comprehensive economic development strategy 2020-2025 update
TRANSCRIPT

Western Nevada Development District
Comprehensive Economic Development Strategy 2020-2025 Update
Recovery and Resiliency

2 Western Nevada Development District
INTRODUCTION
Board of Directors, Associate Members 3
About WNDD 4
Planning for the Future, Today 5
What is Recovery & Resiliency 6
COVID-19 Impact 8
ECONOMIC RECOVERY &
RESILIENCY PROJECT
Economic Recovery & Resiliency
Project Overview 12
Economic Resiliency 16
Infrastructure 22
Quality of Life 28
Government/Organizational Capacity 32
REGIONAL OVERVIEW
By the Numbers 38
Geographic Profile 39
Megapolitan Theory 40
Population: Growth Rates 42
Population: Age 44
Population: Diversity, Race, Culture 46
Population: Gender 48
Population: Education 50
Commuting 53
Income Per Capita Personal Income 54
Median Earnings 55
Top Growing Industries 56
Top Industry Earnings 57
Five-Year Total Employment 58
Employment By Industry 60
Top Occupations 62
Top Industry Wages 64
Top Growing Occupations 65
APPENDICES
WNDD CEDS Projects 66
Economic Development Resources 70
Economic Recovery & Resiliency
Council - Teams 72
Economic Recovery & Resiliency
Action Plan 74
CEDS Data 84
CEDS Process/Public Participation 93
2020 CEDS Committee 94
Sources and Images 95
Table of Contents
Comprehensive Economic Development Strategy 3
WNDD Board of Directors
CARSON CITYMaurice White, City SupervisorNancy Paulson, City Manager CHURCHILL COUNTYJustin Heath, County CommissionerBruce Breslow, Executive Director, Churchill Fallon Economic DevelopmentJim Barbee, County Manager DOUGLAS COUNTYDanny Tarkanian, County CommissionerLisa Granahan, Economic Vitality ManagerKitty McKay, Director, Patience Experience, Carson Tahoe Health CITY OF FALLONKelly Frost, City CouncilwomanSara Beebe, Operations Director, Churchill County Economic Development Authority CITY OF FERNLEYRoy Edgington, Mayor, WNDD President CITY OF LOVELOCKPat Rowe, City Councilwoman, WNDD Member at LargeMark Hauenstein, CEO, Technical Designs HUMBOLDT COUNTYKen Tipton, County Commissioner Dave Mendiola, County Manager MINERAL COUNTYCatherine Hall, County Commissioner PERSHING COUNTYShayla Hudson, County CommissionerHeidi Lusby-Angivck, Executive Director, Pershing County Economic Development Authority
CITY OF RENONaomi Duerr, City Councilwoman,WNDD Vice PresidentAric Jensen, Revitalization ManagerJeff Limpert, Office of Economic DevelopmentTeri Bath, WNDD Secretary, Treasurer, Nevada Hemp Fiber President CITY OF SPARKSDian Vanderwell, City CouncilwomanTracy Holland, Iron Workers Local Union No. 12Art Sperber, Senior Project Manager, CA Group, Inc, and City of Sparks Business Representative STOREY COUNTY Clay Mitchell, County Commissioner WASHOE COUNTYJeanne Hermann, County CommissionerMojra Hauenstein, Director of Planning and Building CITY OF WINNEMUCCAVince Mendiola, City CouncilmanJan Morrison, Humboldt County/City of Winnemucca Economic Development OfficerRicky Sanchez, Grocery Outlet PYRAMID LAKE PAIUTE TRIBE/ THE NUMU PEOPLECassandra Darrough UNIVERSITY OF NEVADA, RENO DEPARTMENT OF ECONOMICS Dr. Thomas Harris
Mary Alber, Ph.D., MBA, Education Innovation Collaborative, Founding Director
Rob Benner, Building and Construction Trade Council of Northern Nevada, Secretary/Treasurer
Denise Castle, Join, Inc., CEO
Carol Chaplin, Lake Tahoe Visitors Authority, President and CEO
Leslie Colbrese, Community Services Agency and Development Corporation, CEO
Heidi Hill Drum, Tahoe Prosperity Center, CEO
Amy Fleming, Governor’s Office of Workforce Innovation Program Development and Engagement, Specialist
Aster Girma, Nevada Green Institute Inc., Strategic Sustainability Consultant Niki Gladys, Western Nevada College, Executive Director of Institutional Development
Mary Kerner, Rural Nevada Development Corporation, CEO
Paul MacDonald, RailPros, Director of Network Planning
Nancy McCormick, Economic Development Authority of Western Nevada (EDAWN), Senior Vice President of Business Retention, Expansion & Workforce
Jen Nalder, Main Street Gardnerville, Program Manager
Dr. Dana Ryan, Truckee Meadows Community College, Special Assistant to the President
Stacey Sept, Nevada Rural Housing Authority, Director of Community Development
Alexander Stettinski, Downtown Reno Partnership, Executive Director
Jeff Sutich, NV Energy, Economic Development Executive
Nick Vander Poel, Capitol Partners, Government Affairs Specialist
Aaron West, Nevada Builders Alliance, CEO
Associate Members
I N T R O D U C T I O N
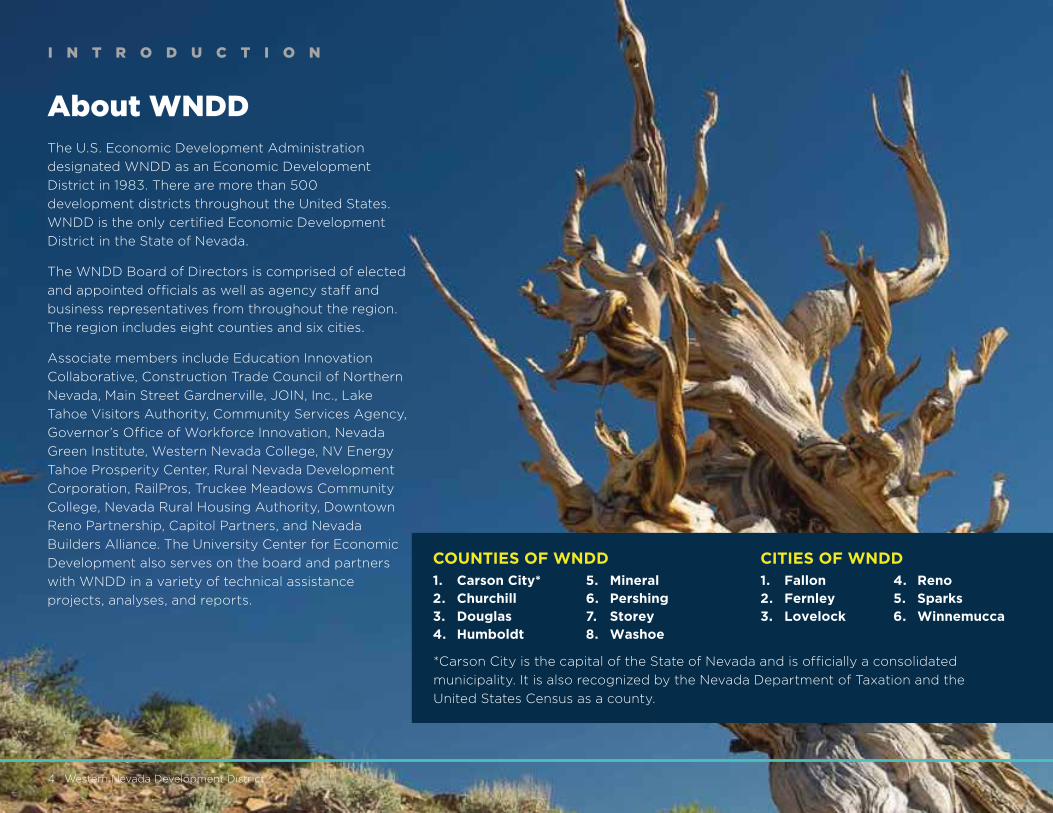
About WNDDThe U.S. Economic Development Administration
designated WNDD as an Economic Development
District in 1983. There are more than 500
development districts throughout the United States.
WNDD is the only certified Economic Development
District in the State of Nevada.
The WNDD Board of Directors is comprised of elected
and appointed officials as well as agency staff and
business representatives from throughout the region.
The region includes eight counties and six cities.
Associate members include Education Innovation
Collaborative, Construction Trade Council of Northern
Nevada, Main Street Gardnerville, JOIN, Inc., Lake
Tahoe Visitors Authority, Community Services Agency,
Governor’s Office of Workforce Innovation, Nevada
Green Institute, Western Nevada College, NV Energy
Tahoe Prosperity Center, Rural Nevada Development
Corporation, RailPros, Truckee Meadows Community
College, Nevada Rural Housing Authority, Downtown
Reno Partnership, Capitol Partners, and Nevada
Builders Alliance. The University Center for Economic
Development also serves on the board and partners
with WNDD in a variety of technical assistance
projects, analyses, and reports.
1. Carson City*2. Churchill3. Douglas4. Humboldt
5. Mineral6. Pershing7. Storey8. Washoe
1. Fallon2. Fernley3. Lovelock
4. Reno5. Sparks6. Winnemucca
COUNTIES OF WNDD CITIES OF WNDD
4 Western Nevada Development District
*Carson City is the capital of the State of Nevada and is officially a consolidated
municipality. It is also recognized by the Nevada Department of Taxation and the
United States Census as a county.

I N T R O D U C T I O N
Representing eight counties and six cities in
the northwest corner of Nevada, the Western
Nevada Development District (WNDD)
works toward creating an environment that
welcomes new businesses, industries, and
workforce to the region to promote a vibrant,
resilient, and sustainable economy.
WNDD’s cornerstone is the Comprehensive
Economic Development Strategy (CEDS).
The CEDS is a locally based, regionally
driven economic development planning
process and document that successfully
engages the region’s community leaders,
private sector partners, and stakeholders.
This framework enables the region and its
partners to strengthen their leverage and
expand regional capacity to attract outside
resources to build a sustainable and resilient
economy. The result creates an economic
roadmap to diversify and strengthen the
regional economy and to qualify the region
for additional assistance from the Economic
Development Administration of the U.S.
Department of Commerce (EDA).
The competitive global market makes
it necessary for regions to have a long-
term economic development strategy that
can serve as a roadmap to progress and
prosperity. The CEDS does just that and is
updated annually and revisited, revised, and
rewritten every five years.
The 2021 CEDS update refreshes the data in
the 2020-2025 report and enables WNDD
to continue as a designated Economic
Development District by the EDA. The CEDS
helps to ensure the communities within
the region remain eligible for EDA and all
federal funding. EDA invests in public works,
economic adjustment assistance, technical
assistance, and short-term planning. EDA
investment priorities enhance regional
competitiveness and support long-term
diversification and development of the
regional economy.
Specific priorities include:
1. Equity
2. Recovery & Resilience
3. Workforce Development
4. Manufacturing
5. Technology-Based Economic
Development
6. Environmentally Sustainable
Development
7. Exports & FDI
Once certified by the EDA, the CEDS
update will maintain the region’s Economic
Development District designation, the
associated planning funds, and regionwide
eligibility for federal funding to accomplish
projects identified within the plan.
Planning For The Future, Today
Comprehensive Economic Development Strategy 5
Unique to this CEDS is the inclusion of the
Economic Recovery and Resiliency Plan,
created by the Economic Recovery and
Resiliency Council and its teams. Read
the plan on pages 12 through 37 with the
Action Plan on pages 74 - 83.

6 Western Nevada Development District
What is Recovery and Resiliency, and why does it matter to Western Nevada in a post-COVID world?
R E C O V E R Y & R E S I L I E N C Y
“Resilience” became an important concept
since the COVID-19 pandemic arrived in
Nevada in March 2020. Becoming more
resilient is something that cities and
states must do if they’re to survive global
economic disruptors like the pandemic in
the future. As Western Nevada rebuilds from
the impacts of the COVID-19 pandemic,
economic development strategy must focus
on recovery and resiliency to prepare for
future shocks and changes.
The U.S. Department of Commerce
Economic Development Administration
(EDA), through a CARES Act grant, is
funding the Western Nevada Development
District’s Economic Recovery and Resiliency
Council (ERRC) and its development of
a regional recovery and resiliency plan
for the WNDD territory that comprises
eight counties and six cities. The EDA has
prioritized equity, workforce development,
environmentally sustainable development,
technology-based economic development,
recovery and resilience, manufacturing and
exports, and FDI.
What are Economic Recovery and Resiliency?
According to the EDA, recovery and
resilience focus on “economic development
planning or implementation projects that
build economic resilience to and long-term
recovery from economic shocks, such as the
decline of an important industry or a natural
disaster.”
In Western Nevada, that means creating
an environment that welcomes new
businesses and industries to the region
to promote a vibrant, resilient, and
sustainable economy while strengthening
the environment for existing businesses.
Helping the economy recover will mean
supporting the expansion of small
businesses, attracting new technology
companies and a skilled workforce, and
integrating data into the decision-making
process.
What is the Recovery and Resilience Plan for Western Nevada?
The development of this economic
recovery and resilience plan is vital to the
WNDD region. During the height of the
pandemic, the area had an average rate
of unemployment of 17.35%. At the same
time, the state’s unemployment rate rose
to 28.2 percent—the worst unemployment
rate in state history and the highest mark
in the country, according to the Nevada
Department of Employment, Training and
Rehabilitation.
Each year, WNDD updates the CEDS,
and this year’s update has a component
specifically related to WNDD’s Economic
Recovery and Resiliency Council and the
resulting Economic Recovery Resiliency
Plan.
Members of the Economic Recovery and
Resiliency Council represent leadership
in critical areas such as agriculture,
building and trades, business, economic

Comprehensive Economic Development Strategy 7
development, education and workforce,
financial, government, health and
wellness, housing, information technology,
manufacturing, mining, tourism, hospitality
and the arts, and utilities/infrastructure/
transportation.
The council has identified critical economic
vitality challenges. The Economic Recovery
Resiliency Plan includes strategies for
economic recovery and builds capacity for
pre-disaster preparedness through resilience
planning and projects. Projects may be
engaged and/or expanded to respond more
rapidly to create more economic stability
and growth.
Key Economic Vitality Challenges in Western Nevada
To determine critical issues impacting
economic vitality in Western Nevada,
the ERRC gathered feedback from
representatives of more than 130 unique
agencies and organizations. During a
workshop that took place in early 2021, the
ERRC worked with subject matter experts
to develop a holistic understanding of the
issues based on data. Each was asked what
issues or challenges they experienced or
observed due to the pandemic. Then, using
an online poll, members of the ERRC cast
their vote on issues that impacted them the
most. According to those votes, these six
issues are the most pressing for the region:
1. Inadequate broadband connectivity
2. Workforce limitations such as
inadequate training, low wages, and a
lack of child-care facilities
3. Reduced access to routine medical
care during the pandemic left residents
lacking health and wellness services
4. An inadequate supply of affordable
housing, along with the skyrocketing
real-estate market, made it hard for
residents to afford a mortgage or to pay
rent
5. Siloed governmental agencies whose
systems aren’t connected made resident
support resources difficult, inefficient,
and arduous to navigate
6. The limited diversity regarding
economic activity and industry.
Finally, efforts to diversify the Nevada
economy were hampered by the pandemic,
and small business owners lacked a
safety net to keep them afloat during the
emergency. The ERRC plan will examine
how the region can emerge from the
pandemic with a healthier and more resilient
economy.

C O V I D - 1 9 I M P A C T
Western Nevada is starting to climb its way
out of the COVID-19 pandemic. Although
positive COVID cases are decreasing as
the population becomes vaccinated, the
lesson of the pandemic is that Nevada’s
economy was unprepared for a crisis of this
magnitude.
The COVID-19 pandemic swiftly and
dramatically impacted the state’s economy
and tested its resiliency. Following
Governor Steve Sisolak declaring a State
of Emergency and implementing stay-
at-home directives in mid-March 2020,
unemployment claims spiked, worker
earnings decreased significantly, and
consumer spending slowed dramatically.
By the end of April 2020, the state had
lost 244,800 jobs, and the unemployment
rate rose to 28.2 percent—the worst
unemployment rate in state history and the
highest mark in the country, according to
the Nevada Department of Employment,
Training and Rehabilitation.
As a result of policies and restrictions
designed to prevent the spread of COVID-19,
many of the counties and cities within the
Western Nevada Development District’s
region experienced economic downfalls
not seen in decades. Outside of Southern
Nevada, two of WNDD’s counties, Storey
and Carson City, showed the highest
How Did COVID-19 Impact
12 Critical Areas In The WNDD
Region?
8 Western Nevada Development DistrictPhoto: Shutterstock.com

Comprehensive Economic Development Strategy 9
C O V I D - 1 9 I M P A C T
unemployment rates and annual change
in the state in April 2020. While workers
lost their jobs at large businesses, those
employed by small businesses were not
immune. The number of hourly employees
working in small businesses decreased by
almost 36% in the WNDD region’s counties
on average, according to Opportunity
Insights, a team of researchers and policy
analysts based at Harvard University
tracking the impacts of COVID-19 using
private-sector data. In Carson City alone,
half of the employees in small businesses
lost their jobs. At the same time, consumer
spending in the WNDD region dropped by
almost 23%, closely mirroring the state’s
drop of 25%. Nationally, consumer spending
fell by about 15%, according to Opportunity
Insights.
Common indices to measure the health
of a region’s economy include the level
of unemployment, the median household
income, and the state of the real estate
market.
According to the Nevada Department of
Employment, Training, and Rehabilitation
April 2021 economic report, Nevada added
back 8,400 jobs in April as the state
continues to recover from the effects of the
pandemic. “The number of jobs remains
below typical levels but is up by 196,200
since April 2020, an annual increase of 17.6%.
The state’s unemployment rate in April is
8.0 percent, down slightly from 8.1 percent
in March 2021 and down 21.5 percentage
points compared to April 2020,” according
to DETR.
According to 2019 U.S. Census Bureau
data, the median household income in
Nevada was $60,365 per year, which is
more than $2K lower than the U.S. median
household income of $62,843 for the same
year. Meanwhile, housing prices in Northern
Nevada have skyrocketed. The Reno Gazette
Journal reported in April 2021 that the
median price for an existing single-family
home in Reno reached $514,000 in March,
up nearly 20% YOY. So, while the region is
recovering from the economic effects of the
pandemic, it still has a way to go.
To address the challenges faced by
Nevadans and business owners in Western
Nevada, WNDD’s Economic Recovery and
Resiliency Council (ERCC) developed an
Economic Recovery and Resiliency Plan
funded by a U.S. Department of Commerce
Economic Development Administration
CARES Act grant. After assessing the
impacts of the COVID-19 pandemic, the
ERCC has identified four key areas and 12
goals that must be addressed to recover
from the pandemic and become resilient to
future shakeups.
Arts, Culture and Recreation
The pandemic shut down the special events
season that the Reno/Sparks region is
known for and typically draws 5M visitors
per year, which was a massive blow to the
arts and culture scene and the economy.
In addition, canceled special events such
as the Genoa Candy Dance, Burning Man,
the Lake Tahoe Shakespeare Festival, and a
year-long calendar of events in Virginia City
also tremendously impacted rural and less
populated communities.
Many of these events are set to return in
2021, bringing back economic activity levels
More than a year later, the state and region are reinventing themselves to recover and become more resilient to future economic shocks.
And, the numbers are showing results.
10 Western Nevada Development District
C O V I D - 1 9 I M P A C T
to support large and small communities in
the region.
The region can brand itself as a destination
for tourists and remote workers who are
attracted to the region’s ample outdoor
recreation draws such as trails, public lands,
mountains, and Lake Tahoe.
Entrepreneurship, Innovation,
Small Business
In the early months of the pandemic, the
statewide economic lockdown significantly
affected the tourism industry, which was
23% of the state’s economy.
“Seasonally adjusted jobs in the industry
dropped by 43%, or by 152,800 jobs from
356,400 to 203,600, between April 2019
and April 2020 as result of the lockdown
that began on March 17,” according to the
Nevada Governor’s Office of Economic
Development’s “Nevada Recovery and
Resiliency Plan.”
Additionally, the Nevada Gaming Control
Board reported in May 2020 that gaming
win decreased by 99.41% compared with
May 2019. And for the fiscal year (July 1,
2019, through May 31, 2020), the gaming win
was down 19.38%.
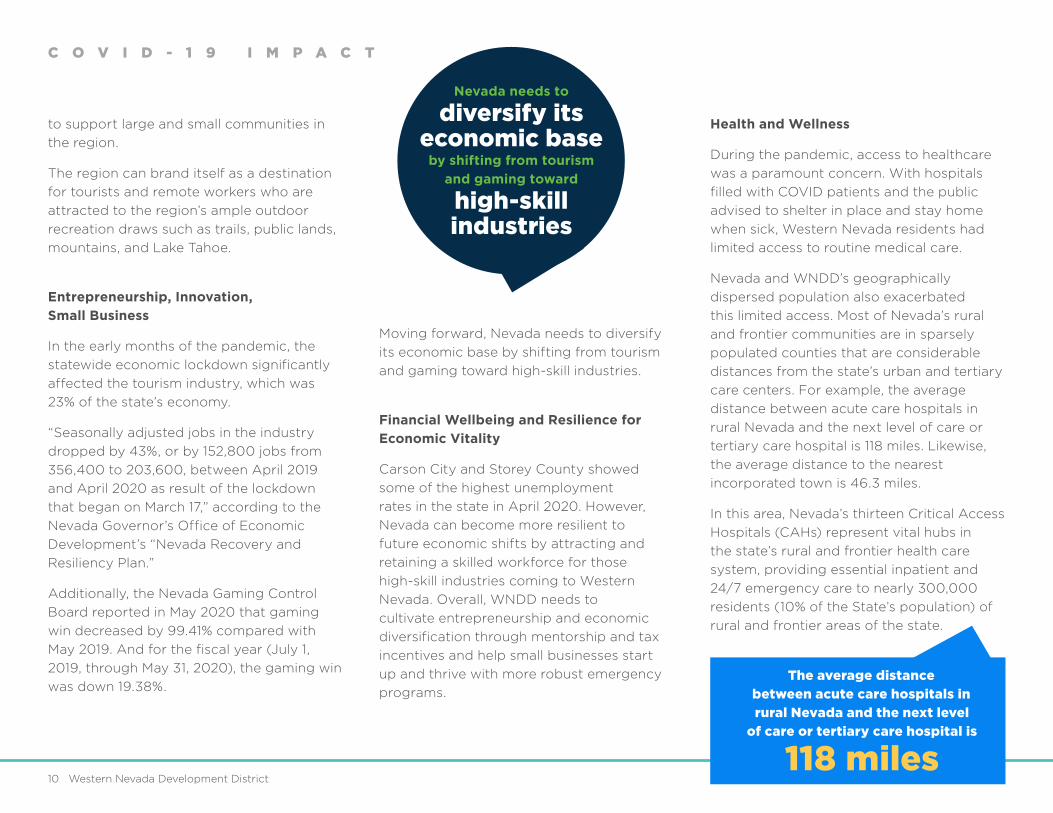
Moving forward, Nevada needs to diversify
its economic base by shifting from tourism
and gaming toward high-skill industries.
Financial Wellbeing and Resilience for
Economic Vitality
Carson City and Storey County showed
some of the highest unemployment
rates in the state in April 2020. However,
Nevada can become more resilient to
future economic shifts by attracting and
retaining a skilled workforce for those
high-skill industries coming to Western
Nevada. Overall, WNDD needs to
cultivate entrepreneurship and economic
diversification through mentorship and tax
incentives and help small businesses start
up and thrive with more robust emergency
programs.
Health and Wellness
During the pandemic, access to healthcare
was a paramount concern. With hospitals
filled with COVID patients and the public
advised to shelter in place and stay home
when sick, Western Nevada residents had
limited access to routine medical care.
Nevada and WNDD’s geographically
dispersed population also exacerbated
this limited access. Most of Nevada’s rural
and frontier communities are in sparsely
populated counties that are considerable
distances from the state’s urban and tertiary
care centers. For example, the average
distance between acute care hospitals in
rural Nevada and the next level of care or
tertiary care hospital is 118 miles. Likewise,
the average distance to the nearest
incorporated town is 46.3 miles.
In this area, Nevada’s thirteen Critical Access
Hospitals (CAHs) represent vital hubs in
the state’s rural and frontier health care
system, providing essential inpatient and
24/7 emergency care to nearly 300,000
residents (10% of the State’s population) of
rural and frontier areas of the state.
Nevada needs to
diversify its economic base
by shifting from tourism
and gaming toward
high-skill industries
The average distance
between acute care hospitals in
rural Nevada and the next level
of care or tertiary care hospital is
118 miles

Comprehensive Economic Development Strategy 11
C O V I D - 1 9 I M P A C T
Housing
And while the region’s housing market is
bullish and new home builds are increasing,
longtime resident homebuyers are
increasingly being priced out of the market.
According to the Reno Gazette Journal,
rental rates also hit a new high of $1,400 per
month in November 2020.
Partnerships and Collaboration
During the pandemic, a weakness of
governmental agencies was their siloed
systems that didn’t talk to other agencies,
such as DETR’s unemployment filing system.
As a result, according to a column in the Las
Vegas Sun, “a void of confusion, frustration,
and hopelessness ensued for hundreds of
thousands of Nevadans unable to file a claim
or receive benefits from UI or PUA.”
Inter-agency cooperation, collaboration,
partnership development, and
communication will be vital in addressing
strategic planning and crisis management
moving forward.
Regional Perspective in Planning
Despite the statewide economic gut punch,
Northern Nevada’s diversified economic
landscape helped it weather the pandemic
easier than its neighbors in the south.
The ERRC aims to develop a regional
perspective for strategic planning and
to create strategies around interagency
collaboration.
Strategic Economic Development
Another challenge posed by the pandemic
was the halting of non-essential business
and COVID restrictions that led to severe
economic downfalls in the counties and
cities of the WNDD region. The region’s
recovery will be built on the back of the
strategies and action plans developed by
WNDD to help small and large businesses
recover.
Sustainable Education and Workforce
The level of unemployment, which has
recovered faster than that in Southern
Nevada, is still problematic. Therefore, a
plan must be developed to address low
educational attainment and career guidance
for a skilled workforce.
Technology, Broadband, and Connectivity
Finally, while the larger population hubs
have strong broadband connectivity and
high-speed internet speeds, rural areas
lack the same connectivity resource. When
libraries and schools were shuttered during
the pandemic, people who lacked access to
computers and the internet at home were
affected by a loss of technology—including
children who were doing distance learning
from home.
Transportation
The pandemic significantly impacted
transportation in Nevada and the WNDD
region. For example, in April 2020, the
Reno-Tahoe International Airport (RNO)
served 17,265 passengers, a decrease of
94.9% versus the same period in 2019.
On the roads and rails, initially, intermodal
freight volume declined because of the
pandemic. However, nationally, in October
2020, intermodal freight was up by 10%
compared to the same month in 2019.
Utilities
While utilities in Nevada weren’t under
additional strain due to the pandemic’s stay-
at-home order, those who were unemployed
had a difficult time paying their bills. The
region will need to continue to invest in
physical infrastructure and utilities such as
water and sewer systems as they age and as
the area continues to grow and increase in
population.
The ERRC aims to develop a regional perspective for strategic
planning and to create strategies around interagency collaboration.

12 Western Nevada Development District
E C O N O M I C R E C O V E R Y & R E S I L I E N C Y P R O J E C T
Funded through a U.S. Department of
Commerce, Economic Development
Administration (EDA) CARES Act grant, the
Economic Recovery and Resiliency Council
was formed in 2020 to develop an Economic
Recovery and Resiliency Plan for WNDD’s
region.
That plan, which is presented as part
of this year’s Comprehensive Economic
Development Strategy Update, includes
strategies for economic recovery and to
build capacity for pre-disaster preparedness
through resilience planning and projects.
From its inception, the vision for the ERRC
included engaging a multi-disciplinary
team of subject matter experts to develop
a coordinated effort and plan to resume
economic activity to the fullest and safest
extent possible. Ultimately, more than
130 agencies participated in the process,
representing the following areas:
How the Economic Recovery and Resiliency Project Can Help the WNDD Region
Building Back Stronger
The process included multiple discussions
per month amongst the stakeholders and
WNDD staff. At these meetings, regional
experts discussed policies and overall plan-
making. The business and service sector
clusters conveyed their category’s highest
priority issues, strategies to address those
issues, identification of resources available
to engage those strategies, and determine
the resource gaps.
Agriculture
Arts and Culture
Business
Building and
Trades
Economic
Development
Education/
Workforce
Financial
Government
Health and
Wellness
Hospitality
Housing
Information and
Technology
Infrastructure
Manufacturing
Mining
State and
Federal Natural
Resources
Tourism
Transportation
Utilities
E C O N O M I C R E C O V E R Y & R E S I L I E N C Y P R O J E C T
Council Timeline
Over six months, the Council met as a large group and individually to pursue its work of
developing an economic recovery and resiliency plan to align with the “Nevada: Action
Plan for Recovery and Resilience” plan being developed through the Governor’s Office of
Economic Development.
Webinar Workshops
The Council also held several workshops open to its members and the general public
to provide information about critical economic development updates and ideas. Those
included:
March 19, 2021: The webinar “Profiles in Resiliency” hosted experts from Santa Rosa,
California, Houston, Texas, and global green infrastructure development firm TerraScale, to
share their experiences, lessons learned, and plans. Speakers included:
• Jillian Donatto, Houston-Galveston Area Council, Senior Planner for Economic
Development
• Mark R. Schonberg, President of TerraScale and a retired U.S. Army Colonel
• Sean McGlynn, City of Santa Rosa, City Manager
April 9, 2021: A second free presentation from the Nevada Governor’s Office of Economic
Development reviewed “Nevada’s Plan for Recovery and Resiliency.” The report, “Nevada’s
Plan for Recovery and Resiliency,” was released on Jan. 19 following Gov. Steve Sisolak’s
State of the State address and gives the state a plan for moving forward through 2021 and
beyond.
The webinar covered how the Governor’s Office of Economic Development and its
partners are working to pursue visionary policies that set Nevada apart for the future and
build resilience and diversification of the state’s economy.
Council Core Team Members
The Council Core Team was established to
develop the Economic Recovery Council
framework and be stewards of the process.
The Core Team guided the design and
implementation of the Council and their
respective teams’ activities, coordinated
workshops, provided economic insights, and
more.
These individuals included:
• Andrew Haskin: Northern Nevada
Development Authority
• Aric Jensen: City of Reno
• Buddy Borden: University of Nevada
Reno University Center for Economic
Development
• Dana Ryan: Truckee Meadows Community
College
• Marlene Rebori: University of Nevada,
Reno Cooperative Extension
• Patty Herzog: Governor’s Office of
Economic Development
• Sheryl Gonzales: Western Nevada
Development District
• Teri Bath: Business Representative, WNDD
Board, Secretary-Treasurer
• Tom Harris: University of Nevada
Reno University Center for Economic
Development
Comprehensive Economic Development Strategy 13

14 Western Nevada Development District
E C O N O M I C R E C O V E R Y & R E S I L I E N C Y P R O J E C T
Economic Recovery & Resiliency Program Timeline
DEC. 9, 2020JAN. 29, 2021 10AM - 12PM
MARCH 19, 20219 - 11AM
APRIL 9, 20219 - 11AM
WEEK OFAPRIL 19, 2021
WEEK OFMAY 17, 2021
Meet Before Jan. 13, 2021
Meet Before April 19, 2021
Meet Before Feb. 22, 2021
WEEK OF MARCH 8, 20201
WEEK OF JUNE 21, 2021
Orientation Meeting Report out from teamDetermine outcomes to
mitigate Issues
Report out – Goals, Strategies,
Outcomes
Assets/resources to engage strategies
Resource gaps
Project OverviewIssue Discussion
Data Collection ToolPrioritize 3-5
Short/Mid/Long Term
Developing goals & strategies to
address issues & generate outcomes
Determine outcomes when issues addressed
Tool #2 for determine outcomes
RECOVERY & RESILIENCY
WEBINARCase historiesExperiences
Defining recovery & resiliency
STATE PLAN FOR RECOVERY AND RESILIENCY
WEBINARGovernor’s Office
of Economic Development
THE PLAN & ITS
FRAMEWORK
COUNCIL MEETING COUNCIL’S TEAM MEETING COUNCIL & COUNCIL’S TEAM MEETING
KICK OFF WORKSHOP State Economic Recovery
& Resiliency Challenges/Issues Identified
Prioritized
Comprehensive Economic Development Strategy 15
Western Nevada Development District
Economic Recovery & Resiliency
Plan FrameworkG
OV
ER
NM
ENT &
OR
GA
NIZ
ATI
O
N CAPACITY QUALITY O
F LIFE
INF
RA
STRUCTUREECONOMIC
R
ESILI
EN
CY
Su
stain
ab
ility
Reg
iona
l
Plan
ning
Pers
pe
ctive
in
Partnerships/
Collaboration Housing
Arts, Culture
& Recreation
Health
&
Welln
ess
Tra
nsp
orta
tion &
Energ
y
Sew
er, W
ate
r,
TechonologyBroadbandConnectivity Small Business
Stra
tegi
c
Entrepreneurship,Eco
nom
ic
Devel
opmen
t
Innovation &
Fin
ancia
lW
ellb
ein
g a
nd
Education &
Workforce
Resi
lience
E C O N O M I C R E C O V E R Y & R E S I L I E N C Y P R O J E C T
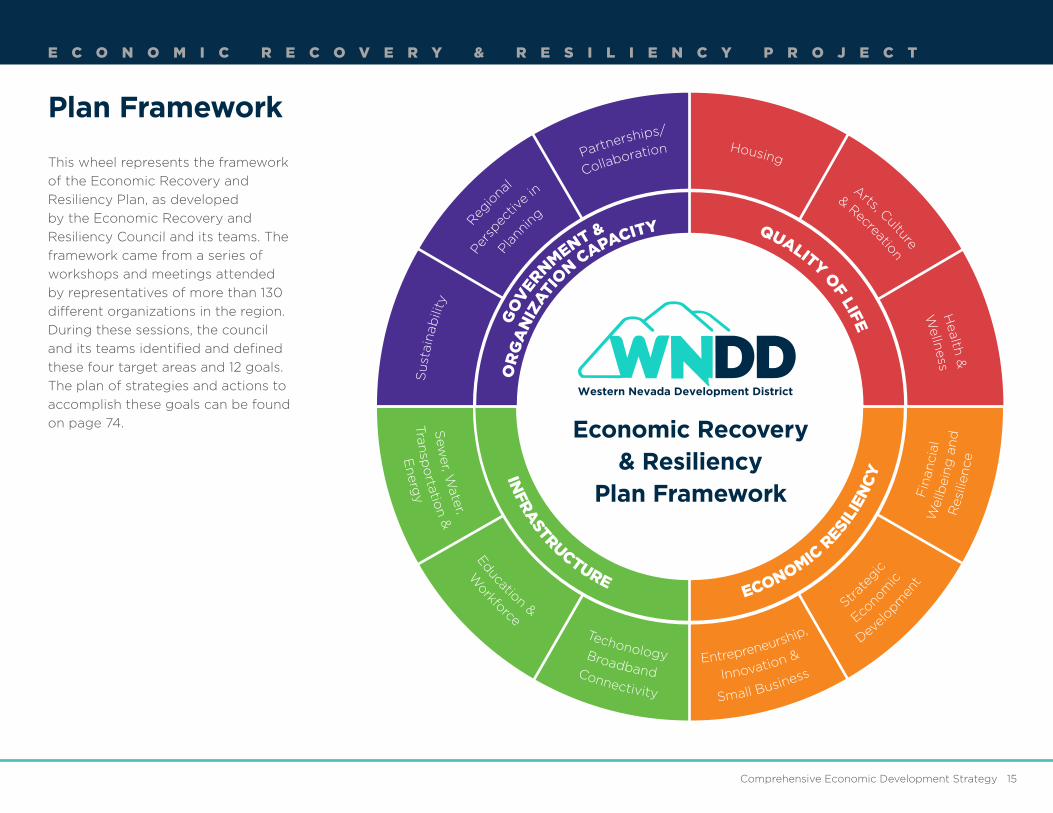
Plan Framework
This wheel represents the framework
of the Economic Recovery and
Resiliency Plan, as developed
by the Economic Recovery and
Resiliency Council and its teams. The
framework came from a series of
workshops and meetings attended
by representatives of more than 130
different organizations in the region.
During these sessions, the council
and its teams identified and defined
these four target areas and 12 goals.
The plan of strategies and actions to
accomplish these goals can be found
on page 74.

16 Western Nevada Development District
E C O N O M I C R E C O V E R Y & R E S I L I E N C Y P R O J E C T
An area’s ability to quickly recover from a
significant disruption, endure the impacts of
a major shock, and, when possible, prevent
the circumstances altogether can define its
economic resiliency.
The COVID-19 pandemic clearly showed
how the Western Nevada Development
District’s (WNDD) region fared in the face of
a significant economic challenges. To build
a regional capacity for economic resilience,
a network of partner organizations and
individuals must anticipate risk, evaluate
how that risk can impact critical economic
assets, and build a responsive capacity.
To do so, WNDD and its partners will
engage in initiatives to pivot the economy
from the COVID-19 pandemic to recovery
and greater resiliency. These efforts will
include planning for and implementing
resilience through specific goals or actions
to bolster the long-term economic durability
of the region. In addition, WNDD will
work to establish information networks
among the various stakeholders in the
area to encourage active and regular
communications between the public,
private, education, and nonprofit sectors to
collaborate on existing and potential future
challenges.
TARGET AREA 1:
The region can withstand, prevent,
and quickly recover from shocks to its
underlying economic base, such as the
COVID-19 pandemic, by engaging in
activities, programs, and steady-state
and responsive initiatives.
EconomicResiliency

Comprehensive Economic Development Strategy 17
E C O N O M I C R E C O V E R Y & R E S I L I E N C Y P R O J E C T
GOAL 1.1
Encourage Entrepreneurship, Innovation, and Small BusinessesSupporting innovation, small businesses, and entrepreneurs by creating an environment where they can survive and thrive is vital to the region’s economic recovery and resiliency.
1.1 Strategies 1.1 Outcomes
1. Micro, small and medium-sized enterprises
(MSMEs), entrepreneurs, and others can
access new economic resiliency planning
programs.
2. Action partners and others can establish
economic recovery centers during
economic shock events.
3. Businesses and entrepreneurs can access
a centralized portal of available services
and programs that expands and contracts
with information relative to economic
conditions.
4. With training and preparation, small
businesses can be more resilient to current
and future economic challenges.
5. A regional market study has been
developed and is implemented to attract,
support, and expand business and industry.
6. Diversity training and programs are
provided.
7. Industry 4.0 training covers fundamental
concepts of future smart factories, cyber-
physical systems, and physical processes
within these factories. In addition, the
virtualization techniques and intelligent
decision-making capabilities would support
managers in leading these initiatives.
8. A supply chain study determines activities
to mitigate future disruptions.
9. Stronger local supply chains support the
regional economy.
10. More exporters, especially rural, women,
veterans, and minority-owned MSMEs, exist
in the region.
11. Entrepreneurs and small business owners
can access capital at sufficient levels to fuel
innovation and operations.
12. The number and quality of co-working,
incubator, and innovation centers in the
region has expanded.
13. Technology-based businesses and
industries can receive targeted support.
• Strategy A: Develop economic
recovery and resiliency support
services and tools for small
businesses and entrepreneurs.
• Strategy B: Continue to promote
the region as a place where small
businesses, entrepreneurs, and high-
tech companies can start, build and
grow.
• Strategy C: Foster an innovative
entrepreneur ecosystem throughout
the region.
• Strategy D: Research and determine
strategies that establish a more
reliable and resilient supply chain
supporting suppliers, manufacturers,
distributors, and businesses.

18 Western Nevada Development District
E C O N O M I C R E C O V E R Y & R E S I L I E N C Y P R O J E C T
• Innovation and incubator programs
• Local chamber of commerce
organizations
• NCET (Nevada’s Center for
Entrepreneurship and Technology)
• Nevada Governor’s Office of Economic
Development (GOED)
• Nevada Industry Excellence (NVIE)
• Nevada Small Business Development
Center
• Regional Development Authorities
• Small business and entrepreneur
organizations
• U.S. Small Business Administration (SBA)
• University of Nevada, Reno Center for
Economic Development
• Venture Capital Partners/Angel Investors
1.1 Possible Action Partners

Comprehensive Economic Development Strategy 19
E C O N O M I C R E C O V E R Y & R E S I L I E N C Y P R O J E C T
GOAL 1.2
Engage In Strategic Economic Development Advancing growth and expansion for industries critical to the region’s economic ecosystem and its prosperity.
1.2 Strategies 1.2 Outcomes
• Strategy A: Support the advanced
manufacturing sector and engage in
activities that promote expansion to
improve the region’s competitiveness.
• Strategy B: Advance activities that
support and promote economic
revitalization.
• Strategy C: Reposition northwestern
Nevada as a gateway for a variety of
traveler experiences and extended
visitation throughout the WNDD
region.
• Strategy D: Promote and support
agriculture as a robust, resilient, and
sustainable economic practice.
• Strategy E: Promote and support
economic vitality and resiliency,
aligning activities with the Nevada
Governor’s Office of Economic
Development (GOED) and regional
development authorities for seamless
and robust results.
1. Supply chains have increased resiliency,
are equitable, and support local MSMEs.
2. Onshore manufacturing has increased in
the region.
3. The agricultural industry is strengthened
with increased federal, and state funding
to support mobile processing facilities,
establishment of a seed production and
banking program, increased marketing,
and alternative growing venues.
4. An agricultural blockchain has been
established.
5. A map of locations within the region that
have the infrastructure necessary for
manufacturing is available.
6. Increased marketing activities in rural
communities to attract business and
workforce.
7. The Tourism/Hospitality Industry is
repositioned with marketing the region as
a destination and has prepared resiliency
plans for future economic shocks.

20 Western Nevada Development District
E C O N O M I C R E C O V E R Y & R E S I L I E N C Y P R O J E C T
• Convention and tourism agencies
• Downtown Reno Partnership
• Local chamber of commerce
organizations
• Nevada Department of Agriculture (NDA)
• Nevada Farm Bureau
• Nevada Governor’s Office of Economic
Development (GOED)
• Nevada Industrial Hemp Fiber
Cooperative
• Nevada Industry Excellence (NVIE)
• Regional Development Authorities
• U.S. Department of Agriculture (USDA)
• University of Nevada, Reno Center for
Economic Development
• University of Nevada, Reno College of
Agriculture, Biotechnology, and Natural
Resources
• Western Nevada College Specialty Crop
Institute
1.2 Possible Action Partners

Comprehensive Economic Development Strategy 21
GOAL 1.3
Foster Financial Wellbeing and Resilience The region’s economic vitality is supported by the expansion, development, and implementation of programs that support financial wellbeing, security, and resilience.
1.3 Strategies 1.3 Outcomes 1.3 Possible Action Partners
E C O N O M I C R E C O V E R Y & R E S I L I E N C Y P R O J E C T
• Strategy A: Equitably expand economic
prosperity through the development
and promotion of services that result
in a stable and future ready financial
foundation for individuals, families and
business.
• Strategy B: Engage and bolster the local
investor environment and the resulting
access to capital
1. Small businesses and entrepreneurs have
established or strengthened relationships
with banks, resulting in awareness and
understanding of financial programs and
products.
2. Banks support the economic resiliency
of their current and future customers by
providing training, tools, and information
for business continuity during and after
an economic shock.
3. Small businesses and entrepreneurs can
access more financial capital resources.
4. Lenders and banks are providing
programs and services to strengthen
relationships with their customers.
5. There is a resource of financial
information and services promoted
through WNDD and its partners and
made available through the WNDD
website.
• Battleborn State Venture Capital Fund
• Community Development Block Grant
(CDBG) Program
• Partnering financial institutions, such as
banks and credit unions
• Rural Nevada Development Corporation
• Start Up Nevada
• State Small Business Credit Initiative 2.0
• U.S. Department of Agriculture (USDA)
• U.S. Department of Housing and Urban
Development (HUD)
• U.S. Economic Development
Administration (EDA)
• U.S. Small Business Administration (SBA)

E C O N O M I C R E C O V E R Y & R E S I L I E N C Y P R O J E C T
Infrastructure systems, including
communications, healthcare, transportation,
electricity, and water and sanitation services,
constitute the core of a resilient community
and economy in times of catastrophe.
When these systems are put in place, they
can help a region respond to significant
disruptions. Resilient infrastructure can also
reduce the impact of these shocks on an
area or help a community even avoid the
effects of a major threat.
The COVID-19 pandemic clearly showed
the opportunities and challenges of the
infrastructure in the Western Nevada
Development District’s region. To learn from
this and support the region’s capacity for
economic resilience, WNDD and its partner
organizations must make infrastructure
more resilient across multiple dimensions in
the face of numerous threats and risks.
To do so, WNDD and its partners will assess,
address and improve the resilience of the
region’s physical assets, operations, business
models and governance, and financing. It
will also consider broader factors such as
the environment and climate and the role of
technology when addressing infrastructure
systems. These priorities and actions to build
a more resilient infrastructure system in the
region will become a defining moment in
the recovery from COVID-19. When planning
and prioritizing investment, resilience will be
an essential factor to consider, particularly in
the context of technologies and innovations
that might offer lower-cost, digitally enabled
solutions.
TARGET AREA 2:
The region’s planned, modern, and
resilient infrastructure includes
widespread broadband access to
connect its urban and rural areas while
supporting an increasingly mobile and
remote workforce.
Infrastructure
22 Western Nevada Development District

Comprehensive Economic Development Strategy 23
E C O N O M I C R E C O V E R Y & R E S I L I E N C Y P R O J E C T
GOAL 2.1
Improve Sewer, Water, Transportation, EnergyIncrease improvements in sewer, water, transportation, and energy systems that are innovative, sustainable,efficient, and integrated to support and promote a more business-ready region.
2.1 Strategies 2.1 Outcomes
1. There is a regional infrastructure plan
in place, including an implementation
strategy.
2. Physical infrastructure funding is given
higher priority by federal, state, and local
government agencies and organizations.
3. Infrastructure investment has increased.
4. More rural Infrastructure projects are
completed.
5. Public transportation has been increased
between rural and urban communities and
within urban communities.
6. WNDD has increased its working
relationship with transportation agencies.
7. Renewable energy has been increased
throughout the region.
8. WNDD member agencies participate
more with the grant process to fund
infrastructure.
9. There is increased air travel at Reno-
Tahoe International Airport and with rural
airports.
10. WNDD has increased programs and
services for the WNDD membership on
grant resources and processes for grant
applications.
• Strategy A: Facilitate infrastructure
planning towards a more efficient,
coordinated, and connected
infrastructure, promoting resiliency
throughout the region.
• Strategy B: Work with WNDD
members and stakeholders to secure
funding for improved infrastructure
to attract new business and meet
the growth of existing businesses.

24 Western Nevada Development District
E C O N O M I C R E C O V E R Y & R E S I L I E N C Y P R O J E C T
• Broadband Internet Providers
• Nevada Department of Agriculure (NDA)
• Nevada Department of Transportation
(NDOT)
• Nevada Governor’s Office of Energy
(GOE)
• Nevada Governor’s Office of Science,
Innovation, and Technology (OSIT)
• Nevada Grant Office
• Nevada State Infrastructure Bank (SIB)
• Nevada Trucking Association
• NV Energy
• Regional Transportation Commission
(RTC) of Washoe County
• Renewable Energy Organizations/
Agencies
• Reno Trucking Association
• Airports throughout the WNDD region
• Southwest Gas
• Truckee Meadows Water Authority
• WNDD Board Agencies
2.1 Possible Action Partners

Comprehensive Economic Development Strategy 25
GOAL 2.2
Advance Technology and ConnectivityPlan for and support technologies that advance innovation and promote economic development.
2.2 Strategies 2.2 Possible Action Partners
2.2 Outcomes
1. Mapping of Internet connectivity
throughout the region has been
completed.
2. A Regional Broadband and
Connectivity master plan is in place.
3. Innovative technologies reach all
sectors of the region.
4. Individuals, businesses, organizations,
and public institutions throughout
the region, especially vulnerable and
disadvantaged communities, can access
affordable, sustainable, equitable,
and stable internet connectivity at a
minimum of 200 megabits per second
download speed and 30 megabits per
second upload speed.
• Strategy A: Ensure reliable, affordable, high-speed and secure Internet access
throughout the region.
• Strategy B: Support and promote technology and innovation throughout every sector
of the economy.
• Local, regional, and academic libraries
• Nevada Governor’s Office of Science,
Innovation, and Technology (OSIT)
• Technology partners
• University of Nevada, Reno Center for
Economic Development
• Venture Capitalists
• WNDD Board Agencies
5. Public and private agencies collaborate
to plan, fund and incentivize, and
efficiently implement improved
connectivity in the region based on
new technology.
6. The region has a cyber-secure network
that meets Cyber Security Maturity
Model Certification (CMMC) Level 3
certification.
7. There is accessible equipment and
devices and computer literacy training
for underserved populations.
8. There is an increased use of
technology across all sectors of the
economy.
E C O N O M I C R E C O V E R Y & R E S I L I E N C Y P R O J E C T

26 Western Nevada Development District
GOAL 2.3
Support Education and WorkforceSupport the development of a skilled workforce to meet the growing needs of business and industry.
2.3 Strategies 2.3 Outcomes
1. Workforce training programs are aligned
with business and industry needs and are
developed, funded, and provided through
close collaboration between businesses,
educators, and government.
2. Workforce training is available before and
after hiring and is available for entry-level
workers and the more experienced, and,
where appropriate, includes training in
how to work virtually.
3. Training in the trades is consistent across
the region.
4. Out-of-state trained, certified, and
licensed workers, including artisans
and professionals, move to the region,
augmenting an already large pool of well-
trained workers.
5. Workforce lives in attractive, affordable
communities that include affordable and
accessible services such as childcare,
health services, and education.
• Strategy A: Support and participate
in the Nevada Governor’s Workforce
Development Board and sub-
committees to execute on a state
plan that includes a strong vision and
strategies to create a robust, user-
friendly, straightforward and seamless
workforce system.
• Strategy B: Increase the percentage
of residents older than 18 who have
completed post-secondary education
or training with a particular focus
on certificates, technical degrees
and apprenticeships relevant to
employment in middle-skill, living wage
occupations.
• Strategy C: Advocate for and support
a dynamic lifelong learning system with
ongoing training for advancing skills
and knowledge, keeping pace with
industry adjustments and expectations.
• Strategy D: Develop and launch a
marketing campaign across a broad
range of agencies, including education,
workforce development, employers,
health and human services, and
economic development to promote
work readiness for the 21st century.
• Strategy E: Promote the development
of programs that bring the workforce
to the region.
E C O N O M I C R E C O V E R Y & R E S I L I E N C Y P R O J E C T

Comprehensive Economic Development Strategy 27
2.3 Possible Action Partners
• Building and Construction Trades Council
of Northern Nevada
• Great Basin College
• JOIN, Inc.
• Nevada Builders Alliance
• Nevada Department of Education (NDE)
• Nevada Department of Employment,
Training and Rehabilitation (DETR)
• Nevada Governor’s Office of Economic
Development (GOED)
• Nevada Governor’s Workforce
Development Board
• Nevada State Library
• Nevada System of Higher Education
(NSHE)
• Nevada Works
• School districts throughout the WNDD
region
• Truckee Meadows Community College
(TMCC)
• University of Nevada, Reno
• Western Nevada College (WNC)
E C O N O M I C R E C O V E R Y & R E S I L I E N C Y P R O J E C T
6. Workforce is properly remunerated,
secure, willing to accept training and
move between sectors while remaining in
the region.
7. Resources for job seekers, upskilling,
and post-disaster emergencies, such as
unemployment insurance, special training,
and job information, are available quickly
and efficiently.
8. Revenues for local government promote,
support, and sustain quality education
and workforce training, and health and
wellness systems and programs.
9. There is a Statewide Strategic Plan for
workforce development.

A complex balance of variables, including
healthcare, housing, arts, culture, and
recreation, contributes to the region’s overall
quality of life. Improving the region’s quality
of life can increase its desirability, generate
economic activity, and boost its recognition
and reputation. It can also contribute to
the overall happiness of its population,
which has been positively associated with
economic resilience.
Improving the quality of life is also
intrinsically connected to attracting and
retaining the workforce and businesses,
which are critical factors to an area’s ability
to anticipate, weather, and recover from an
economic shock. Industry wants to be based
where a talented workforce calls home.
Factors such as housing, cost of living, and
quality of life heavily influence an individual’s
decision to make the region their home, and
this is especially true for those with high-
paying knowledge, professional, and creative
jobs.
During the COVID-19 pandemic, some of the
region’s quality of life amenities which were
a boon to the local population and a draw to
people and businesses seeking to relocate.
Many individuals sought to recreate in the
region’s public lands and outdoor amenities,
which are critical components of its quality
of life and outdoor recreation economy.
Comparably less expensive housing costs
also drew individuals to the area from states
such as California, bolstering the market
during the economic shock. However, as
more people discover the quality of life
the region offers, WNDD and its partners
must continue investing and innovating to
improve the aspects that make it a desirable
place to live.
To strengthen and diversify the region’s
economy by continuing to improve its
quality of life, WNDD and its partners will
develop and implement plans, strategies,
activities, and initiatives that give its
residents what they want and need to
survive and thrive.
TARGET AREA 3:
The region offers more diverse
housing opportunities to fit the needs
of many populations, accessible health
and wellness services and amenities,
and opportunities for leisure pursuits
that enhance a sense of place and
community.
Quality Of Life
E C O N O M I C R E C O V E R Y & R E S I L I E N C Y P R O J E C T
28 Western Nevada Development District
Comprehensive Economic Development Strategy 29
E C O N O M I C R E C O V E R Y & R E S I L I E N C Y P R O J E C T
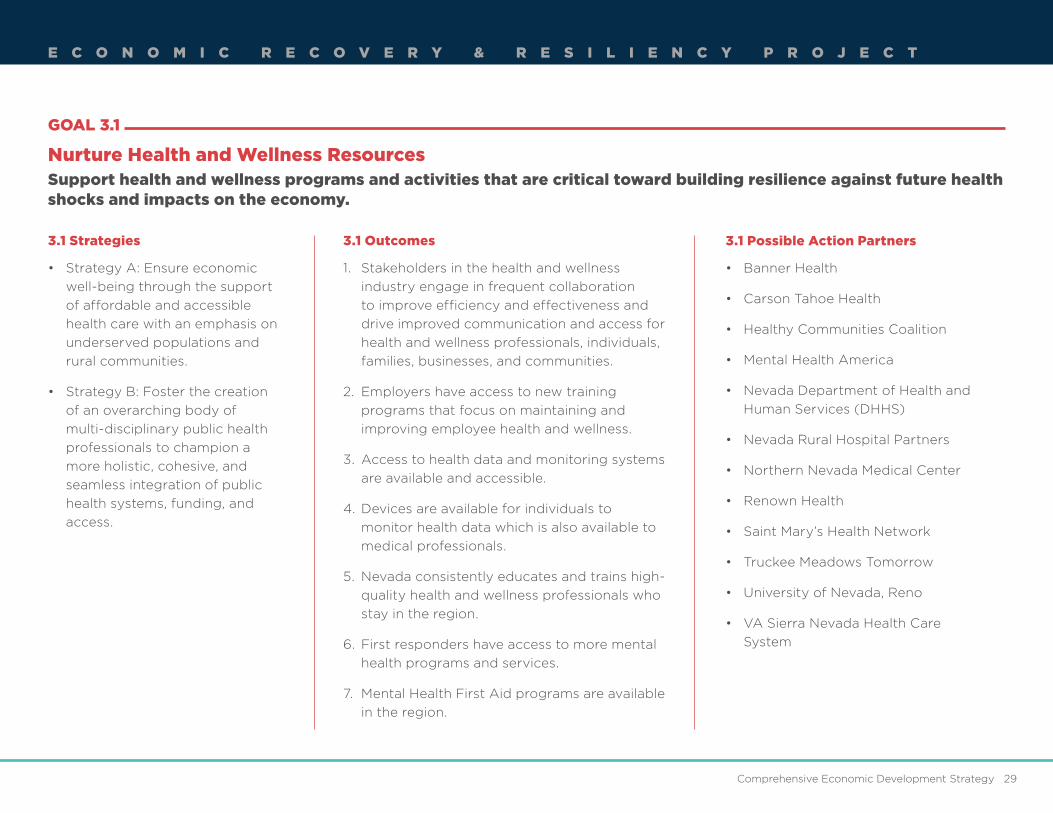
GOAL 3.1
Nurture Health and Wellness ResourcesSupport health and wellness programs and activities that are critical toward building resilience against future health shocks and impacts on the economy.
3.1 Strategies 3.1 Possible Action Partners3.1 Outcomes
1. Stakeholders in the health and wellness
industry engage in frequent collaboration
to improve efficiency and effectiveness and
drive improved communication and access for
health and wellness professionals, individuals,
families, businesses, and communities.
2. Employers have access to new training
programs that focus on maintaining and
improving employee health and wellness.
3. Access to health data and monitoring systems
are available and accessible.
4. Devices are available for individuals to
monitor health data which is also available to
medical professionals.
5. Nevada consistently educates and trains high-
quality health and wellness professionals who
stay in the region.
6. First responders have access to more mental
health programs and services.
7. Mental Health First Aid programs are available
in the region.
• Strategy A: Ensure economic
well-being through the support
of affordable and accessible
health care with an emphasis on
underserved populations and
rural communities.
• Strategy B: Foster the creation
of an overarching body of
multi-disciplinary public health
professionals to champion a
more holistic, cohesive, and
seamless integration of public
health systems, funding, and
access.
• Banner Health
• Carson Tahoe Health
• Healthy Communities Coalition
• Mental Health America
• Nevada Department of Health and
Human Services (DHHS)
• Nevada Rural Hospital Partners
• Northern Nevada Medical Center
• Renown Health
• Saint Mary’s Health Network
• Truckee Meadows Tomorrow
• University of Nevada, Reno
• VA Sierra Nevada Health Care
System

30 Western Nevada Development District
E C O N O M I C R E C O V E R Y & R E S I L I E N C Y P R O J E C T
GOAL 3.2
Build Housing CapacitySupport and promote activities and organizations committed to creating diverse, affordable, and available housing
options in the region to attract and retain workforce while stimulating the economy.
3.2 Strategies 3.2 Possible Action Partners
3.2 Outcomes
1. There are increased housing developments at all price points in the region near places of
work or public transportation locations connecting residential areas and places of work.
2. Established communities understand the value of new, affordable housing developments.
3. The region exhibits clear examples of balanced growth models.
4. Housing developers and builders take the initiative and risks to increase all housing stock.
5. Appropriate regulations, processes, and policies exist to ensure builders, regulators, and
educational institutions work collaboratively to expand housing.
6. There is adequate transitional housing available to those experiencing housing insecurity.
• Strategy A: Encourage new, existing, and creative development that expands housing
types to serve the region.
• Strategy B: Work with regional partners and stakeholders to identify barriers to housing
development and determine best practices, including improved cross coordination
amongst municipalities, to mitigate those hindrances.
• Strategy C: Evaluate opportunities for resources to fund affordable housing, including
those available via government, nonprofits, and financial institutions.
• Community Services Agency (CSA)
• Nevada Rural Housing Authority
• Nevada State Housing Division
• Northern Nevada Community
Housing
• Reno Housing Authority (RHA)
• Washoe HOME Consortium
• WNDD Member agencies

Comprehensive Economic Development Strategy 31
E C O N O M I C R E C O V E R Y & R E S I L I E N C Y P R O J E C T
GOAL 3.3
Cultivate Arts, Culture, and RecreationPromote arts, culture, and recreation activities and amenities as essential elements to qualify of life and support the recruitment of business, industry, and workforce in these areas.
3.3 Strategies 3.3 Possible Action Partners
3.3 Outcomes
1. There are increased projects that
support parks, trails, and open space
that are interconnected.
2. Public recreation programs and
amenities create and bolster social
networks, resulting in increased
resiliency for individuals, families,
neighborhoods, and communities.
3. Planning efforts increase to build a
greater sense of place.
• Strategy A: Enhance and capitalize
on the region’s existing quality of life
amenities to recruit and retain talent in
the region.
• Strategy B: Support the region’s
communities as they develop and grow
a greater sense of place.
• Carson City Culture and Tourism
Authority
• Fallon Convention and Tourism Authority
• Fernley Convention and Tourism
Authority
• Lake Tahoe Visitors Authority
• Mineral County Convention and Tourism
Authority
• Nevada Division of Tourism
• Nevada Housing Division
• Nevada State Parks
• Nevada Tourism and Cultural Affairs
• North Lake Tahoe Resort Association
• Reno Sparks Convention and Visitors
Authority
• Tahoe Douglas Visitors Authority
• Truckee Meadows Tomorrow
• Virginia City Tourism Commission
• Winnemucca Convention and Visitors
Authority
• WNDD Member agencies

32 Western Nevada Development District
Collaboration among the public, private,
education, and nonprofit sectors may
strengthen a region’s reaction to an
economic shock, provided they are aware
of each other’s roles and responsibilities
in the recovery process. The more able
government and stakeholder organizations
are to share essential information, the more
quickly the region can respond in times of
crisis.
The COVID-19 crisis rapidly increased
citizen demand for government services
and programs. For example, Nevada’s
unemployment system was quickly
overwhelmed in 2020 by the sudden surge
in claims from people out of work. Before
the pandemic, the Nevada Department of
Employment, Training and Rehabilitation
(DETR) processed between 16,000 and
18,000 claims a week. As of January 2021,
that number reached about 300,000 a
week.
Innovative solutions and digital technologies
hold the potential to help resource-
constrained governments and regulators
address capacity challenges such as these
while improving regulatory capacity,
service delivery, and crisis management.
To shape a more resilient economy, build
more resilient governments, and revitalize
the core capabilities of the public sector,
WNDD and its partners will engage in
programs, activities, and tactics to reimagine
government for the long term.
TARGET AREA 4:
The region’s government and
stakeholder organizations seamlessly
coordinate to institute innovative
solutions that are streamlined,
technologically advanced, and better
positioned to grow a sustainable and
resilient economy.
Government and Organizational Capacity
E C O N O M I C R E C O V E R Y & R E S I L I E N C Y P R O J E C T

Comprehensive Economic Development Strategy 33
E C O N O M I C R E C O V E R Y & R E S I L I E N C Y P R O J E C T
GOAL 4.1
Grow Partnerships and CollaborationExpand the region’s capacity to catalyze economic vitality through partnerships and collaboration.
4.1 Strategies 4.1 Outcomes
1. A one-stop, intergovernmental,
streamlined resource center for
information about services and programs
facilitates connections to those assets.
2. Government services are accessed
through virtual services, facilitating a
speedy recovery from a disaster.
3. An established, tested, and ready
Economic Response and Recovery
Emergency program includes
intergovernmental and agency
coordination to readily systematically and
cooperatively mobilize reserve forces and
resources according to economic shock
and needs.
4. The government provides the public with
disaster-related and recovery information
which is reliable, consistent and easy to
understand, resulting in a well-informed
and knowledgeable public.
5. Government policies, procedures,
and operations advance economic
development, including recovery and
resiliency strategies.
6. Government-sponsored Food Security
Councils address food desert issues.
7. The State Organic Certification Program
is re-established.
8. There is increased outreach to
WNDD member agencies regarding
opportunities for increased collaboration.
• Strategy A: Strengthen centralized,
clear and consistent communication
networks for communities and
stakeholders when accessing
government services and information,
utilizing cutting edge technology
creating greater efficiency,
effectiveness and increased customer
service for the public.
• Strategy B: Work with member
agencies to align and strengthen
policies, procedures, and operations
that advance economic development,
including recovery and resiliency
strategies.
• Strategy C: Expand economic
development capacity with increased
partnerships and enhanced
resources that support and oversee
the implementation of strategies
that build community and regional
resilience.

34 Western Nevada Development District
E C O N O M I C R E C O V E R Y & R E S I L I E N C Y P R O J E C T
4.1 Possible Action Partners
• Nevada Department of Agriculture
(NDA)
• Nevada Department of Public Safety,
Division Of Emergency Management/
Homeland Security
• Nevada Department of Conservation
and Natural Resources
• Nevada Division of Environmental
Protection
• Nevada Division of Outdoor
Recreation
• Nevada Governor’s Office of
Economic Development (GOED)
• Regional Development Authorities
• Tribal Governments
• U.S. Department of Agriculture
(USDA)
• University of Nevada, Reno Center for
Economic Development
• WNDD Board Members

Comprehensive Economic Development Strategy 35
E C O N O M I C R E C O V E R Y & R E S I L I E N C Y P R O J E C T
GOAL 4.2
Integrate a Regional Perspective in PlanningProvide for regional planning towards economic development goals that support recovery and plan for resiliency.
4.2 Strategies 4.2 Outcomes 4.2 Possible Action Partners
1. As a result of the CEDS process,
projects have been prioritized and
identified and approved by the
WNDD Board as having the most
significant benefit to the region.
2. There is increased regional
collaboration on the CEDS and ERR
Plan goals and actions.
3. Action Teams have been established
to engage the CEDS and ERR Plan.
4. Important economic data, trends, and
best practices are provided to the
WNDD members.
5. Training is provided to WNDD
members for economic development,
vitality, and resiliency.
6. WNDD Members are provided
ongoing and up-to-date information
and resources for funding projects
and programs.
• Nevada Governor’s Office of Economic
Development (GOED)
• Nevada State Housing Division
• Regional Development Authorities
• University of Nevada, Reno Center for
Economic Development
• University of Nevada, Reno Cooperative
Extension
• WNDD Member agencies
• Strategy A: Foster achievement
of the Comprehensive Economic
Development Strategy (CEDS) and
Economic Recovery and Resiliency
(ERR) Plan.
• Strategy B: Build partnerships to
support the engagement of the
CEDS, the ERR Plan, and the plan’s
respective goals, strategies, actions,
and projects.

36 Western Nevada Development District
E C O N O M I C R E C O V E R Y & R E S I L I E N C Y P R O J E C T
GOAL 4.3
Support Sustainability EffortsAdvance U.S. Economic Development Administration (EDA) ’s Investment Priority by promoting economic development planning and implementation projects that address the climate crisis, including green products, processes (including green infrastructure), places, and buildings to support economic and environmental resilience.
4.3 Strategies 4.3 Outcomes 4.3 Possible Action Partners
1. There are increased projects that
have been funded and developed that
promote environmental quality of life
and sustainability.
2. WNDD has presented ongoing
training to promote economic
resiliency and sustainability projects.
3. WNDD provides information
and resources on best practices
for sustainability and economic
development practices.
• Nevada State Housing Division
• Smart Growth America
• U.S. Economic Development
Administration (EDA)
• WNDD Member agencies
• Strategy A: Support sustainable
investments that promote job creation
and protect natural resources, and the
environment.
• Strategy B: Engage in communication
and training opportunities that
promote services, programs, and the
benefits of a sustainable and green
environment.

Comprehensive Economic Development Strategy 37
E C O N O M I C R E C O V E R Y & R E S I L I E N C Y P R O J E C T

38 Western Nevada Development District
440,893Jobs
NUMBERSBy the
2019 Population:
650,6422039 Projected
Population: 694,731
Average Per Capita Income:
$50,460
Largest Employing Industry:
Manufacturing
Primary Industries: Management of Companies and Enterprises, Utilities, And Finance and Insurance
R E G I O N A L O V E R V I E W
A Region Connected
Located in the northwestern corner of
Nevada, the Western Nevada Development
District’s region includes both urban and rural
areas, large cities, and even larger swaths
of open public lands. As a result, the region
often magnifies the state’s demographic
and economic trends, drawing attention to
opportunities and potential threats.
Commerce and commute intertwine the
region’s various communities, making it
more crucial that they work together to
demonstrate a forward-moving commitment
to quality of life and opportunity for all
residents
Like the rest of the state, the region’s
population is expected to grow over the next
decade. With that growth comes greater
economic activity, but also a greater need for
infrastructure, education, and other services
that promote and deliver the high-quality of
life that the region promises.
Ultimately, the region continues to pursue its
mission to have an innovative economy rooted
in sustainable development and enriched
by the area’s abundant natural resources
and the collaboration of its independent,
unique communities. To develop an action
plan that supports the region’s overall
goals, it’s imperative to begin with a clear
understanding of the region’s communities
from a demographic, geographic, and
economic perspective.

Churchill
Pershing
Washoe
Reno
Storey
Douglas
Carson
Mineral
Sparks
Fallon
Lovelock
Fernley
Humboldt
Winnemucca
Geographic Profile
R E G I O N A L O V E R V I E W
Western Nevada Development DistrictRegion – 2021
OREGON IDAHO
Nevada is geographically unique in how
much of its acreage is devoted to public
lands. As a whole, Nevada covers 110,567
square miles, making it the 7th largest state
in the nation by area. However, only 12.2%
of the land is private, which makes Nevada
the 10th smallest state in acreage available.
In addition, the 13,490 square miles of
developable private land is not contiguous.
Western Nevada Development District
includes the counties of Carson City,
Churchill, Douglas, Humboldt, Mineral,
Pershing, Storey, and Washoe, and the cities
of Fallon, Fernley, Lovelock, Reno, Sparks
and Winnemucca. The major thoroughfares
that connect the region Interstates 8 and
580, and U.S. Routes 50 and 95.
Going east from the Sierra Nevada, the
WNDD region is characterized by mountain
ranges, generally running north and south,
separated by broad valleys. The topography
is comprised of valleys surrounded by
mountains of varying heights. The region
is bounded on the north by Oregon and
Idaho, and to the west by Lake Tahoe and
California. To the east lies Utah and south
lies the remainder of Nevada.
Nevada is part of the Great Basin, a desert
environment. The region falls within a high
desert environment and has an arid climate.
Nevada is the driest state in the country, and
the WNDD region has rainfall that ranges
from 16.8 inches in Douglas County to 5.3
inches in Mineral County.
As a region, more than 80% of the WNDD
region is public lands. Mineral County boasts
the highest percentage of public lands at
94.4%, while Storey County has the least
with 9.5%.
CALIFORNIA
UTA
HA
RIZ
ON
A
Comprehensive Economic Development Strategy 39Sydney Martinez/TravelNevada

40 Western Nevada Development District
R E G I O N A L O V E R V I E W
More Connected Than EverThe Megapolitan Theory and How It Impacts Western Nevada’s Recovery and Resiliency
The Megapolitan Theory will be essential to
the continued growth of the counties, cities,
and communities that make up the Western
Nevada Development District (WNDD), and
you might not even have heard about it.
You’re not alone.
The term came from geographer Jean
Gottmann in his 1961 book, Megalopolis.
Megapolitans were also extensively
addressed in a 2011 report by Robert Lang
of the University of Las Vegas and Arthur
Nelson of the University of Utah.
Lang described megapolitan regions
as “integrated networks of metro- and
micropolitan areas.” Metropolitan areas are
defined by the commuter traffic within an
area, whereas megapolitans are linked by
their economic ties. At a minimum, they
include at least two metropolitan areas but
are often much larger, and their connections
can extend beyond the economy to
infrastructure, social, and urban ties.
The WNDD sits in the middle of the
Northern Nevada Sierra Pacific Megapolitan
Cluster, extending from the center of the
state to the Pacific Ocean, and includes San
Francisco, San Jose, and Sacramento.
In the California portion of this megapolitan
cluster is the major economic and tech
center of Silicon Valley. But the WNDD
communities are in a good position as
well, with two significant assets: acres and
acres of inexpensive land and a motivated
workforce.
This was apparent in 2014 when Tesla
chose Storey County as the home for its
Gigafactory after reportedly investigating
more than 100 potential sites. As of 2018,
Tesla employed almost 8,000 people at this
location.
The Megapolitan Theory gets even
better for the communities in the WNDD.
Adjoining the Northern Nevada Sierra
Pacific Megapolitan Cluster are two other
Megapolitan clusters. The Eastern Nevada
Mountain Megapolitan Cluster takes in the
northeast third of Nevada, almost all of Utah
(including Salt Lake City), and extends to
Denver. The Southern Nevada Southwest
Triangle Megapolitan Cluster consists of
all of Southern California (including Los
Angeles and San Diego), the southern
portion of Nevada (Las Vegas), and almost
two-thirds of Arizona (Phoenix and Tucson).
What does this mean? According to
Nevada’s Plan for Recovery & Resilience,
prepared by SRI International, in
collaboration with RCG Economics and
Brookings Mountain West: “… Nevada sits at
the center of a trade region that exceeds 53
million residents, a region that exceeds in
both population and GDP such nations like
South Korea (pop. 51.8 million) and Spain
(pop 47.3 million).” That is a lot of potentials.
The study goes on to note: “Nevada’s most
important economic opportunities lie in
deepening its ties to adjacent megapolitan
areas. The state can induce both corporate
relocation and skilled labor migration from
the greater Southwest. Nevada maintains
lower costs, less regulation, and less tax
burden, especially when compared to
California.”
As of 2018,
Telsa employed
almost 8,000 people
at it’s
Storey County
location

Comprehensive Economic Development Strategy 41
26
Figure 9 below shows what Brookings Mountain West at UNLV terms “The Three Nevadas.” The three zones identified show the approximate area of economic interdependence that links Nevada to California, Arizona, and Utah. Las Vegas falls within a sphere that extends from California’s Central Coast to the Mexican border with Arizona. Reno’s economic sphere incorporates much of Northern California. Elko’s shared economic space stretches across Utah to Colorado’s Front Range.
Each of Nevada’s Regions Remains Well-Positioned to Megapolitan Areas Throughout the Western United States
Figure 9: Nevada's Megapolitan Clusters. Source: Robert E. Lang and Jaewon Lim, Brookings Mountain West--UNLV, 2020.
These megapolitan areas exhibit an economic integration either approaching or equal to what the U.S. Census Bureau defines as “combined statistical areas” (or CSAs). Being a CSA is significant in that it shows urban space has achieved high levels of economic integration centered on commuting patterns. Nevada is becoming more connected with its neighboring states via a myriad of economic functions. Tech transfers from the Bay Area to metro Reno have transformed Northern Nevada. Las Vegas shares a wide array of trade, patents, highway, air links, and now direct labor markets with California and Arizona. Gold mined in central Nevada is processed in Utah and often managed from Colorado. Nevada’s most important economic opportunities lie in deepening its ties to adjacent megapolitan areas. The state can induce both corporate relocation and skilled labor migration from the greater Southwest. Nevada maintains lower costs, less regulation, and less tax burden, especially when compared to California.
R E G I O N A L O V E R V I E W
A study entitled MountainMegas, also
prepared by the Brookings Institution
at UNLV, noted that true success
for WNDD and its megapolitan area
depends on balanced growth that is
sustainable, productive, and inclusive.
Attaining this requires continued
development of infrastructure—both
roads and digital connectivity, top-
level innovation, a viable workforce,
a strong quality of place, and good
regional governance. Good schools and
institutions of higher education should
also be included in that list.
Tesla’s selection of northern Nevada
for its Gigafactory helped northwest
Nevada recover from the 2008
recession. A development strategy
based in part on the Megapolitan Theory
will propel even more regional economic
growth as the nation recovers from the
economic setbacks of the Coronavirus
pandemic.
Each of Nevada’s regions remains well-positioned to megapolitan areas throughout the western Unites States.
Source: Robert E. Lang and Jaewon Lim, Brookings Mountain West–UNLV, 2020.

R E G I O N A L O V E R V I E W
Population: Growthannual regional
growth rate
2.9%1970 - 2019
U.S. Census Bureau, 1970, 2018; American Community Survey, 2019; Nevada Department of Taxation, 2019
Fallon 1970: 2,959 2019: 8,430 184.9%
Fernley 1970: N/A 2019: 20,068 N/A
Lovelock 1970: 1,680 2019: 1,959 16.6%
Reno 1970: 72,863 2019: 246,500 238.3%
Sparks 1970: 24,187 2019: 100,589 315.9%
Winnemucca 1970: 3,587 2019: 7,762 116.4%
1970Population
1980 Population
1990Population
2000Population
2010Population
2019 Population
Population Growth by City
Like the state of Nevada as a whole, the population in the Western Nevada Development District’s region
grew dramatically from 1970 to 2019, compared to the country. While the United States saw a population
increase of about 60% over those 49 years, WNDD’s population grew by more than 280% during the same
time. This trend will likely continue over the next two decades as experts predict more people will move and
relocate to the region.
42 Western Nevada Development District

Comprehensive Economic Development Strategy 43
R E G I O N A L O V E R V I E W
POPULATION: Growth by Region, CountyPopulation Growth and Projections: Region and County
WNDD Region 2019: 650,642 2039: 694,731 10.2%
Washoe County 2019: 471,519 2039: 525,513 11.5%
Carson City 2019: 54,773 2039: 62,202 13.6%
Churchill County 2019: 24,259 2039: 27,244 12.3%
Douglas County 2019: 48,132 2039: 45,520 5.4%
Humboldt County 2019: 16,828 2039: 18,082 7.5%
Mineral County 2019: 4,460 2039: 5,021 12.6%
Pershing County 2019: 6,615 2039: 6,373 3.7%
Storey County 2019: 3,988 2039: 4,776 19.8%
1970Population
1980 Population
1990Population
2000Population
2010Population
2019 Population
2039 PROJECTED
POPULATION
Lowest growth rate:
0.2%in 2011
10.2%2037 projected population
predicted increase from 2019
6.3%Highest growth rate: in 1978
74% of the WNDD
Region’s population is
Washoe County

44 Western Nevada Development District
R E G I O N A L O V E R V I E W
Population: Age
Population by Age: WNDD Region
Average Median Age in WNDD Region: years
Source: U.S. Census Bureau, American Community Survey, 2019
19 and under23.5%
75 and over
6.8%
ages 55-7424.9%
ages 20-3420.4%
ages 35-5424.3%
43.7
Average Median Age by County
Average Median Age by City
Carson City
42.4
WashoeCounty
38.6
DouglasCounty
52
Humboldt County
36
MineralCounty
52.9
Sparks
38.3
Lovelock
39.8Fallon
34.4
Reno
35.8
PershingCounty
42.1
On the whole, the WNDD Region
is older than the state of Nevada
and the United States, with an
average age of 43.7, almost seven
years older than the state and
country. More rural areas, such
as Mineral and Douglas, have an
older population on average than
the state and the general region.
However, the population of more
urban areas skews younger,
especially the region’s largest
county, Washoe County, and the
cities it encompasses, Reno and
Sparks. Individuals younger than
44 make up more than half of the
WNDD’s regional population, and
individuals between the ages of
25-34 make up the largest group
of the population in the region.
ChurchillCounty
39.7StoreyCounty
50.9
Winnemucca
33.7
Fernley
38.4

Comprehensive Economic Development Strategy 45
Population by Age: County
Source: U.S. Census Bureau, American Community Survey, 2019
75 and over
55 - 74
35 - 54
20 - 34
19 and under
Fallon Fernley Lovelock Reno Sparks Winnemucca
Carson City
Churchill County
Douglas County
Mineral County
HumboldtCounty
Pershing County
Storey County
Washoe County
Population by Age: City
WNDD’s youngest city is
Fallon with 50% of the population 34
and under
Humboldt County has the region’s youngest median age

46 Western Nevada Development District
R E G I O N A L O V E R V I E W
Population: Diversity, Culture and Race Population by Race/Ethnicity: Region
White
Hispanic/Latino
Black/African American
American Indian/Alaska Native
Asian
Native Hawaiian/Other Pacific Islander
Some other race
Two or more racesWNDD Region
United States
Nevada
While Nevada’s population is almost
evenly split between white and other
races and ethnicities, the overall
WNDD’s regional population is almost
65% white. The region’s Hispanic or
Latino population is also a smaller
percentage than the state average of
more than 29%.
The region’s most diverse county by
percentage is Mineral County, which
also has the most significant American
Indian and Alaska native population by
percentage at almost 19%. However,
Washoe County has the most
indigenous individuals by headcount.
Compared to the state of Nevada as a whole, the WNDD region is less diverse when examining race and ethnicity.

Comprehensive Economic Development Strategy 47
Population by Race/Ethnicity: County
Source: U.S. Census Bureau, American Community Survey, 2019
Population by Race/Ethnicity: City
ChurchillCounty
WashoeCounty
Douglas County
Mineral County
Humboldt County
PershingCounty
Carson City
StoreyCounty
Winnemucca
Sparks
Reno
Lovelock
Fernley
Fallon

48 Western Nevada Development District
R E G I O N A L O V E R V I E W
Population: Gender
Male to Female Ratios
In general, there are more men than women living in the WNDD region compared with state
and national averages. The region’s average sex ratio, males per 100 females, is 12 points
higher than the state’s and more than 15 points higher than the national ratio. In general,
there are more men than women in rural areas, especially Pershing County. Pershing
County’s males-per-females ratio is especially high in the 65 and older age range. The area
with the most equal representation of genders is Douglas County, which averages around a
100-male-to-100-female ratio for individuals older than 18 years.
WNDDRegion
United States
Nevada
Total males per 100 females
Males per 100 females 18 years and older
Males per 100 females 65 years and older

Comprehensive Economic Development Strategy 49
Male to Female Ratios: County Male to Female Ratios: City
ChurchillCounty
Fernley
WashoeCounty
Douglas County
Lovelock
Mineral County
Humboldt County
PershingCounty
Carson City
Fallon
StoreyCounty
Total males per 100 females
Males per 100 females 18 years and older
Males per 100 females 65 years and older
FallonLowest city male-to-female ratio
Highest city male-to-female ratio
Lovelock
Reno Sparks Winnemucca
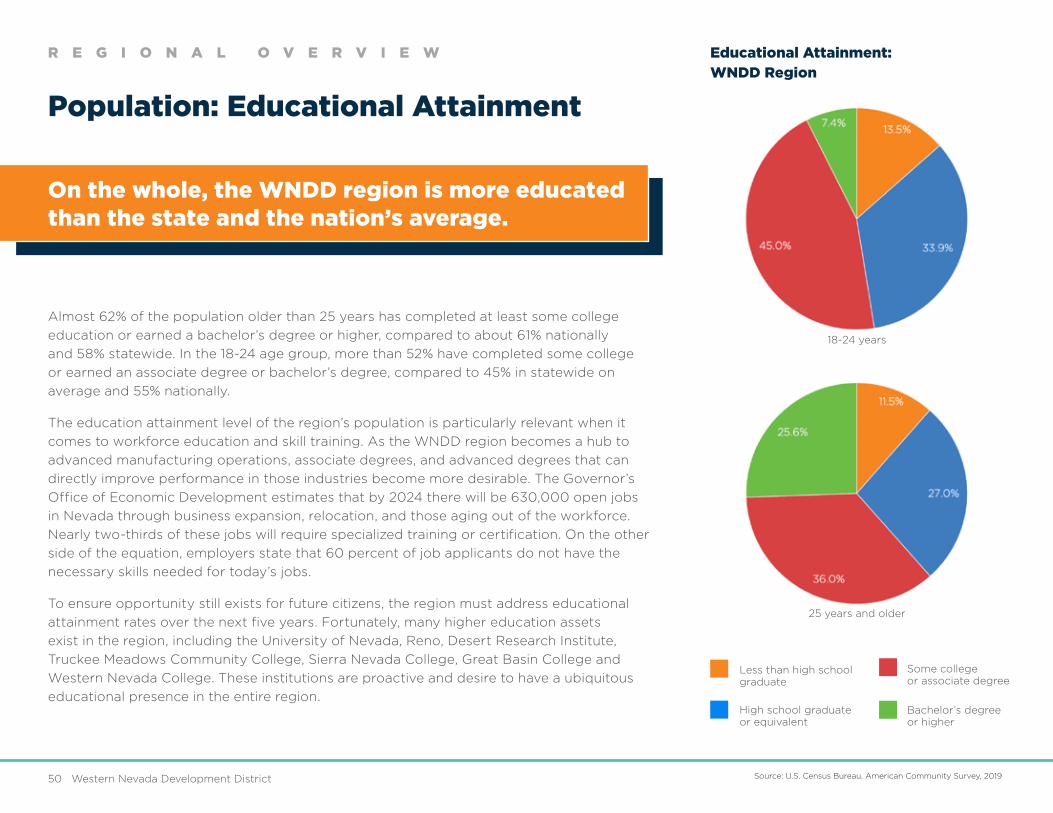
50 Western Nevada Development District
R E G I O N A L O V E R V I E W
Source: U.S. Census Bureau, American Community Survey, 2019
Almost 62% of the population older than 25 years has completed at least some college
education or earned a bachelor’s degree or higher, compared to about 61% nationally
and 58% statewide. In the 18-24 age group, more than 52% have completed some college
or earned an associate degree or bachelor’s degree, compared to 45% in statewide on
average and 55% nationally.
The education attainment level of the region’s population is particularly relevant when it
comes to workforce education and skill training. As the WNDD region becomes a hub to
advanced manufacturing operations, associate degrees, and advanced degrees that can
directly improve performance in those industries become more desirable. The Governor’s
Office of Economic Development estimates that by 2024 there will be 630,000 open jobs
in Nevada through business expansion, relocation, and those aging out of the workforce.
Nearly two-thirds of these jobs will require specialized training or certification. On the other
side of the equation, employers state that 60 percent of job applicants do not have the
necessary skills needed for today’s jobs.
To ensure opportunity still exists for future citizens, the region must address educational
attainment rates over the next five years. Fortunately, many higher education assets
exist in the region, including the University of Nevada, Reno, Desert Research Institute,
Truckee Meadows Community College, Sierra Nevada College, Great Basin College and
Western Nevada College. These institutions are proactive and desire to have a ubiquitous
educational presence in the entire region.
On the whole, the WNDD region is more educated than the state and the nation’s average.
Educational Attainment: WNDD Region
18-24 years
25 years and older
Population: Educational Attainment
Less than high school graduate
High school graduate or equivalent
Some college or associate degree
Bachelor’s degree or higher

Comprehensive Economic Development Strategy 51 Source: U.S. Census Bureau, American Community Survey, 2019
Educational Attainment: County
25 years and older
18-24 years18-24 years 25 years and older25 years and older
Mineral CountyHumboldt County
Carson City Churchill County
18-24 years 18-24 years18-24 years 25 years and older 25 years and older
Douglas County
Pershing County
18-24 years 25 years and older
Washoe County
18-24 years 25 years and older
Storey County
18-24 years 25 years and older
More than 46%
of Washoe County’s
population 18-24 have
completed some
college or graduated
with an associate
degree
Less than high school graduate
High school graduate or equivalent
Some college or associate degree
Bachelor’s degree or higher

52 Western Nevada Development District
Educational Attainment: City
25 years and older
18-24 years18-24 years 25 years and older25 years and older
SparksReno
Fallon Fernley
18-24 years 18-24 years18-24 years 25 years and older 25 years and older
Lovelock
Winnemucca
18-24 years 25 years and older

Comprehensive Economic Development Strategy 53
R E G I O N A L O V E R V I E W
Commuting
Because of its large area and diversity of
industries and communities, the WNDD
region sees a large number of commuters
who travel from one county to another for
work or residence. For example:
Of the people who work in Carson City:
• 14.0% Reside in Douglas County
• 57.1% Reside in Carson City
• 13.9% Reside in Washoe County
Of the people who work in Storey County:
• 40.5% reside in Storey County
• 30.4% reside in Washoe County
• 18.8% reside in Lyon County
As a result, residential adjustment plays a fairly
significant role in considering the personal
income of individuals in each location. For
example, for every $100 of personal income
reported for Washoe County in 2019, $3.84
is derived from jobs and earnings garnered
outside the county.
This adjustment is more dramatic in Storey
County, where the majority of employees and
workers commute each day. On average, more
than 440 percent of the income made in Storey
County leaves the county via employees living
in surrounding counties. For every $100 of
personal income reported for Storey County in
2019, an additional $440.83 of earned income
was reported elsewhere from jobs held locally
by workers who resided in another county.
Douglas County sees a similar affect for
residential adjustment. From 1969 to 1992,
Douglas County realized negative residence
adjustment. After 1992, residence adjustment
has been positive. For every $100 of personal
income reported for Douglas County in
2019, $8.13 is derived from jobs and earnings
garnered outside the county.
Carson CIty
Churchill County
Douglas County
Humboldt County
Mineral County
Pershing County
Storey County
Washoe County
Other
Place of Work by County
Nearly 13% of working Douglas County
residents work outside of the WNDD region
More than 50% of workers in Storey County commute from other counties each day
County of Residence:

54 Western Nevada Development District Source: Nevada REAProject.org Data Regional Income Division, BEA (11-15-2018)
R E G I O N A L O V E R V I E W
Income Per Capita Personal Income
When measured in current dollars, Western Nevada Development
District (WNDD)’s per capita personal income increased 1,048%, from
$5,379 in 1970 to $61,755 in 2019. When measured in constant 2012
dollars to adjust for inflation, it advanced 119%, from $25,674 in 1970 to
$56,217 in 2019.
During this 51-year period, Western Nevada Development District’s
real per capita personal income rose from $24,306 in 1969 to $56,217
in 2019, for a net gain of $31,910, or 131%. In comparison, Northeastern
Nevada Regional Development Authority’s real per capita personal
income advanced from $20,453 in 1969 to $45,342 in 2019, for a net
advance of $24,889, or almost 122%.
In addition, Nevada’s real per capita personal income increased from
$23,718 in 1969 to $46,573 in 2019, for a net gain of $22,855, or 96%.
At the national level, real per capita personal income increased from
$19,638 in 1969 to $51,424 in 2019, for a net gain of $31,786, or almost
162%.
From 1970 to 2019 the per capita income in the WNDD region grew by
119%
WNDD Per Capita Personal Income 1970-2019 Current vs. Constant Dollars
$70,000-----
$60,000-----
$50,000-----
$40,000-----
$30,000-----
$20,000-----
$10,000-----
$0-
-$70,000-----$60,000-----$50,000-----$40,000-----$30,000-----$20,000-----$10,000-----$0
| | | | | | | | | | | | | | | | | | | | | | | | | | | | | | | | | | | | | | | | | | | | | | | | | | |
1970 1975 1980 1985 1990 1995 2000 2005 2010 2015
1970 1975 1980 1985 1990 1995 2000 2005 2010 2015
Current $s Constant $s
Real Per Capita Personal Income Indices 1969-2019
WNDD Nevada United States
$70,000-----
$60,000-----
$50,000-----
$40,000-----
$30,000-----
$20,000-----
$10,000-----
$0-
-$70,000-----$60,000-----$50,000-----$40,000-----$30,000-----$20,000-----$10,000-----$0
| | | | | | | | | | | | | | | | | | | | | | | | | | | | | | | | | | | | | | | | | | | | | | | | | | |

Comprehensive Economic Development Strategy 55
R E G I O N A L O V E R V I E W
Median Earnings By Educational Attainment
Source: U.S. Census Bureau, American Community Survey, 2019
County City
Regional Comparison
ChurchillCounty
FernleyWashoeCounty
Douglas County
Humboldt County
LovelockMineral County
RenoPershingCounty
Sparks WinnemuccaCarson City
FallonStoreyCounty
Less than high school graduate
High school graduate (includes equivalency)
United States Nevada WNDD Region
For Individuals 25 Years and older, in 2018 Inflation-Adjusted Dollars
Some college or associate degree
Bachelor’s degree
Graduate or professional degree
Some higher education
Median Earnings for WNDD Region In The Past 12 Months $38,126

56 Western Nevada Development District
R E G I O N A L O V E R V I E W
Top Growing Industries
Manufacturing
Construction
Transportation and Warehousing
Health Care and Social Assistance
Administrative and Support and Waste Management and Remediation Services
Professional Scientific, and Technical Services
Information
Real Estate and Rental and Leasing
Retail Trade
Agriculture, Forestry, Fishing and Hunting
Government
Mining, Quarrying and Oil and Gas Extraction
Wholesale Trade
Other Services (except Public Administration)
Management of Companies and Enterprises
Finance and Insurance
Utilities
Growth in Number of Jobs by Industry: WNDD Region
0 2,000 4,000 6,000 8,000 10,000 12,000
Data from Nevada Cooperative Extension at the University Center for Economic Development

Comprehensive Economic Development Strategy 57
R E G I O N A L O V E R V I E W
Top Industry Earnings2020 Earning per Worker
$0 $50,000 $100,000 $150,000
Management of Companies and Enterprises
Utilities
Finance and Insurance
Mining, Quarrying, and Oil and Gas Extraction
Professional, Scientific, and Technical Services
Information
Manufacturing
Government
Wholesale Trade
Construction
Health Care and Social Assistance
Real Estate and Rental and Leasing
Transportation and Warehousing
Administrative and Support and Waste Management and Remediation Services
Education Services
Retail Trade
Agriculture, Forestry, Fishing and Hunting
Arts, Entertainment, and Recreation
Other Services (except Public Administration)
Accommodation and Food Services
Data from Nevada Cooperative Extension at the University Center for Economic Development

58 Western Nevada Development District
R E G I O N A L O V E R V I E W
Five-Year Total Employment Total Number Of Jobs 2015-2019: WNDD Region
The majority of the job
growth was driven by
Storey County,
home to the
Tahoe-Reno
Industrial
Center.
The WNDD region saw an increase of more than 52,500 jobs from 2015-2019.
Tahoe-Reno Industrial Center
The number of jobs in the WNDD region grew at almost double
the rate of the United States from 2015 to 2019. The majority of
the job growth was primarily driven by Storey County, which saw
an increase of more than 216% during that time. Storey County is
home to the Tahoe-Reno Industrial Center (TRIC), which includes
the Telsa and Panasonic Gigafactory, Wal-Mart regional food
distribution center, Zulily, Thrive Market and many others. Areas
that experienced double- digit growth include Washoe County and
the Reno-Sparks Metropolitan Statistical Area, which includes the
cities of Reno and Sparks, and part of Greater Reno-Tahoe-Fernley
Combined Statistical Area.

Comprehensive Economic Development Strategy 59
Reno-Sparks MSA
Carson City Churchill County
Mineral County
Douglas County
Pershing CountyHumboldt County
Storey County Washoe County
Fallon MSA
Total Number Of Jobs 2015-2019: County and City Metropolitan Statistical Areas
Fernley MSA
Source: U.S. Bureau of Economic Analysis
Storey County jobs increased
216%from
2015-2019

60 Western Nevada Development District
R E G I O N A L O V E R V I E W
Employment By Industry: Comparing 2010 to 2019
2010 2019Nevada
2010 2019WNDD Region
2010 2019Carson City
2010 2019Churchill County
2010 2019Douglas County
100%
90%
80%
70%
60%
50%
40%
30%
20%
10%
0
Construction
Education and Health Services
Manufacturing
Natural Resources and Mining
Financial Activities
Information

Comprehensive Economic Development Strategy 61
2010 2019Humboldt County
2010 2019Mineral County
2010 2019Pershing County
2010 2019Storey County
2010 2019Washoe County
100%
90%
80%
70%
60%
50%
40%
30%
20%
10%
0
Other Services
Professional and Business Services
Tourism, Gaming and Hospitality
Unclassified
Public Administration
Trade, Transportation and Utilities
From 2010 to 2019, some of the fastest growing industries for employment in the WNDD region’s counties included construction and
manufacturing. Both of these segments increased their overall employment by more than 91% and 94% respectively. Almost all counties
in the WNDD region saw the number of people employed by construction increase, with the exception of Pershing County. Storey County
primarily drove the region’s growth in manufacturing employment during this time, with an almost 2400% increase. Tourism, gaming and
hospitality employed about 25% statewide in 2019, compared to less than 17% in the WNDD region.

62 Western Nevada Development District
R E G I O N A L O V E R V I E W
Top Occupations
1. Office and administrative support 38,9192. Sales and related 32,8173. Management 29,3164. Food preparation and serving related 21,8255. Construction and extraction 21,633
6. Production 19,9767. Educational instruction and library 18,7628. Material moving 16,8259. Transportation 13,70210. Business and financial operations 13,507
Source: U.S. Census Bureau, American Community Survey, 2019
Top Occupations: WNDD Region
WNDD Top Ten Occupation Totals:
Office and administrative support
Sales and related
Management
Food preparation and serving related
Construction and extraction
Production
Educational instruction and library
Material moving
Transportation
Business and financial operations
In the WNDD Region, almost one half of the
civilian, employed population older than 16 is
employed in five occupational areas:
Civilian employed population 16 and over:
• Office and administrative support
• Sales and related
• Management
• Food preparation and serving related
• Construction and extraction
In general, most of the top occupations in
the counties and cities in the region reflect
that trend. However, some areas show
more employment in the construction and
extraction occupations, such as Mineral
County. Storey County bucks the trend a bit,
as its top occupations include Installation,
maintenance, and repair.
Those occupations with the least amount
of workforce in the region include farming,
fishing, and forestry, legal law enforcement
workers including supervisors, life,
physical, and social science firefighting and
prevention, and other protective service
workers including supervisors. However,
this is in line with trends nationally and in
Nevada.
Civilian employed population
16 years and over in region:
320,98438,919
32,817
29,316
21,63319,976
18,76216,825
13,702 13,507
21,825

Comprehensive Economic Development Strategy 63
Top Occupations: County and City
Carson City Churchill County Douglas County Humboldt County
Mineral County Pershing County Storey County Washoe County
The city of Reno is largest working population in the region, employing more than 140,000 civilians 16 years and over
Lovelock has the smallest workforce, totaling less than 800 employed civilians 16 years and over.
Washoe County has the largest workforce, more than 75% of the region’s total working population.
65% of the workforce in Churchill County are employed within the top ten occupations.
Fallon
SparksReno
Fernley Lovelock
Winnemucca

64 Western Nevada Development District
R E G I O N A L O V E R V I E W
Top Industry Wages
Industrial Design Services
Computer and Supply Merchant Wholesalers
Security & Commodity Investment Activity
Securities Brokerage
Custom Computer Programming Services
Architectural Services
Portfolio Management
Computer Training
Lessors, Nonfinancial Intangible Assets
Scientific Research and Development Services
Funds, Trusts & Other Financial Vehicles
Semiconductor and Related Devices
Nonscheduled Air Passenger Chartering
Other Travel Arrangement Services
All Other Travel Arrangement Services
Trust, Fiduciary, and Custody Activities
Real Estate Credit
Physical/Engineering/Biological Research
All Other Financial Investment Activity
Research and Development in the Physical, Engineering, and Life Sciences (except
Nanotechnology and Biotechnology)
Average Weekly Wage: WNDD Region
The top wages in the WNDD region are paid for support activities for
industrial design services
Sources: U.S. Census Bureau, American Community Survey, 2019

Comprehensive Economic Development Strategy 65
R E G I O N A L O V E R V I E W
Top Growing Occupations
Transportation and Material Moving
Construction and Extraction
Business and Financial Operations
Management
Health Practitioners and Technical
Production
Architecture and Engineering
Office and Administrative Support
Healthcare Support
Installation, Maintenance and Repair
Community and Social Service
Computer and Mathematical
Farming, Fishing and Forestry
Protective Service
Life, Physical and Social Science
Legal
Sales and Related
Educational Instruction and Library
0 1,000 2,000 3,000 4,000 5,000 6,000 7,000
Data from Nevada Cooperative Extension at the University Center for Economic Development

66 Western Nevada Development District
Projects Supported by the 2020-2025 CEDs
A P P E N D I C E S : C E D S P R O J E C T S
Project Name Cost Timing
Muller Parkway $12,000,000 2020/2021
Project Name Cost Timing
CHIP Wastewater Treatment Project
$25,000,000 2020/2021
CHIP Water Treatment Project $20,000,000 2020/2021
County Fairgrounds Covered Area
$15,000,000 2020/2021
Reno Highway Wastewater Expansion
$6,000,000 2020/2021
Reno Highway Water System Expansion
$3,000,000 2020/2021
Churchill Commerce Area – Water
$3,500,000 2021
Churchill Commerce Area – Sewer
$3,500,000 2021
Douglas County
Project Name Cost Timing
Convention Center East Hall Reconstruction
$20,000,000 2021
Early Learning Center (Extension to Boys and Girls Club Building)
$6,000,000 2021
Winnemucca Municipal Business Air Park
$2,000,000 2021
Grass Valley Water Treatment Plant
TBD 2021
Humboldt County
Project Name Cost Timing
Industrial Property Utilities $10,000,000 2020/2021
Potable Water Supply Storage $6,000,000 2020/2021
Waste Water ReUse $5,000,000 2020/2021
Sidewalks and Gutters $2,000,000 2020/2021
Mineral County Well Improvements
$650,000 2021
Hawthorne Hazardous Cargo Bypass
$350,000 2021
Mineral County
Churchill County
Annually, WNDD member agencies submit projects to be included with the CEDS and part of the regional planning process. A process is
engaged to evaluate and prioritize those projects. Projects are listed below.

Comprehensive Economic Development Strategy 67
A P P E N D I C E S : C E D S P R O J E C T S
Project Name Cost Timing
Pershing County Law Enforcement Center
$12,000,000 2020/2021
Lovelock Sewer Lift Station (17th St) and Sewer Expansion (6th St)
$5,000,000 2020/2021
G-29 Bridge Replacement $3,000,000 2020/2021
Lovelock Fire Department Land Acquisition
$60,000 2021
Central Avenue Sidewalk Improvements
TBD 2021
Broadband - Last Mile Unknown 2020/2021
Community Parks Upgrade Unknown 2020/2021
Community Youth Center and Gym
Unknown 2020/2021
Derby Field Water Main Unknown 2020/2021
I80 Exits 105, 106, 107 Unknown 2020/2021
Imlay Water System Unknown 2020/2021
Lovelock Beautification/Landscaping
Unknown 2020/2021
Lovelock Depot/Block Development
Unknown 2020/2021
Lovelock Fire Station Addition Unknown 2020/2021
Lovelock Housing Unknown 2020/2021
Maszen House Museum Upgrades Unknown 2020/2021
Park and Ride Shuttle Services Unknown 2020/2021
PC Economic Development and Lands Bill
Unknown 2020/2021
PC Hiking/Biking/Walking Trails Unknown 2020/2021
PC Hotsprings/Ghost Towns/40 Mile Desert
Unknown 2020/2021
Redevelopment Area Unknown 2020/2021
Pershing CountyProject Name Cost Timing
C Street Dedication $2,000,000 2020/2021
Lockwood Flood $2,000,000 2020/2021
Virginia City Visitor's Center $1,800,000 2020/2021
Lousetown Road $1,400,000 2020/2021
Historic Freight Depot Restoration Project
$643,828 2020/2021
Gold Hill Sewer Phase II $500,000 2020/2021
Lockwood Center $400,000 2020/2021
Six Mile Canyon $300,000 2020/2021
B and C Streets Stairway Project TBD 2021
Liberty Engine Company 1 Seismic Retrofit Project
TBD 2021
Mark Twain Flood Project TBD 2020/2021
Piper's Opera House Seismic Retrofit Project
TBD 2021
Sidewalk and Boardwalk Restoration Project
TBD 2021
Six Mile Canyon Flood Project TBD 2021
South Entrance Rest Stop Project TBD 2021
St. Mary's Art Center Seismic Retrofit Project
TBD 2021
Storey County Courthouse Seismic Retrofit Project
TBD 2021
Virginia and Truckee Railroad Tunnel 6 Project
TBD 2021
Storey County
Project Name Cost Timing
Bailey Creek Sediment Improvements
$20,000,000 2020/2021
Heppner Subdivision Sediment $16,000,000 2020/2021
STMWRF-TMWRF Intertie $10,000,000 2020/2021
Lemmon Drive Improvements $2,000,000 2020/2021
Calle De La Plata Improvements $1,500,000 2020/2021
Swan Lake Reservoir Dam Unknown 2020/2021
Washoe County

68 Western Nevada Development District
A P P E N D I C E S : C E D S P R O J E C T S
Project Name Cost Timing
North Valleys Treated Effluent/Recycled Water Storage System
$176,000,000 2021
RSWRF Aquifer Storage and Recovery
$55,500,000 2020/2021
Public Safety Center $33,000,000 2020/2021
Reno Moana Recreation Facility $19,000,000 2020/2021
Reno Fire Station HQ $14,750,000 2020/2021
Rosewood Lakes Regional Athletics
$11,000,000 2020/2021
Lear II Lift Station and Force Main
$10,900,000 2020/2021
City Hall Seismic Retrofit $9,500,000 2020/2021
The Parking Gallery Addition $7,500,000 2020/2021
Fire Station Repair and Reconstruction
$5,560,000 2020/2021
Reno Fire Station #1 $5,500,000 2020/2021
National Bowling Stadium Multi-Use Expansion
$5,000,000 2021
Reno Quality of Life Projects $688,790 2020/2021
Downtown Reno Beautification Unknown 2020/2021
City of Reno
Project Name Cost Timing
TMWRF Advanced Nutrient Treatment
$60,000,000 2020/2021
TMWRF Nitrification $5,000,000 2021
TMWRF Effluent Reuse Station Rehabilitation
$4,100,000 2021
TMWRF Solids Management $2,000,000 2021
City of Sparks
Project Name Cost Timing
William Street Complete Streets $16,500,000 2020/2021
Carson City Emergency Operations Center
$12,100,000 2020/2021
Quill Water Treatment Plant Upgrade
$10,000,000 2020/2021
Terminal Building Construction and Airport Entrance Beautification
$6,000,000 2021
Southeast Mandatory Sewer Extension Project
$4,200,000 2020/2021
Carson Airport Storage and Maintenance Facility
$1,100,000 2021
Project Name Cost Timing
Rattlesnake Hill Water Tank Capacity Increase
$3,950,000 2021
Rattlesnake Hill Industrial Park Development
TBD 2021
Carson City
City of Fallon
Project Name Cost Timing
Community Center $27,000,000 2020/2021
Nevada Pacific Parkway Extension
$16,000,000 2020/2021
BOR Park #1 Development TBD 2020/2021
City Street Reconstruction TBD 2020/2021
City Wide ide Fiber Optic Project TBD 2020/2021
Improved Water Storage and Management
TBD 2020/2021
Main Street Revitalization TBD 2020/2021
Railroad Underpass Rehabilitation
TBD 2020/2021
Silverland Park Ball Fields TBD 2020/2021
Upgrades to City Water Delivery TBD 2020/2021
City of Fernley

Co mprehensive Economic Development Strategy 69
A P P E N D I C E S : C E D S P R O J E C T S
Project Name Cost Timing
Tahoe Incubator and Revolving Loan Fund
$500,000 2020/2021
Tahoe Broadband Connectivity Project
$150,000 2020/2021
Tahoe Green Jobs Initiative $75,000 2020/2021
Project Name Cost Timing
East View Workforce Training Center
$42,000,000 2020/2021
Manufacturing Training Center $2,000,000 2021
STEM Mobile Classroom/Activities Center
$533,000 2021
Project Name Cost Timing
Tribal College on Yerington Paiute Reservation
$3,000,000 2020/2021
Project Name Cost Timing
Fallon Workforce Development Training Center
Unknown 2020/2021
Project Name Cost Timing
Improving Rural Connectivity $100,000 2020/2021
Project Name Cost Timing
Tahoe South Events Center $100,000,000 2020/2021
Tahoe Douglas Visitors’ Authority
Tahoe Prosperity Center (TPC)
Truckee Meadows Community College (TMCC)
University of Nevada, Reno (UNR)
Western Nevada College (WNC)
Western Nevada Development District (WNDD)
Project Name Cost Timing
Workforce Re-Training and Upskilling
$2,000,000 2021
Pilot High School CTE Training Program
$413,000 2021
Career Information Videos (Robotics, Advanced Manufacturing, Logistics)
$100,000 2021
Workforce Demand and Gap Analysis
$50,000 2021
Technology Apprenticeship Programs
Unknown 2020/2021
Project Name Cost Timing
Learning Labs Ecosystems $2,000,000 2021
Project Name Cost Timing
Affordable Housing Rehabilitation
$1,800,000 2021
Project Name Cost Timing
Career Bound Nevada Workforce Training
$2,500,000 2020/2021
Training Nevadans for Careers $1,000,000 2020/2021
JOIN, Inc.
Project Name Cost Timing
Feasibility Study: Business Incubator/Co-Working Space
$50,000 2021
MainStreet Gardnerville
Economic Development Authority of Western Nevada (EDAWN)
Education Innovation Collaborative (EIC)
Community Services Agency (CSA)

70 Western Nevada Development District
A P P E N D I C E S : E C O N O M I C D E V E L O P M E N T R E S O U R C E S
Nevada Department of
Training & Rehabilitation
DETR is Nevada's lead workforce
development agency. It offers workforce-
related services, job placement, and
training, services for people with disabilities,
investigation of claims of discrimination,
unemployment insurance benefits, labor
market data, and more. (detr.nv.gov)
Nevada Economic
Development Authorities
GOED recognizes local Economic
Development Authorities to market their
areas to new and expanding business and
industry. Each EDA also operates other
programs regarding economic development.
WNDD partners with the following local
EDAs:
• Churchill County Economic Development
Authority (ceda-nv.org)
• Economic Development Authority of
Western Nevada (edawn.org)
• Humboldt Development Authority
(hdanv.org)
• Northern Nevada Development Authority
(nnda.org)
• Pershing County Economic Diversification
Authority (pershingcounty.net)
Nevada Governor's Office of Economic
Development
GOED is a collaborative effort between
the Nevada Legislature and the Governor's
Office to restructure economic development
in the state. GOED promotes a robust,
diversified, and prosperous economy in
Nevada, stimulates business expansion
and retention, encourages entrepreneurial
enterprise, attracts new businesses, and
facilitates community development.
(diversifynevada.com)
NevadaWorks
Nevadaworks provides employers in
Northern Nevada with a skilled, productive
workforce that supports the economic
needs of local communities. A public-private
partnership, the organization administers
Workforce Development funds, connects
with potential employers, and interfaces with
DETR. (nevadaworks.com)
University Center for
Economic Development
UCED fosters economic development
throughout Nevada by making the extensive
resources of the University of Nevada, Reno
available to organizations, and areas that
can benefit from job and income creation
and job retention efforts. (unr.edu/business/
centers/uced)
Nevada Small Business
Development Center
The Nevada Small Business Development
Center is a statewide resource for business
assistance, providing a unique array of
services, expertise, and training in all areas,
including starting, growth, and development
of a business. The Nevada SBDC also offers
information and guidance in understanding
and complying with environmental
regulations. Also, the Nevada SBDC provides
useful data and analysis of the economy,
environment, and demographic data to help
businesses, government agencies, and other
organizations promote economic growth in
their communities. (nevadasbdc.org)
Economic Development ResourcesNumerous groups and organizations provide support, funding, and resources for economic development activities
in the WNDD region, including:

Comprehensive Economic Development Strategy 71
A P P E N D I C E S : E C O N O M I C D E V E L O P M E N T R E S O U R C E S
Nevada Division of Environmental
Protection
NDEP administers the state revolving
loan fund. These funds are used by local
governments and improvement districts
to maintain and upgrade public water and
sewer facilities. (ndep.nv.gov)
Nevada State Data Center
The SDC provides training and technical
assistance in accessing and using Census
data for the planning, decision-making,
administration, and research needs of
Nevada's state and local governments,
businesses, researchers, and others. (nsla.
nv.gov/state-data-center)
USDA Rural Development
USDA Rural Development provides
funding and technical assistance for public
infrastructure, public facilities, and business
loans. The state office is located in Carson
City, with satellite offices in Fallon and other
sites outside of the WNDD region. (rd.usda.
gov)
U.S. Small Business Administration
Created in 1953, the SBA is the only cabinet-
level federal agency entirely dedicated
to small business. It provides counseling,
capital, and contracting expertise as the
nation's go-to resource and voice for small
businesses. (sba.gov)
Rural Nevada Development Corporation
RNDC is a non-profit development
corporation that supports Nevada's
17 counties and 27 Native American
tribes. RNDC addresses critical issues
such as affordable housing and offers
down payment assistance, homeowner
rehabilitation, and small business alternative
lending practices. (rndcnv.org)
Nevada Microenterprise Initiative Program
The NMI provides business development
training and financial investments to small
business entrepreneurs. NMI is the only SBA
Intermediary Lender for the SBA Micro-
Loan Program in the State of Nevada. (ssbci.
nv.gov/About/Microenterprise)
Other regional economic
development resources include:
• Bureau of Indian Affairs (bia.gov)
• Commercial Lenders
• Downtown Reno Partnership
• Inter-Tribal Council of Nevada
(itcn.org)
• Local Area Chambers of Commerce
• Local Hospitals and Rural Health
Clinics
• Nevada Commission on Tourism
(travelnevada.com)
• Nevada Department of
Transportation (nevadadot.com)
• Nevada Department of Health and
Human Services (dhhs.nv.gov)
• University of Nevada, Reno School of
Medicine (med.unr.edu)
• U.S. Department of Housing and
Urban Development (hud.gov)
• U.S. Forest Service (fs.usda.gov)

72 Western Nevada Development District
A P P E N D I C E S : E R R C O U N C I L & T E A M S
Economic Recovery & Resiliency Council And TeamsAGRICULTURE
Kelli Kelly, Chair, Fallon Food Hub, Executive Director
Teri Bath, Western Nevada Development District, Board Member
Brandon Bishop, Nevada Dept of Agriculture, Education and Information Officer
Cortney Bloomer, Healthy Communities Coalition of Lyon and Storey Counties, Food Security Manager
Buddy Borden, University of Nevada Cooperative Extension, Associate Professor, County Educator, Clark County
Lindsay Chichester, University of Nevada Cooperative Extension, Extension Educator, County Educator, Douglas County
Jolene Cook, Reno Food Systems, Director and Marketing Manager
Clint Koble, USDA Farm Service Agency, Nevada State Office, Former State Director
Jill Moe, Desert Farming Initiative, University of Nevada, Reno, DFI Interim Director / Education Program Coordinator
Gus Wegren, USDA Farm Service Agency, Nevada State Office, Acting State Director
BUILDING AND TRADES
Aaron West, Chair, Nevada Builders Alliance, CEO
Reed Graham, Erickson Framing, Vice President
Elizabeth Gupta, Tricor Builders, Owner
Melissa Maguire, A.M. Smith Electric, Owner
Josh Munns, Nextek Construction, Founder
BUSINESS
Ann Silver, Chair, Reno + Sparks Chamber of Commerce, CEO
Sara Beebe, Churchill Economic Development Authority, Director Of Operations and Bookkeeping
Denise Castle, JOIN Inc., CEO
Valerie Clark, Clark and Associates, President and CEO
Peter Fishburn, Brown and Bigelow, Manager
Sam Haugh, The Alternative Board, Owner
Cheri Hill, Sage International, CEO
Heidi Hill Drum, Tahoe Prosperity Center, CEO
Darrell Plummer, Sierra Sage Properties, Owner
Toni Quiruz, Digiprint Corporation, Director
Tom Young, Great Basin Brewery, Owner
ECONOMIC DEVELOPMENT
Andrew Haskin, Chair, Northern Nevada Development Authority, Deputy Director
Bruce Breslow, Churchill Fallon Economic Development, Director
Amy Fleming, Economic Development Authority of Western Nevada (EDAWN), Director of Workforce Development
Lisa Granahan, Douglas County, Economic Vitality Manager
Patty Herzog, Nevada Governor’s Office of Economic Development, Director of Rural Economic and Community Development
Heidi Lusby-Angvick, Pershing County Economic Development Authority, Executive Director
Jan Morrison, Humboldt County, Economic Develoment Officer
EDUCATION AND WORKFORCE
Dana Ryan, Chair, Truckee Meadows Community College, Special Assistant to the President
Jenny Casselman, Nevada Department of Employment, Training and Rehabilitation, Assistant Director
Denise Castle, JOIN Inc., CEO
Tom Harris, University of Nevada Cooperative Extension, Professor, State Specialist
Karsten Heise, Governor’s Office of Economic Development, State Agency Representative
Mechell Merrill Nevada Department of Employment, Training & Rehabilitation, Deputy Administrator of Programs, Bureau of Vocational Rehabilitation
Cheryl Olson Nevada System of Higher Education, Project Director, Nevada Alliance for Youth Apprenticeship
Sarah Russell, Pyramid Lake High School, Principal
Craig Statucki, Nevada Department of Education, Director of Career Readiness, Adult Learning, and Education Options
Summer Stephens, Churchill County School District, Superintendent
Milt Stewart, NevadaWorks, Program Specialist
Sidney Sullivan, Truckee Meadows Community College, Career Hub Program Manager
Tammy Westergard, Nevada State Library, Administrator and Nevada State Librarian
Georgia White, Western Nevada College, Director of Professional and Applied Technology
Isla Young, Governor's Office of Workforce Innovation, Executive Director
FINANCE
Alfredo Cedeno, Chair, U.S. Small Business Administration, Outreach and Marketing Specialist
Chandler Allen, USDA Rural Development, Business and Cooperative Programs Director
Jake Carrico, Nevada Small Business Development Center, Business Development Advisor
Kathy Halbardier, Nevada Small Business Development Center, Rural Business Advisor
Stephanie Hanna, Synergy Home Mortgage, Senior Mortgage Specialist
Lynda Hascheff, Opportunity Alliance of Nevada, Executive Director
Mike Hix, Meadows Bank, Regional President
Aric Jensen, City of Reno, Revitalization and Grants Manager
Mary Kerner, Rural Nevada Development Corporation, CEO
GOVERNMENT
Dian Vanderwell, Chair, City of Sparks, City Councilwoman
Debbie Balsinger, Office of Rep. Mark Amodei, Constituent Service Representative
Suz Coyote, Nevada Division of Emergency Management, Grants and Projects Analyst
Brad Crowell Nevada Department of Conservation and Natural Resources, Director
Cassandra Darrough, Pyramid Lake Paiute Tribe/NUMU, Tribal Coordinator, Nevada Division of Emergency Management
Kurt Englehart, Office of Sen. Catherine Cortez Masto, Regional Coordinator - Rurals
Nate Helton Office of Sen. Jacky Rosen, Regional Coordinator - Rurals

Comprehensive Economic Development Strategy 73
A P P E N D I C E S : E R R C O U N C I L & T E A M S
Daphne Hooper, City of Fernley, City Manager
Stacy Parobek, Office of Rep. Mark Amodei, District Director
Jon Raby, Bureau of Land Management, Nevada State Director
Colin Robertson, Nevada Division of Outdoor Recreation, Administrator
Tim Shannon, Bureau of Land Management, Senior Advisor/Chief of Staff
Jon Stansfield, U.S. Forest Service, Deputy Forest Supervisor, Humboldt-Toiyabe National Forest
HEALTH AND WELLNESS
Kitty McKay, Chair, Carson Tahoe Health, Director, Patience Experience
Jessica Flood, Nevada Rural Hospital Partners, Northern Regional Behavioral Health Coordinator
Toni Inserra, South Lyon Medical Center, Administrator
Erica Mirich, Truckee Meadows Tomorrow, Executive Director
Jim Peckham, Friends in Service Helping (FISH), Executive Director
Annie Zucker, Renown Health, Manager of Community Impact
HOUSING
Ron Bath, Chair, Salmon Point Development, Founder
Leslie Colbrese, Community Services Agency, CEO
Katie Coleman, Nevada Rural Housing, Dir of Communications
Gordon Gossage, Regenesis Reno, Founder/CEO
John Krmpotic, KLS Planning and Design, President
Jacob LaRow, Nevada Housing Division, Deputy Administrator
Ray Pezonella, Pezonella Associates, Inc., President, P.E.
Stacey Sept, Nevada Rural Housing, Dir of Community Development
Mae Worthey-Thomas, Nevada Housing Division, Affordable Housing Advocate
MANUFACTURING
Karsten Heise, Chair, Governor’s Office of Economic Development, Director of Strategic Programs
Louis Berry, Panasonic Energy of North America, Director of Production Training and Industrial Engineering
Ryan Costella, Click Bond Inc., Director of Strategic Initiatives
Dave Donegan, H&T Rechargeable Battery Components, Engineering Manager
Rhea Gustafson, Nevada Industry Excellence, Project Manager
Emily Howarth, Western Nevada College, Professor of Computer Information Technology
Sven Klatt, Vineburg Machining Inc., GM/Product Development and Design
James Merati, Tesla, Production Engineering/Equipment Maintenance Associate Manager
Gerd Poppinga, Vineburg Machining Inc., CEO President
Randy Walden, Truckee Meadows Community College, Advanced Manufacturing and Robotics Instructor
MINING
Joe Riney, Chair, Nevada Mining Association, Director of Workforce Engagement
Alora Bartosz, Ormat Technologies Inc., Business Development Analyst
Doug Brown, Quality Control Manager, Granite Construction
Annie Huhta, Mackay School of Earth Sciences & Engineering, College of Science, University of Nevada, Reno, Director
Scott Nichols, Permitting and Lands Management, Ormat Technologies Inc
Zach Spencer, Comstock Mining, Director of External Relations
Paul Thomsen, Ormat Technologies Inc., Vice President of Business Development
Mike Visher, Nevada Division of Minerals, Administrator
SEWER, WATER, TRANSPORTATION, ENERGY
Cheryl Couch, Chair, United States Department of Agriculture, Nevada Community Programs Director
Lee Bonner, Nevada Department of Transportation, State Railroad Coordinator
Paul Enos, Nevada Trucking Association, CEO
Lucia Maloney, Carson City, Transportation Manager
Jojo Myers, Nevada Governor's Office of Science, Innovation & Technology, State Broadband Development Manager
Mylinh Nguyen, Nevada Department of Transportation, Chief Environmental Engineer
Jennifer Rose, Reno Tahoe Airport Authority, Board of Trustees Member, CEO of It's My Community Store
Jeff Sutich, NV Energy, Economic Development
Jennifer Taylor, Governor's Office of Energy, DEP Director, Intergovernment Relations
TECHNOLOGY
Vas Kamyshanov, Chair, Balanced Agency, CEO
Debashis Bagchi Air Wire Technology, President and CEO
JR Cox, Ground Rounds, Director of Talent Acquisition
Gordon Dodson, Terra Scale, Chief Project Integration Officer
Phil Eggen, Terra Scale, Co-Founder and Chief Technology Officer
Zak Gulling, Monarch Casino and Resort, Inc., CIO
Sena Lloyd, Blockchains, LLC, Director of Research and Workforce Development
Elizabeth Redmond, CoWorkr, CEO & Co-Founder
Brian Wilcox, CyberPros360, Founder
Kris Zierolf, Renown Health, Director of IT Applications
TOURISM, HOSPITALITY ARTS AND CULTURE
Carol Chaplin, Chair, Lake Tahoe Visitors Authority, CEO
Stephen Ascuaga, Peppermill Resort Casino, Corporate Director of Business Development
Terri Bath, Salmon Point Development, Principal
Jennifer Cunningham, Reno-Sparks Convention and Visitors Authority, Former Executive Vice President
Jess Horning, Liquid Blue Events, Founder/Partner
Amy Oppio, Nevada Museum of Art, Deputy Director
Carl Ribaudo, SMG Consulting, President/Chief Strategist
Brenda Scolari, Nevada Commission on Tourism, Director

74 Western Nevada Development District
A P P E N D I C E S : E C O N O M I C R E C O V E R Y & R E S I L I E N C Y A C T I O N P L A N
Economic Recovery & Resiliency Committee Data
GOAL 1.1
Encourage Entrepreneurship, Innovation, and Small BusinessesSupporting innovation, small businesses, and entrepreneurs by creating an environment where they can survive and thrive is vital to the
region’s economic recovery and resiliency.
Target Area 1: Economic ResiliencyThe region can withstand, prevent, and quickly recover from shocks to its underlying economic base, such as the COVID-19 pandemic, by engaging in activities, programs, and steady-state and responsive initiatives.
1.1 Strategies 1.1 Actions
Strategy A: Develop economic recovery and resiliency support services and tools for small businesses and entrepreneurs.
A.1. Coordinate with existing networks and organizations to identify specific needs of businesses to prepare for continuity operations when responding to economic shocks and emergency planning.
A.2: Develop and disseminate training programs for small businesses to help them prepare for future economic shocks.
A.3: Establish business recovery centers that can provide flexible resources and services that can expand and contract in response to economic shocks.
A.3: Establish business recovery centers that can provide flexible resources and services that can expand and contract in response to economic shocks.
Strategy B: Continue to promote the region as a place where small businesses, entrepreneurs, and high-tech companies can start, build and grow.
B.1: Work with member agencies and stakeholders to develop and enhance strategies that promote the region’s benefits.
B.2: Develop training and development opportunities to help small businesses prepare for the innovative technology shifts resulting from the ongoing automation of traditional manufacturing and industrial practices using modern innovative technology, also known as Industry 4.0.
B.3: Create and target training and educational tools to generate awareness and understanding regarding the benefits of diversity in business.
B.4: Increase funding for technology-based entrepreneurship and provide targeted support for technology-based firms in automation and digital technologies.
Strategy C: Stimulate an innovative entrepreneur ecosystem throughout the region.
C.1: Support and advance the continued development and expansion of co-working, incubator, and innovation centers throughout the region.
C.2: Increase and diversify access to capital to boost innovation and entrepreneurship.
C.3: Support, participate with and engage in activities and programs that recruit, expand, and retain the entrepreneurial community in the region.
C.4: Focus on supporting the digital arts and outdoor recreation.
C.5: Promote international trade and export assistance programs to increase the number of exporters, new market exports, and global supply penetration, especially among rural and women, veteran, and minority-owned micro, small and medium enterprises (MSMEs).
Strategy D: Research and determine strategies that establish a more reliable and resilient supply chain supporting suppliers, manufacturers, distributors, and businesses.
D.1: Develop a supply chain study and determine actions to address disruption issues and unanticipated supply shocks.
D.2: Engage strategies to onshore manufacturing, reduce disruptions and increase resilience.
D.3: Create a more robust regional supply chain to reduce importation of goods and services, and strengthen MSMEs’ buying power.

Comprehensive Economic Development Strategy 75
A P P E N D I C E S : E C O N O M I C R E C O V E R Y & R E S I L I E N C Y A C T I O N P L A N
GOAL 1.2
Engage In Strategic Economic DevelopmentAdvancing growth and expansion for industries critical to the region’s economic ecosystem and its prosperity.
1.2 Strategies 1.2 Actions
Strategy A: Support the advanced manufacturing sector and engage in activities that promote expansion to improve the region’s competitiveness.
A.1: Support new and existing manufacturers by providing information regarding resources available to assist them in their business efforts, such as incubation, technology, and capital.
A.2: Identify the region’s manufacturing capabilities and align them with demand for those products within the supply chains of manufacturers and other sectors within the region.
A.3: Create a map of locations within the region that have infrastructure necessary for manufacturing growth including water, sewer, energy, transit, and broadband.
Strategy B: Advance activities that support and promote economic revitalization.
B.1: Support Main Street and Downtown improvements to promote economic revitalization.
B.2: Identify and redevelop Brownfields sites to return them to productive economic use.
B.3: Work with rural communities and businesses to design and implement marketing plans to promote their communities as business-ready locations.
Strategy C: Reposition northwestern Nevada as a gateway for a variety of traveler experiences and extended visitation throughout the WNDD region.
C.1: Work with the hospitality industry to assess tourists on destination interest, including interface with other localities to extend to a regional destination.
C.2: Support the development of a risk and resiliency assessment for the tourism/hospitality industry.
C.3: Identify actions to engage in response to tourist survey and risk/resiliency assessment, capitalizing on current destinations and possible future destinations.
C.4: Establish a community-based arts and culture endowment with targeted relief funds to be applied to support the arts workforce.
C.5: Foster career growth and training in the travel/tourism and hospitality sector that addresses the new ways people are traveling and with full adoption of cutting-edge technology.
Strategy D: Promote and support agriculture as a robust, resilient, and sustainable economic practice.
D.1: Advance the expansion of food production to address food insecurity by supporting activities that enable increased funding to organizations such as the Nevada Department of Agriculture (NDA).
D.2: Working with agricultural partners, explore opportunities to utilize unused public buildings such as schools for storage facilities.
D.3: Promote mobile processing facilities that take advantage of value-added for the agricultural industry.
D.4: Market the opportunities and benefits of urban farms and vertical growing systems.
D.5: Encourage the development of a seed production and banking program.
D.6: Support the creation of an agricultural blockchain program for the agricultural producers to create a more resilient supply chain.
D.7: Promote and support existing and the increase of local farmers’ markets.
Strategy E: Promote and support economic vitality and resiliency, aligning activities with the Nevada Governor’s Office of Economic Development (GOED) and regional development authorities for seamless and robust results.
E.1: Present training regarding the State of Nevada’s existing policies and procedures that provide incentives and tax abatements that attract new businesses and retain and support existing and emerging companies.
E.2: Create a regional business and industry asset map and update it on an annual basis to guide economic development to focus on the types of activity and industry needed.

76 Western Nevada Development District
A P P E N D I C E S : E C O N O M I C R E C O V E R Y & R E S I L I E N C Y A C T I O N P L A N
GOAL 1.3
Foster Financial Wellbeing and ResilienceThe region’s economic vitality is supported by the expansion, development, and implementation of programs that support financial
wellbeing, security, and resilience.
1.3 Strategies 1.3 Actions
Strategy A: Equitably expand economic prosperity through the development and promotion of services that result in a stable and future ready financial foundation for individuals, families and business.
A.1: Assess and determine services, programs, and training needed to advance financial stability and resiliency.
A.2: Research and inventory existing programs that can be built upon and promoted to provide these services and programs.
A.3: Working with financial partners to determine, develop and provide training and tools that support planning for financial security.
A.4: Create awareness of activities that facilitate the development of financial resiliency.
Strategy B: Engage and bolster the local investor environment and the resulting access to capital.
B.1: Strengthen the banking relationship with businesses and entrepreneurs with various programs such as loan clinics.
B.2: Advocate for the continued development of public alternative lending sources within the region through assisting qualified, eligible entities in accessing programs such as U.S. Small Business Administration (SBA), U.S. Department of Agriculture (USDA), U.S. Department of Housing and Urban Development (HUD), Community Development Block Grant (CDBG) Program, and U.S. Economic Development Administration (EDA), that will capitalize alternative lending projects.
B.3: Increase the growth and availability of funding for start-up, early stage and next-stage companies in the region.
B.4: Develop a financial pipeline of information and services that provide resources for business funding and capital opportunities.
B.5: Continue to operate and adequately capitalize the WNDD Revolving Loan Fund

Comprehensive Economic Development Strategy 77
A P P E N D I C E S : E C O N O M I C R E C O V E R Y & R E S I L I E N C Y A C T I O N P L A N
GOAL 2.1
Improve Sewer, Water, Transportation, Energy SystemsIncrease improvements in sewer, water, transportation, and energy systems that are innovative, sustainable, efficient, and integrated to
support and promote a more business-ready region.
Target Area 2: InfrastructureThe region’s planned, modern, and resilient infrastructure includes widespread broadband access to connect its urban and rural areas while supporting an increasingly mobile and remote workforce.
2.1 Strategies 2.1 Actions
Strategy A: Facilitate infrastructure planning towards a more efficient, coordinated, and connected infrastructure, promoting resiliency throughout the region.
A.1: Coordinate a regional infrastructure plan, including inventories of current and proposed projects and details regarding mapping, costs, and timelines to fund.
A.2: Coordinate economic development efforts with regional current and proposed infrastructure projects.
A.3: Advocate for ongoing and expansion of the reuse of wastewater for agriculture and economic development.
A.4: Promote expansion of renewable energy development, including solar, geothermal, and wind farms, including recruitment, retention, and expansion of green energy companies.
A.5: Collaborate with partners to improve public transportation between rural and urban communities and in urban communities to bolster mobility.
A.6: Explore and determine the feasibility of a broader regional transportation planning agency.
A.7: Promote the increase of air travel through the Reno-Tahoe International Airport.
A.8: Promote the reintroduction of state and federal subsidies for rural air travel.
A.9: Work with agricultural partners to create on-farm cold storage facilities to improve the supply chain and increase food security.
Strategy B: Work with WNDD members and stakeholders to secure funding for improved infrastructure to attract new business and meet the growth of existing businesses.
B.1: Develop, maintain, and promote a data resource for the WNDD region and its agencies that includes information on all known funding organizations such as the private sector, private foundations, and state and federal opportunities.
B.2: Continue to work with member agencies to develop CEDS projects for the annual CEDS update and rewrite. Create awareness and understanding of the prioritization process and how to become grant-ready.
B.3: Provide training through webinars and workshops for WNDD membership regarding funding resources, grant application processes, and strategies to improve competitiveness toward the award of funding projects.
B.4: Assist board members and their agencies with research, technical assistance, application, and management of grants for infrastructure projects.
B.5: Support robust funding of the State Infrastructure Bank and distribute information to WNDD members regarding the bank and process to access funds.
B.6: Support the State Grant Matching Program to be funded to provide matching funds towards infrastructure-related grant applications.

78 Western Nevada Development District
A P P E N D I C E S : E C O N O M I C R E C O V E R Y & R E S I L I E N C Y A C T I O N P L A N
GOAL 2.2
Advance Technology and ConnectivityPlan for and support technologies that advance innovation and promote economic development.
2.2 Strategies 2.2 Actions
Strategy A: Ensure reliable, affordable, high-speed and secure Internet access throughout the region.
A.1: Establish a WNDD Broadband Study Project comprised of a stakeholder team for the purpose of defining the connectivity issues, including defining and the mapping of broadband coverage with the purpose of how best to address gaps with a focus on economically distressed and underserved populations.
A.2: Develop a regional broadband and connectivity master plan.
A.3: Advocate for innovative options for connectivity tools, such as satellite, fiber, and wireless networks and the use of mobile hotspot loan programs.
A.4: Promote broadband infrastructure tax incentives for the private sector, service providers, and developers to encourage the expansion of broadband and connectivity.
A.5: Create and leverage public and private partnerships, establish cooperatives and work with all wireline providers in the region to improve access to high-speed internet.
A.6: Working with public and private sector, Identify funding to develop, improve or establish connectivity throughout the region, with an emphasis on the rural communities.
A.7: Promote cybersecurity with networks that support Cyber Security Model Certification at a Level 3 certification.
A.8: Increase awareness and understanding regarding cybersecurity and risk management strategies through training and other educational outreach.
A.9: Support equitable access to the internet, devices, and technical assistance to underserved populations.
A.10: Continue to promote and utilize the potential of the Nevada System of Higher Education (NSHE) and regional library system to provide connectivity for the region.
Strategy B: Support and promote technology and innovation throughout every sector of the economy.
B.1: Encourage the investment in digital infrastructure for business and industry to ramp up the adoption of new technologies and grow the economy.
B.2: Pursue opportunities to work with member agencies and the private sector to foster the expansion of technology systems that support greater effectiveness and efficiencies in delivery of services and program.
B.3: Encourage dedicated networks for health care, education, workforce, and community and social services.
B.4: Support the inclusion of innovative technology and connectivity as a standard for new construction and remodel projects.
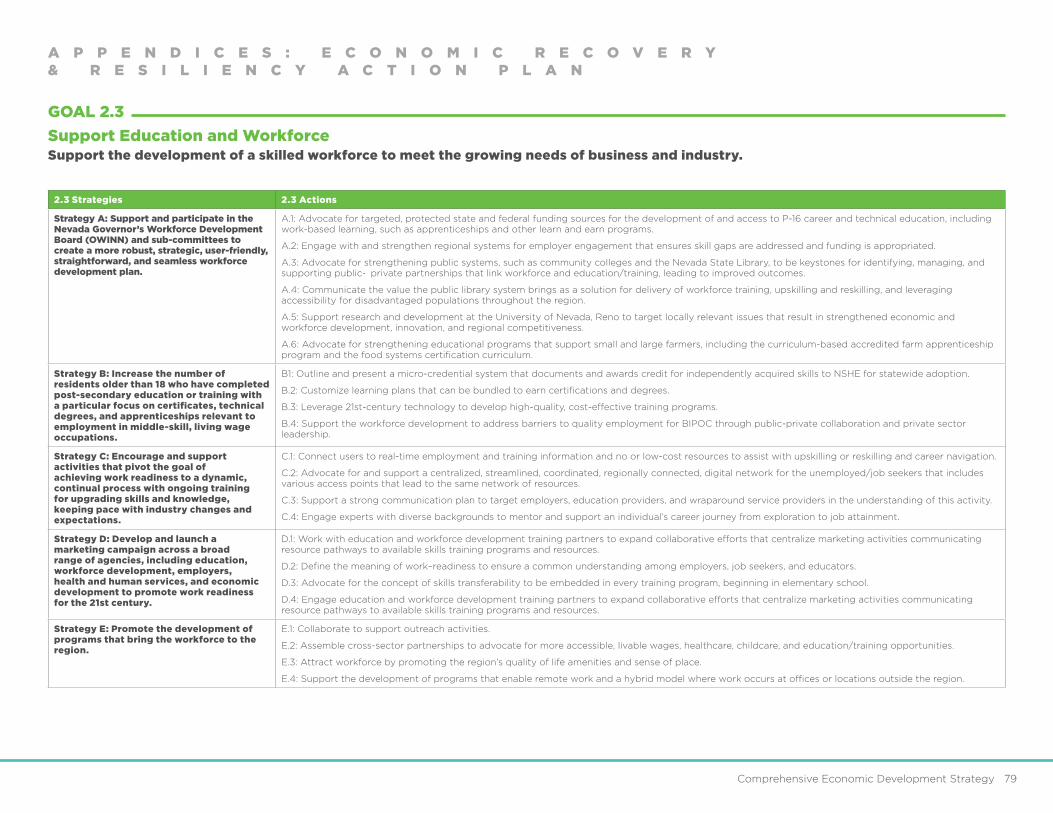
Comprehensive Economic Development Strategy 79
A P P E N D I C E S : E C O N O M I C R E C O V E R Y & R E S I L I E N C Y A C T I O N P L A N
GOAL 2.3
Support Education and WorkforceSupport the development of a skilled workforce to meet the growing needs of business and industry.
2.3 Strategies 2.3 Actions
Strategy A: Support and participate in the Nevada Governor’s Workforce Development Board (OWINN) and sub-committees to create a more robust, strategic, user-friendly, straightforward, and seamless workforce development plan.
A.1: Advocate for targeted, protected state and federal funding sources for the development of and access to P-16 career and technical education, including work-based learning, such as apprenticeships and other learn and earn programs.
A.2: Engage with and strengthen regional systems for employer engagement that ensures skill gaps are addressed and funding is appropriated.
A.3: Advocate for strengthening public systems, such as community colleges and the Nevada State Library, to be keystones for identifying, managing, and supporting public-¬private partnerships that link workforce and education/training, leading to improved outcomes.
A.4: Communicate the value the public library system brings as a solution for delivery of workforce training, upskilling and reskilling, and leveraging accessibility for disadvantaged populations throughout the region.
A.5: Support research and development at the University of Nevada, Reno to target locally relevant issues that result in strengthened economic and workforce development, innovation, and regional competitiveness.
A.6: Advocate for strengthening educational programs that support small and large farmers, including the curriculum-based accredited farm apprenticeship program and the food systems certification curriculum.
Strategy B: Increase the number of residents older than 18 who have completed post-secondary education or training with a particular focus on certificates, technical degrees, and apprenticeships relevant to employment in middle-skill, living wage occupations.
B1: Outline and present a micro-credential system that documents and awards credit for independently acquired skills to NSHE for statewide adoption.
B.2: Customize learning plans that can be bundled to earn certifications and degrees.
B.3: Leverage 21st-century technology to develop high-quality, cost-effective training programs.
B.4: Support the workforce development to address barriers to quality employment for BIPOC through public-private collaboration and private sector leadership.
Strategy C: Encourage and support activities that pivot the goal of achieving work readiness to a dynamic, continual process with ongoing training for upgrading skills and knowledge, keeping pace with industry changes and expectations.
C.1: Connect users to real-time employment and training information and no or low-cost resources to assist with upskilling or reskilling and career navigation.
C.2: Advocate for and support a centralized, streamlined, coordinated, regionally connected, digital network for the unemployed/job seekers that includes various access points that lead to the same network of resources.
C.3: Support a strong communication plan to target employers, education providers, and wraparound service providers in the understanding of this activity.
C.4: Engage experts with diverse backgrounds to mentor and support an individual’s career journey from exploration to job attainment.
Strategy D: Develop and launch a marketing campaign across a broad range of agencies, including education, workforce development, employers, health and human services, and economic development to promote work readiness for the 21st century.
D.1: Work with education and workforce development training partners to expand collaborative efforts that centralize marketing activities communicating resource pathways to available skills training programs and resources.
D.2: Define the meaning of work–readiness to ensure a common understanding among employers, job seekers, and educators.
D.3: Advocate for the concept of skills transferability to be embedded in every training program, beginning in elementary school.
D.4: Engage education and workforce development training partners to expand collaborative efforts that centralize marketing activities communicating resource pathways to available skills training programs and resources.
Strategy E: Promote the development of programs that bring the workforce to the region.
E.1: Collaborate to support outreach activities.
E.2: Assemble cross-sector partnerships to advocate for more accessible, livable wages, healthcare, childcare, and education/training opportunities.
E.3: Attract workforce by promoting the region’s quality of life amenities and sense of place.
E.4: Support the development of programs that enable remote work and a hybrid model where work occurs at offices or locations outside the region.

80 Western Nevada Development District
A P P E N D I C E S : E C O N O M I C R E C O V E R Y & R E S I L I E N C Y A C T I O N P L A N
GOAL 3.1
Nurture Health and Wellness ResourcesSupport health and wellness programs and activities that are critical toward building resilience against future health shocks and the economy.
Target Area 3: Quality Of LifeThe region offers more diverse housing opportunities to fit the needs of many populations, accessible health and wellness services and amenities, and opportunities for leisure pursuits that enhance a sense of place and community.
3.1 Strategies 3.1 Actions
Strategy A: Ensure economic well-being through the support of affordable and accessible health care with an emphasis underserved populations and rural communities.
A.1: Promote expansion and increased access to high-quality, affordable health care.
A.2: Encourage the expansion of mobile health centers.
A.3: Support the development of a centralized 24/7 portal that provides a one-stop source of access to health, wellness, and community support resources and services.
A.4: Support development, implementation, and access to health data and monitoring systems and devices for individuals and health professionals.
A.5: Promote enterprises that inspire a lifestyle of wellness.
A.6: Advocate for improved environments and systems within public spaces that fight the spread of disease including HVAC systems, touchless technology and ultraviolet light.
A.7: Encourage employers to promote and support employee health and wellness through improved working conditions as well as healthcare plans and programs.
Strategy B: Foster the creation of an overarching body of multi-disciplinary public health professionals to champion a more holistic, cohesive, and seamless integration of public health systems, funding, and access.
B.1: Promote programs and systems that increase the number of health and wellness professionals, including removing barriers that restrict professionals from working in the region.
B.2: Invest in telemedicine programs, personnel, and technology to improve access to and complement existing health care services and support business development.
B.3: Advocate the continuation, development, and support for broader telehealth coverage policies.
B.4: Develop Emotional First Aid, Peer Support, and Community Neighborhood Mental Health First Aid Training Programs.

Comprehensive Economic Development Strategy 81
A P P E N D I C E S : E C O N O M I C R E C O V E R Y & R E S I L I E N C Y A C T I O N P L A N
GOAL 3.2
Build Housing CapacitySupport and promote activities and organizations committed to creating diverse, affordable, and available housing options in the region to
attract and retain workforce while stimulating the economy.
GOAL 3.3
Cultivate Arts, Culture, and RecreationPromote arts, culture, and recreation activities and amenities as essential elements to qualify of life and support the recruitment of business,
industry, and workforce in these areas.
3.2 Strategies 3.2 Actions
Strategy A: Encourage new, existing, and creative development that expands housing types to serve the region.
A.1: Support innovation, technology, and alternative housing options such as re-purposing properties into multi-family properties, high-quality mobile home parks, manufactured housing, container housing, and 3-D (Extrusion Based Technology) printed housing.
A.2: Recommend to employers, those that are expanding as well as relocating, to participate in solutions for housing workforce with programs that provide subsidies, and tax incentives.
A.3: Advance smart growth approaches that support construction using green building techniques and materials.
A.4: Support the preservation of current and future viability of affordable housing rentals.
A.5: Promote public investment in public infrastructure to support increased housing development.
Strategy B: Work with regional partners and stakeholders to identify barriers to housing development and determine best practices, including improved cross coordination amongst municipalities, to mitigate those hindrances.
B.1: Explore zoning and building codes, development requirements, and fees to determine and recommend opportunities for more expedited processes to increase multi-family and multi-use affordable housing and accessory dwelling units.
B.2: Work with member agencies to advocate for federally-owned land to be sold and developed to help the region with growth and access to land for housing.
Strategy C: Evaluate opportunities for resources to fund affordable housing, including those available via government, nonprofits, and financial institutions.
C.1: Promote state, federal, and local programs and resources that support affordable housing funding.
C.2: Establish public-private partnerships specific for the purchase or donation of land and equity funding.
3.3 Strategies 3.3 Actions
Strategy A: Enhance and capitalize on the region’s existing quality of life amenities to recruit and retain talent in the region.
A.1: Recommend projects and activities that support an interconnected system of parks, trails, and open spaces throughout the region and its communities.
A.2: Promote tourism and recreational amenities on a regional basis including plans and development as well as activities that reflect the historic, cultural, and natural resources.
A.3: Encourage partners and stakeholders to support lifelong learning opportunities that increase social connections, health and wellness, and social responsibility resulting in greater resiliency.
A.4: Working with WNDD Board, identify opportunities to promote cultural and arts events occurring throughout the region.
A.5: Focus on digital arts and outdoor recreation opportunities that build the region’s quality of life.
Strategy B: Support the region’s communities as they develop and grow a greater sense of place.
B.1: Implement arts and culture-based placemaking to improve downtowns and public spaces.
B.2: Identify each county and city’s unique assets and strengths as part of the placemaking process.
B.3: Develop strategies and programs that initiate the placemaking process and promote a greater sense of place.
B.4: Working with partners, promote and advance activities that create a sustainable and just food system that enhances equitable access to affordable, local, and healthy food.
B.5: Encourage funding to local food pantries to continue buying locally.

82 Western Nevada Development District
A P P E N D I C E S : E C O N O M I C R E C O V E R Y & R E S I L I E N C Y A C T I O N P L A N
GOAL 4.1
Grow Partnerships and CollaborationExpand the region’s capacity to catalyze economic vitality through partnerships and collaboration.
Target Area 4: Government and Organizational CapacityThe region’s government and stakeholder organizations seamlessly coordinate to institute innovative solutions that are streamlined, technologically advanced, and better positioned to grow a sustainable and resilient economy.
4.1 Strategies 4.1 Actions
Strategy A: Strengthen centralized, clear and consistent communication networks for communities and stakeholders when accessing government services and information, utilizing cutting edge technology creating greater efficiency, effectiveness and increased customer service for the public.
A.1: Develop a community-facing resource map that delineates organizational services and clientele, the connective relationships between entities, and identifies access points that will be used by service entities for referral, reduction of duplicative services, and identification of gaps.
A.2: Utilizing technology, foster and support a 24/7 centralized resource of information and resources for small business and entrepreneur resources.
A.3: Encourage the development of an informational clearinghouse that would include production fact sheets for small to medium farmers.
Strategy B: Work with member agencies to align and strengthen policies, procedures, and operations that advance economic development, including recovery and resiliency strategies.
B.1: Assess and identify policies, codes, and practices considered to be barriers to economic development and resiliency.
B.2: Collaborate to maximize economic development by engaging revised policies, procedures, and operations that eliminate or reduce barriers.
B.3: Increase economic recovery and resiliency by establishing an Economic Emergency Response Team or Program that includes intergovernmental and agency coordination that will expand and contract programs and services in response to any economic shock.
Strategy C: Expand economic development capacity with increased partnerships and enhanced resources that support and oversee the implementation of strategies that build community and regional resilience.
C.1: Encourage investments that use public and private sector resources and leverage complementary investments by other government, public entities, and nonprofits.
C.2: Promote the partnering of member governments of like-interested projects maximizing resources.
C.3: Increase outreach in each county to promote partnering and connect membership.
C.4: Advocate for increased funding to the Nevada Department of Agriculture (NDA) to maximize responsiveness and improve effectiveness in the state-managed agricultural marketing program.
C.5: Recommend to U.S. Department of Agriculture (USDA) and Nevada Department of Agriculture (NDA) to increase collaboration for the betterment of Nevada producers.
C.6: Advocate for local government-sponsored food security councils to address food desert issues, emphasizing rural communities.
C.7: Recommend re-establishment of State Maintained Organic Certification Program.
C.8: Support actions that will boost the potential of the region as a significant transportation and distribution center.

Comprehensive Economic Development Strategy 83
A P P E N D I C E S : E C O N O M I C R E C O V E R Y & R E S I L I E N C Y A C T I O N P L A N
GOAL 4.2
Integrate a Regional Perspective in PlanningProvide for regional planning towards economic development goals that support recovery and plan for resiliency.
GOAL 4.3
Support Sustainability EffortsAdvance U.S. Economic Development Administration (EDA) ’s Investment Priority by promoting economic development planning and
implementation projects that address the climate crisis, including green products, processes (including green infrastructure), places, and
buildings to support economic and environmental resilience.
4.2 Strategies 4.2 Actions
Strategy A: Foster achievement of the Comprehensive Economic Development Strategy (CEDS) and Economic Recovery and Resiliency (ERR) Plan.
A.1: Engage ongoing activities that develop greater regional collaboration on goals and actions related to the CEDS and the ERR Plan.
A.2: Facilitate the identification and prioritization of investment projects that benefit the region.
A.3: Promote WNDD and its memberships’ economic development achievements resulting from regional planning efforts.
A.4: Promote regional collaboration for more robust networks, including market connections between rural and urban areas.
A.5: Support regional partners in sharing resources to increase coordination functions and expand capacity to complete projects.
A.6: Provide up-to-date demographic and economic data for member agencies on the WNDD website.
A.7: Provide ongoing training and informational events on key economic trends, issues, and best practices.
A.8: Continue outreach activities that provide information on economic development, funding opportunities, and critical indicators regarding the region’s economy.
Strategy B: Build partnerships to support the engagement of the CEDS, the ERR Plan, and the plan’s respective goals, strategies, actions, and projects.
B.1: Work with WNDD members and key stakeholders to establish Action Teams focused on implementing the CEDS, ERR Plan, and projects.
B.2: Develop an annual work plan that implements strategies and actions of the CEDS and ERR Plan.
B.3: Increase outreach to the business, educational, and key stakeholder communities and agencies to promote partnering and collaboration to realize key economic development strategies and projects successfully.
B.3: Continue to coordinate with the University of Nevada, Reno Center for Economic Development, and University of Nevada, Reno Cooperative Extension to support and advance economic development programs and projects.
4.3 Strategies 4.3 Actions
Strategy A: Support sustainable investments that promote job creation and protect natural resources, and the environment.
A.1: Encourage member agencies and stakeholders to develop projects that support a transition to a green economy, including green products, processes, and buildings.
A.2: Pursue opportunities through the Environmental Protection Agency and other sources for brownfield assessment, clean-up, and redevelopment funding.
Strategy B: Engage in communication and training opportunities that promote services, programs, and the benefits of a sustainable and green environment.
B.1: Provide training and information regarding climate events and economic shocks resulting from those events to plan for and create economic recovery, resiliency, and sustainability.
B.2: Leverage all WNDD outlets to provide resources and information on best practices in planning for sustainability and the benefits associated with economic development.

84 Western Nevada Development District
A P P E N D I C E S : C E D S D A T A
1970 Population 1980 Population 1990 Population 2000 Population 2010 Population 2019 Population 1970 - 2019 Population Change
WNDD Region 170,722 279,185 372,030 496,996 590,644 650,642 479,920
Washoe County 121,068 193,623 254,667 339,486 412,844 471,519 350,451
Carson City 15,468 32,022 40,443 52,457 55,375 54,773 39,305
Churchill County 10,513 13,917 17,938 23,982 24,946 24,259 13,746
Douglas County 6,882 19,421 27,637 41,259 47,042 48,132 41,250
Humboldt County 6,375 9,434 12,844 16,106 16,528 16,828 10,453
Mineral County 7,051 6,217 6,475 5,071 4,812 4,460 -2,591
Pershing County 2,670 3,048 4,336 6,693 6,703 6,615 3,945
Storey County 695 1,503 2,526 3,399 4,016 3,988 3,293
Washoe County 121,068 193,623 254,667 339,486 412,844 471,519 350,451
Fallon 2,959 4,262 6,430 7,536 8,560 8430 5,471
Fernley 5,164 8,543 18,378 20068 20,068
Lovelock 1,680 3,232 4,781 2,139 1959 279
Reno 72,863 100,756 133,850 180,480 220,996 246500 173,637
Sparks 24,187 40,780 53,367 66,346 87,301 100589 76,402
Winnemucca 3,587 4,140 6,416 7,169 7,396 7,762 4,175
2019 Population
2039 Population
Predicted Change
Predicted % Change
WNDD Region 630,574 694,731 64,157 10.2%
Carson City 54,773 62,202 7,429 13.6%
Churchill County 24,259 27,244 2,985 12.3%
Douglas County 48,132 45,520 -2,612 -5.4%
Humboldt County 16,828 18,082 1,254 7.5%
Mineral County 4,460 5,021 561 12.6%
Pershing County 6,615 6,373 -242 -3.7%
Storey County 3,988 4,776 788 19.8%
Washoe County 471,519 525,513 53,994 11.5%
Jurisdiction 2039 Population (Low International Migration)
2039 Population (COVID-19 Best Case)
Average of Both 2039 Forecasts
Predicted % Change
WNDD Region 703,094 686,363 694,729 10.2%
Carson City 62,878 61,526 62,202 7.5%
Churchill County 27,583 26,904 27,244 12.6%
Douglas County 45,787 45,252 45,520 -3.7%
Humboldt County 18,228 17,936 18,082 19.8%
Mineral County 5,105 4,936 5,021 11.5%
Pershing County 6,403 6,342 6,373 4,781
Storey County 4,808 4,744 4,776 180,480
Washoe County 532,302 518,723 525,513 66,346
Winnemucca 3,587 4,140 6,416 7,169
Sources: U.S. Census Bureau, 1970, 1980, 2010, 2019
Sources: U.S. Census Bureau, American Community Survey, 2019; Nevada Department of Taxation, 2019
Source: Nevada Department of Taxation, 2019
Population: Growth
Population: Growth Projections Population: Growth Projections Variances
Appendices: WNDD CEDS Data
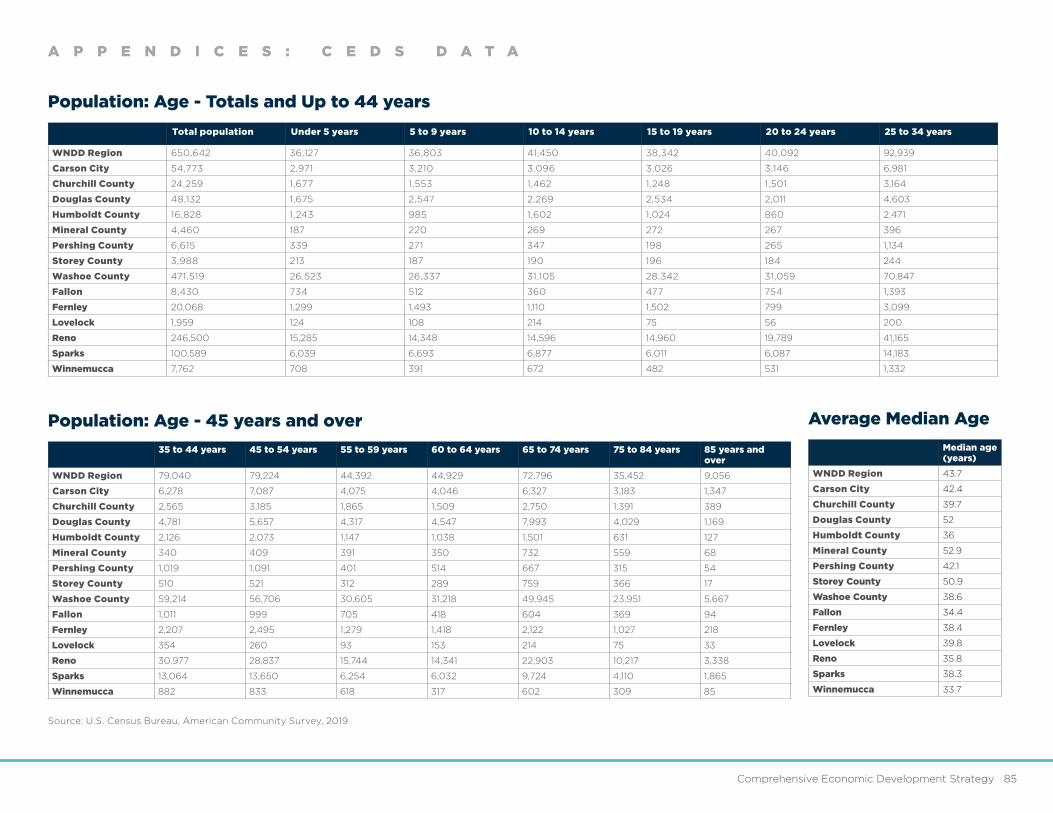
Comprehensive Economic Development Strategy 85
Total population Under 5 years 5 to 9 years 10 to 14 years 15 to 19 years 20 to 24 years 25 to 34 years
WNDD Region 650,642 36,127 36,803 41,450 38,342 40,092 92,939
Carson City 54,773 2,971 3,210 3,096 3,026 3,146 6,981
Churchill County 24,259 1,677 1,553 1,462 1,248 1,501 3,164
Douglas County 48,132 1,675 2,547 2,269 2,534 2,011 4,603
Humboldt County 16,828 1,243 985 1,602 1,024 860 2,471
Mineral County 4,460 187 220 269 272 267 396
Pershing County 6,615 339 271 347 198 265 1,134
Storey County 3,988 213 187 190 196 184 244
Washoe County 471,519 26,523 26,337 31,105 28,342 31,059 70,847
Fallon 8,430 734 512 360 477 754 1,393
Fernley 20,068 1,299 1,493 1,110 1,502 799 3,099
Lovelock 1,959 124 108 214 75 56 200
Reno 246,500 15,285 14,348 14,596 14,960 19,789 41,165
Sparks 100,589 6,039 6,693 6,877 6,011 6,087 14,183
Winnemucca 7,762 708 391 672 482 531 1,332
35 to 44 years 45 to 54 years 55 to 59 years 60 to 64 years 65 to 74 years 75 to 84 years 85 years and over
WNDD Region 79,040 79,224 44,392 44,929 72,796 35,452 9,056
Carson City 6,278 7,087 4,075 4,046 6,327 3,183 1,347
Churchill County 2,565 3,185 1,865 1,509 2,750 1,391 389
Douglas County 4,781 5,657 4,317 4,547 7,993 4,029 1,169
Humboldt County 2,126 2,073 1,147 1,038 1,501 631 127
Mineral County 340 409 391 350 732 559 68
Pershing County 1,019 1,091 401 514 667 315 54
Storey County 510 521 312 289 759 366 17
Washoe County 59,214 56,706 30,605 31,218 49,945 23,951 5,667
Fallon 1,011 999 705 418 604 369 94
Fernley 2,207 2,495 1,279 1,418 2,122 1,027 218
Lovelock 354 260 93 153 214 75 33
Reno 30,977 28,837 15,744 14,341 22,903 10,217 3,338
Sparks 13,064 13,650 6,254 6,032 9,724 4,110 1,865
Winnemucca 882 833 618 317 602 309 85
Median age (years)
WNDD Region 43.7
Carson City 42.4
Churchill County 39.7
Douglas County 52
Humboldt County 36
Mineral County 52.9
Pershing County 42.1
Storey County 50.9
Washoe County 38.6
Fallon 34.4
Fernley 38.4
Lovelock 39.8
Reno 35.8
Sparks 38.3
Winnemucca 33.7
A P P E N D I C E S : C E D S D A T A
Population: Age - Totals and Up to 44 years
Population: Age - 45 years and over
Source: U.S. Census Bureau, American Community Survey, 2019
Average Median Age

86 Western Nevada Development District
A P P E N D I C E S : C E D S D A T A
Population: Diversity, Culture, Race
Population: Gender
Total population White Hispanic Or Latino Black Or African American
American Indian And Alaska Native
Asian Native Hawaiian And Other Pacific Islander
Some Other Race
Two Or More Races
United States 328,239,523 60.0% 18.4% 12.4% 0.7% 5.6% 0.2% 0.3% 2.5%
Nevada 3,080,156 47.8% 29.2% 9.3% 0.9% 8.3% 0.7% 0.4% 3.4%
WNDD Region 650,642 64.9% 23.2% 2.1% 1.8% 4.6% 0.5% 0.2% 2.7%
Carson City 54,773 67.0% 24.1% 2.0% 2.0% 2.6% 0.0% 0.2% 2.0%
Churchill County 24,259 73.2% 13.9% 2.4% 3.8% 2.8% 0.1% 0.2% 3.6%
Douglas County 48,132 80.8% 12.7% 0.7% 1.7% 1.6% 0.2% 0.1% 2.2%
Humboldt County 16,828 65.4% 27.0% 0.6% 5.1% 0.6% 0.0% 0.0% 1.2%
Mineral County 4,460 60.3% 11.6% 5.1% 18.9% 1.3% 0.0% 0.1% 2.7%
Pershing County 6,615 65.2% 24.4% 3.5% 2.4% 1.0% 0.3% 0.0% 3.1%
Storey County 3,988 84.6% 3.2% 1.7% 0.4% 0.9% 0.0% 0.0% 9.2%
Washoe County 471,519 62.2% 25.0% 2.2% 1.4% 5.6% 0.6% 0.2% 2.7%
Fallon 8,430 72.7% 11.2% 3.7% 1.4% 5.6% 0.0% 0.5% 5.0%
Fernley 20,068 71.8% 19.0% 1.6% 2.0% 1.6% 0.0% 0.5% 3.5%
Lovelock 1,959 72.4% 21.4% 0.5% 2.7% 0.5% 0.0% 0.0% 2.5%
Reno 246,500 61.0% 24.7% 2.6% 0.8% 6.5% 0.8% 0.3% 3.3%
Sparks 100,589 57.7% 30.1% 2.0% 0.9% 5.6% 0.5% 0.1% 3.1%
Winnemucca 7,762 59.2% 35.6% 0.8% 2.7% 0.0% 0.0% 0.0% 1.7%
Jurisdiction Sex ratio (males per 100 females) Sex ratio (males per 100 females) 18 years and older Sex ratio (males per 100 females) 65 years and older
United States 97 94.9 80.1
Nevada 100.6 99.5 88.7
WNDD Region 112.2 116.6 104.2
Carson City 105.6 105.8 84.0
Churchill County 102.6 102.2 93.6
Douglas County 100.9 99.9 100.2
Humboldt County 106.5 110.8 105.2
Mineral County 98.8 94.9 110.0
Pershing County 178.9 215.5 134.4
Storey County 112.1 111.3 104.7
Washoe County 101.7 101.0 90.6
Fallon 99.1 102.7 79.0
Fernley 102.3 108.2 114.9
Lovelock 101.1 102.8 61.0
Reno 102.2 101.3 89.0
Sparks 100.9 99.0 86.1
Winnemucca 107.4 105.9 81.1
Source: U.S. Census Bureau, American Community Survey, 2019

A P P E N D I C E S : C E D S D A T A
Population: Educational Attainment – 18-24 years old
Population: Educational Attainment – 25 years and older
Jurisdiction Population 18 to 24 years
Less than high school graduate
High school graduate or equivalent
Some College Or Associate Degree
Bachelor's Degree or higher
WNDD 53,342 7,181 18,074 24,010 3,972
Carson City 4,230 828 1,466 1,803 133
Churchill County 1,905 398 685 668 154
Douglas County 2,865 348 1,031 1,291 195
Humboldt County 1,153 159 601 341 52
Mineral County 388 39 196 153 0
Pershing County 310 84 159 58 9
Storey County 255 27 11 103 9
Washoe County 40,895 4,973 13,358 19,144 3,420
Fallon 866 119 313 315 119
Fernley 1,341 325 567 449 0
Lovelock 74 6 68 0 0
Reno 26,602 2,864 7,655 13,540 2,543
Sparks 8,071 1,028 3,348 3,125 570
Winnemucca 682 79 317 234 52
Jurisdiction Population 25 years and older
Less than high school graduate
High school graduate or equivalent
Some College Or Associate Degree
Bachelor's Degree or higher
WNDD 543,049 62,342 146,439 195,449 138,819
Carson City 39,324 5,121 10,205 15,279 8,719
Churchill County 16,818 1,410 5,310 6,937 3,161
Douglas County 37,096 2,521 9,043 14,614 10,918
Humboldt County 11,114 1,953 3,426 3,871 1,864
Mineral County 3,245 357 1,160 1,243 485
Pershing County 5,195 992 1,932 1,692 579
Storey County 3,018 192 838 1,040 948
Washoe County 316,319 35,940 74,437 108,405 97,537
Fallon 5,593 332 2,065 2,246 950
Fernley 13,865 1,732 5,011 5,296 1,826
Lovelock 1,382 286 599 329 168
Reno 167,522 18,441 37,194 55,704 56,183
Sparks 68,882 9,339 19,048 24,462 16,033
Winnemucca 4,978 1,017 1,542 1,453 966
Source: U.S. Census Bureau, American Community Survey, 2019Comprehensive Economic Development Strategy 87

88 Western Nevada Development District
A P P E N D I C E S : C E D S D A T A
Employment: Median Earnings By Educational Attainment
Commuting
Less Than High School Graduate
High School Graduate (Includes Equivalency)
Some College Or Associate Degree
Bachelor's Degree Graduate Or Professional Degree
Some Higher Education
United States $24,071 $31,264 $37,471 $54,925 $74,253 $55,550
Nevada $27,489 $32,067 $37,952 $49,770 $67,544 $51,755
WNDD $37,685 $34,278 $36,425 $49,620 $71,917 $52,654
Carson City $26,439 $32,198 $37,375 $46,120 $63,904 $49,133
Churchill County $26,887 $31,130 $37,622 $55,662 $66,765 $53,350
Douglas County $23,205 $33,221 $35,770 $46,046 $65,515 $49,110
Humboldt County $32,841 $46,073 $43,346 $51,367 $78,750 $57,821
Mineral County $26,591 $28,164 $31,121 $41,667 $72,895 $48,561
Pershing County $32,328 $23,769 $53,975 $72,625 $50,123
Storey County $108,083 $39,250 $39,375 $58,333 $72,955 $56,888
Washoe County $26,751 $32,388 $38,584 $51,740 $67,761 $52,695
Fallon $19,167 $25,688 $35,479 $68,604 $86,042 $63,375
Fernley $30,685 $33,750 $40,859 $41,667 $86,080 $56,202
Lovelock $40,977 $32,950 $37,396 $67,969 $46,105
Reno $26,515 $31,377 $35,409 $48,008 $65,547 $49,655
Sparks $26,380 $34,097 $42,710 $53,267 $61,093 $52,357
Winnemucca $49,875 $49,073 $54,083 $50,577 $74,954 $59,871
Carson City Churchill County Douglas County Humboldt County Mineral County Pershing County Storey County Washoe County
Carson City 57.18% 0.13% 11.68% 0.00% 0% 0% 7.25% 1.27%
Churchill County 0.23% 87.89% 0.01% 0.00% 5.09% 1% 0.00% 0.21%
Douglas County 14.00% 0.17% 63.52% 0.10% 0% 0% 2.90% 0.64%
Humboldt County 0.06% 0.07% 0.00% 87.57% 2% 7% 0.00% 0.03%
Mineral County 0% 0% 0.00% 0.00% 87.02% 1% 0% 0.01%
Pershing County 0.00% 0.00% 0.00% 3.27% 0.00% 73.49% 0% 0.06%
Storey County 0.59% 0% 0.20% 0.00% 0% 0% 40.52% 0.46%
Washoe County 13.90% 2.46% 3.10% 2.31% 0.57% 2.99% 30.47% 92.99%
Other 14.04% 8.68% 21.49% 6.75% 5.51% 13.79% 18.86% 4.33%
Source: U.S. Census Bureau, American Community Survey, 2019
Source: U.S. Census. 2020. "Table 1. Residence County to Workplace County Commuting Flows for the United States and Puerto Rico Sorted by Residence Geography 5-Year ACS,2011-2015”. Washington, D.C., https://www.census.gov/topics/employment/commuting/guidance/flows.html

Comprehensive Economic Development Strategy 89
A P P E N D I C E S : C E D S D A T A
Employment by Industry: 2010 Average
Employment by Industry: 2019 Average
Construction Education and Health Services
Financial Activities
Information Manufacturing Natural Resources and Mining
Other Services
Professional and Business Services
Public Admin.
Trade, Transp. and Utilities
Tourism, Gaming and Hospitality
Unclass. Total
Nevada 59,241 175,891 52,571 13,508 37,885 14,469 27,198 136,578 63,062 215,993 310,762 874 1,108,032
WNDD 11,654 48,779 11,234 3,144 16,019 3,411 6,755 29,276 19,789 53,444 45,771 166 249,442
Carson City 802 5,508 1,182 384 2,572 660 1,999 7,319 3,879 3,331 20 27,656
Churchill County 421 1,663 276 198 269 282 178 727 814 2,001 983 5 7,817
Douglas County 775 2,303 732 136 1,673 140 342 1,501 1,014 2,482 6,056 23 17,177
Humboldt County 518 1,164 100 78 254 2,072 159 444 602 1,288 1,066 7,745
Mineral County 41 338 45 10 253 144 176 1,007
Pershing County 4 271 21 68 423 25 27 425 212 137 1,613
Storey County 132 7 376 84 138 192 1,481 164 2,574
Washoe County 8,961 37,532 8,871 2,348 10,807 410 5,243 24,386 9,362 41,957 33,858 118 183,853
Construction Education and Health Services
Financial Activities
Information Manufacturing Natural Resources and Mining
Other Services
Professional and Business Services
Public Admin.
Trade, Transp. and Utilities
Tourism, Gaming and Hospitality
Unclass. Total
Nevada 95,899 227,092 65,101 16,958 59,291 19,866 35,443 197,079 63,982 267,688 357,061 3,141 1,408,601
WNDD 22,319 56,496 12,559 3,598 31,194 4,522 7,610 36,955 19,486 66,618 51,814 395 313,566
Carson City 1,523 6,336 1,164 430 2,700 96 741 2,182 7,455 4,322 3,696 34 30,679
Churchill County 749 1,554 221 157 544 360 179 623 812 2,062 1,082 5 8,348
Douglas County 1,532 2,644 749 166 2,002 153 396 1,601 990 2,984 6,452 38 19,707
Humboldt County 411 1,224 108 11 272 2,099 167 280 580 1,481 1,069 7 7,709
Mineral County 43 305 32 8 142 196 146 159 1,031
Pershing County 246 21 27 749 23 13 452 222 145 1,898
Storey County 765 222 15 11,427 169 110 621 155 4,120 174 17,778
Washoe County 17,296 43,965 10,249 2,826 14,222 754 5,994 31,635 8,846 51,281 39,037 311 226,416
Source: Nevada Department of Employment, Training & Rehabilitation

90 Western Nevada Development District
A P P E N D I C E S : C E D S D A T A
Employment: Occupation by Employment
WNDD Carson City
Churchill County
Douglas County
Humboldt County
Mineral County
Pershing County
Storey County
Washoe County
Fallon Fernley Lovelock Reno Sparks Winnemucca
Civilian employed population 16 years and over
320,984 25,705 9,620 21,421 8,491 1,534 2,072 1,638 241,666 3,780 8,837 793 140,387 50,230 4,154
Office and administrative support
38,919 3,081 1,360 2,520 1,083 230 203 196 29,157 563 1,089 114 15,748 6,949 488
Sales and related 32,817 2,339 699 1,996 676 130 159 133 25,962 307 723 79 14,821 5,260 363
Management 29,316 2,320 891 2,532 651 127 202 162 21,697 187 734 46 11,296 4,261 228
Food preparation and serving related
21,825 1,911 456 1,634 397 38 88 153 16,640 200 508 69 11,190 3,663 266
Construction and extraction
21,633 1,973 559 1,366 1,567 210 261 101 14,866 144 730 91 7,985 3,620 815
Production 19,976 2,096 498 1,147 439 63 50 48 14,941 260 694 50 8,819 3,691 302
Educational instruction, and library
18,762 938 599 1,065 359 159 119 105 15,112 221 306 35 9,754 2,525 224
Material moving 16,825 1,058 266 777 419 110 123 31 13,337 133 704 86 8,564 2,741 170
Transportation 13,702 698 565 491 451 67 200 59 10,550 220 621 15 5,362 2,597 43
Business and financial operations
13,507 1,256 420 1,043 133 43 53 52 10,076 197 431 7 5,455 1,668 107
Health diagnosing and treating practitioners and other technical
12,867 675 430 650 149 0 39 25 10,806 199 93 0 6,913 979 80
Building and grounds cleaning and maintenance
12,516 1,220 502 1,111 236 47 49 56 8,986 166 309 20 4,719 2,414 215
Installation, maintenance, and repair
10,305 1,038 401 503 383 38 119 186 7,133 146 504 57 3,324 1,825 48
Personal care and service
10,276 1,037 256 966 203 115 10 59 7,295 145 335 10 4,006 1,322 104
Healthcare support
7,421 908 276 559 227 21 74 36 5,158 138 162 21 3,024 1,445 132
Computer and mathematical
6,557 519 110 405 13 0 0 25 5,386 19 99 0 3,888 464 0
Health technologists and technicians
5,010 398 234 268 140 15 55 28 3,679 150 193 24 2,587 258 4

Comprehensive Economic Development Strategy 91
Employment: Occupation by Employment, cont’d
A P P E N D I C E S : C E D S D A T A
WNDD Carson City
Churchill County
Douglas County
Humboldt County
Mineral County
Pershing County
Storey County
Washoe County
Fallon Fernley Lovelock Reno Sparks Winnemucca
Architecture and engineering
4,855 298 141 396 165 7 0 33 3,697 40 118 0 1,819 1,080 90
Community and social service
4,722 392 229 452 65 21 46 20 3,399 94 98 14 2,343 729 78
Firefighting and prevention, and other protective service workers including supervisors
4,251 329 173 317 319 57 0 23 2,963 133 70 0 1,844 653 33
Arts, design, entertainment, sports, and media
4,169 431 69 389 16 9 117 35 3,073 30 30 5 1,929 566 12
Law enforcement workers including supervisors
3,840 315 92 298 117 6 71 21 2,756 38 164 34 1,729 487 211
Life, physical, and social science
3,497 148 45 277 319 0 0 48 2,603 0 57 0 1,880 477 53
Legal 2,330 252 42 207 0 21 0 0 1,808 27 0 0 888 486 0
Farming, fishing, and forestry
1,360 75 307 52 238 0 34 3 586 23 65 16 500 70 88
Source: U.S. Census Bureau, American Community Survey, 2019

92 Western Nevada Development District
A P P E N D I C E S : C E D S D A T A
Employment: Top Industry Wages
Average of Average Weekly Wages
Research and Development in the Physical, Engineering, and Life Sciences (except Nanotechnology and Biotechnology)
$2,559.00
All Other Financial Investment Activity $2,626.00
Physical/Engineering/Biological Research $2,628.57
Real Estate Credit $2,654.43
Trust, Fiduciary, and Custody Activities $2,711.00
Other Travel Arrangement Services $2,726.00
All Other Travel Arrangement Services $2,726.00
Nonscheduled Air Passenger Chartering $2,727.50
Semiconductor and Related Devices $2,816.00
Funds, Trusts & Other Financial Vehicles $2,873.00
Scientific Research and Development Svc $2,881.71
Lessors, Nonfinancial Intangible Assets $2,912.00
Computer Training $3,060.00
Portfolio Management $3,279.33
Architectural Services $3,646.50
Custom Computer Programming Services $3,765.33
Securities Brokerage $3,782.50
Security & Commodity Investment Activity $3,823.00
Computer and Supply Merchant Wholesalers $4,223.00
Industrial Design Services $5,818.00
Source: Nevada Department of Employment, Training & Rehabilitation

Comprehensive Economic Development Strategy 93
A P P E N D I C E S : P R O C E S S / P U B L I C P A R T I C I P A T I O N
This 2020 CEDS Update was developed with
a Comprehensive Economic Development
Strategy Committee and through regional
meetings composed of representatives
from the public and private sector and
community leaders.
Meetings of this group were publicized via
the Western Nevada Development District's
channels, and members of the public
were encouraged to attend if interested.
Information was distributed to all cities,
counties, and economic development
corporations.
In June 2019, the WNDD launched the
five-year rewrite of the Comprehensive
Economic Development Strategy with a
regional planning workshop.
Information was presented to subject
matter experts from throughout the region
that represent the areas of infrastructure,
workforce development, business/industry
sector, transportation, and housing. Other
representatives related to quality of life
issues such as health care, the environment,
culture, and the arts were also present.
The CEDS Committee presented and
facilitated the SWOT workshop process with
subject matter experts, including:
• Dr. Tom Harris, Director of the University
of Nevada Reno Center for Economic
Development
• Marlene Rebori from the University of
Nevada, Reno Cooperative Extension
• Buddy Borden from the University of
Nevada Reno Center for Economic
Development
• Bob Potts, Deputy Director at the
Nevada Governor’s Office of Economic
Development
About 125 people attended the
workshop, including representatives
from the educational community, utilities,
transportation, commercial businesses,
elected officials, local tribal officials, State
of Nevada agencies, Senator Jacky Rosen
representatives, nonprofit agencies, the
tourism industry, and financial institutions.
As a part of the CEDS process, WNDD
and its CEDS committee presented an
Economic Resiliency workshop to conduct
an additional SWOT regarding the region’s
resiliency to an economic shock. There were
65 people in attendance to this workshop,
which included presentations by:
• Brett Schwartz from the National
Association of Development Organizations
Research Foundation and the Stronger
CEDS Stronger Economy
• Tonya Graham, Executive Director with the
Geos Institute.
Participants and organizers discussed
how flooding, drought, fire, and industry
disruptions and closures could affect
the region in smaller groups. Each group
analyzed how the region would prepare for
the event, possible economic impacts of the
event, and potential strategies to mitigate
the economic shock. The Action Plan
includes the results of this workshop.
CEDS Process and Public Participation

94 Western Nevada Development District
Information used to create this document is available upon request to WNDD: 1000 N. Division St., Suite 102 B, Carson City, NV 89703
wndd.org | [email protected] | 775-473-6753
The WNDD Board approved the final 2020-2025 CEDS Update of Directors on June 28, 2021.
Teri Bath, City of Reno
George “Buddy” Borden, University of
Nevada, Reno – Cooperative Extension
Roy Edgington, Jr., City Of Fernley
Aster Girma, Nevada Green Institute
Tom Harris, University of Nevada, Reno –
Center for Economic Development
Shelley Hartmann, Mineral County
Economic Development Authority
Andrew Haskin, Northern Nevada
Development Authority
Mark Hauenstein, City Of Lovelock
Jeanne Hermann, Washoe County
Patricia Herzog, Governors Office of
Economic Development
Aric Jensen, City Of Reno
Rick Lattin, Churchill County
Jeff Limpert, City Of Reno
Heidi Lusby-Angvick, Pershing County
Economic Development Authority
Lara Mather, Storey County
Marlene Rebori, University of Nevada, Reno
– Cooperative Extension
Dr. Dana Ryan, JOIN Inc.
Art Sperber, City Of Sparks
Sarah Tone, Washoe County
Mark Tulman, JOIN Inc.
CEDS 2020 Committee
This 2020 CEDS Update was developed with a Comprehensive Economic Development Strategy Committee and through regional meetings
composed of representatives from the public and private sector and community leaders.
A P P E N D I C E S : P R O C E S S / P U B L I C P A R T I C I P A T I O N

Comprehensive Economic Development Strategy 95
A P P E N D I C E S : S O U R C E S
This Comprehensive Economic Development
Strategy uses demographic data obtained
from a wide variety of sources. A substantial
amount of data has been compiled
and analyzed from various primary and
secondary sources as part of this CEDS
document:
• Census Data & American Community
Survey*
• EMSI; Economic Modeling**
• Local Chamber of Commerce Officials
• Local Community Clerk Officials
• Local Economic Development Officials
• Local Planning Officials
• Nevada Department of Training &
Rehabilitation
• Nevada Governor's Office of Economic
Development
• U.S. Department of Labor
• United States Census Bureau, American
Fact Finder
Sources
*Data from American Community Survey (ACS) is based on survey data and estimates and is less accurate than Decennial U.S. Census data.**EMSI modeling data is a compilation of data from multiple sources such as U.S. Census, Department of Labor statistics, and other sources. Drawing conclusions or comparisons with the information should be done with caution.
ImagesCover: (bridge) WNDD
(drill) WNDD
(construction) WNDD
(machinery) shutterstock.com
Page 4: WNDD
Page 5: shutterstock.com
Page 7: shutterstock.com
Page 8: shutterstock.com
Page 12: shutterstock.com
Page 16: shutterstock.com
Page 18: shutterstock.com
Page 20: shutterstock.com
Page 22: shutterstock.com
Page 24: shutterstock.com
Page 27: WNDD
Page 28: (building) shutterstock.com,
(produce) WNDD
Page 32: (people) shutterstock.com,
(intersection) WNDD
Page 34: (bridge) WNDD
(beams) WNDD
(digger) WNDD
(workers) WNDD
Page 36: WNDD
Page 37: shutterstock.com
Page 38: WNDD
Page 39: Sydney Martinez/TravelNevada
Page 42: shutterstock.com
Page 45: shutterstock.com
Page 48: shutterstock.com
Page 52: shutterstock.com
Page 58: (people) shutterstock.com,
(building) Storey County
Page 76: shutterstock.com
Page 87: shutterstock.com
Page 91: WNDD
Page 92: shutterstock.com

96 Western Nevada Development District
Western Nevada Development District