comprehensive annual financial report - tamarac
TRANSCRIPT

COMPREHENSIVE ANNUAL FINANCIAL REPORT
CITY OF TAMARAC, FLORIDA FISCAL YEAR ENDED SEPTEMBER 30, 2016
Veterans Honor Wall Veterans Memorial Park

The City of Tamarac takes great pride in honoring the sacrifices our veterans have made Symbols of the City’s respect and appreciation began with the Veterans Memorial Wall, the addition of the Eternal Flame sculpture and continued with the addition of the Veterans Honor Wall which will serve as an everlasting reminder of their service and sacrifice for their country.
The Veterans Memorial Wall was added to Veterans Park in 1999. In partnership with the Veterans Affairs Committee, the City honored our veterans with a formal structure. The circular makeup of the wall and platform was designed to symbolize “closing the circle of conflict”.
The Eternal Flame Sculpture titled “In the Spirit of Peace” was designed and developed by local artist Beth Ravitz to symbolize an everlasting eternal flame. The sculpture consists of five (5) flames and each flame represents a branch of service. The sculpture was dedicated on Memorial Day 2005.
The Veterans Honor Wall was designed and developed by Glass Artist, Zac Knudson. The wall was dedicated on Memorial Day 2016. The Veterans Honor Wall was designed to honor and recognize individual Tamarac Veterans. The wall consists of two (2) image panels and eight (8) panels that include 800 names of both living and deceased Tamarac Veterans with branch of service, rank and years of service.
“The veterans of our military services have put their lives on the line to protect the freedoms that we enjoy. They have dedicated their lives to their country and deserve to be recognized for their commitment.” Judd Gregg, Former Governor and Senator of New Hampshire

2016 COMPREHENSIVE
ANNUAL FINANCIAL
REPORT
FOR THE
CITY OF TAMARAC, FLORIDA
Fiscal Year Ended
September 30, 2016
Prepared by FINANCIAL SERVICES
Mark C. Mason, CPA, Director of Financial Services Christine Cajuste, CPA, Assistant Director of Financial Services/Controller

CITY OF TAMARAC, FLORIDA
CITY COMMISSION
HARRY DRESSLER, Mayor
DEBRA PLACKO, Vice Mayor
MICHELLE GOMEZ, Commissioner
MARLON BOLTON, Commissioner
JULIE FISHMAN, Commissioner
ADMINISTRATIVE STAFF Michael C. Cernech
City Manager
Samuel S. Goren City Attorney
Mark C. Mason, CPA
Director of Financial Services


CITY OF TAMARAC, FLORIDA COMPREHENSIVE ANNUAL FINANCIAL REPORT
TABLE OF CONTENTS YEAR ENDED SEPTEMBER 30, 2016
I. INTRODUCTORY SECTION Page Letter of Transmittal ........................................................................................................................................................ i-vi GFOA Certificate of Achievement ................................................................................................................................... vii Organizational Chart ........................................................................................................................................................ viii List of Principal Officers ................................................................................................................................................... ix II. FINANCIAL SECTION Independent Auditors’ Report ........................................................................................................................................ 1-3 Management’s Discussion and Analysis ....................................................................................................................... 4-18 Basic Financial Statements: Government-Wide Financial Statements: Statement of Net Position ....................................................................................................................................... 19 Statement of Activities ........................................................................................................................................... 20 Fund Financial Statements: Balance Sheet - Governmental Funds .................................................................................................................... 21 Reconciliation of the Balance Sheet to the Statement of Net Position Governmental Funds ............................................................................................................................................ 22 Statement of Revenues, Expenditures, and Changes in Fund Balances – Governmental Funds ............................................................................................................................................ 23 Reconciliation of the Statement of Revenues, Expenditures, and Changes In Fund Balances of Governmental Funds to Statement of Activities ...................................................................... 24 Statement of Net Position – Proprietary Funds ...................................................................................................... 25 Statement of Revenues, Expenses, and Changes in Fund Net Position – Proprietary Funds ................................................................................................................................................. 26 Statement of Cash Flows – Proprietary Funds ....................................................................................................... 27 Statement of Fiduciary Net Position – Fiduciary Funds & Statement of Changes in Fiduciary Net Position - Fiduciary Funds ...................................................................... 28 Notes to the Financial Statements .......................................................................................................................... 29-87 Required Supplementary Information: Budgetary Comparison Schedules: General Fund .......................................................................................................................................................... 88 Fire Rescue Special Revenue Fund ....................................................................................................................... 89 Notes to Budgetary Comparison Schedule ............................................................................................................. 90 Schedule of Funding Progress, Employer Contributions, Changes in Net Pension Liability and Related Ratios ................................................................................................................................................ 91-100 Combining Financial Statements: Combining Balance Sheet – Nonmajor Governmental Funds ........................................................................... 101-102 Combining Statement of Revenues, Expenditures, and Changes in Fund Balances – Nonmajor Governmental Funds ................................................................................................................... 103-104

CITY OF TAMARAC, FLORIDA COMPREHENSIVE ANNUAL FINANCIAL REPORT
TABLE OF CONTENTS YEAR ENDED SEPTEMBER 30, 2016
(Continued)
Budgetary Comparison Schedules: Public Arts Fund ....................................................................................................................................... 105 Local Option Gas Tax Fund ....................................................................................................................... 105 Building Department Fund ......................................................................................................................... 106 Housing Grant Programs Fund…. ............................................................................................................. .106 Debt Service Fund ...................................................................................................................................... 107 Schedules of Revenues, Expenditures, and Changes in Fund Balances – Budget and Actual – General Capital Projects Fund. .................................................................................................................... 108 Public Service Facilities Construction Capital Projects Fund...................................................................... 109 2005 Capital Improvement Projects Fund. ................................................................................................. 110 Capital Maintenance Fund. .......................................................................................................................... 111 Capital Equipment Fund. ............................................................................................................................. 112 Corridor Improvement Fund. ....................................................................................................................... 113 Tamarac Village Fund ................................................................................................................................. 114 Internal Service Funds Combining Statement of Net Position ......................................................................................................... 115 Combining Statement of Revenues, Expenses, and Changes in Fund Net Position ................................... 116 Combining Statement of Cash Flows ......................................................................................................... 117 Statement of Changes in Assets and Liabilities- Agency Fund ....................................................................... 118 III. STATISTICAL SECTION Net Position by Component ....................................................................................................................................... 119 Changes in Net Position ..................................................................................................................................... 120-121 Fund Balances of Governmental Funds ..................................................................................................................... 122 Changes in Fund Balances of Governmental Funds .......................................................................................... 123-124 Program Revenues by Function/Program .................................................................................................................. 125 Tax Revenues by Source – Governmental Funds ...................................................................................................... 126 Assessed Value and Estimated Actual Value of Taxable Property ........................................................................... 127 Property Tax Rates – Direct and Overlapping Governments ..................................................................................... 128 Principal Property Tax Payers.................................................................................................................................... 129 Property Tax Levies and Collections ........................................................................................................................ 130 Ratios of Outstanding Debt by Type .......................................................................................................................... 131 Ratios of General Bonded Debt Outstanding ............................................................................................................. 132 Direct and Overlapping Governmental Debt ............................................................................................................. 133 Legal Debt Margin Information ................................................................................................................................. 134 Pledged Revenue Coverage ............................................................................................................................... 135-138 Demographic and Economic Statistics....................................................................................................................... 139 Major Employer – Number of Employees ................................................................................................................. 140 Full-Time Equivalent City Employees by Function/Program .................................................................................... 141 Operating Indicators by Function/Program ................................................................................................................ 142 Capital Assets Statistics by Function ......................................................................................................................... 143

CITY OF TAMARAC, FLORIDA COMPREHENSIVE ANNUAL FINANCIAL REPORT
TABLE OF CONTENTS YEAR ENDED SEPTEMBER 30, 2016
(Continued)
IV. COMPLIANCE SECTION Independent Auditors’ Report on Internal Control over Financial Reporting and on Compliance and Other Matters based on an Audit of Financial Statements Performed in Accordance with Government Auditing Standards ........................................................................................................................ 144-145 Independent Auditor’s Report on Compliance for its Major Federal Program and Report on Internal Control over Compliance ..................................................................... 146-147 Schedule of Expenditures of Federal Awards and State Financial Assistance ....................................................................................................................................................................... 148-149 Notes to the Schedule of Expenditures of Federal Awards and State Financial Assistance ............................................................................................................................................... 150
Schedule of Findings and Questioned Costs ................................................................................................................... 151-152
Management Letter Required by Chapter 10.550 of the Rules of the Auditor General of the State of Florida ........................................................................................................................... 153-154 Independent Accountant’s Report on the City’s Compliance with Section 218.415, Florida Statutes, Local Government Investment Policies ................................................................................................................................................................ 155


INTRODUCTORY SECTION


LETTER OF TRANSMITTAL

March 8, 2017 Honorable Mayor, City Commissioners and Pension Trustees City of Tamarac, Florida Dear Mayor, Commissioners and Pension Trustees: We are pleased to present to you the Comprehensive Annual Financial Report (CAFR) of the City of Tamarac, Florida (the City) for the fiscal year ended September 30, 2016. Chapter 218.39, Florida Statutes and the City Charter require that a complete set of financial statements be published within 270 days (nine months) of fiscal year end and presented in conformance with accounting principles generally accepted in the United States of America (GAAP) and audited in accordance with auditing standards generally accepted in the United States of America and those standards applicable to financial audits performed in accordance with Government Auditing Standards by licensed independent certified public accountants. Responsibility for both the accuracy of the presented data and the completeness and fairness of the presentation, including all disclosures, rests with the management of the City. We believe the data, as presented, is accurate in all material respects and is presented in a manner designed to fairly set forth the financial position and the results of operations of the City on a Government-wide and Fund basis. All disclosures necessary to enable the reader to gain an understanding of the City’s financial activities have been included. Management of the City is responsible for establishing and maintaining internal controls designed to ensure that the assets of the City are protected from loss, theft or misuse and to ensure that sufficient, reliable, adequate accounting data is compiled for the preparation of financial statements in conformity with accounting principles generally accepted in the United States of America. Internal accounting controls have been designed to provide reasonable rather than absolute assurance that the financial statements will be free from material misstatement. The concept of reasonable assurance recognizes that: (1) the cost of a control should not exceed the benefits likely to be derived; and (2) the evaluation of costs and benefits requires estimates and judgments by management. We believe that the City’s internal controls adequately safeguard assets and provide reasonable assurance of properly recorded financial transactions. In addition, the City maintains budgetary controls. The objective of these controls is to ensure compliance with legal provisions embodied in the annual budget approved by the City Commission. The City also maintains an encumbrance system that is employed as an extension of formal budgetary integration in all fund types. Encumbrances for governmental type funds outstanding at fiscal year-end are reported as committed or assigned designations of fund balance depending on the process by which the amounts are encumbered. In compliance with the laws of the State of Florida, the City’s financial statements have been audited by RSM US LLP a firm of licensed certified public accountants. The independent auditor has issued an unmodified (“Clean”) opinion that the City’s financial statements for the fiscal year ended September 30, 2016 are fairly presented in conformity with GAAP. The independent auditors’ report is presented as the first component of the financial section of this report. Management’s Discussion and Analysis (MD&A) immediately follows the independent auditor’s report and provides a narrative introduction, overview, and analysis of the basic financial statements. The MD&A complements this letter of transmittal and should be read in conjunction with it.

ii
CITY PROFILE AND GOVERNMENTAL STRUCTURE Created in 1963 by the Legislature of the State of Florida, the City of Tamarac occupies approximately twelve square miles in the northwestern portion of Broward County, the second most populated county in the State. With its population of 64,681 people, the City ranks thirteenth in population among the 31 municipalities in the County. The City is primarily residential with a diverse population with 50.8% of the population between the ages of 18 and 65. The City is located on the semi-tropical coastal ridge between the Everglades and the Atlantic Ocean. The terrain is generally flat, with developed land elevations varying from approximately 4 to 22 feet above sea level. The sub-tropical climate provides comfortable living year round. The City provides many recreational facilities for residents. It is also home to the 500-acre Tamarac Commerce Park along with high density commercial corridors serving the local population. Additionally, nearby access to super-highways, railways, airways, and waterways gives the City an ideal location in the expanding and dynamic tri-county commercial market. The City operates under the Commission/City Manager form of government. The policy-making body of the city is a City Commission composed of five members, four members elected by district on a nonpartisan basis and the Mayor. The Mayor is elected at-large on a nonpartisan basis and has one (1) vote. All terms run for a four (4) year period with the Mayor and two (2) commissioners being elected at one election and two years later, the remaining two (2) commissioners are elected. The City Commission is responsible for all policy-making functions of the government and retains the services of a City Manager and City Attorney. The City Manager is responsible for the administration of the City. The City provides a comprehensive range of municipal services including general government, public safety (police and fire), public works, parks and recreation, community development, and utilities (water, sewer and stormwater). For additional information concerning our City, please visit our website at www.tamarac.org. The City Commission is required to adopt a final budget no later than September 30 of the preceding fiscal year to which the budget applies. The annual budget serves as the foundation for the City of Tamarac’s financial planning and control. The budget is prepared by fund, function (e.g. public safety), and department (e.g. police). Amendments to the City’s operating budget in which appropriations are increased or decreased, transfers between departments, or transfers between funds must be approved by the City Commission. The amendments are presented in ordinance form and allow for public input. The City Charter authorizes the City Manager to transfer appropriations within an operating department of the general fund and within the fund as a whole for all other funds. Transfers are requested by the relevant operating managers through the department director. Transfers are reviewed and processed by the budget staff and approved by the City Manager. For additional budgetary information please refer to the Notes to the Budgetary Comparison Schedule in the Required Supplementary Information Section. LOCAL ECONOMY The City of Tamarac has had some growth in residential and commercial development this fiscal year. The real estate market has begun to rebound from the lows experienced in prior fiscal years, this year the City added approximately 160 new residential, 11 multi-family and 188 commercial units. The City of Tamarac is viewed as a community that is favorable to business and has been a magnet for new businesses and employees’ families. As a result and based upon evaluating median population age for the County the City has an estimated average age for 2010 of 47.6 years, versus 52.9 years in 2000. The City of Tamarac has become one of Broward County’s most attractive areas for young families.
iii
The City has focused its financial strategy on sustainability in the provision of services in the challenging economic climate that has affected Southeast Florida. This year continued to be challenging, however, there was a significant increase in taxable property values in comparison to previous years. The total taxable assessed property value in Tamarac was $2,496,995,116, $2,445,879,756, $2,539,653,079, $2,726,451,547and 2,905,190,535 in calendar years 2011, 2012, 2013, 2014 and 2015 and for fiscal years 2012, 2013, 2014, 2015 and 2016, respectively. The total taxable assessed value from calendar year 2011 through calendar year 2015, and for fiscal year 2012 through fiscal year 2016, increased 16.3%, however fiscal year 2016 did reflect a 6% increase over fiscal year 2015. New construction, annexations, etc. during that same period totaled $75,773,196. The reliance on ad valorem taxes continues to remain neutral in relation to prior years with another slight increase in fiscal year 2016, primarily due to the increase in assessed value. Fiscal year 2016 ad valorem receipts of $20,367,131 represented 36.59% of the total revenue sources for the general fund, this compares to 34.81% in fiscal year 2015. At the end of fiscal year 2016 ad valorem taxes represented 21.15% of governmental fund revenues compared to 26.76% in 2014. Global, national and state economics continue to be key factors in assessing the City’s future fiscal picture. Changes in the global, national, state and local economies can affect both revenues and expenditures due to the impact on tax receipts, revenue sharing, and the costs of providing city services. The 2010 census and subsequent population growth has had little, although positive, impact on revenue sharing for the City with the shift of population internally within Broward County.
The City has made and continues to make significant progress in supporting its mission to promote and enhance the City's economic vitality by attracting new businesses and providing a positive business environment. Occupational licenses provide a snapshot of new business activity in the City. In FY 2016, 2438 business licenses were issued, 465 of these licenses were for new businesses. This compares to 2406 issued in 2015. In 2016, several new businesses including, but not limited to, A & J School of Self Defense; Above All Recovery Center; Addiction and Recovery Solutions; Alliance Health & Injury Center; America’s Best Contacts/Eyeglasses;. Beall’s Outlet Store #155; Buddy’s Food Market; Coles Healthcare Services; Comprehensive Breast Center; Cypress Communications, Inc; Empire Mods South, Inc; Ft. Pierce Orthopedics; Friedman Dental Group, Inc.; Kapco Global; Lakeside Laundry; Live Well Pharmacy, Inc.; Lucky Me Stores, LLC; Moments Restaurant & Lounge; N.L. Elgut & Associates, LLC; Sage Dental of Tamarac; Subway W. Commercial; Tamarac Brick Oven Pizza & Pasta; The Dental Place of Tamarac; The Meatball Market Restaurant; Traffic Mgmt Solutions, Inc.; Tubby’s Liquor’s; Unipharma,LLC; Vita Health & Medical Center; Wireless M of Tamarac,LLC; have made Tamarac home. The City continues to market itself as a community of choice and we continue our partnership with the Tamarac Chamber of Commerce, while increasing our level of participation with the Greater Fort Lauderdale/Broward Economic Development Alliance (formerly the Broward Alliance). In addition, the City provides support to low to moderate income Tamarac residents through housing rehabilitation and first time homebuyer assistance programs funded by the Community Development Grants programs including the State Housing Initiative Partnership (SHIP), Community Development Block Grants (CDBG), the Home Investments Partnership (HOME) and the Neighborhood Stabilization Program (NSP). NSP was established in FY 2008 to address issues pertaining to foreclosed and abandoned properties. In 2016 one property was acquired and rehabilitated under the NSP3 Program; three previously acquired and rehabilitated homes were sold to NSP3 eligible buyers. Additionally, fifteen income eligible residents were approved for home rehabilitation services as part of the City’s annual entitlement from federal and state grant programs. MAJOR INITIATIVES The City of Tamarac has a long-term Vision Statement. It represents the collective aspirations, dreams and desires of the City Commission, the Executive Team, employees and the residents offered through a series of meetings and

iv
workshops. The following Vision Statement embodies where we would like the City to be, and provides an image for what we are capable of becoming in the future: “The City of Tamarac, our community of choice - leading the nation in quality of life through safe neighborhoods, a vibrant economy, exceptional customer service and recognized excellence.” The City has developed a Strategic Plan in order to set a uniform direction towards achieving its mission, vision and values. The City’s Executive Team reviews the City’s Strategic Plan on a biennial basis and updates the plan every other year. The biennial process identifies major issues or concerns through an environmental scan, and strengths, weaknesses, opportunities and threats (S.W.O.T.) analysis. Departments then develop action plans designed to achieve the City’s five strategic goals. The City then allocates resources providing for uniform progress towards the City’s stated strategic goals. Each goal further contributes to moving the City towards its long term vision. Strategic Goals
1. Inclusive Community – The City of Tamarac is committed to providing programs and services that meet the needs of an increasingly diverse community.
2. Healthy Financial Environment – The City of Tamarac will utilize financial management to develop and maintain a healthy financial environment, encouraging and supporting economic development and redevelopment.
3. Dynamic Organizational Culture – The City of Tamarac will create and sustain a culture conducive to development and retention of a skilled workforce.
4. Clear Communication – The City of Tamarac will ensure effective communication within the organization and throughout the City, and enhance the visibility of City programs and services.
5. A Vibrant Community – The City of Tamarac will provide resources, initiatives and opportunities to continually revitalize our community and preserve the environment.
LONG-TERM FINANCIAL PLANNING A significant measure of the City’s financial strength is the level of its fund balances (i.e. the accumulation of revenues exceeding expenditures). The City’s general fund balance has demonstrated positive trends over the past several years. Encumbrances are brought forward from the previous fiscal year and re-encumbered. The City Council takes the responsibility of being stewards of the public’s funds very seriously and has adopted the following general fund reserve policy: reserve funds shall not be used to fund recurring expenditures. Fund balances should be maintained at fiscally sound levels in all funds. The City has adopted financial policies that will insure that the City maintains an appropriate fund balance in line with recommended best practices. The unassigned, undesignated amount of $25.58 million in the general fund is 41.8% of the proposed general fund operating expenditures (including recurring transfers), leaving the City in a solid financial position to adequately prepare for changing economic conditions and prepare for future improvements. The City’s staff is charged with daily operations and involved in a variety of projects which are in accordance with the City’s Strategic Plan. The FY 2017 budget focused on providing an array of core services to residents, completing projects in progress, improving processes and practices, replacing existing infrastructure and equipment, and improving our financial position. The City Commission, through the budget process, has determined the City’s top priorities to meet the changing needs of Tamarac. The following current and future projects concentrate on improving infrastructure and streamlining City processes:
Implement a Comprehensive Corridor Improvement Plan to improve the appearance of the City’s thoroughfares

v
Construct one new Fire Station and rebuild one existing Fire Station. Development of the Tamarac Village concept along the NW 57th street corridor Maintain a vehicle and equipment replacement plan for the City’s fleet, fire rescue apparatus, light vehicles
and personal computers New clubhouse for the Colony West golf course Implement new gateway and neighborhood signs Continue to pursue the high performance initiatives through efficiencies and training Improvements/Upgrades to the Waste Water system Pine Island Road Pedestrian Crosswalks Replace/Upgrade Water Mains Citywide Buffer walls
RELEVANT FINANCIAL POLICIES The City has adopted a comprehensive set of financial management policies in the areas of operating management, debt management, accounts management, financial planning, and economic resources. These policies are approved annually through the budget process, with the most recent approval by the City Commission on September 26, 2016. Economic conditions will affect the City’s ability to realize its budgeted revenues in the categories of franchise fees, utility taxes, and state-shared revenues. Therefore, quarterly monitoring and conservatism (95% budgeting of certain revenue sources) should mitigate any unforeseen circumstances. The annual budget should be maintained in such a manner as to avoid an operating fund deficit. The annual budget should show fiscal restraint. Expenditures should be managed to create a positive cash balance (surplus) in each fund at the end of the fiscal year. The City maintains a prudent cash management and investment program in order to meet daily cash requirements, increase the amount available for investment, and earn the maximum rate of return on invested funds commensurate with appropriate security and safety of principle. The City should maintain sufficient reserves in accordance with established policy to maintain fiscally sound levels in all funds. The City shall maintain adequate protection from loss due to property damage or liabilities of the City. The City shall maintain a risk fund for workers’ compensation and property/liability and ensure adequate resources are available to support the value of incurred but not reported (IBNR) claims. The City is in compliance with its comprehensive debt management policy. The City is in compliance with its investment policy. AWARDS In 2013 the City of Tamarac joined the ranks of such prestigious organizations as Motorola, UPS and Hilton Hotel as the recipient of the international Palladium award for performance excellence. The award honors organizations throughout the world who translate strategic concepts into measurable results. The City was honored for developing programs and services which lead to higher resident satisfaction, improvements in employee performance, a strong financial outlook and increased engagement in the workforce. Tamarac was the third city in the United States to receive this award. The Government Finance Officers Association of the United States and Canada (GFOA) awarded a Certificate of Achievement for Excellence in Financial Reporting to the City of Tamarac for its Comprehensive Annual Financial


-vii-

-viii-

-ix-
City of Tamarac, Florida List of Principal Officers
September 30, 2016
ELECTED OFFICIALS Mayor Harry Dressler Vice-Mayor Debra Placko Commissioner Michelle Gomez Commissioner Marlon Bolton Commissioner Julie Fishman
APPOINTED OFFICIALS City Manager Michael C. Cernech City Attorney Samuel Goren Assistant City Manager Diane Phillips Chief Building Official Claudio Grande City Clerk Pat Teufel Director of Community Development Maxine Calloway Director of Financial Services Mark C. Mason, CPA Director of Information Technology Levent Sucuoglu Director of Parks and Recreation Gregory Warner Director of Human Resources Maria Swanson Director of Public Services Jack Strain Fire Chief Mike Burton

FINANCIAL SECTION


1
Independent Auditor's Report The Honorable Mayor, Members of the
City Commission, Pension Board of Trustees and City Manager City of Tamarac, Florida Report on the Financial Statements We have audited the accompanying financial statements of the governmental activities, the business-type activities, each major fund, and the aggregate remaining fund information of the City of Tamarac, Florida (the City), as of and for the year ended September 30, 2016, and the related notes to the financial statements, which collectively comprise the City’s basic financial statements as listed in the table of contents. Management's Responsibility for the Financial Statements Management is responsible for the preparation and fair presentation of these financial statements in accordance with accounting principles generally accepted in the United States of America; this includes the design, implementation and maintenance of internal control relevant to the preparation and fair presentation of financial statements that are free from material misstatement, whether due to fraud or error. Auditor's Responsibility Our responsibility is to express opinions on these financial statements based on our audit. We conducted our audit in accordance with auditing standards generally accepted in the United States of America and the standards applicable to financial audits contained in Government Auditing Standards, issued by the Comptroller General of the United States. Those standards require that we plan and perform the audit to obtain reasonable assurance about whether the financial statements are free from material misstatement. An audit involves performing procedures to obtain audit evidence about the amounts and disclosures in the financial statements. The procedures selected depend on the auditor's judgment, including the assessment of the risks of material misstatement of the financial statements, whether due to fraud or error. In making those risk assessments, the auditor considers internal control relevant to the City's preparation and fair presentation of the financial statements in order to design audit procedures that are appropriate in the circumstances, but not for the purpose of expressing an opinion on the effectiveness of the City's internal control. Accordingly, we express no such opinion. An audit also includes evaluating the appropriateness of accounting policies used and the reasonableness of significant accounting estimates made by management, as well as evaluating the overall presentation of the financial statements. We believe that the audit evidence we have obtained is sufficient and appropriate to provide a basis for our audit opinions. Opinions In our opinion, the financial statements referred to above present fairly, in all material respects, the respective financial position of the governmental activities, the business-type activities, each major fund and the aggregate remaining fund information of the City of Tamarac, Florida, as of September 30, 2016, and the respective changes in financial position and, where applicable, cash flows thereof for the year then ended in accordance with accounting principles generally accepted in the United States of America.
2
Emphasis of Matter As discussed in Note 3 to the accompanying financial statements, the City adopted the recognition and disclosure requirements of GASB Statement No. 72, Fair Value Measurement and Application, effective October 1, 2015. The fund balance of the Tamarac Village Fund as of October 1, 2015 has been restated. Our opinion is not modified with respect to this matter. As discussed in Note 3 of the financial statements, the October 1, 2015 net position balances for the Business-type Activities and the Utility Fund were restated. In our opinion, such adjustments were appropriate and have been properly applied. Our opinion is not modified with respect to this matter. Other Matters Required Supplementary Information Accounting principles generally accepted in the United States of America require that the management’s discussion and analysis, budgetary comparison schedules, and other post-employment benefits and pension schedules as listed in the table of contents be presented to supplement the basic financial statements. Such information, although not a part of the basic financial statements, is required by the Governmental Accounting Standards Board who considers it to be an essential part of financial reporting for placing the basic financial statements in an appropriate operational, economic or historical context. We have applied certain limited procedures to the required supplementary information in accordance with auditing standards generally accepted in the United States of America, which consisted of inquiries of management about the methods of preparing the information and comparing the information for consistency with management's responses to our inquiries, the basic financial statements, and other knowledge we obtained during our audit of the basic financial statements. We do not express an opinion or provide any assurance on the information because the limited procedures do not provide us with sufficient evidence to express an opinion or provide any assurance. Other Information Our audit was conducted for the purpose of forming opinions on the financial statements that collectively comprise the City’s basic financial statements. The accompanying supplementary information such as the Schedule of Expenditures of Federal Awards, as required by Title 2 U.S. Code of Federal Regulations Part 200, Uniform Administrative Requirements, Cost Principles, and Audit Requirements for Federal Awards (Uniform Guidance) and other information, such as the introductory section, statistical section, combining and individual fund statements and schedules and Schedule of State Financial Assistance are presented for purposes of additional analysis and are not a required part of the basic financial statements. The combining and individual fund statements and schedules, Schedule of Expenditures of Federal Awards, and Schedule of State Financial Assistance are the responsibility of management and were derived from and relates directly to the underlying accounting and other records used to prepare the basic financial statements. Such information has been subjected to the auditing procedures applied in the audit of the basic financial statements and certain additional procedures, including comparing and reconciling such information directly to the underlying accounting and other records used to prepare the basic financial statements or to the basic financial statements themselves, and other additional procedures in accordance with auditing standards generally accepted in the United States of America. In our opinion, the combining and individual fund statements and schedules, Schedule of Expenditures of Federal Awards, and Schedule of State Financial Assistance are fairly stated, in all material respects, in relation to the basic financial statements as a whole. The introductory and statistical sections have not been subjected to the auditing procedures applied in the audit of the basic financial statements, and accordingly, we do not express an opinion or provide any assurance on them.

3
Other Reporting Required by Government Auditing Standards In accordance with Government Auditing Standards, we have also issued our report dated March 7, 2017 on our consideration of the City’s internal control over financial reporting and on our tests of its compliance with certain provisions of laws, regulations, contracts and grant agreements and other matters. The purpose of that report is to describe the scope of our testing of internal control over financial reporting and compliance and the results of that testing, and not to provide an opinion on internal control over financial reporting or on compliance. That report is an integral part of an audit performed in accordance with Government Auditing Standards in considering the City’s internal control over financial reporting and compliance.
Fort Lauderdale, Florida March 7, 2017

MANAGEMENT’S DISCUSSION AND ANALYSIS (MD&A)


CITY OF TAMARAC, FLORIDA
MANAGEMENT’S DISCUSSION AND ANALYSIS SEPTEMBER 30, 2016
4
The City of Tamarac’s (the “City”) management’s discussion and analysis is a narrative overview and analysis of the financial activities of the City for the fiscal year ended September 30, 2016. It is designed to (a) assist the reader in focusing on significant financial issues, (b) provide an overview of the City’s financial activity, (c) identify changes in the City’s financial position, (d) identify any material deviations from the financial plan (the approved budget), and (e) identify individual fund issues or concerns. Since the Management’s Discussion and Analysis (MD&A) is designed to focus on the current year’s activities, resulting changes and current known facts, please read it in conjunction with the City’s financial statements (beginning on page 19) and letter of transmittal.
FINANCIAL HIGHLIGHTS
At the close of fiscal year 2016, the City’s Government-wide assets and deferred outflows exceeded its liabilities and deferred inflows by $251.8 million (net position). Governmental and business-type assets and deferred outflows exceeded liabilities and deferred inflows by $143.3 million and $108.5 million, respectively. Of this amount, $78.2 million (unrestricted net position) may be used to meet the ongoing obligations to citizens and creditors.
The City’s total net position increased by $17.1 million during the current fiscal year. The City’s net
position increase results from this year’s operations. Net position of our business-type activities increased by $6.5 million, net position of our governmental activities increased by approximately $10.6 million.
During the year, the City had expenses that were $11.3 million less than the $76.4 million generated in
taxes and other revenues for governmental programs, excluding transfers.
In the City’s business-type activities, revenues decreased by $1.1 million and expenses increased by $1.9 million.
Total cost of all of the City’s governmental activities increased by $1.9 million or 3 percent as a result of
the increased expenditures on Public Safety and General Government activities.
The General Fund’s fund balance increased by $2.8 million for the fiscal year ended September 30, 2016.
At the end of the current year, fund balance for the General Fund was $36.4 million, or 69 percent of total general fund expenditures and transfers. Of this amount, $10.3 million is assigned for capital projects, economic development, disaster reserve, and subsequent year’s budget appropriation. The remaining reserved fund balances of $0.4 million are non-spendable inventories and prepayments and amounts committed or restricted for public safety and economic development. These designations are in compliance with the City’s fund balance and financial policies.
The City’s total bonded debt decreased by $2.4 million during the fiscal year mainly as a result of debt
service payment on existing debt.

CITY OF TAMARAC, FLORIDA
MANAGEMENT’S DISCUSSION AND ANALYSIS SEPTEMBER 30, 2016
5
OVERVIEW OF THE FINANCIAL STATEMENTS This annual report consists of four parts—management’s discussion and analysis (this section), the basic financial statements, required supplementary information and an additional section that presents combining statements for nonmajor governmental funds and internal service funds. The basic financial statements include two kinds of statements that present different views of the City:
Within the government wide financial statements, the first two statements are government-wide financial statements that provide both long-term and short-term information about the City’s overall financial status.
The remaining statements are fund financial statements that focus on individual parts of the City government, reporting the City’s operations in more detail than the government-wide statements.
Governmental funds statements show how general government services such as public safety were financed in the short term as well as what remains for future spending.
Proprietary funds statements offer short-term and long-term financial information about the activities the government operates like businesses; such as the stormwater operations and the water and wastewater systems.
Fiduciary funds statements provide information about the financial relationships in which the City acts solely as a trustee or agent for the benefit of those parties outside of the government.
The financial statements also include notes that explain some of the information in the financial statements and provide more detailed data. The statements are followed by a section of required supplementary information that further explains and supports the information in the financial statements. Figure A-1 shows how the required parts of this annual report are arranged and are related to one another. In addition to these required elements, we have included a section with combining statements that provides details about our nonmajor governmental funds and internal service funds, each of which is added together and presented in single columns in the basic financial statements. The individual internal service fund is also included, reflecting balances prior to their elimination from the government wide financial statements, to avoid a “doubling-up” effect within the governmental and business-type activities columns of said statements.

CITY OF TAMARAC, FLORIDA
MANAGEMENT’S DISCUSSION AND ANALYSIS SEPTEMBER 30, 2016
6
Government-wide Financial Statements The government-wide financial statements (statement of net position and statement of activities found on pages (19-20) are designed in a manner similar to a private-sector business in that all governmental and business-type activities are presented in separate columns which add to a total for the Primary Government. Fiduciary funds are not included in the government-wide statements. The focus of the Statement of Net Position (the “Unrestricted Net Position”) is on governmental and business-type activities of the City. This statement combines and consolidates governmental funds’ current financial resources (short-term spendable resources) with capital assets, including infrastructure, and long-term obligations. Net position is the difference between the City’s assets and deferred outflows and its liabilities and deferred inflows. Increases or decreases in net position may serve as a useful indicator of whether the financial position of the City is improving or deteriorating over time. The Statement of Activities reflects the expenses of a given function, which are offset by program revenues. Program revenues are defined as charges for services, operating grants and contributions, and capital grants and contributions directly associated with a given function. Governmental activities are supported by taxes and intergovernmental revenues whereas the business-type activities are primarily supported by user fees and charges for services. The governmental activities of the City include general government, public safety, public works, community development, parks and recreation, and transportation. The business-type activities of the City reflect private sector type operations (water and sewer, stormwater utility and golf course) where the fee for service typically covers all or most of the cost of operation, including depreciation. Fund Financial Statements Government resources are allocated to and accounted for in individual funds, based upon the purposes for which they are to be spent and the means by which spending activities are controlled. The accounts of the City are organized on the basis of funds, each of which is considered a separate accounting entity. The operations for each fund are accounted for with a separate set of self-balancing accounts that comprise its assets, liabilities, deferred inflows/outflows, fund balance, revenue, and expenditures or expenses, as appropriate. The City’s funds are presented in separate fund financial statements. These funds are presented in a Governmental Fund Financial Statement and a Proprietary Fund (Business-type) Financial Statement and Fiduciary Financial Statements. The City’s major funds are presented in separate columns on the fund financial statements. The funds that do not meet the criteria of a major fund are considered nonmajor funds and are combined into a single column on the fund financial statements. The total columns on the Governmental Funds and Proprietary Funds (Business-type) Financial Statements (see pages 21-27) are not the same as the Governmental Activities column and the Business-type column on the Government-wide Financial Statements. The Governmental Funds Total column requires reconciliation because of the different measurement focus (current financial resources versus total economic resources) which is reflected on the page following each statement (see pages 22 and 24). The flow of current financial resources will reflect bond proceeds and interfund transfers as other financial sources as well as capital expenditures and bond principal payments as expenditures. The reconciliation will eliminate these transactions and incorporate the capital assets and long-term obligations (bonds and others) into the Governmental Activities column in the Government-wide Statements. The Proprietary Funds (Business-type) total column requires reconciliation because the internal service fund is consolidated as part of the governmental activities, but a portion of the internal service funds is for business-type activities. This reconciliation is a result of the surplus elimination (see pages 25 and 26). Governmental Fund Financial Statements Governmental Fund Financial Statements (see pages 21-24) are prepared on the modified accrual basis of accounting using a current financial resources measurement focus. Under the modified accrual basis, revenues are
CITY OF TAMARAC, FLORIDA
MANAGEMENT’S DISCUSSION AND ANALYSIS SEPTEMBER 30, 2016
7
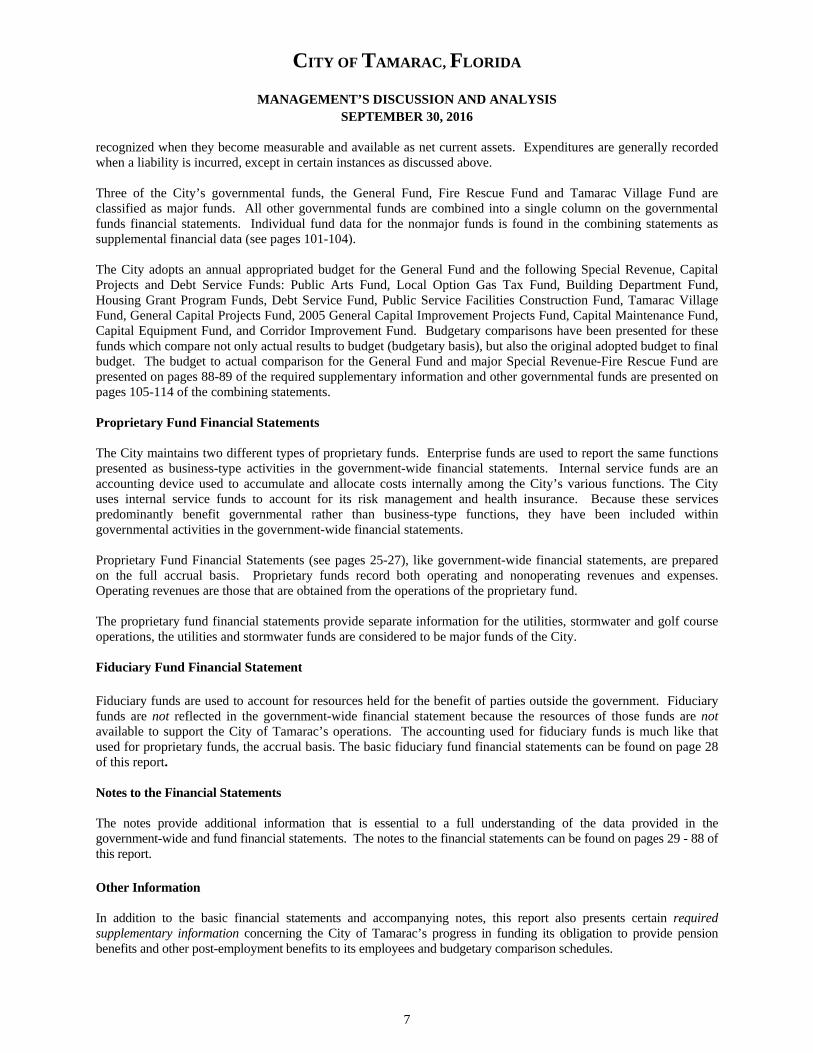
recognized when they become measurable and available as net current assets. Expenditures are generally recorded when a liability is incurred, except in certain instances as discussed above. Three of the City’s governmental funds, the General Fund, Fire Rescue Fund and Tamarac Village Fund are classified as major funds. All other governmental funds are combined into a single column on the governmental funds financial statements. Individual fund data for the nonmajor funds is found in the combining statements as supplemental financial data (see pages 101-104). The City adopts an annual appropriated budget for the General Fund and the following Special Revenue, Capital Projects and Debt Service Funds: Public Arts Fund, Local Option Gas Tax Fund, Building Department Fund, Housing Grant Program Funds, Debt Service Fund, Public Service Facilities Construction Fund, Tamarac Village Fund, General Capital Projects Fund, 2005 General Capital Improvement Projects Fund, Capital Maintenance Fund, Capital Equipment Fund, and Corridor Improvement Fund. Budgetary comparisons have been presented for these funds which compare not only actual results to budget (budgetary basis), but also the original adopted budget to final budget. The budget to actual comparison for the General Fund and major Special Revenue-Fire Rescue Fund are presented on pages 88-89 of the required supplementary information and other governmental funds are presented on pages 105-114 of the combining statements. Proprietary Fund Financial Statements The City maintains two different types of proprietary funds. Enterprise funds are used to report the same functions presented as business-type activities in the government-wide financial statements. Internal service funds are an accounting device used to accumulate and allocate costs internally among the City’s various functions. The City uses internal service funds to account for its risk management and health insurance. Because these services predominantly benefit governmental rather than business-type functions, they have been included within governmental activities in the government-wide financial statements. Proprietary Fund Financial Statements (see pages 25-27), like government-wide financial statements, are prepared on the full accrual basis. Proprietary funds record both operating and nonoperating revenues and expenses. Operating revenues are those that are obtained from the operations of the proprietary fund. The proprietary fund financial statements provide separate information for the utilities, stormwater and golf course operations, the utilities and stormwater funds are considered to be major funds of the City. Fiduciary Fund Financial Statement Fiduciary funds are used to account for resources held for the benefit of parties outside the government. Fiduciary funds are not reflected in the government-wide financial statement because the resources of those funds are not available to support the City of Tamarac’s operations. The accounting used for fiduciary funds is much like that used for proprietary funds, the accrual basis. The basic fiduciary fund financial statements can be found on page 28 of this report. Notes to the Financial Statements The notes provide additional information that is essential to a full understanding of the data provided in the government-wide and fund financial statements. The notes to the financial statements can be found on pages 29 - 88 of this report. Other Information In addition to the basic financial statements and accompanying notes, this report also presents certain required supplementary information concerning the City of Tamarac’s progress in funding its obligation to provide pension benefits and other post-employment benefits to its employees and budgetary comparison schedules.

CITY OF TAMARAC, FLORIDA
MANAGEMENT’S DISCUSSION AND ANALYSIS SEPTEMBER 30, 2016
8
The combining statements referred to earlier in connection with non-major governmental funds are presented immediately following the required supplementary information. Combining and individual fund statements and schedules can be found beginning on page 101 of this report.
GOVERNMENT-WIDE STATEMENTS The Government-wide Financial Statements were designed so that the user can determine if the City is in a better or worse financial condition from the prior year. The City’s overall financial condition has remained stable. Summary of Net Position The City’s combined net position increased to $251.8 million from $232.8 million between fiscal years 2015 and 2016.
City of Tamarac, Florida Summary Schedule of Net position
(in millions)
2016 2015 2016 2015 2016 2015
Current and other assets $ 96.6 $ 91.2 $ 55.9 $ 51.2 $ 152.5 $ 142.4
Capital assets 114.9 112.8 71.4 67.4 186.3 180.2
Total assets 211.5 204.0 127.3 118.6 338.8 322.6
Total deferred outflows of resources 16.2 12.9 3.3 3.0 19.5 2.8
Long-term debt outstanding 69.4 66.9 16.5 16.3 85.9 83.2
Other liabilities 5.4 8.9 4.7 4.6 10.1 13.5
Total liabilities 74.8 75.8 21.2 20.9 96.0 96.7
Total deferred inflows of resources
9.6 8.4 0.9 0.7 10.5 9.1
Net position:Net investment in capital assets 87.5 87.6 57.5 53.2 145.0 140.8
Restricted 13.2 18.8 7.4 6.4 20.6 25.2
Unrestricted 42.6 26.3 43.6 40.5 86.2 66.8
Total net position (as restated) $ 143.3 $ 132.7 $ 108.5 $ 100.1 $ 251.8 $ 232.8
Total
Note: Totals may not add due to rounding.
Governmental Activities Business-type Activities
The largest portion of the net position (70%) is restricted as to the purpose they can be used for or are invested in capital assets. The net investment in capital assets is the largest portion of net position. This represents capital assets (land, buildings, improvements, equipment, infrastructure, and construction in progress), net of accumulated depreciation, and the outstanding related debt used to acquire the assets. Unamortized deferred charges on refundings “follow the debt” in calculating net position components for the statement of net position. That is, if the debt is capital related, the deferred amounts are included in the calculation of net investment in capital assets. If the debt is restricted for a specific purpose and the proceeds are unspent, the net proceeds affect restricted net position. If the debt proceeds are not restricted for capital or other purposes, the deferred charges are included in the calculation of unrestricted net position. The City uses these capital assets to provide services to citizens; consequently, these assets are not available for future spending. Although the City’s investment in its capital assets is reported net of related debt, it should be noted that the resources needed to repay this debt must be provided from other sources, since the capital assets themselves cannot be used to liquidate these liabilities. Similarly, deferred inflows and outflows relating to pension liabilities and earnings are components of net position.

CITY OF TAMARAC, FLORIDA
MANAGEMENT’S DISCUSSION AND ANALYSIS SEPTEMBER 30, 2016
9
At the end of the current fiscal year, the City of Tamarac is able to report positive balances in all three categories of net position, for the government as a whole and for business-type activities. The same situation held true for the prior fiscal year. Maintaining a positive fund balance overall is an indication that the government is not spending down all of its available resources and is able to fund future temporary shortfalls or emergencies. Summary of Changes in Net Position The following table compares the Revenues and Expenses for the current and prior fiscal years.
City of Tamarac, Florida Summary Schedule of Changes in Net position
(in millions)
2016 2015 2016 2015 2016 2015RevenuesProgram revenues:
Charges for services $ 29.3 $ 29.7 $ 34.0 $ 34.1 $ 63.3 $ 63.8 Operating grants and contributions 0.7 1.1 - - 0.7 1.1 Capital grants and contributions 3.0 0.4 0.7 1.8 3.7 2.2
General revenuesProperty taxes 20.6 19.1 - - 20.6 19.1 Other taxes 14.9 14.2 - - 14.9 14.2 Intergovernmental 6.7 6.5 - - 6.7 6.5 Investment income 0.5 0.2 0.2 0.1 0.7 0.3 Other income 0.7 0.3 - - 0.7 0.3
Total revenues 76.4 71.5 34.9 36.0 111.3 107.5
Expenses Program ActivitiesGovernmental Activities:
General government 15.1 13.2 - - 15.1 13.2 Public safety 35.9 33.9 - - 35.9 33.9 Physical Environment 3.8 5.2 - - 3.8 5.2 Transportation 2.1 2.3 - - 2.1 2.3 Culture and recreation 5.7 5.5 - - 5.7 5.5 Economic environment 1.0 1.6 - - 1.0 1.6 Human services 0.3 0.3 - - 0.3 0.3 Interest on long-term debt 1.2 1.2 - - 1.2 1.2
Business-type Activities:Utilities - - 21.6 20.5 21.6 20.5 Stormwater - - 5.1 4.2 5.1 4.2 Colony West - - 2.4 2.4 2.4 2.4 Total expenses 65.1 63.2 29.1 27.1 94.2 90.3
Increase in net position before transfers 11.3 8.3 5.8 8.9 17.1 17.2 Transfers in (out) (0.7) (0.6) 0.7 0.6 - - Increase (decrease) in net position 10.6 7.7 6.5 9.5 17.1 17.2 Net position, October 1 (as restated) 132.7 125.0 102.0 90.6 234.7 215.6 Net position, September 30 $ 143.3 $ 132.7 $ 108.5 $100.1 $ 251.8 $ 232.8
Total
Note: Totals may not add due to rounding.
GovernmentalActivities
Business-typeActivities

CITY OF TAMARAC, FLORIDA
MANAGEMENT’S DISCUSSION AND ANALYSIS SEPTEMBER 30, 2016
10
There was an increase of $3.1 million in unrestricted net position reported in connection with the City’s business-type activities. The increase is mainly due to the results of operations, the amount by which revenues outpaced revenues. This increase is $4.7 million below the $7.8 million increase that was recorded in fiscal year 2016 as results from the City’s decision to not increase the water and waste water rates for fiscal year 2016. As previously stated, the City’s overall net position increased by $17.2 million during the current fiscal year. The City’s net position increase is mainly due to increases in revenue in the Governmental funds, capital grants increased $2.6 million due to a grant for new fire equipment and Property taxes increased $1.5 million, mainly from the new Water Utility tax. The unrestricted net position of the governmental activities showed an increase of $16.3 million or 61.98% from last year due to a reclassification of land previously recorded as capital assets to investments, this also resulted in a net increase in current assets of $5.4 million. Additionally approximately $5 million from restriction in the capital projects fund due to utilization and reclassification of bond funds. The City’s net investment in capital assets decreased by $7.3 million mainly as a result of the reclassification of capital asset ($7.9 million), capital additions ($6.5 million) and depreciation ($4.3 million). The restricted component of the governmental activities’ net position increased by $9.6 million due to an increase in restricted funds assigned to capital projects. Governmental Activities There was an increase in the City’s governmental revenues in 2016, revenues increased by $4.9 million to $76.4 million. Approximately 27.0% of the Governmental Activity’s revenues come from property taxes, and 19.5% from other taxes. Another 38.4% come from fees charged for services, and the remaining is primarily federal, state and local aid.
The following is a chart of revenues by source of governmental activities by percent of total revenues.
Revenues by source - Governmental Activities
Charges for services reported in the governmental activities decreased by $0.4 million, or 1.3% in comparison to the prior year. This was due mainly to settlements of $1.0 million in fiscal year 2015 that were not repeated in 2016 coupled by an increase in Code enforcement fees $0.4 million, and interfund service charges $0.3 million.

CITY OF TAMARAC, FLORIDA
MANAGEMENT’S DISCUSSION AND ANALYSIS SEPTEMBER 30, 2016
11
Property taxes reported in the governmental activities increased $1.5 million, or 7.8%, in comparison to the prior year. Taxable assessed property valuation of $2,890,121,191 for fiscal year 2016 represents a 6% increase from the previous fiscal year. The millage rate remained the same as fiscal year 2016 at 7.2899. Additionally, the debt service millage rate decreased from 0.1010 in fiscal year 2015, to 0.0952 in fiscal year 2016. Utility taxes increased by $0.8 million or 17.3% in comparison to the prior year, this was due to the addition of a new water utility tax.
Gas taxes reported in the governmental activities increased slightly by $48,532, 2.3% in comparison to the prior year. The 6 cent and 5 cent gas taxes are based on the number of gallons sold irrespective of the unit cost per gallon so the revenues fluctuate with the level of demand for fuel.
Franchise fees reported in the governmental activities decreased slightly by $40,280, or 0.8% in comparison to the prior year. Franchise fees are levied on a corporation or individual by the City in return for granting a privilege or permitting the use of public property subject to regulations. The City receives franchise fees for electricity, propane, solid waste, and towing services.
Communication services taxes reported in the governmental activities decreased $72,287, or 2.9% in comparison to the prior year primarily due to a continued reduction in land lines subject to the tax.
Interest income reported in the governmental activities increased $42,011 or 19.9% from the prior year. The increase was due to the general/national stabilization in interest rates between fiscal year 2015 and 2016. The following is a chart of expenses by function of governmental activities by percent of total expenses.
Functional Expenses for Fiscal Year 2016
The City’s governmental activities expenses cover a range of services with 55.1% related to public safety. The expenses for governmental activities increased to $65.1 million, this is a 3.0% increase compared to 2015. The increase was mainly attributable to increases in personnel costs including health insurance claims. The functional activities expenses were similar in some cases, reporting changes compared to last year’s expenses. There were increases in general government ($1.9 million), public safety ($2.0 million), and culture and recreation ($0.2 million). There were decreases in transportation ($0.2 million), physical environment ($1.4 million) and economic environment ($0.6 million). General government expenses reported in governmental activities increased $1.9 million, or 14.4%, in comparison to the prior year. The increase was mainly attributable to increases in personnel costs including health insurance claims.

CITY OF TAMARAC, FLORIDA
MANAGEMENT’S DISCUSSION AND ANALYSIS SEPTEMBER 30, 2016
12
Public Safety expenses reported in governmental activities increased $2.0 million, or 5.9%, in comparison to prior year due to increases in the cost of services.
Physical environment expenses reported in governmental activities decreased $1.4 million, or 26.9%, in comparison to the prior year. This is a result of approximately $1.4 million expended in fiscal year 2015 for road maintenance which was not repeated in fiscal year 2016.
Culture and Recreation expenses reported in governmental activities increased $0.2 million, or 3.6%, in comparison to the prior year. This is a result of increases in personnel costs for vacant positions that were filled in fiscal year 2016.
Economic Environment expenses reported in governmental activities decreased $0.2 million, or 37.5%, in comparison to the prior year as a result of continued decreases in activity for the Neighborhood Stabilization Program funds used to assist qualified recipients in the purchase and renovation of foreclosed homes in 2016. The table below presents the cost of each of the City’s various public services—public safety, general administration, economic environment, culture and recreation, physical environment, transportation and human services—as well as each service’s net cost (total cost less fees generated by the activities and intergovernmental aid). The net cost shows the financial burden on the City’s taxpayers by each of these services.
The cost of all governmental activities this year was $64.5 million. Some of that cost was financed by: o Those who directly benefited from the programs through charges for services ($29.3 million), and o Other governments and organizations that subsidized certain programs from operating and capital
grants and contributions ($3.7 million).
The remaining net cost of services or “public benefit” of governmental services were financed with $31.8 million in taxes, franchise fees, unrestricted intergovernmental revenues and other revenues such as interest revenue.
City of Tamarac, Florida
Net Cost of City’s Governmental Activities (in millions)
2016 2015 2016 2015Public safety $ 35.9 $ 33.9 $ 13.9 $ 14.2 General government 15.1 13.2 8.0 5.5 Economic environment 1.0 1.6 0.2 0.5 Culture and recreation 5.7 5.5 4.4 4.2 Physical environment 3.8 5.2 2.5 4.0 Transportation 2.1 2.3 1.5 2.0 Human Services 0.3 0.3 0.3 0.3 Interest on long-term debt 1.2 1.2 1.2 1.2 Total $ 65.1 $ 63.2 $ 32.0 $ 31.9
Total Cost of Services Net Cost of Services
Business-type Activities The business-type activities net position increased by $6.5 million from the prior fiscal year. Revenues of the City’s business-type activities decreased by 3.0 percent to $34.9 million and expenses increased by $2.0 million to $29.1 million (see Summary of Changes in Net Position on page 9).

CITY OF TAMARAC, FLORIDA
MANAGEMENT’S DISCUSSION AND ANALYSIS SEPTEMBER 30, 2016
13
The following is a chart of revenues by source for business-type activities.
Revenues by Source- Business-type Activities
For business-type activities charges for services is the major source of revenues representing 97.4% of revenues in 2015. Charges for services remained stable at $34.0 million, a slight $0.1 decrease; this was primarily due to stable rates in the Utilities in Fiscal year 2016. Investment interest earnings increased in fiscal year 2016. Investment earnings were $163,715 or 0.6% of revenue which reflects the City’s conservative investment approach and a slight rebound in the market conditions as compared to fiscal year 2015.
Expenses by Program- Business-type Activities
Water and sewer expenses reported in business-type activities increased by $1.2 million, or 6.1%, in comparison to the prior year, the increase mainly attributable to the increases in repairs and maintenance costs, waste water disposal costs, as well as interfund service charges in fiscal year 2016.

CITY OF TAMARAC, FLORIDA
MANAGEMENT’S DISCUSSION AND ANALYSIS SEPTEMBER 30, 2016
14
Stormwater reported an increase in expenses of $910,285 or 22.5% over the prior year, this increase was mainly due to increases in contracted services, repairs and maintenance costs, and administrative charges in addition to write off of uncollectible receivables in fiscal year 2016. Non-major Golf Course Fund reported a decrease in expenses of $78,127 or 3.2% under the prior year, this decrease was mainly due to decrease in golf course operational activities which resulted in a decrease in food and beverage costs as well as golf course labor costs in fiscal year 2016. Other enterprise funds’ expenses reported in business-type activities remained consistent year over year with slight increases in salaries, pension costs and some maintenance services.
FINANCIAL ANALYSIS OF THE CITY’S FUNDS
Governmental Funds The focus of the City’s Governmental Funds is to provide information on near-term inflows, outflows, and balances of spendable resources. Such information is useful in assessing the City’s financing requirements. In particular, unassigned fund balance may serve as a useful measure of a government’s net resources available for spending at the end of the fiscal year. As the City completed the year, its governmental funds reported combined fund balances of $93.1 million, or an increase of $5.3 million compared to last year’s combined fund balances of $87.8 million. The primary reasons for these changes in fund balances are as follows:
The fund balance of the General Fund increased by $2.8 million due primarily to an increase in income from taxation, charges for services and intergovernmental revenue. At the end of the year expenditures were 92.4% of budget.
The Fire Rescue Fund balance decreased by $1.9 million due mainly to a decrease in transfers in coupled
by increases in personnel costs, leases and operating supplies.
The Tamarac Village Fund decreased by $0.4 million, mainly due to debt service payments.
Proprietary Funds The City’s Proprietary Funds include the City’s Enterprise Funds – Utilities Fund, the Stormwater Fund and the Golf Course Fund. An enterprise fund is used to account for activities for which a fee is charged to external users for goods and/or services. The funds provide the same type of information found in the government-wide financial statements, but in more detail.
Utilities operating revenue decreased slightly by $0.1 million or 0.4% in FY16, there was no change in the water rates in fiscal year 2016. Operating expenses, including depreciation increased by $1.2 million mainly attributable to the increases in repairs and maintenance costs, waste water disposal costs, as well as interfund service charges in fiscal year 2016.
Stormwater operating revenues increased by $189,372 or 3.5% over the prior fiscal year, the Stormwater rates increased 3% in fiscal year 2016. Operating expenses, including depreciation, increased by $914,042 mainly due to increases in contracted services, repairs and maintenance costs, and administrative charges in addition to write off of uncollectible receivables in fiscal year 2016.
Non-Major Golf Course Fund operating revenue decreased by $248,357 or 11% in FY16 due to a decrease in golf course operational activities fiscal year 2016. Operating expenses, including depreciation also decreased by $78,127 which resulted from a decrease in food and beverage costs as well as golf course labor costs in fiscal year 2016.

CITY OF TAMARAC, FLORIDA
MANAGEMENT’S DISCUSSION AND ANALYSIS SEPTEMBER 30, 2016
15
General Fund Budgetary Highlights Over the course of the year, the City amended the General Fund budget two times. Budget amendments fall into two categories: (1) Amendments are approved for prior year encumbrances; and (2) supplemental appropriations to recognize and appropriate grant revenues which were received after the adoption of the budget, and to provide appropriations for various other needs which had arisen since the adoption of the budget. Even with these adjustments, actual expenditures were $4.4 million below final budgeted amounts. The most significant contributor to this variance was various departmental savings due to staff vacancies and tighter control over operating expenditures. The fiscal year 2016 amended final budget of $57.3 million increased slightly from the original General Fund budget by $64,942 primarily because of the recognition of developer contributions for traffic calming improvements during the fiscal year. With base revenues of $54.2 million and $3.1 million in operating transfers for internal service charges from the Building and Fire Funds, the Adopted Budget is balanced. The original General Fund budget consists of $44.0 million base expenditures and $13.3 million in operating transfers to the other funds. Differences between the original budget and the final amended budget increased appropriations by $64,942 which primarily consists of the cost of installation of traffic calming improvements.
CAPITAL ASSET AND DEBT ADMINISTRATION Capital Assets The City’s net investment in capital assets for its governmental and business-type activities as of September 30, 2016 amounts to $186.3 million (net of accumulated depreciation), or a 0.9% increase, in comparison to the prior year.
City of Tamarac, Florida Capital Assets
(net of depreciation, in millions)
Governmental Actvities
Business-type Actvities Total
2016 2015 2016 2015 2016 2015Land $ 16.7 $ 25.2 $ 10.3 $ 10.3 $ 27.0 $ 35.5 Intangibles-right-of-ways 0.1 0.1 - - 0.1 0.1
Buildings and improvements 20.0 20.9 6.3 6.5 26.3 27.4
Improvements other than buildings
17.4 17.9 45.3 41.0 62.7 58.9
Equipment 4.7 3.0 3.0 2.9 7.7 5.9
Infrastructure 44.8 44.5 4.5 4.8 49.3 49.3
Public arts 0.4 0.4 - - 0.4 0.4
Construction in progress 2.3 0.8 2.2 1.9 4.5 2.7
Total $ 106.4 $ 112.8 $ 71.6 $ 67.4 $ 178.0 $ 180.2
Major capital asset purchases and projects during the fiscal year included the following: Started construction on fire station #78 Two new Ambulances Generator Replacement Improvements to the water pipelines Sewer main rehabilitation Culvert replacements Playground Renovation at Sunset Point Park New bike paths Additional information on the City’s Capital Assets can be found on pages 51-52 of this report.

CITY OF TAMARAC, FLORIDA
MANAGEMENT’S DISCUSSION AND ANALYSIS SEPTEMBER 30, 2016
16
Long-term debt At year-end the City had $54.4 million in bonds and notes outstanding— a decrease of $1.9 million from last year— as shown in the following table. Of this amount, $0.3 million comprises debt backed by the full faith and credit of the government and $54.1 million in revenue bonds and notes backed by specific taxes and fee revenues. The debt position of the City is summarized below:
City of Tamarac, Florida Outstanding Debt
(in millions)
2016 2015 2016 2015 2016 2015
General obligation bonds $ 0.3 $ 0.5 $ - $ - $ 0.3 $ 0.5
Revenue bonds and notes 39.6 41.3 14.5 15.0 54.1 56.3
Total $ 39.9 $ 41.8 $ 14.5 $ 15.0 $ 54.4 $ 56.8
Governmental Business-type Total
In November 2015 and December 2015, the City entered into new Capital Lease arrangements for the acquisition of two ambulances. In 2016, a Standard and Poor’s review affirmed the City’s Capital Improvement Bond credit rating of AA-. These ratings reflect the strong financial performance and credit position of the City. The following table shows the latest ratings for the City by the major rating agencies.
2016 2015 2016 2015 2016 2015
General Obligation Bonds
Current Underlying A1 A1 AA AA AA AA
Capital Improvement Revenue
Current Underlying Aa3 Aa3 AA- AA- AA- AA-
Sales Tax Revenue (2010 & 2009)
Current Underlying Aa3 Aa3 AA- AA- AA- AA-
Insured N/A N/A N/A N/A AA- AA-
Water & Sewer Revenue
Current Underlying Aa2 Aa2 AA AA AA AA
Insured Aa2 Aa2 N/A N/A AA AA
Stormwater Assessment Revenue
Current Underlying A1 A1 AA AA AA- AA-
Moody's FitchStandard &
Poor's
Rating Agency
Additional information on the City of Tamarac’s long-term debt can be found in Note 9 beginning on page 56 of this report.

CITY OF TAMARAC, FLORIDA
MANAGEMENT’S DISCUSSION AND ANALYSIS SEPTEMBER 30, 2016
17
Economic Factors and Next Year’s Budget
According to the U.S. Bureau of Labor Statistics, the unemployment rate for the Broward County area in September 2016 was 4.6%, down from 5.2% in September 2015. The largest sector of employment in Tamarac continues to be in the education and health services sector with the retail and manufacturing industry following. Together these industries account for almost one-third of the employment in the City. The State of Florida does not have a state personal income tax and therefore, the State operates primarily using sales taxes. Local governments (cities, counties and school boards) rely primarily on property taxes and a limited array of permitted other taxes (sales, communication, gasoline, utilities services, etc.) and fees (franchise, building permits, occupational licenses, etc.) for their governmental activities. There are a limited number of state-shared revenues and recurring and non-recurring (one-time) grants from both the state and federal governments. For the business-type and certain governmental activities (building inspections, recreational programs, etc.) the user pays a related fee or charge associated with the service. It is anticipated that the housing market will soften with prices continuing to rise in 2016, but only to a more traditionally healthy level of 2-4% per year. Sales tax revenues are projected to increase 1-3% per year for the foreseeable future.
Total City Millage
Fiscal Year 2007 2008 2009 2010 2011 2012 2013 2014 2015 2016 2017Operating Millage 6.2224 5.0496 5.3215 5.9999 6.5000 6.6850 7.2899 7.2899 7.2899 7.2899 7.2899Debt Service Millage 0.1305 0.0630 0.0701 0.0802 0.0894 0.0924 0.1128 0.1086 0.1010 0.0952 0.0739Total Millage 6.3529 5.1126 5.3916 6.0801 6.5894 6.7774 7.4027 7.3985 7.3909 7.3851 7.3638
The operating millage for fiscal year 2016 was 7.2899 per thousand dollars of taxable value and the rate set for fiscal year 2017 remains 7.2899 per thousand dollars of taxable value. Although the millage rate is the same for 2016, revenues are expected to increase due to an increase in taxable value for 2017.

CITY OF TAMARAC, FLORIDA
MANAGEMENT’S DISCUSSION AND ANALYSIS SEPTEMBER 30, 2016
18
The City is considered to be built out due to its limited vacant land available for development. Taxable assessed value increased by 6% in calendar year 2015. The total taxable assessed property value in Tamarac was, $2,496,995,116, $2,445,879,756, $2,539,653,079, 2,726,451,547 and 2,905,190,535 in calendar years, 2011, 2012, 2013, 2014 and 2015 and for fiscal years 2012, 2013, 2014, 2015 and 2016, respectively. The total taxable assessed value from calendar year 2009 through calendar year 2015, and for fiscal year 2010 through fiscal year 2016, increased 16.3%. These assessed values were at its lowest at $2,445,879,756 in 2013 but has been on the rise since then. Property taxes are projected to be approximately the same on an annual basis with slight growth from new construction. Over the past two years the City has seen very small increases in growth, calendar year 2015 had growth of $2,418,590 which included the construction of the Sabal Palm North development. Currently the City is adding housing in the Sabal Palm South area; the growth is expected to continue over the next two years. In addition, the City has seen an uptick in development of commercial properties and expects that trend to continue over the next five years. Overall, the adopted budget is an economical and prudent financial plan that will ensure quality public services and needed capital improvements for both today and in the future. Fiscal year 2017 budgeted expenditures and transfers for the General Fund are expected to be $61.2 million, or 6.9 percent, more than fiscal year 2016. In developing the budget, the primary economic factors considered were revenue growth and the cost of providing existing services.
Contacting the City’s Financial Services Department
The City’s financial statements are designed to present users (citizens, taxpayers, customers, investors and creditors) with a general overview of the City’s finances and to demonstrate the City’s accountability. For questions concerning any information contained in this report or for additional financial information, contact the Financial Services Department, 7525 NW 88th Avenue, Tamarac, Florida 33321.


BASIC FINANCIAL STATEMENTS


Governmental Business-typeActivities Activities Total
ASSETSCash and equity in pooled cash 68,762,256$ 36,008,636$ 104,770,892$ Investments 13,016,900 11,543,644 24,560,544 Investment- real property 18,620,662 - 18,620,662 Accounts receivable - net 3,512,955 5,348,229 8,861,184 Intergovernmental receivable 1,266,184 175,925 1,442,109 Internal balances (688,082) 688,082 - Inventories 425,179 327,480 752,659 Prepaid expenses 236,461 15,241 251,702 Other assets 682 - 682 Restricted assets: Cash and equity in pooled cash and investments - 1,594,624 1,594,624 Capital assets not being depreciated: Land 16,747,485 10,332,812 27,080,297 Construction in progress 2,275,645 2,203,982 4,479,627 Intangibles 114,430 - 114,430 Public art 462,480 - 462,480 Capital assets (net of accumulated depreciation): Buildings and improvements 19,884,696 6,252,241 26,136,937 Improvements other than buildings 17,355,634 45,266,769 62,622,403 Equipment 4,730,325 3,023,726 7,754,051 Infrastructure 44,835,853 4,523,894 49,359,747 Total assets 211,559,745 127,305,285 338,865,030
DEFERRED OUTFLOWS OF RESOURCESDeferred outflows from pensions 15,056,560 2,465,068 17,521,628 Deferred charges on refunding 1,129,723 832,095 1,961,818
Total deferred outflows of resources 16,186,283 3,297,163 19,483,446
LIABILITIESAccounts payable and other accrued liabilities 1,030,243 1,906,289 2,936,532 Accrued payroll 1,239,968 210,878 1,450,846 Accrued interest payable 1,285,477 932,495 2,217,972 Customer deposits 641,588 1,630,879 2,272,467 Intergovernmental payable 62,056 45,369 107,425 Unearned revenue 1,139,706 - 1,139,706 Noncurrent liabilities: Due within one year 3,697,916 669,420 4,367,336 Due in more than one year 65,718,611 15,797,818 81,516,429 Total liabilities 74,815,565 21,193,148 96,008,713
DEFERRED INFLOWS OF RESOURCESDeferred inflows from pensions 9,598,534 871,101 10,469,635
NET POSITIONNet investment in capital assets 87,522,863 57,504,296 145,027,159 Restricted for:
Renewal and replacement - 6,013,402 6,013,402 Public safety 8,636,250 - 8,636,250 Transportation 811,374 - 811,374 Economic development 3,398,819 - 3,398,819 Capital improvement 1,678 - 1,678 Debt service 288,592 1,439,465 1,728,057
Unrestricted 42,672,353 43,581,036 86,253,389
Total net position 143,331,929$ 108,538,199$ 251,870,128$
The notes to the financial statements are an integral part of this statement.
CITY OF TAMARAC, FLORIDASTATEMENT OF NET POSITION
SEPTEMBER 30, 2016
19

Operating Capital Business-Charges for Grants and Grants and Governmental Type
Expenses Services Contribution Contribution Activities Activities TotalFunctions/programsPrimary government: Governmental activities: General government 15,110,128$ 7,109,741$ -$ -$ (8,000,387)$ -$ (8,000,387)$ Public safety 35,856,590 19,629,167 - 2,250,554 (13,976,869) - (13,976,869) Transportation 2,119,888 30,136 - 584,962 (1,504,790) - (1,504,790) Culture and recreation 5,724,133 1,161,688 - 194,172 (4,368,273) - (4,368,273) Physical environment 3,796,537 1,322,131 - - (2,474,406) - (2,474,406) Economic environment 958,415 - 773,398 - (185,017) - (185,017) Human services 301,177 - - - (301,177) - (301,177) Interest on long-term debt 1,207,785 - - - (1,207,785) - (1,207,785) Total governmental activities 65,074,653 29,252,863 773,398 3,029,688 (32,018,704) - (32,018,704)
Business-type activities:Utilities 21,576,295 26,332,665 - 571,614 - 5,327,984 5,327,984 Stormwater 5,115,091 5,636,718 - 150,000 - 671,627 671,627 Colony West 2,382,382 1,999,255 - - - (383,127) (383,127)
Total business activities 29,073,768 33,968,638 - 721,614 - 5,616,484 5,616,484
Total primary government 94,148,421$ 63,221,501$ 773,398$ 3,751,302$ (32,018,704) 5,616,484 (26,402,220)
General revenues:Taxes:
Property taxes, levied for general purpose 20,367,131 - 20,367,131 Property taxes, levied for debt service 266,402 - 266,402 Other taxes 9,769,866 - 9,769,866
Franchise fees 5,139,071 - 5,139,071 Intergovernmental not restricted to specific program 6,697,326 - 6,697,326 Investment income 464,576 163,715 628,291 Other income 606,485 - 606,485 Gain on disposal of capital assets 88,198 1,294 89,492
Transfers (750,305) 750,305 - Total general revenues 42,648,750 915,314 43,564,064
Change in net position 10,630,046 6,531,798 17,161,844 Net position, October 1 as restated (Note 3) 132,701,883 102,006,401 234,708,284
Net position, September 30 143,331,929$ 108,538,199$ 251,870,128$
The notes to the financial statements are an integral part of this statement.
Net (Expense) Revenue andChanges in Net PositionProgram Revenues
CITY OF TAMARAC, FLORIDASTATEMENT OF ACTIVITIES
FOR THE YEAR ENDED SEPTEMBER 30, 2016
20

Special Nonmajor Total
Revenue Governmental Governmental
General Fire Rescue Tamarac Village Funds Funds
ASSETS Cash and equity in pooled cash 30,332,382$ 7,603,277$ 467,454$ 25,278,370$ 63,681,483$
Investments 5,496,193 1,585,519 96,442 4,471,227 11,649,381
Investment- real property - - 18,620,662 - 18,620,662
Accounts receivable - net 1,400,309 1,460,896 - 639,557 3,500,762
Due from other governments 399,778 9,687 78,267 778,452 1,266,184
Other assets 682 - - - 682
Inventories 96,926 - - 328,253 425,179
Prepaid items 22,772 - - - 22,772
Total assets 37,749,042$ 10,659,379$ 19,262,825$ 31,495,859$ 99,167,105$
LIABILITIES AND FUND BALANCES
Liabilities:Accounts payable and other accrued liabilities 303,630$ 46,334$ 1,931$ 647,456$ 999,351$
Accrued payroll 405,815 627,571 - 102,778 1,136,164
Accrued principal and interest payable - 63,555 131,099 1,090,824 1,285,478
Due to other governmental units 8,361 - - 53,695 62,056
Escrow deposits 150,784 - - 490,804 641,588
Unearned revenue 494,405 - - 645,301 1,139,706
Total liabilities 1,362,995 737,460 133,030 3,030,858 5,264,343
DEFERRED INFLOWS OF RESOURCESUnavailable Revenues - 791,232 - - 791,232
Total deferred inflows of resources - 791,232 - - 791,232
Fund Balances:Non spendable:
Inventories and prepayments 119,698 - - 328,253 447,951
Long-term receivable - - - 563,051 563,051
Investment- real property - - 18,620,662 - 18,620,662
Restricted for:
Public safety 10,741 5,698,068 - 2,927,441 8,636,250
Transportation - - - 811,374 811,374
Debt service - - - 288,592 288,592
Economic development - - - 2,507,515 2,507,515
Capital projects - - - 2,428,461 2,428,461
Committed for:
Economic development 325,447 - - - 325,447
Public safety - 3,949 - - 3,949
Capital projects - - - 4,672,116 4,672,116
Assigned:
Capital projects 3,500,000 - - 11,826,607 15,326,607
Public Safety - 3,428,670 - - 3,428,670
Economic development 500,000 - 509,133 2,111,591 3,120,724
Disaster reserve 1,000,000 - - - 1,000,000
Subsequent year's budget: appropriation of fund balance 5,336,332 - - - 5,336,332
Unassigned: 25,593,829 - - - 25,593,829
Total fund balances 36,386,047 9,130,687 19,129,795 28,465,001 93,111,530
Total liabilities, deferred inflows of resources and fund balances
37,749,042$ 10,659,379$ 19,262,825$ 31,495,859$ 99,167,105$
The notes to the financial statements are an integral part of this statement.
CITY OF TAMARAC, FLORIDABALANCE SHEET
SEPTEMBER 30, 2016GOVERNMENTAL FUNDS
Major Funds
21

Fund balances - total government funds (page 21) 93,111,530$
Amounts reported for governmental activities in the statementof net position are different because:
Capital assets used in governmental activities are notfinancial resources and therefore are not reported in thegovernmental funds.
Governmental capital assets 157,116,324 Less accumulated depreciation (50,709,776)
Other long-term assets are not available to pay for current period expenditures and are therefore 791,232
are reported as unavailable revenue in the funds.
Net pension assets/obligations resulting from overfunding/underfunding of the police, fire, non-represented and general employees pension plans are not reported in the funds as they are due and payable in the current period and are thereforenot reported in the governmental funds.
Net pension liability (23,584,394)
Other long-term liabilities, including bonds payable, are not due andpayable in the current period and therefore are not reported inthe governmental funds.
Governmental bonds payable (39,895,834) Parking lot remediation (260,800) (40,156,634)
Deferred inflows of resources related to pensions (9,442,560)
Deferred outflows of resources related to pensions 14,706,646 OPEB Obligations attributable to retiree benefits financed from governmental fund types (1,197,359) Deferred charges on refunding 1,129,723 Compensated absences (2,881,215)
Internal service fund is used by management to charge the costs of certain activities to individual funds. The assets and liabilities of the internal service funds are included in governmental activities in the statement of net position 4,448,412
Net position of governmental activities (page 19) 143,331,929$
The notes to the financial statements are an integral part of this statement.
SEPTEMBER 30, 2016
CITY OF TAMARAC, FLORIDARECONCILIATION OF THE BALANCE SHEET TO THE STATEMENT OF NET POSITION
GOVERNMENTAL FUNDS
22

Special Nonmajor TotalRevenue Governmental Governmental
General Fire Rescue Tamarac Village Funds FundsREVENUES:
Taxes:Property 20,367,131$ -$ -$ 266,402$ 20,633,533$ Other taxes 8,653,942 - - 1,115,924 9,769,866
Franchise fees 5,139,071 - - - 5,139,071 Charges for services 2,124,259 1,611,302 - 283,846 4,019,407 Payment in lieu of taxes 1,863,417 - - - 1,863,417 Intergovernmental 6,569,196 66,923 - 3,855,858 10,491,977 Licenses and permits 750,564 - - 2,890,341 3,640,905 Fines and forfeitures 1,568,814 - - 274,586 1,843,400 Investment income 125,099 41,148 212,653 85,676 464,576 Donations from private resources - - - 25,548 25,548 Program repayment - - - 9,349 9,349 Other 8,496,531 1,091 69,532 625,444 9,192,598 Special assessments 5,509 11,726,066 - - 11,731,575
Total revenues 55,663,533 13,446,530 282,185 9,432,974 78,825,222
EXPENDITURES:Current:
General government 12,137,825 - 109,245 25,000 12,272,070 Public safety 17,091,419 18,686,826 - 2,735,420 38,513,665 Transportation 1,281,758 - - 35,568 1,317,326 Culture and recreation 4,312,181 - - 123,851 4,436,032 Physical environment 3,852,982 - - 110,741 3,963,723 Economic environment 401,253 - - 562,631 963,884 Human services 293,064 - - 15,123 308,187
Debt service:Principal retirement - 389,363 - 1,991,328 2,380,691 Interest and fiscal charges - 21,591 276,609 790,150 1,088,350
Capital outlay 218,832 2,061,393 - 5,754,583 8,034,808
Total expenditures 39,589,314 21,159,173 385,854 12,144,395 73,278,736
Excess (deficiency) of revenues over (under) expenditures 16,074,219 (7,712,643) (103,669) (2,711,421) 5,546,486
Other financing sources (uses):Capital lease - 555,824 - - 555,824
Transfers in - 5,977,733 779,775 9,559,401 16,316,909
Transfers out (13,279,358) (817,720) - (2,970,136) (17,067,214)
Total other financing sources (uses) (13,279,358) 5,715,837 779,775 6,589,265 (194,481)
Net change in fund balances 2,794,861 (1,996,806) 676,106 3,877,844 5,352,005
Fund balances - beginning, as restated (Note 3) 33,591,186 11,127,493 18,453,689 24,587,157 87,759,525
Fund balances - ending 36,386,047$ 9,130,687$ 19,129,795$ 28,465,001$ 93,111,530$
The notes to the financial statements are an integral part of this statement.
Major Funds
CITY OF TAMARAC, FLORIDASTATEMENT OF REVENUES, EXPENDITURES, AND CHANGES IN FUND BALANCES
GOVERNMENTAL FUNDSFOR THE YEAR ENDED SEPTEMBER 30, 2016
23

Amounts reported for governmental activities in the statementof activities are different because:
Net change in fund balances - total government funds (page 23) 5,352,005$
Governmental funds report capital outlays as expenditures,however, in the statement of activities, the cost of those assetsis depreciated over their estimated useful lives.
Expenditures for capital outlays 5,846,783$ Less current year depreciation (4,312,065) 1,534,718
The effect of various miscellaneous transactions involving capital assets
is to decrease net position (23,659)
Revenues that are earned but received within the City's availability period are recognized in thestatement of activities when earned and subsequently in the governmental fund financialstatements when they become available. The net difference is recorded as a reconciling itemNet effect of timing of revenue recognition for:
Ambulance transport fees 791,232
Issuance of long term debt (e.g. bonds, capital leases) provide current financial resources togovernmental funds, but issuing debt increases long-term liabilities in the statement of net position.Repayment of bond principal is an expenditure in the governmental funds,but the repayment reduces long-term liabilities in the statement of net position.
Bonds, note and leasesPrincipal repayments 2,380,691 Capital lease financing proceeds (555,824)
Some expenses reported in the statement of activities do not require the use of current financialresources and therefore are not reported as expenditures in governmental funds.
Compensated absences (8,594) Amortization of bond premium 111,036 Amortization of deferred charges on refunding (119,435) (16,993)
The net effect of pension and retirement contributions expense is to increase net position. 1,088,659
Contributions to retiree benefits do not use current financial resources and are not recordedin full as expenditures in the governmental funds, however these disbursements increase the net OPEBobligations in the statement of activities. (170,835)
Internal service funds are used by management to charge the costs of certain activities to individual funds. The net revenue of certain activitiesin the internal service fund is reported with governmental activities. 250,052
Change in net position of governmental activities (page 20) 10,630,046$
The notes to the financial statements are an integral part of this statement.
FOR THE YEAR ENDED SEPTEMBER 30, 2016
CITY OF TAMARAC, FLORIDARECONCILIATION OF THE STATEMENT OF REVENUES, EXPENDITURES, AND CHANGES IN FUND BALANCES OF
GOVERNMENTAL FUNDS TO THE STATEMENT OF ACTIVITIES
24

Governmental
Activities
Non Major Internal
Utilities Stormwater Enterprise Fund Total Service Funds
ASSETS
Current assets:
Cash and equity in pooled cash 24,345,540$ 10,998,032$ 665,064$ 36,008,636$ 5,080,773$
Investments 8,112,955 3,270,154 160,535 11,543,644 1,367,519
Intergovernmental receivable 25,925 150,000 - 175,925 -
Accounts receivable - net 4,786,430 561,799 - 5,348,229 12,192
Inventories 289,199 4,845 33,436 327,480 -
Prepaid expenses 5,418 - 9,823 15,241 213,689
Total current assets 37,565,467 14,984,830 868,858 53,419,155 6,674,173
Non-current assets:
Restricted assets:
Cash and equity in pooled cash and investments 1,586,864 7,760 - 1,594,624 -
Capital assets:
Land 7,415,829 87,929 2,829,054 10,332,812 -
Buildings and improvements 7,334,209 1,480,000 678,693 9,492,902 -
Improvements other than building 107,466,150 3,648,925 240,037 111,355,112 -
Equipment 5,111,236 2,390,961 1,008,511 8,510,708 15,766
Infrastructure 58,974 31,185,187 - 31,244,161 -
Construction in progress 1,353,586 808,949 41,447 2,203,982 -
Total capital assets 128,739,984 39,601,951 4,797,742 173,139,677 15,766
Less accumulated depreciation (70,506,790) (30,248,158) (781,305) (101,536,253) (15,766)
Total capital assets - net 58,233,194 9,353,793 4,016,437 71,603,424 -
Total non-current assets 59,820,058 9,361,553 4,016,437 73,198,048 -
Total assets 97,385,525 24,346,383 4,885,295 126,617,203 6,674,173
DEFERRED OUTFLOWS OF RESOURCES
Deferred outflows from pensions 1,785,430 679,638 - 2,465,068 349,914
Deferred charges on refunding 645,774 186,321 - 832,095 -
Total deferred outflows of resources 2,431,204 865,959 - 3,297,163 349,914
LIABILITIES
Current liabilities:
Accounts payable and other accrued liabilities 1,465,962 342,170 98,157 1,906,289 30,890
Accrued payroll 161,742 49,136 - 210,878 103,804
Accrued interest payable 597,009 335,486 - 932,495 -
Intergovernmental payable 45,369 - - 45,369 -
Claims payable - - - - 1,326,725
Bonds payable 310,000 285,000 - 595,000 - Customer deposits 1,586,864 7,760 36,255 1,630,879 - Compensated absences 55,429 18,991 - 74,420 7,124
Total current liabilities 4,222,375 1,038,543 134,412 5,395,330 1,468,543
Non-current liabilities:
Bonds payable 11,598,662 2,295,004 - 13,893,666 -
Net Pension liability 643,132 282,331 - 925,463 186,083
Net OPEB obligations 254,194 54,708 - 308,902 12,878
Compensated absences 498,865 170,922 - 669,787 64,115
Total noncurrent liabilities 12,994,853 2,802,965 - 15,797,818 263,076
Total liabilities 17,217,228 3,841,508 134,412 21,193,148 1,731,619
DEFERRED INFLOWS OF RESOURCES
Deferred inflows from pensions 630,696 240,405 - 871,101 155,974
630,696 240,405 - 871,101 155,974
NET POSITION
Net investment in capital assets 46,580,179 6,911,355 4,012,762 57,504,296 -
Restricted for:
Renewal and replacement 5,896,669 116,733 - 6,013,402 -
Debt service 896,953 542,512 - 1,439,465 -
Unrestricted 28,595,004 13,559,829 738,121 42,892,954 5,136,494
Total net position 81,968,805$ 21,130,429$ 4,750,883$ 107,850,117 5,136,494$
Explanation of difference between proprietary funds statement of
net position and the statement of net position:
Internal service fund is used by management to charge the costs of certain
activities, such as insurance, to individual funds. The portion attributable
to business-type activities is reflected here and the residual assets and
liabilities of the internal service fund are included in the governmental
activities in the statement of net position. 688,082
108,538,199$
The notes to the financial statements are an integral part of this statement.
Major Funds
Business-type Activities - Enterprise Funds
CITY OF TAMARAC, FLORIDASTATEMENT OF NET POSITION
PROPRIETARY FUNDS
SEPTEMBER 30, 2016
25
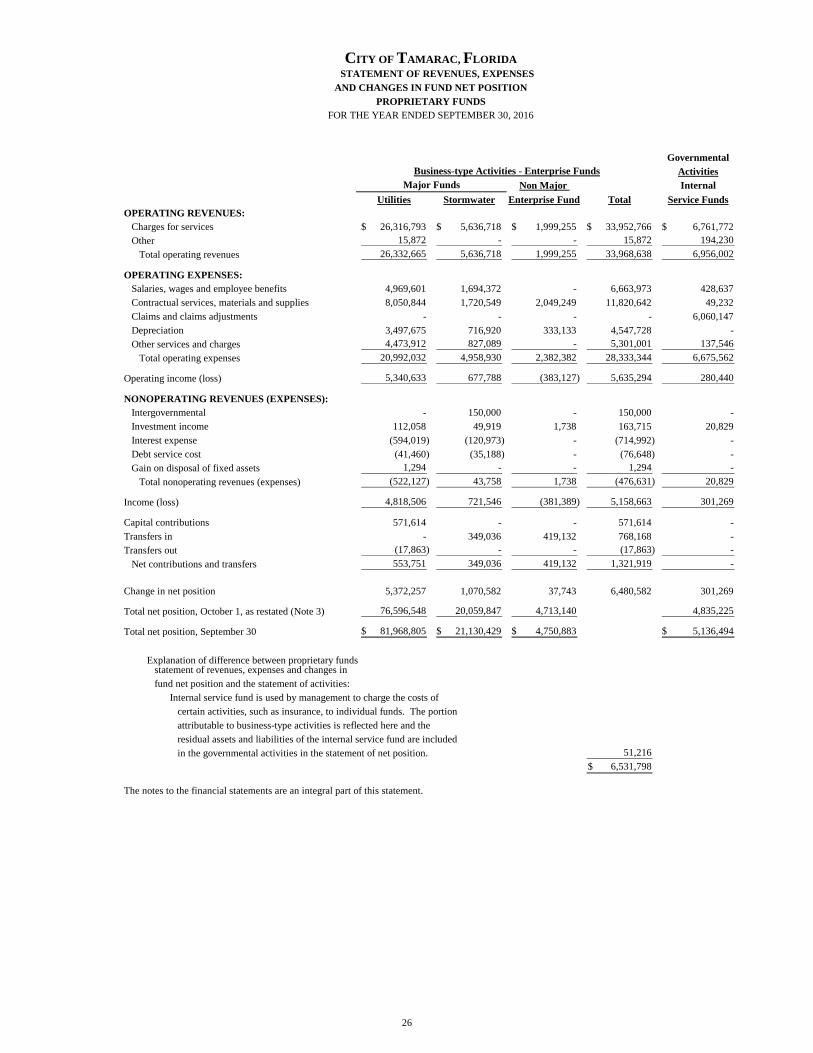
GovernmentalActivities
Non Major Internal
Utilities Stormwater Enterprise Fund Total Service FundsOPERATING REVENUES: Charges for services 26,316,793$ 5,636,718$ 1,999,255$ 33,952,766$ 6,761,772$ Other 15,872 - - 15,872 194,230
Total operating revenues 26,332,665 5,636,718 1,999,255 33,968,638 6,956,002
OPERATING EXPENSES: Salaries, wages and employee benefits 4,969,601 1,694,372 - 6,663,973 428,637 Contractual services, materials and supplies 8,050,844 1,720,549 2,049,249 11,820,642 49,232 Claims and claims adjustments - - - - 6,060,147 Depreciation 3,497,675 716,920 333,133 4,547,728 - Other services and charges 4,473,912 827,089 - 5,301,001 137,546
Total operating expenses 20,992,032 4,958,930 2,382,382 28,333,344 6,675,562
Operating income (loss) 5,340,633 677,788 (383,127) 5,635,294 280,440
NONOPERATING REVENUES (EXPENSES): Intergovernmental - 150,000 - 150,000 - Investment income 112,058 49,919 1,738 163,715 20,829 Interest expense (594,019) (120,973) - (714,992) - Debt service cost (41,460) (35,188) - (76,648) - Gain on disposal of fixed assets 1,294 - - 1,294 -
Total nonoperating revenues (expenses) (522,127) 43,758 1,738 (476,631) 20,829
Income (loss) 4,818,506 721,546 (381,389) 5,158,663 301,269
Capital contributions 571,614 - - 571,614 - Transfers in - 349,036 419,132 768,168 - Transfers out (17,863) - - (17,863) -
Net contributions and transfers 553,751 349,036 419,132 1,321,919 -
Change in net position 5,372,257 1,070,582 37,743 6,480,582 301,269
Total net position, October 1, as restated (Note 3) 76,596,548 20,059,847 4,713,140 4,835,225
Total net position, September 30 81,968,805$ 21,130,429$ 4,750,883$ 5,136,494$
Explanation of difference between proprietary funds statement of revenues, expenses and changes infund net position and the statement of activities:
Internal service fund is used by management to charge the costs of certain activities, such as insurance, to individual funds. The portionattributable to business-type activities is reflected here and the residual assets and liabilities of the internal service fund are includedin the governmental activities in the statement of net position. 51,216
6,531,798$
The notes to the financial statements are an integral part of this statement.
Major Funds
CITY OF TAMARAC, FLORIDA
Business-type Activities - Enterprise Funds
FOR THE YEAR ENDED SEPTEMBER 30, 2016
STATEMENT OF REVENUES, EXPENSESAND CHANGES IN FUND NET POSITION
PROPRIETARY FUNDS
26

Governmental
ActivitiesNon Major Internal
Utilities Stormwater Enterprise Fund Total Service FundsCash flows from operating activities: Cash received from customers (including other funds) 26,372,538$ 5,538,039$ 2,019,631$ 33,930,208$ 6,955,495$ Payments to suppliers (9,219,889) (1,425,078) (1,992,577) (12,637,544) (232,419) Cash paid on claims - - - - (6,335,139) Payments to employees (5,026,880) (1,659,158) - (6,686,038) (445,934) Interfund service payments (2,952,251) (828,689) - (3,780,940) (137,546)
Net cash provided by (used in) operating activities 9,173,518 1,625,114 27,054 10,825,686 (195,543)
Cash flows from noncapital financing activities: Transfers in - 349,036 419,132 768,168 - Transfers out (17,863) - - (17,863) -
Intergovernmental - 150,000 - 150,000 -
Net cash provided by (used in) by noncapital financing activities (17,863) 499,036 419,132 900,305 -
Cash flows from capital and related financing activities: Acquisition and construction of capital assets (5,122,668) (1,131,927) (37,072) (6,291,667) - Proceeds from sale of capital assets 1,294 - - 1,294 - Principal paid on long-term debt (287,893) (266,429) - (554,322) - Interest paid (597,539) (125,043) - (722,582) -
Net cash used in capital and related financing activities (6,006,806) (1,523,399) (37,072) (7,567,277) -
Cash flows from investing activities:
Proceeds from sales and maturities of investments 3,212,356 1,485,946 69,299 4,767,600 1,130,508 Purchases of investments (1,337,890) (618,871) (166,390) (2,123,150) (470,839)
Interest income 112,058 49,919 1,738 163,715 20,829
Net cash provided by (used) in investing activities 1,986,524 916,994 (95,353) 2,808,165 680,498
Net increase (decrease) in cash and cash equivalents 5,135,373 1,517,745 313,761 6,966,879 484,955
Cash and cash equivalents at beginning of year 20,797,031 9,488,047 351,303 30,636,381 4,595,818
Cash and cash equivalents at end of year 25,932,404$ 11,005,792$ 665,064$ 37,603,260$ 5,080,773$
Pooled cash and cash equivalents per statement of net assets: Unrestricted 24,345,540$ 10,998,032$ 665,064$ 36,008,636$ 5,080,773$ Restricted 1,586,864 7,760 - 1,594,624 -
Total 25,932,404$ 11,005,792$ 665,064$ 37,603,260$ 5,080,773$
Reconciliation of operating income (loss) to net
cash provided by (used in) operating activities:
Operating income (loss) 5,340,633$ 677,788$ (383,127)$ 5,635,294$ 280,440$ Adjustments to reconcile operating income (loss) to net cash provided by (used in) operating activities:
Depreciation 3,497,675 716,920 333,133 4,547,728 - Change in assets and liabilities:
Increase (decrease) in accounts receivable (52,817) 51,321 - (1,496) (507) Increase (decrease) in due from other governments - (150,000) - (150,000) - (Increase) decrease in inventories (16,347) - 19,042 2,695 - (Increase) decrease in prepayments (4,918) - 27 (4,891) (213,689) Increase in accounts payable 377,505 296,902 37,603 712,010 29,865 Increase (decrease) in accrued liabilities (22,178) 1,211 - (20,967) (20,889) Increase in due to other government 6,997 - - 6,997 - Increase (decrease) in compensated absences (66,271) 20,816 - (45,455) 1,794 Increase in OPEB obligation 31,170 13,187 - 44,357 1,798 Decrease in estimated insurance claims payable - - - - (274,992)
Increase (decrease) in customer deposits 92,690 - 20,376 113,066 -
Increase (decrease) in net pension liability and related amounts (10,621) (3,031) - (13,652) 637 Total adjustments 3,832,885 947,326 410,181 5,190,392 (475,983) Net cash provided by (used in) operating activities 9,173,518$ 1,625,114$ 27,054$ 10,825,686$ (195,543)$
Non-cash investing, capital and financing activities:
Capital Contibutions 142,709$ -$ -$ 142,709$ -$
Decrease in fair value of investments (43,075)$ (21,546)$ (242)$ (64,863)$ (4,178)$
The notes to the financial statements are an integral part of this statement.
Major Funds
CITY OF TAMARAC, FLORIDA
Business-type Activities - Enterprise Funds
STATEMENT OF CASH FLOWS
PROPRIETARY FUNDS
FOR THE YEAR ENDED SEPTEMBER 30, 2016
27

Pension
Trust Agency
Funds Funds
ASSETS
Cash and cash equivalents 9,026,302$ 1,823,630$
Receivables:
Interest and dividend receivables 11,047 -
Accounts receivables - 740,078
Contributions receivable 27,372 - Total receivables 38,419 740,078
Investments, at fair value :
Common stock 66,142,442
Government securities 13,637,325
Corporate bonds 12,812,354
Limited liability partnership 3,970,153
Mutual funds 69,940,189 166,502,463 -
Total assets 175,567,184 2,563,708
LIABILITIES
Accounts payable 35,197 2,563,708
Total liabilities 35,197 2,563,708$
Net position restricted for pension and other purposes 175,531,987$
Pension
Trust
Funds
ADDITIONS
Contributions:
Employer 7,844,941$
Employee 2,114,532
State 1,093,371
Total contributions 11,052,844
Investment income:
Net appreciation in fair value of investments 10,536,146
Interest and dividends 2,933,582
Total investment gain 13,469,728
Less investment expenses (728,062)
Net investment gain 12,741,666
Total additions 23,794,510
DEDUCTIONS
Benefits paid and refunds 8,485,251
Administrative expenses 174,310
Total deductions 8,659,561
Change in net position 15,134,949
Net position, October1 160,397,038
Net position, September 30 175,531,987$
The notes to the financial statements are an integral part of this statement.
FIDUCIARY FUNDS
FOR THE YEAR ENDED SEPTEMBER 30, 2016
CITY OF TAMARAC, FLORIDASTATEMENT OF FIDUCIARY NET POSITION
FIDUCIARY FUNDS
September 30, 2016
CITY OF TAMARAC, FLORIDASTATEMENT OF CHANGES IN FIDUCIARY NET POSITION
28

NOTES TO THE FINANCIAL STATEMENTS


Variance withFinal Budget
Actual Amounts PositiveOriginal Final Budgetary Basis (Negative)
Revenues:Taxes 33,362,547$ 33,362,547$ 34,160,144$ 797,597$ Charges for services 1,577,674 1,577,674 2,124,259 546,585 Payment in lieu of taxes 1,901,877 1,863,417 1,863,417 - Intergovernmental 6,240,795 6,240,795 6,569,196 328,401 Licenses and permits 767,144 767,144 750,564 (16,580) Fines and forfeitures 2,103,737 2,103,737 1,568,814 (534,923) Investment income 176,400 176,400 125,099 (51,301) Miscellaneous 11,117,498 11,220,900 8,502,040 (2,718,860)
Total revenues 57,247,672 57,312,614 55,663,533 (1,649,081)
Expenditures:Commission 631,075 631,075 610,295 20,780 City manager 1,770,882 1,811,799 1,522,444 289,355 City attorney 590,580 591,080 568,313 22,767 City clerk 550,742 550,742 505,530 45,212 Human resources 1,276,360 1,277,801 1,154,762 123,039 Finance 2,823,255 2,823,255 2,601,174 222,081 Information technology 2,478,368 2,550,851 1,897,043 653,808 Public works 7,631,688 7,705,758 7,135,312 570,446 Parks and recreation 4,718,824 4,756,247 4,569,067 187,180 Police 14,803,897 14,803,897 14,313,649 490,248 Community development 1,780,365 1,843,475 1,655,322 188,153 Red light camera 1,507,587 1,507,587 966,143 541,444 Non-departmental 3,404,691 3,179,689 2,090,260 1,089,429
Total expenditures 43,968,314 44,033,256 39,589,314 4,443,942
Excess of revenues over expenditures 13,279,358 13,279,358 16,074,219 2,794,861
Other financing sources (uses):Transfers out (13,279,358) (13,279,358) (13,279,358) -
Total other financing uses (13,279,358) (13,279,358) (13,279,358) -
Net change in fund balance -$ -$ 2,794,861 2,794,861$
Budgetary fund balances, October 1 33,591,186
Budgetary fund balances, September 30 36,386,047$
See notes to required supplementary information.
CITY OF TAMARAC, FLORIDABUDGETARY COMPARISON SCHEDULE
GENERAL FUND
FISCAL YEAR ENDED SEPTEMBER 30, 2016
Budgeted Amounts
88

Variance withFinal Budget
Actual Amounts PositiveOriginal Final Budgetary Basis (Negative)
Revenues:Charges for services 2,188,856$ 2,188,856$ 1,611,302$ (577,554)$ Intergovernmental 49,000 49,000 66,923 17,923 Fire rescue assessment 11,601,000 11,601,000 11,726,066 125,066 Investment income 31,480 31,480 41,148 9,668 Miscellaneous 1,468,860 2,368,736 1,091 (2,367,645)
Total revenues 15,339,196 16,239,072 13,446,530 (2,792,542)
Expenditures:Current:
Public safety 19,260,726 19,301,389 18,686,826 614,563 Debt service:
Principal retirement 391,158 391,158 389,363 1,795 Interest and fiscal charges 21,215 21,215 21,591 (376)
Capital outlay 2,196,399 2,241,147 2,061,393 179,754
Total expenditures 21,869,498 21,954,909 21,159,173 795,736
Deficiency of revenues under expenditures (6,530,302) (5,715,837) (7,712,643) (1,996,806)
Other financing sources (uses):Issuance of debt 555,824 555,824 555,824 - Transfers in 5,977,733 5,977,733 5,977,733 - Transfers out (3,255) (817,720) (817,720) -
Total other financing sources 6,530,302 5,715,837 5,715,837 -
Net change in fund balance -$ -$ (1,996,806) (1,996,806)$
Budgetary fund balances, October 1 11,127,493
Budgetary fund balances, September 30 9,130,687$
See notes to required supplementary information.
CITY OF TAMARAC, FLORIDABUDGETARY COMPARISON SCHEDULEFIRE RESCUE SPECIAL REVENUE FUNDFISCAL YEAR ENDED SEPTEMBER 30, 2016
Budgeted Amounts
89

CITY OF TAMARAC, FLORIDA
NOTES TO THE FINANCIAL STATEMENTS SEPTEMBER 30, 2016
29
NOTE 1. ORGANIZATION AND SUMMARY OF SIGNIFICANT ACCOUNTING POLICIES A. Organization The City of Tamarac, Florida (the “City”) was incorporated in 1963 and is a political subdivision of the State of Florida located in northwestern Broward County. The City operates under a Commission-Manager form of government, with the legislative function being vested in a five-member commission. The City Commission is governed by the City Charter and by state and local laws and regulations. The City Commission is responsible for establishment and adoption of policy. The City provides the following range of municipal services authorized by its charter: public safety (Police and Fire), highways and streets, sanitation, health and social services, culture, recreation, bus transportation, planning and zoning, water and sewer, stormwater utility services and general administrative services. The accounting policies of the City conform to Generally Accepted Accounting Principles in the United States of America (GAAP) as applicable to governments. The Governmental Accounting Standards Board (GASB) is the standard-setting body for governmental accounting and financial reporting. B. The Reporting Entity The financial statements were prepared in accordance with GASB Statement No. 14, The Financial Reporting Entity, as amended by GASB Statement No. 39 and 61, which establishes standards for defining and reporting on the financial reporting entity. The definition of the financial reporting entity is based upon the concept that elected officials are accountable to their constituents for their actions. One of the objectives of financial reporting is to provide users of financial statements with a basis for assessing the accountability of the elected officials. The financial reporting entity consists of the primary government, organizations for which the primary government is financially accountable and other organizations for which the nature and significance of their relationship with the primary government are such that exclusion would cause the reporting entity’s financial statements to be misleading or incomplete. The City is financially accountable for a component unit if it appoints a voting majority of the organization’s governing board and it is able to impose its will on that organization or there is a potential for the organization to provide specific financial benefits to, or impose specific financial burdens on the City. Based on these criteria, there were no organizations which met the criteria described above. C. Government-wide and Fund Financial Statements The government-wide financial statements (i.e., the statement of net position and the statement of activities) report information on all of the non-fiduciary activities of the primary government. The effect of interfund activity has been removed from these statements. Governmental activities, which normally are supported by taxes and intergovernmental revenues, are reported separately from business-type activities, which rely to a significant extent on fees and charges for support. The statement of activities demonstrates the degree to which the direct expenses of a given function or segment are offset by program revenues. Direct expenses are those that are clearly identifiable with a specific function or segment. Program revenues include 1) charges to customers or applicants who purchase, use, or directly benefit from goods, services, or privileges provided by a given function or segment and 2) grants and contributions that are restricted to meeting the operational or capital requirements of a particular function or segment. Taxes and other items not properly included among program revenues are reported instead as general revenues. Separate financial statements are provided for governmental funds, proprietary funds, and fiduciary funds, even though the latter are excluded from the government-wide financial statements. Major individual governmental funds and major individual enterprise funds are reported as separate columns in the fund financial statements.

CITY OF TAMARAC, FLORIDA
NOTES TO THE FINANCIAL STATEMENTS SEPTEMBER 30, 2016
30
D. Measurement Focus, Basis of Accounting, and Financial Statement Presentation The government-wide financial statements are reported using the economic resources measurement focus and the accrual basis of accounting, as are the proprietary fund and fiduciary fund financial statements. Revenues are recorded when earned and expenses are recorded when a liability is incurred, regardless of the timing of related cash flows. Property taxes are recognized as revenues in the year for which they are levied. Grants and similar items are recognized as revenue as soon as all eligibility requirements imposed by the provider have been met. Governmental fund financial statements are reported using the current financial resources measurement focus and the modified accrual basis of accounting. Revenues are recognized as soon as they are both measurable and available. Revenues are considered to be available when they are collectible within the current period or soon enough thereafter to pay liabilities of the current period. For this purpose, the City considers revenues to be available if they are collected within 60 days. Expenditure-driven grants are recognized as revenue when the qualifying expenditure has been incurred and all other eligibility requirements have been met, and the amount is received during the period or within the availability period of the revenue source (within nine (9) months of year-end). All other revenue items are considered to be measurable only when cash is received by the government. Expenditures generally are recorded when a liability is incurred, as under accrual accounting. However, debt service expenditures, as well as expenditures related to compensated absences, pension costs, other post-employment benefits and claims and judgments, are recorded only when payment is made. Property taxes, sales taxes, utility taxes, franchise fees, licenses, intergovernmental revenues and interest associated with the current fiscal period are all considered to be susceptible to accrual and so have been recognized as revenues of the current fiscal period. Only the portion of special assessments receivable due within the current fiscal period are considered to be susceptible to accrual as revenue of the current period. All other revenue items are considered to be measurable and available only when cash is received by the government. Accounting principles generally accepted in the United States of America set forth minimum criteria (percentage of the assets, deferred outflows, liabilities, deferred inflows, revenue, or expenditures/expenses of the applicable fund category and the governmental and enterprise combined) for the determination of major funds. The nonmajor funds are presented in one column in the respective fund financial statements. The City reports the following major governmental funds:
The General Fund is the City's primary operating fund. It accounts for all financial resources of the general government, except those required to be accounted for in another fund. The Fire Rescue Special Revenue Fund accounts for revenue sources that are legally restricted for fire rescue purposes, including but not limited to Fire Rescue Assessments, EMS fees, transfers from General Fund and other miscellaneous revenues.
The Tamarac Village Fund accounts for the proceeds from the 2016 Line of Credit used for various Land Acquisition projects related to the Tamarac Village Project.
CITY OF TAMARAC, FLORIDA
NOTES TO THE FINANCIAL STATEMENTS SEPTEMBER 30, 2016
31
The City reports the following major proprietary funds:
The Utilities Fund is used to account for the provision of water and sewer services both internal and external to the City. The Stormwater Management Fund is used to account for the provision of stormwater maintenance and capital improvements within the City.
The City reports the following nonmajor proprietary funds:
The Golf Course Fund is used to account for services provided by the Colony West Golf Club.
Additionally, the government reports the following fund types:
Debt Service Funds account for resources accumulated and payments made for principal and interest on long-term debt, other than bonds which are payable from proprietary funds. Special Revenue Funds account for resources that are legally restricted to expenditures for specific purposes. Capital Project Funds account for the construction of major capital improvements other than those financed by the proprietary funds. Internal Service Funds are used to account for the financing of insurance services provided to other funds of the City on a cost reimbursement basis.
Pension Trust Funds include General Employee’s Pension Fund, Police Officers’ Pension Fund, Firefighters’ Pension Fund, Elected and Appointed and Non-Represented Employees' Pension Fund, which all account for the accumulation of resources to be used for retirement benefit payments to the City’s employees, Elected Officials, Police Officers and Firefighters. Agency Fund is used to account for the City’s collection of the Solid Waste Fees on behalf of Waste Management Inc.; these fees are remitted to Waste Management Inc. and Wheelabrator Inc. (Tipping fees) net of the City’s Franchise Fee revenue.
As a general rule, the effect of interfund activity has been eliminated from the government-wide financial statements. Exceptions to this general rule are payments-in-lieu of taxes and interfund service payments between the City's utilities function and various other functions of the City. Elimination of these charges would distort the direct costs and program revenues reported for the various functions concerned. Amounts reported as program revenues include 1) charges to customers or applicants for goods, services, or privileges provided, 2) operating grants and contributions, and 3) capital grants and contributions, including special assessments. Internally dedicated resources are reported as general revenues rather than as program revenues. Likewise, general revenues include all taxes, whose purpose has not been restricted to a specific program.

CITY OF TAMARAC, FLORIDA
NOTES TO THE FINANCIAL STATEMENTS SEPTEMBER 30, 2016
32
Proprietary funds distinguish operating revenues and expenses from nonoperating items. Operating revenues and expenses generally result from providing services and producing and delivering goods in connection with a proprietary fund's principal ongoing operations. The principal operating revenues of the City’s utilities, stormwater and golf course enterprise funds are charges to customers for services. Operating expenses for enterprise funds and internal service funds include the cost of services, administrative expenses, and depreciation on capital assets. All revenues and expenses not meeting this definition are reported as non-operating revenues and expenses. When both restricted and unrestricted resources are available for use, it is the City's policy to use restricted resources first to the extent possible, then unrestricted resources as necessary. E. Assets, Liabilities, Deferred Outflows/Inflows of Resources and Net Position 1. Cash, Cash Equivalents and Investments Cash and cash equivalents includes cash on hand, investments with the State Board of Administration (SBA) and Florida Surplus Asset Fund Trust (FLSAFE) investment pools (Securities and Exchange Commission Rule 2A-7 Pool) and investments with a maturity of three months or less. Resources of all funds, with the exception of the pension trust funds, and certain other cash and investment accounts, have been combined into a pooled cash and investment system for the purpose of maximizing earnings. Interest earned on pooled cash and investments is allocated monthly based upon equity balances of the respective funds. Each funds’ equity in pooled investments is calculated based on the funds’ pro rata share of equity in pooled cash. The Financial Services Director of the City of Tamarac is a member of the FLSAFE Board of Trustees. The SBA was created by section 218.405, Florida Statutes and FLSAFE was created pursuant to Florida Statute 163.01 and 218.415. The investment pools operate under investment guidelines established by Section 215.47, Florida Statutes and are reported at net asset value. For the purpose of the statement of cash flows for the proprietary fund types, cash and cash equivalents mean short term, highly liquid investments with an original maturity of three months or less. In accordance with GASB Statement No. 31 “Accounting and Financial Reporting for Certain Investments and for External Investment Pools”, all investments are reported at fair value. Fair value is determined by quoted market prices. The fair value of the investment pool is its position in the pool which is the same as the value of the pool shares. Income, including the change in fair value, from investments held by the individual funds is recorded in the respective fund as it is earned. All other investments owned by the City are accounted for in pooled cash and investment accounts. Income earned from this pooling of investments is allocated monthly to the respective funds based upon average daily balances. 2. Investments The City’s investments are reported at fair value which is the amount a financial instrument could be exchanged for in a current transaction between willing parties at the measurement date. Generally, these are quoted market prices. Investments, including restricted investments, consist of mutual funds, U.S. Government securities, corporate debt and equity securities, mortgage-backed securities, asset-backed securities and securities of governmental agencies unconditionally guaranteed by the U.S. Government. Investments with Local Government Investment Pools (LIGP) are recorded at net asset value (NAV) per share. This method of determining fair value uses member units to which a proportionate share of net asset is attributed. Investment are categorized according to fair value, the hierarchy is based on the valuation input used to measure the fair value of the asset with Level 1 assets being those where quoted prices in an active market for identical assets can be readily obtained, Level 2 assets valued using a matrix pricing technique of quoted prices for similar assets or liabilities in active markets, and level 3 assets valued using significant unobservable inputs.

CITY OF TAMARAC, FLORIDA
NOTES TO THE FINANCIAL STATEMENTS SEPTEMBER 30, 2016
33
3. Receivables Activities between funds that are representative of lending/borrowing arrangements outstanding at the end of the fiscal year are referred to as either “due to/from other funds” or “advances to/from other funds. Any balances outstanding between the governmental activities and business-type activities are reported in the government-wide financial statements as “internal balances.” All trade and other receivables are shown net of allowance for uncollectibles. In addition to those receivables specifically identified as uncollectible, a general allowance is calculated based on the City’s historic bad-debt experience. Long-term receivables are analyzed for their collectability based on the terms and conditions of the agreements. 4. Inventories and Prepaid Items Inventories are valued at lower of cost or market value using the “first-in, first out” (FIFO) method. The costs of inventories, consisting primarily of expendable supplies held for consumption and assets held for resale, are recorded as expenditures when consumed rather than when purchased. The City’s Utilities Department maintains inventories for parts needs for line maintenance, and the Golf Course maintains an inventory of equipment. The Community Development Department holds inventory of Real Property for rehabilitation and resale which is reported at lower of cost or net realizable value. Certain payments to vendors reflect costs applicable to future accounting periods and are recorded as prepaid items or deferred charges in both government-wide and fund financial statements. Payments for services that benefit future periods are recorded as prepaid expenses in accordance with the consumption method. 5. Restricted Assets Certain proceeds from revenue refunding bonds, as well as other monies as required by several bond indentures, are classified as restricted assets in the government-wide and proprietary fund statement of net position. Restricted assets are not presented on the balance sheet of the governmental funds; however, fund balance of these funds are restricted as to use, when applicable. 6. Capital Assets Capital assets, which include land, intangibles, building and improvements, improvements other than buildings, equipment and infrastructure assets (e.g., roads, sidewalks, stormwater culverts, pump stations, water and sewer lines, light poles, catch basins, and similar items), are reported in the applicable governmental or business-type activities columns in the government-wide financial statements. Capital assets are defined by the City as assets with an initial, individual cost of more than $1,000 for equipment and $5,000 for infrastructure (amount not rounded) and an estimated useful life in excess of one year. Such assets are recorded at historical cost or estimated cost if actual historical cost is unavailable. Donated capital assets are recorded at acquisition value on the date of donation. The costs of normal maintenance and repairs that do not add to the value of the asset or materially extend asset lives are not capitalized, but expensed as incurred.

CITY OF TAMARAC, FLORIDA
NOTES TO THE FINANCIAL STATEMENTS SEPTEMBER 30, 2016
34
Capital assets are depreciated using the straight line method over the following estimated useful lives:
Assets
Years Buildings and Improvements 40-50 Improvements Other Than Buildings 20 Equipment 4-20 Infrastructure: Streets
35-40
Sidewalks 30 Light Poles (Concrete) 40 Pump Stations 30 Water and Sewer Lines 30 Culverts 30 Catch Basins 30
7. Deferred Outflows/Inflows of Resources In addition to assets, the statement of financial position will periodically report a separate section for deferred outflows of resources. This separate financial statement element, deferred outflows of resources, represents a consumption of net position that applies to a future period(s) and so will not be recognized as an outflow of resources (expense/expenditure) until then. The government has two items that qualifiy for reporting in this category. It is the deferred charge on a debt refunding reported in the government-wide and proprietary fund statement of net position. A deferred charge on a debt refunding results from the difference in the carrying value of refunded debt and its reacquisition price. This amount is deferred and amortized over the shorter of the life of the refunded or refunding debt. The City also reports deferred ouflows from pensions which are further described in Note 14 on pensions. In addition to liabilities, the statement of financial position will periodically report a separate section for deferred inflows of resources. This separate financial statement element, deferred inflows of resources, represents an acquisition of net position that applies to a future period(s) and so will not be recognized as an inflow of resources (revenue) until that time. The government has only one item of the type that are deferred and recognized as an inflow of resources in the period that the amounts become available, that is the deferred inflow from pensions. See Note 14 for more information on this line item. 8. Unearned/Unavailable Revenue Unearned revenue represents inflows that do not yet meet the criteria for revenue recognition and are recorded as unearned revenue in the government-wide and the fund statements. Unavailable revenue (a deferred inflow of resources) is recorded for governmental fund receivables that are not measurable and/or available. For this purpose, the City considers revenues to be available if they are collected within 60 days (except for grants 270 days) of the end of the fiscal year. In addition, inflows that do not meet the criteria for revenue recognition are recorded as unavailable revenue in the fund statements. 9. Compensated Absences It is the City’s policy to permit eligible employees to accumulate earned but unused vacation and sick pay benefits. Upon separation from service, employees receive payment for a portion of unused vacation time and sick leave subject to length of service and contract classification. All vacation and sick pay is accrued when incurred in the government-wide

CITY OF TAMARAC, FLORIDA
NOTES TO THE FINANCIAL STATEMENTS SEPTEMBER 30, 2016
35
and proprietary fund financial statements to the extent that they are payable at separation. The non-current portion for governmental funds is maintained separately and represents a reconciling item between the fund and government-wide presentations. A liability for these amounts is reported in governmental funds only if they matured, for example, as a result of employee resignation or retirements. 10. Long-Term Obligations In the government-wide financial statements and proprietary fund types in the fund financial statements, long-term debt and other long-term obligations are reported as liabilities in the applicable governmental activities, business-type activities, and proprietary fund type statement of net position. In the government-wide financial statements and proprietary funds, bond premiums and discounts are amortized over the life of the bonds using the straight-line method, which does not result in a material difference from the effective interest method. Bonds payable are reported net of the applicable bond premium or discount. In the fund financial statements, governmental fund types recognize bond premiums and discounts, as well as bond issuance costs, during the current period. The face amount of debt issued is reported as other financing resources. Premiums received on debt issuances are reported as other financing sources while discounts on debt issuances are reported as other financing uses. Issuance costs, whether or not withheld from the actual debt proceeds received, and payment of principal and interest are reported as debt service expenditures. 11. Nature and Purpose of Classification of Fund Balance and Net Position In the fund financial statements, governmental funds report fund classifications that comprise a hierarchy based primarily on the extent to which the City is bound to honor constraints on the specific purposes for which amounts in those funds can be spent. Amounts that are restricted to specific purposes either by a) constraints placed on the use of resources by creditors, grantors, contributors, or laws or regulations of other governments or b) imposed by law through constitutional provisions or enabling legislation are classified as restricted fund balances. Amounts that can only be used for specific purposes pursuant to constraints imposed by the City Commission through an ordinance or resolution are classified as committed fund balances. Amounts that are constrained by the City’s intent to be used for specific purposes but are neither restricted nor committed are classified as assigned fund balances. Non-spendable fund balances include amounts that cannot be spent because they are either (a) not in spendable form or (b) legally or contractually required to be maintained intact. Unassigned fund balance represents fund balance that has not been assigned to other funds and that has not been restricted, committed, or assigned to specific purposes within the general fund. In all other funds, unassigned is limited to negative residual fund balance. Net position of the government-wide and proprietary funds are categorized as invested in capital assets net of related debt, reduced by accumulated depreciation and any outstanding debt incurred to acquire, construct or improve those assets excluding unexpended bond proceeds. The first category represents net investment in capital assets such as, property, plant, equipment and infrastructure. The restricted category represents the balance of assets restricted by requirements of revenue bonds and other externally imposed constraints or by legislation in excess of the related liabilities payable from restricted assets. Unrestricted consists of the net position balance that do not meet the definition of either of the other two components. When an expenditure is incurred for purposes for which both restricted and unrestricted fund balance are available, the City considers restricted funds, to the extent possible, to have been spent first. When an expenditure is incurred for which committed, assigned, or unassigned fund balance are available, the City considers amounts to have been spent first out of committed funds, then assigned and finally unassigned funds as needed, unless the City Commission has provided otherwise in its commitment or assignment options. The City Commission which is the highest level of decision making authority commits funds via formal action through adoption of a Resolution or Ordinance (which are equally binding as the highest decision making authority) once adopted the limitations imposed by such Resolution or Ordinance can only

CITY OF TAMARAC, FLORIDA
NOTES TO THE FINANCIAL STATEMENTS SEPTEMBER 30, 2016
36
be removed or revised by a similar action. Subsequent to the City Commission action, the Mayor or City Manager or designee depending on the agreement is authorized to contract and sign agreements that are legally binding; these funds are considered commitments for fund balance classification purposes. The City Commission also assigns funds via Resolution or Ordinance which require a majority vote of the City Commission, however, unlike commitments an additional action does not normally have to be taken to remove an assignment. 12. Recently Issued Accounting Pronouncements GASB Statement No. 73 Accounting and Financial Reporting for Pensions and Related Assets That Are Not within the Scope of GASB Statement 68, and Amendments to Certain Provisions of GASB Statements 67 and 68. The objective of this Statement is to improve the usefulness of information about pensions included in the general purpose external financial reports of state and local governments for making decisions and assessing accountability. This Statement results from a comprehensive review of the effectiveness of existing standards of accounting and financial reporting for all postemployment benefits with regard to providing decision-useful information, supporting assessments of accountability and interperiod equity, and creating additional transparency.The requirements of GASB 73 are effective for fiscal year beginning after June 15, 2016. The implementation of this statement is not expected to have a material effect on the City’s financial statements. GASB Statement No. 75, Accounting and Financial Reporting for Postemployment Benefits Other Than Pensions. The primary objective of this Statement is to improve accounting and financial reporting by state and local governments for postemployment benefits other than pensions (other postemployment benefits or OPEB). It also improves information provided by state and local governmental employers about financial support for OPEB that is provided by other entities. This Statement results from a comprehensive review of the effectiveness of existing standards of accounting and financial reporting for all postemployment benefits (pensions and OPEB) with regard to providing decision-useful information, supporting assessments of accountability and interperiod equity, and creating additional transparency. The requirements of GASB 74 are effective for fiscal year beginning after June 15, 2017. The provisions of this statement are expected to have a material effect on the City’s Financial Statements. GASB Statement No. 77 Tax Abatement Disclosures - The requirements of this Statement improve financial reporting by giving users of financial statements essential information that is not consistently or comprehensively reported to the public at present. Disclosure of information about the nature and magnitude of tax abatements will make these transactions more transparent to financial statement users. As a result, users will be better equipped to understand (1) how tax abatements affect a government’s future ability to raise resources and meet its financial obligations and (2) the impact those abatements have on a government’s financial position and economic condition. The provisions of Statement 77 are effective for financial statements for reporting beginning after December 15, 2015. The implementation of this statement is not expected to have a material effect on the City’s financial statements. GASB Statement No 79 Certain External Investment Pools and Pool Participants- This Statement addresses accounting and financial reporting for certain external investment pools and pool participants. Specifically, it establishes criteria for an external investment pool to qualify for making the election to measure all of its investments at amortized cost for financial reporting purposes. The requirements of GASB 79 are effective for fiscal year beginning after December 15, 2015. The implementation of this statement did not have a material effect on the City’s financial statements. GASB Statement No. 80, Blending Requirements for Certain Component Units—an amendment of GASB Statement No. 14. This Statement amends the blending requirements for the financial statement presentation of component units of all state and local governments. The additional criterion requires blending of a component unit incorporated as a not-for-profit corporation in which the primary government is the sole corporate member. The additional criterion does not apply to component units included in the financial reporting entity pursuant to the provisions of Statement No. 39, Determining Whether Certain Organizations Are Component Units.The requirements of this Statement are effective for reporting

CITY OF TAMARAC, FLORIDA
NOTES TO THE FINANCIAL STATEMENTS SEPTEMBER 30, 2016
37
periods beginning after June 15, 2016. The implementation of this statement is not expected to have a material effect on the City’s financial statements. GASB Statement No. 82, Pension Issues—an amendment of GASB Statements No. 67, No. 68, and No. 73. The objective of this Statement is to address certain issues that have been raised with respect to Statements No. 67, Financial Reporting for Pension Plans, No. 68, Accounting and Financial Reporting for Pensions, and No. 73, Accounting and Financial Reporting for Pensions and Related Assets That Are Not within the Scope of GASB Statement 68, and Amendments to Certain Provisions of GASB Statements 67 and 68. Specifically, this Statement addresses issues regarding (1) the presentation of payroll-related measures in required supplementary information, (2) the selection of assumptions and the treatment of deviations from the guidance in an Actuarial Standard of Practice for financial reporting purposes, and (3) the classification of payments made by employers to satisfy employee (plan member) contribution requirements. The requirements of this Statement are effective for reporting periods beginning after June 15, 2016, except for the requirements of this Statement for the selection of assumptions in a circumstance in which an employer’s pension liability is measured as of a date other than the employer’s most recent fiscal year-end. In that circumstance, the requirements for the selection of assumptions are effective for that employer in the first reporting period in which the measurement date of the pension liability is on or after June 15, 2017. The implementation of this statement is not expected to have a material effect on the City’s financial statements. GASB Statement No. 83, Certain Asset Retirement Obligations. This Statement addresses accounting and financial reporting for certain asset retirement obligations (AROs). An ARO is a legally enforceable liability associated with the retirement of a tangible capital asset.Agovernment that has legal obligations to perform future asset retirement activities related to its tangible capital assets should recognize a liability based on the guidance in this Statement. The requirements of this Statement are effective for reporting periods beginning after June 15, 2018. The implementation of this statement is not expected to have a material effect on the City’s financial statements. GASB Statement No. 84, Fiduciary Activities. This Statement establishes criteria for identifying fiduciary activities of all state and local governments. The focus of the criteria generally is on (1) whether a government is controlling the assets of the fiduciary activity and (2) the beneficiaries with whom a fiduciary relationship exists. Separate criteria are included to identify fiduciary component units and postemployment benefit arrangements that are fiduciary activities. The requirements of this Statement are effective for reporting periods beginning after December 15, 2018. The implementation of this statement is not expected to have a material effect on the City’s financial statements. 13. Special Assessments The City levies four (4) Special Assessments. The City levies the following Special Assessments against benefited property owners:
a. Fire Rescue Assessments – Accounted and reported in the major fund, Fire Rescue Fund in the amount of $11,662,153.
b. Stormwater Management Fees – Accounted and reported in the major fund- Stormwater Fund in the amount of $5,639,636.
c. Solid Waste Assessments – Accounted for and Reported in the Agency Fund in the amount of $4,787,887. d. Nuisaince Abatement Assessment – Accounted and reported in the General Fund in the amount of $5,651.
14. Use of Estimates The preparation of financial statements in conformity with accounting principles generally accepted in the United States requires management to make estimates and assumptions that affect the amounts reported in the accompanying financial statements. Although these estimates are based on management’s knowledge of current events and actions it may undertake in the future, they may ultimately differ from actual results.

CITY OF TAMARAC, FLORIDA
NOTES TO THE FINANCIAL STATEMENTS SEPTEMBER 30, 2016
38
NOTE 2. PROPERTY TAXES Property taxes are assessed as of January 1 each year and are first billed the following November 1. Under Florida law, the assessment of all properties and the collection of all county, municipal, school board and special district property taxes are consolidated in the offices of the County Property Appraiser and County Revenue Collection Division, respectively. The laws for the State regulating tax assessments are also designed to assure a consistent property valuation method statewide. State statutes permit municipalities to levy property taxes up to 10 mills ($10 per $1,000 of assessed taxable valuation). The operating millage rate assessed by the City for the fiscal year ended September 30, 2016 was 7.2899 mills. The debt service millage rate for the fiscal year ended September 30, 2016 was 0.0952 mills. Tax liens are placed on the property as of January 1 of the calendar year in which the tax levy occurs. Taxes are billed on November 1 of each fiscal year and taxes are due no later than March 31st following the year in which they were levied. On April 1, taxes become delinquent if unpaid and each year unpaid taxes are sold through tax certificates at public auction prior to June 1 and the proceeds are remitted to the City. There were no material delinquent property taxes at September 30, 2016; therefore an allowance for uncollectible taxes has not been recorded.
[Intentionally Left Blank]

CITY OF TAMARAC, FLORIDA
NOTES TO THE FINANCIAL STATEMENTS SEPTEMBER 30, 2016
39
NOTE 3. STEWARDSHIP, COMPLIANCE, AND ACCOUNTABILITY 1. Compliance with Finance-Related Legal and Contractual Provisions City Management believes that they are in compliance with finance-related legal and contractual provisions. 2. Restatement of Prior Year’s Net Position and Fund Balances (a) The October 1, 2015 beginning net position of Utilities Fund and Business type activities were restated as follow: Statement of Activities: Business-type
Activities Net position, October 1, 2015, previously reported
$100,111,651 Restatement of net position due to addition of contributed capital and capital assets
1,894,750
Net position, October 1, 2015, restated $102,006,401 Propietary Funds -Business Type Activities- Enterprise Funds:
While preparing the financial statements for the fiscal year ended September 30, 2016 it was noted that the City did not account for Capital Contributions for Utility Improvements completed in 2009. The October 1, 2015 net position for Business Type Activities and the Utility Fund were restated to record capital contributions received from developers in prior periods. The restatement also resulted in an increase in net investment in capital assets of $1,894,750 for the Business-type Activities and Utilities Fund net position balances. (b) Fund Balance: October 1, 2015 beginning fund balance of the Major Fund - Tamarac Village was restated due to the implementation of GASB Statements 72: Tamarac Village Fund: Fund Balance, October 1, 2015, previously reported $10,509,389 Restatement of fund balance due to the implementation of GASB 72
7,944,300
Fund Balance, October 1, 2015, restated $18,453,689 Land previously purchased for governmental purposes for which the purpose has now changed has been reclassified from capital assets to Investment in Real Property and is reported at fair value. See note 4 (h) for further details. The increase resulted in an increase in non spendable fund balance of $7,944,300 for the fund.
Utilities Net position, October 1, 2015, previously reported $74,701,798 Restatement of net position due to addition of contributed capital and capital assets
1,894,750
Net position, October 1, 2015, restated $76,596,548

CITY OF TAMARAC, FLORIDA
NOTES TO THE FINANCIAL STATEMENTS SEPTEMBER 30, 2016
40
3. Compliance with Bond Rate Covenant Water and Waste Water Revenues Water and Sewer (Utility) Revenue Bond Resolution requires the City to fix, establish and revise the same from time to time, whenever necessary, maintain and collect such fees, rates or other charges for the product, services and facilities of the system, which will always provide in each fiscal year (1) net revenues sufficient to pay one hundred ten percent (110%) of the annual debt service on all outstanding bonds becoming due in such fiscal year through fiscal year 2039 and (2) net revenues in each fiscal year adequate to pay at least one hundred percent (100%) of (a) the annual debt service on all outstanding bonds becoming due in such fiscal year and (b) any amounts required to be deposited into the Reserve Fund, and the Reserve for Renewal, Replacement and Improvement Fund. For fiscal year ended September 30, 2016, the water and sewer 110% test was 1,148% and the 100% test was 328%. Stormwater Revenues Stormwater Revenue Bond Resolution requires the City to fix, establish, revise from time to time whenever necessary, maintain and collect always such fees, rates, rentals, and other charges for the use of the products, services and facilities of the system which will always provide Net Revenues in each fiscal year through fiscal year 2024, sufficient to pay 125% of the Bond Service Requirement in the applicable bond year, plus 100% of any amount required by the terms hereof to be deposited into the Reserve Fund, and the Reserve for Renewal, Replacement and Improvement Fund. For fiscal year ended September 30, 2016, the stormwater 125% test was 450% and the 100% test was 196%. Sales Tax Revenue Sales Tax Bond Resolutions for the Series 2009 and the Series 2010 Sales Tax Bond (collectively, the "Bonds") covenants that the estimated Pledged Revenues will be sufficient to pay the principal of and interest on the Bonds as the same become due through fiscal year 2027. For the fiscal year ended September 30, 2016, the Sales Tax Revenue was 262% of the maximum annual debt service of the bonds. Covenant to Budget and Appropriate Resolutions for the City’s 2013 Capital Improvement Bond, the 2016 Line of Credit and the 2012 Master Capital Lease are secured by Covenant to Budget and Appropriate (CB&A), additionally the City’s Sales Tax Bonds and Stormwater Revenue Bond are covered by a back-up CB&A. Resolutions for the various Bonds and Note require that the average of the Pledgeable Non-Ad Valorem Revenues for the two most recent Fiscal Years for which audited financial statements of the Issuer are available is equal to or greater than 2.0x the projected maximum annual debt service for all issues. For fiscal year ended September 30, 2016 and 2015, the CB&A coverage for the City was 4.09 and 3.83 respectively and the two year average is 3.86.

CITY OF TAMARAC, FLORIDA
NOTES TO THE FINANCIAL STATEMENTS SEPTEMBER 30, 2016
41
NOTE 4. DETAILED NOTES 1. Deposits and Investments a. Cash and Cash Equivalents The City, for accounting and investment purposes, maintains a cash and investment pool for use by all City funds, excluding pension funds. This gives the City the ability to invest large amounts of idle cash for short periods of time and to maximize earning potential. Each fund type’s portion of this pool is displayed on the combined balance sheet as cash and equity in pooled cash and investments. Income earned on pooled cash and investments is allocated to the respective funds based on each fund’s equity balances. As of September 30, 2016, the City had the following cash equivalents:
Amounts
Demand Deposits 72,258,591$ FLSAFE 28,266,972 Certificates of Deposit 10,000,000 Florida Prime (SBA) 3,244 Short term Portfolio 7,879,651
Total 118,408,458$
Deposits The carrying amounts of the City’s cash deposits were $72,258,591 including petty cash on hand of $1,132 as of September 30, 2016. Bank balances before reconciling items were $73,088,606 at that date, the total of which is collateralized by the State’s pool as discussed below. Custodial Credit Risk. Custodial credit risk for deposits is the risk that in the event of the failure of a depository financial institution a government will not be able to recover its deposits or will not be able to recover collateral securities that are in the possession of an outside party. All of the City’s deposits are entirely insured by federal depository insurance or collateralized by the multiple financial institution collateral pool pursuant to Florida Statutes, Chapter 280, “Florida Security for Public Deposits Act.” Under this Act all qualified public depositories are required to pledge eligible collateral having a fair value equal to or greater than the average daily or monthly balance of all public deposits multiplied by the depository’s collateral pledging level.

CITY OF TAMARAC, FLORIDA
NOTES TO THE FINANCIAL STATEMENTS SEPTEMBER 30, 2016
42
b. Investments Portfolio Section 218.415, Florida Statutes limits the types of investments that a government can invest in unless specifically authorized in an investment policy. On June 9, 2010, the City adopted a comprehensive investment policy pursuant to Section 218.415, Florida Statutes that established permitted investments, asset allocation limits, issuer limits, credit rating requirements, and maturity limits to protect the City’s cash and investment assets. The City maintains a common cash and investment pool for the use of all funds. The investment policy applies to all cash and investments held or controlled by the City with the exception of Pension Funds and funds related to the issuance of debt. The City’s investment policy allows for the following investments: The Florida State Board of Administration’s Local Government Surplus Funds Trust Fund (Florida PRIME), Florida Surplus Asset Fund Trust (FLSAFE), United States Government Securities, United States Government Agencies, Federal Instrumentalities, Non-Negotiable Interest Bearing Time Certificates of Deposit or Saving Accounts, Repurchase Agreements, Commercial Paper, Bankers’ Acceptances, State and/or Local Government Taxable and/or Tax-Exempt Debt, Money Market Mutual Funds, Intergovernmental Investment Pools, Corporate Obligations or Corporate Notes, Mortgage-Backed Securities (MBS), Asset-Backed Securities (ABS), and Bond Funds. As of September 30, 2016, the City had the following investment types and effective duration presented in terms of years:
Weighted AverageSecurity Type Fair Value Duration (Years) Credit Rating
Florida Prime (SBA) 3,244$ 0.00 N/AMoney Market Fund 7,879,651 0.00 AAAmFlorida Safe Investment Pool 28,266,972 0.00 AAAmCertificates of Deposit 10,000,000 0.86 N/AUS Treasury Notes 7,007,940 1.19 AA+US Government Agency Securities 951,043 0.99 AA+Corporate Notes 6,766,448 1.03 AA-
60,875,298$
Portfolio Weighted Average Duration 0.19 AA
The City has implemented the Governmental Accounting Standards Board (GASB) Statement No. 72, Fair Value Measurement and Application issued in February 2015 by categorizing its investments according to the fair value hierarchy established by this Statement. The hierarchy is based on the valuation input used to measure the fair value of the asset with Level 1 assets being those where quoted prices in an active market for identical assets can be readily obtained, and Level 2 assets valued using a matrix pricing technique of quoted prices for similar assets or liabilities in active markets, and level 3 assets valued using significant unobservable inputs. Investments with Local Government Investment Pools (LIGP) are recorded at net asset value (NAV) per share. This method of determining fair value uses member units to which a proportionate share of net asset is attributed.

CITY OF TAMARAC, FLORIDA
NOTES TO THE FINANCIAL STATEMENTS SEPTEMBER 30, 2016
43
As of September 30, 2016, the City’s investments were categorized as follows:
Investment Type Amount Level 1 Level 2
Money Market Fund 7,879,651$ 7,879,651$ -$
Debt Securities: U.S. Treasury Notes 7,007,940 7,007,940 - U.S. Government Agency 951,043 - 951,043 Corporate Notes 6,766,448 - 6,766,448
22,605,082$ 14,887,591$ 7,717,491$
Investments Measured at Net Asset Value (NAV)
Florida Prime (SBA) 3,244 Florida Safe Investment Fund 28,266,972
50,875,298 Certificates of Deposit 10,000,000 Total Investments 60,875,298$
c. Interest Rate Risk Interest rate risk is the risk that changes in interest rates will adversely affect the fair value of an investment. Generally, the longer the maturity of an investment, the greater the sensitivity of its fair value to changes in interest rates. As a means of limiting its exposure to fair value losses arising from rising interest rates, the City’s investment policy limits the City’s investment portfolio to maturities not to exceed five years at time of purchase. d. Credit Risk Generally, credit risk is the risk that an issuer of an investment will not fulfill its obligation to the holder of the investment. This is measured by the assignment of a rating by a nationally recognized statistical rating organization. State law limits investments in commercial paper to the highest credit rating from a nationally recognized rating agency. It is the City’s policy to limit investments in these types to have at least A1/P1 rating from Standard and Poor’s (S&P) and Moody’s Investor Services, respectively. Commercial Paper of any United States company that is rated, at the time of purchase, “Prime-1” by Moody’s and “A-1” by Standard & Poor’s (prime commercial paper). If the commercial paper is backed by a letter of credit (“LOC”), the long-term debt of the LOC provider must be rated “A” or better by at least two nationally recognized rating agencies. As of September 30, 2016, the City had the following exposure as a percentage of total investments: Security Type S&P Credit Rating Percentage of Portfolio
US Treasury Notes AA+ 5.29%
Corporate Notes AA- 5.13%

CITY OF TAMARAC, FLORIDA
NOTES TO THE FINANCIAL STATEMENTS SEPTEMBER 30, 2016
44
e. Concentration of Credit Risk The City’s investment policy has established asset allocation and issuer limits on the following investments which are designed to reduce concentration of credit risk of the City’s investment portfolio. A maximum of 100% of available funds may be invested in United States Government Securities, 75% of available funds may be invested in United States Government Instrumentalities, 50% of available funds may be invested in United States Government Obligations and in Intergovernmental investment pools, 25% of available funds may be invested in commercial paper by any US Corporation, bankers’ acceptances, repurchase agreements, registered investment companies (mutual funds) and in bond funds, 20% of available funds may be invested in state and local government debts, and corporate obligations or corporate notes, 15% of available funds may be invested in mortgage-backed securities and 10% of available funds may be invested in certificates of deposits and asset backed securities. Investments with individual issuers that represent more then 5% of the City’s investments are included on the previous table. f. Custodial Credit Risk Custodial credit risk for investments is the risk that in the event of the failure of the counterparty (e.g., broker-dealer) to a transaction, a government will not be able to recover the value of its investment or collateral securities that are in the possession of another party. The City’s investment policy requires that a third party commercial bank’s trust department hold all securities owned by the City. All securities purchased or sold will be transferred only under the “delivery versus payment” (D.V.P.) method through the City’s safekeeping agent. All City investments at September 30, 2016 are being held by a third party commercial trust bank in the name of the City or its agent. g. Local Government Investment Pool At September 30, 2016, the City had $28,266,972 invested in the Florida Surplus Asset Fund Trust (FLSAFE), an investment vehicle established under state statute for local government entities in Florida to pool surplus funds. The Board of Trustees, which is primarily comprised of five (5) government officials of participating entities that have investment responsibility for their respective government entity, administers and enforces the requirements of creating and operating the FLSAFE. FLSAFE operates similarly to money market funds and each share is equal in value to $1.00. FLSAFE is rated AAAm by Standard & Poor’s. Investments are limited to those allowed by the Indenture of Trust. A designated custodial bank provides safekeeping and depository services in connection with the direct investment and withdrawal functions. The custodian’s internal records identify the investments owned by the participating governments. At September 30, 2016 the City had $3,244 invested in the Florida Prime (formally SBA).

CITY OF TAMARAC, FLORIDA
NOTES TO THE FINANCIAL STATEMENTS SEPTEMBER 30, 2016
45
h. Investment in Real Property In December 2010 the City adopted Resolution R-2010-158 and R-2010-163 authorizing the purchase of real property consisting of eight vacant lots located between 91st and 94th Avenues on the North side of Commercial Boulevard and vacant land located immediately East and West of 91st Avenue on the North side of Commercial Boulevard. Additionally, in September 2013 the City adopted Resolution R-2013-93 authorizing the purchase of real property located 9399 West Commercial Boulevard. These were added to two additional parcels previously owned , the former Tamarac Jewish Center purchased in August 2008 via resolution R-2007-132 for $7,172,179 and a lot at the corner of NW 91st Ave and 57th street in July 2006 via resolution R-2006-65 for $772,121. These two parcels were previously classified as capital assets. Pursuant to GASB 72, these two purchases have been reclassified to investment in real property as further discussed in Note 3. The adoption of GASB 72 and a change in the City’s intended use of the property to be held for resale resulted in the purchases being reclassed to investment in real property. The total amount paid for all parcels was $18,409,141. As of September 30, 2016, the market value of the investment properties is estimated to be $18,620,662. i. Employee Pension Plans The Employee Pension Plan investments are held separately from those of other City funds. As prescribed by the plan documents, the plan is authorized to invest plan assets in obligations of the U.S. Government, stocks, corporate bonds, and various mutual and money market funds, which are held by the plan and not in the City's name. The plan investments are being held by RBC Global Asset Management, American Realty Advisors, Fifth Third Bank, Florida Municipal Pension Trust Fund, State Street Global Advisors, J. P. Morgan and USB Trumbull Properties LP, which consisted of the following:
General Non-represented
Employees Police Firefighters Employees
Pension Pension Pension Pension
Common stock 15,873,719$ -$ 50,268,723$ -$
Government securities, corporate bonds
and mortgage backed securities 10,584,503 - 15,865,176 -
Mutual funds 11,482,200 3,575,814 16,469,871 38,412,304
Limited Partnership 3,061,451 908,702
Money market funds 3,722,378 555,739 4,536,890 -
Total 44,724,251$ 5,040,255$ 87,140,660$ 38,412,304$
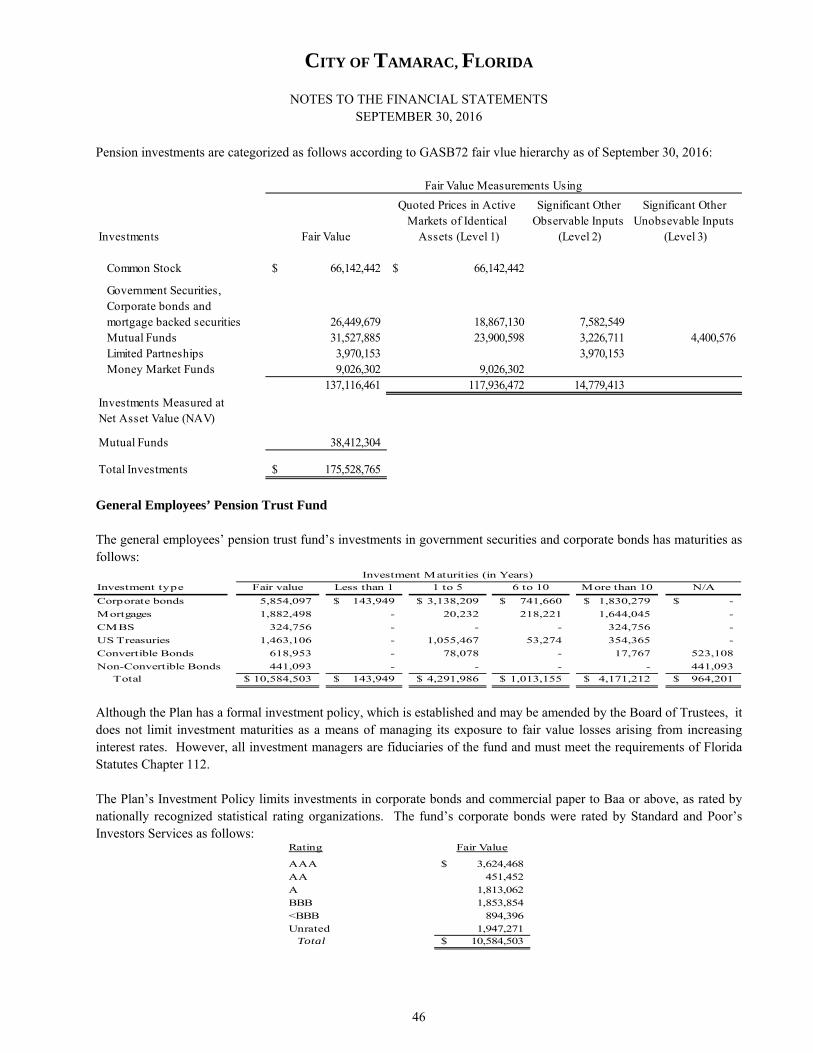
CITY OF TAMARAC, FLORIDA
NOTES TO THE FINANCIAL STATEMENTS SEPTEMBER 30, 2016
46
Pension investments are categorized as follows according to GASB72 fair vlue hierarchy as of September 30, 2016:
General Employees’ Pension Trust Fund The general employees’ pension trust fund’s investments in government securities and corporate bonds has maturities as follows: Although the Plan has a formal investment policy, which is established and may be amended by the Board of Trustees, it does not limit investment maturities as a means of managing its exposure to fair value losses arising from increasing interest rates. However, all investment managers are fiduciaries of the fund and must meet the requirements of Florida Statutes Chapter 112. The Plan’s Investment Policy limits investments in corporate bonds and commercial paper to Baa or above, as rated by nationally recognized statistical rating organizations. The fund’s corporate bonds were rated by Standard and Poor’s Investors Services as follows:
Investments Fair Value
Quoted Prices in Active Markets of Identical
Assets (Level 1)
Significant Other Observable Inputs
(Level 2)
Significant Other Unobsevable Inputs
(Level 3)
Common Stock 66,142,442$ 66,142,442$
Government Securities, Corporate bonds and mortgage backed securities 26,449,679 18,867,130 7,582,549 Mutual Funds 31,527,885 23,900,598 3,226,711 4,400,576 Limited Partneships 3,970,153 3,970,153 Money Market Funds 9,026,302 9,026,302
137,116,461 117,936,472 14,779,413
Investments Measured at Net Asset Value (NAV)
Mutual Funds 38,412,304
Total Investments 175,528,765$
Fair Value Measurements Using
Investment type Fair value Less than 1 1 to 5 6 to 10 More than 10 N/A
Corporate bonds 5,854,097 143,949$ 3,138,209$ 741,660$ 1,830,279$ -$
Mortgages 1,882,498 - 20,232 218,221 1,644,045 -
CMBS 324,756 - - - 324,756 -
US Treasuries 1,463,106 - 1,055,467 53,274 354,365 -
Convertible Bonds 618,953 - 78,078 - 17,767 523,108
Non-Convertible Bonds 441,093 - - - - 441,093
Total 10,584,503$ 143,949$ 4,291,986$ 1,013,155$ 4,171,212$ 964,201$
Investment Maturities (in Years)
Rating Fair Value
AAA 3,624,468$ AA 451,452
A 1,813,062 BBB 1,853,854
<BBB 894,396 Unrated 1,947,271 Total 10,584,503$

CITY OF TAMARAC, FLORIDA
NOTES TO THE FINANCIAL STATEMENTS SEPTEMBER 30, 2016
47
In accordance with the Plan’s Investment Policy there was no investment in a single issuer exceeding 5% of Plan assets that require concentration of credit risk disclosures. Short term investments totaling $3,722,378 are held in a money market fund at Fifth Third Bank rated AAAm by Standard & Poors. Police Officers’ Pension Trust Fund The police officers’ pension trust fund’s investments in government securities and corporate bonds are held in three bond funds: Baird Aggregate Bond Fund, Dodge and Cox Income Fund, and Templeton Gobal Bond Fund. Ratings and maturities vary within each mutal fund between AAA and below B with the vast majority of bonds rated BBB or higher up to 30 years. Although the Plan has a formal investment policy, it does not limit investment maturities as a means of managing its exposure to fair value losses arising from increasing interest rates. However all investment managers are fiduciaries of the fund and must meet the requirements of Chapter 112. In accordance with the Plan’s Investment Policy, which is established and may be amended by the Board of Trustees, there was no investment in a single issuer exceeding 5% of Plan assets that require concentration of credit risk disclosures. Short term investments totaling $555,739 are held in a money market fund at Fifth Third Bank rated AAAm by Standard & Poors. Firefighters’ Pension Trust Fund The firefighters’ pension trust fund’s investments in government securities and corporate bonds has maturities as follows: Although the Plan has a formal investment policy, which is established and may be amended by the Board of Trustees, it does not limit investment maturities as a means of managing its exposure to fair value losses arising from increasing interest rates. However all investment managers are fiduciaries of the fund and must meet the requirements of Florida Statutes Chapter 112. The investment policy limits investments in corporate bonds and commercial paper to the top 3 ratings provided by nationally recognized statistical rating organizations. The Fund’s corporate bonds were rated by Standard and Poor’s Investors Services as follows:
Investment type Fair value Less than 1 1 to 5 6 to 10 More than 10
US Treasuries 1,765,930$ -$ -$ 1,765,930$ -$
US Agencies 5,175,886 5,175,886 - - -
Agency MBS 4,030,288 2,834,144 1,196,144 - -
Corporates 4,893,072 715,530 - 4,177,542 -
Total 15,865,176$ 8,725,560$ 1,196,144$ 5,943,472$ -$
Investment Maturities (in Years)
Rating Fair Value
AA+ 6,941,816$
AA 318,533
A- 2,599,783 BBB+ 1,304,609 BBB 670,147 Unrated 4,030,288 Total 15,865,176$

CITY OF TAMARAC, FLORIDA
NOTES TO THE FINANCIAL STATEMENTS SEPTEMBER 30, 2016
48
In accordance with the Plan’s Investment Policy there was no investment in a single issuer exceeding 5% of Plan assets that require concentration of credit risk disclosures. Short term investments totaling $4,536,890 are held in a money market fund at Fifth Third Bank rated AAAm by Standard & Poors. Elected and Appointed Officers and Non-represented Employee Retirement Fund The Elected and Appointed Officers and Non-represented Employee Retirement Fund’s total investments of $38,412,304 is in mutual funds at September 30, 2016. The Plan’s investment policy is established and may be amended by the Board of Trustees. The Trustees have adopted the same policy as that established by the Board of Trustees of the Florida Municipal Investment Trust, which holds the plans assets. The Fund’s Investment Guidelines regarding bond duration states that the Portfolio should maintain a duration equal to the Barclays Capital A+ Aggregate Index plus or minus 30% but no greater than seven years. The Portfolio duration as of September 30, 2016 is within these guidelines with a duration at 4.45 years. The Fund holds shares in the Florida Municipal Investment Trust Fund. The Fund participates in the Fund A portfolio, which has an asset allocation as follows: Interest rate risk exists when there is a possibility that changes in interest rates could adversely affect an investment’s fair value. The Florida Municipal Investment Trust Board Market High Quality Bond Fund mitigates interest rate risk by limiting the duration and maturity of its investments. At September 30, 2016 it reported to its investors a duration of 4.45 years. State law limits investment in debt securities to those with the top 3 ratings issued by the nationally recognized statistical rating organizations. The Florida Municipal Investment Trust Broad Market High Quality Fund had a Fitch rating of AA.
Fund AllocationCash 0.80%
Broad Market High Quality Bond 15.60%
Core Plus Fixed Income 23.80%
High Quality Growth 7.60%
Diversified Value 8.20%
Russell 1000 Enhanced Index 22.90%
Diversified Small to Mid Cap 11.30%
International Blend 9.80%
100.00%

CITY OF TAMARAC, FLORIDA
NOTES TO THE FINANCIAL STATEMENTS SEPTEMBER 30, 2016
49
2. Receivables and Payables Receivables at year-end for the City’s governmental funds, including the applicable allowance for uncollectible accounts, are as follows:
General Fire RescueTamarac Village
Nonmajor Governmental
Internal Service
Fund Fund Fund Funds Fund Total
Receivables:
Gross accounts receivable 1,412,237$ 1,460,896$ -$ 639,557$ 12,192$ 3,524,882$
Due from other governments 399,778 9,687 78,267 778,452 - 1,266,184
Gross receivables 1,812,015 1,470,583 78,267 1,418,009 12,192 4,791,066
Less: Allowance for uncollectibles (11,928) - - - - (11,928)
Net total receivables 1,800,087$ 1,470,583$ 78,267$ 1,418,009$ 12,192$ 4,779,138$
Receivables at year-end for the City’s business-type activities, including the applicable allowance for uncollectible accounts, are as follows:
Utilities Stormwater
Fund Fund Total
Receivables:
Customers, gross 4,808,457$ 566,688$ 5,375,145$
Due from governments 25,925 - 25,925
Gross receivables 4,834,382$ 566,688$ 5,401,070$
Less: Allowance for uncollectibles (22,027) (4,889) (26,916)
Net total receivables 4,812,355$ 561,799$ 5,374,154$
Payables at September 30, 2016 were as follows:
General
TamaracVillage
NonmajorGovernmental
InternalService
Fund Fund Fund Funds Fund Total
Governmental activit ies:
Accounts & accrued liabilites 303,630$ 46,334$ 1,931$ 647,456$ 30,890$ 1,030,241$
Accrued payroll 405,815 627,571 - 102,778 103,804 1,239,968
Due to other governments 8,361 - - 53,695 - 62,056
Total governmental activit ies 717,806$ 673,905$ 1,931$ 803,929$ 134,694$ 2,332,265$
Utilit ies Stormwater
NonmajorEnterprise
Fund Fund Total Total
Business-type activit ies:
Accounts & accrued liabilities 1,465,962$ 342,170$ 98,157$ 1,906,289$
Accrued payroll 161,742 49,136 - 210,878
Due to other governments 45,369 - - 45,369
Total business-type activit ies 1,673,073$ 391,306$ 98,157$ 2,162,536$
FireRescue

CITY OF TAMARAC, FLORIDA
NOTES TO THE FINANCIAL STATEMENTS SEPTEMBER 30, 2016
50
3. Intergovernmental Revenue Intergovernmental revenue at September 30, 2016 is as follows: Governmental activities:
NonmajorGeneral Fire Rescue Governmental
Fund Fund Fund Total
Shared Revenues:
Federal shared revenue -$ 10,692$ 3,614,387$ 3,625,079$
State shared revenue 6,293,465 56,231 47,299 6,396,995
Local shared revenue 275,731 - 194,172 469,903
Total 6,569,196$ 66,923$ 3,855,858$ 10,491,977$
4. Investment Income Investment income as of September 30, 2016 is as follows:
Governmental EnterpriseInternal Service
Funds Funds Funds Total
Investment income 459,313$ 162,885$ 20,829$ 643,027$ Interest received from tax collector 5,263 830 - 6,093
Total 464,576$ 163,715$ 20,829$ 649,120$
5. Other Revenue Other revenue as of September 30, 2016 is as follows:
Internal Governmental Enterprise Service
Funds Funds Fund Total
Administrative charges 6,508,141$ -$ -$ 6,508,141$ Telecommunications tower rental income 671,738 671,738 Rental income 151,185 - - 151,185 School board shared utilities costs 37,569 - - 37,569 Fleet charges- Interlocal 194,440 - - 194,440 Other 1,629,525 15,872 194,230 1,839,627
Total 9,192,598$ 15,872$ 194,230$ 9,402,700$

CITY OF TAMARAC, FLORIDA
NOTES TO THE FINANCIAL STATEMENTS SEPTEMBER 30, 2016
51
NOTE 5. CAPITAL ASSETS Capital assets activity for governmental activities for the year ended September 30, 2016 was as follows:
Balance BalanceOctober 1, September 30,
2015 * Additions Retirements 2016
Governmental Activities
Capital assets not being depreciated:Land 17,313,690$ -$ 566,205$ 16,747,485$ Intangibles 114,430 - - 114,430 Construction in progress 801,720 3,487,989 2,014,064 2,275,645 Public Art 462,480 - - 462,480
Total assets not being depreciated 18,692,320 3,487,989 2,580,269 19,600,040
Capital assets being depreciated:Buildings and improvements 37,051,290 - - 37,051,290 Improvements Other Than Buildings 24,668,795 530,267 - 25,199,062 Infrastructure 56,442,935 1,199,781 - 57,642,716 Equipment 16,145,320 3,209,015 1,715,353 17,638,982
Total capital assets being depreciated 134,308,340 4,939,063 1,715,353 137,532,050
Less accumulated depreciation for:Building and Improvements (16,181,514) (985,080) - (17,166,594) Improvements other than building (6,738,373) (1,105,055) - (7,843,428) Infrastructure (11,997,972) (808,891) - (12,806,863) Equipment (13,187,312) (1,413,039) 1,691,694 (12,908,657)
Total accumulated depreciation (48,105,171) (4,312,065) 1,691,694 (50,725,542)
Net capital assets being depreciated 86,203,169 626,998 23,659 86,806,508
Governmental activity capital assets, net 104,895,489$ 4,114,987$ 2,603,928$ 106,406,548$
* As restated, see note 3 (2b)

CITY OF TAMARAC, FLORIDA
NOTES TO THE FINANCIAL STATEMENTS SEPTEMBER 30, 2016
52
The following is a summary of capital assets in the Enterprise Funds at September 30, 2016:
Balance BalanceOctober 1, September 30,
2015* Additions Retirements 2016
Business-type activities
Capital assets not being depreciated: Land 10,331,212$ 1,600$ -$ 10,332,812$ Construction in progress 1,931,815 5,598,273 5,326,106 2,203,982 Total assets not being depreciated 12,263,027 5,599,873 5,326,106 12,536,794
Capital assets being depreciated: Buildings and improvements 9,492,902 - - 9,492,902 Improvements Other Than Buildings 105,867,880 5,487,232 - 111,355,112 Infrastructure 31,244,161 - - 31,244,161 Equipment 7,637,697 1,106,275 233,264 8,510,708 Total capital assets being depreciated 154,242,640 6,593,507 233,264 160,602,883
Less accumulated depreciation for: Building (2,926,513) (314,148) - (3,240,661) Improvements other than building (63,008,348) (3,079,995) - (66,088,343) Infrastructure (26,539,075) (181,192) - (26,720,267) Equipment (4,743,859) (972,393) 229,270 (5,486,982) Total accumulated depreciation (97,217,795) (4,547,728) 229,270 (101,536,253)
Net capital assets being depreciated 57,024,845 2,045,779 3,994 59,066,630
Business-type activity capital assets, net 69,287,872$ 7,645,652$ 5,330,100$ 71,603,424$
* As restated, see note 3 (2a)
Depreciation expense was charged to functions/programs of the City as follows: General government 946,298$ Public Safety 1,093,864 Transportation 872,212 Culture/recreation 1,372,775 Physical environment 19,633 Human services 7,283 Total depreciation expense - governmental activities 4,312,065$
Depreciation expense was charged to functions/programs of the City as follows:Business-type activities:
Utilites 3,497,675$ Stormwater 716,920 Nonmajor enterprise fund 333,133
Total depreciation expense-business-type activities 4,547,728$

CITY OF TAMARAC, FLORIDA
NOTES TO THE FINANCIAL STATEMENTS SEPTEMBER 30, 2016
53
NOTE 6 . CONSTRUCTION AND OTHER SIGNIFICANT COMMITMENTS Construction Commitments: The City has active construction projects as of September 30, 2016. The projects include sidewalk installations, infrastructure improvements, park improvements, and water and sewer improvements. At the end of the current fiscal year, the City’s commitments with contractors are as follows:
(1) The Tamarac Lakes South Buffer Wall project is funded by the corridor improvement fund. (2) The Fire Station design/build project is funded by the CIP 05 Revenue Bond Fund. (3) The NW 77th Street Multi-Purpose Trail project is funded by the public service facilities fund. (4) The Park & Recreation Emergency Generator is funded by the general capital project fund. (5) The Receiving Pond Erosion project is funded by the stormwater capital project fund. (6) The Shaker Village Pipe Bursting project is funded by the utility renewal and replacement fund. (7) The Filters 5 & 6 Rehabilitation at Water Treatment Plant project is funded by the utility renewal and replacement fund. (8) The Colony West Area Improvement project is funded by the colony west golf course fund, utility renewal and replacement fund, and storm water capital project fund.
Total Spent to RemainingContract Date Commitment
Governmental activities:
Corridor Improvement Fund
Tamarac Lakes South Buffer Wall (1) 1,362,994$ (121,531)$ 1,241,463$
CIP 05 Revenue Bond Fund
Design Build - Fire Station 78 (2) 3,804,464 (1,585,574) 2,218,890
Public Service Facilities Fund
NW 77th Street Multi-Purpose Trail (3) 130,758 (31,239) 99,519
General Capital Project Fund
Park & Recreation Emergency Generator (4) 344,095 (97,938) 246,157
Total governmental activities 5,642,311$ (1,836,282)$ 3,806,029$
Business-type activities:
Stormwater Fund:
Receiving Pond Erosion (5) 919,091$ (225,544)$ 693,547$
Utilities Fund:
Shaker Village Pipe Bursting (6) 1,222,177 (966,235) 255,942
Filters 5 & 6 Rehabilitation at Water Treatment Plant (7) 242,011 - 242,011
Colony West Golf Course Fund:
Colony West Area Improvement (8) 224,444 (130,468) 93,976
Total business-type activities 2,607,723$ (1,322,247)$ 1,285,476$

CITY OF TAMARAC, FLORIDA
NOTES TO THE FINANCIAL STATEMENTS SEPTEMBER 30, 2016
54
Encumbrances: Encumbrance accounting is utilized to assure budgetary control and accountability and to facilitate effective cash planning and control. At year end the amount of encumbrances expected to be honored upon performance by vendors in the next fiscal year were as follows:
Governmental Funds/Activities:
General Fund 325,447$ Fire Rescue 3,949 Internal service fund 2,191 Nonmajor governmental funds 5,110,636
Total 5,442,223$
Business-type Funds/Activities:Water and Sewer 1,079,068$ Stormwater 824,610 Nonmajor enterprise fund 123,101
Total 2,026,779$
Amounts related to governmental funds are reported as committed fund balance in the financial statements. NOTE 7. OPERATING LEASES The City has entered into various lease agreements for computers, copiers, cell towers and real property. These leases are accounted for as operating leases. The leases are generally for a 3 or 4-year term and include renewal options. The City paid a total of $221,390 under these arrangements for the fiscal year 2016.
The following schedule reflects the operating lease obligations for governmental activities and business-type activities for the next five years.
Year Ending Governmental Business-TypeSeptember 30, Activities Acitivities Total
2017 120,900$ 1,751$ 122,651$ 2018 27,555 - 27,555 2019 13,940 - 13,940 2020 3,789 - 3,789 2021 3,978 - 3,978
Total 170,162$ 1,751$ 171,913$
NOTE 8. INTERFUND TRANSFERS Interfund Transfers for the year ended September 30, 2016 consisted of the following:
Fire Tamarac Nonmajor Non Major
Transfer Out Rescue Village Governmental Stormwater Enterprise Total
General fund 5,977,733$ (1) 779,775$ (2) 5,774,800$ (3) 327,918$ (4) 419,132$ (4) 13,279,358$
Fire rescue fund - - 814,465 (5) 3,255 (6) - 817,720
Nonmajor governmental funds - - 2,970,136 (7) - - 2,970,136
Utilities fund - - 17,863 (8) - 17,863 Total 5,977,733$ 779,775$ 9,559,401$ 349,036$ 419,132$ 17,085,077$
Transfer In

CITY OF TAMARAC, FLORIDA
NOTES TO THE FINANCIAL STATEMENTS SEPTEMBER 30, 2016
55
Transfers are used to (1) move funds from the fund that the budget requires to collect them to the fund that the budget requires to expend them, (2) move receipts restricted to debt service from the funds collecting the receipts to the debt service fund as debt service payments become due, and (3) use unrestricted revenues collected in the general fund to finance various capital projects accounted for in other funds in accordance with budgetary authorizations. The following transfers are explained below:
(1) $5,977,733 was transferred from General Fund to Fire Rescue Fund to supplement the cost of Fire Rescue services;
(2) $779,775 was transferred from General Fund to Tamarac Village for debt service costs;
(3) $2,537,800 was transferred from General Fund to Revenue Bond Fund for the cost of debt service for the 2009
Sales Tax Revenue Refunding Bonds, 2010 Sales Tax Revenue Refunding Bonds and the 2013 Capital Improvement Revenue Bonds; $237,000 was transferred from General Fund to Nonmajor Governmental Fund (Capital Equipment Replacement Fund) for the costs of replacing equipments; $500,000 was transferred from General Fund to Nonmajor Governmental Fund (Capital Maintenance Fund) for costs of maintaining Parks and Recreation’s facilities; $1,000,000 was transferred from General Fund to Nonmajor Governmental Fund (Corridor Improvement Fund) for the costs of corridor improvements; and $1,500,000 was transferred from General Fund to Nonmajor Governmental Fund (General Capital Projects Fund) for costs of general capital projects;
(4) $327,918 was transferred from General Fund to Proprietary Fund (Stormwater Fund) for the annual Stormwater fees for exempt properties from the Stormwater Assessments and $419,132 was transferred from general Fund to Nonmajor Proprietary Fund (Colony West Golf Course) for costs of operating the golf course;
(5) $814,465 was transferred from Fire Rescue Fund to Nonmajor Governmental Fund (CIP 2005 Revenue Bond Fund) for the costs of building a new fire rescue building;
(6) $3,255 was transferred from Fire Rescue Fund to Proprietary Fund (Stormwater Fund) for the annual Stormwater Assessments;
(7) $210,300 was transferred from Nonmajor Governmental Fund (Building Fund) to Nonmajor Governmental Fund (General Capital Projects Fund) for costs of capital projects; $25,000 was transferred from Nonmajor Governmental Fund (Building Fund) to Nonmajor Governmental Fund (Capital Equipment Replacement Fund) for cost of equipment replacement; $651,200 was transferred from Nonmajor Governmental Fund (Streetscape Improvement Fund) to Nonmajor Governmental Fund (Corridor Improvement Fund) for costs of improvements; $551,000 was transferred from Nonmajor Governmental Fund (General Capital Projects Fund) to Nonmajor Governmental Fund (CIP 2005 Revenue Bond Fund) for streets and roads improvement costs; $1,249,000 from Nonmajor Governmental Fund (Public Service Facilities Fund) to Nonmajor Governmental Fund (CIP 2005 Revenue Bond Fund) for streets and roads improvement costs; and $283,636 was transferred from Nonmajor Governmental Fund (State Housing Initiative Program Fund) to Nonmajor Governmental Fund (Affordable Housing Assistance Program Fund) for housing assistance; and
(8) $17,863 was transferred from Proprietary Fund (Utilities Fund) to Proprietary Fund (Stormwater Fund) for Stormwater fees.

CITY OF TAMARAC, FLORIDA
NOTES TO THE FINANCIAL STATEMENTS SEPTEMBER 30, 2016
56
NOTE 9. LONG-TERM DEBT Long-term debt at September 30, 2016 is comprised of the following: Governmental Activities General Long-term Debt
Outstanding Balance
The government issues general obligation bonds to provide funds for the acquisition andconstruction of major capital facilities.
On December 10, 1998, the City of Tamarac issued $3,250,000 of General ObligationBonds, Series 1998 (Senior and Community Center Project). The 1998 General Obligationbonds bear an interest rate of 4.269% and matures in varying annual installments through2018. Bond proceeds were used to build the City of Tamarac Community Center. The bondswill be repaid from ad valorem taxes levied by the City upon the taxable real and tangibleproperty within the City. 251,631$
Revenue Bonds The government also issues bonds where the government pledges income derived from specific/dedicated revenue sources to pay debt service. Governmental
Capital Improvement Revenue Bonds Series 2013 in the amount of $13,785,000 issuedto refund the Series 2005 Capital Improvement Revenue Bonds. The Revenue Bondsbear interest from 2% to 5% and mature in varying annual installments through 2027.The bonds are secured and payable solely from non-ad valorem revenues appropriatedby the City. 12,135,000$
Sales Tax Revenue Refunding Bonds, Series 2009 in the amount of $5,350,000 issued torefund the Series 1999 Sales Tax Bond. The 2009 Refunding Revenue bonds bear aninterest rate of 3.7% and matures in varying annual installments through 2019. Thebonds will be repaid solely from and is secured by a lien on and pledge of the half-centsales tax revenues and, if necessary, from non ad valorem revenues budgeted andappropriated by the City in accordance with Resolution R-2009-92. 1,870,000
On December 8, 2010, the City Commission adopted Resolution R-2010-161,authorizing the issuance of the Sales Tax Refunding Revenue Bond, Series 2010 in theamount of $9,501,000. The purpose was to provide a partial refunding of the Sales TaxRevenue Bond, Series 2002 in order to take advantage of favorable market conditions, toachieve interest savings on the existing bond and to provide new money in the amount of $703,127 to refund a short-term note payable related to real property acquired for apassive park. The bond was issued at an interest rate of 2.25% with no extension of theSeries 2002 maturity date of April 1, 2022. The bond is secured by a lien on and pledgeof the half-cent sales tax revenue and, if necessary, from non ad valorem Revenuesbudgeted and appropriated by the City in accordance with Resolution R-2010-161. 6,628,000
20,633,000$

CITY OF TAMARAC, FLORIDA
NOTES TO THE FINANCIAL STATEMENTS SEPTEMBER 30, 2016
57
Revenue Note On June 9, 2016 the City amended and restated the 2013 line of credit, reducing the limit to $16,620,000. On October 22, 2013, the City issued a $20 million Taxable Redevelopment Revenue Note, Series 2013 initially as a line of credit with PNC Bank and the amount available to be drawn until April 1, 2016. The 2013 line of credit replaced and refunded the Taxable Redevelopment Note, Series 2011. The line of credit bears a variable interest rate equal to one (1) month LIBOR rate plus 1.10% per annum and accrues based on the outstanding amount drawn, payable semi-annually beginning October 1, 2016 and on each subsequent April 1 and October 1 through October 1, 2018 (the “Conversion Date”). No principal amount is due prior to conversion date. Effective October 1, 2018, the line of credit shall automatically convert into a term loan with interest rate equal to any of the following based on City’s election on September 1, 2017 (a) variable interest rate equal to one (1) month LIBOR rate plus 1.10 per annum; (b) fixed interest rate to be determined one month prior to the conversion date. The principal and interest of the term loan shall be payable semi-annually on each April 1 and October 1 beginning October 1, 2018 through 2022. The Note was issued to finance the acquisition of real property within the City to be used for development and/or redevelopment purposes and is secured by non-ad valorem revenues. As of September 30, 2016, the City has $16,620,000 outstanding.
Business-typeOutstanding
Balance
Water and Sewer Utility Revenue Refunding Bonds, Series 2009 in the amountof $14,020,000. The bonds were a combined refunding and new money issue,partial refunding of the Capital Improvement Revenue Bond Series 2004 andrefunding of the Capital Improvement Revenue Note Series 2006. The 2009Revenue bonds bear interest at rates varying from 3% to 5% and mature invarying annual installments through 2039. The new money as well as therefunding of the Capital Improvement Note will finance acquisition,construction and equipping certain capital improvements to the City's water and wastewater facilities. The bonds will be repaid from pledged revenues derivedfrom water and sewer service charges. 12,175,000$
Stormwater System Refunding Bond, Series 2009 in the amount of $4,345,000.The Bond was a partial refunding of the Capital Improvement Revenue Bonds,Series 2004. The 2009 Revenue bonds bear an interest rate of 4.15% andmatures in varying annual installments through 2024. These bonds were issuedto finance the acquisition, construction and equipping of certain capitalimprovements to the City's stormwater utility system and related capitalexpenditures. The bonds and the interest are secured by and payable fromrevenues derived from the stormwater service charges and, if necessary, fromnon ad valorem pledged Revenues budgeted and appropriated by the City inaccordance with the Resolution. 2,640,000
14,815,000$
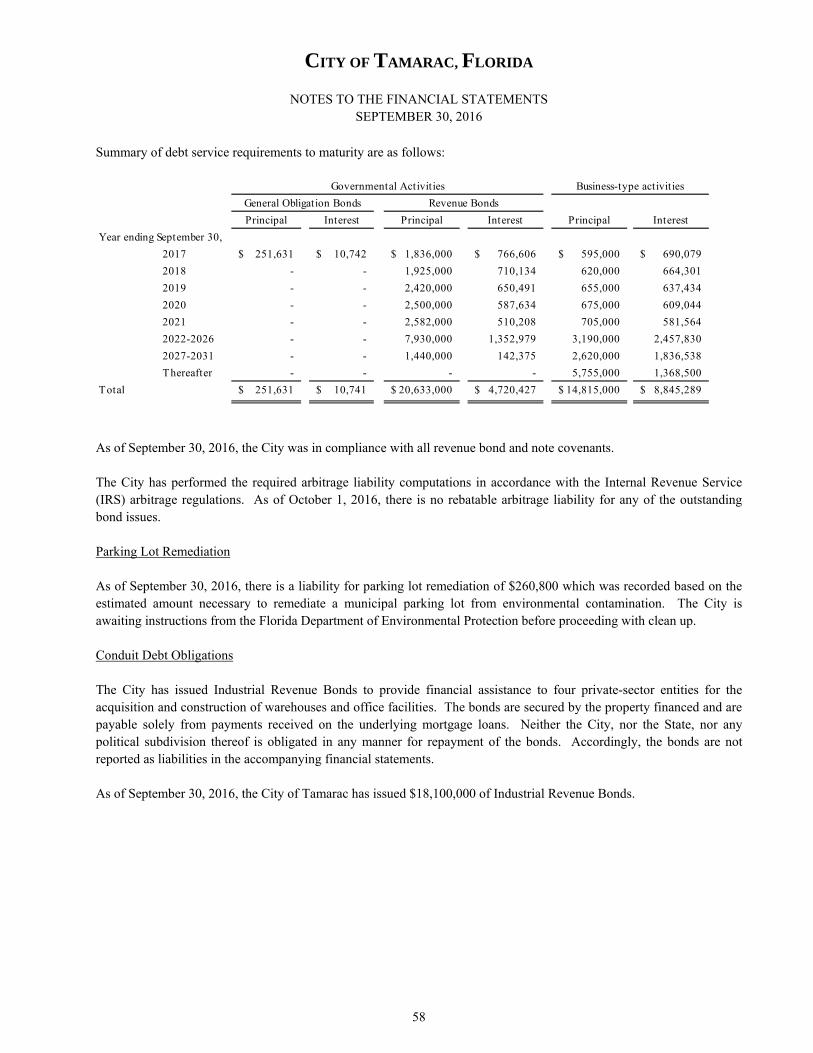
CITY OF TAMARAC, FLORIDA
NOTES TO THE FINANCIAL STATEMENTS SEPTEMBER 30, 2016
58
Summary of debt service requirements to maturity are as follows:
As of September 30, 2016, the City was in compliance with all revenue bond and note covenants. The City has performed the required arbitrage liability computations in accordance with the Internal Revenue Service (IRS) arbitrage regulations. As of October 1, 2016, there is no rebatable arbitrage liability for any of the outstanding bond issues. Parking Lot Remediation As of September 30, 2016, there is a liability for parking lot remediation of $260,800 which was recorded based on the estimated amount necessary to remediate a municipal parking lot from environmental contamination. The City is awaiting instructions from the Florida Department of Environmental Protection before proceeding with clean up. Conduit Debt Obligations The City has issued Industrial Revenue Bonds to provide financial assistance to four private-sector entities for the acquisition and construction of warehouses and office facilities. The bonds are secured by the property financed and are payable solely from payments received on the underlying mortgage loans. Neither the City, nor the State, nor any political subdivision thereof is obligated in any manner for repayment of the bonds. Accordingly, the bonds are not reported as liabilities in the accompanying financial statements. As of September 30, 2016, the City of Tamarac has issued $18,100,000 of Industrial Revenue Bonds.
Principal Interest Principal Interest Principal Interest
Year ending September 30,
2017 251,631$ 10,742$ 1,836,000$ 766,606$ 595,000$ 690,079$
2018 - - 1,925,000 710,134 620,000 664,301
2019 - - 2,420,000 650,491 655,000 637,434
2020 - - 2,500,000 587,634 675,000 609,044
2021 - - 2,582,000 510,208 705,000 581,564
2022-2026 - - 7,930,000 1,352,979 3,190,000 2,457,830
2027-2031 - - 1,440,000 142,375 2,620,000 1,836,538
Thereafter - - - - 5,755,000 1,368,500
Total 251,631$ 10,741$ 20,633,000$ 4,720,427$ 14,815,000$ 8,845,289$
Governmental Activities Business-type activities
General Obligation Bonds Revenue Bonds

CITY OF TAMARAC, FLORIDA
NOTES TO THE FINANCIAL STATEMENTS SEPTEMBER 30, 2016
59
Long-term liability activity for the year ended September 30, 2016 was as follows:
October 1, September 30, Due within
2015 Additions Reductions 2016 One Year
Governmental activities:
Bonds, notes and leases payable
General obligation 492,959$ -$ (241,328)$ 251,631$ 251,631$
Revenue bonds 22,383,000 - (1,750,000) 20,633,000 1,836,000
Redevelopment note 16,620,000 - - 16,620,000 -
Capital lease 1,003,346 555,824 (389,363) 1,169,807 386,331
Bond premium 1,332,432 - (111,036) 1,221,396 -
Total bonds and notes payable 41,831,737 555,824 (2,491,727) 39,895,834 2,473,962
Other liabilit ies:
Compensated absences 2,942,066 171,441 (161,053) 2,952,454 295,246
Claims and judgments 1,601,717 6,060,147 (6,335,139) 1,326,725 928,708
Net Pension Liability 23,025,929 744,548 - 23,770,477 -
OPEB obligations 1,037,604 172,633 - 1,210,237 -
Parking lot remediation 260,800 - - 260,800 -
Total other liabilit ies 28,868,116 7,148,769 (6,496,192) 29,520,693 1,223,954
Governmental activity
long-term liabilit ies 70,699,853$ 7,704,593$ (8,987,919)$ 69,416,527$ 3,697,916$
Business-type activities:
Bonds and notes payable
Water and sewer revenue
refunding bonds 12,475,000$ -$ (300,000)$ 12,175,000$ 310,000$ Stormwater Refunding Revenue Note 2,915,000 - (275,000) 2,640,000 285,000
Less deferred amounts:
Bond discounts (347,012) - 20,678 (326,334) -
Total bonds and notes payable 15,042,988 - (554,322) 14,488,666 595,000
Other liabilit ies:
Compensated absences 789,662 6,900 (52,355) 744,207 74,420
Net Pension Liability 945,678 - (20,215) 925,463 -
OPEB Obligations 264,545 44,358 - 308,903 -
Total other liabilit ies 1,999,885 51,258 (72,570) 1,978,573 74,420
Business-type activity
long-term liabilit ies 17,042,873$ 51,258$ (626,892)$ 16,467,239$ 669,420$

CITY OF TAMARAC, FLORIDA
NOTES TO THE FINANCIAL STATEMENTS SEPTEMBER 30, 2016
60
The Internal Service Fund predominantly serves the governmental funds. Accordingly, long-term liabilities for the fund are included as part of the above totals for governmental activities. Also, for the governmental activities, claims and judgments, OPEB obligations, pension obligations and compensated absences are generally liquidated by the General Fund. NOTE 10. CAPITAL LEASE
Outstanding Balance
63,026$
215,730$
388,432$
251,286$
251,333$
1,169,807$
$277,912 capital lease to Banc of America Public Capital Corp. to finance one (1) Horton Ambulance/Rescue
Vehicles acquisition. The lease is collateralized by the related equipment. The lease requires ten semi-annualpayments of $29,321, including principal and interest accruing at 1.97% beginning June 10, 2016 throughDecember 10, 2020. Gross amount of assets acquired was $277,912.
$527,632 capital lease to Banc of America Public Capital Corp. to finance acquisition of two (2) NavistarAmbulances. The lease is collateralized by the related equipment. The lease requires ten semi-annualpayments of $54,933, including principal and interest accruing at 1.4795% beginning November 3, 2013
through May 3, 2018. Gross amount of assets acquired was $527,632.
$607,667 capital lease to Banc of America Public Capital Corp. to finance Aerial Fire Apparatus acquisition.The lease is collateralized by the related equipment. The lease requires ten semi-annual payments of $63,554,including principal and interest accruing at 1.679% beginning October 1, 2012 through April 1, 2017. Grossamount of assets acquired was $607,667.
$546,916 capital lease to Banc of America Public Capital Corp. to finance two (2) Horton Ambulance/RescueVehicles acquisition. The lease is collateralized by the related equipment. The lease requires ten semi-annual
payments of $57,698, including principal and interest accruing at 1.97% beginning April 6, 2015 throughOctober 6, 2019. Gross amount of assets acquired was $546,916.
$277,912 capital lease to Banc of America Public Capital Corp. to finance one (1) Horton Ambulance/Rescue
Vehicles acquisition. The lease is collateralized by the related equipment. The lease requires ten semi-annual
payments of $29,260, including principal and interest accruing at 1.90% beginning May 12, 2016 through
November 12, 2020. Gross amount of assets acquired was $277,912.

CITY OF TAMARAC, FLORIDA
NOTES TO THE FINANCIAL STATEMENTS SEPTEMBER 30, 2016
61
NOTE 11. FUTURE REVENUES THAT ARE PLEDGED The City has pledged various future revenue sources for various debt issues. For the water and sewer system and the stormwater system, the City has pledged future customer revenues, net of certain operating expenses. The following table provides a summary of the pledged revenues for the City’s outstanding debt issues. Additional information regarding the City’s pledged revenue can be found in Note 3.
NOTE 12. RESTRICTED ASSETS The balances of the restricted asset accounts in the enterprise funds at September 30, 2016 pertains to the following:
Customer deposits 1,594,624$
Pledged Revenue
Total Principal
and Interest Outstanding
Current Year Principal and Interest Paid
Current Year Net Revenue
Water and Sewer Net Revenue 20,503,406$ 894,019$ 10,256,601$ 1,147 %Stormwater Net Revenue 3,156,883 395,973 1,783,979 451 %Half Cent Sales Tax 9,127,520 1,521,981 4,037,987 265 %Covenant to Budget and Appropriate 32,079,300 1,244,002 32,158,612 2,585 %
Percent of Revenues to Principal and Interest Paid

CITY OF TAMARAC, FLORIDA
NOTES TO THE FINANCIAL STATEMENTS SEPTEMBER 30, 2016
62
NOTE 13. FUND BALANCE As of September 30, 2016, fund balances are comprised of the following:
Total
Tamarac Nonmajor Governmental
General Fire Rescue Village Governmental Funds
Nonspendable:
Inventories 119,698$ -$ -$ 328,253$ 447,951$
Long-term receivable - - - 563,051 563,051
Investment- real property - - 18,620,662 - 18,620,662
Restricted:
Public safety 10,741 5,698,068 - 2,927,441 8,636,250
Transportation - - - 811,374 811,374
Debt service - - - 288,592 288,592
Economic development - - - 2,507,515 2,507,515
Capital projects - - - 2,627,254 2,627,254
Committed:
Economic development 325,447 - - - 325,447
Public safety - 3,949 - - 3,949
Economic stablization - - - -
Capital projects - - - 4,672,116 4,672,116
Assigned:
Public safety - 3,428,670 - - 3,428,670
Capital projects:
Facilities maintenance 400,000$ - - -
Land acquisition 3,000,000 - - -
Technology replacement 100,000 3,500,000 - - - 3,500,000
Corridor Improvements 3,874,938
Fire Station#36 1,090,384
Neighbohood Signage 595,000
Waters Edge Park 2,775,207
Aquatic Center Improvements 757,634
Security System Improvements 608,118
Pedestrian Crossing 382,000
Other projects 1,544,533 11,627,814 11,627,814
Economic development 500,000 - 509,133 2,111,591 3,120,724
Disaster reserve 1,000,000 - - - 1,000,000 Subsequent year's budget:appropriation of fund balance 5,336,332 - - - 5,336,332
Unassigned 25,593,829 - - - 25,593,829
Total fund balances 36,386,047$ 9,130,687$ 19,129,795$ 28,465,001$ 93,111,530$
CITY OF TAMARAC, FLORIDA
NOTES TO THE FINANCIAL STATEMENTS SEPTEMBER 30, 2016
63
NOTE 14. EMPLOYEE RETIREMENT SYSTEMS AND PENSION PLANS The City has four defined benefit single-employer pension plans:
General Employees’ Pension Plan Police Officers’ Pension Plan Firefighters’ Pension Plan Elected and Appointed Officers and Non-Represented Employees’ Pension Plan
The City accounts for all four plans as pension trust funds; they are accounted for on the economic resources measurement focus and the accrual basis of accounting. Plan member contributions, employer contributions, and contributions from other entities are recognized in the period in which the contributions are due. Benefits and refunds are recognized when due and payable in accordance with terms of the plans. Plan assets are reported at fair value for financial statement purposes as reported within the annual trustee statements. The defined benefit plans do not issue stand-alone financial reports and are not included in any other retirement system’s or entity’s financial report. Financial statements for the individual pension plans are presented below since separate GAAP financial reports have not been issued for the individual plans. The City also has two (2) employees who are in a defined contribution plan established under the provisions of Section 401(a) of the Internal Revenue Code.
[Intentionally left blank]

CITY OF TAMARAC, FLORIDA
NOTES TO THE FINANCIAL STATEMENTS SEPTEMBER 30, 2016
64
Elected and
Appointed and
General Police Non-represented
Employees Officers Firefighters Employees
Retirement Retirement Retirement Retirement Total
ASSETS
Cash and cash equivalents 3,844,144$ 560,777$ 4,621,218$ 163$ 9,026,302$
Receivables:
Interest and dividends - 11,047 - - 11,047
Contributions receivable - - 27,343 29 27,372
Investments, at fair value:
Common stock 15,873,719 - 50,268,723 - 66,142,442
Government securities 3,345,604 - 10,291,721 - 13,637,325
Corporate bonds 7,238,899 - 5,573,455 - 12,812,354
Limited liability partnership 3,061,451 908,702 - - 3,970,153
Mutual funds 11,482,200 3,575,814 16,469,871 38,412,304 69,940,189
Total investments 41,001,873 4,484,516 82,603,770 38,412,304 166,502,463
Total assets 44,846,017 5,056,340 87,252,331 38,412,496 175,567,184
LIABILITIES
Accounts payable 2,050 9,373 12,444 11,330 35,197
Net position restricted for pension benefits 44,843,967$ 5,046,967$ 87,239,887$ 38,401,166$ 175,531,987$
Elected and
Appointed and
General Police Non-represented
Employees Officers Firefighters Employees
Retirement Retirement Retirement Retirement Total
ADDITIONS
Contributions:
Employer 1,482,771$ 515,895$ 3,548,031$ 2,298,244$ 7,844,941$
Employee 552,111 - 935,054 627,367 2,114,532
State - 515,886 577,485 - 1,093,371
Total contributions 2,034,882 1,031,781 5,060,570 2,925,611 11,052,844
Investment income:
Net appreciation in fair value
of investments 2,380,297 275,275 5,028,167 2,852,407 10,536,146
Interest and dividend income 1,014,689 95,705 1,823,181 7 2,933,582
Total investment income 3,394,986 370,980 6,851,348 2,852,414 13,469,728
Less investment expenses (169,676) (38,677) (477,894) (41,815) (728,062)
Net investment income 3,225,310 332,303 6,373,454 2,810,599 12,741,666
Total additions 5,260,192 1,364,084 11,434,024 5,736,210 23,794,510
DEDUCTIONS
Benefits paid and refunds 1,982,529 1,080,039 3,790,644 1,632,039 8,485,251
Administrative expenses 42,492 65,966 40,399 25,453 174,310
Total deductions 2,025,021 1,146,005 3,831,043 1,657,492 8,659,561
Change in net position 3,235,171 218,079 7,602,981 4,078,718 15,134,949
Net position, October 1 41,608,796 4,828,888 79,636,906 34,322,448 160,397,038
Net position, September 30 44,843,967$ 5,046,967$ 87,239,887$ 38,401,166$ 175,531,987$
CITY OF TAMARAC, FLORIDA
COMBINING STATEMENT OF CHANGES IN NET POSITION
PENSION TRUST FUNDS
FOR THE YEAR ENDED SEPTEMBER 30, 2016
CITY OF TAMARAC, FLORIDA
COMBINING STATEMENT OF FIDUCIARY NET POSITION
PENSION TRUST FUNDS
September 30, 2016
Pension Trust Funds

CITY OF TAMARAC, FLORIDA
NOTES TO THE FINANCIAL STATEMENTS SEPTEMBER 30, 2016
65
A. General Employees’ Pension Plan Pension Plan Description Name of the pension plan: City of Tamarac Employees’ Pension Plan Legal plan administrator: Board of Trustees of the City of Tamarac Employees’ Pension Plan, which consists of
five trustees and three alternate trustees. Three trustees and two alternates are elected by plan participants. One trustee is appointed by the Mayor from members of the City Commission, and one trustee is appointed by the City manager
Plan type: Single-employer defined benefit pension plan Number of covered individuals: 338 (136 inactive employees and beneficiaries currently receiving benefits; 27
inactive employees entitled to but not yet receiving benefits; 175 active employees) Contribution requirement: Employer contributions are actuarially determined; employees must contribute 7% of
pensionable earnings; employee contribution requirement may be amended by City ordinance, but employer contribution requirement is subject to State minimums.
Pension plan reporting: The plan issues a financial report as part of the City’s Comprehensive Annual Financial Report each year which contains information about the plan’s fiduciary net position. The plan’s fiduciary net position has been determined on the same basis used by the pension plan under the accrual basis of accounting.
Description of the benefit terms Employees covered: Full-time employees of the City of Tamarac, other than employees directly engaged by
the City Commission, temporary general employees, management employees, firefighters, police officers, and certain employees who were previously allowed to opt out of the plan.
Types of benefits offered: Retirement, disability, and pre-retirement death benefits Basic pension formula: 2.6% of average earnings x service years Early retirement Retirement benefit is reduced by 7/30% for each month by which the participant’s early adjustment: retirement age precedes age 62 Disability pension: Larger of basic pension formula and the lesser of: (i) current salary offset by worker’s
compensation, social security, and LTD benefits, or (ii) ⅔ of current salary (payable until normal retirement age for a service-connected disability)
Larger of benefit payable prior to normal retirement age and basic pension formula reflecting compensation and service during the period of disability (payable after normal retirement age for a service-connected disability)
Larger of basic pension formula and the lesser of: (i) current salary offset by social security and LTD benefits, or (ii) 20% of current salary (payable until normal retirement age for a non-service-connected disability if the participant has at least 10 years of service)
Larger of benefit payable prior to normal retirement age and basic pension formula (payable after normal retirement age for a non-service-connected disability if the participant has at least 10 years of service)
Lesser of: (i) current salary offset by social security and LTD benefits, or (ii) 20% of current salary (payable until normal retirement age for a non-service-connected disability if the participant has between two and 10 years of service)
Basic pension formula (payable after normal retirement age for a non-service-connected disability if the participant has between two and 10 years of service)
Pre-retirement death 50% of basic pension formula or 100% of the participant’s 100% J&C annuity at benefit: earliest retirement age (payable to the beneficiary of a fully vested participant for life
after the participant’s death prior to retirement) Return of accumulated employee contributions (payable to the beneficiary of a non-
vested participant who dies prior to retirement)

CITY OF TAMARAC, FLORIDA
NOTES TO THE FINANCIAL STATEMENTS SEPTEMBER 30, 2016
66
General Employees’ Pension Plan (continued) Normal retirement age: Age 55 with at least 30 years of service or age 62 Early retirement age: Age 55 with at least 10 years of service Vesting requirement: 100% vesting with five years of service Form of payment: Actuarially increased single life annuity 10-year certain and life annuity Any other actuarially equivalent form of payment approved by the Board of Trustees
Single lump sum payment (automatic if the value of the benefit is $3,500 or less; optional if the participant terminates his employment at least 10 years prior to his early retirement age)
Average earnings: Average of the highest 60 consecutive months of total cash remuneration from the City, excluding overtime in excess of 300 hours per year earned after November 8, 2011 and payments for unused leave that accrues after that date
Cost-of-living adjustment: None DROP: A deferred retirement option plan (DROP) is available to those participants who have
reached their normal retirement age and individuals may participate in the DROP for up to 36 months; participants may only enter the DROP within five years following their normal retirement age and, if DROP participation is elected more than two years after normal retirement age, the maximum DROP participation period is reduced by one month for each month that the election is deferred; DROP accounts receive an interest credit equal to the return on the market value of assets minus a ½% administrative charge (or the actual investment return for those participants who elect the self-directed option). As of September 30, 2016 the amount held for DROP participants is $225,413.
Early retirement window: Actively employed participants who attain age 55 with at least 25 years of service on or before December 31,2017 may elect to retire or enter DROP with an unreduced early retirements pension, provided that they make a one-time irrevocable election to terminate their employment or enter the DROP within 180 days of becoming eligible for the unreduced early retirement pension and that they retire or enter the DROP on or before December 31, 2017.
Legal authority: The plan was established effective June 1, 1975 pursuant to City ordinance and has been amended numerous times since that date.
Changes: No significant plan changes were adopted since the prior measurement date.
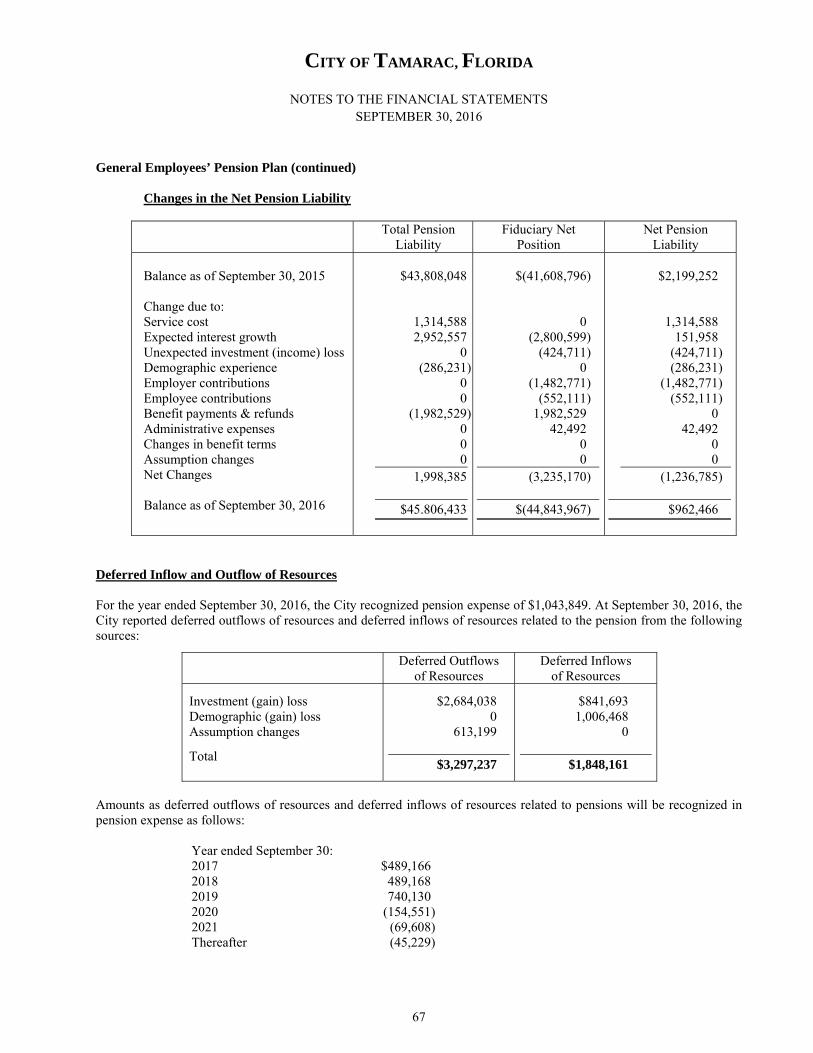
CITY OF TAMARAC, FLORIDA
NOTES TO THE FINANCIAL STATEMENTS SEPTEMBER 30, 2016
67
General Employees’ Pension Plan (continued)
Changes in the Net Pension Liability
Total Pension Liability
Fiduciary Net Position
Net Pension Liability
Balance as of September 30, 2015 Change due to: Service cost Expected interest growth Unexpected investment (income) loss Demographic experience Employer contributions Employee contributions Benefit payments & refunds Administrative expenses Changes in benefit terms Assumption changes Net Changes Balance as of September 30, 2016
$43,808,048
1,314,588 2,952,557
0 (286,231)
0 0
(1,982,529) 0 0 0
1,998,385 $45.806,433
$(41,608,796)
0 (2,800,599)
(424,711) 0
(1,482,771) (552,111)
1,982,529 42,492
0 0
(3,235,170)
$(44,843,967)
$2,199,252
1,314,588 151,958
(424,711) (286,231)
(1,482,771) (552,111)
0 42,492
0 0
(1,236,785)
$962,466
Deferred Inflow and Outflow of Resources For the year ended September 30, 2016, the City recognized pension expense of $1,043,849. At September 30, 2016, the City reported deferred outflows of resources and deferred inflows of resources related to the pension from the following sources:
Deferred Outflows of Resources
Deferred Inflows of Resources
Investment (gain) loss Demographic (gain) loss Assumption changes
Total
$2,684,038 0 613,199 $3,297,237
$841,693 1,006,468 0 $1,848,161
Amounts as deferred outflows of resources and deferred inflows of resources related to pensions will be recognized in pension expense as follows:
Year ended September 30: 2017 $489,166 2018 489,168 2019 740,130 2020 (154,551) 2021 (69,608) Thereafter (45,229)

CITY OF TAMARAC, FLORIDA
NOTES TO THE FINANCIAL STATEMENTS SEPTEMBER 30, 2016
68
General Employees’ Pension Plan (continued) Net Pension Liability as of September 30, 2016 Total pension liability $45,806,433 Less fiduciary net position (44,843,967) Net pension liability $ 962,466
Plan fiduciary net position as a percentage of total pension liability 98%
Information used to determine the Net Pension Liability Employer’s reporting date: September 30, 2016 Measurement date: September 30, 2016 Actuarial valuation date: October 1, 2015 Actuarial assumptions Discount rate: 6.73% per annum (2.80% per annum is attributable to long-term inflation); this rate
was used to discount all future benefit payments. Salary increases: 4.00% per annum; average earnings is loaded to account for unused leave payments. Cost-of-living increases: None assumed Mortality basis: Sex-distinct rates set forth in the RP-2000 Mortality Table for annuitants, projected to
2015 by Scale AA, as published by the Internal Revenue Service (IRS) for purposes of Internal Revenue Code (IRC) section 430; future generational improvements in mortality have not been reflected.
Retirement: 5% of eligible participants are assumed to retire at each of ages 55 through 61 and 100% of eligible participants are assumed to retire at age 62 or upon the attainment of age 55 with at least 30 years of service.
Other decrements: Assumed employment termination is based on age, ranging from 17.20% at age 20 to 1.10% at age 55; assumed disability is based on age, ranging from 0.07% at age 20 to 1.085% at age 55.
Non-investment expenses: 1.25% of future payroll Future contributions: Contributions from the employer and employees are assumed to be made as legally
required. Changes: No assumptions were changed since the prior measurement date. Determination of the Long-term Expected Rate of Return on Assets The long-term expected rate of return on pension plan investments are developed for each major asset class by weighing the expected future real rates of return by the target asset allocation percentage and by adding expected inflation. Best estimates of real rates of return for each major asset class incluced in the pension plan’s target asset allocation as of September 30, 2016 are summarized in the following table:
Investment Category Target Allocation Expected Long-Term Real Return Domestic equity International large cap Bonds Convertible securities Real estate investment trusts Master limited partnerships Total or weighted arithmetic average
37.00% 15.00% 28.00% 10.00% 5.00% 5.00% 100.00%
6.00% per annum 0.10% per annum 1.90% per annum 3.90% per annum 4.10% per annum 11.30% per annum 3.93% per annum

CITY OF TAMARAC, FLORIDA
NOTES TO THE FINANCIAL STATEMENTS SEPTEMBER 30, 2016
69
General Employees’ Pension Plan (continued) The 3.93% money weighted real rate of return expresses investment performance, net of investment expense, adjusted for the changing amounts actually invested. Comparison of Net Pension Liability (Asset) using alternative Discount Rates Discount Rate. The discount rate used to measure the total pension liability was 7%. The projection of cash flows used to determine the discount rate assumes plan members will contribute at the current contribution rate and the City will continue to make future contributions at the actuarially determined contribution rate. Based on those assumptions, the pension plan’s fiduciary net position was projected to be available to make all projected make all future benefit payment of current plan members. Therefore, the long-term expected rate of return on pension plan investment was applied to all periods of projected benefit payments to determine the total pension liability.
Discount Rate Minus 1.00%
6.73% Discount Rate Discount Rate Plus 1.00%
Net pension liability (asset)
$5,999,077
$962,466
$(3,298,901)
B. Police Officers’ Pension Plan Pension Plan Description Name of the pension plan: City of Tamarac Police Officers’ Pension Plan Legal plan administrator: Board of Trustees of the City of Tamarac Police Officers’ Pension Plan, which consists
of five trustees. Two trustees are legal residents of the City appointed by the City Commission. Two trustees are retired police officers, and one trustee is selected by the other four, and appointed, as a ministerial act by the City Commission.
Plan type: Qualified, governmental defined benefit retirement plan; for GASB purposes it is a
single employer plan. The plan status is closed. Number of covered individuals: 36 retirees and beneficiaries of retirees. Contribution requirement: Employer contributions are actuarially determined for the remaining amount necessary
to pay Normal Cost plus amortization of Unfunded Past Service Liability.; Employees must contribute are 5% of earnings. The City shall "pick-up" and pay participant contributions in lieu of after-tax payroll deductions. However, there are no active employees.
Pension plan reporting: The plan issues, as part of the City’s Comprehensive Annual Financial Report, a
financial report each year, which contains information about the plan’s fiduciary net position. The plan’s fiduciary net position has been determined on the same basis used by the pension plan and is equal to the market value of assets calculated under the accrual basis of accounting.
Description of the benefit terms
Employees covered: Full time Police Officers who were members of and who elected to remain in the City of Tamarac Police Officers’ Pension Plan after the City contracted with the Broward Sheriff’s Office as of July 1, 1989 .
Types of benefits offered: Retirement, disability, and pre-retirement death benefits Basic pension formula: 3% of average earnings x service

CITY OF TAMARAC, FLORIDA
NOTES TO THE FINANCIAL STATEMENTS SEPTEMBER 30, 2016
70
Police Officers’ Pension Plan (continued) Early retirement adjustment: Eligible at age 50 with 10 years of service. Retirement benefit is reduced by 3% per
year and payable immediately Disability pension: Service connected disability in the case of permanent incapacity incurred in the line
of duty.
Benefit: The following benefits are payable until normal retirement age, at which time the retirement benefit starts, unless the participant had 10 or more years of service or the disability was service connected, in which case the greater of the disability benefit or the retirement benefit will be payable:
The monthly benefit shall equal the greater of: 1. the participant's accrued benefit, or 2. current monthly base pay minus 100% City Long Term Disability Benefit, 100%
Social Security, and 100% Worker's Compensation, provided the benefit paid does not exceed 75% of the employees average monthly salary, or
3. 42% of Average Monthly Compensation. Normal Form of Benefit: Life Annuity with 120 monthly payments guaranteed; other options are also available. Susidy: For participants retiring on or after 10/1/02, $220 per month, with 120 payments guaranteed. Non-service connected disability in the case of other permanent incapacity incurred after 2 years of service, if not at early or normal retirement age. Benefit: The following benefits are payable until normal retirement age, at which time the retirement benefit starts, unless the participant had 10 or more years of service or the disability was service connected, in which case the greater of the disability benefit or the retirement benefit will be payable: 2-9 Years of Service - The monthly benefit shall equal the current monthly base pay minus 100% City Long Term Disability Benefit and 100% Social Security, provided the benefit paid does not exceed 20% of participant's average monthly salary. 10 Years of Service - The monthly benefit shall equal the greater of: 1. the participant's accrued retirement benefit, or 2. current monthly base pay minus 100% City Long Term Disability Benefit and
100% Social Security, provided the benefit paid does not exceed 35% of police officers average monthly salary, or
3. 25% of Average Monthly Compensation.
Normal Form of Benefit: 2-9 Years of Service Life Annuity 10+ Years of Service Life Annuity with 120 monthly payments guaranteed; other options are also available. Subsidy: For participants retiring on or after 10/1/02, $220 per month, with 120 payments guaranteed.

CITY OF TAMARAC, FLORIDA
NOTES TO THE FINANCIAL STATEMENTS SEPTEMBER 30, 2016
71
Police Officers’ Pension Plan (continued) Pre-retirement death
Eligbility: All vested participants, whether or not still in active employment. Benefit: Greatest of:
1. 100% or the value of the participant's accrued benefit, or 2. 100% survivorship annuity, or 3. participant's total accumulated contributions.
Post-retirement death: Determined by the form of benefit elected upon retirement. A lump sum will be made
of any excess of accumulated Employee Contributions over pension payments made.
Normal retirement age: Earlier of age 57 with 5 years of service, age 55 with 10 years of service, or age 52 with 25 years of service
Early retirement age: Age 50 with at least 10 years of service Vesting requirement: 100% vesting with five years of service Form of payment: Actuarially increased single life annuity 10-year certain and life annuity
Any other actuarially equivalent form of payment approved by the Board of Trustees
Average earnings: Average of the highest 60 consecutive months of total cash remuneration from the City, or Broward Sheriff’s Office.
Cost-of-living adjustment: Each participant receiving normal retirement benefits shall be eligible for an extra
payment of up to 2% of the annual benefit amount paid or payable for the year. Such benefit shall be funded solely by actuarial gains from the corresponding year, if there are accumulated gains.
Share Plan Excess premium tax revenues from the state are allocated annually among eligible
participants on the basis of years of service. Legal authority: The plan was established effective June 1, 1975 pursuant to City ordinance and has
been amended numerous times since that date. Changes: The benefit terms did not change from the prior measurement date.

CITY OF TAMARAC, FLORIDA
NOTES TO THE FINANCIAL STATEMENTS SEPTEMBER 30, 2016
72
Police Officers’ Pension Plan (continued) Changes in the Net Pension Liability
Total Pension Liability
Fiduciary Net Position Net Pension Liability
Balance as of September 30, 2015 Change due to:
Service cost Expected interest growth Unexpected investment income Demographic experience Employer contributions State contributions Benefit payments & refunds Administrative expenses Changes in benefit terms Assumption changes Other Net Changes
Balance as of September 30, 2016
10,609,257
0
689,362 425,538
0 0 0
(1,080,039) 0 0 0 0
34,861 $10,644,118
$(4,828,888)
0 (332,303)
0 0
(515,895) (515,886)
1,080,039 65,966
0 0 0
(218,079)
$(5,046,967)
5,780,368
0 357,061 425,538
0 (515,895) (515,886)
0 65,964
0 0 0
(183,218)
$5,597,150
Deferred Inflow and Outflow of Resources For the year ended September 30, 2016, the City recognized pension expense of $919,674. At September 30, 2016, the City reported deferred outflows of resources and deferred inflows of resources related to pension from the following sources:
Deferred Outflows of Resources
Deferred Inflows of Resources
Investment (gain) loss
$188,837
$8,165
Amounts as deferred outflows of resources and deferred inflows of resources related to pensions will be recognized in pension expense as follows:
Year ended September 30: 2017 $60,905 2018 60,905 2019 60,904 2020 (2,042) 2021 0 Thereafter 0

CITY OF TAMARAC, FLORIDA
NOTES TO THE FINANCIAL STATEMENTS SEPTEMBER 30, 2016
73
Police Officers’ Pension Plan (continued) Net Pension Liability as of September 30, 2016 Total pension liability $10,644,118 Less fiduciary net position (5,046,968) Net pension liability $5,597,150
Plan fiduciary net position as a percentage of total pension liability 47.42%
Information used to determine the Net Pension Liability Employer’s reporting date: September 30, 2016 Measurement date: September 30, 2016 Actuarial valuation date: October 1, 2015 Actuarial assumptions Discount Rate 6.75% Actuarial cost method: Entry age normal Amortization method: Level dollar closed Remaining amortization period: 14 years Asset valuation method: 4-year smoothed market Inflation: 3.0%
Salary increases: NA Investment rate of return: 6.75% Retirement age: NA Mortality: RP-2000 Combined Healthy Participant Mortality Tables for males and females,
projected to reflect future mortality improvement using scale AA (sex distinct tables).
Determination of the Long-term Expected Rate of Return on Plan Assets The long-term expected rate of return on pension plan investments are developed for each major asset class by weighing the expected future real rates of return by the target asset allocation percentage and by adding expected inflation. Best estimates of real rates of return for each major asset class incluced in the pension plan’s target asset allocation as of September 30, 2016 are summarized in the following table:
Investment Category Target Allocation Expected Long-Term Real Return Domestic equity International equity Domestic bonds International Bonds REIT Total or weighted arithmetic average
35.00% 15.00% 30.00% 5.00% 15.00% 100.00%
2.625% per annum 1.275% per annum 0.750% per annum 0.175% per annum 0.675% per annum 5.500% per annum
The 5.50% money weighted real rate of return expresses investment performance, net of investment expense, adjusted for the changing amounts acutally invested.

CITY OF TAMARAC, FLORIDA
NOTES TO THE FINANCIAL STATEMENTS SEPTEMBER 30, 2016
74
Police Officers’ Pension Plan (continued) Comparison of Net Pension Liability using Alternative Discount Rates Discount Rate. The discount rate used to measure the total pension liability was 7%. The projection of cash flows used to determine the discount rate assumes plan members will contribute at the current contribution rate and the City will continue to make future contributions at the actuarially determined contribution rate. Based on those assumptions, the pension plan’s fiduciary net position was projected to be available to make all projected make all future benefit payment of current plan members. Therefore, the long-term expected rate of return on pension plan investment was applied to all periods of projected benefit payments to determine the total pension liability.
Discount Rate Minus 1.00%
6.75% Discount Rate Discount Rate Plus 1.00%
Net pension liability
$6,414,134
$5,597,150
$4,883,533
C. Firefighters’ Pension Plan
Pension Plan Description
Name of the pension plan: City of Tamarac Firefighters’ Pension Plan Legal plan administrator: Board of Trustees of the City of Tamarac Firefighters’ Pension Plan Plan type: Single-employer defined benefit pension plan Number of covered individuals: 134 (37 inactive employees and beneficiaries currently receiving benefits; three
inactive employees entitled to but not yet receiving benefits; 94 active employees, and 5 DROP participants)
Contribution requirement: Employer contributions are actuarially determined; employees must contribute 10.5% of pensionable earnings; employee contribution requirement may be amended by City ordinance, but employer contribution requirement is subject to State minimums.
Pension plan reporting: The plan issues a financial report each year, as part of the City’s Comprehensive Annual Financial Statement, which contains information about the plan’s fiduciary net position. The plan’s fiduciary net position has been determined on the same basis used by the pension plan under the accrual basis of accounting.
Description of the benefit terms Employees covered: Full-time firefighters of the City of Tamarac Types of benefits offered: Retirement, disability, and pre-retirement death benefits Basic pension formula: 3% of average earnings x first 15 years of service + 4% of average earnings x next
10 years of service + 3% of average earnings x service in excess of 25 years Early retirement adjustment: Retirement benefit is reduced by ¼% for each month by which the participant’s early
retirement age precedes age 55 Disability pension: Larger of basic pension formula and the lesser of: (i) average compensation minus
worker’s compensation and LTD benefits, or (ii) 42% of average compensation (payable until normal retirement age for a service-connected disability)
Larger of benefit payable prior to normal retirement age and basic pension formula reflecting compensation and service during the period of disability (payable after normal retirement age for a service-connected disability)
Larger of basic pension formula and the lesser of: (i) average compensation minus LTD benefits, or (ii) 25% of average compensation (payable until normal retirement age for a non-service-connected disability)
Larger of benefit payable prior to normal retirement age and basic pension formula (payable after normal retirement age for a non-service-connected disability)

CITY OF TAMARAC, FLORIDA
NOTES TO THE FINANCIAL STATEMENTS SEPTEMBER 30, 2016
75
Firefighters’ Pension Plan (continued) Pre-retirement death benefit: Basic pension formula (payable to the beneficiary of a fully vested participant for
life after the participant’s death prior to retirement) Return of accumulated employee contributions (payable to the beneficiary of a non-vested participant who dies prior to retirement)
Normal retirement age: Any age with at least 25 years of service, or Age 55 (requires at least eight years of service if hired after 2012) Early retirement age: Age 55 with at least 10 years of service Vesting requirement: 100% vesting with five years of service (if hired prior to 2013) or with eight years of
service (otherwise) Form of payment: Actuarially increased single life annuity
10-year certain and life annuity Any other actuarially equivalent form of payment approved by the Board of Trustees Single lump sum payment (automatic if the value of the benefit is $3,500 or less)
Average earnings: Average of the highest 60 consecutive months of total cash remuneration from the City, excluding overtime in excess of 300 hours per year earned after December 31, 2012 and payments for unused leave that accrues after that date
Retirement subsidy: $10 x service (maximum of $300), payable until age 65 Retirement supplement: 3% of average earnings, reduced for less than 2,496 hours of accrued sick leave Cost-of-living adjustment: 2.25% per annum (for those who retire after May 31, 2013 and who have been
retired for at least five years); 2.50% per annum (applies to the retirement subsidy); no COLA applies to the retirement supplement.
DROP: A deferred retirement option plan (DROP) is available to those participants who have earned at least 25 years of service and individuals may participate in the DROP for up to 60 months; DROP accounts receive an interest credit equal to the return on the market value of assets subject to a 5% to 9% corridor minus a ½% administrative charge (or the actual investment return for those participants who elect the self-directed option). As of September 30, 2016 the amount held for DROP is $1,779,446.
Legal authority: The plan was established effective June 1, 1975 pursuant to City ordinance and has been amended numerous times since that date.
Changes: The benefit terms did not change from the prior measurement date. Changes in the Net Pension Liability
Total Pension Liability
Fiduciary Net Position
Net Pension Liability
Balance as of September 30, 2015 Change due to:
Service cost Expected interest growth Unexpected investment income Demographic experience Employer contributions Employee contributions Benefit payments & refunds Administrative expenses Changes in benefit terms Assumption changes Net changes
Balance as of September 30, 2016
$95,628,893
2,573,593 6,498,728
0 (186,453)
0 0
(3,790,644) 0 0 0
5,095,224
$100,724,117
$(79,636,906)
0 (5,408,287)
(965,167) 0
(4,125,516) (935,054)
3,790,644 40,399
0 0
(7,602,981)
$(87,239,887)
15,991,987
2,573,593 1,090,441 (965,167) (186,453)
(4,125,516) (935,054)
0 40,399
0 0
(2,507,757)
$13,484,231

CITY OF TAMARAC, FLORIDA
NOTES TO THE FINANCIAL STATEMENTS SEPTEMBER 30, 2016
76
Firefighters’ Pension Plan (continued) Deferred Inflows and Outflows of Resources For the year ended September 30, 2016, the City recognized pension expense of $3,156,689. At September 30, 2016, the City reported deferred outflows and deferred inflows of resources related to pension from the following sources:
Deferred Outflows of Resources
Deferred Inflows of Resources
Investment (gain) loss Demographic (gain) loss Assumption changes
Total
$4,430,639 0 857,068 $5,287,707
$2,219,824 2,386,133 0 $4,605,957
Amounts as deferred outflows of resources and deferred inflows of resources related to pensions will be recognized in pension expense as follows:
Year ended September 30: 2017 $387,309 2018 387,309 2019 1,111,153 2020 (365,724) 2021 (172,692) Thereafter (665,605)
Net Pension Liability as of September 30, 2016 Total pension liability $100,724,117 Less fiduciary net position (87,239,886) Net pension liability $13,484,231
Plan fiduciary net position as a percentage of total pension liability 87%
Information used to Determine the Net Pension Liability Employer’s reporting date: September 30, 2016 Measurement date: September 30, 2016 Actuarial valuation date: October 1, 2015 Actuarial assumptions
Discount rate: 6.74% per annum (2.00% per annum is attributable to long-term inflation); this rate was used to discount all future benefit payments.
Salary increases: 4.00% per annum Cost-of-living increases: 2.00% per annum (for those who retired during the period October 1, 2002 through
February 28, 2007) or 2.25% per annum (for those who retire after February 28, 2007 and who have been retired for at least three years) or 2.25% per annum (for those who retire after May 31, 2013 and who have been retired for at least five years); 2.50% per annum (applies to the retirement subsidy); no COLA applies to the retirement supplement.

CITY OF TAMARAC, FLORIDA
NOTES TO THE FINANCIAL STATEMENTS SEPTEMBER 30, 2016
77
Firefighters’ Pension Plan (continued)
Mortality basis: Sex-distinct rates set forth in the RP-2000 Mortality Table for annuitants, projected to 2015 by Scale AA, as published by the Internal Revenue Service (IRS) for purposes of Internal Revenue Code (IRC) section 430; future generational improvements in mortality have not been reflected.
Retirement: Retirement is assumed to occur at the earlier of age 55 or upon the attainment of 25 years of service.
Other decrements: Assumed employment termination is based on age, ranging from 6.00% at age 20 to 0.80% at age 50; assumed disability is based on age, ranging from 0.14% at age 20 to 1.00% at age 50.
Non-investment expenses: 0.20% of the actuarial value of assets Future contributions: Contributions from the employer and employees are assumed to be made as legally
required. Changes: Since the prior measurement date, the mortality basis was changed from a 2007
projection of the RP-2000 Mortality Table to a 2015 projection. Determination of the Long-term Expected Rate of Return on Plan Assets The long-term expected rate of return on pension plan investments are developed for each major asset class by weighing the expected future real rates of return by the target asset allocation percentage and by adding expected inflation. Best estimates of real rates of return for each major asset class incluced in the pension plan’s target asset allocation as of September 30, 2016 are summarized in the following table:
Investment Category Target Allocation Expected Long-Term Real Return
Large cap value equity Large cap growth equity Mid cap value equity Mid cap growth equity International value equity International growth equity Core fixed income Core private real estate
Total or weighted arithmetic average
20.00% 25.00% 5.00% 5.00% 5.00% 5.00% 30.00% 5.00%
100.00%
6.00% per annum 6.18% per annum 6.25% per annum 6.10% per annum 5.85% per annum 5.75% per annum 1.89% per annum 4.62% per annum
4.74% per annum
The 4.74% money weighted real rate of return expresses investment performance, net of investment expense, adjusted for the changing amounts acutally invested. Comparison of Net Pension Liability using Alternative Discount Rates Discount Rate. The discount rate used to measure the total pension liability was 7%. The projection of cash flows used to determine the discount rate assumes plan members will contribute at the current contribution rate and the City will continue to make future contributions at the actuarially determined contribution rate. Based on those assumptions, the pension plan’s fiduciary net position was projected to be available to make all projected make all future benefit payment of current plan members. Therefore, the long-term expected rate of return on pension plan investment was applied to all periods of projected benefit payments to determine the total pension liability.
Discount Rate Minus 1.00%
6.74% Discount Rate Discount Rate Plus 1.00%
Net pension liability
$ 27,021,067
$13,484,231
$ 2,532,108

CITY OF TAMARAC, FLORIDA
NOTES TO THE FINANCIAL STATEMENTS SEPTEMBER 30, 2016
78
D. Elected and Appointed Officers and Non-Represented Employees’ Pension Plan Pension Plan Description Name of the pension plan: City of Tamarac Elected and Appointed Officers and Non-Represented Employees
Retirement Plan Legal plan administrator: Board of Trustees of the City of Tamarac Elected and Appointed Officers and Non-
Represented Employees Retirement Plan, which consists of five trustees who are members of the plan. Two trustees are elected by the members of the plan, two are appointed by the City Manager, and the fifth is appointed by the other four.
Plan type: Single-employer defined benefit pension plan Number of covered individuals: 131 (33 inactive employees and beneficiaries currently receiving benefits; 17 inactive
employees entitled to but not yet receiving benefits; 81 active employees) Contribution requirement: Employer contributions are actuarially determined; employees must contribute 10% of
pensionable earnings; employee contribution requirement may be amended by City ordinance, but employer contribution requirement is subject to State minimums.
Pension plan reporting: The plan issues a financial report each year, as part of the City’s Comprehensive Annual Financial Statement, which contains information about the plan’s fiduciary net position. The plan’s fiduciary net position has been determined on the same basis used by the pension plan calculated under the accrual basis of accounting.
Description of the benefit terms Employees covered: All managerial and non-bargaining employees, as well as charter officers and elected
commissioners, of the City of Tamarac may voluntarily participate in the plan. Subject to certain exceptions, those individuals who were hired on and after October 1, 2005 are required to participate in the plan.
Types of benefits offered: Retirement, disability, and pre-retirement death benefits Basic pension formula: ● 6⅔% of average earnings x service, limited to 80% of average earnings (for elected
officials) ● 4% of average earnings x service, limited to 80% of average earnings (for City
manager & City attorney) ● 3% of average earnings x service, limited to 80% of average earnings (for all other
employees) Early retirement Retirement benefit is reduced by 5% for each year by which the participant’s early adjustment: retirement age precedes age 60 Disability pension: Basic pension formula Pre-retirement death 50% survivor annuity based on the basic pension formula (payable to the beneficiary of benefit: a fully vested participant for life after the participant’s death prior to retirement)
Return of accumulated employee contributions (payable to the beneficiary of a non-vested participant who dies prior to retirement)
Normal retirement age: Age 55 with at least 25 years of service, or Age 57 with at least 20 years of service, or Age 60 with at least five years of service Early retirement age: Age 50 with at least five years of service Vesting requirement: 20% vesting for each year of service, maximum 100% vesting after five years of
service Form of payment: Actuarially increased single life annuity 10-year certain and life annuity Actuarially equivalent joint and contingent annuity Actuarially equivalent joint and contingent annuity with “pop-up” feature
Actuarially equivalent annuity plus a partial lump sum payment, where the lump sum payment is equal to up to three years of benefit payments with simple interest at 4% per year and a refund of the participant’s contributions during this period

CITY OF TAMARAC, FLORIDA
NOTES TO THE FINANCIAL STATEMENTS SEPTEMBER 30, 2016
79
Elected and Appointed Officers and Non-Represented Employees’ Pension Plan (continued) Average earnings: Average of the highest 60 consecutive months of total cash remuneration from the
City, excluding bonuses, employer contributions to another insurance program, non-taxable reimbursements, employer contributions to an IRC 457 plan, payments for unused leave, and overtime in excess of 300 hours per year after June 30, 2011
Cost-of-living adjustment: 2.00% per annum for those who have been retired for at least five years Legal authority: The plan was established effective October 1, 2005 pursuant to City ordinance and has
been amended numerous times since that date. Changes: The benefit terms did not change from the prior measurement date. Changes in the Net Pension Liability (Asset)
Total Pension Liability
Fiduciary Net Position Net Pension Liability (Asset)
Balance as of September 30, 2015 Change due to:
Service cost Expected interest growth Unexpected investment income Demographic experience Employer contributions Employee contributions Benefit payments & refunds Administrative expenses Changes in benefit terms Assumption changes Net change
Balance as of September 30, 2016
$33,905,891
1,944,536 2,476,010
0 (1,509,282)
0 0
(1,632,039) 0 0
7,868,142 9,147,367
$43,053,258
$(34,322,448)
0 (2,446,205)
(364,393) 0
(2,298,244) (627,367)
1,632,039 25,452
0 0
(4,078,718)
$(38,401,166)
$(416,557)
1,944,536 29,805
(364,393) (1,509,282) (2,298,244)
(627,367) 0
25,452 0
7,868,142 5,068,649
$4,652,092

CITY OF TAMARAC, FLORIDA
NOTES TO THE FINANCIAL STATEMENTS SEPTEMBER 30, 2016
80
Elected and Appointed Officers and Non-Represented Employees’ Pension Plan (continued) Deferred Inflow and Outflow of Resources For the year ended September 30, 2016, the City recognized pension expense of $2,314,181. At September 30, 2016, the City reported deferred outflows of resources and deferred inflows of resources related to pension from the following sources:
Deferred Outflows of Resources
Deferred Inflows of Resources
Investment (gain) loss Demographic (gain) loss Assumption changes
Total
$1,870,654 $0 $6,877,192 $8,747,846
$345,509 $2,265,364 $1,396,479 $4,007,352
Amounts as deferred outflows of resources and deferred inflows of resources related to pensions will be recognized in pension expense as follows:
Year ended September 30: 2017 $941,755 2018 941,754 2019 968,750 2020 345,202 2021 418,079 Thereafter 1,124,954
Net Pension Liability as of September 30, 2016 Total pension liability $43,053,258 Less fiduciary net position (38,401,166) Net pension liability $ 4,652,092
Plan fiduciary net position as a percentage of total pension liability 89%
Information used to determine Net Pension Liability Employer’s reporting date: September 30, 2016 Measurement date: September 30, 2016 Actuarial valuation date: October 1, 2015 Actuarial assumptions Discount rate: 7% per annum (2.92% per annum is attributable to long-term inflation); this rate was
used to discount all future benefit payments. Salary increases: 5.00% per annum Cost-of-living increases: 2.00% per annum after participant has been retired for at least five years Mortality basis: Sex-distinct rates set forth in the RP-2000 Mortality Table for annuitants, projected to
2015 by scale AA, as published by the Internal Revenue Service (IRS) for purposes of Internal Revenue Code (IRC) section 430; future generational improvements in mortality have not been reflected.
Retirement: Retirement is assumed to occur at the rate of 5% at each early retirement age and 100% at normal retirement age.
Other decrements: Assumed disability is based on the Wyatt 1985 Disability Study (Class 1).

CITY OF TAMARAC, FLORIDA
NOTES TO THE FINANCIAL STATEMENTS SEPTEMBER 30, 2016
81
Elected and Appointed Officers and Non-Represented Employees’ Pension Plan (continued) Non-investment expenses: 1.00% of covered payroll Future contributions: Contributions from the employer and employees are assumed to be made as legally
required. Changes: Contributions from the employer and employees are assumed to be made as legally
required. Since the prior measurement date, the discount rate was decreased from 9.08% to 7% per annum.
Determination of the Long-term Expected Rate of Return on Plan Assets The long-term expected rate of return on pension plan investments are developed for each major asset class by weighing the expected future real rates of return by the target asset allocation percentage and by adding expected inflation. Best estimates of real rates of return for each major asset class incluced in the pension plan’s target asset allocation as of September 30, 2016 are summarized in the following table:
Investment Category Target Allocation Expected Long-Term Real Return Core bonds Multi-sector U.S. large cap equity U.S. small cap equity Non-U.S. equity Total or weighted arithmetic average
16.00% 24.00% 39.00% 11.00% 10.00% 100.00%
0.58% per annum 1.08% per annum 6.08% per annum 6.83% per annum 6.83% per annum 4.08% per annum
The 4.08% money weighted real rate of return expresses investment performance, net of investment expense, adjusted for the changing amounts acutally invested. Comparison of Net Pension Liability using Alternative Discount Rates Discount Rate. The discount rate used to measure the total pension liability was 7%. The projection of cash flows used to determine the discount rate assumes plan members will contribute at the current contribution rate and the City will continue to make future contributions at the actuarially determined contribution rate. Based on those assumptions, the pension plan’s fiduciary net position was projected to be available to make all projected make all future benefit payment of current plan members. Therefore, the long-term expected rate of return on pension plan investment was applied to all periods of projected benefit payments to determine the total pension liability.
Discount Rate Minus 1.00%
7% Discount Rate Discount Rate Plus 1.00%
Net pension liability
$9,618,383
$4,652,092
$513,043
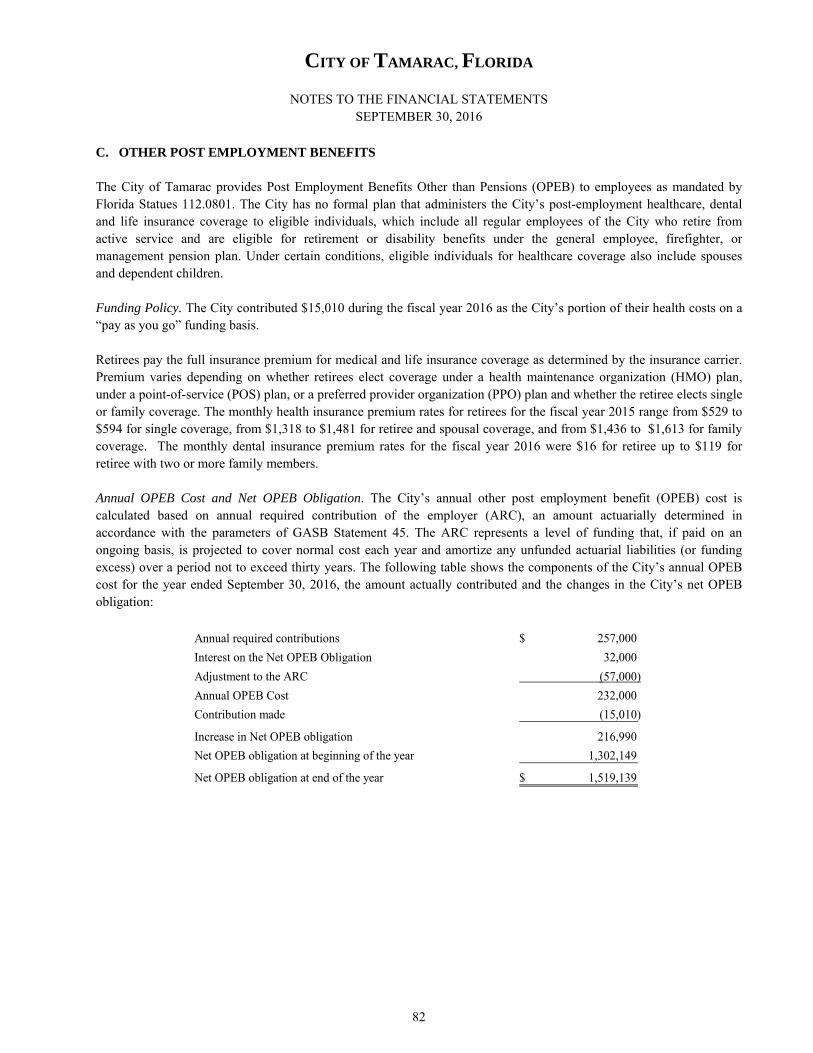
CITY OF TAMARAC, FLORIDA
NOTES TO THE FINANCIAL STATEMENTS SEPTEMBER 30, 2016
82
C. OTHER POST EMPLOYMENT BENEFITS The City of Tamarac provides Post Employment Benefits Other than Pensions (OPEB) to employees as mandated by Florida Statues 112.0801. The City has no formal plan that administers the City’s post-employment healthcare, dental and life insurance coverage to eligible individuals, which include all regular employees of the City who retire from active service and are eligible for retirement or disability benefits under the general employee, firefighter, or management pension plan. Under certain conditions, eligible individuals for healthcare coverage also include spouses and dependent children. Funding Policy. The City contributed $15,010 during the fiscal year 2016 as the City’s portion of their health costs on a “pay as you go” funding basis. Retirees pay the full insurance premium for medical and life insurance coverage as determined by the insurance carrier. Premium varies depending on whether retirees elect coverage under a health maintenance organization (HMO) plan, under a point-of-service (POS) plan, or a preferred provider organization (PPO) plan and whether the retiree elects single or family coverage. The monthly health insurance premium rates for retirees for the fiscal year 2015 range from $529 to $594 for single coverage, from $1,318 to $1,481 for retiree and spousal coverage, and from $1,436 to $1,613 for family coverage. The monthly dental insurance premium rates for the fiscal year 2016 were $16 for retiree up to $119 for retiree with two or more family members. Annual OPEB Cost and Net OPEB Obligation. The City’s annual other post employment benefit (OPEB) cost is calculated based on annual required contribution of the employer (ARC), an amount actuarially determined in accordance with the parameters of GASB Statement 45. The ARC represents a level of funding that, if paid on an ongoing basis, is projected to cover normal cost each year and amortize any unfunded actuarial liabilities (or funding excess) over a period not to exceed thirty years. The following table shows the components of the City’s annual OPEB cost for the year ended September 30, 2016, the amount actually contributed and the changes in the City’s net OPEB obligation:
Annual required contributions 257,000$
Interest on the Net OPEB Obligation 32,000
Adjustment to the ARC (57,000)
Annual OPEB Cost 232,000
Contribution made (15,010)
Increase in Net OPEB obligation 216,990
Net OPEB obligation at beginning of the year 1,302,149
Net OPEB obligation at end of the year 1,519,139$
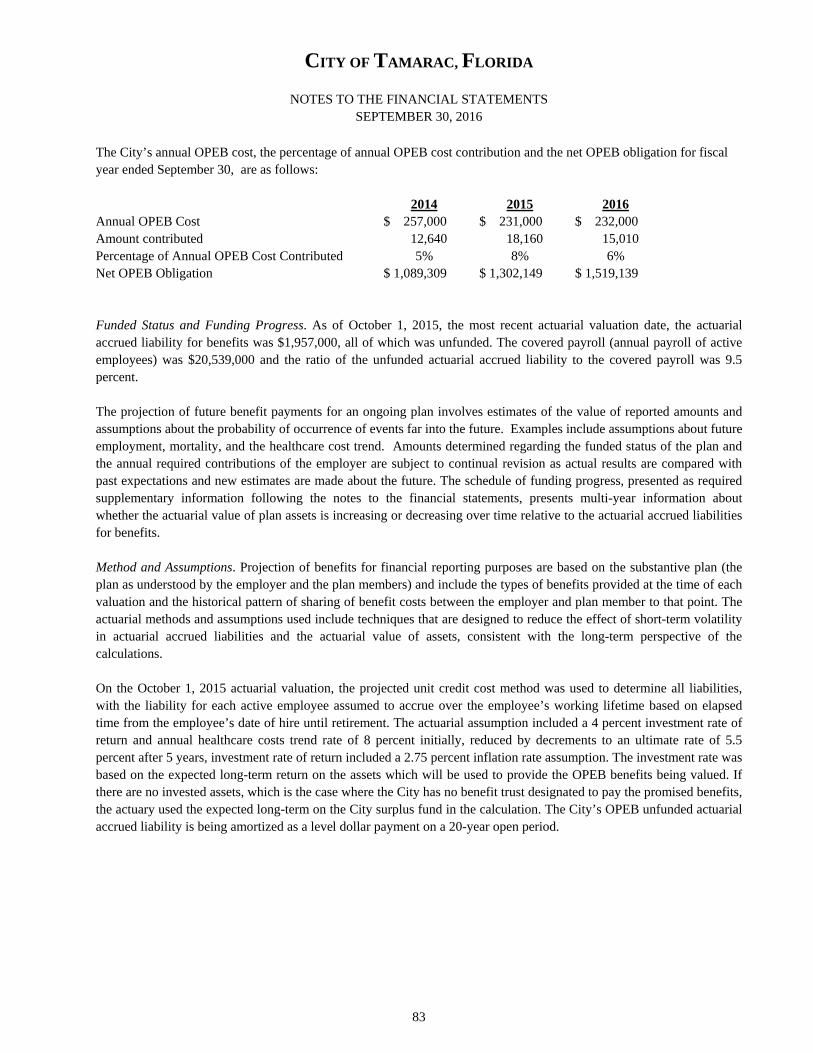
CITY OF TAMARAC, FLORIDA
NOTES TO THE FINANCIAL STATEMENTS SEPTEMBER 30, 2016
83
The City’s annual OPEB cost, the percentage of annual OPEB cost contribution and the net OPEB obligation for fiscal year ended September 30, are as follows: 2014 2015 2016 Annual OPEB Cost $ 257,000 $ 231,000 $ 232,000 Amount contributed 12,640 18,160 15,010 Percentage of Annual OPEB Cost Contributed 5% 8% 6% Net OPEB Obligation $ 1,089,309 $ 1,302,149 $ 1,519,139 Funded Status and Funding Progress. As of October 1, 2015, the most recent actuarial valuation date, the actuarial accrued liability for benefits was $1,957,000, all of which was unfunded. The covered payroll (annual payroll of active employees) was $20,539,000 and the ratio of the unfunded actuarial accrued liability to the covered payroll was 9.5 percent. The projection of future benefit payments for an ongoing plan involves estimates of the value of reported amounts and assumptions about the probability of occurrence of events far into the future. Examples include assumptions about future employment, mortality, and the healthcare cost trend. Amounts determined regarding the funded status of the plan and the annual required contributions of the employer are subject to continual revision as actual results are compared with past expectations and new estimates are made about the future. The schedule of funding progress, presented as required supplementary information following the notes to the financial statements, presents multi-year information about whether the actuarial value of plan assets is increasing or decreasing over time relative to the actuarial accrued liabilities for benefits. Method and Assumptions. Projection of benefits for financial reporting purposes are based on the substantive plan (the plan as understood by the employer and the plan members) and include the types of benefits provided at the time of each valuation and the historical pattern of sharing of benefit costs between the employer and plan member to that point. The actuarial methods and assumptions used include techniques that are designed to reduce the effect of short-term volatility in actuarial accrued liabilities and the actuarial value of assets, consistent with the long-term perspective of the calculations. On the October 1, 2015 actuarial valuation, the projected unit credit cost method was used to determine all liabilities, with the liability for each active employee assumed to accrue over the employee’s working lifetime based on elapsed time from the employee’s date of hire until retirement. The actuarial assumption included a 4 percent investment rate of return and annual healthcare costs trend rate of 8 percent initially, reduced by decrements to an ultimate rate of 5.5 percent after 5 years, investment rate of return included a 2.75 percent inflation rate assumption. The investment rate was based on the expected long-term return on the assets which will be used to provide the OPEB benefits being valued. If there are no invested assets, which is the case where the City has no benefit trust designated to pay the promised benefits, the actuary used the expected long-term on the City surplus fund in the calculation. The City’s OPEB unfunded actuarial accrued liability is being amortized as a level dollar payment on a 20-year open period.

CITY OF TAMARAC, FLORIDA
NOTES TO THE FINANCIAL STATEMENTS SEPTEMBER 30, 2016
84
NOTE 15. OTHER INFORMATION A. RISK MANAGEMENT The City is exposed to various risks of loss related to torts, theft of, damage to, and Bestruction of assets, errors and omissions, injuries to employees, and natural disasters. The risk management program is responsible for administering the City’s insurance, self-insurance, and general safety and loss prevention programs. The City purchases commercial insurance for all types of claims with nominal deductible amounts except for self-insurance risks discussed below. The Florida Legislature pursuant to Florida Statute §768.28, must approve liability awards in excess of $200,000 per person, $300,000 per occurrence against municipalities in the State of Florida. These limits do not apply to action brought in federal courts or to claim relief bills approved by the Florida legislature. The amount of risk retained by the City is limited through the purchase of excess insurance of $2 million with a deductible per occurrence as follows: The City adjusts their insurance program limits and deductibles to enhance and refine the protection afforded. Current deductible limits for the primary insurance lines per occurrence are as follows:
Liabilities are recorded when it is probable that a loss has occurred and the amount of loss can be reasonably estimated. Liabilities include an amount for claims that have been incurred but not reported. Because actual claims liabilities depend on such complex factors as inflation, changes in legal doctrines and damage awards, the process used in computing claims liability does not necessarily result in an exact amount. Claims liabilities are reevaluated periodically to take into consideration recently settled claims, the frequency of claims, and other economic and social factors. Interfund premiums are based primarily upon the insured funds' claims experience and are reported as interfund services provided and used. The claims liability of $822,000 reported at September 30, 2016 in the Insurance Services Fund is based on GASB No. 10, “Accounting and Financial Reporting for Risk Financing and Related Insurance Issues” which requires that a liability for claims be reported if information prior to the issuance of the financial statements indicates that a liability has been incurred at the date of the financial statements and the amount of the loss can be reasonably estimated.
General and auto liability 25,000$
Automobile physical damage 10,000
Workers’ compensation 25,000
Crime 10,000
Property damage 50,000 Property damage (named storm) - 5% of the scheduled value of Real Property, Personal Property, Personal Property of others and Business Income values at the time and place of damage caused by the named storm.

CITY OF TAMARAC, FLORIDA
NOTES TO THE FINANCIAL STATEMENTS SEPTEMBER 30, 2016
85
Changes in the fund's claims liability during the past two fiscal years are as follows:
Current Year
Beginning Claims and Claim End ofYear Ended of Year Changes in Payments Year
September 30 Liability Estimates (Credits) Liability
2015 1,337,000$ 1,565,327$ (1,767,327)$ 1,135,000$ 2016 1,135,000 884,487 (1,197,487) 822,000
The City has not had a significant reduction in insurance coverage from coverage in the prior years’ major categories of risk, and settled claims have not exceeded the City’s retention and excess coverage in force for each of the past three years. B. EMPLOYEES HEALTH INSURANCE The City is partially self-insured for employee’s health insurance. Under the self-insured plan the City pays for medical claims directly based on actual claims submitted by the applicants. The City’s Health Insurance Internal Service Fund is used to account for and finance both uninsured and insured risk of loss related to employee health. Coverages for Health are provided as follows: Self-Insured Retention Aggregate Stop Loss $150,000 $4,947,818 All operating funds in the City participate in the program and make payments in the form of premiums to the Health Insurance Fund based on estimates of the amounts needed to pay prior and current claims. At September 30, 2016 the Health Insurance fund has completed only three years of activities. Changes in the fund's claims liability during the past two fiscal years are as follows:
Current Year
Beginning Claims and Claim End ofYear Ended of Year Changes in Payments Year
September 30 Liability Estimates (Credits) Liability
2015 440,299$ 4,647,992$ (4,621,574)$ 466,717$ 2016 466,717 5,175,660 (5,137,652) 504,725
At September 30, 2016 the fund has an unrestricted net position of $841,608.

CITY OF TAMARAC, FLORIDA
NOTES TO THE FINANCIAL STATEMENTS SEPTEMBER 30, 2016
86
C COMMITMENTS AND CONTINGENCIES
1. Pending litigation The City is defendant in various legal proceedings and claims arising in the ordinary course of operations. Management has instructed legal counsel to vigorously defend these actions and does not expect ultimate liability, if any, to have a material adverse effect on the financial statements of the City. 2. Grants Amounts received and receivables from grantor agencies are subjest to audit and adjustments by grantor agencies, principally the federal government. Any disallowed claims, including amounts already collected, may constitute a liability of the applicable funds. The amount, if any, of expenditures which may be disallowed by the grantor cannot be determined at this time although the City expects such amounts, if any to not be material. 3. Interlocal Agreement with Broward County Sheriff's Office A contract exists between Broward County Sheriff's Office and the City, whereby Broward County Sheriff's Office provides deputy sheriffs to serve the City of Tamarac. These deputy sheriffs are paid through the Broward County Sheriff's Office payroll. The City of Tamarac pays Broward County for the police services based on an ongoing contract with annual renewals. The City recorded expenses of $13,626,957 under this contract for the fiscal year ended September 30, 2016. 4. Interlocal Agreement with Broward County, Florida In 1988, the City entered into an agreement with Broward County, Florida for the transmission, treatment and disposal of wastewater. The charges for service provided by the County include operating, maintenance and debt service charges for the facilities and the County Improvement, Repair, and Replacement Fund Surcharge. The charges are adjusted annually based upon actual costs incurred in the prior year. For the fiscal year ended September 30, 2016, the City recorded expenses of $5,319,660 under this agreement. The agreement will continue in existence and cannot be canceled on any condition except by mutual cancellation agreement between the City and Broward County. Management considers cancellation of this agreement as remote. 5. Interlocal Agreement with City of North Lauderdale, Florida In February 2011 the City entered into an agreement with the City of North Lauderdale to provide fleet maintenance and repairs to the City of North Lauderdale’s Fire Department. In September 2011, this agreement was extended to include the City of North Lauderdale’s Public Works Department. Under this agreement the City of Tamarac provides in-house and contracted service for preventative maintenance and repair services to North Lauderdale’s vehicles and equipment, to include the provision of recommendations on replacement cycles of vehicles and equipment serviced under the agreement. The City of North Lauderdale is charged an annual fee for preventative maintenance and additional charges for all unscheduled repairs to include the cost for labor and parts. The agreement is effective for one (1) year beginning October 1, 2013 for two years with a two (2) year renewal but may be terminated by each party with the provision of sixty (60) days’ notice of the intention to terminate. The City recorded revenue of $194,440 under this contract for the fiscal year ended September 30, 2016.

CITY OF TAMARAC, FLORIDA
NOTES TO THE FINANCIAL STATEMENTS SEPTEMBER 30, 2016
87
6. Golf Course Management Agreement On October 24, 2013 the City entered into a Management Agreement with Billy Casper Golf LLC for the management and operation of the Colony West Golf Course. The agreement is for an initial term of five (5) years beginning November 1, 2013 with one five (5) year renewal. The initial annual agreement requires a base management fee of $7,333 per month and an incentive fee of 15% of positive Net Operating Income in excess of $1 for fiscal years 2014 and 2015. Thereafter the incentive fee will be 15% of positive Net Operating Income in excess of $150,000 but not more that 100% of Base Management Fees paid for the fiscal year. Management fees total $92,679 for fiscal year 2016. 7. Ground Lease Agreement On October 15, 2015 the City entered into a Ground Lease and Sale Agreement (the Agreement) with a private developer to lease City land consisting of approximately +/- 22.00 acres of vacant land and improvements known as Tamarac Village located along NW 57th street between Pine Island Road and NW 94th Avenue. The term of the lease is 99 years from the lease commence date. The lease will commence when the developer’s site plan is approved by the City Commission and the property has been rezoned to allow for the development of the land in accordance with the conceptual site plan. The developer will pay the City annual rent of $100 for leasing the land. As of fiscal year end 2016 the lease has not commenced. The developer intends to construct a mixed-use, mid-rise, multi-family and lifestyle retail development based upon the conceptual site plan consisting of a parcel containing approximately 400 residential dwelling units and a parcel containing approximately 35,000 square feet of commercial, retail, and/or restaurant space. The terms of the Agreement also provides the developer with an option at any time after the lease commencement date to purchase the land based on certain terms and conditions set forth in the Agreement. The developer’s first option will be to purchase the land at a price of $18,620,662 for both the residential and commercial parcels within 30 months of the lease after the commencement date. The purchase price of the land increases incrementally for each 30 month period following the first 30 months of the lease commencement date. Management therefore expects that that the land will be purchased by the developer within the first 30 day period following the lease commencement date. Management further expects the commencement of the lease and sale of the land to the developer to occur in fiscal year 2017. NOTE 15. SUBSEQUENT EVENTS Advanced and Current Refunding On November 9, 2016, via Resolution R-2016-110, the City issued Utility Refunding Revenue Bonds Series 2016A and 2016B (Taxable) in the amount of $21,865,000. The 2016 Utility Refunding Revenue Bonds Series 2016A and 2016B bears interest rates varying from 1% to 5% and matures in varying annual installments through 2046. The refunding resulted in gross debt service savings of approximately $1,083,838, net present value savings of approximately $698,740 or 5.7% of the principal amount refunded, and an economic gain of $663,775. These bonds were issued for the purpose of refunding the Utility Refunding Revenue Bond, Series 2009 as well as financing the cost of improvements to the Utility System.

REQUIRED SUPPLEMENTARY INFORMATION (OTHER THAN MD&A)


Variance withFinal Budget
Actual Amounts PositiveOriginal Final Budgetary Basis (Negative)
Revenues:Taxes 33,362,547$ 33,362,547$ 34,160,144$ 797,597$ Charges for services 1,577,674 1,577,674 2,124,259 546,585 Payment in lieu of taxes 1,901,877 1,863,417 1,863,417 - Intergovernmental 6,240,795 6,240,795 6,569,196 328,401 Licenses and permits 767,144 767,144 750,564 (16,580) Fines and forfeitures 2,103,737 2,103,737 1,568,814 (534,923) Investment income 176,400 176,400 125,099 (51,301) Miscellaneous 11,117,498 11,220,900 8,502,040 (2,718,860)
Total revenues 57,247,672 57,312,614 55,663,533 (1,649,081)
Expenditures:Commission 631,075 631,075 610,295 20,780 City manager 1,770,882 1,811,799 1,522,444 289,355 City attorney 590,580 591,080 568,313 22,767 City clerk 550,742 550,742 505,530 45,212 Human resources 1,276,360 1,277,801 1,154,762 123,039 Finance 2,823,255 2,823,255 2,601,174 222,081 Information technology 2,478,368 2,550,851 1,897,043 653,808 Public works 7,631,688 7,705,758 7,135,312 570,446 Parks and recreation 4,718,824 4,756,247 4,569,067 187,180 Police 14,803,897 14,803,897 14,313,649 490,248 Community development 1,780,365 1,843,475 1,655,322 188,153 Red light camera 1,507,587 1,507,587 966,143 541,444 Non-departmental 3,404,691 3,179,689 2,090,260 1,089,429
Total expenditures 43,968,314 44,033,256 39,589,314 4,443,942
Excess of revenues over expenditures 13,279,358 13,279,358 16,074,219 2,794,861
Other financing sources (uses):Transfers out (13,279,358) (13,279,358) (13,279,358) -
Total other financing uses (13,279,358) (13,279,358) (13,279,358) -
Net change in fund balance -$ -$ 2,794,861 2,794,861$
Budgetary fund balances, October 1 33,591,186
Budgetary fund balances, September 30 36,386,047$
See notes to required supplementary information.
CITY OF TAMARAC, FLORIDABUDGETARY COMPARISON SCHEDULE
GENERAL FUND
FISCAL YEAR ENDED SEPTEMBER 30, 2016
Budgeted Amounts
88
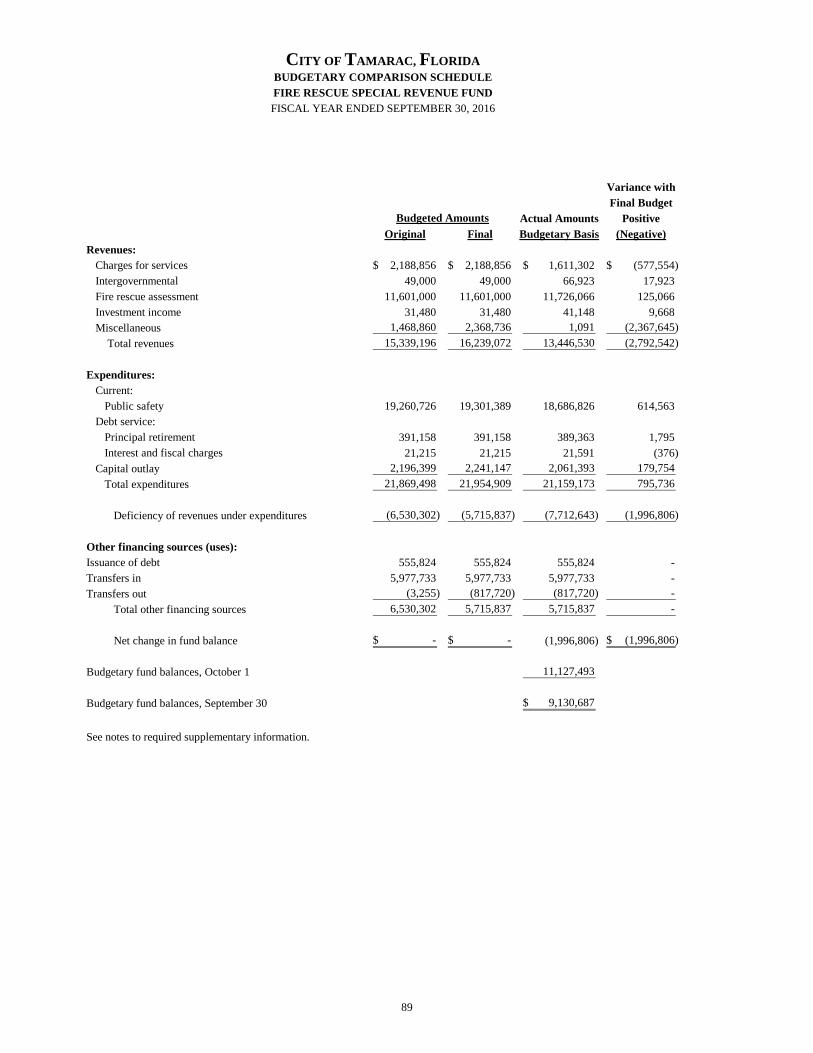
Variance withFinal Budget
Actual Amounts PositiveOriginal Final Budgetary Basis (Negative)
Revenues:Charges for services 2,188,856$ 2,188,856$ 1,611,302$ (577,554)$ Intergovernmental 49,000 49,000 66,923 17,923 Fire rescue assessment 11,601,000 11,601,000 11,726,066 125,066 Investment income 31,480 31,480 41,148 9,668 Miscellaneous 1,468,860 2,368,736 1,091 (2,367,645)
Total revenues 15,339,196 16,239,072 13,446,530 (2,792,542)
Expenditures:Current:
Public safety 19,260,726 19,301,389 18,686,826 614,563 Debt service:
Principal retirement 391,158 391,158 389,363 1,795 Interest and fiscal charges 21,215 21,215 21,591 (376)
Capital outlay 2,196,399 2,241,147 2,061,393 179,754
Total expenditures 21,869,498 21,954,909 21,159,173 795,736
Deficiency of revenues under expenditures (6,530,302) (5,715,837) (7,712,643) (1,996,806)
Other financing sources (uses):Issuance of debt 555,824 555,824 555,824 - Transfers in 5,977,733 5,977,733 5,977,733 - Transfers out (3,255) (817,720) (817,720) -
Total other financing sources 6,530,302 5,715,837 5,715,837 -
Net change in fund balance -$ -$ (1,996,806) (1,996,806)$
Budgetary fund balances, October 1 11,127,493
Budgetary fund balances, September 30 9,130,687$
See notes to required supplementary information.
CITY OF TAMARAC, FLORIDABUDGETARY COMPARISON SCHEDULEFIRE RESCUE SPECIAL REVENUE FUNDFISCAL YEAR ENDED SEPTEMBER 30, 2016
Budgeted Amounts
89

90
CITY OF TAMARAC, FLORIDA
NOTE TO BUDGETARY COMPARISON SCHEDULE REQUIRED SUPPLEMENTARY INFORMATION FISCAL YEAR ENDED SEPTEMBER 30, 2016
A. Budgetary Information
The following procedures are used to establish the budgetary data reflected in the financial statements: Annual budgets are adopted on a basis consistent with accounting principles generally accepted in the United States on all governmental funds except for four (4) special revenue funds: Law Enforcement Forfeiture, Impact Fee, Donations and Sponsorship, Street Improvement, and Affordable Housing Assistance Funds.
1. Prior to July 30 of each year, the City Manager submits to the City Commission a proposed operating budget for the fiscal year commencing the following October 1. The operating budget includes proposed expenditures and the means of financing them.
2. Public hearings are held to obtain taxpayer comments.
3. On or before September 30, the budget is legally enacted by the City Commission through passage of an
Ordinance pursuant to Florida Statute.
4. The level of control at which expenditures may not exceed the budget is at the departmental level. The City Commission approves these levels annually by Ordinance. The City Manager is authorized to transfer budgeted amounts within individual departments; any revisions that alter the total expenditures of any department must be approved by the City Commission. See the separately issued budgetary report on the General Fund’s Statement of Revenues, Expenditures and Changes in Fund – Budget and Actual for the departmental legal level of control.
5. Pursuant to financial policy, every appropriation, except an appropriation for capital improvement projects
and multi-year grants, shall lapse at the close of the fiscal year to the extent that it has not been expended or encumbered. An appropriation for a capital improvement projects or multi-year grant shall continue in force, i.e. not required to be re-budgeted, until the purpose for which it was made has been accomplished or abandoned; the purpose of any such appropriation shall be deemed abandoned if three (3) years pass without any disbursement from an encumbrance of the appropriation unless extended by action of the City Commission.
6. Budgets are adopted on a basis consistent with accounting principles generally accepted in the United States
of America. Annual appropriated budgets are adopted for General, certain Special Revenue, and Debt Service Funds. Project length financial plans and budgets are adopted for the capital project funds.

91
City of Tamarac, Florida EMPLOYEES’ PENSION FUNDS
REQUIRED SUPPLEMENTARY INFORMATION
SCHEDULE OF FUNDING PROGRESS, EMPLOYER CONTRIBUTIONS, CHANGES IN NET PENSION LIABILITY AND RELATED RATIOS
(Unaudited) The actuarial assumptions presented below were determined as part of the actuarial valuations at the dates indicated to determine fiscal year 2016 contributions.
*Per Actuarial Valuation Report on valuation date.
**The General Employees’, Police Officers’ and Firefighters’ plans provide for a 2% cost-of-living adjustment for any year in which the Plan has
an actuarial gain. The General Employees’ had an actuarial gain for fiscal year 2012 and distributed a COLA in fiscal 2013. The Police Officers’
Plan did not have actuarial gains in the current year. The non-represented employees’ plan provides a 2% annual cost-of-living adjustment
beginning January 1 five years after retirement. The firefighters’ plan provides a 2% annual cost-of-living adjustment for participants retiring on
or after October 1, 2008 and a 2.25% cost-of-living adjustment for participants retiring on or after March 1, 2007, beginning January 1 three years
after retirement.
***There is no payroll for the police officers’ plan because it is a closed plan with no active employees. All participants have retired or
terminated with vested benefits.
Elected and Appointed and
Non-represented General PoliceEmployees’ Employees’ Officers’ Firefighters’
Pension Plan Pension Plan Pension Plan Pension PlanContribution rates (% of Payroll): City* 29.58% 17.35% N/A*** 43.13% State of Florida* 0.00% 0.00% N/A*** 11.41% Plan members* 10.00% 7.00% N/A*** 10.50%
Employer contributions made $2,298,244 $1,482,771 $1,031,781 $4,125,516
Actuarial valuation date 10/1/2015 10/1/2015 10/1/2015 10/1/2015
Actuarial cost method* Entry age normal Entry age normal Entry age normal Entry age normal
Amortization method* Level dollar, closed Level dollar, closed Level dollar, closed Level dollar, closed
Asset Valuation Method 5-year smoothed market 3-year smoothed market
4-year smoothed market
3-year smoothed market
Remaining amortization period* 30 years 30 years 14 years 30 years
Actuarial assumptions: Investment rate of return* 7.00% 7.00% 6.75% 7.00% Projected salary increases* 5.00% 4.00% N/A 4.00% Includes inflation at * 3.50% 3.50% 3.00% 3.00% Cost-of-living adjustments applied** 2.00% None** None** 2.25% Retirement age (years) 55-60 55-62 N/A 55 or 25 Yrs Svc Motality RP-2000 RP-2000 RP-2000 RP-2000

92
City of Tamarac, Florida EMPLOYEES’ PENSION FUNDS
REQUIRED SUPPLEMENTARY INFORMATION
SCHEDULE OF FUNDING PROGRESS, EMPLOYER CONTRIBUTIONS, CHANGES IN NET PENSION LIABILITY AND RELATED RATIOS
(Unaudited)
Elected and Appointed Officers and Non-Represented Employees' Pension Fund
2016 2015 2014Total pension liability
Service Cost 1,944,536 1,320,865 1,042,508 Interest 2,476,010 3,123,686 2,553,550 Differences between expected and actual experience (1,509,282) (1,255,372) - Changes of assumptions 7,868,142 (1,852,845) - Benefit payments, including refunds of member contributions (1,632,039) (908,052) (1,409,554) Net change in total pension liability 9,147,367 428,282 2,186,504
Total pension liability - beginning 33,905,891 33,477,609 31,291,105 Total pension liability - ending (a) 43,053,258 33,905,891 33,477,609
Plan fiduciary net position
Contributions - employer 2,298,244 2,129,940 2,129,940 Contributions - members 627,367 735,600 630,346 Net investment income 2,810,599 (83,009) 2,479,375 Benefit payments, including refunds of member contributions (1,632,039) (908,052) (863,463) Administrative expense (25,453) (33,063) (31,033) Net change in plan fiduciary net position 4,078,718 1,841,416 4,345,165
Plan fiduciary net position - beginning 34,322,448 32,481,032 28,135,867 Plan fiduciary net position - ending (b) 38,401,166 34,322,448 32,481,032
City's net pension liability - ending (a) - (b) 4,652,092 (416,557) 996,577
Plan fiduciary net position as a percentage of the total pension liability 89.19% 101.23% 97.02%
Covered-employee payroll 6,712,583 6,474,181 6,303,446
City's net pension liability as a percentage of covered-employee payroll 69.30% -6.43% 15.81%
SCHEDULE OF CHANGES IN THE CITY'S NET PENSION LIABILITY AND RELATED RATIOS
LAST THREE FISCAL YEARS
This schedule is presented to illustrate the requirement to show information for 10 years. However, until a full 10-year trend is compiled, information for those years for which information is available will be presented.

93
City of Tamarac, Florida EMPLOYEES’ PENSION FUNDS
REQUIRED SUPPLEMENTARY INFORMATION
SCHEDULE OF FUNDING PROGRESS, EMPLOYER CONTRIBUTIONS, CHANGES IN NET PENSION LIABILITY AND RELATED RATIOS
(Unaudited)
Elected and Appointed Officers and Non-Represented Employees' Pension Fund
Historical Trend Information
Fiscal Year End
(1) Actuarially Determined Contribution
(2) Contributions
Made in Relation to Actuarially Determined
Contributions
(3) Contribution
Deficiency (Excess)
Covered Payroll
Column (2) as a % of
Covered Payroll
September 30, 2016 September 30, 2015 September 30, 2014 September 30, 2013 September 30, 2012 September 30, 2011 September 30, 2010 September 30, 2009 September 30, 2008 September 30, 2007
$1,855,752 $2,129,940 $2,278,870 $2,211,719 $1,958,981 $1,979,599 $1,363,166 $1,291,224 $896,423 $1,637,317
$2,298,244 $2,129,940 $3,111,821 $2,278,870 $2,211,719 $1,958,981 $1,979,599 $1,363,166 $1,291,224 $896,423
$(442,492) $0 $(981,881) $0 $0 $0 $0 $0 $0 $0
$6,712,583 $6,474,181 $6,303,446 $5,048,120 $4,992,711 $5,261,520 $4,833,856 $4,517,584 $4,701,787 $4,157,248
34.24% 32.90% 49.37% 45.14% 44.30% 37.23% 40.95% 30.17% 27.46% 21.56%
2014 2015 2016 Annual money-weighted rate of return, net of investment expense
4.48% 5.48% 4.08%
[Intentionally Left Blank]

94
City of Tamarac, Florida EMPLOYEES’ PENSION FUNDS
REQUIRED SUPPLEMENTARY INFORMATION
SCHEDULE OF FUNDING PROGRESS, EMPLOYER CONTRIBUTIONS, CHANGES IN NET PENSION LIABILITY AND RELATED RATIOS
(Unaudited)
General Employees’ Pension Fund
2016 2015 2014Total pension liability
Service Cost 1,314,588 1,385,451 1,327,370 Interest 2,952,557 2,837,828 2,713,538 Changes of benefit terms - (258,593) - Differences between expected and actual experience (286,231) (1,062,957) - Changes of assumptions - 857,017 - Benefit payments, including refunds of member contributions (1,982,529) (1,849,346) (1,998,267) Net change in total pension liability 1,998,385 1,909,400 2,042,641
Total pension liability - beginning 43,808,048 41,898,648 39,856,007 Total pension liability - ending (a) 45,806,433 43,808,048 41,898,648
Plan fiduciary net position
Contributions - employer 1,482,771 1,465,206 1,465,206 Contributions - members 552,111 567,806 543,026 Net investment income 3,225,310 (1,451,074) 3,882,084 Benefit payments, including refunds of member contributions (1,982,529) (1,849,346) (1,703,250) Administrative expense (42,492) (54,870) (56,132) Net change in plan fiduciary net position 3,235,171 (1,322,278) 4,130,934
Plan fiduciary net position - beginning 41,608,796 42,931,074 38,800,140 Plan fiduciary net position - ending (b) 44,843,967 41,608,796 42,931,074
City's net pension liability - ending (a) - (b) 962,466 2,199,252 (1,032,426)
Plan fiduciary net position as a percentage of the total pension liability 97.90% 94.98% 102.46%
Covered-employee payroll 7,887,295 8,111,500 7,764,738
City's net pension liability as a percentage of covered-employee payroll 12.20% 27.11% -13.30%
SCHEDULE OF CHANGES IN THE CITY'S NET PENSION LIABILITY AND RELATED RATIOS
LAST THREE FISCAL YEARS
This schedule is presented to illustrate the requirement to show information for 10 years. However, until a full 10-year trend is compiled, information for those years for which information is available will be presented.

95
City of Tamarac, Florida
EMPLOYEES’ PENSION FUNDS
REQUIRED SUPPLEMENTARY INFORMATION SCHEDULE OF FUNDING PROGRESS, EMPLOYER CONTRIBUTIONS, CHANGES IN NET PENSION
LIABILITY AND RELATED RATIOS (Unaudited)
General Employees’ Pension Fund
Historical Trend Information
Fiscal Year End
(1) Actuarially Determined Contribution
(2) Contributions
Made in Relation to Actuarially Determined
Contributions
(3) Contribution
Deficiency (Excess)
Covered Payroll
Column (2) as a % of
Covered Payroll
September 30, 2016 September 30, 2015 September 30, 2014 September 30, 2013 September 30, 2012 September 30, 2011 September 30, 2010 September 30, 2009 September 30, 2008 September 30, 2007
$1,368,447 $1,348,945 $1,465,206 $1,560,203 $1,775,842 $1,732,015 $1,832,030 $1,400,328 $1,170,202 $1,406,440
$1,482,771 $1,465,206 $1,465,206 $2,374,746 $1,775,842 $1,732,015 $1,832,030 $1,400,328 $1,170,202 $1,406,440
$114,324 $116,261 $0 $814,543 $0 $0 $0 $0 $0 $0
$7,887,295 $8,111,500 $7,764,738 $6,591,390 $6,411,284 $6,275,679 $6,544,201 $6,222,769 $6,189,215 $6,278,039
18.80% 18.06% 18.87% 36.03% 27.70% 27.60% 27.99% 22.50% 18.91% 22.40%
2014 2015 2016 Annual money-weighted rate of return, net of investment expense
3.85% 3.93% 3.93%
[Intentionally Left Blank]

96
City of Tamarac, Florida EMPLOYEES’ PENSION FUNDS
REQUIRED SUPPLEMENTARY INFORMATION
SCHEDULE OF NotesFUNDING PROGRESS, EMPLOYER CONTRIBUTIONS, CHANGES IN NET PENSION LIABILITY AND RELATED RATIOS
(Unaudited)
Police Officers’ Pension Fund
2016 2015 2014Total pension liability
Interest 689,361 704,633 689,432 Differences between expected and actual experience 425,538 604,430 - Benefit payments, including refunds of member contributions (1,080,039) (1,068,771) (1,068,563) Net change in total pension liability 34,860 240,292 (379,131)
Total pension liability - beginning 10,609,257 10,368,965 10,748,096 Total pension liability - ending (a) 10,644,117 10,609,257 10,368,965
Plan fiduciary net position
Contributions - employer 515,895 693,807 634,005 Contributions - members 515,886 - - Net investment income 332,303 24,495 379,485 Benefit payments, including refunds of member contributions (1,080,039) (1,068,771) (1,068,563) Administrative expense (65,966) (67,343) (57,817) Net change in plan fiduciary net position 218,079 (417,812) (112,890)
Plan fiduciary net position - beginning 4,828,888 5,246,700 5,359,590 Plan fiduciary net position - ending (b) 5,046,967 4,828,888 5,246,700
City's net pension liability - ending (a) - (b) 5,597,150 5,780,368 5,122,264
Plan fiduciary net position as a percentage of the total pension liability 47.42% 45.52% 50.60%
Covered-employee payroll - - -
City's net pension liability as a percentage of covered-employee payroll N/A N/A N/A
SCHEDULE OF CHANGES IN THE CITY'S NET PENSION LIABILITY AND RELATED RATIOS
LAST THREE FISCAL YEARS
This schedule is presented to illustrate the requirement to show information for 10 years. However, until a full 10-year trend is compiled, information for those years for which information is available will be presented.

97
City of Tamarac, Florida EMPLOYEES’ PENSION FUNDS
REQUIRED SUPPLEMENTARY INFORMATION
SCHEDULE OF FUNDING PROGRESS, EMPLOYER CONTRIBUTIONS, CHANGES IN NET PENSION LIABILITY AND RELATED RATIOS
(Unaudited)
Police Officers’ Pension Fund
Historical Trend Information
Fiscal Year End
(1) Actuarially Determined Contribution
(2) Contributions
Made in Relation to Actuarially Determined
Contributions
(3) Contribution
Deficiency (Excess)
Covered Payroll
Column (3) as a % of
Covered Payroll
September 30, 2016 September 30, 2015 September 30, 2014 September 30, 2013 September 30, 2012 September 30, 2011 September 30, 2010 September 30, 2009 September 30, 2008 September 30, 2007
$749,769 $693,807 $634,005 $568,740 $523,338 $400,226 $364,182 $247,146 $238,889 $280,740
$1,031,781 $693,807 $634,005 $568,740 $523,338 $400,226 $364,182 $247,146 $238,889 $280,740
$0 $0 $0 $0 $0 $0 $0 $0 $0 $0
$0 $0 $0 $0 $0 $0 $0 $0 $0 $0
N/A N/A N/A N/A N/A N/A N/A N/A N/A N/A
2014 2015 2016
Annual money-weighted rate of return, net of investment expense
7.75% 5.50% 5.50%
[Intentionally Left Blank]

98
City of Tamarac, Florida EMPLOYEES’ PENSION FUNDS
REQUIRED SUPPLEMENTARY INFORMATION
SCHEDULE OF FUNDING PROGRESS, EMPLOYER CONTRIBUTIONS, CHANGES IN NET PENSION LIABILITY AND RELATED RATIOS
(Unaudited)
Firefighters' Pension Fund
2016 2015 2014Total pension liability
Service Cost 2,573,593 2,486,578 2,369,205 Interest 6,498,728 6,292,030 5,588,496 Differences between expected and actual experience (186,453) (2,722,163) - Changes of assumptions - 1,052,078 - Benefit payments, including refunds of member contributions (3,790,644) (4,046,517) (3,306,963) Net change in total pension liability 5,095,224 3,062,006 4,650,738
Total pension liability - beginning 95,628,893 92,566,887 87,916,149 Total pension liability - ending (a) 100,724,117 95,628,893 92,566,887
Plan fiduciary net position
Contributions - employer 4,125,516 3,783,852 3,932,396 Contributions - members 935,054 820,904 784,835 Net investment income 6,373,454 (1,936,546) 8,455,590 Benefit payments, including refunds of member contributions (3,790,644) (4,574,071) (2,381,968) Administrative expense (40,399) (58,958) (110,635) Net change in plan fiduciary net position 7,602,981 (1,964,819) 10,680,218
Plan fiduciary net position - beginning 79,636,906 81,601,725 70,921,507 Plan fiduciary net position - ending (b) 87,239,887 79,636,906 81,601,725
City's net pension liability - ending (a) - (b) 13,484,230 15,991,987 11,492,715
Plan fiduciary net position as a percentage of the total pension liability 86.61% 83.28% 87.58%
Covered-employee payroll 7,564,449 7,818,131 7,474,618
City's net pension liability as a percentage of covered-employee payroll 178.26% 204.55% 153.76%
SCHEDULE OF CHANGES IN THE CITY'S NET PENSION LIABILITY AND RELATED RATIOS
LAST THREE FISCAL YEARS
This schedule is presented to illustrate the requirement to show information for 10 years. However, until a full 10-year trend is compiled, information for those years for which information is available will be presented.

99
City of Tamarac, Florida EMPLOYEES’ PENSION FUNDS
REQUIRED SUPPLEMENTARY INFORMATION
SCHEDULE OF FUNDING PROGRESS, EMPLOYER CONTRIBUTIONS, CHANGES IN NET PENSION LIABILITY AND RELATED RATIOS
(Unaudited)
Firefighters' Pension Fund
Historical Trend Information
Fiscal Year End
(1) Actuarially Determined Contribution
(2) Contributions
Made in Relation to Actuarially Determined
Contributions
(3) Contribution
Deficiency (Excess)
Covered Payroll
Column (2) as a % of
Covered Payroll
September 30, 2016 September 30, 2015 September 30, 2014 September 30, 2013 September 30, 2012 September 30, 2011 September 30, 2010 September 30, 2009 September 30, 2008 September 30, 2007
$3,840,846 $3,783,852 $3,932,396 $4,075,841 $4,432,471 $4,302,532 $3,871,068 $3,188,989 $2,948,608 $2,547,399
$4,125,516 $3,783,852 $5,701,022 $4,075,841 $4,432,471 $4,302,532 $3,871,068 $3,188,989 $2,948,608 $2,547,399
$284,670 $0 $1,768,626 $0 $0 $0 $0 $0 $0 $0
$7,564,449 $7,818,131 $7,474,618 $7,077,620 $7,390,906 $6,971,283 $6,839,210 $6,721,811 $6,815,386 $5,356,655
54.54% 48.40% 76.27% 57.59% 59.97% 61.72% 56.60% 47.44% 43.26% 47.56%
2014 2015 2016 Annual money-weighted rate of return, net of investment expense
4.74% 4.74% 4.74%
[Intentionally Left Blank]

100
City of Tamarac, Florida EMPLOYEES’ PENSION FUNDS
REQUIRED SUPPLEMENTARY INFORMATION
SCHEDULE OF FUNDING PROGRESS AND EMPLOYER CONTRIBUTIONS (Unaudited)
City of Tamarac Other Post Employment Benefits (OPEB)
Schedule of Funding Progress
(1)
Actuarial Valuation
Date
(2)
Actuarial Value of Assets (AVA)
(3)
Actuarial Accrued Liability (AAL)
- Entry Age
(4) Unfunded
Actuarial Accrued Liability
(UAAL)(3)-(2)
(5)
Funded Ratio (2)/(3)
(6)
Covered Payroll
(7)
UAAL As % of Covered
Payroll (4)/(6)
10/1/07 $ - $1,250,000 $1,250,000 0% $19,762,000 6.3% 10/1/08 $ - 1,041,000 1,041,000 0 18,633,000 5.6% 10/1/10 $ - 1,041,000 1,041,000 0 18,633,000 5.6% 10/1/11 $ - 2,092,000 2,092,000 0 20,127,000 10.4% 10/1/12 $ - 2,009,000 2,009,000 0 21,322,000 9.4% 10/1/15 $ - 1,957,000 1,957,000 0 20,539,000 9.5%
Schedule of Contributions from Employer
Year ended September 30,
Annual Required
Contribution
City
Contribution
Percentage Contributed
2008 $ 107,000 $ 58,267 54% 2009 140,000 52,374 37% 2010 140,000 37,687 27% 2011 267,000 69,591 26% 2012 270,000 65,573 24% 2013 271,000 75,700 28% 2014 276,000 12,640 5% 2015 254,000 18,160 7% 2016 257,000 15,010 6%


COMBINING FINANCIAL STATEMENTS


NONMAJOR GOVERNMENTAL FUNDS
Special Revenue Funds Special Revenue Funds are used to account for and report the proceeds of specific revenue sources that are restricted or committed to expenditures for specified purposes other than debt service or capital projects. Impact Fee Funds: Consist of: Drainage Improvement Fund – used to account for the collection of drainage impact fees to be used for upgrading drainage and drainage retention. Parks and Recreation Improvement Fund –used to account for the collection of parks and recreation impact fees to be used for the acquisition and development of park and recreation facilities and sites. Trafficways Improvement Fund – used to account for the collection of impact fees to be used for construction or improvement of roads, streets, highways and bridges. Affordable Housing Impact Fees – used to account for the collection of impact fees used for the benefit of the provision of affordable housing. Law Enforcement Forfeiture Funds (State and Federal) – to account for law enforcement related projects funded by the proceeds from forfeited confiscated property. Public Arts Fund – to account for all contributions received from art fees, grants, donations that are restricted for public art projects within the City. Local Option Gas Tax Fund – to account for the collection of gas taxes used to fund the construction of new roads and sidewalks, intersection improvements and improvements of the City’s existing transportation network. Building Department Fund – to account for the collection of permit fees, inspection fees, and other fees and charges, and for the operational expenditures related to the Building Department. Housing Grants Programs: Consist of : Community Development Block Grant Program Fund – used to account for revenue from a grant agreement between the City and the U.S. Department of Housing and Urban Development and expenditures for qualified neighborhood revitalization. The program includes expenditures for housing rehabilitation and public service programs. State Housing Initiative Partnership – used to account for funds received from the State Housing Initiatives Partnership for the purpose of providing affordable housing in the City. Neighborhood Stabilization Program – used to account for funds received from the U.S. Department of Housing and Urban Development to address foreclosures and abandoned properties within the City. Donations and Sponsorship Fund – to account for private donations and sponsorships received from citizens and corporate businesses. Streetscape Improvement Fund – to account for the collection of investment income to be used for public roadways including curbing and medians. State Affordable Housing Assistance Fund – to account for loan programs financed by the State Housing Initiative Partnership grant.
Debt Service Fund
Debt Service Fund – to account for the accumulation of resources transfered from other funds and payment of principal and interest and fiscal charges on the City’s general obligation bonds which are payable from ad valorem taxes and the City’s revenue bonds which are payable from sales tax revenue and non-ad valorem revenues appropriated by the City.
Capital Projects Funds
General Capital Project Fund accounts for the construction of major capital projects other than those financed by the proprietary funds. Public Service Facilities Construction Fund – to account for the proceeds from the Series 2002 Sales Tax Revenue Bonds and impact fees used for the acquisition and construction of capital projects which includes the purchase of land, street improvements, the construction of a fire station, and a development service building. 2005 Capital Improvement Projects Fund – to account for the proceeds from the Series 2005 Capital Improvement Revenue Bonds used for various construction projects including the Sports Complex Expansion and the Recreation center Demolition/Construction. Capital Equipment Fund – to budget for and fund purchases of governmental fund vehicles and equipment. Capital Maintenance Fund – to budget for and fund purchases of governmental fund maintenance equipment. Corridor Improvement Fund – to budget for the execution of arterial corridor study results, specifically sound walls, entryway signage, and streetscape improvements.

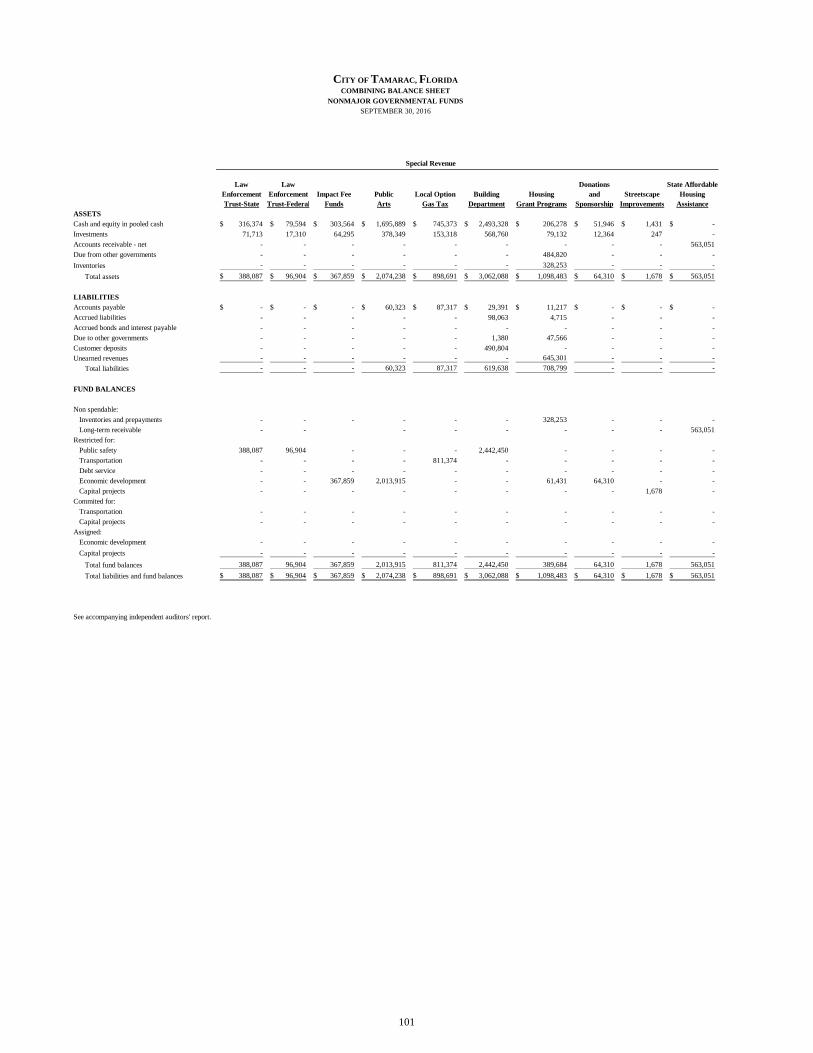
Law Law Donations State AffordableEnforcement Enforcement Impact Fee Public Local Option Building Housing and Streetscape HousingTrust-State Trust-Federal Funds Arts Gas Tax Department Grant Programs Sponsorship Improvements Assistance
ASSETS Cash and equity in pooled cash 316,374$ 79,594$ 303,564$ 1,695,889$ 745,373$ 2,493,328$ 206,278$ 51,946$ 1,431$ -$
Investments 71,713 17,310 64,295 378,349 153,318 568,760 79,132 12,364 247 -
Accounts receivable - net - - - - - - - - - 563,051
Due from other governments - - - - - - 484,820 - - -
Inventories - - - - - - 328,253 - - -
Total assets 388,087$ 96,904$ 367,859$ 2,074,238$ 898,691$ 3,062,088$ 1,098,483$ 64,310$ 1,678$ 563,051$
LIABILITIESAccounts payable -$ -$ -$ 60,323$ 87,317$ 29,391$ 11,217$ -$ -$ -$
Accrued liabilities - - - - - 98,063 4,715 - - -
Accrued bonds and interest payable - - - - - - - - - -
Due to other governments - - - - - 1,380 47,566 - - -
Customer deposits - - - - - 490,804 - - - -
Unearned revenues - - - - - - 645,301 - - -
Total liabilities - - - 60,323 87,317 619,638 708,799 - - -
FUND BALANCES
Non spendable:
Inventories and prepayments - - - - - - 328,253 - - -
Long-term receivable - - - - - - - - 563,051
Restricted for:
Public safety 388,087 96,904 - - - 2,442,450 - - - -
Transportation - - - - 811,374 - - - - -
Debt service - - - - - - - - - -
Economic development - - 367,859 2,013,915 - - 61,431 64,310 - -
Capital projects - - - - - - - - 1,678 -
Commited for:
Transportation - - - - - - - - - -
Capital projects - - - - - - - - - -
Assigned:
Economic development - - - - - - - - - -
Capital projects - - - - - - - - - -
Total fund balances 388,087 96,904 367,859 2,013,915 811,374 2,442,450 389,684 64,310 1,678 563,051
Total liabilities and fund balances 388,087$ 96,904$ 367,859$ 2,074,238$ 898,691$ 3,062,088$ 1,098,483$ 64,310$ 1,678$ 563,051$
See accompanying independent auditors' report.
Special Revenue
CITY OF TAMARAC, FLORIDACOMBINING BALANCE SHEET
NONMAJOR GOVERNMENTAL FUNDSSEPTEMBER 30, 2016
101

ASSETS Cash and equity in pooled cash
Investments
Accounts receivable - net
Due from other governments
Inventories
Total assets
LIABILITIESAccounts payable
Accrued liabilities
Accrued bonds and interest payable
Due to other governments
Customer deposits
Unearned revenues
Total liabilities
FUND BALANCES
Non spendable:
Inventories and prepayments
Long-term receivable
Restricted for:
Public safety
Transportation
Debt service
Economic development
Capital projects
Commited for:
Transportation
Capital projects
Assigned:
Economic development
Capital projects
Total fund balances
Total liabilities and fund balances
See accompanying independent auditors' report.
Total
Nonmajor
Debt Service Governmental
Fund Funds
Public 2005General Services Capital
Debt Service Capital Facilities Improvement Capital Capital CorridorFund Projects Construction Projects Maintenance Equipment Improvement Total
1,164,277$ 8,556,107$ 825,885$ 3,850,743$ 452,075$ 1,477,946$ 3,057,560$ 25,278,370$
215,139 1,347,748 215,139 734,442 - - 613,271 4,471,227
- 76,506 - - - - - 639,557
- 209,517 84,115 - - - - 778,452
- - - - - - - 328,253
1,379,416$ 10,189,878$ 1,125,139$ 4,585,185$ 452,075$ 1,477,946$ 3,670,831$ 31,495,859$
-$ 17,805$ 33,015$ 366,348$ 17,300$ 2,984$ 21,756$ 647,456$
- - - - - - - 102,778
1,090,824 - - - - - - 1,090,824
- 4,749 - - - - - 53,695
- - - - - - - 490,804 - - - - - - - 645,301
1,090,824 22,554 33,015 366,348 17,300 2,984 21,756 3,030,858
- - - - - - - 328,253
- - - - - - - 563,051
- - - - - - - 2,927,441
- - - - - - - 811,374
288,592 - - - - - - 288,592
- - - - - - - 2,507,515
- - 456,063 1,970,720 - - - 2,428,461
- - - - - - - -
- 399,556 470,294 2,215,091 13,998 35,693 1,537,484 4,672,116
- - - - - - 2,111,591 2,111,591
- 9,767,768 165,767 33,026 420,777 1,439,269 - 11,826,607
288,592 10,167,324 1,092,124 4,218,837 434,775 1,474,962 3,649,075 28,465,001
1,379,416$ 10,189,878$ 1,125,139$ 4,585,185$ 452,075$ 1,477,946$ 3,670,831$ 31,495,859$
Capital Projects Fund
CITY OF TAMARAC, FLORIDACOMBINING BALANCE SHEET (Continued)
NONMAJOR GOVERNMENTAL FUNDS SEPTEMBER 30, 2016
102
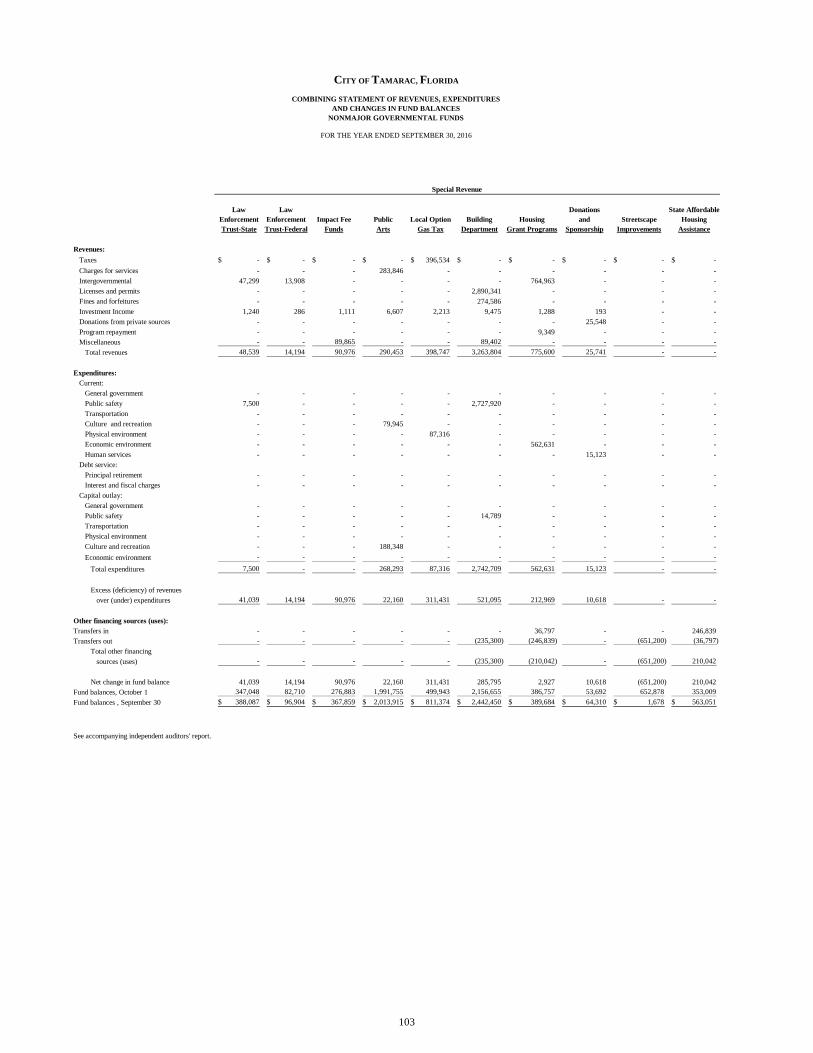
Law Law Donations State AffordableEnforcement Enforcement Impact Fee Public Local Option Building Housing and Streetscape HousingTrust-State Trust-Federal Funds Arts Gas Tax Department Grant Programs Sponsorship Improvements Assistance
Revenues:
Taxes -$ -$ -$ -$ 396,534$ -$ -$ -$ -$ -$
Charges for services - - - 283,846 - - - - - -
Intergovernmental 47,299 13,908 - - - - 764,963 - - -
Licenses and permits - - - - - 2,890,341 - - - -
Fines and forfeitures - - - - - 274,586 - - - -
Investment Income 1,240 286 1,111 6,607 2,213 9,475 1,288 193 - -
Donations from private sources - - - - - - - 25,548 - -
Program repayment - - - - - - 9,349 - - -
Miscellaneous - - 89,865 - - 89,402 - - - -
Total revenues 48,539 14,194 90,976 290,453 398,747 3,263,804 775,600 25,741 - -
Expenditures:Current:
General government - - - - - - - - - -
Public safety 7,500 - - - - 2,727,920 - - - -
Transportation - - - - - - - - - -
Culture and recreation - - - 79,945 - - - - - -
Physical environment - - - - 87,316 - - - - -
Economic environment - - - - - - 562,631 - - -
Human services - - - - - - - 15,123 - -
Debt service:
Principal retirement - - - - - - - - - -
Interest and fiscal charges - - - - - - - - - -
Capital outlay:
General government - - - - - - - - - -
Public safety - - - - - 14,789 - - - -
Transportation - - - - - - - - - -
Physical environment - - - - - - - - - -
Culture and recreation - - - 188,348 - - - - - -
Economic environment - - - - - - - - - -
Total expenditures 7,500 - - 268,293 87,316 2,742,709 562,631 15,123 - -
Excess (deficiency) of revenues
over (under) expenditures 41,039 14,194 90,976 22,160 311,431 521,095 212,969 10,618 - -
Other financing sources (uses):Transfers in - - - - - - 36,797 - - 246,839
Transfers out - - - - - (235,300) (246,839) - (651,200) (36,797)
Total other financing
sources (uses) - - - - - (235,300) (210,042) - (651,200) 210,042
Net change in fund balance 41,039 14,194 90,976 22,160 311,431 285,795 2,927 10,618 (651,200) 210,042
Fund balances, October 1 347,048 82,710 276,883 1,991,755 499,943 2,156,655 386,757 53,692 652,878 353,009
Fund balances , September 30 388,087$ 96,904$ 367,859$ 2,013,915$ 811,374$ 2,442,450$ 389,684$ 64,310$ 1,678$ 563,051$
See accompanying independent auditors' report.
Special Revenue
CITY OF TAMARAC, FLORIDA
COMBINING STATEMENT OF REVENUES, EXPENDITURESAND CHANGES IN FUND BALANCES
NONMAJOR GOVERNMENTAL FUNDS
FOR THE YEAR ENDED SEPTEMBER 30, 2016
103

Revenues:
Taxes
Charges for services
Intergovernmental
Licenses and permits
Fines and forfeitures
Investment Income
Donations from private sources
Program repayment
Miscellaneous
Total revenues
Expenditures:Current:
General government
Public safety
Transportation
Culture and recreation
Physical environment
Economic environment
Human services
Debt service:
Principal retirement
Interest and fiscal charges
Capital outlay:
General government
Public safety
Transportation
Physical environment
Culture and recreation
Economic environment
Total expenditures
Excess (deficiency) of revenues
over (under) expenditures
Other financing sources (uses):Transfers in
Transfers out
Total other financing
sources (uses)
Net change in fund balance
Fund balances, October 1
Fund balances , September 30
See accompanying independent auditors' report.
Total
Nonmajor
Debt Service GovernmentalFund Funds
Public 2005General Services Capital
Debt Service Capital Facilities Improvement Capital Capital CorridorFund Projects Construction Projects Maintenance Equipment Improvement
266,402$ 719,390$ -$ -$ -$ -$ -$ 1,382,326$
- - - - - - - 283,846
- 194,172 584,962 - - 2,250,554 - 3,855,858
- - - - - - - 2,890,341
- - - - - - - 274,586
3,490 29,460 4,120 11,823 874 3,820 9,676 85,676
- - - - - - - 25,548
- - - - - - - 9,349 - - - - - 181,677 264,500 625,444
269,892 943,022 589,082 11,823 874 2,436,051 274,176 9,432,974
- 25,000 - - - - - 25,000
- - - - - - - 2,735,420
- - 35,568 - - - - 35,568
- - - - 43,906 - - 123,851
- - - - - - 23,425 110,741
- - - - - - - 562,631
- - - - - - - 15,123
1,991,328 - - - - - - 1,991,328
790,150 - - - - - - 790,150
- 161,460 - - 22,193 127,062 - 310,715
- - - - - 2,511,667 - 2,526,456
- 37,175 513,985 1,321,035 - - - 1,872,195
- 6,430 - - - - 121,035 127,465
- 729,404 - - - - - 917,752
- - - - - - - -
2,781,478 959,469 549,553 1,321,035 66,099 2,638,729 144,460 12,144,395
(2,511,586) (16,447) 39,529 (1,309,212) (65,225) (202,678) 129,716 (2,711,421)
2,537,800 1,710,300 - 2,614,465 500,000 262,000 1,651,200 9,559,401 - (551,000) (1,249,000) - - - - (2,970,136)
2,537,800 1,159,300 (1,249,000) 2,614,465 500,000 262,000 1,651,200 6,589,265
26,214 1,142,853 (1,209,471) 1,305,253 434,775 59,322 1,780,916 3,877,844 262,378 9,024,471 2,301,595 2,913,584 - 1,415,640 1,868,159 24,587,157
288,592$ 10,167,324$ 1,092,124$ 4,218,837$ 434,775$ 1,474,962$ 3,649,075$ 28,465,001$
Capital Projects Fund
CITY OF TAMARAC, FLORIDA
COMBINING STATEMENT OF REVENUES, EXPENDITURESAND CHANGES IN FUND BALANCES
NONMAJOR GOVERNMENTAL FUNDS (Continued)
FOR THE YEAR ENDED SEPTEMBER 30, 2016
104

Variance with
Final Budget
Actual Amounts Positive
Original Final Budgetary Basis (Negative)
Revenues:
Charges for services 150,000$ 150,000$ 283,846$ 133,846$
Investment income 4,000 4,000 6,607 2,607
Miscellaneous 681,000 681,000 - (681,000)
Total revenues 835,000 835,000 290,453 (544,547)
Expenditures:
Current:
Culture / recreation 85,000 135,150 79,945 55,205
Capital Outlay:
Culture / recreation 750,000 699,850 188,348 511,502
Total expenditures 835,000 835,000 268,293 566,707
Excess of revenues
over expenditures - - 22,160 22,160
Net change in fund balance -$ -$ 22,160 22,160$
Fund balances at beginning of year 1,991,755
Fund balances at end of year 2,013,915$
See accompanying independent auditors' report.
Variance with
Final Budget
Actual Amounts Positive
Original Final Budgetary Basis (Negative)
Revenues:
Taxes 373,500$ 373,500$ 396,534$ 23,034$
Investment income 2,000 2,000 2,213 213
Miscellaneous 451,706 451,706 - (451,706)
Total revenues 827,206 827,206 398,747 (428,459)
Expenditures:
Current:
Physical environment 576,400 576,400 87,316 489,084
Total expenditures 576,400 576,400 87,316 489,084
Excess of revenues over expenditures 250,806 250,806 311,431 (60,625)
Other financing uses:
Reserves (250,806) (250,806) - 250,806
Total other financing uses (250,806) (250,806) - 250,806
Net change in fund balance -$ -$ 311,431 311,431$
Fund balances at beginning of year 499,943
Fund balances at end of year 811,374$
See accompanying independent auditors' report.
Budgeted Amounts
Budgeted Amounts
CITY OF TAMARAC, FLORIDALOCAL OPTION GAS TAX FUND
BUDGETARY COMPARISON SCHEDULE
FOR THE YEAR ENDED SEPTEMBER 30, 2016
CITY OF TAMARAC, FLORIDAPUBLIC ARTS FUND
BUDGETARY COMPARISON SCHEDULE
FOR THE YEAR ENDED SEPTEMBER 30, 2016
105

Variance with
Final Budget
Actual Amounts Positive
Original Final Budgetary Basis (Negative)
Revenues: Licenses and permits 2,549,000$ 2,549,000$ 2,890,341$ 341,341$
Fines and forfeitures 140,000 140,000 274,586 134,586
Investment Income 2,000 2,000 9,475 7,475
Miscellaneous 344,400 359,485 89,402 (270,083)
Total revenues 3,035,400 3,050,485 3,263,804 213,319
Expenditures:
Current:
Public safety 2,786,900 2,801,985 2,727,920 74,065
Capital Outlay:
Public safety 13,200 13,200 14,789 (1,589)
Total expenditures 2,800,100 2,815,185 2,742,709 72,476
Excess of revenues over expenditures 235,300 235,300 521,095 285,795
Other financing uses:Transfers out (235,300) (235,300) (235,300) -
Total other financing uses (235,300) (235,300) (235,300) -
Net change in fund balance -$ -$ 285,795 285,795$
Fund balances at beginning of year 2,156,655
Fund balances at end of year 2,442,450$
See accompanying independent auditors' report.
Variance with
Final Budget
Actual Amounts Positive
Original Final Budgetary Basis (Negative)
Revenues:
Intergovernmental 1,174,739$ 1,198,471$ 764,963$ (433,508)$
Investment income - - 1,288 1,288
Program repayment - - 9,349 9,349
Total revenues 1,174,739 1,198,471 775,600 (422,871)
Expenditures:
Current:
Economic environment 908,892 824,490 562,631 261,859
Capital Outlay:
Economic environment - 99,402 - 99,402
Total expenditures 908,892 923,892 562,631 361,261
Excess (deficiency) of revenues over (under) expenditures 265,847 274,579 212,969 (61,610)
Other financing uses:Transfers in - - 36,797 36,797
Transfers out (265,847) (274,579) (246,839) 27,740
Total other financing (uses) (265,847) (274,579) (210,042) 64,537
Net change in fund balance -$ -$ 2,927 2,927$
Fund balances at beginning of year 386,757
Fund balances at end of year 389,684$
See accompanying independent auditors' report.
Budgeted Amounts
CITY OF TAMARAC, FLORIDAHOUSING GRANT PROGRAMS FUND
BUDGETARY COMPARISON SCHEDULEFOR THE YEAR ENDED SEPTEMBER 30, 2016
CITY OF TAMARAC, FLORIDABUILDING DEPARTMENT FUND
BUDGETARY COMPARISON SCHEDULEFOR THE YEAR ENDED SEPTEMBER 30, 2016
Budgeted Amounts
106

Variance with
Final Budget
Actual Amounts Positive
Original Final Budgetary Basis (Negative)
Revenues:
Taxes 263,600$ 263,600$ 266,402$ 2,802$
Investment income 3,000 3,000 3,490 490
Total revenues 266,600 266,600 269,892 3,292
Expenditures:
Debt service:
Principal 1,991,500 1,991,500 1,991,328 172
Interest and fiscal charges 812,900 812,900 790,150 22,750
Total expenditures 2,804,400 2,804,400 2,781,478 22,922
Deficiency of revenues
under expenditures (2,537,800) (2,537,800) (2,511,586) 26,214
Other financing sources:Transfers in 2,537,800 2,537,800 2,537,800 -
Total other financing sources 2,537,800 2,537,800 2,537,800 -
Net change in fund balance -$ -$ 26,214 26,214$
Fund balances at beginning of year 262,378
Fund balances at end of year 288,592$
See accompanying independent auditors' report.
CITY OF TAMARAC, FLORIDA DEBT SERVICE FUND
BUDGETARY COMPARISON SCHEDULE
FOR THE YEAR ENDED SEPTEMBER 30, 2016
Budgeted Amounts
107
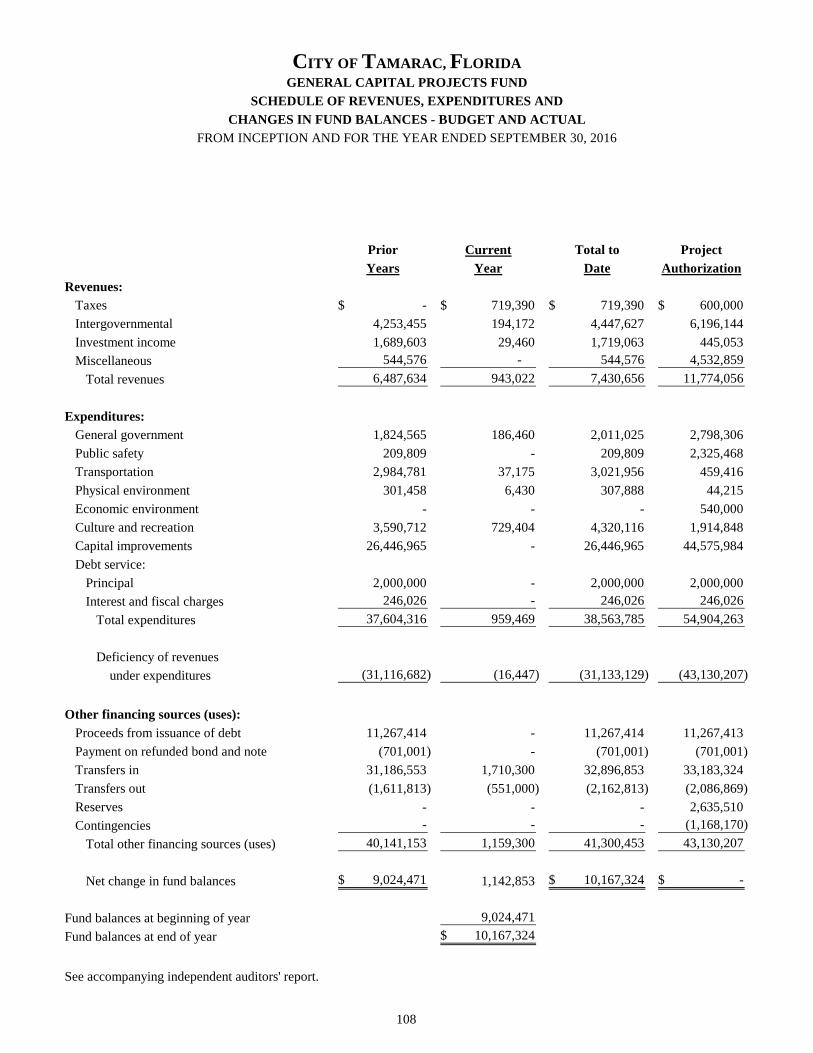
Prior Current Total to Project
Years Year Date Authorization
Revenues:
Taxes -$ 719,390$ 719,390$ 600,000$
Intergovernmental 4,253,455 194,172 4,447,627 6,196,144
Investment income 1,689,603 29,460 1,719,063 445,053
Miscellaneous 544,576 - 544,576 4,532,859
Total revenues 6,487,634 943,022 7,430,656 11,774,056
Expenditures:
General government 1,824,565 186,460 2,011,025 2,798,306
Public safety 209,809 - 209,809 2,325,468
Transportation 2,984,781 37,175 3,021,956 459,416
Physical environment 301,458 6,430 307,888 44,215
Economic environment - - - 540,000
Culture and recreation 3,590,712 729,404 4,320,116 1,914,848
Capital improvements 26,446,965 - 26,446,965 44,575,984
Debt service:
Principal 2,000,000 - 2,000,000 2,000,000
Interest and fiscal charges 246,026 - 246,026 246,026
Total expenditures 37,604,316 959,469 38,563,785 54,904,263
Deficiency of revenues
under expenditures (31,116,682) (16,447) (31,133,129) (43,130,207)
Other financing sources (uses):
Proceeds from issuance of debt 11,267,414 - 11,267,414 11,267,413
Payment on refunded bond and note (701,001) - (701,001) (701,001)
Transfers in 31,186,553 1,710,300 32,896,853 33,183,324
Transfers out (1,611,813) (551,000) (2,162,813) (2,086,869)
Reserves - - - 2,635,510
Contingencies - - - (1,168,170)
Total other financing sources (uses) 40,141,153 1,159,300 41,300,453 43,130,207
Net change in fund balances 9,024,471$ 1,142,853 10,167,324$ -$
Fund balances at beginning of year 9,024,471
Fund balances at end of year 10,167,324$
See accompanying independent auditors' report.
CITY OF TAMARAC, FLORIDAGENERAL CAPITAL PROJECTS FUND
SCHEDULE OF REVENUES, EXPENDITURES AND
CHANGES IN FUND BALANCES - BUDGET AND ACTUAL
FROM INCEPTION AND FOR THE YEAR ENDED SEPTEMBER 30, 2016
108
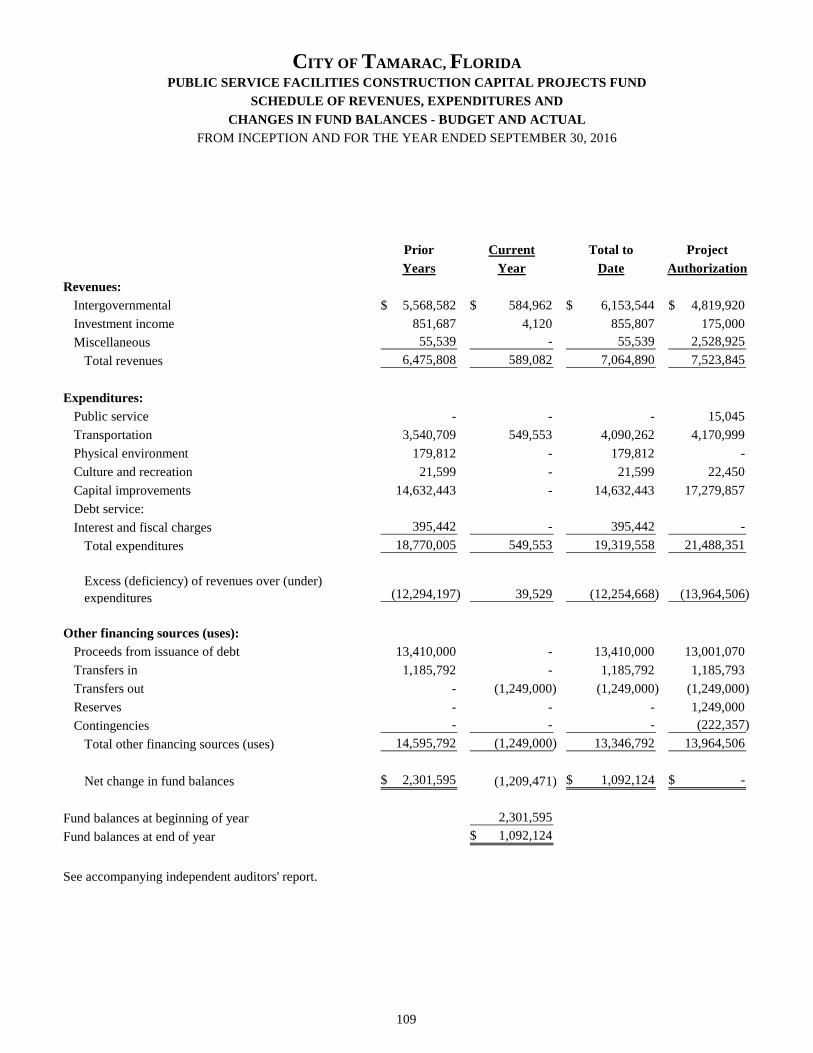
Prior Current Total to Project
Years Year Date Authorization
Revenues:
Intergovernmental 5,568,582$ 584,962$ 6,153,544$ 4,819,920$
Investment income 851,687 4,120 855,807 175,000
Miscellaneous 55,539 - 55,539 2,528,925
Total revenues 6,475,808 589,082 7,064,890 7,523,845
Expenditures:
Public service - - - 15,045
Transportation 3,540,709 549,553 4,090,262 4,170,999
Physical environment 179,812 - 179,812 -
Culture and recreation 21,599 - 21,599 22,450
Capital improvements 14,632,443 - 14,632,443 17,279,857
Debt service:
Interest and fiscal charges 395,442 - 395,442 -
Total expenditures 18,770,005 549,553 19,319,558 21,488,351
Excess (deficiency) of revenues over (under) expenditures (12,294,197) 39,529 (12,254,668) (13,964,506)
Other financing sources (uses):
Proceeds from issuance of debt 13,410,000 - 13,410,000 13,001,070
Transfers in 1,185,792 - 1,185,792 1,185,793
Transfers out - (1,249,000) (1,249,000) (1,249,000)
Reserves - - - 1,249,000
Contingencies - - - (222,357)
Total other financing sources (uses) 14,595,792 (1,249,000) 13,346,792 13,964,506
Net change in fund balances 2,301,595$ (1,209,471) 1,092,124$ -$
Fund balances at beginning of year 2,301,595
Fund balances at end of year 1,092,124$
See accompanying independent auditors' report.
CITY OF TAMARAC, FLORIDA
FROM INCEPTION AND FOR THE YEAR ENDED SEPTEMBER 30, 2016
PUBLIC SERVICE FACILITIES CONSTRUCTION CAPITAL PROJECTS FUND
SCHEDULE OF REVENUES, EXPENDITURES AND
CHANGES IN FUND BALANCES - BUDGET AND ACTUAL
109

Prior Current Total to Project
Years Year Date Authorization
Revenues:
Intergovernmental 160,215$ -$ 160,215$ 142,587$
Investment income 1,785,287 11,823 1,797,110 40,000
Miscellaneous revenues 127 - 127 4,039,276
Total revenues 1,945,629 11,823 1,957,452 4,221,863
Expenditures:
General government 4,000 - 4,000 -
Public safety 17,159 - 17,159 3,800,465
Transportation 1,634,687 1,321,035 2,955,722 1,874,465
Culture and recreation 726,515 - 726,515 611,680
Capital improvements 11,681,883 - 11,681,883 17,948,818
Debt service:
Interest and fiscal charges 395,498 - 395,498 349,803
Total expenditures 14,459,742 1,321,035 15,780,777 24,585,231
Deficiency of revenues
under expenditures (12,514,113) (1,309,212) (13,823,325) (20,363,368)
Other financing sources (uses):
Proceeds from issuance of debt 15,027,697 - 15,027,697 17,000,000
Transfers in 400,000 2,614,465 3,014,465 3,014,465
Reserves - - - 940,000
Contingencies - - - (591,097)
Total other financing sources 15,427,697 2,614,465 18,042,162 20,363,368
Net change in fund balances 2,913,584$ 1,305,253 4,218,837$ -$
Fund balances at beginning of year 2,913,584
Fund balances at end of year 4,218,837$
See accompanying independent auditors' report.
CITY OF TAMARAC, FLORIDA2005 CAPITAL IMPROVEMENT PROJECT FUND
SCHEDULE OF REVENUES, EXPENDITURES AND
CHANGES IN FUND BALANCES - BUDGET AND ACTUAL
FROM INCEPTION AND FOR THE YEAR ENDED SEPTEMBER 30, 2016
110

Prior Current Total to Project
Years Year Date Authorization
Revenues:
Investment income -$ 874$ 874$ -$
Total revenues - 874 874 -
Expenditures:
General government - 22,193 22,193 95,000
Culture and recreation - 43,906 43,906 58,204
Total expenditures - 66,099 66,099 153,204
Deficiency of revenues
under expenditures - (65,225) (65,225) (153,204)
Other financing sources:
Transfers in - 500,000 500,000 500,000
Transfers out - - -
Contingencies - - - (346,796)
Total other financing sources - 500,000 500,000 153,204
Net change in fund balances -$ 434,775 434,775$ -$
Fund balances at beginning of year -
Fund balances at end of year 434,775$
See accompanying independent auditors' report.
CITY OF TAMARAC, FLORIDACAPITAL MAINTENANCE FUND
SCHEDULE OF REVENUES, EXPENDITURES AND
CHANGES IN FUND BALANCES - BUDGET AND ACTUAL
FROM INCEPTION AND FOR THE YEAR ENDED SEPTEMBER 30, 2016
111

Prior Current Total to Project
Years Year Date Authorization
Revenues:
Intergovernmental -$ 2,250,554$ 2,250,554$ 2,782,500$
Investment income 18,613 3,820 22,433 -
Miscellaneous revenues 68,373 181,677 250,050 1,120,554
Total revenues 86,986 2,436,051 2,523,037 3,903,054
Expenditures:
General government 1,406,560 127,062 1,533,622 3,519,067
Public safety 634,565 2,511,667 3,146,232 4,008,339
Transportation 224,573 - 224,573 113,000
Physical environment - - - 10,000
Total expenditures 2,265,698 2,638,729 4,904,427 7,650,406
Deficiency of revenues
under expenditures (2,178,712) (202,678) (2,381,390) (3,747,352)
Other financing sources:
Transfers in 3,594,352 262,000 3,856,352 3,856,352
Reserves - - - 128,000
Contingencies - - - (237,000)
Total other financing sources 3,594,352 262,000 3,856,352 3,747,352
Net change in fund balances 1,415,640$ 59,322 1,474,962$ -$
Fund balances at beginning of year 1,415,640
Fund balances at end of year 1,474,962$
See accompanying independent auditors' report.
CITY OF TAMARAC, FLORIDACAPITAL EQUIPMENT FUND
SCHEDULE OF REVENUES, EXPENDITURES AND
CHANGES IN FUND BALANCES - BUDGET AND ACTUAL
FROM INCEPTION AND FOR THE YEAR ENDED SEPTEMBER 30, 2016
112

Prior Current Total to Project
Years Year Date Authorization
Revenues:
Intergovernmental -$ -$ -$ 532,697$
Investment income 6,020 9,676 15,696 -
Miscellaneous revenues - 264,500 264,500 -
Total revenues 6,020 274,176 280,196 532,697
Expenditures:
Physical environment 137,861 144,460 282,321 4,591,045
Total expenditures 137,861 144,460 282,321 4,591,045
Deficiency of revenues
under expenditures (131,841) 129,716 (2,125) (4,058,348)
Other financing sources (uses):
Transfers in 2,000,000 1,651,200 3,651,200 3,651,200
Reserves - - - 681,518
Contingencies - - - (274,370)
Total other financing sources 2,000,000 1,651,200 3,651,200 4,058,348
Net change in fund balances 1,868,159$ 1,780,916 3,649,075$ -$
Fund balances at beginning of year 1,868,159
Fund balances at end of year 3,649,075$
See accompanying independent auditors' report.
CITY OF TAMARAC, FLORIDACORRIDOR IMPROVEMENT FUND
SCHEDULE OF REVENUES, EXPENDITURES AND
CHANGES IN FUND BALANCES - BUDGET AND ACTUAL
FROM INCEPTION AND FOR THE YEAR ENDED SEPTEMBER 30, 2016
113


MAJOR CAPITAL PROJECTS FUND
BUDGETARY COMPARISON SCHEDULE


Prior Current Total to Project
Years Year Date Authorization
Revenues:
Intergovernmental -$ -$ -$ 1,800,000$
Investment income 4,893 212,653 217,546 -
Miscellaneous revenues 9,736 69,532 79,268 934,278
Total revenues 14,629 282,185 296,814 2,734,278
Expenditures:
General government 264,069 109,245 373,314 217,774
Physical environment
Culture and recreation 571,871 - 571,871 19,503,753
Debt service:
Principal retirement - - - 14,206,509
Interest and fiscal charges 1,131,889 276,609 1,408,498 1,610,202
Total expenditures 1,967,829 385,854 2,353,683 35,538,238
Deficiency of revenues
under expenditures (1,953,200) (103,669) (2,056,869) (32,803,960)
Other financing sources (uses):
Proceeds from issuance of debt 30,391,509 - 30,391,509 36,620,000
Payment on refunded bond and note (19,087,920) - (19,087,920) (5,316,412)
Transfers in 9,103,300 779,775 9,883,075 1,938,775
Reserves - - - (438,403)
Total other financing sources 20,406,889 779,775 21,186,664 32,803,960
Net change in fund balances 18,453,689$ 676,106 19,129,795$ -$
Fund balances at beginning of year as restated 18,453,689
Fund balances at end of year 19,129,795$
See accompanying independent auditors' report.
CITY OF TAMARAC, FLORIDATAMARAC VILLAGE FUND
SCHEDULE OF REVENUES, EXPENDITURES AND
CHANGES IN FUND BALANCES - BUDGET AND ACTUAL
FROM INCEPTION AND FOR THE YEAR ENDED SEPTEMBER 30, 2016
114


INTERNAL SERVICE FUNDS
Internal service funds are used to account for services provided to other departments or agencies of the government, or to other governments on a cost-reimbursement basis. Risk Management Fund - The Risk Management Fund is an internal service fund that accounts for the administration of risk management and various insurance premiums. Property and liability insurance and workers’ compensation are administered through this fund. Health Insurance Fund - The Health Insurance Fund is an internal service fund that accounts for employee’s health insurance, premiums and claims.


ASSETS Risk Management Health Insurance Total
Current assets:
Cash and equity in pooled cash 3,872,530$ 1,208,243$ 5,080,773$
Investments 1,147,527 219,992 1,367,519
Accounts receivable - net - 12,192 12,192
Prepaid expenses 213,689 - 213,689
Total current assets 5,233,746 1,440,427 6,674,173
Capital assets:
Equipment 15,766 - 15,766
Total capital assets 15,766 - 15,766
Less accumulated depreciation (15,766) - (15,766)
Total capital assets - net - - -
Total non-current assets - - -
Total assets 5,233,746 1,440,427 6,674,173
DEFERRED OUTFLOWS OF RESOURCESDeferred outflows from pensions 349,914 - 349,914
LIABILITIES
Current liabilities:
Accounts payable and other accrued liabilities 30,890 - 30,890
Accrued payroll 9,710 94,094 103,804
Claims payable 822,000 504,725 1,326,725
Compensated absences 7,124 - 7,124
Total current liabilities 869,724 598,819 1,468,543
Non-current liabilities:
Net Pension liability 186,083 - 186,083
Net OPEB obligations 12,878 - 12,878
Compensated absences 64,115 - 64,115
Total noncurrent liabilities 263,076 - 263,076
Total liabilities 1,132,800 598,819 1,731,619
DEFERRED INFLOWS OF RESOURCES
Deferred inflows from pensions 155,974 - 155,974
NET POSITION
Unrestricted 4,294,886 841,608 5,136,494
Total net position 4,294,886$ 841,608$ 5,136,494$
CITY OF TAMARAC, FLORIDACOMBINING STATEMENT OF NET POSITION
INTERNAL SERVICE FUNDS
SEPTEMBER 30, 2016
115

Risk Management Health Insurance Total
OPERATING REVENUES:
Charges for services 1,552,977$ 5,208,795$ 6,761,772$
Other 171,113 23,117 194,230
Total operating revenues 1,724,090 5,231,912 6,956,002
OPERATING EXPENSES:
Salaries, wages and employee benefits 394,137 34,500 428,637
Contractual services, materials and supplies 49,232 - 49,232
Claims and claims adjustments 884,487 5,175,660 6,060,147
Other services and charges 137,546 - 137,546
Total operating expenses 1,465,402 5,210,160 6,675,562
Operating (income) loss 258,688 21,752 280,440
NONOPERATING REVENUES:
Investment income 16,730 4,099 20,829
Total nonoperating revenues 16,730 4,099 20,829
Income (loss) before transfers 275,418 25,851 301,269
Change in net position 275,418 25,851 301,269
Total net position, October 1 4,019,468 815,757 4,835,225
Total net position, September 30 4,294,886$ 841,608$ 5,136,494$
CITY OF TAMARAC, FLORIDA COMBINING STATEMENT OF REVENUES, EXPENSES
AND CHANGES IN FUND NET POSITION
INTERNAL SERVICE FUNDS
FOR THE YEAR ENDED SEPTEMBER 30, 2016
116

Risk Management Health Insurance TotalCash flows from operating activities: Cash received from customers (including other funds) 1,724,090$ 5,231,405$ 6,955,495$
Payments to suppliers (231,867) (552) (232,419)
Cash paid on claims (1,197,487) (5,137,652) (6,335,139)
Payments to employees (391,766) (54,168)$ (445,934)$
Interfund service payments (137,546) - (137,546)
Net cash provided by (used in) operating activities (234,576) 39,033 (195,543)
Cash flows from investing activities: Proceeds from sales and maturities of investments 746,442 384,066 1,130,508
Purchases of investments (310,880) (159,959) (470,839)
Interest income 16,730 4,099 20,829
Net cash provided by investing activities 452,292 228,206 680,498
Net increase in cash and cash equivalents 217,716 267,239 484,955
Cash and cash equivalents at beginning of year 3,654,814 941,004 4,595,818
Cash and cash equivalents at end of year 3,872,530$ 1,208,243$ 5,080,773$
Pooled cash and cash equivalents per
Statement of net position:
Unrestricted 3,872,530$ 1,208,243$ 5,080,773$
Total, September 30 3,872,530$ 1,208,243$ 5,080,773$
Reconciliation of operating income (loss) to net
cash provided by (used in) operating activities:
Operating loss 258,688$ 21,752$ 280,440$
Adjustments to reconcile operating loss to net
cash provided by (used in) operating activities:
Non cash pension expense adjustment 637 - 637
Change in assets and liabilities:
Increase in accounts receivable - (507) (507)
Increase in prepayments (213,689) - (213,689)
Decrease in accounts payable 30,417 (552) 29,865
Increase (decrease) in accrued liabilities (1,221) (19,668) (20,889)
Increase in compensated absences 1,794 - 1,794
Increase in OPEB obligation 1,798 - 1,798
Increase (decrease) in estimated insurance claims payable (313,000) 38,008 (274,992)
Total adjustments (493,264) 17,281 (475,983)
Net cash provided by (used in) operating activities (234,576)$ 39,033$ (195,543)$
Non-cash investing, capital and financing activities:
Decrease in fair value of investments (3,320)$ (858)$ (4,178)$
CITY OF TAMARAC, FLORIDACOMBINING STATEMENT OF CASH FLOWS
INTERNAL SERVICE FUNDSFOR THE YEAR ENDED SEPTEMBER 30, 2016
117


FIDUCIARY FUNDS
Agency Fund
Agency funds are used to account for short-term custodial collections on resources on behalf of another individual, entity, or government. Solid Waste Fund - used to account for the City’s collection of the Solid Waste Fees on behalf of Waste Management Inc.; these fees are remitted to Waste Management Inc. net of the City’s Franchise Fee revenue.

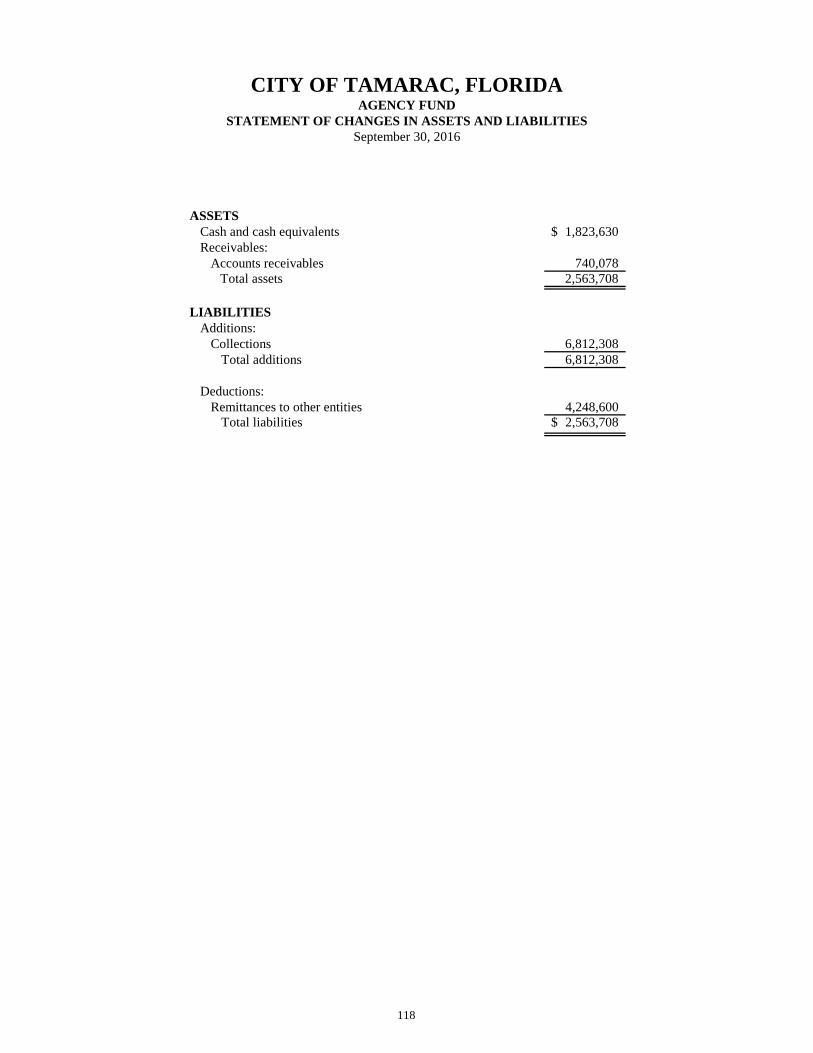
ASSETSCash and cash equivalents 1,823,630$ Receivables:
Accounts receivables 740,078 Total assets 2,563,708
LIABILITIESAdditions:
Collections 6,812,308 Total additions 6,812,308
Deductions:Remittances to other entities 4,248,600
Total liabilities 2,563,708$
CITY OF TAMARAC, FLORIDAAGENCY FUND
STATEMENT OF CHANGES IN ASSETS AND LIABILITIESSeptember 30, 2016
118


STATISTICAL SECTION


STATISTICAL SECTION
This part of the City of Tamarac’s comprehensive annual report presents detailed information as a context for understanding what the information in the financial statements, note disclosures, and required supplementary information says about the government’s overall financial health. Contents Page Financial Trends 119-124 These schedules contain trend information to help the reader understand how the government’s financial performance and well-being have changed over time. Revenue Capacity These schedules contain information to help the reader assess the government’s most significant local revenue source, the property tax. 125-130 Debt Capacity These schedules present information to help the reader assess the affordability of the government’s current levels of outstanding debt and the governments’ ability to issue additional debt in the future. 131-138 Demographic and Economic Information These schedules offer demographic and economic indicators to help the reader understand the environment within which the government’s financial activities take place. 139-140 Operating Information These schedules contain service and infrastructure data to help the reader understand how the information in the government’s financial report relates to the services the government provides and the activities it performs. 141-143 Sources: Unless otherwise noted, the information in these schedules is derived from the comprehensive annual financial reports for the relevant year. The City implemented GASB Statement No. 34 in 2002; schedules presenting government-wide information include information beginning that year.


2007 2008 2009 2010 2011 2012 2013 2014 2015 2016
Governmental activitiesNet investments in capital assets 74,006,704$ 77,300,114$ 86,076,841$ 84,104,407$ 84,047,031$ 89,098,575$ 89,007,614$ 88,016,074$ 87,647,677$ 87,522,863$ Restricted 33,639,956 17,497,293 17,675,068 14,005,135 15,881,934 18,662,357 19,965,692 18,000,879 18,445,796 13,136,713 Unrestricted 7,997,681 32,787,159 31,682,290 40,089,461 39,839,769 39,319,602 43,784,808 46,588,201 30,326,724 42,672,353
Total governmental activities net position 115,644,341 127,584,566 135,434,199 138,199,003 139,768,734 147,080,534 152,758,114 152,605,154 136,420,197 143,331,929
Business-type activitiesNet investments in capital assets 45,633,402 50,273,220 45,546,743 43,760,949 45,059,260 43,990,534 42,862,218 49,636,287 55,366,369 57,504,296 Restricted 8,599,062 8,599,062 6,909,717 8,520,498 8,174,927 7,851,106 7,428,847 8,039,430 6,397,223 7,452,867 Unrestricted 16,432,180 13,542,094 21,514,450 21,368,742 20,727,336 24,687,666 30,039,279 32,668,574 38,348,058 43,581,036
Total business-type activities net position 70,664,644 72,414,376 73,970,910 73,650,189 73,961,523 76,529,306 80,330,344 90,344,291 100,111,650 108,538,199
Primary GovernmentNet investments in capital assets 119,640,106 127,573,334 131,623,584 127,865,356 129,106,291 133,089,109 131,869,832 137,652,361 143,014,046 145,027,159 Restricted 42,239,018 26,096,355 24,584,785 22,525,633 24,056,861 26,513,463 27,394,539 26,040,309 24,843,019 20,589,580 Unrestricted 24,429,861 46,329,253 53,196,740 61,458,203 60,567,105 64,007,268 73,824,087 79,256,775 68,674,782 86,253,389
Total primary government net position 186,308,985$ 199,998,942$ 209,405,109$ 211,849,192$ 213,730,257$ 223,609,840$ 233,088,458$ 242,949,445$ 236,531,847$ 251,870,128$
Source: City of Tamarac, Financial Services Department
See accompanying independent auditors' report.
Net Position by ComponentCITY OF TAMARAC
Last Ten Fiscal Years
119

2007 2008 2009 2010 2011 2012 2013 2014 2015 2016ExpensesGovernmental activities:
General government 11,504,582$ 11,432,868$ 12,597,059$ 11,026,034$ 11,907,718$ 12,197,860$ 13,172,537$ 13,186,504$ 13,156,821$ 15,110,128$ Public safety 28,264,994 28,472,914 30,471,668 31,489,221 30,961,029 30,837,435 31,874,454 33,433,457 33,902,418 35,856,590 Transportation 2,330,808 1,748,860 1,881,356 1,904,168 1,857,501 1,958,527 1,916,467 2,080,132 2,277,480 2,119,888 Culture and recreation 5,496,590 5,168,340 4,097,080 4,249,737 2,976,038 3,053,031 3,114,106 5,861,128 5,500,440 5,724,133 Physical environment 2,610,684 2,452,233 3,319,120 3,276,239 2,397,899 1,396,958 1,661,414 3,502,203 5,253,489 3,796,537 Economic environment 1,559,614 1,263,812 2,600,159 4,869,005 4,641,173 5,027,797 5,384,425 1,759,016 1,605,029 958,415 Human services 333,332 286,630 335,523 294,665 268,033 286,589 301,201 309,607 288,099 301,177 Interest on long-term debt 1,624,593 1,607,303 1,727,200 1,482,104 1,892,592 1,333,856 1,518,847 1,331,112 1,202,719 1,207,785
Total governmental activities expenses 53,725,197 52,432,960 57,029,165 58,591,173 56,901,983 56,092,053 58,943,451 61,463,159 63,186,495 65,074,653
Business-type activities:Water and sewer 17,976,618 19,207,646 19,425,830 20,726,556 20,510,633 20,926,131 20,732,351 21,051,084 20,548,027 21,576,295 Stormwater 3,017,732 3,112,292 3,401,976 3,894,763 4,295,863 3,835,057 4,114,237 4,096,611 4,212,046 5,115,091 Colony West - - - - - - - 1,962,695 2,460,509 2,382,382
Total business-type activities expenses 20,994,350 22,319,938 22,827,806 24,621,319 24,806,496 24,761,188 24,846,588 27,110,390 27,220,582 29,073,768 Total primary government expenses 74,719,547$ 74,752,898$ 79,856,971$ 83,212,492$ 81,708,479$ 80,853,241$ 83,790,039$ 88,573,549$ 90,407,077$ 94,148,421$
Program RevenuesGovernmental activities:
Charges for services: General government 872,023$ 1,145,570$ 1,322,983$ 5,398,147$ 5,550,906$ 5,217,332$ 6,672,175$ 6,233,276$ 7,647,508$ 7,109,741$ Public safety 11,859,118 11,300,837 13,790,107 15,205,661 13,935,434 17,669,883 16,831,036 18,195,233 19,626,281 19,629,167 Transportation 66,357 25,722 22,916 20,732 25,586 44,806 30,439 32,119 30,813 30,136 Culture and recreation 830,025 774,582 617,553 688,892 781,946 881,550 1,039,216 1,108,933 1,134,633 1,161,688 Physical environment 733,360 1,320,064 474,243 1,721,461 1,098,831 1,047,223 874,239 1,048,901 1,265,048 1,322,131 Operating grants and contributions 2,625,239 1,684,420 2,812,190 4,522,583 2,486,725 1,286,377 1,416,266 1,402,578 1,124,992 773,398 Capital grants and contributions 617,827 2,850,100 3,970,632 120,572 300,793 1,353,899 907,321 315,084 439,400 3,029,688
Total governmental activities program revenues 17,603,949 19,101,295 23,010,624 27,678,048 24,180,221 27,501,070 27,770,692 28,336,124 31,268,675 33,055,949
Business-type activities:Charges for services:
Water and sewer 18,694,290 18,790,162 19,603,121 19,743,109 20,022,360 21,663,441 23,240,537 24,458,676 26,433,582 26,332,665 Stormwater 4,383,991 4,498,587 4,718,123 4,824,703 5,014,883 5,107,852 5,268,150 5,468,692 5,447,346 5,636,718 Colony West - - - - - - - 1,245,893 2,247,612 1,999,255 Capital grants and contributions 348,154 374,304 33,453 24,747 4,701 96,620 25,925 376,667 1,782,279 721,614
Total business-type activities program revenues 23,426,435 23,663,053 24,354,697 24,592,559 25,041,944 26,867,913 28,534,612 31,549,928 35,910,819 34,690,252 Total primary government program revenues 41,030,384$ 42,764,348$ 47,365,321$ 52,270,607$ 49,222,165$ 54,368,983$ 56,305,304$ 59,886,052$ 67,179,494$ 67,746,201$
Source: City of Tamarac, Financial Services Department
See accompanying independent auditors' report.
120
Changes in Net PositionLast Ten Fiscal Years
CITY OF TAMARAC

2007 2008 2009 2010 2011 2012 2013 2014 2015 2016Net (Expense) RevenueGovernmental activities (36,121,248)$ (33,331,665)$ (34,018,541)$ (30,913,125)$ (32,721,762)$ (28,590,983)$ (31,172,759)$ (33,127,035)$ (31,917,820)$ (32,018,704)$ Business-type activities 2,432,085 1,343,115 1,526,891 (28,760) 235,448 2,106,725 3,688,024 4,439,538 8,690,237 5,616,484 Total primary government net expense (33,689,163) (31,988,550) (32,491,650) (30,941,885) (32,486,314) (26,484,258) (27,484,735) (28,687,497) (23,227,583) (26,402,220)
General Revenue and Other Changes in Net PositionGovernmental activities: Taxes: Property taxes, levied for general purpose 22,940,448 21,284,960 19,970,716 18,615,754 16,158,683 16,031,177 17,144,382 17,793,441 18,777,604 20,367,131 Property taxes, levied for debt service 483,058 267,384 261,027 249,729 222,831 222,068 265,894 265,523 260,067 266,402 Other taxes 4,182,926 4,266,849 4,212,917 4,255,717 8,219,801 8,556,815 8,685,834 8,963,290 9,034,439 9,769,866 Franchise fees 4,842,600 4,784,526 4,628,491 4,680,810 4,409,431 4,858,123 4,714,971 5,001,885 5,179,351 5,139,071 Unrestricted grants and contributions 6,162,220 5,716,941 4,799,972 5,155,111 5,138,584 5,971,497 5,805,252 6,226,204 6,517,126 6,697,326 Interest earnings 3,133,291 1,841,268 857,983 308,708 131,485 244,526 152,129 209,895 211,046 464,576 Miscellaneous 5,824,558 5,912,810 6,754,945 - - 289,351 45,279 109,014 202,275 606,485 Transfers 297,200 361,000 380,100 412,100 - (329,508) - (5,636,152) (630,549) (750,305) Gain (loss) on sale of capital assets 31,191 836,152 2,023 - 10,678 58,734 36,598 101,207 82,709 88,198 Total governmental activities 47,897,492 45,271,890 41,868,174 33,677,929 34,291,493 35,902,783 36,850,339 33,034,307 39,634,068 42,648,750
Business-type activities: Investment earnings 1,255,811 754,467 314,330 117,618 61,082 119,298 81,579 131,182 135,827 163,715 Transfers (297,200) (361,000) (380,100) (412,100) - 329,508 - 5,636,152 630,549 750,305 Gain on sale of capital assets 72,863 13,150 95,413 2,521 14,804 12,252 31,435 29,574 6,324 1,294 Total business-type activities 1,031,474 406,617 29,643 (291,961) 75,886 461,058 113,014 5,796,908 772,700 915,314 Total primary government 48,928,966 45,678,507 41,897,817 33,385,968 34,367,379 36,363,841 36,963,353 38,831,215 40,406,768 43,564,064
Change in Net PositionGovernmental activities 11,776,244 11,940,225 7,849,633 2,764,804 1,569,731 7,311,800 5,677,580 (92,728) 7,716,248 10,630,046 Business-type activities 3,463,559 1,749,732 1,556,534 (320,721) 311,334 2,567,783 3,801,038 10,236,446 9,462,937 6,531,798 Total primary governmental 15,239,803$ 13,689,957$ 9,406,167$ 2,444,083$ 1,881,065$ 9,879,583$ 9,478,618$ 10,143,718$ 17,179,185$ 17,161,844$
Source: City of Tamarac, Financial Services Department
See accompanying independent auditors' report.
CITY OF TAMARAC
121
Last Ten Fiscal YearsChanges in Net Position

2007 2008 2009 2010 2011 2012 2013 2014 2015 2016
General Fund Reserved 833,219$ 642,923$ 590,453$ -$ -$ -$ -$ -$ -$ -$
Unreserved 16,685,842 19,454,677 22,159,672 - - - - - - -
Non-spendable - - - 112,523 150,157 128,239 122,894 123,480 104,704 119,698
Restricted - - - 11,188 10,741 10,741 10,741 10,741 10,741 10,741
Committed - - - 41,352 87,840 152,340 230,882 281,123 257,944 325,447
Assigned - - - 10,200,000 9,200,000 10,200,000 6,663,981 6,781,518 8,671,296 10,336,332
Unassigned - - - 14,229,231 16,824,295 13,230,150 20,550,932 21,584,051 24,546,501 25,593,829
Total general fund 17,519,061 20,097,600 22,750,125 24,594,294 26,273,033 23,721,470 27,579,430 28,780,913 33,591,186 36,386,047
All Other Governmental Funds Reserved 21,024,595 14,575,011 17,677,302 - - - - - - -
Unreserved, reported in Special revenue funds - - (220,379) - - - - - - -
Capital projects funds 12,259,715 19,043,205 15,390,008 - - - - - - -
Debt service funds 355,651 404,029 191,933 - - - - - - -
Non-spendable, reported in Special revenue funds - - - - 99,766 566,704 607,720 437,348 97,854 328,253
Capital projects funds - - - 106,867 8,450,548 8,450,548 8,450,548 10,634,664 10,817,850 19,183,713
Restricted, reported in Special revenue funds - - - 5,561,895 5,456,031 7,061,984 9,824,508 9,363,582 11,172,757 11,944,398
Debt service funds - - - 399,528 494,706 728,004 194,462 210,436 262,378 288,592
Capital projects funds - - - 9,160,308 9,772,289 10,294,924 9,328,262 7,808,949 2,776,322 2,428,461
Committed, reported in Special revenue funds - - - 110,792 13,443 - - 86,395 834,987 3,949
Capital projects funds - - - 432,655 1,749,681 2,869,104 2,082,946 1,307,832 5,128,489 4,672,116
Assigned reported in Capital projects funds - - - 15,611,124 13,306,282 12,819,687 12,383,204 10,312,914 9,349,904 11,826,607
Special revenue funds - - - - - - - 4,378,793 5,494,595 6,049,394
Unassigned reported in Capital projects funds - - - - - - (328,924) - - -
Total all other government funds 33,639,961 34,022,245 33,038,864 31,383,169 39,342,746 42,790,955 42,542,726 44,540,913 45,935,136 56,725,483
Total Government Funds 51,159,022$ 54,119,845$ 55,788,989$ 55,977,463$ 65,615,779$ 66,512,425$ 70,122,156$ 73,321,826$ 79,526,322$ 93,111,530$
Source: City of Tamarac, Financial Services Department
See accompanying independent auditors' report.
CITY OF TAMARACFund Balances of Governmental Funds
Last Ten Fiscal Years
122

2006 2007 2008 2009 2010 2011 2012 2013 2015 2016REVENUESTaxes 32,449,025$ 31,313,801$ 29,791,213$ 28,546,010$ 29,010,746$ 29,668,182$ 30,811,081$ 32,024,139$ 33,251,461$ 35,542,470$ Licenses and permits 2,671,892 2,406,897 2,376,229 2,486,764 2,752,376 2,889,091 2,747,173 3,040,164 3,669,277 3,640,905 Intergovernmental 9,405,276 10,200,171 9,009,504 9,794,883 7,791,667 8,601,588 8,128,840 7,891,704 7,778,275 10,491,977 Charges for Services 4,372,195 3,975,639 3,803,768 3,697,083 3,615,862 4,181,545 3,664,156 4,595,001 4,730,312 4,019,407 Fines and forfeitures 598,039 446,866 583,158 686,232 1,004,325 1,153,113 917,045 1,318,087 2,280,647 1,843,400 Investment earnings 3,134,750 1,841,269 857,984 308,714 131,486 244,525 152,127 209,895 211,046 464,576 Special assessments 6,723,891 6,715,675 8,760,258 8,704,112 8,791,417 11,787,249 11,694,360 11,609,729 11,676,053 11,731,575 Miscellaneous 5,939,824 6,311,869 6,759,450 6,754,546 5,377,604 5,210,526 6,506,960 6,329,270 7,654,335 11,090,912 Total revenues 65,294,892 63,212,187 61,941,564 60,978,344 58,475,483 63,735,819 64,621,742 67,017,989 71,251,406 78,825,222
EXPENDITURESGeneral government 10,697,895 10,824,676 11,634,921 11,908,896 11,472,407 11,217,405 11,898,550 11,523,177 11,853,038 12,272,070 Public safety 28,388,447 27,991,426 29,569,781 31,810,830 30,556,661 30,640,931 31,321,080 32,562,872 33,789,019 38,513,665 Transportation 1,418,702 1,158,425 1,260,665 1,226,271 1,079,216 1,204,504 1,152,629 1,242,455 1,425,855 1,317,326 Economic environment 1,654,950 1,266,711 2,608,447 5,051,557 2,393,996 1,393,321 1,655,512 1,750,430 1,653,389 963,884 Physical environment 2,654,791 2,181,900 3,239,801 3,230,078 2,915,140 2,930,078 3,032,937 3,429,419 5,396,992 3,963,723 Human Services 354,446 293,005 340,625 243,480 263,872 282,064 293,721 295,803 291,020 308,187 Culture and recreation 5,020,571 4,543,692 3,314,474 3,293,390 3,465,730 3,740,221 4,033,774 4,460,240 4,286,466 4,436,032 Capital outlay 6,828,861 16,803,869 3,625,716 3,160,859 1,841,508 8,758,358 5,128,406 6,027,064 3,051,878 8,034,808 Debt service: Principal 1,400,658 1,247,730 3,300,103 1,262,792 2,001,329 1,647,131 1,890,275 2,042,798 2,177,136 2,380,691 Interest 1,625,551 1,607,303 1,957,267 1,459,097 1,952,404 1,303,320 1,391,883 1,204,149 1,083,284 1,088,350 Total expenditures 60,044,872 67,918,737 60,851,800 62,647,250 57,942,263 63,117,333 61,798,767 64,538,407 65,008,077 73,278,736
Excess (deficiency) of revenuesover (under) expenditures 5,250,020 (4,706,550) 1,089,764 (1,668,906) 533,220 618,486 2,822,975 2,479,582 6,243,329 5,546,486
(Continued on next page)
Source: City of Tamarac, Financial Services Department
See accompanying independent auditors' report.
CITY OF TAMARACChanges in Fund Balances of Governmental Funds
Last Ten Fiscal Years
123

2007 2008 2009 2010 2011 2012 2013 2014 2015 2016Other financingsources (uses)Capital leases - - - - - 607,667 527,632 - 546,916 555,824 Proceeds from issuance of debt - 6,818,373 5,474,280 1,445,280 23,272,509 - 15,450,541 16,620,000 - - Payments on refunded debt - - (5,275,000) - (14,167,413) - (15,191,417) (13,771,508) - - Transfers in 20,867,785 16,347,134 11,420,722 9,919,287 13,459,815 14,520,914 11,920,559 13,623,378 13,424,380 16,316,909 Transfers out (20,570,585) (15,498,134) (11,040,622) (9,507,187) (13,459,815) (14,850,422) (11,920,559) (15,751,782) (14,010,129) (17,067,214) Total other financing
sources (uses) 297,200 7,667,373 579,380 1,857,380 9,105,096 278,159 786,756 720,088 (38,833) (194,481)
Net changes in fund balance 5,547,220$ 2,960,823$ 1,669,144$ 188,474$ 9,638,316$ 896,645$ 3,609,731$ 3,199,670$ 6,204,496$ 5,352,005$
Ratio of total debt service to noncapital expenditures
Total debt service 3,026,209$ 2,855,033$ 5,257,370$ 2,721,889$ 3,953,733$ 2,950,451$ 3,282,158$ 3,246,947$ 3,260,420$ 3,469,041$
Total noncapital expenditures 53,216,011 51,114,868 57,226,084 59,486,391 56,100,755 55,842,649 56,670,361 58,511,343 61,956,199 65,243,928
Ratio 6% 6% 9% 5% 7% 5% 6% 6% 5% 5%
Source: City of Tamarac, Financial Services Department
See accompanying independent auditors' report.
124
(Continued)Last Ten Fiscal Years
Changes in Fund Balances of Governmental FundsCITY OF TAMARAC

2007 2008 2009 2010 2011 2012 2013 2014 2015 2016Function/ProgramGovernmental activities: General government 872,023$ 1,222,872$ 1,563,149$ 5,606,358$ 6,367,056$ 5,313,275$ 6,720,841$ 6,233,276$ 7,647,508$ 7,109,741$ Public safety 12,549,719 11,488,382 14,700,096 15,410,338 14,070,909 18,333,287 16,942,707 18,251,574 19,626,281 21,879,721 Transportation 66,357 555,495 352,279 20,732 63,630 44,806 814,334 49,430 324,375 615,098 Culture/recreation 994,457 1,245,768 3,375,988 823,862 786,424 1,538,024 1,124,718 1,311,237 1,262,632 1,355,860 Physical environment 767,491 1,320,064 474,243 1,721,461 1,145,400 1,178,904 874,239 1,144,370 1,282,887 1,322,131 Economic environment 2,353,902 3,268,714 2,544,869 4,095,297 1,746,802 1,092,774 1,293,853 1,346,237 1,124,992 773,398 Subtotal governmental activities 17,603,949 19,101,295 23,010,624 27,678,048 24,180,221 27,501,070 27,770,692 28,336,124 31,268,675 33,055,949
Business-type activities Water/wastewater 19,042,444 19,164,466 19,636,574 19,767,856 20,027,061 21,760,061 23,266,462 24,835,343 28,215,861 26,904,279 Stormwater 4,383,991 4,498,587 4,718,123 4,824,703 5,014,883 5,107,852 5,268,150 5,468,692 5,447,346 5,786,718 Colony West - - - - - - - 1,245,893 2,247,612 1,999,255 Subtotal business-type activities 23,426,435 23,663,053 24,354,697 24,592,559 25,041,944 26,867,913 28,534,612 31,549,928 35,910,819 34,690,252 Total primary government 41,030,384$ 42,764,348$ 47,365,321$ 52,270,607$ 49,222,165$ 54,368,983$ 56,305,304$ 59,886,052$ 67,179,494$ 67,746,201$
Source: City of Tamarac, Financial Services Department
See accompanying independent auditors' report.
CITY OF TAMARACProgram Revenues by Function/Program
Last Ten Fiscal Years
125

Fiscal
Year Property Sales & Use FranchiseLocal Option
Gas Tax
2007 23,423,506 4,035,998 4,842,600 1,081,652
2008 21,552,344 4,120,406 4,784,526 1,073,542
2009 20,231,743 3,037,695 4,628,491 972,074
2010 18,865,483 3,016,203 4,680,810 1,037,421
2011 16,381,514 3,140,797 4,409,431 1,045,839
2012 16,253,245 3,319,822 4,858,123 1,034,710
2013 17,410,277 3,545,802 4,714,971 1,032,099
2014 18,058,964 3,760,479 5,001,885 1,067,547
2015 19,037,671 3,928,976 5,179,351 1,085,206
2016 20,633,533 4,037,987 5,139,071 1,110,527
Change2007 - 2016 -11.9% 0.0% 6.1% 2.7%
Source: City of Tamarac, Financial Services Department
See accompanying independent auditors' report.
City of TamaracTax Revenues by Source - Governmental Funds
Last Ten Fiscal Years(modified accrual basis of accounting)
126

Tax Year Fiscal YearResidential
PropertyNon-Residential
PropertyPersonal Property
Less: Tax Exemptions
Total Taxable Value
Total Direct Tax Rate
Estimated Actual Market
Value
Taxable Value as a Percentage of Market Value
2006 2007 3,595,772$ 812,384$ 201,088$ 756,359$ 3,852,885$ 6.3529 6,242,664$ 61.72%
2007 2008 4,076,990 954,591 407,699 877,960 4,561,320 5.1126 7,158,234 63.72%
2008 2009 3,992,061 1,019,696 163,052 1,303,330 3,871,479 5.3916 6,056,062 63.93%
2009 2010 3,272,001 1,062,921 158,771 1,486,624 3,007,069 6.0800 4,709,447 63.85%
2010 2011 2,578,120 1,039,343 158,840 1,486,624 2,289,679 6.5894 3,723,029 61.50%
2011 2012 2,497,140 989,638 153,089 1,144,478 2,495,389 6.7774 3,632,374 68.70%
2012 2013 2,442,151 971,166 168,941 1,136,378 2,445,880 7.4027 3,530,134 69.29%
2013 2014 2,508,291 981,145 178,237 1,128,021 2,539,652 7.3985 3,695,728 68.72%
2014 2015 2,671,825 1,001,529 178,117 1,125,020 2,726,451 7.3909 4,233,269 64.41%
2015 2016 2,840,656 1,027,702 184,550 1,147,719 2,905,189 7.3851 4,669,644 62.21%
Source: Broward County Property Appraiser
See accompanying independent auditors' report.
Real Property
CITY OF TAMARACAssessed Value and Estimated Actual Value of Taxable Property
Last Ten Fiscal Years(in thousand of dollars)
127

County School District
Fiscal Year
Operating Millage
Debt Service Millage
Total City
MillageOperating
Millage
Debt Service Millage
Total County Millage
Operating Millage
Debt Service Millage
Total School Millage
Children's Services
South Florida Water
Management District
Broward Health
Florida Inland
Navigation District
Total Direct &
Overlapping Rates
2007 6.2224 0.1305 6.3529 5.6433 0.4228 6.0661 7.6790 0.1897 7.8687 0.4073 0.6970 1.8317 0.0385 23.2622
2008 5.0496 0.0630 5.1126 4.8889 0.3979 5.2868 7.4770 0.1714 7.6484 0.3572 0.6240 1.6255 0.0345 20.6890
2009 5.3215 0.0701 5.3916 4.8889 0.4256 5.3145 7.4170 0.0000 7.4170 0.3754 0.6240 1.7059 0.0345 20.8629
2010 5.9999 0.0801 6.0800 4.8889 0.5000 5.3889 7.4310 0.0000 7.4310 0.4243 0.6240 1.7059 0.0345 21.6886
2011 6.5000 0.0894 6.5894 5.1021 0.3670 5.4691 7.6310 0.0000 7.6310 0.4696 0.6240 1.8750 0.0345 22.6926
2012 6.6850 0.0924 6.7774 5.1860 0.3670 5.5530 7.4180 0.0000 7.4180 0.4789 0.4363 1.8750 0.0345 22.5731
2013 7.2899 0.1128 7.4027 5.2576 0.2954 5.5530 7.4560 0.0000 7.4560 0.4902 0.4289 1.8564 0.0345 23.2217
2014 7.2899 0.1086 7.3985 5.4440 0.2830 5.7270 7.4800 0.0000 7.4800 0.4882 0.4110 1.7554 0.0345 23.2946
2015 7.2899 0.1010 7.3909 5.4584 0.2646 5.7230 7.4380 0.0000 7.4380 0.4882 0.3842 1.5939 0.0345 23.0527
2016 7.2899 0.0952 7.3851 5.4741 0.2489 5.7230 7.2030 0.0710 7.2740 0.4882 0.3551 1.4425 0.0320 22.6999
Source: Broward County Property Appraiser
See accompanying independent auditors' report.
CITY OF TAMARACProperty Tax Rates
Direct and Overlapping GovernmentsLast Ten Fiscal Years
City of Tamarac Overlapping Rates
128
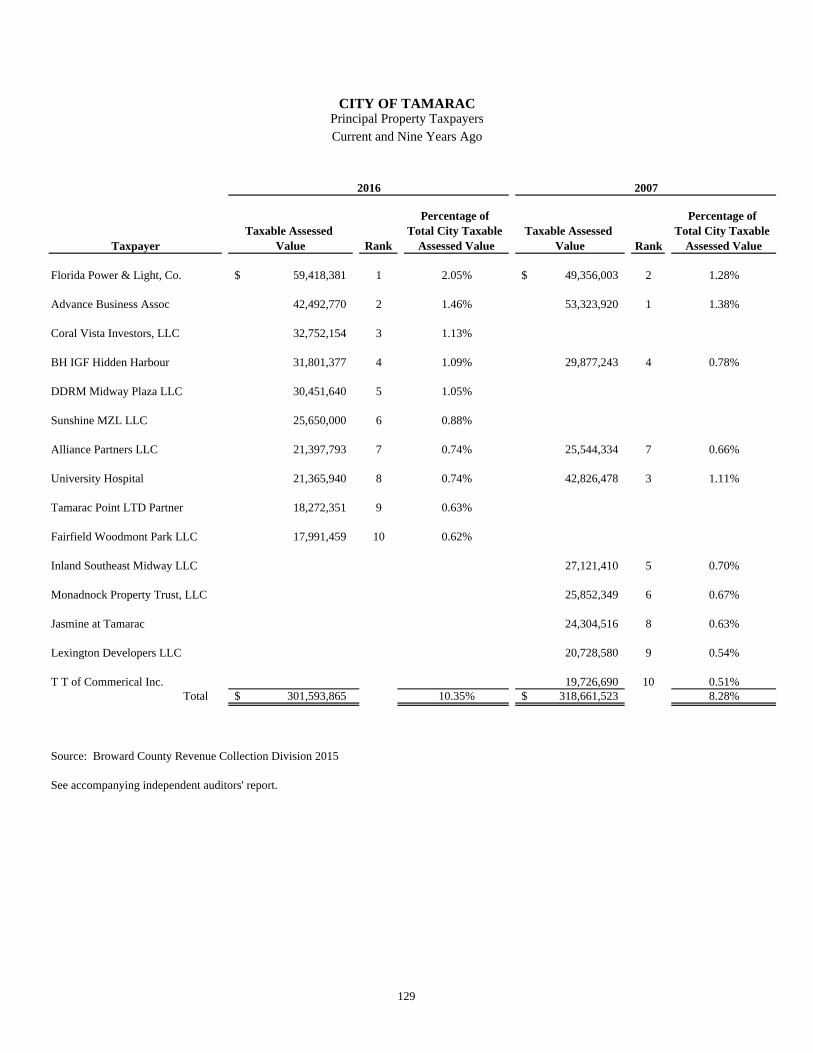
Taxable Assessed Value Rank
Percentage of Total City Taxable
Assessed ValueTaxable Assessed
Value Rank
Percentage of Total City Taxable
Assessed Value
Florida Power & Light, Co. 59,418,381$ 1 2.05% 49,356,003$ 2 1.28%
Advance Business Assoc 42,492,770 2 1.46% 53,323,920 1 1.38%
Coral Vista Investors, LLC 32,752,154 3 1.13%
BH IGF Hidden Harbour 31,801,377 4 1.09% 29,877,243 4 0.78%
DDRM Midway Plaza LLC 30,451,640 5 1.05%
Sunshine MZL LLC 25,650,000 6 0.88%
Alliance Partners LLC 21,397,793 7 0.74% 25,544,334 7 0.66%
University Hospital 21,365,940 8 0.74% 42,826,478 3 1.11%
Tamarac Point LTD Partner 18,272,351 9 0.63%
Fairfield Woodmont Park LLC 17,991,459 10 0.62%
Inland Southeast Midway LLC 27,121,410 5 0.70%
Monadnock Property Trust, LLC 25,852,349 6 0.67%
Jasmine at Tamarac 24,304,516 8 0.63%
Lexington Developers LLC 20,728,580 9 0.54%
T T of Commerical Inc. 19,726,690 10 0.51%Total 301,593,865$ 10.35% 318,661,523$ 8.28%
Source: Broward County Revenue Collection Division 2015
See accompanying independent auditors' report.
Taxpayer
2016 2007
CITY OF TAMARACPrincipal Property TaxpayersCurrent and Nine Years Ago
129

Collected within the Fiscal Year of the Levy Total Collections to Date
Fiscal Year Ended
September 30Total Tax Levy for Fiscal Year Amount
Percentage Collected
Collections in Subsequent Years Amount Percentage of Levy
2007 24,280$ 24,165$ 99.5% 20$ 24,185$ 99.6%
2008 22,363 21,440 95.9% - 21,440 95.9%
2009 20,859 18,843 90.3% 295 19,138 91.7%
2010 19,703 18,630 94.6% 121 18,751 95.2%
2011 16,863 16,016 95.0% 142 16,158 95.8%
2012 16,692 16,014 95.9% 17 16,031 96.0%
2013 17,830 17,131 96.1% 13 17,144 96.2%
2014 18,514 17,788 96.1% 5 17,793 96.1%
2015 19,876 18,777 94.5% - 18,777 94.5%
2016 21,179 20,344 96.1% 23 20,367 96.2%
Source: Broward County Revenue Collection Division
See accompanying independent auditors' report.
(in thousands of dollars)
CITY OF TAMARACProperty Tax Levies and Collections
Last Ten Fiscal Years
130

Stormwater
General Sales Tax Capital Taxable Water & Sewer System Total Percentage Fiscal Obligation Increment Improvement Redevelopment Capital Revenue Term Refunding Primary of Personal Per
Year Bonds Bonds Bondsa Note Leases Bonds Loan Bonds Governmentb Incomec Capitad
2007 2,265,523$ 17,200,000$ 14,850,000$ -$ -$ 2,705,000$ 6,000,000$ 8,680,000$ 51,700,523$ 2.92% 862.41 2008 1,927,135 16,275,000 14,550,000 6,818,373 - 1,860,000 5,090,000 8,325,000 54,845,508 2.43% 925.32 2009 1,747,032 15,315,000 14,395,000 4,942,653 - 14,020,000 - 4,345,000 54,764,685 3.25% 922.90 2010 1,559,240 14,425,000 14,210,000 6,017,414 370,520 13,785,000 - 4,130,000 54,497,174 3.33% 915.76 2011 1,363,431 14,556,000 13,995,000 13,771,509 - 13,540,000 - 3,905,000 61,130,940 3.75% 1,011.65 2012 1,159,263 13,422,000 13,745,000 13,771,509 584,704 13,290,000 - 3,670,000 59,642,476 3.41% 969.13 2013 946,379 12,243,000 14,959,504 13,771,509 957,944 13,030,000 - 3,430,000 59,338,336 3.37% 948.55 2014 724,407 11,030,000 14,463,468 16,620,000 735,118 12,760,000 - 3,180,000 59,512,993 3.29% 942.33 2015 492,959 9,783,000 13,932,432 16,620,000 1,003,346 12,196,555 a - 2,846,433 a 56,874,725 3.04% 891.55 2016 251,631 8,498,000 13,356,396 16,620,000 1,169,807 11,908,662 a - 2,580,004 a 54,384,500 2.91% 840.81
Notes: Details regarding the City's outstanding debt can be found in note 9 of the financial statements.
a Presented net of original issuance discounts and premiums b Includes general bonded debt, sales tax increment debt, and business-type activities. c Personal Income based on an estimate of 2015 median household income ($43,235) of the City of Tamarac. d Population data can be found on Page 143, Demographic Statistics and Information
Source: City of Tamarac, Financial Services Department
See accompanying independent auditors' report.
Governmental Activities
CITY OF TAMARACRatios of Outstanding Debt by Type
Last Ten Fiscal Years
Business-Type Activities
131

Fiscal YearGeneral Obligation
Bonds
Less: Amounts available in Debt
Service Fund
Net General Bonded Debt Outstanding
Percentage of Estimated Actual Taxable Value of
Property
Per Capitaa
2007 2,265,523 103,330 2,162,193 0.056% 36.072008 1,927,135 116,727 1,810,408 0.040% 30.542009 1,747,032 119,050 1,627,982 0.042% 27.432010 1,559,240 107,805 1,451,435 0.048% 24.392011 1,363,431 68,850 1,294,581 0.057% 21.422012 1,159,263 29,454 1,129,809 0.045% 18.362013 946,379 33,540 912,839 0.037% 14.592014 724,407 37,368 687,039 0.027% 10.882015 492,959 35,796 457,163 0.017% 7.172016 251,631 40,685 210,946 0.007% 3.26
Notes: Details regarding the City's outstanding debt can be found in note 9 of the financial statements
a See the Schedule of Demographic and Economic Statistics for population data
Source: City of Tamarac, Financial Services Department
See accompanying independent auditors' report.
CITY OF TAMARACRatios of General Bonded Debt Outstanding
Last Ten Fiscal Years
132

EstimatedNet Share of
Debt Estimated OverlappingOutstanding Percentage Debt
Name of Government (in thousands) Applicable 1 (in thousands)
Broward County 232,035$ 1.93% 4,473$
City of Tamarac - Direct Debt 39,895
Total Direct and Overlapping Debt 44,368$
Sources: Assessed value data used to estimate applicable percentages provided by Broward County Property Appraiser. The total debt outstanding provided by Broward County.
Overlapping governments are those that coincide, at least, in part, with the geographic boundaries of the city. This schedule estimates the portion of the outstanding debt of those overlapping governments that is borne by the residents and businesses of the City of Tamarac.This process recognizes that, when considering the government's ability to issue and repaylong-term debt, the entire debt burden borne by the residents and businesses should betaken into account. However, this does not imply that every taxpayer is a resident, andtherefore responsible for repaying the debt, of each overlapping government.
1 The percentage of overlapping debt applicable is estimated using taxable assessed property values. Applicable percentages were estimated by determing the portion of Broward County'staxable assessed value that is within the government's boundaries and dividing it by BrowardCounty's total taxable assessed value.
Source: City of Tamarac, Financial Services Department
See accompanying independent auditors' report.
City of TamaracDirect and Overlapping Governmental Debt
September 30, 2016
133

The Charter of the City of Tamarac imposes no bonded debt limit. Details regarding the City's outstanding debt can be found in the note 9 of the financial statements.
CITY OF TAMARACLegal Debt Margin Information
September 30, 2016
134

Utility Less: Net Debt Service RequirementsFiscal Service Operating Available
Year Charges (a) Expenses(b) Revenue Principal Interest Total Coverage2007 18,694,290 14,501,880 4,192,410 1,140,000 667,747 1,807,747 2.32
2008 18,790,162 15,425,826 3,364,336 2,110,000 680,392 2,790,392 1.21
2009 19,795,236 15,729,539 4,065,697 2,037,755 340,924 2,378,679 1.71
2010 19,830,341 16,259,240 3,571,101 235,000 653,794 888,794 4.02
2011 20,060,648 15,334,980 4,725,668 245,000 646,744 891,744 5.30
2012 21,740,226 16,567,804 5,172,422 250,000 639,394 889,394 5.82
2013 23,293,876 15,515,170 7,778,706 260,000 629,394 889,394 8.75
2014 24,893,289 16,089,566 8,803,723 270,000 618,994 888,994 9.90
2015 27,592,589 15,356,033 12,236,556 285,000 606,843 891,843 13.72
2016 26,874,922 16,608,175 10,266,747 300,000 594,018 894,018 11.48
Notes: Details regarding the government's outstanding debt can be found in note 9 of the financial statements.
(a) Includes water and sewer service charges, and meter installations. For 2010-2011 also includes investment and other income. (b) Does not include depreciation and amortization expenses. For 2010-2011 includes all expenses except for Payments in lieu of taxes.
Source: City of Tamarac, Financial Services Department
See accompanying independent auditors' report.
CITY OF TAMARACPledged Revenue Coverage
Last Ten Fiscal YearsUtilities Fund
135

Stormwater Less: Net Debt Service RequirementsFiscal Service Operating Available
Year Charges (a) Expenses(b) Revenue Principal Interest Total Coverage2010 4,843,393 3,529,073 1,314,320 215,000 180,318 395,318 3.32
2011 4,997,126 1,040,095 3,957,031 225,000 171,395 396,395 9.98
2012 5,150,365 3,218,957 1,931,408 235,000 162,058 397,058 4.86
2013 5,314,171 3,360,207 1,953,964 240,000 152,305 392,305 4.98
2014 5,513,848 3,285,625 2,228,223 250,000 142,345 392,345 5.68
2015 5,490,417 3,277,106 2,213,311 265,000 131,970 396,970 5.58
2016 5,836,637 4,056,415 1,780,222 275,000 120,973 395,973 4.50
Notes:
(a) Includes storwater service charges, investment income and other income.(b) Does not include depreciation and payment in lieu of taxes expense.
Source: City of Tamarac, Financial Services Department
See accompanying independent auditors' report.
Pledged Revenue CoverageCITY OF TAMARAC
Last Six Fiscal YearsStormwater Fund
136

Debt Service RequirementsFiscal Sales TaxYear Revenue Principal Interest Total Coverage2007 3,559,744 890,000 859,225 1,749,225 2.04
2008 3,358,616 925,000 824,840 1,749,840 1.92
2009 3,037,695 965,000 785,500 1,750,500 1.74
2010 3,016,203 890,000 666,335 1,556,335 1.94
2011 3,140,797 1,220,000 627,940 1,847,940 1.70
2012 3,319,822 1,134,000 397,295 1,531,295 2.17
2013 3,545,802 1,179,000 351,245 1,530,245 2.32
2014 3,760,479 1,213,000 316,900 1,529,900 2.46
2015 3,928,977 1,247,000 281,479 1,528,479 2.57
2016 4,037,987 1,285,000 236,981 1,521,981 2.65
Source: City of Tamarac, Financial Services Department
See accompanying independent auditors' report.
CITY OF TAMARACPledged Revenue Coverage
Last Ten Fiscal YearsSales Tax
137
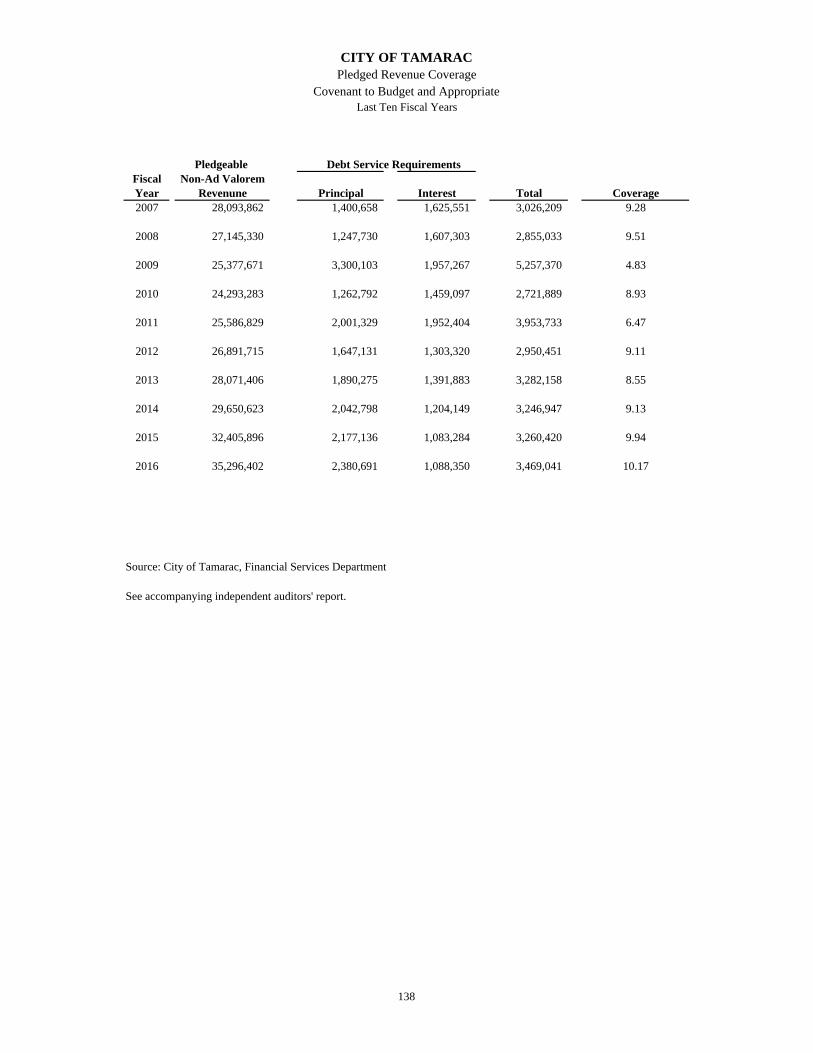
Pledgeable Debt Service RequirementsFiscal Non-Ad ValoremYear Revenune Principal Interest Total Coverage2007 28,093,862 1,400,658 1,625,551 3,026,209 9.28
2008 27,145,330 1,247,730 1,607,303 2,855,033 9.51
2009 25,377,671 3,300,103 1,957,267 5,257,370 4.83
2010 24,293,283 1,262,792 1,459,097 2,721,889 8.93
2011 25,586,829 2,001,329 1,952,404 3,953,733 6.47
2012 26,891,715 1,647,131 1,303,320 2,950,451 9.11
2013 28,071,406 1,890,275 1,391,883 3,282,158 8.55
2014 29,650,623 2,042,798 1,204,149 3,246,947 9.13
2015 32,405,896 2,177,136 1,083,284 3,260,420 9.94
2016 35,296,402 2,380,691 1,088,350 3,469,041 10.17
Source: City of Tamarac, Financial Services Department
See accompanying independent auditors' report.
CITY OF TAMARACPledged Revenue Coverage
Covenant to Budget and AppropriateLast Ten Fiscal Years
138

TotalPersonalIncome
Year PopulationSchool
EnrollmentUnemployment
Rate2007 59,949 42,092 1,337,342 22,308 45.5 83.5% 3,792 4.7%2008 59,272 47,483 1,483,697 25,032 49.1 83.5% 3,792 7.1%2009 59,340 41,029 1,547,366 25,820 49.3 86.8% 3,792 11.9%2010 59,510 40,447 1,502,270 25,244 47.6 87.1% 4,244 10.4%2011 60,427 40,389 1,476,836 24,440 47.1 88.7% 4,155 6.5%2012 61,542 41,837 1,570,552 25,520 47.4 89.1% 4,652 7.7%2013 62,557 41,972 1,551,288 24,798 47.1 89.7% 4,446 7.1%2014 63,155 42,548 1,570,981 24,875 46.5 90.8% 5,547 6.1%2015 63,793 43,250 1,590,870 24,938 45.3 90.0% 5,315 5.2%2016 64,681 43,235 1,574,853 24,348 47.2 90.0% 5,469 4.6%
Sources: 2000-2007 Per Capita Income source from 2001 & 2005 Bureau of Economic and Business Research. 2000-2007 Per Capita Income and Median Household Income other than 1999 are derived from an estimate of Broward County data. 2007 - 2009 Median Household Income, Per Capita Income and Median Age derived from an estimate of 2006-2008 American Community Survey. 2009 Population from 2000 U.S. Census - 2010 Estimate. 2011 Data is derived from the 2010 Census 2013 Median Household Income, Per Capita Income and Median Age derived from 2008-2012 American Community Survey 5-Year Estimates. 2013 Population based on 2012 Population Estimates (U.S. Census Bureau ) 2013 Median Household Income, Per Capita Income and Median Age derived from 2009-2014 American Community Survey 5-Year Estimates. 2015 Population based on 2014 Population Estimates (U.S. Census Bureau ) 2015 US Department of Labor Local Area Unemployment Statistics 2016 Population based on 2015 Population Estimates (U.S. Census Bureau ) 2016 US Department of Labor Local Area Unemployment Statistics
Notes:1 Median Age (2000-2009) and Percent High School Graduate or Higher (2000-2009), from 2000 Census. No data available outside of 2000 U.S. Census
Percent High1 School Graduate
or Higher
Median Household
Income
Per Capita Income Median1 Age
(amounts in thousand)
City of TamaracDemographic and Economic Statistics
Last Ten Calendar Years
139

2016 2007Percentage Percentage
of Total City of Total CityEmployees Employment Employees Employment
City Furniture Inc. 783 18.12% 1,800 29.47%
Convergys Customer Mgmt CP 766 17.73% 1,290 21.12%
Columbia Hospital Corp. (formerly University Hospital) 684 15.83% 1,000 16.37%
City of Tamarac 411 9.51% 403 6.60%
Wal-Mart Associates Inc. 385 8.91%
Richline Group (formerly Aurafin CP) 346 8.01% 250 4.09%
Employment Resources Inc. 300 6.94%
Henderson Behavioral Health (formerly Treatment Center) 242 5.60%
ABM Security Services Inc. 223 5.16% 0.00%
Consolidated Community Management I 181 4.19%
Publix Supermarkets 0.00% 510 8.35%
Walgreens 0.00% 185 3.03%
Heartland of Tamarac 0.00% 210 3.44%
Toshiba CP 0.00% 185 3.03%
Arch Aluminum & Glass 0.00% 275 4.50%
Source:* Tamarac Chambers of Commerce for 2005* 2016 Data provided by Florida Department of Economic Opportunity
See accompanying independent auditors' report.
Employer
Current and Nine Years AgoMajor Employers - Number of Employees
CITY OF TAMARAC
140

2007 2008 2009 2010 2011 2012 2013 2014 2015 2016
Governmental activities: General Government 103 97 89 88 67 73 73 75 77 78 Public Safety* 109 104 104 102 119 127 128 130 133 134 Transportation 17 10 10 10 14 13 11 10 10 11 Culture and recreation 36 34 42 35 40 46 47 52 50 50 Physical environment 69 65 64 59 26 26 26 31 34 35 Economic Development 3 2 1 1 1 2
Business-type activities: Water and Wastewater 51 50 51 50 61 64 64 63 63 63 Stormwater 18 18 18 21 21 21 23 20 20 21
Total 403 378 378 365 351 372 373 382 387 392
Notes:* The City contracts for police services with the Broward County Sheriff's Office and in doing so does not maintain a municipal police force.
Sources:City of Tamarac Adopted Budget Documents 2007-2016
See accompanying independent auditors' report.
Function/Program
Last Ten Fiscal YearsFull-Time Equivalent City Employees by Function/Program
CITY OF TAMARAC
141

2007 2008 2009 2010 2011 2012 2013 2014 2015 2016Function/ProgramGeneral Government Building Permits Issued 7,587 5,634 5,104 5,723 6,029 6,203 6,218 5,770 8,019 7,375 Building Inspections Conducted 33,215 17,103 16,834 16,058 15,654 15,112 15,667 14,181 20,133 22,620Police Physical Arrests 1,197 1,579 1,605 1,099 1,680 1,663 1,184 952 1,080 530 Traffic Violations 4,908 1,216 8,959 7,884 5,560 5,192 4,841 7,548 7,766 7,477Fire Emergency Responses 10,694 10,735 10,896 11,081 11,274 11,324 11,856 10,453 11,059 10,683 Inspections 1,684 2,652 2,714 2,667 2,639 2,824 2,710 2,313 2,500 3,106Refuse Collection Recyclables Collected (tons) 3,439 3,482 3,430 3,243 2,972 4,203 4,354 4,058 4,048 4,283Other Public Works Street Resurfacing (miles) 2.00 0.00 0.00 0.00 0.00 0.00 0.00 1.78 118.00 0.31 Potholes Repaired 64 115 82 122 180 171 296 221 231 261Parks and Recreation Athletic Field Permits Issued 87 2 90 130 158 508 809 833 925 991Water New Connections 350 74 14 17 11 19 15 43 253 485
Water Main Breaks 18 13 11 26 12 24 24 13 6 18
Average Daily Consumption (millions of gallons) 5.7 5.4 5.7 5.9 6.1 5.9 5.9 5.7 5.7 6.0 Peak Daily Consumption (millions of gallons) 11.2 14.0 7.5 6.6 6.9 6.4 8.5 6.5 6.7 7.0Wastewater Average Daily Sewage Treatment
(millions of gallons) 6.480 6.512 6.600 6.800 7.485 8.500 8.413 8.437 8.437 7.850
Transit Total Route Miles 80,244 73,450 98,281 112,324 121,340 128,960 120,595 109,516 108,595 108,314 Passengers 47,145 16,304 36,345 35,024 53,973 52,172 70,509 65,423 65,277 63,001
Sources:City of Tamarac Building and Code, Fire Rescue, Parks and Recreation, Public Works, Utilities departments; and Broward Sheriff's Office (District 7)
See accompanying independent auditors' report.
CITY OF TAMARACOperating Indicators by Function/Program
Last Ten Fiscal Years
142

2007 2008 2009 2010 2011 2012 2013 2014 2015 2016FunctionPublic safetyPolice:
Stations 1 1 1 1 1 1 1 1 1 1Patrol units 89 74 72 82 85 101 118 107 107 113
Fire stations 3 3 3 3 3 3 3 3 3 4
Highways and StreetsStreets (miles) 136 140 137 137 137 136 136 136 136 136Street lights 239 385 239 242 255 255 255 255 255 282
Culture and recreationParks acreage 150.55 159.05 153.6 153.6 153.6 176.6 640.6 416.0 416.0 416.0Parks 10 11 10 10 10 10 10 11 11 12Tennis courts 4 4 4 4 4 4 4 4 4 4Community centers 1 1 3 3 3 3 3 3 3 3Aquatic Center 1 1 1 1 1 1 1 1 1 1Golf Course N/A N/A N/A N/A N/A N/A 1 1 1 1
WaterWater mains (miles) 250.9 251.2 253.9 253.9 254.0 254.0 255.0 254.3 254.5 255.6Fire hydrants 2,043 2,045 2,077 2,079 2,083 2,084 2,091 2,094 2,101 2,128Maximum daily capacity(millions of gallons) 20 20 20 20 20 16 16 16 16 16
SewerSanitary Sewers (miles) 185.50 186.00 188.30 188.30 188.30 188.00 188.00 188.40 188.40 188.95Storm Sewers (miles) 77.0 78.6 77.0 82.0 82.0 82.0 82.0 82.3 82.3 82.3Maximum daily capacity(millions of gallons) 8.0 8.0 8.5 8.5 8.5 8.5 8.5 8.2 8.5 8.5
Sources:
See accompanying independent auditors' report.
Last Ten Fiscal YearsCapital Asset Statistics by Function
CITY OF TAMARAC
City of Tamarac Fire Rescue, Parks and Recreation, Public Works, Utilities departments; and Broward Sheriff's Office (District 7)
143


COMPLIANCE SECTION


144
Report on Internal Control over Financial Reporting and on Compliance and Other Matters Based on an Audit of Financial Statements Performed In Accordance with
Government Auditing Standards
Independent Auditor's Report To the Honorable Mayor, Members of the
City Commission, Pension Board of Trustees and City Manager City of Tamarac, Florida We have audited, in accordance with the auditing standards generally accepted in the United States of America and the standards applicable to financial audits contained in Government Auditing Standards issued by the Comptroller General of the United States, the financial statements of the governmental activities, the business-type activities, each major fund, and the aggregate remaining fund information of the City of Tamarac, Florida (the City), as of and for the year ended September 30, 2016, and the related notes to the financial statements, which collectively comprise the City's basic financial statements, and have issued our report thereon dated March 7, 2017. Internal Control over Financial Reporting In planning and performing our audit of the financial statements, we considered the City's internal control over financial reporting (internal control) to determine the audit procedures that are appropriate in the circumstances for the purpose of expressing our opinion on the financial statements, but not for the purpose of expressing an opinion on the effectiveness of the City's internal control. Accordingly, we do not express an opinion on the effectiveness of the City's internal control. A deficiency in internal control exists when the design or operation of a control does not allow management or employees, in the normal course of performing their assigned functions, to prevent, or detect and correct, misstatements on a timely basis. A material weakness is a deficiency, or a combination of deficiencies, in internal control, such that there is a reasonable possibility that a material misstatement of the entity's financial statements will not be prevented, or detected and corrected on a timely basis. A significant deficiency is a deficiency, or a combination of deficiencies, in internal control that is less severe than a material weakness, yet important enough to merit attention by those charged with governance. Our consideration of internal control was for the limited purpose described in the first paragraph of this section and was not designed to identify all deficiencies in internal control that might be material weaknesses or significant deficiencies and therefore, material weaknesses or significant deficiencies may exist that were not identified. Given these limitations, during our audit we did not identify any deficiencies in internal control that we consider to be material weaknesses. We did identify a deficiency in internal control, described in the accompanying schedule of findings and questioned costs as item 2016-01 that we consider to be a significant deficiency.

145
Compliance and Other Matters As part of obtaining reasonable assurance about whether the City's financial statements are free from material misstatement, we performed tests of its compliance with certain provisions of laws, regulations, contracts, and grant agreements, noncompliance with which could have a direct and material effect on the determination of financial statement amounts. However, providing an opinion on compliance with those provisions was not an objective of our audit, and accordingly, we do not express such an opinion. The results of our tests disclosed no instances of noncompliance or other matters that are required to be reported under Government Auditing Standards. City’s Response to Finding The City’s response to the finding identified in our audit is described in the accompanying schedule of findings and questioned costs. The City’s response was not subjected to the auditing procedures applied in the audit of the financial statements and, accordingly, we express no opinion on it. Purpose of this Report The purpose of this report is solely to describe the scope of our testing of internal control and compliance and the results of that testing, and not to provide an opinion on the effectiveness of the City's internal control or on compliance. This report is an integral part of an audit performed in accordance with Government Auditing Standards in considering the City's internal control and compliance. Accordingly, this communication is not suitable for any other purpose.
March 7, 2017 Fort Lauderdale, Florida

146
Report On Compliance For its Major Federal Program and Report On Internal Control Over Compliance
Independent Auditors’ Report
To the Honorable Mayor, Members of the
City Commission, Pension Board of Trustees and City Manager City of Tamarac, Florida Report on Compliance for Each Major Federal Program We have audited the City of Tamarac, Florida’s (the City) compliance with the types of compliance requirements described in the OMB Compliance Supplement that could have a direct and material effect
on the City’s major federal program for the year ended September 30, 2016. The City’s major federal program is identified in the summary of auditor’s results section of the accompanying schedule of findings and questioned costs. Management’s Responsibility Management is responsible for compliance with federal statutes, regulations, and the terms and conditions of its federal awards applicable to its federal programs. Auditor’s Responsibility Our responsibility is to express an opinion on compliance for the City’s major federal program based on our audit of the types of compliance requirements referred to above. We conducted our audit of compliance in accordance with auditing standards generally accepted in the United States of America; the standards applicable to financial audits contained in Government Auditing Standards, issued by the Comptroller General of the United States; and the audit requirements of Title 2 U.S. Code of Federal Regulations Part 200, Uniform Administrative Requirements, Cost Principles, and Audit Requirements for Federal Awards (Uniform Guidance). Those standards and the Uniform Guidance require that we plan and perform the audit to obtain reasonable assurance about whether noncompliance with the types of compliance requirements referred to above that could have a direct and material effect on a major federal program occurred. An audit includes examining, on a test basis, evidence about the City’s compliance with those requirements and performing such other procedures as we considered necessary in the circumstances. We believe that our audit provides a reasonable basis for our opinion on compliance for the major federal program. However, our audit does not provide a legal determination of the City’s compliance. Opinion on Major Federal Program In our opinion, the City complied, in all material respects, with the types of compliance requirements referred to above that could have a direct and material effect on its major federal program for the year ended September 30, 2016.

147
Report on Internal Control Over Compliance Management of the City is responsible for establishing and maintaining effective internal control over compliance with the types of compliance requirements referred to above. In planning and performing our audit of compliance, we considered the City’s internal control over compliance with the types of requirements that could have a direct and material effect on the major federal program to determine the auditing procedures that are appropriate in the circumstances for the purpose of expressing an opinion on compliance for the major federal program and to test and report on internal control over compliance in accordance with the Uniform Guidance, but not for the purpose of expressing an opinion on the effectiveness of internal control over compliance. Accordingly, we do not express an opinion on the effectiveness of the City’s internal control over compliance. A deficiency in internal control over compliance exists when the design or operation of a control over compliance does not allow management or employees, in the normal course of performing their assigned functions, to prevent, or detect and correct, noncompliance with a type of compliance requirement of a federal program on a timely basis. A material weakness in internal control over compliance is a deficiency, or combination of deficiencies, in internal control over compliance, such that there is a reasonable possibility that material noncompliance with a type of compliance requirement of a federal program will not be prevented, or detected and corrected, on a timely basis. A significant deficiency in internal control over compliance is a deficiency, or a combination of deficiencies, in internal control over compliance with a type of compliance requirement of a federal program that is less severe than a material weakness in internal control over compliance, yet important enough to merit attention by those charged with governance. Our consideration of internal control over compliance was for the limited purpose described in the first paragraph of this section and was not designed to identify all deficiencies in internal control over compliance that might be material weaknesses or significant deficiencies. We did not identify any deficiencies in internal control over compliance that we consider to be material weaknesses. However, material weaknesses may exist that have not been identified. The purpose of this report on internal control over compliance is solely to describe the scope of our testing of internal control over compliance and the results of that testing based on the requirements of the Uniform Guidance. Accordingly, this report is not suitable for any other purpose.
March 7, 2017 Fort Lauderdale, Florida

148
City of Tamarac, FloridaSchedule of Expenditures of Federal AwardsFiscal Year Ended September 30, 2016
Federal Agency,Pass-Through Entity, CFDA Contract / GrantFederal Program Number Number ExpendituresU.S. Department of Housing and Urban Development:
Community Development Block Grant 14.218 2012-2015 325,618 $
Passed through Broward County:Home Investment Partnership 14.239 not applicable 106,975
Total U.S. Department of Housing and Urban Development 432,593
U.S. Department of Homeland Security:Passed through Florida Department of Financial Services:
Assistance to Firefighters 97.044 EMS-2014-FR-00210 2,250,554
Passed through Florida Division of Emergency Management:Homeland Security Grant Program 97.067 15-DS-L5-11-16-01-233 10,692
Total U.S. Department of Homeland Security 2,261,246
U.S. Department of Transportation:Bikeway/Walkway Project Phase #3 20.205 425535-2-58/68-01 672,378
Total U.S. Department of Transportation 672,378
Total Expenditures of Federal Awards 3,366,217 $
See Notes to Schedules of Expenditures of Federal Awards and State Financial Assistance.

149
City of Tamarac, FloridaSchedule of State Financial AssistanceFiscal Year Ended September 30, 2016
State Agency,Pass-Through Entity, CSFA Contract / GrantState Project Number Number Expenditures
Florida Department of Environmental Protection:FRDAP2015-Sunset Pt Park (1-Picnic) 37.017 A16080 44,172 $ FRDAP2015-Sunset Pt Park (2-Playground) 37.017 A16019 50,000 House Ag & Nat Resources Appropriations Sub Committee-Pond Erosion 37.039 S0850 150,000
Total Florida Department of Environmental Protection 244,172
Florida Department of Emergency Management:Residential Construction and Mitigation Program 31.006 15RC-E6-11-16-02-270 79,843 Residential Construction and Mitigation Program 31.006 16RC-Q3-11-16-02-264 22,418
Total Florida Department of Emergency Management 102,261
Florida Housing Finance Agency:State Housing Initiatives Partnership (SHIP) Program 40.901 not applicable 230,110
Total Expenditures of State Financial Assistance 576,543 $
See Notes to Schedules of Expenditures of Federal Awards and State Financial Assistance.

City of Tamarac, Florida Notes to Schedules of Expenditures of Federal Awards and State Financial Assistance
150
(1) Basis of Presentation The accompanying Schedules of Expenditures of Federal Awards and State Financial Assistance (the Schedules) presents the activity of all federal awards and state financial assistance of the City of Tamarac, Florida (the City) for the year ended September 30, 2016. The information in the Schedules are presented in accordance with the requirements of Title 2 U.S. Code of Federal Regulations Part 200, Uniform Administrative Requirements, Cost Principles and Audit Requirements for Federal Awards (Uniform Guidance) and Chapter 10.550, Rules of the Florida Auditor General. Because the Schedules present only a selected portion of the operations of the City, they are not intended to and do not present the financial position, changes in net positions, or cash flows of the City. The City’s reporting entity is defined in Note 1 to the City’s basic financial statements. (2) Summary of Significant Accounting Policies The Schedules are presented using the modified accrual basis of accounting for expenditures accounted for in the governmental funds and on the accrual basis of accounting for expenses of the proprietary fund types, which are described in Note 1 to the City’s basic financial statements. Such expenditures are recorded following the cost principles contained in the Uniform Guidance and the Rules of the Department of Financial Services of the State of Florida, wherein certain types of expenditures are not allowable or are limited as to reimbursement. (3) Indirect Cost Recovery The City did not recover its indirect costs using the 10% de minimis indirect cost rate provided under Section 200.414 of the Uniform Guidance.

City of Tamarac, Florida Schedule of Findings and Questioned Costs
151
I – Summary of Independent Auditor's Results
Financial Statements
Type of auditor’s report issued:
Internal control over financial reporting:Material weakness(es) identified? Yes X NoSignificant deficiency(ies) identified that are
not considered to be material weakness(es)? X Yes None ReportedNoncompliance material to financial statements
noted? Yes X No
Federal Awards
Internal control over major program:Material weakness(es) identified? Yes X NoSignificant deficiency(ies) identified not
considered to be material weakness(es)? Yes X No
Type of auditor’s report issued on compliance formajor program:Any audit findings disclosed that are required
to be reported in accordance with Section2 CFR 200.516(a)? Yes X No
Identification of major program:
CFDA Number
97.044 Assistance to Firefighters
Dollar threshold used to distinguish between type A and type B programs:
Auditee qualified as low-risk auditee? X Yes No
II – Federal Award Findings and Questioned Costs
None reported.
Unmodified
Unmodified
Name of Federal Program or Cluster
750,000 $

City of Tamarac, Florida Schedule of Findings and Questioned Costs (Continued)
152
III – Financial Statement Findings
2016-01 ─ Capital Contributions Criteria: The City’s internal control system should be designed to allow for the proper identification and recording of capital contributions on an ongoing basis. Condition: During the current year, we noted capital contributions received from developers for the utilities fund were not identified and recorded in the proper accounting period. Cause: Established internal controls were not properly designed to allow for the identification and recording of capital contributions on an ongoing basis. Effect: The balances of capital assets and net investment in capital assets of the utilities fund and business-type activities were increased as of October 1, 2015 by $1,894,750. Context: The finding is considered systemic in nature. Recommendation: We recommend that management amend its current internal control policies and procedures to provide for a process to identify and record capital contributions when the transaction occurs. Views of Responsible Officials and Planned Corrective Actions: Upon discovery that Capital Contributions from developers were not recorded, City personnel immediately recorded the contributions as a prior period adjustment, informed the City’s Auditors of the adjustment and took steps to improve the internal control that lead to the oversight. The City evaluated a process, worked with the various agencies involved with managing Contributed Capital and implemented a new process for the recording of contributed Capital. The new process will provide for a routing of documentation to the various departments who are responsible for each phase of the managing, recoding in the general ledger and recording in the public records. Each time there is a new development which involves the transfer of property to the City, a bill of sale and all related documents will be routed and signed off by all departments prior to being recorded in the public records by the City Clerk. The process starts from Public Services who will compile the information, then it will be routed through Financial Services who will record the contributed capital in the general ledger, the City Attorney, City Manager and then the City Clerk for recording. This process will ensure that all bill of sales related to contributed capital is routed to Financial Services for proper accounting before being legally recorded.


153
Management Letter Required By Chapter 10.550 of the Rules of the
Auditor General of the State of Florida To the Honorable Mayor, Members of the
City Commission, Pension Board of Trustees and City Manager City of Tamarac, Florida Report on the Financial Statements We have audited the financial statements of the City of Tamarac, Florida (the City), as of and for the fiscal year ended September 30, 2016, and have issued our report thereon dated March 7, 2017. Auditor's Responsibility We conducted our audit in accordance with auditing standards generally accepted in the United States of America; the standards applicable to financial audits contained in Government Auditing Standards, issued by the Comptroller General of the United States; the audit requirements of Title 2 U.S. Code of Federal Regulations Part 200, Uniform Administrative Requirements, Cost Principles, and Audit Requirements of Federal Awards (Uniform Guidance); and Chapter 10.550, Rules of the Auditor General. Other Reports and Schedule We have issued our Independent Auditor's Report on Internal Control over Financial Reporting and on Compliance and Other Matters Based on an Audit of the Financial Statements Performed in Accordance with Government Auditing Standards, Independent Auditor’s Report on Compliance For Each Major Federal Program and Report on Internal Control over Compliance; Schedule of Findings and Questioned Costs; and Independent Accountant’s Report on an examination conducted in accordance with attestation standards established by the American Institute of Certified Public Accountants Professional Standards, Section 601, regarding compliance requirements in accordance with Chapter 10.550, Rules of the Auditor General. Disclosures in those reports and schedule, which are dated March 7, 2017, should be considered in conjunction with this management letter. Prior Audit Findings Section 10.554(1)(i)1., Rules of the Auditor General, requires that we determine whether or not corrective actions have been taken to address findings and recommendations made in the preceding annual financial audit report. There were no recommendations made in the preceding annual financial audit report. Official Title and Legal Authority Section 10.554(1)(i)4., Rules of the Auditor General, requires that the name or official title and legal authority for the primary government and each component unit of the reporting entity be disclosed in this management letter, unless disclosed in the notes to the financial statements. This is disclosed in Note 1 of the financial statements.

154
Financial Condition Sections 10.554(1)(i)5.a. and 10.556(7), Rules of the Auditor General, require that we apply appropriate procedures and report the results of our determination as to whether or not the City has met one or more of the conditions described in Section 218.503(1), Florida Statutes, and identification of the specific condition(s) met. In connection with our audit, we determined that the City did not meet any of the conditions described in Section 218.503(1), Florida Statutes. Pursuant to Sections 10.554(1)(i)5.c. and 10.556(8), Rules of the Auditor General, we applied financial condition assessment procedures. It is management's responsibility to monitor the City’s financial condition, and our financial condition assessment was based in part on representations made by management and the review of financial information provided by same. Annual Financial Report Sections 10.554(1)(i)5.b. and 10.556(7), Rules of the Auditor General, require that we apply appropriate procedures and report the results of our determination as to whether the annual financial report for the City for the fiscal year ended September 30, 2016, filed with the Florida Department of Financial Services pursuant to Section 218.32(1)(a), Florida Statutes, is in agreement with the annual financial audit report for the fiscal year ended September 30, 2016. In connection with our audit, we determined that these two reports were in agreement. Other Matters Section 10.554(1)(i)2., Rules of the Auditor General, requires that we address in the management letter any recommendations to improve financial management. In connection with our audit, we did not have any such recommendations. Section 10.554(1)(i)3., Rules of the Auditor General, requires that we address noncompliance with provisions of contracts or grant agreements, or abuse, that have occurred, or are likely to have occurred, that have an effect on the financial statements that is less than material but which warrants the attention of those charged with governance. In connection with our audit, we did not have any such findings. Purpose of this Letter Our management letter is intended solely for the information and use of the Legislative Auditing Committee, members of the Florida Senate and the Florida House of Representatives, the Florida Auditor General, Federal and other granting agencies, the Mayor, City Commissioners, and applicable management, and is not intended to be and should not be used by anyone other than these specified parties.
March 7, 2017 Fort Lauderdale, Florida

155
Independent Accountant’s Report The Honorable Mayor, Members of the
City Commission, and City Manager City of Tamarac, Florida We have examined the City of Tamarac, Florida’s (the City) compliance with Section 218.415, Florida Statutes, Local Government Investment Policies during the year ended September 30, 2016. Management is responsible for the City’s compliance with those requirements. Our responsibility is to express an opinion on the City’s compliance based on our examination. Our examination was conducted in accordance with attestation standards established by the American Institute of Certified Public Accountants and, accordingly, included examining, on a test basis, evidence about the City’s compliance with those requirements and performing such other procedures as we considered necessary in the circumstances. We believe that our examination provides a reasonable basis for our opinion. Our examination does not provide a legal determination on the City’s compliance with specified requirements. In our opinion, the City complied, in all material respects, with the aforementioned requirements for the year ended September 30, 2016. This report is intended solely for the information and use of the Florida Auditor General, the Honorable Mayor, Members of the City Commission, the City Manager, and applicable management, and is not intended to be and should not be used by anyone other than these specified parties.
Fort Lauderdale, Florida March 7, 2017