comprehensive annual financial reportgene f. mcgee, cmo - mayor • paula tierce, city clerk board...
TRANSCRIPT

COMPREHENSIVE ANNUAL FINANCIAL REPORT
THE CITY OF
RIDGELAND
CITY OF RIDGELAND, MISSISSIPPPI
For the Fiscal Year Ended September 30, 2013
Prepared by the Department of Finance and AdministrationPaula W. Tierce, City Clerk
Ashley Daniel, Finance Manager
1

City of Ridgeland, MississippiCOMPREHENSIVE ANNUAL FINANCIAL REPORT
For the Fiscal Year Ended September 30, 2013Table of Contents
INTRODUCTORY SECTIONLetter of Transmittal . . . . . . . . . . . . . . . . . . . . . . . . . . . . . . . . . . . . . . . . . . . . . . . . . . . . . . . . . . 11GFOA Certificate of Achievement . . . . . . . . . . . . . . . . . . . . . . . . . . . . . . . . . . . . . . . . . . . . . . . 16Organization Chart . . . . . . . . . . . . . . . . . . . . . . . . . . . . . . . . . . . . . . . . . . . . . . . . . . . . . . . . . . . . 17Listing of City Officials . . . . . . . . . . . . . . . . . . . . . . . . . . . . . . . . . . . . . . . . . . . . . . . . . . . . . . . . 18Geographic Location . . . . . . . . . . . . . . . . . . . . . . . . . . . . . . . . . . . . . . . . . . . . . . . . . . . . . . . . . . 18
FINANCIAL SECTIONIndependent Auditor’s Report on the Basic
Financial Statements and Supplementary Information . . . . . . . . . . . . . . . . . . . . . . . . . . . . . 25Management’s Discussion and Analysis (Required
Supplementary Information) . . . . . . . . . . . . . . . . . . . . . . . . . . . . . . . . . . . . . . . . . . . . . . . . . 29
BASIC FINANCIAL STATEMENTS
Government-wide Financial Statements:
Exhibit A-1 Statement of Net Position . . . . . . . . . . . . . . . . . . . . . . . . . . . . . . . . . . . . . . . . . . . . . . . . . . . 47
Exhibit A-2 Statement of Activities . . . . . . . . . . . . . . . . . . . . . . . . . . . . . . . . . . . . . . . . . . . . . . . . . . . . . . 48
Fund Financial Statements:
Exhibit A-3Balance Sheet - Governmental Funds . . . . . . . . . . . . . . . . . . . . . . . . . . . . . . . . . . . . . . . . . . 50
Exhibit A-4Reconciliation of the Governmental Funds Balance Sheetto the Statement of Net Position . . . . . . . . . . . . . . . . . . . . . . . . . . . . . . . . . . . . . . . . . . . . . . 52
Exhibit A-5Statement of Revenues, Expenditures, and Changesin Fund Balances - Governmental Funds . . . . . . . . . . . . . . . . . . . . . . . . . . . . . . . . . . . . . . . . 54
Exhibit A-6Reconciliation of the Statement of Revenues, Expenditures,and Changes in Fund Balances of Governmental Fundsto the Statement of Activities . . . . . . . . . . . . . . . . . . . . . . . . . . . . . . . . . . . . . . . . . . . . . . . . . 56
Exhibit A-7Statement of Net Position - Proprietary Funds . . . . . . . . . . . . . . . . . . . . . . . . . . . . . . . . . . . 57
Exhibit A-8Statement of Revenues, Expenses, and Changesin Fund Net Position - Proprietary Funds . . . . . . . . . . . . . . . . . . . . . . . . . . . . . . . . . . . . . . . 58
Exhibit A-9Statement of Cash Flows - Proprietary Funds . . . . . . . . . . . . . . . . . . . . . . . . . . . . . . . . . . . . 59
2
City of Ridgeland, MississippiCOMPREHENSIVE ANNUAL FINANCIAL REPORT
For the Fiscal Year Ended September 30, 2013Table of Contents
Notes to the Basic Financial Statements . . . . . . . . . . . . . . . . . . . . . . . . . . . . . . . . . . . . . . . . . 63
Required Supplementary Information:
Exhibit B-1General FundBudgetary Comparison Schedule . . . . . . . . . . . . . . . . . . . . . . . . . . . . . . . . . . . . . . . . . . . . . . 98Notes to the Required Supplementary Information . . . . . . . . . . . . . . . . . . . . . . . . . . . . . . . 100
Other Supplementary Information
Combining and Individual Fund Statements and Schedules:
Exhibit C-1Combining Balance SheetNonmajor Governmental Funds . . . . . . . . . . . . . . . . . . . . . . . . . . . . . . . . . . . . . . . . . . . . . . 102
Exhibit C-2Combining Statement of Revenues, Expenditures,and Changes in Fund BalancesNonmajor Governmental Funds . . . . . . . . . . . . . . . . . . . . . . . . . . . . . . . . . . . . . . . . . . . . . . 103
Exhibit C-3Forfeiture and Seizure FundSpecial Revenue FundBudgetary Comparison Schedule . . . . . . . . . . . . . . . . . . . . . . . . . . . . . . . . . . . . . . . . . . . . . 105
Exhibit C-4Debt Service FundMajor Fund - Debt Service FundBudgetary Comparison Schedule . . . . . . . . . . . . . . . . . . . . . . . . . . . . . . . . . . . . . . . . . . . . . 108
Exhibit C-5Colony Park TIF Bond Debt FundMajor Fund - Debt Service FundBudgetary Comparison Schedule . . . . . . . . . . . . . . . . . . . . . . . . . . . . . . . . . . . . . . . . . . . . . 109
Exhibit C-6Combining Balance SheetNonmajor Debt Service Funds . . . . . . . . . . . . . . . . . . . . . . . . . . . . . . . . . . . . . . . . . . . . . . . 111
Exhibit C-7Combining Statement of Revenues, Expendituresand Changes in Fund BalancesNonmajor Debt Service Funds . . . . . . . . . . . . . . . . . . . . . . . . . . . . . . . . . . . . . . . . . . . . . . . 112
Exhibit C-8S.A. School Creek InterceptDebt Service FundBudgetary Comparison Schedule . . . . . . . . . . . . . . . . . . . . . . . . . . . . . . . . . . . . . . . . . . . . . 114
3

City of Ridgeland, MississippiCOMPREHENSIVE ANNUAL FINANCIAL REPORT
For the Fiscal Year Ended September 30, 2013Table of Contents
Exhibit C-9Avery Boulevard Special Assessment Bond FundDebt Service FundBudgetary Comparison Schedule . . . . . . . . . . . . . . . . . . . . . . . . . . . . . . . . . . . . . . . . . . . . . 115
Exhibit C-10TIF Bond Debt LowesDebt Service FundBudgetary Comparison Schedule . . . . . . . . . . . . . . . . . . . . . . . . . . . . . . . . . . . . . . . . . . . . . 116
Exhibit C-11Bonds Issued FundDebt Service FundBudgetary Comparison Schedule . . . . . . . . . . . . . . . . . . . . . . . . . . . . . . . . . . . . . . . . . . . . . 117
Exhibit C-12Lake Harbour Recon 51 to Northpark Drive FundMajor Fund - Capital Project FundBudgetary Comparison Schedule . . . . . . . . . . . . . . . . . . . . . . . . . . . . . . . . . . . . . . . . . . . . . 121
Exhibit C-13Combining Balance SheetNonmajor Capital Projects Funds . . . . . . . . . . . . . . . . . . . . . . . . . . . . . . . . . . . . . . . . . . . . 122
Exhibit C-14Combining Statement of Revenues, Expenditures,and Changes in Fund BalancesNonmajor Capital Projects Funds . . . . . . . . . . . . . . . . . . . . . . . . . . . . . . . . . . . . . . . . . . . . 126
Exhibit C-15Jackson Street Multi UseCapital Projects FundBudgetary Comparison Schedule . . . . . . . . . . . . . . . . . . . . . . . . . . . . . . . . . . . . . . . . . . . . . 130
Exhibit C-16Pear Orchard Parkside VillageCapital Projects FundBudgetary Comparison Schedule . . . . . . . . . . . . . . . . . . . . . . . . . . . . . . . . . . . . . . . . . . . . . 131
Exhibit C-17Madison Ridgeland InterchangeCapital Projects FundBudgetary Comparison Schedule . . . . . . . . . . . . . . . . . . . . . . . . . . . . . . . . . . . . . . . . . . . . . 132
Exhibit C-182004 6 Mil Bond Issue FundCapital Project FundBudgetary Comparison Schedule . . . . . . . . . . . . . . . . . . . . . . . . . . . . . . . . . . . . . . . . . . . . . 133
Exhibit C-19Centre Street Ridgewood SignalCapital Projects FundBudgetary Comparison Schedule . . . . . . . . . . . . . . . . . . . . . . . . . . . . . . . . . . . . . . . . . . . . . 134
4

City of Ridgeland, MississippiCOMPREHENSIVE ANNUAL FINANCIAL REPORT
For the Fiscal Year Ended September 30, 2013Table of Contents
Exhibit C-20Pear Orchard Rice Road SignalCapital Projects FundBudgetary Comparison Schedule . . . . . . . . . . . . . . . . . . . . . . . . . . . . . . . . . . . . . . . . . . . . . 135
Exhibit C-21Lake Harbour Drive ExtensionCapital Projects FundBudgetary Comparison Schedule . . . . . . . . . . . . . . . . . . . . . . . . . . . . . . . . . . . . . . . . . . . . . 136
Exhibit C-222007 Bond Issue FundCapital Projects FundBudgetary Comparison Schedule . . . . . . . . . . . . . . . . . . . . . . . . . . . . . . . . . . . . . . . . . . . . . 137
Exhibit C-23City Center FundCapital Projects FundBudgetary Comparison Schedule . . . . . . . . . . . . . . . . . . . . . . . . . . . . . . . . . . . . . . . . . . . . . 138
Exhibit C-24Universal DES PlaygroundCapital Projects FundBudgetary Comparison Schedule . . . . . . . . . . . . . . . . . . . . . . . . . . . . . . . . . . . . . . . . . . . . . 139
Exhibit C-25Craft Center Parking LotCapital Projects FundBudgetary Comparison Schedule . . . . . . . . . . . . . . . . . . . . . . . . . . . . . . . . . . . . . . . . . . . . . 140
Exhibit C-265.7 Mil Bond Issue FundCapital Projects FundBudgetary Comparison Schedule . . . . . . . . . . . . . . . . . . . . . . . . . . . . . . . . . . . . . . . . . . . . . 141
Exhibit C-27Rice Road Trail Head ImprovementsCapital Projects FundBudgetary Comparison Schedule . . . . . . . . . . . . . . . . . . . . . . . . . . . . . . . . . . . . . . . . . . . . . 142
Exhibit C-28Public Utility FundEnterprise FundBudgetary Comparison Schedule . . . . . . . . . . . . . . . . . . . . . . . . . . . . . . . . . . . . . . . . . . . . . 145
Exhibit C-29Combining Statement of Net PositionInternal Service Funds . . . . . . . . . . . . . . . . . . . . . . . . . . . . . . . . . . . . . . . . . . . . . . . . . . . . . 147
Exhibit C-30Combining Statement of Revenues, Expenses, and Changes in Net PositionInternal Service Funds . . . . . . . . . . . . . . . . . . . . . . . . . . . . . . . . . . . . . . . . . . . . . . . . . . . . . 148
5
City of Ridgeland, MississippiCOMPREHENSIVE ANNUAL FINANCIAL REPORT
For the Fiscal Year Ended September 30, 2013Table of Contents
Exhibit C-31Combining Statement of Cash Flows Internal Service Funds . . . . . . . . . . . . . . . . . . . . . . . . . . . . . . . . . . . . . . . . . . . . . . . . . . . . . 149
Exhibit C-32EMCRS OperationsInternal Service FundBudgetary Comparison Schedule . . . . . . . . . . . . . . . . . . . . . . . . . . . . . . . . . . . . . . . . . . . . . 150
Exhibit C-33Insurance Trust FundInternal Service FundBudgetary Comparison Schedule . . . . . . . . . . . . . . . . . . . . . . . . . . . . . . . . . . . . . . . . . . . . . 151
Other Schedules:
Schedule D-1: Schedule of Investments - All Funds . . . . . . . . . . . . . . . . . . . . . . . . . . . . . . . . 152Schedule D-2: Schedule of Surety Bonds for Municipal Employees . . . . . . . . . . . . . . . . . . . . 153Schedule D-3: Schedule of Long-term Debt . . . . . . . . . . . . . . . . . . . . . . . . . . . . . . . . . . . . . . . 154Schedule D-4: Schedule of Expenditures of Federal Awards . . . . . . . . . . . . . . . . . . . . . . . . . . 155
STATISTICAL SECTION
Table 1: General Governmental Expenditures by function . . . . . . . . . . . . . . . . . . . . . . . . . . . 160Table 2: General Revenues by Source . . . . . . . . . . . . . . . . . . . . . . . . . . . . . . . . . . . . . . . . . . . 161Table 3: Fund Balance and Net Assets Information . . . . . . . . . . . . . . . . . . . . . . . . . . . . . . . . 162Table 4: Schedule of Changes in Net Assets, Last Five Fiscal Years . . . . . . . . . . . . . . . . . . . 163Table 5: Schedule of Changes in Fund Balance . . . . . . . . . . . . . . . . . . . . . . . . . . . . . . . . . . . 164Table 6: Property Tax Levies and Collections . . . . . . . . . . . . . . . . . . . . . . . . . . . . . . . . . . . . . 165Table 7: Assessed and Actual Value of Property . . . . . . . . . . . . . . . . . . . . . . . . . . . . . . . . . . 166Table 8: Property Tax Rates - Direct and Overlapping Governments . . . . . . . . . . . . . . . . . . . 167Table 9: Principal Taxpayers . . . . . . . . . . . . . . . . . . . . . . . . . . . . . . . . . . . . . . . . . . . . . . . . . . 168Table 10: Special Assessment Billings and Collections . . . . . . . . . . . . . . . . . . . . . . . . . . . . . . 169Table 11: Computation of Direct and Overlapping Bonded Debt . . . . . . . . . . . . . . . . . . . . . . . 170Table 12: Ratios of Outstanding Debt by Type . . . . . . . . . . . . . . . . . . . . . . . . . . . . . . . . . . . . 171Table 13: Legal Debt Margin Information . . . . . . . . . . . . . . . . . . . . . . . . . . . . . . . . . . . . . . . . 172Table 14: Ratio of Net General Obligation Debt to Assessed Value and
Net General Obligation Bonded Debt Per Capita . . . . . . . . . . . . . . . . . . . . . . . . . . . . . . . . 173Table 15: Ratio of Annual Debt Service Expenditures for G.O. Bonded
Debt to Total Governmental Expenditures . . . . . . . . . . . . . . . . . . . . . . . . . . . . . . . . . . . . . 174Table 16: Construction Activity . . . . . . . . . . . . . . . . . . . . . . . . . . . . . . . . . . . . . . . . . . . . . . . . 175Table 17: Property Value and Construction . . . . . . . . . . . . . . . . . . . . . . . . . . . . . . . . . . . . . . . 176Table 18: Demographic and Economic Statistics . . . . . . . . . . . . . . . . . . . . . . . . . . . . . . . . . . . 177Table 19: Education Related Information . . . . . . . . . . . . . . . . . . . . . . . . . . . . . . . . . . . . . . . . . 178Table 20: Principal Employers . . . . . . . . . . . . . . . . . . . . . . . . . . . . . . . . . . . . . . . . . . . . . . . . . 179Table 21: Full-time Equivalent Government Employees by Function . . . . . . . . . . . . . . . . . . . 180
6
City of Ridgeland, MississippiCOMPREHENSIVE ANNUAL FINANCIAL REPORT
For the Fiscal Year Ended September 30, 2013Table of Contents
Table 22: Operating Indicators by Function . . . . . . . . . . . . . . . . . . . . . . . . . . . . . . . . . . . . . . . 181Table 23: Capital Assets Indicators by Function . . . . . . . . . . . . . . . . . . . . . . . . . . . . . . . . . . . . 182Table 24: Miscellaneous Statistics . . . . . . . . . . . . . . . . . . . . . . . . . . . . . . . . . . . . . . . . . . . . . . . 183
REPORTS ON INTERNAL CONTROL AND COMPLIANCE
Independent Auditor's Report on the Internal Control over Financial Reporting and onCompliance and Other Matters Based on an Audit of the Financial StatementsPerformed in accordance with Government Auditing Standards . . . . . . . . . . . . . . . . . . . . . 186
Independent Auditor’s Report on Compliance for Each Major Federal Program; Report on Internal Control over Compliance Required by OMB Circular A-133 . . . . . . . . . . . . . . . . 188
Independent Auditor’s Report on Compliance with State Laws and Regulations . . . . . . . . . . 190
Schedule of Findings and Questioned Costs . . . . . . . . . . . . . . . . . . . . . . . . . . . . . . . . . . . . . . . 192
7

This page is intentionally left blank.
8
I
INTRODUCTORYSECTION
This section contains a letter of transmittal intended to give the reader a concise but thorough understanding of the background, structure, and the economic and financial condition of the City. An organizational chart is included along with a listing of principal City officials.
9

This page is intentionally left blank.
10

mailing address: p.o. box 217 • ridgeland, ms 39158street address: 304 highway 51 • ridgeland, ms 39157
ph: 601.856.7113 • www.ridgelandms.org
Gene F. McGee, cmo - mayor • Paula Tierce, city clerk
board of aldermen: D.I. Smith - at - large • Ken Heard, cmo - ward 1 • Chuck Gautier - ward 2 • Kevin Holder - ward 3Brian P. Ramsey - ward 4 • Scott Jones, mayor pro tempore - ward 5 • Wesley Hamlin - ward 6
January 17, 2014
To the Citizens of the City of Ridgeland, Mississippi:
It is our pleasure to submit the Comprehensive Annual Financial Report (CAFR) of the City ofRidgeland, Mississippi, for the fiscal year ended September 30, 2013. Responsibility for theaccuracy of the data presented and the completeness and fairness of the presentations in thefinancial statements, including all disclosures, rests with the management of the City ofRidgeland. This report was prepared in conformity with accounting principles generallyaccepted (GAAP) in the United States of America.
The City is responsible for establishing and maintaining internal controls to ensure that adequateaccounting data is compiled to allow preparation of financial statements in conformity withGAAP. Because the cost of a control should not exceed the benefits likely to be derived, internalcontrols have been implemented to provide reasonable, but not absolute, assurance regarding thereliability of the financial statements. We believe the information as presented is complete andaccurate.
Fortenberry & Ballard, PC, Certified Public Accountants, performed an examination, inaccordance with auditing standards generally accepted in the United States of America and thestandards applicable to financial audits contained in Government Auditing Standards issued bythe Comptroller General of the United States, of the basic financial statements for the City ofRidgeland. Their unqualified opinion is presented as the first page of the financial section of thisreport. Also, as required by federal law, a single audit was conducted and the report includes areport on compliance and internal control over compliance on major federal program fundsexpended by the City of Ridgeland.
GAAP requires that management provide a narrative introduction, overview and analysis toaccompany the basic financial statements in the form of Management’s Discussion and Analysis(MD&A). This letter of transmittal is designed to complement the MD&A and should be read inconjunction with it. The MD&A of the City of Ridgeland can be found immediately followingthe auditor’s report.
Profile of the Government
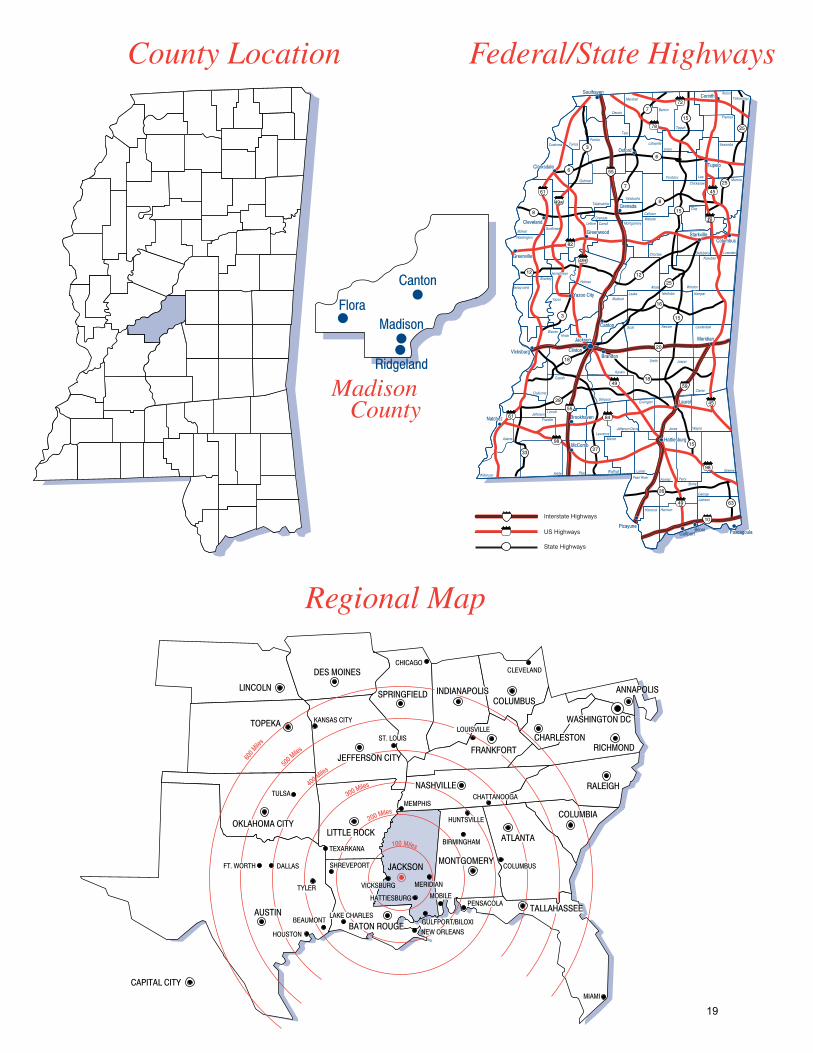
The City of Ridgeland, incorporated in 1899, is located in central Mississippi in south MadisonCounty. With a land area of 22 square miles, the City has grown rapidly since 1980. The City of
11
Ridgeland has seen continuous growth in population from census figures of 11,714 in 1990 to20,173 in 2000 to 24,047 in 2010. The latest population count as of July 1, 2012 is 24,258.
The Ross Barnett Reservoir, a major recreational area, adjoins Ridgeland to the east. TheNatchez Trace Parkway, a federal park commemorating the historical route from Natchez,Mississippi to Nashville, Tennessee, goes through the heart of the city.
Ridgeland is a code-charter municipality that operates under a Mayor/Board of Aldermen formof government. The Mayor is full-time and is elected at-large. Of the seven aldermen, six areelected by ward and one is elected at-large. The Mayor and Board serve concurrent four-yearterms. The next city-wide general election will be held in 2017.
The financial statements present information on the financial position and operations of the Cityas a single comprehensive reporting entity. The City of Ridgeland provides a full range ofservices to enhance and protect the lives of its citizens. The services include, but are not limitedto, police and fire protection, water and sewer services, construction and maintenance of streetsand infrastructure, planning and zoning, recreational and cultural services, and generaladministrative services.
The City of Ridgeland maintains specific budgetary controls. The objective of the budgetarycontrols is to ensure compliance with legal provisions embodied in the annual appropriatedbudget approved by the Mayor and Board of Aldermen. Activities of the general funds, debtservice funds, capital projects funds, and enterprise funds are included in the annual appropriatedbudget. The legal level of budgetary control, the level at which expenditure can not legallyexceed the appropriated amount, is established by major expenditure classifications withindepartments. These major classifications are personnel, supplies, services, and capital. Anychange in the appropriated amount of any major classification requires approval by the Mayorand Board of Aldermen. The City Clerk can approve any transfer within a major classification.
Factors Affecting Financial Condition
The City of Ridgeland is located in one of the fastest growing areas of the state. The City hasseen steady economic growth from the 1980s through 2013. The City of Ridgeland has not feltthe impact of the current recession as have other cities where housing, auto, or financial crisishave been concentrated. In fact, the valuation of non-residential permits issued by the City ofRidgeland increased by approximately $13 million from 2012 to 2013. The unemployment ratehas remained basically the same since 2012, which indicates that the recession has bottomed outin Ridgeland as well as the rest of Mississippi. The City of Ridgeland has seen a consistentincrease in sales tax collections, which indicates that retail is strong and continues to grow.
Ridgeland continues to enjoy a balanced mix of residential and commercial development. Theopening of 950,000 square foot Northpark mall in 1985 was the catalyst for a retail buildingboom in this area. Other commercial development quickly followed, with an associated increasein residential construction. In 2002 Madison County saw the beginning operations of a $930million Nissan production plant, which employs as many as four thousand employees in itsautomotive production facilities.
12
The Highland Colony Parkway was constructed in the late 1990s and has blossomed into avibrant mixed use corridor. Many international, national, and regional office headquarters havelocated along the Parkway. The Parkway is also home to numerous retail developmentsincluding Renaissance at Colony Park and Township at Colony Park. Renaissance is a 400,000square foot retail, restaurant, and office development that is adjacent to several mid-rise officebuildings. Township is an 80-acre mixed use development complete with retail, office,recreational, and housing uses. In addition, several neighborhoods have developed around theParkway. The Highland Colony Parkway corridor remains the fastest growing area of the Cityof Ridgeland.
Madison County and adjacent Hinds and Rankin counties comprise what is known informally asthe “Metro Area”. The City of Ridgeland has one of the lowest tax rates in the area, which hasremained unchanged since 1992.
Long-Term Financial Planning
In 2008 a long-term strategic plan was adopted by the Mayor and Board of Aldermen with inputfrom citizens and the business community. The primary focus during the coming years will becontinued improvement of transportation infrastructure and neighborhood revitalization. Aswith any rapidly-growing municipality, the City of Ridgeland is faced with keeping up withcurrent demand for services as well as planning for long-term growth.
Major Initiatives
There are currently 17.76 miles of multi-use trails and 2.2 miles of bike lanes in the City ofRidgeland. Currently, there are projects under construction that will add 1.25 miles of multi-usepaths. The City of Ridgeland has currently funded projects that are under design that will add anadditional 2.5 miles of multi-use paths during the next two years. The City has planned projectsthat eventually will add 24 miles of new bike lanes and multi-use paths.
Over the course of the past year, several park improvements have been completed. Among theseis the completion of the Adam’s Project Universal Playground, which is the only playground ofits type in central Mississippi. The $300,000 project was funded entirely by a CommunityDevelopment Block Grant and private donations. The half-acre playground in Freedom RidgePark contains play apparatus for children of all ages and ability levels, and it is inclusive of thosewith mental and physical challenges.
The City of Ridgeland received the Healthiest Hometown Award from Blue Cross Blue Shield ofMississippi in July 2013. With the $50,000 funds received, the City of Ridgeland purchased andplaced fitness equipment throughout city parks. The equipment includes a multi-purposeworkout station at the Ridgeland Multi-Purpose Trail, leg press and chest press machines atFriendship Park, a fitness playground at Freedom Ridge Park, and a climbing wall and awheelchair accessible fitness machine at the Universal Design Playground at Freedom RidgePark.
The City of Ridgeland has received national recognition for Freedom Ridge Park, earningmultiple awards from ASA and other organizations. This led to the City of Ridgeland beingselected to hosted the Men’s and Women’s Amateur Softball Association National
13
Championship Softball Series at Freedom Ridge Park. This marked the first time the event washeld outside of the ASA’s headquarters in Oklahoma City.
Ridgeland is an environmental hero among cities, earning the following awards for its efforts inrecycling and environmental protection: 2013 First Place Local Government Award from KeepMississippi Beautiful, Steward in the Mississippi Department of Environmental quality’senhance Program since 2011, Local Government Recycler of the Year 2011 from the MississippiRecycling Coalition, Merit Award from the American Society of Landscape Architects for theRidgeland Area Master Plan and Tree City USA certification since 2009.
The Ridgeland Area Master Plan earned a Clarion-Ledger/Mississippi Municipal LeagueExcellence Award for Planning and Development in 2008 for its citizen-led process ofdeveloping a long-range vision for Ridgeland’s future. The plan included progressive tactics toenhance development in a sustainable manner.
Ridgeland has also been recognized for its forward thinking and technology-oriented businesses. Ridgeland was named Mississippi’s eCity 2013 by Google for its strong online businesscommunity, making Ridgeland one of the nation’s digital capitals. BusinessWeek.com namedRidgeland as the Best Small City for Startups in Mississippi in 2009.
Known as destination for bicycling and a promoter of bicycling safety, Ridgeland earned thebronze award for Bicycle Friendly Community 2010-2014 by the League of AmericanBicyclists. Designated bike routes in Ridgeland include the Natchez Trace Parkway andHighland Colony Parkway. Local bicycling events often use the multiuse trails, mountain biketrails and the bike routes in Ridgeland.
In 2007, the City of Ridgeland issued $19,365,000 in bonds for improvement to the water andsewer system, widening Lake Harbour Drive to five lanes, and other miscellaneous drainage,roadway, and park improvements. Construction is completed, underway or soon to be underwayon each of these projects.
In 2011, the City of Ridgeland issued $5,825,000 in bonds for the design and construction of aCity Center, which was selected as the priority project by the citizen-based Master Plan SteeringCommittee. Currently, the City is in the process of removing the above and below-groundconcrete, which was left by a former concrete bridge beam construction company. The 2011bonds also funded the construction of an open-air pavilion at the multi-use trail head. Thepavilion includes picnic tables, restrooms, a bike rack and a bike repair station.
The City of Ridgeland is in the process of obtaining funding for several road expansion projects. The Lake Harbour Drive Extension project is estimated to cost approximately $20 million andthe Colony Park Boulevard project is expected to cost $10 million. Eighty percent of the ColonyPark Boulevard project will be funded by capital grants. The Mayor and Board of Aldermenappropriated an additional $426,000 in the 2014 fiscal year budget for street maintenance.
Mississippi law limits the amount of general obligation debt a municipality may issue to 15% oftotal assessed valuation. With an assessed valuation of $429,351,776, the City of Ridgeland’smargin for further issuance of general obligation debt is $46,398,186 as of September 30, 2013.
14

Moody’s Investor Services, widely regarded as one of the top three companies in financialresearch and analysis, awarded the City of Ridgeland with a bond rating of Aa2. Aa2 iscategorized as high-grade for long-term debt ratings and Prime-1, which is highest quality, forshort-term debt ratings. Aa2 is subject to very low credit risk. The Aa2 rating received by theCity of Ridgeland is the highest bond rating among cities in the State of Mississippi.
Financial Awards and Acknowledgments
The Government Finance Officers Association of the United States and Canada (GFOA)awarded a Certificate of Achievement for Excellence in Financial Reporting to the City ofRidgeland for its Comprehensive Annual Financial Report (CAFR) for the fiscal year endedSeptember 30, 2012. The Certificate of Achievement is a prestigious national award recognizingconformance with the highest standards for preparation of state and local government financialreports.
In order to be awarded a Certificate of Achievement, a government unit must publish an easilyreadable and efficiently organized Comprehensive Annual Financial Report, whose contentsconform to program standards. The reports must satisfy both generally accepted accountingprinciples and applicable legal requirements.
A Certificate of Achievement is valid for a period of one year. This was the twenty-firstconsecutive year that the City of Ridgeland received this prestigious award. We believe ourcurrent report continues to conform to the Certificate of Achievement Program requirements, andwe are submitting it to GFOA.
The preparation of this report on a timely basis could not have been accomplished without thecooperation of the entire staff of the Department of Finance and Administration. We also wish toexpress our appreciation to the other departments within the City of Ridgeland for theirsubmission of information for this report.
We acknowledge the thorough and professional manner in which the audit was conducted by ourindependent auditors, Fortenberry & Ballard, P.C., and their contribution toward the preparationof this CAFR.
In conclusion, we acknowledge the Board of Aldermen who consistently support the goal ofexcellence in all aspects of financial management by the City of Ridgeland. Their continuinginterest and support are greatly appreciated.
Respectfully yours,
Gene F. McGee Paula TierceMayor City ClerkCity of Ridgeland City of Ridgeland
15
Government Finance Officers Association
Certificate ofAchievementfor Excellencein FinancialReporting
Presented to
City of Ridgeland
Mississippi
For its Comprehensive AnnualFinancial Report
for the Fiscal Year Ended
September 30, 2012
ØrtrÊtu-Executive DirectoriCEO
16

Board of
Alderman
CityAttorney
AdvisoryBoards
MunicipalCourt
Mayor Executive Secretary
Finance andAdministration
PoliceDepartment
PublicWorks
Parks andRecreation
CommunityDevelopment
FireDepartment
CITY OF RIDGELAND
ORGANIZATION CHART
Voters
17
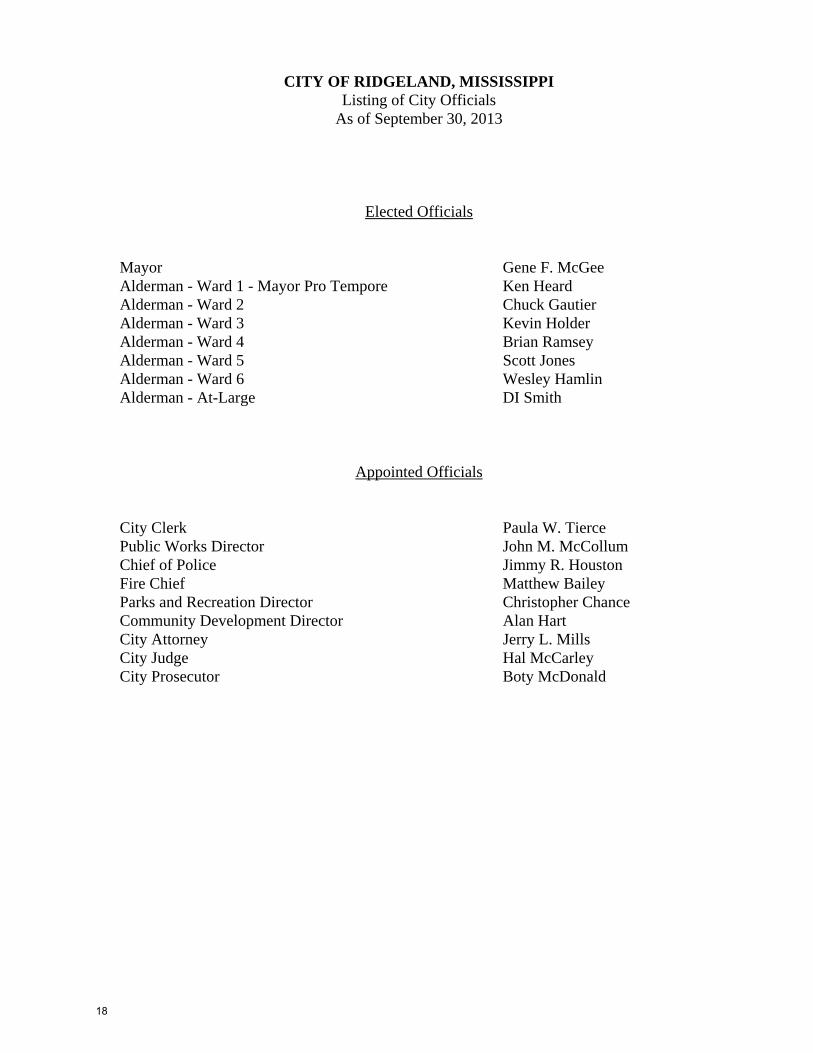
CITY OF RIDGELAND, MISSISSIPPIListing of City Officials
As of September 30, 2013
Elected Officials
Mayor Gene F. McGeeAlderman - Ward 1 - Mayor Pro Tempore Ken HeardAlderman - Ward 2 Chuck GautierAlderman - Ward 3 Kevin HolderAlderman - Ward 4 Brian RamseyAlderman - Ward 5 Scott JonesAlderman - Ward 6 Wesley HamlinAlderman - At-Large DI Smith
Appointed Officials
City Clerk Paula W. TiercePublic Works Director John M. McCollumChief of Police Jimmy R. HoustonFire Chief Matthew BaileyParks and Recreation Director Christopher ChanceCommunity Development Director Alan HartCity Attorney Jerry L. MillsCity Judge Hal McCarleyCity Prosecutor Boty McDonald
18
LINCOLN
TOPEKA
DES MOINES
SPRINGFIELDCOLUMBUS
RALEIGH
RICHMOND
CAPITAL CITY
TULSA
KANSAS CITY
CHICAGOCLEVELAND
MIAMI
DALLAS
MEMPHIS
JACKSON
100 Miles
200 Miles
300 Miles400 Miles
500 Miles
BATON ROUGENEW ORLEANSGULFPORT/BILOXI
TALLAHASSEEPENSACOLA
COLUMBUS
ATLANTA
HOUSTON
AUSTINBEAUMONT
TYLER
FT. WORTH
OKLAHOMA CITYLITTLE ROCK
NASHVILLE
JEFFERSON CITY
ST. LOUISLOUISVILLE
FRANKFORT
CHATTANOOGA
VICKSBURG
LAKE CHARLES
SHREVEPORT
TEXARKANABIRMINGHAM
MONTGOMERY
HUNTSVILLE
ANNAPOLIS
CHARLESTON
WASHINGTON DC
HATTIESBURG
MERIDIAN
MOBILE
600 Mile
s
INDIANAPOLIS
COLUMBIA
Regional Map
Federal/State HighwaysCounty Location
DesotoBenton
Tippah
Prentiss
ItawambaUnion
Pontotoc
Calhoun
Monroe
Clay
Tate
TunicaPanola
Yalobusha
Carroll
Quitman
Washington
Yazoo
Webster
ChoctawNoxubee
Winston
Leake
Oktibbeha
Newton
Jefferson
Pearl River
Adams
Wilkinson Amite
Franklin
Pike Walthall
Claiborne
Simpson
Smith Jasper
Clarke
WayneJonesJefferson Davis
Jackson
Stone
Harrison
PascagoulaBiloxi
Neshoba Kemper
WarrenHinds
Rankin
Scott Lauderdale
Marion
Lamar
Perry
Greene
George
Tallahatchie
Lincoln
Montgomery
AttalaHolmes
Bolivar
Grenada
Chickasaw
Lafayette
Lee
Alcorn
Madison
Sharkey
Hancock
Covington
Copiah
Interstate Highways
US Highways
State Highways
Marshall
63
26
3
Issaq uena
15
15
15
15
7
7
6
6
33
28
27
18
Lawrence
18
25
16
12 12
8
8
98
82
49W
98
49
61
61
84
49
3
10
59
Forrest
Lowndes
Sunflower
Coahoma
49E
20
55
55
Leflore
Humphreys
Gulfport
Laurel
Picayune
HattiesburgMcComb
Natchez Brookhaven
Vicksburg Clinton
Canton
Greenville
Yazoo City
Brandon
MeridianJackson
Greenwood
Grenada
Starkville
Cleveland
Tupelo
Oxford
SouthavenCorinth
Clarksdale
Tishomingo
78
45
72
45
Alt45
Columbus
25
25
Madison County
Madison
Ridgeland
Canton
Flora
19
This page is intentionally left blank.
20
II
FINANCIAL SECTION
This section includes the basic financial statements and the combining and individual fund financial statements and schedules, as well as the independent auditor’s report on the financial statements and schedules.
21

Page left blank intentionally.
22

City of Ridgeland, Mississippi
Audited Financial StatementsSeptember 30, 2013
23
FINANCIAL AUDIT REPORT
24
1929 Spillway Road, Suite BBrandon, Mississippi 39047
Telephone 601-992-5292 Fax 601-992-2033
INDEPENDENT AUDITOR'S REPORT ON THE BASIC FINANCIAL STATEMENTS AND SUPPLEMENTARY INFORMATION
Mayor and Board of AldermenCity of Ridgeland, Mississippi
Report on the Financial Statements
We have audited the accompanying financial statements of the governmental activities, business-type activities, each major fund, and the aggregate remaining fund information of the City ofRidgeland, Mississippi as of and for the year ended September 30, 2013, and the related notes tothe financial statements, which collectively comprise the City of Ridgeland, Mississippi’s basicfinancial statements as listed in the table of contents.
Management’s Responsibility for the Financial Statements
Management is responsible for the preparation and fair presentation of these financial statementsin accordance with accounting principles generally accepted in the United States of America;this includes the design, implementation, and maintenance of internal control relevant to thepreparation and fair presentation of financial statements that are free from material misstatement,whether due to fraud or error.
Auditor’s Responsibility
Our responsibility is to express opinions on these financial statements based on our audit. Weconducted our audit in accordance with auditing standards generally accepted in the UnitedStates of America and the standards applicable to financial audits contained in GovernmentAuditing Standards, issued by the Comptroller General of the United States. Those standardsrequire that we plan and perform the audit to obtain reasonable assurance about whether the financial statements are free from material misstatement.
An audit involves performing procedures to obtain audit evidence about the amounts anddisclosures in the financial statements. The procedures selected depend on the auditor’sjudgment, including the assessment of the risks of material misstatement of the financialstatements, whether due to fraud or error. In making those risk assessments, the auditorconsiders internal control relevant to the entity’s preparation and fair presentation of thefinancial statements in order to design audit procedures that are appropriate in the circumstances,but not for the purpose of expressing an opinion on the effectiveness of the entity’s internalcontrol. Accordingly, we express no such opinion. An audit also includes evaluating theappropriateness of accounting policies used and the reasonableness of significant accountingestimates made by management, as well as evaluating the overall presentation of the financialstatements.
25

We believe that the audit evidence we have obtained is sufficient and appropriate to provide abasis for our audit opinions.
Opinions
In our opinion, the financial statements referred to above present fairly, in all material respects,the respective financial position of the governmental activities, business-type activities, eachmajor fund, and the aggregate remaining fund information of the City of Ridgeland, Mississippi,as of September 30, 2013, and the respective changes in financial position and, where applicable,cash flows thereof for the year then ended in accordance with accounting principles generallyaccepted in the United States of America.
Other Matters
Required Supplementary Information
Accounting principles generally accepted in the United States of America require that themanagement’s discussion and analysis and budgetary comparison information on pages 29 to 45and 95 to 98 be presented to supplement the basic financial statements. Such information,although not a part of the basic financial statements, is required by the Governmental Account-ing Standards Board, who considers it to be an essential part of financial reporting for placingthe basic financial statements in an appropriate operational, economic, or historical context. Wehave applied certain limited procedures to the required supplementary information in accordancewith auditing standards generally accepted in the United States of America, which consisted ofinquiries of management about the methods of preparing the information and comparing theinformation for consistency with management’s responses to our inquiries, the basic financialstatements, and other knowledge we obtained during our audit of the basic financial statements. We do not express an opinion or provide any assurance on the information because the limitedprocedures do not provide us with sufficient evidence to express an opinion or provide anyassurance.
Other Information
Our audit was conducted for the purpose of forming opinions on the financial statements thatcollectively comprise the City of Ridgeland, Mississippi's financial statements. Theaccompanying Schedule of Expenditures of Federal Awards, as required by the Office ofManagement and Budget Circular A-133, Audits of State, Local Governments, and Non-ProfitOrganizations (Circular A-133), the introductory section, combining and individual non majorfund financial statements and the statistical section are presented for purposes of additionalanalysis and are not a required part of the basic financial statements.
The accompanying Schedule of Expenditures of Federal Awards, as required by the Office ofManagement and Budget Circular A-133, Audits of State, Local Governments, and Non-ProfitOrganizations (Circular A-133), the combining and individual non major fund financialstatements are the responsibility of management and were derived from and relate directly to theunderlying accounting and other records used to prepare the basic financial statements. Suchinformation has been subjected to the auditing procedures applied in the audit of the basic
26
financial statements and certain additional procedures, including comparing and reconciling suchinformation directly to the underlying accounting and other records used to prepare the basicfinancial statements or to the financial statements themselves, and other additional procedures inaccordance with auditing standards generally accepted in the United States of America. In ouropinion, the information is fairly stated in all material respects in relation to the basic financialstatements as a whole.
The introductory and statistical sections have not been subjected to the auditing proceduresapplied in the audit of the basic financial statements and, accordingly, we do not express anopinion or provide any assurance on them.
Other Reporting Required by Government Auditing Standards
In accordance with Government Auditing Standards, we have also issued our report datedJanuary 17, 2014, on our consideration of the City of Ridgeland, Mississippi's internal controlover financial reporting and on our tests of its compliance with certain provisions of laws,regulations, contracts and grant agreements and other matters. The purpose of that report is todescribe the scope of our testing of internal control over financial reporting and compliance andthe results of that testing, and not to provide an opinion on internal control over financialreporting or on compliance. That report is an integral part of an audit performed in accordancewith Government Auditing Standards in considering City of Ridgeland, Mississippi’s internalcontrol over financial reporting and compliance.
Fortenberry & Ballard, PC Certified Public AccountantsJanuary 17, 2014
27
MANAGEMENT’S DISCUSSION AND ANALYSIS
28
City of RidgelandManagement’s Discussion and AnalysisFor the year ended September 30, 2013
The following discussion and analysis of the City of Ridgeland’s financial performance providesan overview of the City’s financial activities for the year ended September 30, 2013. The intentof this discussion and analysis is to look at the City’s financial performance as a whole. Readersare encouraged to review the financial statements and the notes to the financial statements toenhance their understanding of the City’s financial performance.
FINANCIAL HIGHLIGHTS
# Total net position increased $9,314,372, which represents a 4% increase from fiscal year2012. Total net position increased $54,268 in the prior year, including a prior periodadjustment of ($1,399,235), which represents a .03% increase from fiscal year 2011.
# General revenues account for $23,384,895, or 53% of all revenues in 2013. Generalrevenues account for $26,314,707, or 69% of all revenues in 2012. Program specificrevenues in the form of charges for services and grants and contributions accounted for$20,660,805 or 47% of total revenues in 2013, compared with $12,081,591 or 31% oftotal revenues in 2012.
# The City had $34,731,328 in expenses, an amount that increased when compared with the$36,942,795 in expenses for the prior year; $20,660,805 of these expenses were offset byprogram specific charges for services, grants and contributions. General revenues of$23,384,895 were adequate to provide for these programs in 2013, and general revenuesof $26,314,707 were adequate to provide for these programs in 2012.
# Among the major funds, the General Fund had $22,652,410 in revenues and $20,845,140in expenditures. In 2012 the General Fund had $21,038,924 in revenues and $20,693,130 in expenditures. The General Fund’s fund balance increased by $1,823,335 from 2012 to2013 and increased by $61,593 from 2011 to 2012.
# The Enterprise Fund - Public Utility Fund had $6,079,849 in revenues and $4,960,519 inexpenses. Its net income was $494,728 after non-operating revenues and transfers wereincluded. Last year it showed $6,001,457 in revenues and $5,218,942 in expenses. Itsnet loss was $925,067 after non-operating revenues, transfers and prior periodadjustments were included.
# Capital assets, net of accumulated depreciation, increased by $4,967,892 in thegovernmental activities, including the effect of the Internal Service Fund that isaccounted for with the governmental activities. This increase in the governmentalactivities was due to the additions to construction in progress. See Note 5 on page 77 ofthis report. Capital assets, net of accumulated depreciation, decreased by $1,898,207from 2011 to 2012.
# Capital assets decreased $108,941 in the business-type activities mainly due to
depreciation expense. Capital assets increased $1,144,293 in the business-type activitiesfrom 2011 to 2012.
29
City of RidgelandManagement’s Discussion and AnalysisFor the year ended September 30, 2013
# Long-term debt decreased by $3,294,805 in the governmental activities from 2012 to2013. The decrease in the governmental activities was mainly due to principal paymentson outstanding long-term debt. Long-term debt decreased by $3,426,676 in thegovernmental activities from 2011 to 2012.
# Long-term debt decreased by $949,330 in the business-type activities from 2012 to 2013. This decrease was related mainly to principal payments made during the year. Long-termdebt increased by $791,065 in the business-type activities from 2011 to 2012.
Using this Annual Financial Report
This annual report consists of a series of financial statements and notes to those statements. These statements are organized so the reader can understand the City of Ridgeland as a financialwhole or as an entire operating entity. The statements then proceed to provide an increasinglydetailed look at specific financial conditions.
The Statement of Net Position and Statement of Activities provide information about theactivities of the whole City, presenting both an aggregate view of the City’s finances and alonger-term view of those assets. Major fund financial statements provide the next level ofdetail. For governmental funds, these statements show how services were financed in the short-term as well as what dollars remain for future spending. The fund financial statements also lookat the City’s most significant funds with all other non-major funds presented in total in onecolumn.
Reporting the City of Ridgeland as a Whole
Statement of Net Position and the Statement of Activities
While this document contains information about the funds used by the City to provide services toour citizens, the view of the City as a whole looks at all financial transactions and asks thequestion, “How did we do financially during 2013?” The Statement of Net Position and theStatement of Activities answers this question.
These statements include all assets and liabilities using the accrual basis of accounting similar tothe accounting used by the private sector companies. This basis of accounting takes into accountall of the current year’s revenues and expenses regardless of when the cash is received or paid. These two statements report the City’s net position and the changes in net position. This changein net position is important because it tells the reader whether, for the City as a whole, thefinancial position of the City has improved or diminished. However, in evaluating the overallposition of the City, non-financial information such as changes in the City’s tax base and thecondition of City capital assets will also need to be evaluated.
30

City of RidgelandManagement’s Discussion and AnalysisFor the year ended September 30, 2013
In the Statement of Net Position and the Statement of Activities, all of the City’s activities arereported in Governmental Activities and Business-type Activities, which include all of the City’sservices including police, fire, administration, water and sewer service and all other departments.
The City of Ridgeland has no Component units as defined by the Governmental AccountingStandard Board (GASB).
Reporting the City of Ridgeland’s Most Significant Funds
Fund Financial Statements
Fund financial reports provide detailed information about the City’s major funds. Based onrestrictions on the use of monies, the City has established many funds, which account for themultitude of services provided to the City’s residents. However, these fund financial statementsfocus on the City’s most significant funds. In the case of the City of Ridgeland, the City’s majorfunds are the General, the Debt Service Fund, Colony Park TIF Bond Debt and Lake HarbourReconstruction 51 to Northpark Drive.
The Debt Service Fund reported a deficit balance of $259,788 at the end of the year but the Cityexpects this to be eliminated in the next three (3) years. The Lake Harbour Reconstruction 51 toNorthpark Drive reported ($5,803,430). This deficit fund balance has previously been providedfor and will be eliminated from previous loan proceeds which are held in the 2007 Bond IssueFund.
Governmental Funds
All of the City’s non-proprietary activities are reported in the governmental funds, which focuson how money flows into and out of those funds and the balances left at year-end available forspending in future periods. These funds are reported using an accounting method calledmodified accrual accounting, which measures cash and all other financial assets that can readilybe converted to cash. The governmental fund statements provide a detailed short-term view ofthe City’s general government operations and the basic services it provides. Governmental fundinformation helps you determine whether there are more or fewer financial resources that can bespent in the near future on services provided to the City’s residents. The relationship (ordifferences) between governmental activities (reported in the Statement of Net Position and theStatement of Activities) and governmental funds is reconciled in the financial statements.
The City of Ridgeland as a Whole
GOVERNMENT-WIDE FINANCIAL ANALYSIS
Over time the trend as well as the amount of net position may serve as a useful indicator of agovernment’s financial position. In the case of the City, assets exceeded liabilities by$224,396,019 at September 30, 2013.
31

City of RidgelandManagement’s Discussion and AnalysisFor the year ended September 30, 2013
The following chart depicts the total amount of assets, liabilities, and net position as ofSeptember 30, 2013 and 2012 in the governmental activities column.
The largest portion of the City’s net position for governmental activities ($180,120,940 or 92%)reflect its net investment in capital assets (capital assets less any capital related outstanding debtused to acquire those capital assets). Although the City’s investment in capital assets is reportednet of the related debt, it should be noted that the resources needed to repay this debt must beprovided from other sources and not the capital assets themselves.
The following are significant current year transactions that have had an impact on theGovernment-Wide Statement of Net Position - Governmental Activities.
# The $3,258,465 retirement of principal of long-term debt.
# The loss on the change in fair value of investments of $307,658.
The following table shows a comparative analysis of the assets, liabilities, and net position forthe Government-Wide Statement of Net Position.
32

City of RidgelandManagement’s Discussion and AnalysisFor the year ended September 30, 2013
Government-Wide Condensed Statement of Net PositionGovernmental Activities
September 30, 2013 September 30, 2012Percentage
Change
Assets:
Current assets $ 21,897,007 20,255,889 8%
Other assets 31,964,950 33,286,453 -4%
Capital assets 203,995,713 199,027,821 2%
Total Assets 257,857,670 252,570,163 2%
Liabilities:
Current liabilities 6,994,137 6,171,397 13%
Other liabilities 34,368,452 36,031,253 -5%
Long-term liabilities 21,513,556 24,205,632 -11%
Total Liabilities 62,876,145 66,408,282 -5%
Net Position:
Net investment in capital assets 180,120,940 177,810,478 1%
Restricted 496,945 1,068,499 -53%
Unrestricted 14,363,640 7,282,904 97%
Total Net Position $ 194,981,525 186,161,881 5%
The table on the next page depicts the revenues by major sources extracted from the government-wide statement of activities - governmental activities column.
33
City of RidgelandManagement’s Discussion and AnalysisFor the year ended September 30, 2013
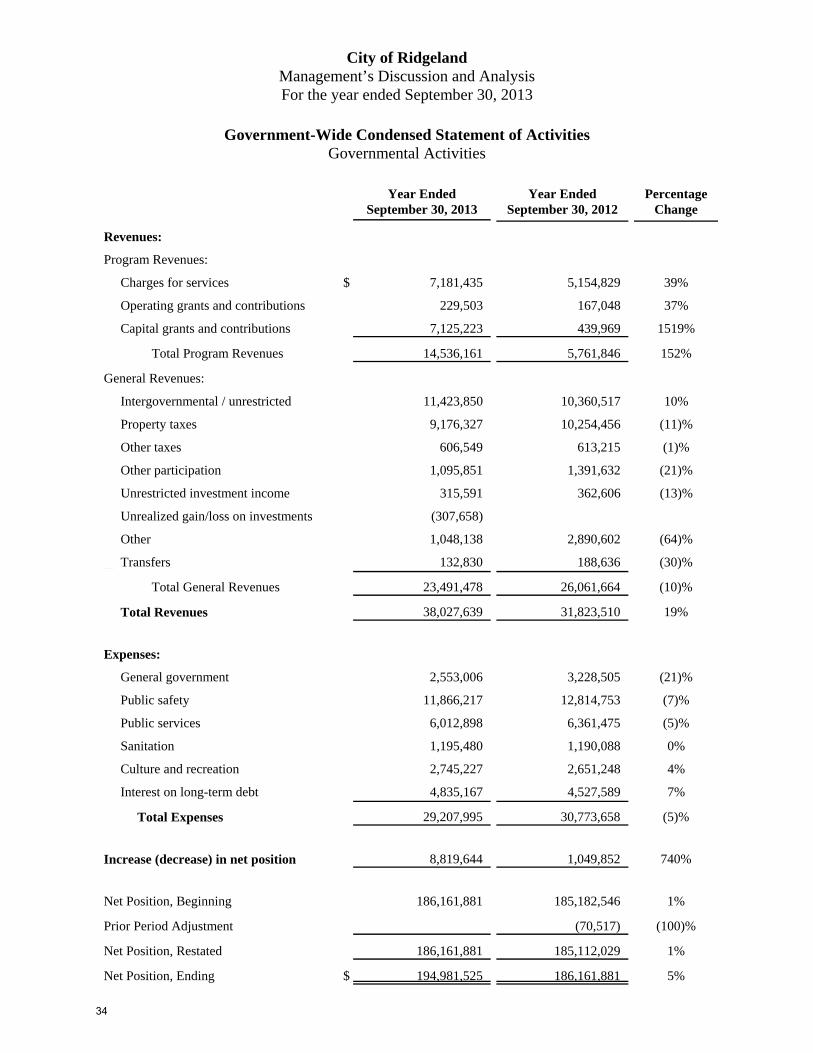
Government-Wide Condensed Statement of ActivitiesGovernmental Activities
Year EndedSeptember 30, 2013
Year EndedSeptember 30, 2012
PercentageChange
Revenues:
Program Revenues:
Charges for services $ 7,181,435 5,154,829 39%
Operating grants and contributions 229,503 167,048 37%
Capital grants and contributions 7,125,223 439,969 1519%
Total Program Revenues 14,536,161 5,761,846 152%
General Revenues:
Intergovernmental / unrestricted 11,423,850 10,360,517 10%
Property taxes 9,176,327 10,254,456 (11)%
Other taxes 606,549 613,215 (1)%
Other participation 1,095,851 1,391,632 (21)%
Unrestricted investment income 315,591 362,606 (13)%
Unrealized gain/loss on investments (307,658)
Other 1,048,138 2,890,602 (64)%
Transfers 132,830 188,636 (30)%
Total General Revenues 23,491,478 26,061,664 (10)%
Total Revenues 38,027,639 31,823,510 19%
Expenses:
General government 2,553,006 3,228,505 (21)%
Public safety 11,866,217 12,814,753 (7)%
Public services 6,012,898 6,361,475 (5)%
Sanitation 1,195,480 1,190,088 0%
Culture and recreation 2,745,227 2,651,248 4%
Interest on long-term debt 4,835,167 4,527,589 7%
Total Expenses 29,207,995 30,773,658 (5)%
Increase (decrease) in net position 8,819,644 1,049,852 740%
Net Position, Beginning 186,161,881 185,182,546 1%
Prior Period Adjustment (70,517) (100)%
Net Position, Restated 186,161,881 185,112,029 1%
Net Position, Ending $ 194,981,525 186,161,881 5%
34
City of RidgelandManagement’s Discussion and AnalysisFor the year ended September 30, 2013
GENERAL GOVERNMENT FUNCTIONS
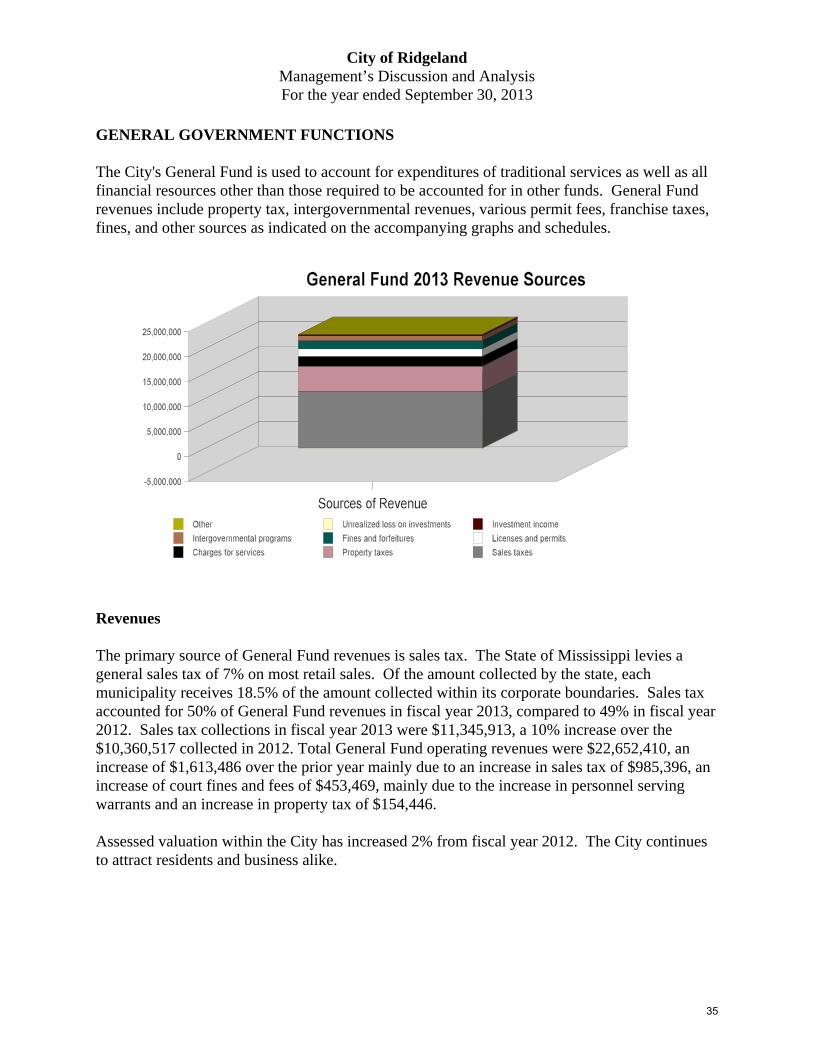
The City's General Fund is used to account for expenditures of traditional services as well as allfinancial resources other than those required to be accounted for in other funds. General Fundrevenues include property tax, intergovernmental revenues, various permit fees, franchise taxes,fines, and other sources as indicated on the accompanying graphs and schedules.
Revenues
The primary source of General Fund revenues is sales tax. The State of Mississippi levies ageneral sales tax of 7% on most retail sales. Of the amount collected by the state, eachmunicipality receives 18.5% of the amount collected within its corporate boundaries. Sales taxaccounted for 50% of General Fund revenues in fiscal year 2013, compared to 49% in fiscal year2012. Sales tax collections in fiscal year 2013 were $11,345,913, a 10% increase over the$10,360,517 collected in 2012. Total General Fund operating revenues were $22,652,410, anincrease of $1,613,486 over the prior year mainly due to an increase in sales tax of $985,396, anincrease of court fines and fees of $453,469, mainly due to the increase in personnel servingwarrants and an increase in property tax of $154,446.
Assessed valuation within the City has increased 2% from fiscal year 2012. The City continuesto attract residents and business alike.
35
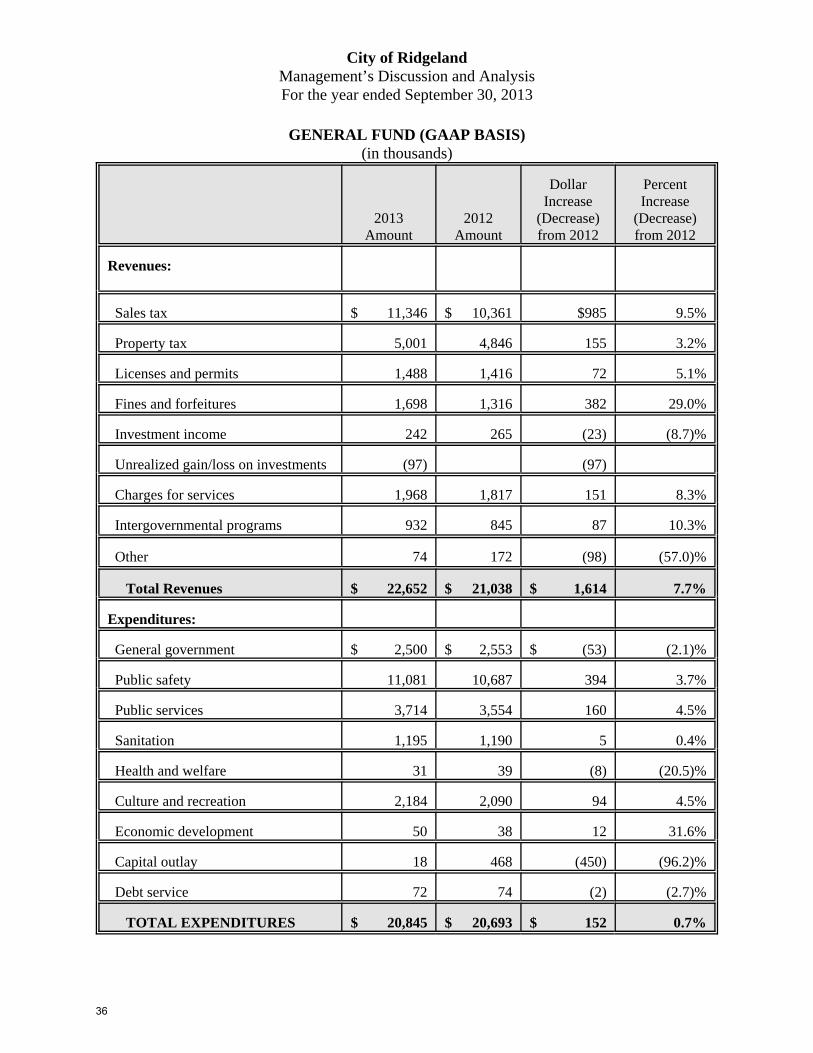
City of RidgelandManagement’s Discussion and AnalysisFor the year ended September 30, 2013
GENERAL FUND (GAAP BASIS)(in thousands)
2013Amount
2012Amount
DollarIncrease
(Decrease)from 2012
PercentIncrease
(Decrease)from 2012
Revenues:
Sales tax $ 11,346 $ 10,361 $985 9.5%
Property tax 5,001 4,846 155 3.2%
Licenses and permits 1,488 1,416 72 5.1%
Fines and forfeitures 1,698 1,316 382 29.0%
Investment income 242 265 (23) (8.7)%
Unrealized gain/loss on investments (97) (97)
Charges for services 1,968 1,817 151 8.3%
Intergovernmental programs 932 845 87 10.3%
Other 74 172 (98) (57.0)%
Total Revenues $ 22,652 $ 21,038 $ 1,614 7.7%
Expenditures:
General government $ 2,500 $ 2,553 $ (53) (2.1)%
Public safety 11,081 10,687 394 3.7%
Public services 3,714 3,554 160 4.5%
Sanitation 1,195 1,190 5 0.4%
Health and welfare 31 39 (8) (20.5)%
Culture and recreation 2,184 2,090 94 4.5%
Economic development 50 38 12 31.6%
Capital outlay 18 468 (450) (96.2)%
Debt service 72 74 (2) (2.7)%
TOTAL EXPENDITURES $ 20,845 $ 20,693 $ 152 0.7%
36
City of RidgelandManagement’s Discussion and AnalysisFor the year ended September 30, 2013
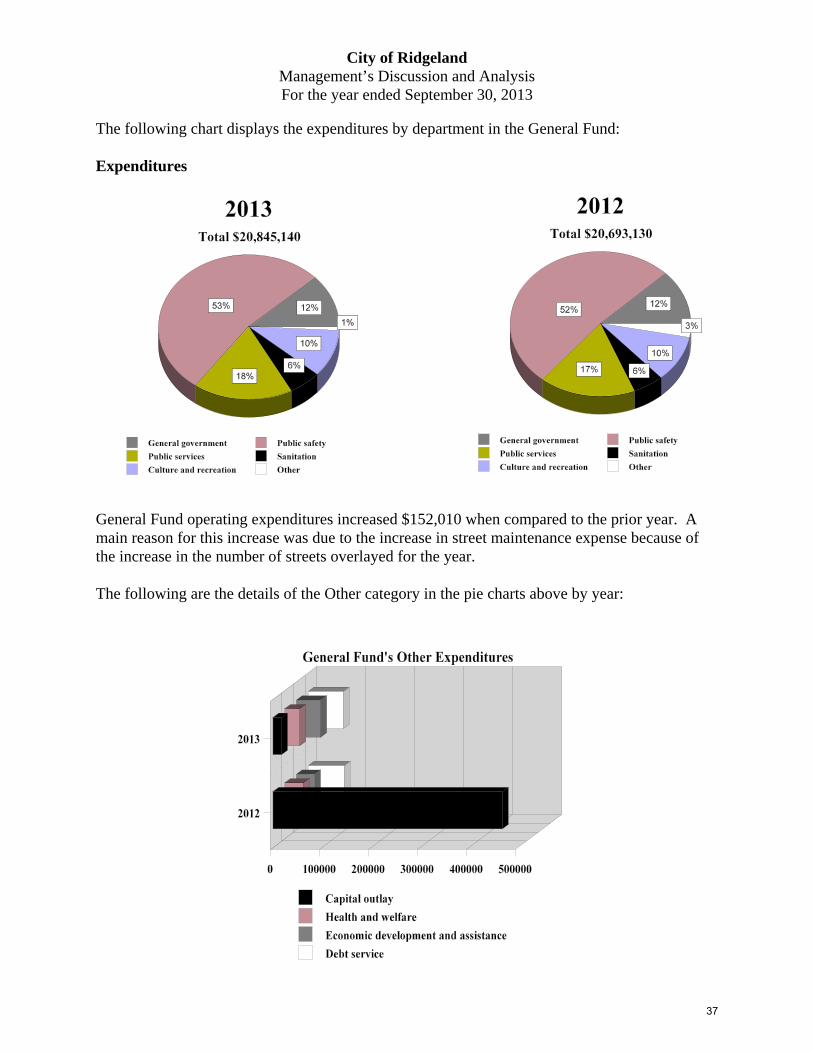
The following chart displays the expenditures by department in the General Fund:
Expenditures
General Fund operating expenditures increased $152,010 when compared to the prior year. Amain reason for this increase was due to the increase in street maintenance expense because ofthe increase in the number of streets overlayed for the year.
The following are the details of the Other category in the pie charts above by year:
37

City of RidgelandManagement’s Discussion and AnalysisFor the year ended September 30, 2013
Status of Fund Balance
On the General Fund balance sheet, fund balance is reported in classifications that comprise ahierarchy based primarily on the extent to which the government is bound to honor constraintson the specific purposes for which amounts in those funds can be spent. The remaining portionwhich is available for appropriation. The fiscal year ended September 30, 2013 endingunassigned fund balance is $14,804,704 which is 71% of the general fund operatingexpenditures.
Other Governmental Funds
The financial performance of the City as a whole is reflected in its governmental funds. As theCity completed the year, its governmental funds reported a combined fund balance of$14,844,402, an increase of $461,896 attributable to the increase in court fines and fees of$453,000 because of the increase in the number of warrant officers. $7,841,486 or 53% of thefund balance is unassigned fund balance, which represents the residual classification fundbalance that has not been assigned to other funds and that has not been restricted, committed orassigned to specific purposes. The remaining fund balance of $7,002,916 or 47% is eithernonspendable, restricted or assigned to indicate that is not available for spending except only forthe purposes to which it is restricted, committed or assigned.
38
City of RidgelandManagement’s Discussion and AnalysisFor the year ended September 30, 2013
Unassigned fund balance is the residual classification for the general fund. The general fund isthe only fund that reports a positive unassigned fund balance amount. This year the City ofRidgeland had a positive $14,804,704 unassigned fund balance in the general fund, whichconstitutes almost 100% of the total fund balance in the governmental funds. However, therewere several capital project funds with negative ending fund balances. Statement No. 54indicates that if there is a negative balance after classifying amounts as nonspendable, restrictedor committed, the fund would report a negative amount as unassigned. This is the case in theCity of Ridgeland and as such, the total ending unassigned fund balance represents 53% of thetotal fund balance in the governmental funds. Additionally, the Board of Aldermen passed aresolution to maintain a fund balance not below 45% of expenditures in the General Fund.
The decrease in the Debt Service Fund was $535,210. The reason for this decrease was due todebt payments exceeding revenues collected. The Colony Park TIF Bond Debt did not show anincrease or decrease during the year. The Lake Harbour Reconstruction 51 to North Park Fundshowed a decrease of $146,382. The fund balance of Other Governmental Funds showed adecrease of $679,847. The reason for this decrease was mainly due to an increase inexpenditures for capital projects.
PROPRIETARY FUNDS Ridgeland's proprietary operations consist of the Public Utility Revenue Fund, the East MadisonCounty Regional Sewer (EMCRS) Fund and the Insurance Trust Fund. The Public UtilityRevenue Fund accounts for traditional water and sewer revenues and expenditures to constructand maintain a water and sewer system.
The East Madison County Regional Sewer Fund was created through an agreement betweenRidgeland, Madison, and the Pearl River Valley Water Supply District whereby all sewage issent through interceptor lines to be treated at the City of Jackson treatment plant. All entitiesinvolved collect a separate sewer fee for this service and submit the fee to Ridgeland monthly. Ridgeland maintains the accounting records, forwards payments to the City of Jackson, andperforms maintenance on the system.
The Insurance Trust Fund accounts for the City’s self insured employee health insuranceprogram.
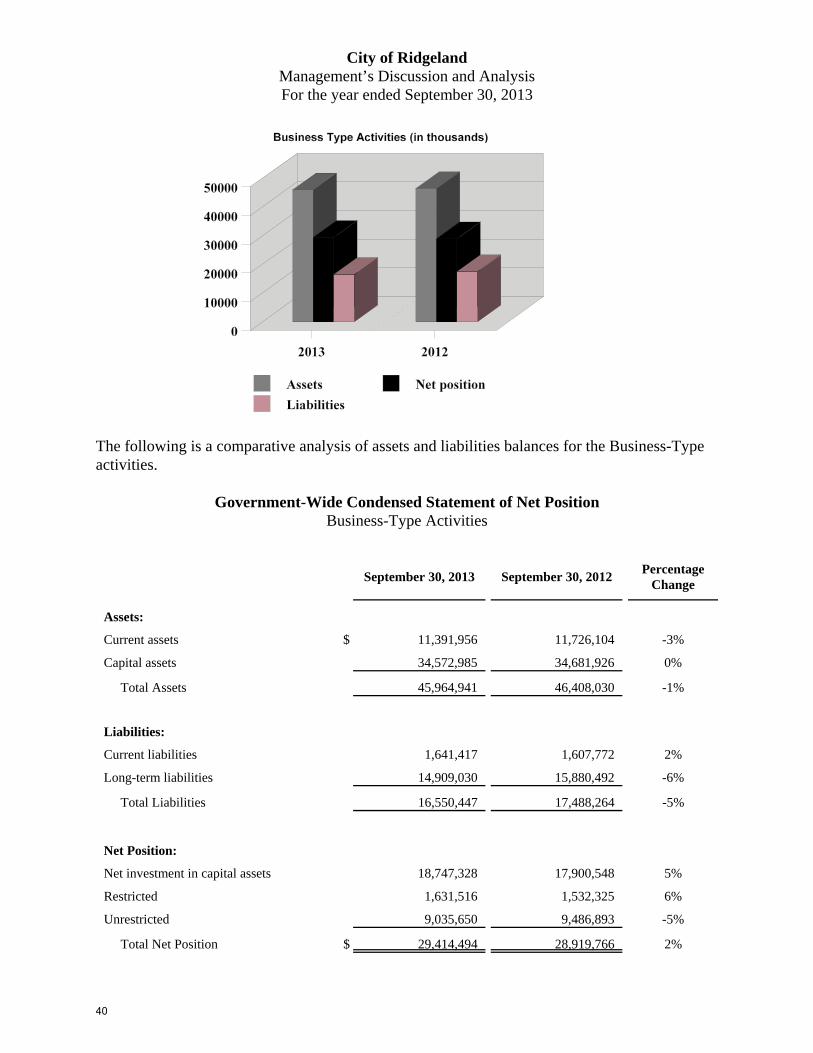
The following chart shows the assets, liabilities, and net position for the government widestatements, business-type activities.
39
City of RidgelandManagement’s Discussion and AnalysisFor the year ended September 30, 2013
The following is a comparative analysis of assets and liabilities balances for the Business-Typeactivities.
Government-Wide Condensed Statement of Net PositionBusiness-Type Activities
September 30, 2013 September 30, 2012Percentage
Change
Assets:
Current assets $ 11,391,956 11,726,104 -3%
Capital assets 34,572,985 34,681,926 0%
Total Assets 45,964,941 46,408,030 -1%
Liabilities:
Current liabilities 1,641,417 1,607,772 2%
Long-term liabilities 14,909,030 15,880,492 -6%
Total Liabilities 16,550,447 17,488,264 -5%
Net Position:
Net investment in capital assets 18,747,328 17,900,548 5%
Restricted 1,631,516 1,532,325 6%
Unrestricted 9,035,650 9,486,893 -5%
Total Net Position $ 29,414,494 28,919,766 2%
40
City of RidgelandManagement’s Discussion and AnalysisFor the year ended September 30, 2013
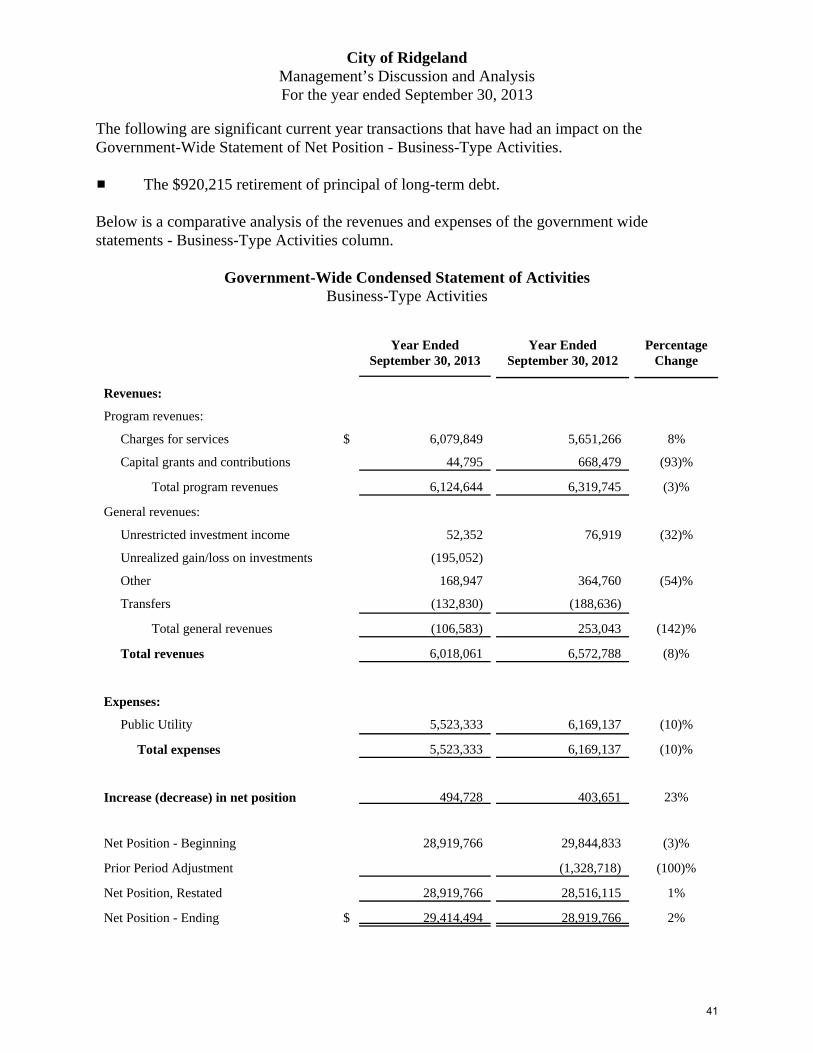
The following are significant current year transactions that have had an impact on theGovernment-Wide Statement of Net Position - Business-Type Activities.
# The $920,215 retirement of principal of long-term debt.
Below is a comparative analysis of the revenues and expenses of the government widestatements - Business-Type Activities column.
Government-Wide Condensed Statement of ActivitiesBusiness-Type Activities
Year EndedSeptember 30, 2013
Year EndedSeptember 30, 2012
PercentageChange
Revenues:
Program revenues:
Charges for services $ 6,079,849 5,651,266 8%
Capital grants and contributions 44,795 668,479 (93)%
Total program revenues 6,124,644 6,319,745 (3)%
General revenues:
Unrestricted investment income 52,352 76,919 (32)%
Unrealized gain/loss on investments (195,052)
Other 168,947 364,760 (54)%
Transfers (132,830) (188,636)
Total general revenues (106,583) 253,043 (142)%
Total revenues 6,018,061 6,572,788 (8)%
Expenses:
Public Utility 5,523,333 6,169,137 (10)%
Total expenses 5,523,333 6,169,137 (10)%
Increase (decrease) in net position 494,728 403,651 23%
Net Position - Beginning 28,919,766 29,844,833 (3)%
Prior Period Adjustment (1,328,718) (100)%
Net Position, Restated 28,919,766 28,516,115 1%
Net Position - Ending $ 29,414,494 28,919,766 2%
41

City of RidgelandManagement’s Discussion and AnalysisFor the year ended September 30, 2013
Public Utility Revenue Fund
The City operates its own water utility system, obtaining water from several ground water wells. Comparative financial data for the Public Utility Revenue Fund for the last two fiscal years ispresented below.
September 30, 2013 September 30, 2012
Operating Revenues $ 6,079,849 6,001,457
Operating Expenses (4,960,519) (5,218,942)
Operating Income $ 1,119,330 782,515
East Madison County Regional Sewer Fund
As previously stated this fund is used to account for monies collected from Ridgeland customers,Madison, and the Pearl River Valley Water Supply District for operation and maintenance of theregional sewer, and for payments to the City of Jackson for treatment of sewage at theirtreatment plant. The amount each entity contributes is based on flow which is metered at variouslocations.
Comparative financial data for the East Madison County Regional Sewer Fund for the last twoyears is presented as follows:
42

City of RidgelandManagement’s Discussion and AnalysisFor the year ended September 30, 2013
September 30, 2013 September 30, 2012
Operating Revenues $ 1,568,680 1,713,581
Operating Expenses (1,832,266) (1,798,259)
Operating Income $ (263,586) (84,678)
General Fund Budgeting Highlights
The City’s budget is prepared according to Mississippi’s law and is based on accounting forcertain transactions on a basis of cash receipts, disbursements, and encumbrances. The mostsignificant budgeted fund is the General Fund.
During the course of 2013, the City budgeted its general fund expenditures taking intoconsideration the need to repair additional streets and purchase additional capital equipment.
An analysis of the final budget to actual budget variances reveal consistent cost saving at eachdepartment level as detailed at Exhibit B-1. The City considered none of these budget variancessignificant.
The City of Ridgeland’s ending unencumbered cash balance in the general fund was$10,226,709.
CAPITAL ASSETS AND LONG-TERM DEBT OBLIGATIONS
Governmental Activities:Capital Assets
(Net of Depreciation)
September 30, 2013 September 30, 2012Percentage
Change
Land $ 110,685,995 110,640,181 0%
Construction in Progress 14,070,532 6,813,637 107%
Buildings 10,701,389 10,916,009 -2%
Improvements 6,433,637 6,314,060 2%
Infrastructure 57,436,579 59,519,761 -3%
Utility Systems (ISF) 1,647,778 1,745,566 -6%
Vehicles 2,072,909 2,090,746 -1%
Furniture and Equipment 946,894 987,861 -4%
Total $ 203,995,713 199,027,821 2%
43

City of RidgelandManagement’s Discussion and AnalysisFor the year ended September 30, 2013
The capital assets total include the $124,740,902 Land and Construction in Progress, the othercapital assets $77,591,408 and the amount of $15,625 in construction in progress for the InternalService Fund (ISF) and other capital assets in the amount of $1,647,778 for a total of$203,995,713 capital assets as reported in the Governmental Activities column of the Statementof Net Position.
Outstanding Notes and Long-Term Obligations at Year End
September 30, 2013 September 30, 2012Percentage
Change
General Obligation Bonds $ 18,416,031 21,348,562 -14%
Other Long-Term Debt 5,458,742 5,852,627 -7%
Compensated Absences 605,357 573,746 6%
Total $ 24,480,130 27,774,935 -12%
At September 30, 2013, the City of Ridgeland had $18,416,031 in outstanding GeneralObligation Bonds, and $6,064,099 in other Long-Term Debt. The City’s overall legal debtmargin at September 30, 2013 was $64,402,766.
Business-Type Activities:
Capital Assets(Net of Depreciation)
September 30, 2013 September 30, 2012Percentage
Change
Land $ 1,158,378 661,814 75%
Construction in Progress 9,386,236 15,453,450 -39%
Buildings 313,555 345,763 -9%
Utility Systems 23,384,783 17,801,025 31%
Vehicles 96,246 113,067 -15%
Machinery and equipment 233,787 306,807 -24%
Total $ 34,572,985 34,681,926 0%
For more detailed information concerning capital assets see Note 7 in the Notes to the FinancialStatements of this report.
44
City of RidgelandManagement’s Discussion and AnalysisFor the year ended September 30, 2013
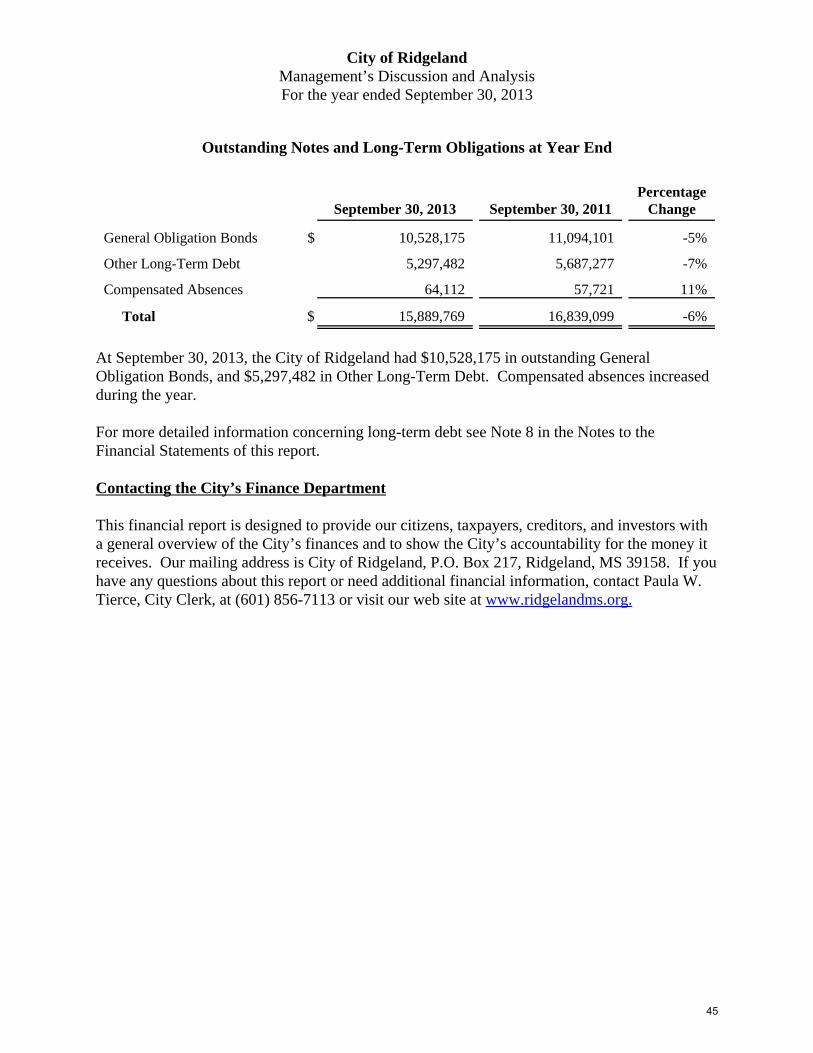
Outstanding Notes and Long-Term Obligations at Year End
September 30, 2013 September 30, 2011Percentage
Change
General Obligation Bonds $ 10,528,175 11,094,101 -5%
Other Long-Term Debt 5,297,482 5,687,277 -7%
Compensated Absences 64,112 57,721 11%
Total $ 15,889,769 16,839,099 -6%
At September 30, 2013, the City of Ridgeland had $10,528,175 in outstanding GeneralObligation Bonds, and $5,297,482 in Other Long-Term Debt. Compensated absences increasedduring the year.
For more detailed information concerning long-term debt see Note 8 in the Notes to theFinancial Statements of this report.
Contacting the City’s Finance Department
This financial report is designed to provide our citizens, taxpayers, creditors, and investors witha general overview of the City’s finances and to show the City’s accountability for the money itreceives. Our mailing address is City of Ridgeland, P.O. Box 217, Ridgeland, MS 39158. If youhave any questions about this report or need additional financial information, contact Paula W.Tierce, City Clerk, at (601) 856-7113 or visit our web site at www.ridgelandms.org.
45

FINANCIAL STATEMENTS
46
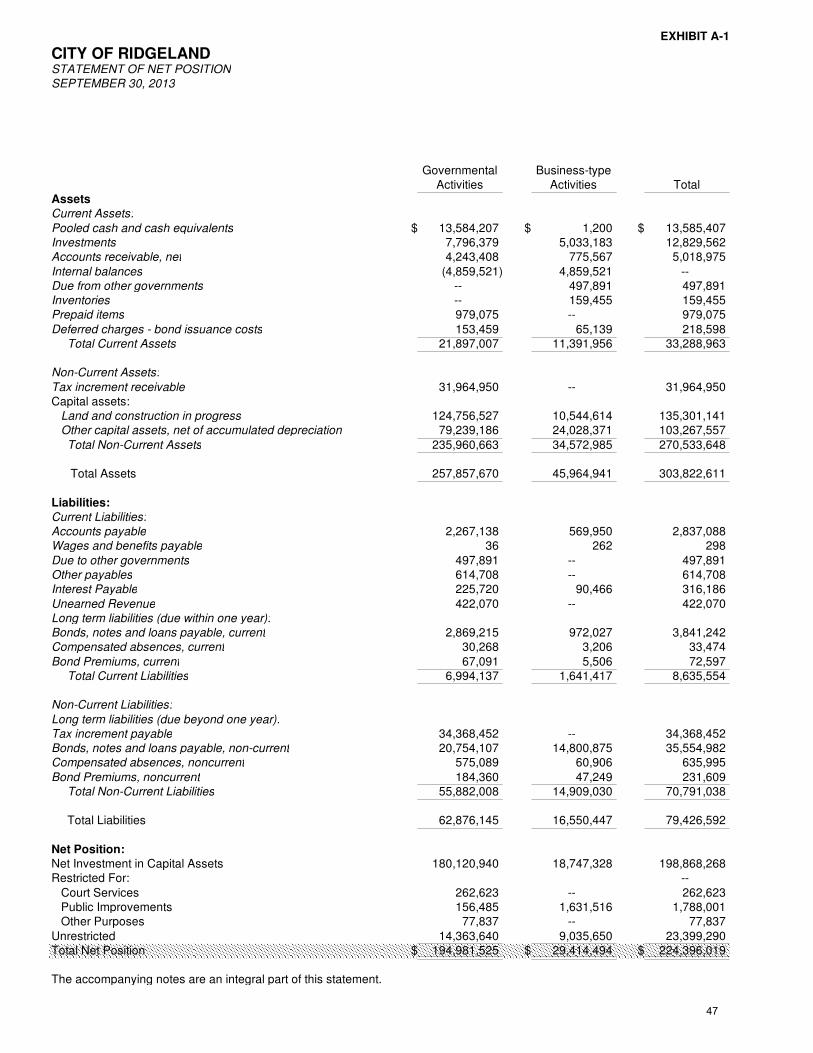
EXHIBIT A-1
CITY OF RIDGELANDSTATEMENT OF NET POSITION
SEPTEMBER 30, 2013
Governmental Business-typeActivities Activities Total
Assets
Current Assets:
Pooled cash and cash equivalents $ 13,584,207 $ 1,200 $ 13,585,407Investments 7,796,379 5,033,183 12,829,562Accounts receivable, net 4,243,408 775,567 5,018,975
Internal balances (4,859,521) 4,859,521 --Due from other governments -- 497,891 497,891Inventories -- 159,455 159,455Prepaid items 979,075 -- 979,075
Deferred charges - bond issuance costs 153,459 65,139 218,598 Total Current Assets 21,897,007 11,391,956 33,288,963
Non-Current Assets:
Tax increment receivable 31,964,950 -- 31,964,950Capital assets: Land and construction in progress 124,756,527 10,544,614 135,301,141 Other capital assets, net of accumulated depreciation 79,239,186 24,028,371 103,267,557
Total Non-Current Assets 235,960,663 34,572,985 270,533,648
Total Assets 257,857,670 45,964,941 303,822,611
Liabilities:
Current Liabilities:
Accounts payable 2,267,138 569,950 2,837,088Wages and benefits payable 36 262 298
Due to other governments 497,891 -- 497,891Other payables 614,708 -- 614,708Interest Payable 225,720 90,466 316,186
Unearned Revenue 422,070 -- 422,070Long term liabilities (due within one year):
Bonds, notes and loans payable, current 2,869,215 972,027 3,841,242Compensated absences, current 30,268 3,206 33,474
Bond Premiums, current 67,091 5,506 72,597 Total Current Liabilities 6,994,137 1,641,417 8,635,554
Non-Current Liabilities:
Long term liabilities (due beyond one year):
Tax increment payable 34,368,452 -- 34,368,452Bonds, notes and loans payable, non-current 20,754,107 14,800,875 35,554,982Compensated absences, noncurrent 575,089 60,906 635,995
Bond Premiums, noncurrent 184,360 47,249 231,609 Total Non-Current Liabilities 55,882,008 14,909,030 70,791,038
Total Liabilities 62,876,145 16,550,447 79,426,592
Net Position:
Net Investment in Capital Assets 180,120,940 18,747,328 198,868,268Restricted For: --
Court Services 262,623 -- 262,623 Public Improvements 156,485 1,631,516 1,788,001 Other Purposes 77,837 -- 77,837
Unrestricted 14,363,640 9,035,650 23,399,290Total Net Position $ 194,981,525 $ 29,414,494 $ 224,396,019
The accompanying notes are an integral part of this statement.
47
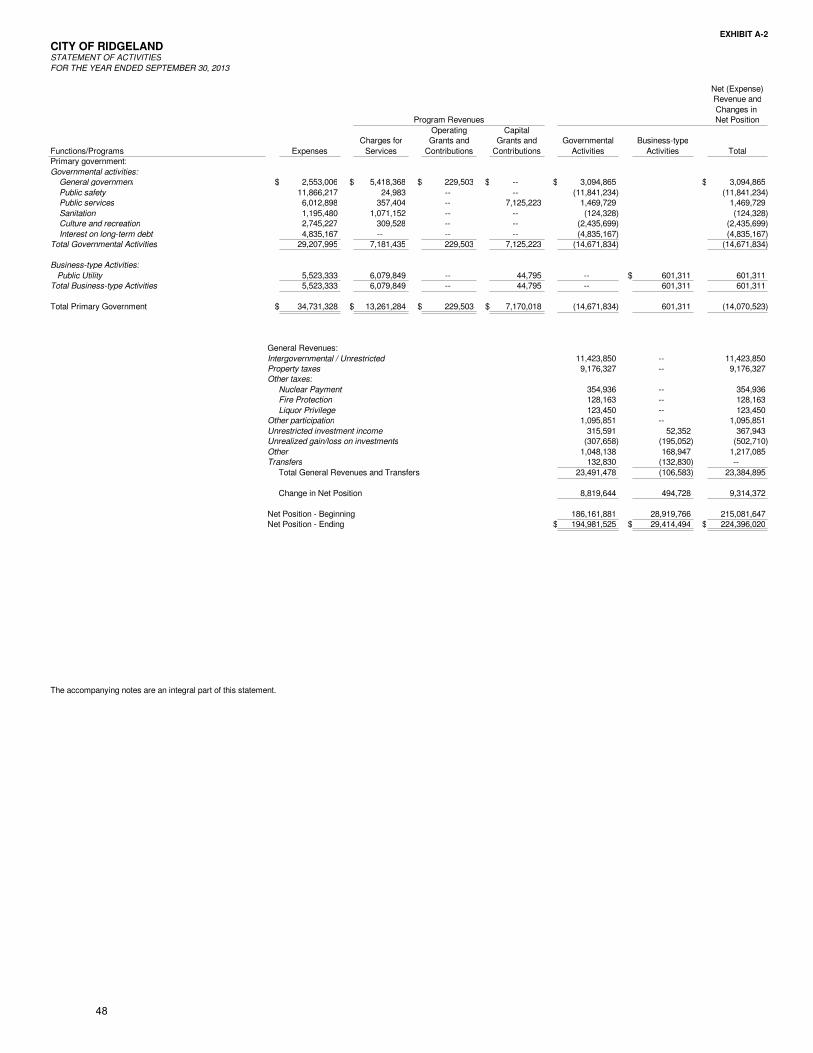
EXHIBIT A-2
CITY OF RIDGELANDSTATEMENT OF ACTIVITIES
FOR THE YEAR ENDED SEPTEMBER 30, 2013
Net (Expense)Revenue and
Changes in Program Revenues Net Position
Operating CapitalCharges for Grants and Grants and Governmental Business-type
Functions/Programs Expenses Services Contributions Contributions Activities Activities TotalPrimary government:
Governmental activities:
General government $ 2,553,006 $ 5,418,368 $ 229,503 $ -- $ 3,094,865 $ 3,094,865
Public safety 11,866,217 24,983 -- -- (11,841,234) (11,841,234) Public services 6,012,898 357,404 -- 7,125,223 1,469,729 1,469,729
Sanitation 1,195,480 1,071,152 -- -- (124,328) (124,328) Culture and recreation 2,745,227 309,528 -- -- (2,435,699) (2,435,699)
Interest on long-term debt 4,835,167 -- -- -- (4,835,167) (4,835,167)Total Governmental Activities 29,207,995 7,181,435 229,503 7,125,223 (14,671,834) (14,671,834)
Business-type Activities:
Public Utility 5,523,333 6,079,849 -- 44,795 -- $ 601,311 601,311Total Business-type Activities 5,523,333 6,079,849 -- 44,795 -- 601,311 601,311
Total Primary Government $ 34,731,328 $ 13,261,284 $ 229,503 $ 7,170,018 (14,671,834) 601,311 (14,070,523)
General Revenues:
Intergovernmental / Unrestricted 11,423,850 -- 11,423,850Property taxes 9,176,327 -- 9,176,327Other taxes:
Nuclear Payment 354,936 -- 354,936 Fire Protection 128,163 -- 128,163
Liquor Privilege 123,450 -- 123,450Other participation 1,095,851 -- 1,095,851
Unrestricted investment income 315,591 52,352 367,943Unrealized gain/loss on investments (307,658) (195,052) (502,710)
Other 1,048,138 168,947 1,217,085Transfers 132,830 (132,830) --
Total General Revenues and Transfers 23,491,478 (106,583) 23,384,895
Change in Net Position 8,819,644 494,728 9,314,372
Net Position - Beginning 186,161,881 28,919,766 215,081,647Net Position - Ending $ 194,981,525 $ 29,414,494 $ 224,396,020
The accompanying notes are an integral part of this statement.
48
This page is intentionally left blank.
49
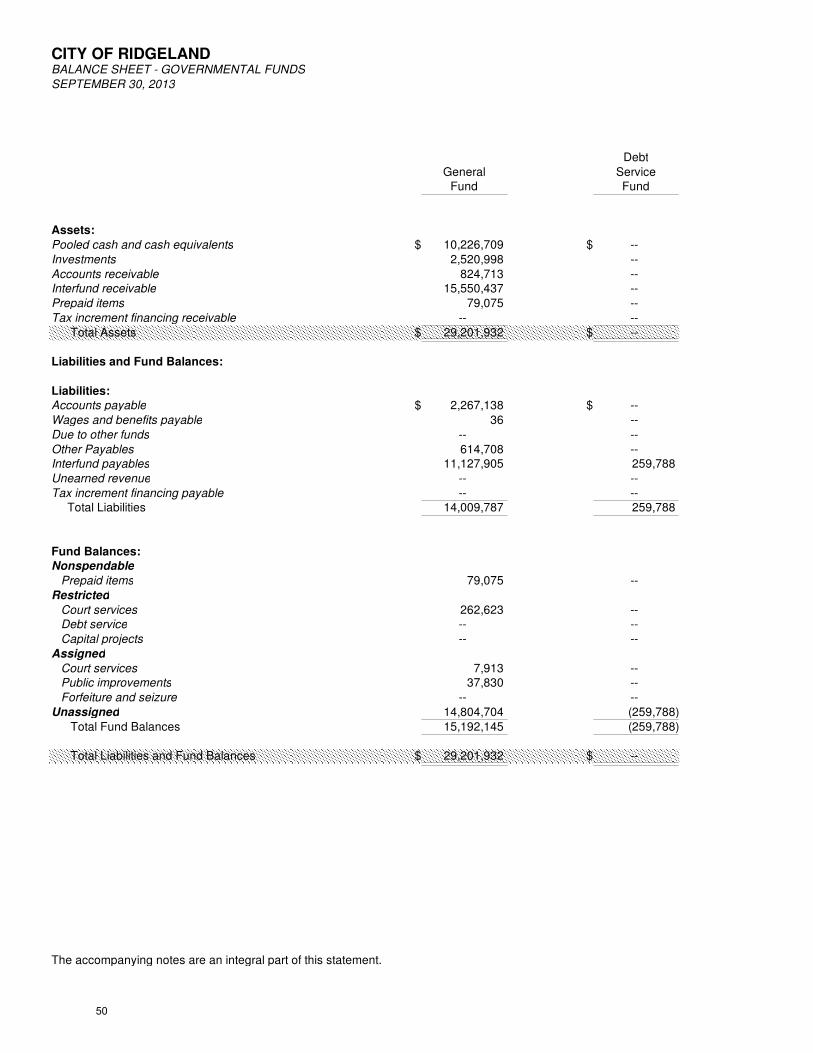
CITY OF RIDGELANDBALANCE SHEET - GOVERNMENTAL FUNDS
SEPTEMBER 30, 2013
Debt
General ServiceFund Fund
Assets:
Pooled cash and cash equivalents $ 10,226,709 $ --
Investments 2,520,998 --
Accounts receivable 824,713 --Interfund receivable 15,550,437 --
Prepaid items 79,075 --
Tax increment financing receivable -- --
Total Assets $ 29,201,932 $ --
Liabilities and Fund Balances:
Liabilities:
Accounts payable $ 2,267,138 $ --
Wages and benefits payable 36 --
Due to other funds -- --
Other Payables 614,708 --Interfund payables 11,127,905 259,788
Unearned revenue -- --
Tax increment financing payable -- -- Total Liabilities 14,009,787 259,788
Fund Balances:
Nonspendable
Prepaid items 79,075 --
Restricted
Court services 262,623 -- Debt service -- --
Capital projects -- --
Assigned
Court services 7,913 -- Public improvements 37,830 --
Forfeiture and seizure -- --
Unassigned 14,804,704 (259,788)
Total Fund Balances 15,192,145 (259,788)
Total Liabilities and Fund Balances $ 29,201,932 $ --
The accompanying notes are an integral part of this statement.
50

EXHIBIT A-3
Colony Lake Harbour Other Total
Park TIF Recon 51 to Governmental GovernmentalBond Debt Northpark Drive Funds Funds
$ 2,862,466 $ -- $ 77,837 $ 13,167,012
-- -- 5,275,381 7,796,379
-- 3,325,070 93,625 4,243,408-- -- 6,899,233 22,449,670
900,000 -- -- 979,075
28,902,718 -- 3,062,232 31,964,950
$ 32,665,184 $ 3,325,070 $ 15,408,308 $ 80,600,494
$ -- $ -- $ -- $ 2,267,138
-- -- -- 36
-- -- 497,891 497,891
-- -- -- 614,708890,184 9,128,500 6,179,420 27,585,797
-- -- 422,070 422,070
31,775,000 -- 2,593,452 34,368,45232,665,184 9,128,500 9,692,833 65,756,092
900,000 -- -- 979,075
-- -- 262,623-- -- 478 478
-- -- 5,637,160 5,637,160
-- -- -- 7,913-- -- -- 37,830
-- -- 77,837 77,837
(900,000) (5,803,430) -- 7,841,486
-- (5,803,430) 5,715,475 14,844,402
$ 32,665,184 $ 3,325,070 $ 15,408,308 $ 80,600,494
51

EXHIBIT A-4
CITY OF RIDGELANDRECONCILIATION OF THE GOVERNMENTAL FUNDS BALANCE SHEET
TO THE STATEMENT OF NET POSITION
SEPTEMBER 30, 2013
Total fund balances for governmental funds $ 14,844,402
Amounts reported for governmental activities in the Statement of Net Position
are different because:
Capital assets used in governmental activities are not reported in the funds. 202,332,310
The assets and liabilities of internal service funds are included in governmental activities in the SNP. 2,357,204
Payables for bond principal which are not due in the current period are not reported in the funds. (15,695,000)
Payables for bond interest which are not due in the current period are not reported in the funds. (225,720)Payables for compensated absences not due in the current period are not reported in the funds. (575,089)
Liabilities due in one year are not recognized in the funds. (2,966,574)
Other long-term liabilities not due and payable in the current period are not reported in the funds. (5,059,107)
Bond issuance costs are recognized in the SNP. 153,459Bond premiums are recognized in the SNP. (184,360)
Net position of governmental activities $ 194,981,525
The accompanying notes are an integral part of this statement.
52

This page is intentionally left blank.
53

CITY OF RIDGELANDSTATEMENT OF REVENUES, EXPENDITURES, AND CHANGES
IN FUND BALANCES - GOVERNMENTAL FUNDS
FOR THE YEAR ENDED SEPTEMBER 30, 2013
Debt
General ServiceFund Fund
Revenues:
Sales taxes $ 11,345,913 $ -- Property taxes 5,001,124 3,367,866
Licenses and permits 1,488,448 --
Fines and forfeitures 1,698,278 --
Investment income 241,660 6,565 Unrealized gain/loss on investments (96,589) --
Charges for services 1,968,004 --
Special Assessments -- --
Intergovernmental programs 931,505 14,764 Other 74,067 --
Total Revenues 22,652,410 3,389,195
Expenditures:
General government 2,500,087 --
Public safety 11,081,093 --
Public Services 3,713,614 --
Sanitation 1,195,480 -- Health and welfare 31,160 --
Culture and recreation 2,183,887 --
Economic development and assistance 50,000 -- Capital outlay 17,478 --
Debt service:
Principal 69,580 3,153,885
Interest 2,761 763,555 Other -- 7,164
Total Expenditures 20,845,140 3,924,604
Excess (Deficiency) of Revenues Over (Under) Expenditures 1,807,270 (535,409)
Other Financing Sources (Uses):
Transfers in 41 199
Transfers out (17,170) -- Sale of assets 33,194 --
Total Other Financing Sources (Uses) 16,065 199
Net Change in Fund Balances 1,823,335 (535,210)
Fund Balances - Beginning 13,368,810 275,422Fund Balances - Ending $ 15,192,145 $ (259,788)
The accompanying notes are an integral part of this statement.
54

EXHIBIT A-5
Colony Lake Harbour Other Total
Park TIF Recon 51 to Governmental GovernmentalBond Debt Northpark Drive Funds Funds
$ 49,525 $ -- $ 28,412 $ 11,423,850653,261 -- 65,576 9,087,827
-- -- -- 1,488,448
-- -- -- 1,698,278
1,219 -- 66,147 315,591-- -- (211,068) (307,657)
-- -- -- 1,968,004
-- -- 42,621 42,621
929,832 6,500,150 814,774 9,191,025-- -- -- 74,067
1,633,837 6,500,150 806,462 34,982,054
-- -- -- 2,500,087
-- -- 57,711 11,138,804
-- -- -- 3,713,614
-- -- -- 1,195,480-- -- -- 31,160
-- -- -- 2,183,887
-- -- -- 50,000-- 6,646,532 1,182,384 7,846,394
--
-- -- 35,000 3,258,465
1,631,081 -- 208,224 2,605,6212,756 -- 2,750 12,670
1,633,837 6,646,532 1,486,069 34,536,182
-- (146,382) (679,607) 445,872
-- -- 409,264 409,504
-- -- (409,504) (426,674)-- -- -- 33,194
-- -- (240) 16,024
-- (146,382) (679,847) 461,896
-- (5,657,048) 6,395,322 14,382,506$ -- $ (5,803,430) $ 5,715,475 $ 14,844,402
55

EXHIBIT A-6
CITY OF RIDGELANDRECONCILIATION OF THE STATEMENT OF REVENUES, EXPENDITURES,
AND CHANGES IN FUND BALANCES OF GOVERNMENTAL FUNDS
TO THE STATEMENT OF ACTIVITIES
FOR THE YEAR ENDED SEPTEMBER 30, 2013
Net change in fund balances - total governmental funds $ 461,896
Amounts reported for governmental activities in the Statement of Activities
("SOA") are different because:
Capital outlays are not reported as expenses in the SOA. 8,627,059
The depreciation of capital assets used in governmental activities is not reported in the funds. (3,514,396)
The gain or loss on the sale of capital assets is not reported in the funds. (13,789)All proceeds from the sale of capital assets are reported in the funds but not in the SOA. (33,194)
Repayment of bond principal is an expenditure in the funds but is not an expense in the SOA. 2,864,580
Repayment of loan principal is an expenditure in the funds but is not an expense in the SOA. 393,885
(Increase) decrease in accrued interest from beginning of period to end of period. 290,878Compensated absences are reported as amount earned in SOA but as amount paid in the funds. (31,611)
Bond premiums are amortized in the SOA. 67,951
Amortization of bond issuance costs. (32,050)
The net income (loss) from internal service funds is accounted for with governmental activities. (261,565)
Change in net position of governmental activities $ 8,819,644
The accompanying notes are an integral part of this statement.
56

EXHIBIT A-7
CITY OF RIDGELANDSTATEMENT OF NET POSITION
PROPRIETARY FUNDS
SEPTEMBER 30, 2013
EnterpriseFundPublic Internal
Utility ServiceFund Funds
Assets
Current Assets:
Cash and cash equivalents $ 1,200 $ 417,194Investments 5,033,183 --Receivables (net of allowances for uncollectibles) 775,567 --
Interfund Receivables 6,086,881 276,652Due from other funds 497,891 --Inventories 159,455 --Deferred charges - bond issuance costs 65,139 --
Total Current Assets 12,619,316 693,846
Non-current Assets:Land and construction in progress 10,544,614 15,625
Capital assets (net of accumulated depreciation) 24,028,371 1,647,778 Total Non-current Assets 34,572,985 1,663,403
Total Assets 47,192,301 2,357,249
Liabilities
Current Liabilities:Deposits payable $ 569,950 $ --
Other payable 261 --Interfund payables 1,227,361 45Interest Payable 90,466 --Bonds, notes and loans payable - current 972,027 --
Compensated absences - current 3,206 --Bond Premiums - current 5,506 -- Total Current Liabilities 2,868,777 45
Non-current Liabilities:Bonds, notes and loans payable - non-current 14,800,875 --Compensated absences - non-current 60,906 --
Bond Premiums - non-current 47,249 -- Total Non-Currrent Liabilities 14,909,030 --
Total Liabilities 17,777,807 45
Net Position
Net investment in capital assets 18,747,328 1,663,403Restricted for Public Improvements 1,631,516 --
Unrestricted 9,035,650 693,801 Total Net Position $ 29,414,494 $ 2,357,204
The accompanying notes are an integral part of this statement.
57
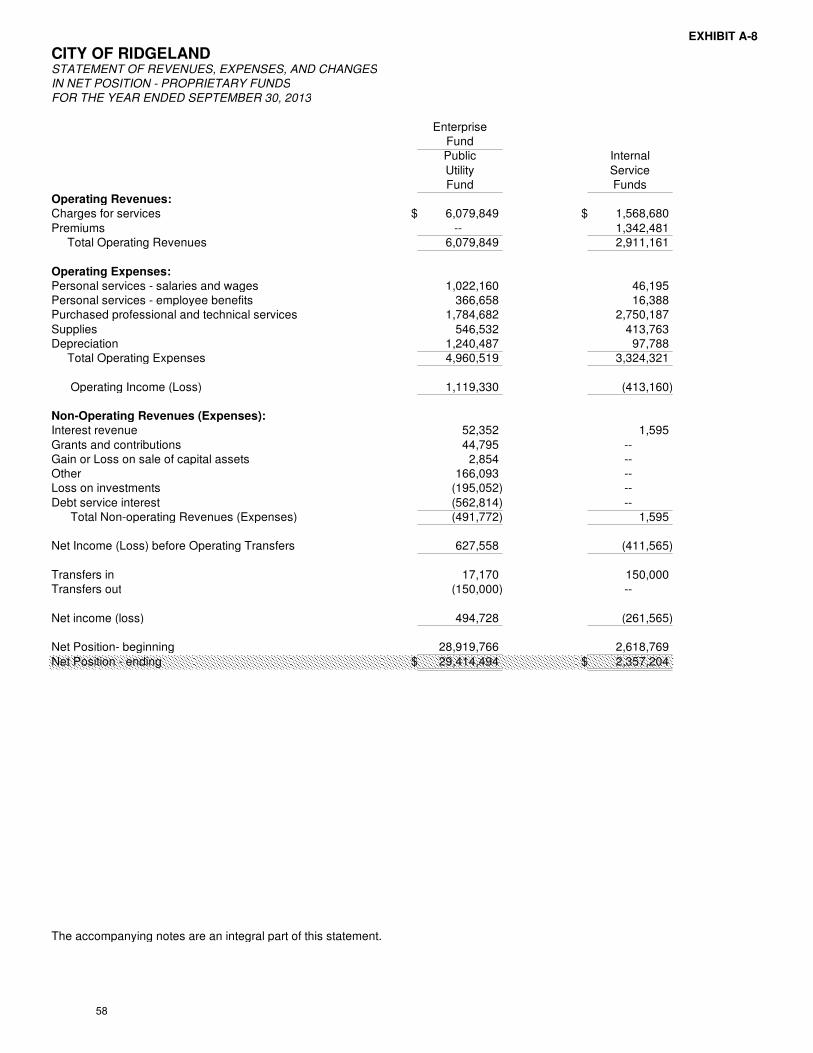
EXHIBIT A-8
CITY OF RIDGELANDSTATEMENT OF REVENUES, EXPENSES, AND CHANGES
IN NET POSITION - PROPRIETARY FUNDS
FOR THE YEAR ENDED SEPTEMBER 30, 2013
EnterpriseFundPublic Internal
Utility ServiceFund Funds
Operating Revenues:
Charges for services $ 6,079,849 $ 1,568,680
Premiums -- 1,342,481 Total Operating Revenues 6,079,849 2,911,161
Operating Expenses:
Personal services - salaries and wages 1,022,160 46,195Personal services - employee benefits 366,658 16,388Purchased professional and technical services 1,784,682 2,750,187
Supplies 546,532 413,763Depreciation 1,240,487 97,788 Total Operating Expenses 4,960,519 3,324,321
Operating Income (Loss) 1,119,330 (413,160)
Non-Operating Revenues (Expenses):
Interest revenue 52,352 1,595
Grants and contributions 44,795 --Gain or Loss on sale of capital assets 2,854 --Other 166,093 --Loss on investments (195,052) --
Debt service interest (562,814) -- Total Non-operating Revenues (Expenses) (491,772) 1,595
Net Income (Loss) before Operating Transfers 627,558 (411,565)
Transfers in 17,170 150,000Transfers out (150,000) --
Net income (loss) 494,728 (261,565)
Net Position- beginning 28,919,766 2,618,769
Net Position - ending $ 29,414,494 $ 2,357,204
The accompanying notes are an integral part of this statement.
58
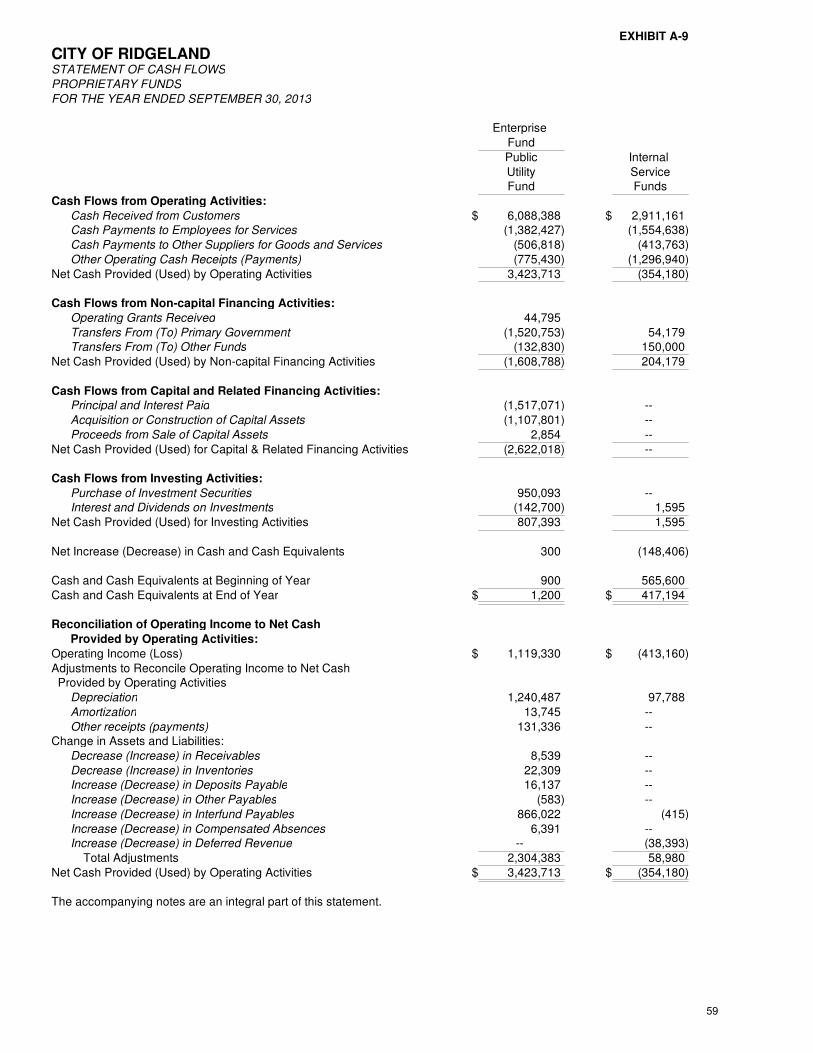
EXHIBIT A-9
CITY OF RIDGELANDSTATEMENT OF CASH FLOWS
PROPRIETARY FUNDS
FOR THE YEAR ENDED SEPTEMBER 30, 2013
Enterprise
Fund
Public Internal
Utility ServiceFund Funds
Cash Flows from Operating Activities:
Cash Received from Customers $ 6,088,388 $ 2,911,161Cash Payments to Employees for Services (1,382,427) (1,554,638)
Cash Payments to Other Suppliers for Goods and Services (506,818) (413,763)
Other Operating Cash Receipts (Payments) (775,430) (1,296,940)
Net Cash Provided (Used) by Operating Activities 3,423,713 (354,180)
Cash Flows from Non-capital Financing Activities:
Operating Grants Received 44,795
Transfers From (To) Primary Government (1,520,753) 54,179Transfers From (To) Other Funds (132,830) 150,000
Net Cash Provided (Used) by Non-capital Financing Activities (1,608,788) 204,179
Cash Flows from Capital and Related Financing Activities:
Principal and Interest Paid (1,517,071) --
Acquisition or Construction of Capital Assets (1,107,801) --
Proceeds from Sale of Capital Assets 2,854 --
Net Cash Provided (Used) for Capital & Related Financing Activities (2,622,018) --
Cash Flows from Investing Activities:
Purchase of Investment Securities 950,093 --Interest and Dividends on Investments (142,700) 1,595
Net Cash Provided (Used) for Investing Activities 807,393 1,595
Net Increase (Decrease) in Cash and Cash Equivalents 300 (148,406)
Cash and Cash Equivalents at Beginning of Year 900 565,600
Cash and Cash Equivalents at End of Year $ 1,200 $ 417,194
Reconciliation of Operating Income to Net Cash
Provided by Operating Activities:
Operating Income (Loss) $ 1,119,330 $ (413,160)
Adjustments to Reconcile Operating Income to Net Cash Provided by Operating Activities
Depreciation 1,240,487 97,788
Amortization 13,745 --
Other receipts (payments) 131,336 --Change in Assets and Liabilities:
Decrease (Increase) in Receivables 8,539 --
Decrease (Increase) in Inventories 22,309 --Increase (Decrease) in Deposits Payable 16,137 --
Increase (Decrease) in Other Payables (583) --
Increase (Decrease) in Interfund Payables 866,022 (415)
Increase (Decrease) in Compensated Absences 6,391 --Increase (Decrease) in Deferred Revenue -- (38,393)
Total Adjustments 2,304,383 58,980
Net Cash Provided (Used) by Operating Activities $ 3,423,713 $ (354,180)
The accompanying notes are an integral part of this statement.
59

This page is intentionally left blank.
60
City of Ridgeland, Mississippi
Notes to the Financial StatementsFor the Year Ended September 30, 2013
61
CITY OF RIDGELAND, MISSISSIPPI
Notes to the Financial StatementsFor the Year Ended September 30, 2013
INDEX
NOTE #I. Summary of Significant Accounting Policies. . . . . . . . . . . . . . . . . . . . . . . . . . . . . . . . . . . . . 63
Introduction . . . . . . . . . . . . . . . . . . . . . . . . . . . . . . . . . . . . . . . . . . . . . . . . . . . . . . . . . . . . . 63A. Financial Reporting Entity. . . . . . . . . . . . . . . . . . . . . . . . . . . . . . . . . . . . . . . . . . . . . 64B. Government-Wide and Fund Financial Statements. . . . . . . . . . . . . . . . . . . . . . . . . . 65C. Basis of Presentation. . . . . . . . . . . . . . . . . . . . . . . . . . . . . . . . . . . . . . . . . . . . . . . . . . 66D. Basis of Accounting. . . . . . . . . . . . . . . . . . . . . . . . . . . . . . . . . . . . . . . . . . . . . . . . . . 67E. Encumbrances . . . . . . . . . . . . . . . . . . . . . . . . . . . . . . . . . . . . . . . . . . . . . . . . . . . . . . 68F. Budgets and Budgetary Information. . . . . . . . . . . . . . . . . . . . . . . . . . . . . . . . . . . . . . 68G. Unearned Revenue . . . . . . . . . . . . . . . . . . . . . . . . . . . . . . . . . . . . . . . . . . . . . . . . . . . 69H. Fund Balances . . . . . . . . . . . . . . . . . . . . . . . . . . . . . . . . . . . . . . . . . . . . . . . . . . . . . . 69I. Cash and Other Deposits and Cash Equivalents . . . . . . . . . . . . . . . . . . . . . . . . . . . . 70J. Investments . . . . . . . . . . . . . . . . . . . . . . . . . . . . . . . . . . . . . . . . . . . . . . . . . . . . . . . . 70K. Inventories . . . . . . . . . . . . . . . . . . . . . . . . . . . . . . . . . . . . . . . . . . . . . . . . . . . . . . . . . 71L. Account Receivable . . . . . . . . . . . . . . . . . . . . . . . . . . . . . . . . . . . . . . . . . . . . . . . . . . 71M. Interfund Transactions and Balances . . . . . . . . . . . . . . . . . . . . . . . . . . . . . . . . . . . . . 71N. Restricted Net Position . . . . . . . . . . . . . . . . . . . . . . . . . . . . . . . . . . . . . . . . . . . . . . . 73O. Capital Assets and Long-term Liabilities . . . . . . . . . . . . . . . . . . . . . . . . . . . . . . . . . 74P. Compensated Absences . . . . . . . . . . . . . . . . . . . . . . . . . . . . . . . . . . . . . . . . . . . . . . . 75
2. Cash, Other Deposits and Investments. . . . . . . . . . . . . . . . . . . . . . . . . . . . . . . . . . . . . . . . 753. Receivables. . . . . . . . . . . . . . . . . . . . . . . . . . . . . . . . . . . . . . . . . . . . . . . . . . . . . . . . . . . . . 784. Property Taxes. . . . . . . . . . . . . . . . . . . . . . . . . . . . . . . . . . . . . . . . . . . . . . . . . . . . . . . . . . . 785. Capital Assets. . . . . . . . . . . . . . . . . . . . . . . . . . . . . . . . . . . . . . . . . . . . . . . . . . . . . . . . . . . 796. Long-term Debt Obligations. . . . . . . . . . . . . . . . . . . . . . . . . . . . . . . . . . . . . . . . . . . . . . . . 817. Business-Type Activities - Capital Assets. . . . . . . . . . . . . . . . . . . . . . . . . . . . . . . . . . . . . . 868. Business-Type Activities - Long-term Debt. . . . . . . . . . . . . . . . . . . . . . . . . . . . . . . . . . . . 879. Defined Benefit Pension Plan. . . . . . . . . . . . . . . . . . . . . . . . . . . . . . . . . . . . . . . . . . . . . . . 9210. Deficit Fund Balances of Individual Funds. . . . . . . . . . . . . . . . . . . . . . . . . . . . . . . . . . . . . 9211. Risk Management. . . . . . . . . . . . . . . . . . . . . . . . . . . . . . . . . . . . . . . . . . . . . . . . . . . . . . . . 9312. Health Insurance. . . . . . . . . . . . . . . . . . . . . . . . . . . . . . . . . . . . . . . . . . . . . . . . . . . . . . . . . 9313. Subsequent Events . . . . . . . . . . . . . . . . . . . . . . . . . . . . . . . . . . . . . . . . . . . . . . . . . . . . . . . 94
62
City of Ridgeland, MississippiNotes to the Financial StatementsFor the Year Ended September 30, 2013
1. SUMMARY OF SIGNIFICANT ACCOUNTING POLICIES
INTRODUCTION
The accounting and reporting framework and the more significant accounting principles andpractices of Ridgeland are discussed in subsequent sections of this Note. The remainder of theNotes are organized to provide explanations, including required disclosures, of the City’sfinancial activities for the fiscal year ended September 30, 2013.
The accompanying financial statements of the City have been prepared in accordance withaccounting principles (GAAP) generally accepted in the United States of America as applied togovernmental units. The Governmental Accounting Standards Board (GASB)is the standard-setting body for governmental accounting and financial reporting.
In December 2010, the GASB issued Statement No. 62, Codification of Accounting andFinancial Reporting Guidance Contained in Pre-November 30, 1989 FASB and AICPAPronouncements. Statement No. 62 brings the authoritative accounting and financial reportingliterature for state and local governments together in a single source, with the FASB and AICPAguidance modified as necessary to appropriately recognize the governmental environment andthe needs of governmental financial statements users. The requirements of this Statement areeffective for financial statements for periods beginning after December 15, 2011.
In June 2011 and March 2012, the GASB issued Statement No. 63, Financial Reporting forDeferred Outflows of Resources, Deferred Inflows and Net Position and Statement No. 65, ItemsPreviously Reported as Assets and Liabilities, respectively. Statement No. 63 will improvefinancial reporting by standardizing the presentation of deferred outflows/inflows of resourcesand their effects in the government’s net position. It provides guidance in reporting theseelements where none previously existed. Statement No. 65 will improve financial reporting byclarifying the appropriate use of financial statement elements to ensure consistency in financialreporting. These related Statements reflect substantial improvements to the financial reporting. Statement No. 63 is effective for periods beginning after December 15, 2011 and Statement No.65 is effective for periods beginning after December 15, 2012.
In June 2012, the GASB issued Statement No. 67, Financial Reporting for Pension Plans andStatement No. 68, Accounting and Financial Reporting for Pensions. Statement No. 67addresses financial reporting for state and local government pension plans and Statement No. 68establishes new accounting and financial reporting requirements for governments that providetheir employees with pensions. These related Statements reflect substantial improvements to theaccounting and financial reporting of pensions plans. Statement No. 67 will take effect forpension plans in the fiscal year ending September 30, 2014 and Statement No. 68 will take effectfor employers and governmental non-employer contributing entities in the fiscal year endingSeptember 30, 2015.
The guidance contained in these Statements will change how governments calculate and reportthe costs and obligations associated with pensions in important ways. It is designed to improve
63
City of Ridgeland, MississippiNotes to the Financial StatementsFor the Year Ended September 30, 2013
the decision-usefulness of reported pension information and to increase the transparency,consistency, and comparability of pension information across governments.
The new standards will better align the recognition of pension expense with the period in whichthe related benefits are earned. Considered in total, the changes set forth by the GASB will havethe overall effect of expense recognition being accelerated. The implementation of theseStatements is expected to have a significant impact upon the financial statements of the City.
Management’s Discussion and Analysis - GASB Statement No. 34 requires that financialstatements be accompanied by a narrative introduction and analytical overview of the govern-ment’s financial activities in the form of management’s discussion and analysis (MD&A). Thisanalysis is similar to analysis the private sector provides in their annual reports.
Government-wide Financial Statements - The reporting model includes financial statementsprepared using full accrual for all of the government’s activities. This approach includes not justcurrent assets and liabilities (such as cash and accounts payable) but also capital assets and long-term liabilities (such as buildings and infrastructure, including bridges and roads, and generalobligation debt). Accrual accounting also reports all of the revenues and cost of providingservices each year, not just those received or paid in the current year or soon after.
Statement of Net Position - The Statement of Net Position is designed to display the financialposition of the primary government and its directly presented component units. Governmentswill report all capital assets, including infrastructure, in the government-wide Statement of NetPosition and will report depreciation expense - the cost of “using up” capital assets - in theStatement of Activities. The net position of a government will be broken down into threecategories - 1) net investment in capital assets; 2) restricted; and 3) unrestricted.
Statement of Activities - The government-wide statement of activities reports expenses andrevenues in a format that focuses on the cost of each of the government’s functions. Theexpenses of individual functions are compared to the revenues generated by the function (forinstance, through user charges or intergovernment grants).
Budgetary Comparison Schedules - Many governments revise their original budgets over thecourse of the year for a variety of reasons. Budgetary comparison information is required,therefore the government’s original budget is compared to the final budget and actual results.
A. FINANCIAL REPORTING ENTITY
COMPONENT UNITS
As required by accounting principles generally accepted in the United States of America, thefinancial statements of the reporting entity include those of the City of Ridgeland (the primarygovernment) and any component units thereof. Component units must either be (1) a legallyseparate organization for which the elected officials of the primary government are financiallyaccountable or (2) another organization for which the nature and significance of its relationship
64
City of Ridgeland, MississippiNotes to the Financial StatementsFor the Year Ended September 30, 2013
with the primary government is such that exclusion would cause the City of Ridgeland’sfinancial statements to be misleading or incomplete. Based upon the application of these criteria,no potential component unit will be included as a part of the City.
RELATED ORGANIZATIONS
Related organizations are excluded from the financial reporting entity because the City’saccountability does not extend beyond making appointments. Audited financial statements areavailable from the respective organizations. Related organizations are described as follows:
Related Organizations Brief Description of Activities and Relationship to the City
Ridgeland Tourism Commission Promote tourism for the city of Ridgeland. Mainly repre-sents restaurants and hotels. All members are appointed bythe Aldermen. The Commission reports independently.
B. GOVERNMENT-WIDE AND FUND FINANCIAL STATEMENTS
The basic financial statements include both government-wide (based on the City as a whole) andfund financial statements. Both the government-wide and fund financial statements (within thebasic financial statements) categorize primary activities as governmental type. In theGovernment-wide Statement of Net Position, the governmental activities column is presented ona full accrual, economic resource basis, which incorporates long-term assets and receivables aswell as long-term debt and obligations.
The government-wide Statement of Activities reflects both the gross and net costs per functionalcategory (Police, Fire, Public Works, etc.), which are otherwise being supported by generalgovernment revenues (property, sales and use taxes, certain intergovernmental revenues, etc.). The Statement of Activities reduces gross expenses (including depreciation) by related programrevenues, operating and capital grants. The program revenues must be directly associated withthe function (Police, Fire, Public Works, etc.). These include changes for some of the servicesthe city provides like permits, licenses, inspection fees and that are associated with the particularfunction. The program revenues also include grants received from federal as well as statesources to be used for operating or capital purposes. The City does not allocate indirectexpenses. The operating grants include operating-specific and discretionary (either operating orcapital) grants while the capital grants column reflects capital-specific grants. The net cost (byfunction) is normally covered by general revenue (property, sales or gas taxes, intergovernmentalrevenues, interest income, etc.).
This government-wide focus is more on the sustainability of the City as an entity and the changein aggregate financial position resulting from the activities of the fiscal period. The fundfinancial statements emphasize the major funds. Non-major funds (by category) are summarizedinto a single column.
65

City of Ridgeland, MississippiNotes to the Financial StatementsFor the Year Ended September 30, 2013
The governmental funds major fund statements in the fund financial statements are presented ona current financial resource and modified accrual basis of accounting. This is the manner inwhich the funds are normally budgeted. This presentation is deemed most appropriate to (a)demonstrate legal and covenant compliance, (b) demonstrate the source and use of liquidresources, and (c) demonstrate how the City’s actual experience conforms to the budget fiscalplan. Since the governmental fund statements are presented on a different measurement focusand basis of accounting than the government-wide statements’ governmental column, a reconcil-iation is presented on the page following each statement, which briefly explains the adjustmentnecessary to transform the fund based financial statements into the governmental column of thegovernment-wide presentation.
The focus of the Statement No. 34 model is on the City as a whole. The focus of the fundfinancial statements is on the major individual funds of the governmental activities and theproprietary funds. Each presentation provides valuable information that can be analyzed andcompared (between years and between governments) to enhance the usefulness of the informa-tion.
C. BASIS OF PRESENTATION
Statement No. 34 sets forth minimum criteria (percentage of the assets, liabilities, revenues orexpenditures/expenses of either fund category or the governmental and enterprise combined) forthe determination of major funds. Funds that meet these criteria are labeled as such. Thenonmajor funds are combined in a column in the fund financial statements and detailed in thecombining section of this report.
1. Major Governmental Funds
The measurement focus of the governmental funds (in the Fund Financial Statements) is upondetermination of financial position and changes in financial position (sources, uses, and balancesof financial resources) rather than upon net income.
The following is a description of the major governmental funds of the City:
General Fund - The General Fund is the general operating fund of the City. General Taxrevenues and other receipts that are not allocated by law or contractual agreement tosome other fund are accounted for in this fund. General operating expenses, fixedcharges, and capital improvement costs not paid through other funds are paid from thisfund.
Debt Service Fund - accounts for the accumulation of financial resources for the paymentof principal and interest on the City’s general obligation debt. The primary revenuesource is local property taxes levied specifically for debt service.
Colony Park TIF Bond Debt - This is a debt service fund that accounts for the payment ofprincipal and interest on the debt related to the Colony Park project.
66

City of Ridgeland, MississippiNotes to the Financial StatementsFor the Year Ended September 30, 2013
Lake Harbour Reconstruction 51 to Northpark Drive - This capital project fund accountsfor the expenditures of the widening of lanes of Lake Harbour from Hwy. 51 toNorthpark Drive.
2. Proprietary Funds
Enterprise Funds are used to account for operations (a) that are financed and operated in amanner similar to private business enterprises - where the intent of the governing body is that thecosts (expenses including depreciation) of providing goods or services to the general public on acontinuing basis be financed or recovered primarily through user charges or (b) where thegoverning body has decided that periodic determination of revenues earned, expenses incurred,and/or net income is appropriate for capital maintenance, public policy, management control,accountability, or other purposes.
The following is a description of the major proprietary fund of the City:
Public Utility Fund - accounts for the operating activities of the City’s public utilityservices.
Internal Service Funds account for operations that provide services to other departments oragencies of the government, or to other governments, on a cost-reimbursement basis.
East Madison County Regional Sewer Fund - accounts for sewer expenses of an inter-local cost-sharing agreement between the City of Ridgeland, Mississippi, the City ofMadison, Mississippi and the Pearl River Valley Water Authority.
Insurance Trust Fund - accounts for the insurance transactions handled by the City fortheir self insured employee health insurance program.
3. Non-Current Governmental Assets and Liabilities
GASB Statement No. 34 provides for the capital assets and long-term debt records to bemaintained and incorporates the information into the governmental column in the government-wide Statement of Net Position.
D. BASIS OF ACCOUNTING
The accounting and financial reporting treatment applied to a fund is determined by its measure-ment focus. All governmental funds are accounted for using the current financial resourcesmeasurement focus. With this measurement focus, only current assets and current liabilitiesgenerally are included on the balance sheet in the fund statements. Long-term assets and long-term liabilities are included in the government-wide statements. Operating statements of thesefunds present increases (i.e., revenues and other financing sources) and decreases (i.e., expendi-tures and other financing uses) in net current assets.
67
City of Ridgeland, MississippiNotes to the Financial StatementsFor the Year Ended September 30, 2013
The government-wide statements of Net Position, statements of activities, and proprietary fundsare accounted for using the economic resources measurement focus. With this measurementfocus, all assets and all liabilities associated with the operation of these activities are included onthe balance sheet.
The fund financial statements are maintained on the modified accrual basis of accounting. Underthis method of accounting, revenues are recognized in the period in which they becomemeasurable and available. With respect to real and personal property tax revenue and other localtaxes, the term “available” is limited to collection within sixty days of the fiscal year end. Levies that are made prior to the fiscal year end, but are not available, are deferred. Interestincome is recorded as earned.
Federal and State reimbursement type grants are recorded as revenue when related eligibleexpenditures are met. Expenditures, other than accrued interest on long-term debt, are recordedwhen the fund liability is incurred. All other revenue items reported in the fund financialstatements are considered “available” when the cash is received by the City one year after itsfiscal year.
Franchise and utility taxes, state revenue sharing, charges for services, and fines and forfeituresassociated with the current period are considered to be susceptible to accrual and therefore havebeen recognized as revenues of the current fiscal period.
Expenditures are generally recorded when a liability is incurred, as under accrual accounting. However, debt service expenditures, as well as expenditures related to compensated absences,claims, and judgments, are recorded only when payment is due.
When both restricted and unrestricted resources are available for use, it is the City’s policy to userestricted resources first, and then unrestricted resources as they are needed.
E. ENCUMBRANCES
An encumbrance system is maintained to account for commitments resulting from approvedpurchase orders, work orders and contracts. All encumbrances lapse at year-end; accordingly, noencumbrances were outstanding at September 30, 2013.
F. BUDGETS AND BUDGETARY INFORMATION
The budget is adopted annually by the Mayor and the Board of Alderman, and subsequentamendments are made during the year on the approval of the Mayor and Board or, whenallowed, upon authority of the City Clerk, as described in the following paragraphs.All funds of the City of Ridgeland, Mississippi, governmental and enterprise, are budgeted, andare presented in either the accompanying financial statements or in schedules thereto. Forcomparison purposes, the final, amended budget is utilized, and it is presented on a modifiedcash basis of accounting as required by the State of Mississippi, which is not consistent withgenerally accepted accounting principles. All budgetary appropriations lapse at year-end.
68
City of Ridgeland, MississippiNotes to the Financial StatementsFor the Year Ended September 30, 2013
The legal level of control, that is the level on which actual expenditures may not legally exceedappropriations, is the major expenditure classifications within departments. Such classificationsare Personnel Services, Supplies, Other Charges and Services and Capital Outlay.
All amendments to the budget to the legal level of control must be approved by the City ofRidgeland’s Mayor and Board of Alderman. The City Clerk is allowed to reclassify, withoutgoverning body approval, any budget “line items”; that is, amounts below the legal level ofcontrol.
The expenditure budget adopted and approved by the duly elected members of the governingauthority of the City of Ridgeland is the appropriation ordinance of said municipality.
As allowed by statute, the expenditure budget was amended and approved by the duly electedmembers of the governing authority of the City of Ridgeland. Such amendments are included inthe reported budgetary data.
G. UNEARNED REVENUE
In the government-wide and proprietary fund financial statements, unearned revenues arerecognized when assets are received prior to being earned. Unearned revenues are also recog-nized in the governmental funds financial statements, which are recognized when revenues areunavailable.
H. FUND BALANCES
Fund balance for governmental funds is reported in classifications that comprise a hierarchybased primarily on the extent to which the government is bound to honor constraints on thespecific purposes for which amounts in those funds can be spent.
Governmental fund balance is classified as nonspendable, restricted, committed, assigned orunassigned. Following are descriptions of fund classifications used by the city:
Nonspendable fund balance includes items that cannot be spent. This includes activitythat is not in a spendable form (inventories, prepaid amounts, long-term portion ofloans/notes receivable, or property held for resale unless the proceeds are restricted,committed, or assigned) and activity that is legally or contractually required to remainintact.
Restricted fund balance includes amounts that have constraints placed upon the use of theresources either by an external party or imposed by law through a constitutional provi-sion or enabling legislation.
Committed fund balance includes amounts that can be used only for the specific purposespursuant to constraints imposed by a formal action of the Board of Alderman, the City’shighest level of decision-making authority. Currently there is no committed fund balance
69
City of Ridgeland, MississippiNotes to the Financial StatementsFor the Year Ended September 30, 2013
for this city.
Assigned fund balance includes amounts that are constrained by the City’s intent to beused for a specific purpose, but are neither restricted nor committed. For governmentalfunds, other than the general fund, this is the residual amount within the fund that is notrestricted or committed. Assignments of fund balance are created by the City Clerkpursuant to authorization established by the policy adopted by the city.
Unassigned fund balance is the residual classification for the general fund. Thisclassification represents fund balance that has not been assigned to other funds and thathas not been restricted, committed, or assigned to specific purposes within the generalfund. The general fund should be the only fund that reports a positive unassigned fundbalance amount. In other governmental funds, it may be necessary to report a negativeunassigned fund balance.
When an expenditure is incurred for purposes for which both restricted and unrestricted(committed, assigned, or unassigned) resources are available, it is the city’s general policy to userestricted resources first. When expenditures are incurred for purposes for which unrestricted(committed, assigned and unassigned) resources are available, and amounts in any of theseunrestricted classifications could be used, it is the city’s general policy to spend committedresources first, followed by assigned amounts, and then unassigned amounts.
I. CASH AND OTHER DEPOSITS AND CASH EQUIVALENTS
The City deposits excess funds in the financial institutions selected by the Mayor and Board ofAldermen in accordance with state statutes.
Cash consists of amounts on deposit with a financial institution in non-interest bearing accounts. Other deposits consist of interest-bearing demand accounts, saving accounts and certificates ofdeposit. Cash and other deposits are valued at cost.
Various restrictions on deposits are imposed by state statutes. The collateral for public entities’deposits in financial institutions is held in the name of the State Treasurer under a programestablished by the Mississippi State Legislature and is governed by section 27-105-5, Miss. CodeAnn. (1972). Under this program, the entity’s funds are protected through a collateral pooladministered by the State Treasurer.
For purposes of the combined statement of cash flows, the municipality considers to be cashequivalents all highly liquid investments and certificates of deposit if they have a maturity ofthree months or less when acquired.
J. INVESTMENTS
The City is allowed, by statue, to invest excess funds in any bonds or other direct obligations ofthe United States of America or the State of Mississippi, or of any county or municipality of this
70
City of Ridgeland, MississippiNotes to the Financial StatementsFor the Year Ended September 30, 2013
state, when such county or municipal bonds have been properly approved; or in interest-bearingtime deposits with any financial institution approved for the deposit of state funds. The interestearned is reported in the fund reporting the investment. Investments are reported at fair value.
K. INVENTORIES AND PREPAID ITEMS
Inventories of materials and supplies in the Enterprise Funds are stated at cost, calculated on thefirst-in, first-out basis.
Certain payments to vendors reflect costs applicable to future accounting periods and arerecorded as prepaid items using the consumption method in both government-wide and fundfinancial statements.
L. ACCOUNTS RECEIVABLE
Accounts Receivable are reported in the government-wide Statement of Net Position and thegovernmental funds Balance Sheet net of allowances for uncollectible receivables.
M. INTERFUND TRANSACTIONS AND BALANCES
In general, eliminations have been made to minimize the double-counting of internal activity,including internal service fund type activity on the government-wide financial statements. Excess revenues or expenses from the internal service funds have been allocated to the appropri-ate function originally charged for the internal sale as part of the process. However, interfundservices, provided and used between different functional categories, have not been eliminated inorder to avoid distorting the direct costs and program revenues of the applicable functions. Transfers between governmental and business-type activities are reported at the net amount onthe government-wide financial statements.
In the fund financial statements, transactions for services rendered by one fund to another aretreated as revenues of the recipient fund and expenditures/expenses of the disbursing fund. Reimbursements of the expenditures/expenses made by one fund for another are recorded asexpenditures/expenses in the reimbursing fund and as a reduction of expenditures/expenses inthe reimbursed fund. Transfers represent flows of assets between funds of the primary govern-ment without equivalent flows of assets in return and without a requirement for payment.
Interfund receivables and payables have been eliminated from the government-wide Statement ofNet Position, except for the residual amounts due between governmental and business-typeactivities.
The following is a summary of interfund transactions and balances:
71

City of Ridgeland, MississippiNotes to the Financial StatementsFor the Year Ended September 30, 2013
Due From/To Other Funds:
Due From Due To
Enterprise Fund:
Public Utility Fund $ 497,891
Other Non-Major Funds:
S.A. School Creek Intercept 497,891
Total $ 497,891 497,891
Due From/To Other Funds are the result of timing differences between the date expenses/expenditures are settled. All balances are expected to be repaid within one year from the date ofthe financial statements.
Interfund Balances
Receivables Payables
General Fund $ 15,550,437 11,127,905
Major Funds:
Debt Service Fund 259,788
Colony Park TIF Bond Debt 890,184
Lake Harbour Recon. 51 to Northpark Drive 9,128,500
Non-Major Funds:
S. A. School Creek Intercept 433,199
Avery Blvd. S.A. Bond Fund 422,070
TIF Bond Debt Lowes 468,780
Jackson Street Multi Use 8,298
Pear Orchard Parkside Village 10,519
Longmeadow Drainage Fund 52,168
Avery Blvd. Special Assessment 387,369
Madison Ridgeland Interchange 178,268
Pear Orchard Rice Road Signal 79,052
Lake Harbour Dr. Ext. 139,948
2007 Bond Issue Fund 398,736
Harbor Crossing TIF 1,030
Culley-Brashear Creek Fund 57,986
City Center Fund 4,791,268
Craft Center Parking Lot Fund 75,039 1,449
5.7 Mil Bond Issue Fund 5,570,189 3,285
Sub-Total Non-Major Funds 6,899,233 6,179,420
72
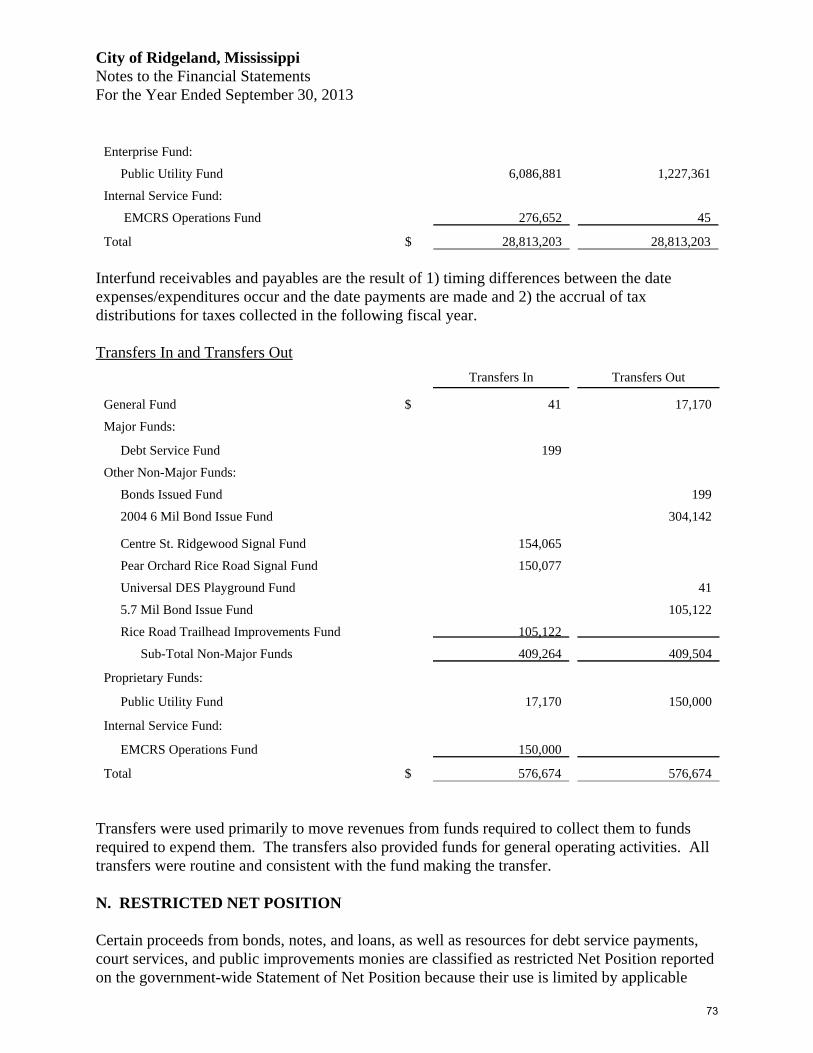
City of Ridgeland, MississippiNotes to the Financial StatementsFor the Year Ended September 30, 2013
Enterprise Fund:
Public Utility Fund 6,086,881 1,227,361
Internal Service Fund:
EMCRS Operations Fund 276,652 45
Total $ 28,813,203 28,813,203
Interfund receivables and payables are the result of 1) timing differences between the dateexpenses/expenditures occur and the date payments are made and 2) the accrual of taxdistributions for taxes collected in the following fiscal year.
Transfers In and Transfers Out
Transfers In Transfers Out
General Fund $ 41 17,170
Major Funds:
Debt Service Fund 199
Other Non-Major Funds:
Bonds Issued Fund 199
2004 6 Mil Bond Issue Fund 304,142
Centre St. Ridgewood Signal Fund 154,065
Pear Orchard Rice Road Signal Fund 150,077
Universal DES Playground Fund 41
5.7 Mil Bond Issue Fund 105,122
Rice Road Trailhead Improvements Fund 105,122
Sub-Total Non-Major Funds 409,264 409,504
Proprietary Funds:
Public Utility Fund 17,170 150,000
Internal Service Fund:
EMCRS Operations Fund 150,000
Total $ 576,674 576,674
Transfers were used primarily to move revenues from funds required to collect them to fundsrequired to expend them. The transfers also provided funds for general operating activities. Alltransfers were routine and consistent with the fund making the transfer.
N. RESTRICTED NET POSITION
Certain proceeds from bonds, notes, and loans, as well as resources for debt service payments,court services, and public improvements monies are classified as restricted Net Position reportedon the government-wide Statement of Net Position because their use is limited by applicable
73

City of Ridgeland, MississippiNotes to the Financial StatementsFor the Year Ended September 30, 2013
bond covenants and restrictions.
The following is a summary of restricted net position:
Restricted For:
Court Services $ 262,623
Public Improvements 1,788,001
Other Purposes 77,837
Total $ 2,128,461
O. CAPITAL ASSETS
In the governmental funds, the cost incurred for the purchase or construction of capital assets arerecorded as capital outlay expenditures.
Capital assets are reported at actual or estimated historical cost based on appraisals or deflatedcurrent replacement cost. Contributed assets are reported at estimated fair value at the timereceived.
Maintenance, repairs, and minor equipment are charged to operations when incurred. Expensesthat materially change capacities or extend useful lives are capitalized. Upon sale or retirementof land, buildings, and equipment, the cost and related accumulated depreciation, if applicable,are eliminated from the respective accounts and any resulting gain or loss is included in thestatement of activities.
All proprietary funds are accounted for on an economic measurement focus. This means that allassets and liabilities (whether current or noncurrent) associated with their activity are includedon their Statement of Net Position. Their fund equity is reported in the total net position of theStatement of Revenues, Expenses and Changes in Net Position. The capital assets threshold forthe propriety funds is the same as it is for governmental funds which is described in detail below.
The revenues and expenses of proprietary funds are classified as operating or nonoperating. Operating revenues and expenses generally result from providing services and producing anddelivering goods in connection with a proprietary fund’s primary operations. All other revenuesand expenses are reported as nonoperating.
In accordance with GASB Statement No. 34, governmental infrastructure has been capitalized. Capitalization thresholds (dollar value above which assets acquisitions are added to the capitalasset account) and estimated useful lives of capital assets are reported in the government-widestatements and proprietary funds. Depreciation is calculated on the straight-line basis for allassets, except land. The following schedule details those thresholds.
74

City of Ridgeland, MississippiNotes to the Financial StatementsFor the Year Ended September 30, 2013
Capital asset thresholds are as follows:
Land N/AInfrastructure N/AFurniture, Vehicles, and Equipment $ 500Improvements other than Buildings $25,000Buildings $50,000
Estimated useful lives, in years, for depreciable assets are as follows:
Computer Equipment and Peripherals 3 yearsVehicles and Equipment 5 yearsHeavy Equipment (backhoes, dozers, front-endloaders, tractors, etc) 10 yearsFurniture and Fixtures 7 yearsImprovements other than Buildings 20 yearsBuildings 40 yearsInfrastructure: Roads 20 years Concrete bridges 50 years Timber bridges 30 years
P. COMPENSATED ABSENCES
Upon termination of employment, the City of Ridgeland provides payment of accrued personalleave to the departing employee. While such leave is accumulated from 5 to 20 days each year,depending on length of service, no payment for medical leave is allowed absent the requiredevidence of such need.
Unpaid personal leave expected to be paid from the Governmental Funds is reported under Long-term Debt as "Accrued Compensated Absences." Similar amounts related to the Propri-etary Fund are accrued in the Enterprise Funds. Typically the related “Accrued CompensatedAbsences Expense” has been paid from the General Fund and the Public Utility Fund.
The respective liabilities are computed utilizing the specific identification method (i.e., eachemployee's actual accumulated personal leave days are multiplied by the applicable actual perday salary). The City's liability for compensated absences is not recorded in the governmentalfunds, for such liability may be paid from financial resources not currently available. Compen-sated absences are reported in governmental funds only if they have matured.
2. CASH, OTHER DEPOSITS, AND INVESTMENTS
A. Cash and Other Deposits
The collateral for public entities’ deposits in financial institutions is now held in the name of theState Treasurer under a program established by the Mississippi State Legislature and is governed
75
City of Ridgeland, MississippiNotes to the Financial StatementsFor the Year Ended September 30, 2013
by Section 27-105-5, Miss. Code Ann. (1972). Under this program, the entity’s funds areprotected through a collateral pool administered by the State Treasurer. Financial institutionsholding deposits of public funds must pledge securities as collateral against those deposits. Inthe event of failure of a financial institution, securities pledged by that institution would beliquidated by the State Treasurer to replace the public deposits not covered by the FederalDeposit Insurance Corporation. The City’s pooled and non-pooled deposits are categorized togive an indication of the level of risk assumed by the City at fiscal year-end.
The carrying amount of the city’s deposits with financial institutions was $13,585,407 and thebank balance was $13,872,311.
Custodial Credit Risk - Deposits. Custodial credit risk is defined as the risk that, in the event ofa financial institutions failure, the city’s deposits may not be returned to it. The city does nothave a deposit policy for custodial credit risk. As of September 30, 2013, none of the city’s bankbalance of $13,872,311 was exposed to custodial credit risk.
B. Investments
Except for (1) nonparticipating investment contracts and for (2) participating interest-earninginvestment contract and money market investments that had a remaining maturity at the time ofpurchase of one year or less, investments are reported at fair value, which is based on quotedmarket price. Nonparticipating investment contracts such as repurchase agreements andnonnegotiable certificates of deposit are reported at cost. Participating interest earning invest-ment contracts and money market investments that had a remaining maturity at the time ofpurchase of one year or less are reported at amortized cost.
Interest Rate Risk. Interest Rate risk is the risk that changes in interest rates will adversely affectthe fair value of an investment. Investments held for longer periods are subject to increased riskof adverse interest rate changes. The City’s investment policy is limited to complying with theState’s investment statutes. The State law has not addressed an interest rate risk. The City usesthe Specific Identification method to disclose interest-rate risk. Under this method, the notesprovide an actual list of the maturities for different individual investments.
Concentration of Credit Risk. Disclosures of investments by amount and issuer for any issuerthat represents five percent or more of total investments is required. This requirement does notapply to investments issued or explicitly guaranteed by the U.S. government, investments inmutual funds and external investment pools, and other pooled investments. As of September 30,2013, the city had the following investments:
76

City of Ridgeland, MississippiNotes to the Financial StatementsFor the Year Ended September 30, 2013
Investment Type Fair Value CreditRatings
Percentage ofInvestments
InterestRates
Panola County MS Taxable GO Bonds $ 293,951 NR 2.29% 4%
Federal National Mortgage Association (FNMA) 4,782,021 AAA 37.27% 2%
Governmental National Mortgage Association (GNMA) 3,830,336 AAA 29.86% 2.72%
State of Mississippi Tax Notes 523,675 AA 4.08% 3.15%
Mississippi Development Bank Tax Notes 1,224,160 AA 9.54% 3.63%
Private Export Funding Corporation (PEFCO) 1,747,218 AAA 13.62% 3.03%
Governmental Money Market Funds and CD’s 428,201 AAA 3.34% 1.56%
Total Investments $ 12,829,562 100%
Investment Maturities in Years
Investment Type Less Than 1 1-5 6-10 More than 10
Panola County MS Taxable GO Bonds 293,951
Federal National Mortgage Association (FNMA) 235,065 4,546,956
State of Mississippi Tax Notes 440,000 83,675
Mississippi Development Bank Tax Notes 473,612 750,548
Governmental National Mortgage Association (GNMA) 3,830,336
Private Export Funding Corporation (PEFCO) 1,747,218
Governmental Money Market Funds 428,201
Credit Risk. The City is allowed, by State Statute, to invest excess funds in any bonds or otherdirect obligations of the United States of America, of the State of Mississippi, or of any countyor municipality of Mississippi, when such county or municipal bonds have been properlyapproved; or in obligations issued or guaranteed in full as to principal and interest by the UnitedStates of America which are subject to a repurchase agreement with a qualified depository; or ininterest-bearing time certificates of deposit with any financial institution approved for thedeposit of state funds.
Custodial Credit Risk - Investments. Custodial credit risk is defined as the risk that, in the eventof a financial institutions failure, the city will not be able to recover the value of its investments. The City does not have a formal investment policy that addresses custodial credit risk. As ofSeptember 30, 2013, $0 of the city’s investment balance was insured and was exposed tocustodial credit risk as follows:
77
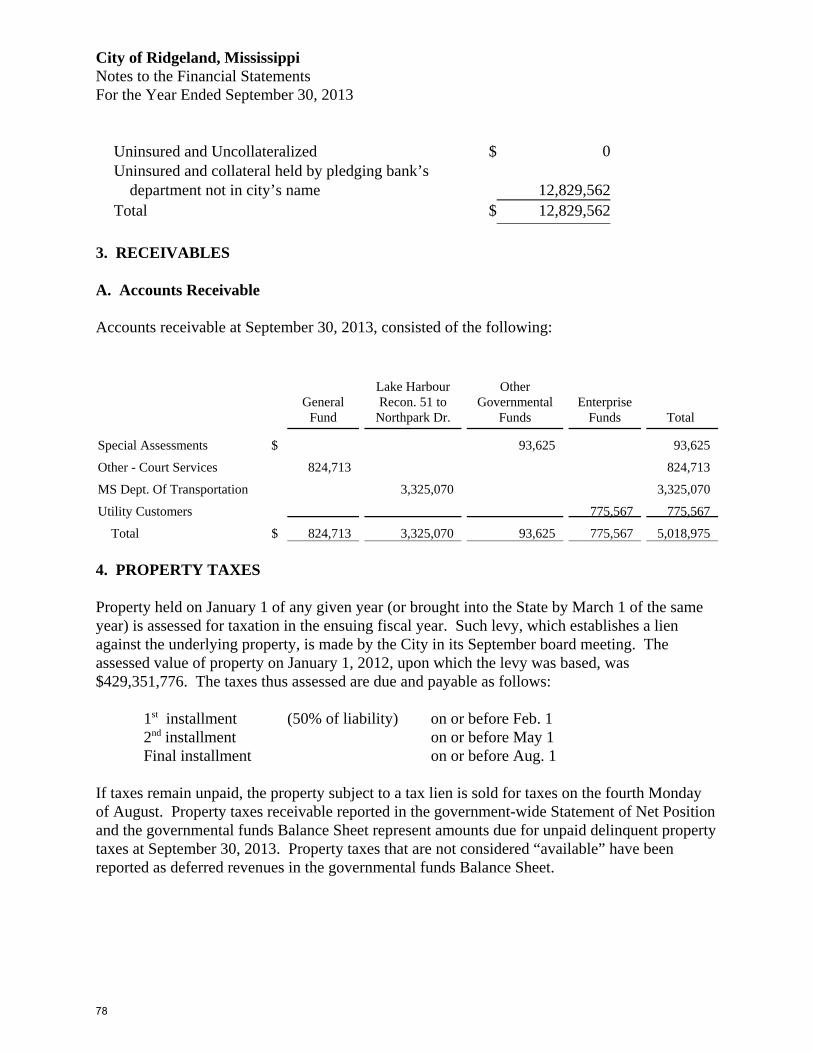
City of Ridgeland, MississippiNotes to the Financial StatementsFor the Year Ended September 30, 2013
Uninsured and Uncollateralized $ 0Uninsured and collateral held by pledging bank’s department not in city’s name 12,829,562Total $ 12,829,562
3. RECEIVABLES
A. Accounts Receivable
Accounts receivable at September 30, 2013, consisted of the following:
GeneralFund
Lake HarbourRecon. 51 to
Northpark Dr.
OtherGovernmental
FundsEnterprise
Funds Total
Special Assessments $ 93,625 93,625
Other - Court Services 824,713 824,713
MS Dept. Of Transportation 3,325,070 3,325,070
Utility Customers 775,567 775,567
Total $ 824,713 3,325,070 93,625 775,567 5,018,975
4. PROPERTY TAXES
Property held on January 1 of any given year (or brought into the State by March 1 of the sameyear) is assessed for taxation in the ensuing fiscal year. Such levy, which establishes a lienagainst the underlying property, is made by the City in its September board meeting. Theassessed value of property on January 1, 2012, upon which the levy was based, was $429,351,776. The taxes thus assessed are due and payable as follows:
1st installment (50% of liability) on or before Feb. 12nd installment on or before May 1Final installment on or before Aug. 1
If taxes remain unpaid, the property subject to a tax lien is sold for taxes on the fourth Mondayof August. Property taxes receivable reported in the government-wide Statement of Net Positionand the governmental funds Balance Sheet represent amounts due for unpaid delinquent propertytaxes at September 30, 2013. Property taxes that are not considered “available” have beenreported as deferred revenues in the governmental funds Balance Sheet.
78

City of Ridgeland, MississippiNotes to the Financial StatementsFor the Year Ended September 30, 2013
5. CAPITAL ASSETS
Balance Completed Balance10-1-2012 Additions Retirements Construction Adjustments 9-30-2013
Non-depreciable capital assets: Land $ 110,640,181 17,478 28,336 110,685,995 Construction in progress 6,798,012 7,791,487 (534,592) 14,054,907
Total non-depreciable capital assets 117,438,193 7,808,965 0 (506,256) 0 124,740,902
Depreciable capital assets: Buildings 15,480,830 95,560 15,576,390 Improvements other than buildings 9,383,593 2,679 506,256 9,892,528 Infrastructure 122,426,062 53,400 122,479,462 Vehicles 6,765,860 491,407 320,891 6,936,376 Furniture and equipment 4,256,890 175,048 176,918 4,255,020
Total depreciable capital assets 158,313,235 818,094 497,809 506,256 0 159,139,776
Less accumulated depreciation for: Buildings 4,564,821 310,180 4,875,001 Improvements other than buildings 3,069,533 389,358 3,458,891
Infrastructure 62,906,301 2,136,582 65,042,883 Vehicles 4,675,114 477,155 288,802 4,863,467 Furniture and equipment 3,269,029 201,121 162,024 3,308,126Total accumulated depreciation 78,484,798 3,514,396 450,826 0 0 81,548,368
Total depreciable capital assets, net 79,828,437 (2,696,302) 46,983 506,256 0 77,591,408
Governmental activities capital assets, net $ 197,266,630 5,112,663 46,983 0 0 202,332,310
The amount of capital assets for governmental activities shown on page 45 of this report($203,995,713) include the Internal Service fund total capital assets, net of accumulateddepreciation ($1,663,403).
The amount of depreciation expense charged to the respective governmental function in thegovernment-wide Statement of Activities for the period is as follows:
Amount
General Government $ 52,919
Public Safety 695,802
Public Services 2,285,495
Culture & Recreation 480,180
Total depreciation expense $ 3,514,396
The following are the amounts spent to September 30, 2013 on the different projects of thegovernmental activities of the City of Ridgeland:
79
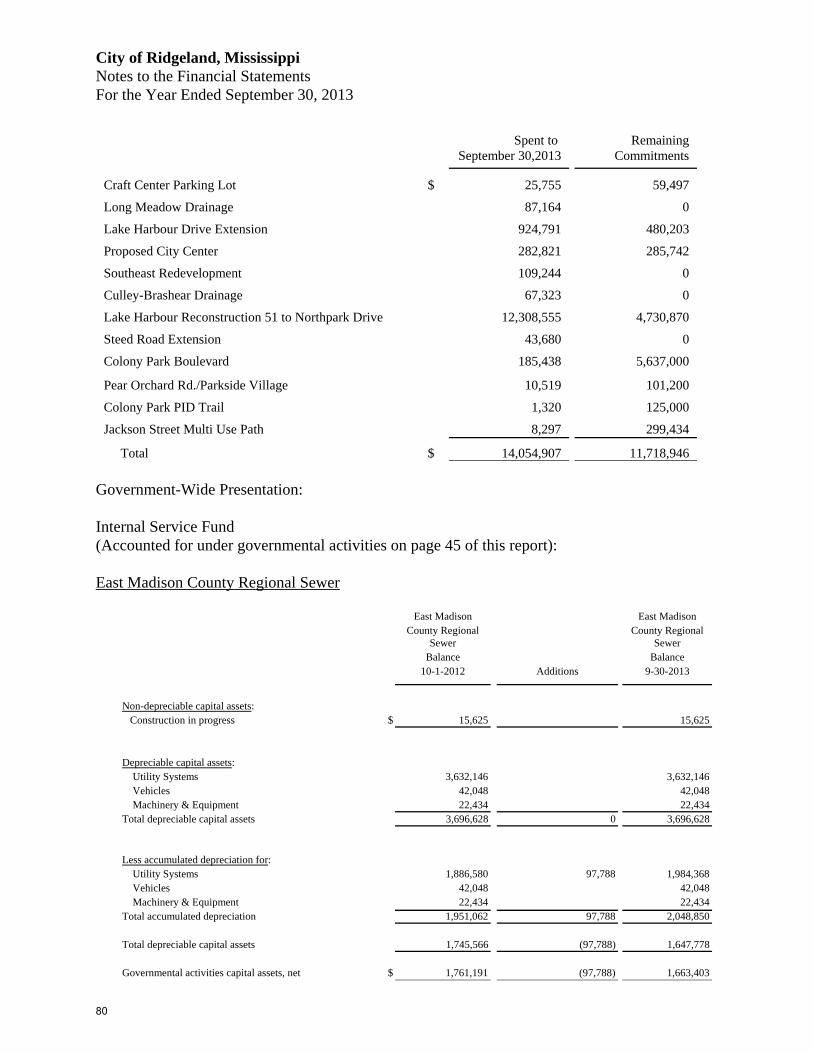
City of Ridgeland, MississippiNotes to the Financial StatementsFor the Year Ended September 30, 2013
Spent to September 30,2013
RemainingCommitments
Craft Center Parking Lot $ 25,755 59,497
Long Meadow Drainage 87,164 0
Lake Harbour Drive Extension 924,791 480,203
Proposed City Center 282,821 285,742
Southeast Redevelopment 109,244 0
Culley-Brashear Drainage 67,323 0
Lake Harbour Reconstruction 51 to Northpark Drive 12,308,555 4,730,870
Steed Road Extension 43,680 0
Colony Park Boulevard 185,438 5,637,000
Pear Orchard Rd./Parkside Village 10,519 101,200
Colony Park PID Trail 1,320 125,000
Jackson Street Multi Use Path 8,297 299,434
Total $ 14,054,907 11,718,946
Government-Wide Presentation:
Internal Service Fund (Accounted for under governmental activities on page 45 of this report):
East Madison County Regional Sewer
East Madison East MadisonCounty Regional
SewerCounty Regional
SewerBalance Balance
10-1-2012 Additions 9-30-2013
Non-depreciable capital assets: Construction in progress $ 15,625 15,625
Depreciable capital assets: Utility Systems 3,632,146 3,632,146 Vehicles 42,048 42,048 Machinery & Equipment 22,434 22,434 Total depreciable capital assets 3,696,628 0 3,696,628
Less accumulated depreciation for: Utility Systems 1,886,580 97,788 1,984,368 Vehicles 42,048 42,048 Machinery & Equipment 22,434 22,434 Total accumulated depreciation 1,951,062 97,788 2,048,850
Total depreciable capital assets 1,745,566 (97,788) 1,647,778
Governmental activities capital assets, net $ 1,761,191 (97,788) 1,663,403
80

City of Ridgeland, MississippiNotes to the Financial StatementsFor the Year Ended September 30, 2013
The following are the amounts spent to September 30, 2013 on a project of the governmentalactivities of the City of Ridgeland:
Spent to September 30, 2013
RemainingCommitments
Wastewater Flow and Monitoring $ 15,625 12,500
6. LONG - TERM OBLIGATIONS
A. Changes in Long-Term Obligations
The following is a summary of changes in long-term debt:
Amounts due
Balance Balance within one10-1-2012 Additions Reductions 9-30-2013 year
General Obligation BondsPublic Improvement $ 195,000 35,000 160,000 40,000Public Improvement 470,000 470,000 0Public Improvement - Refunding 2,495,000 885,000 1,610,000 925,000 Bond Premium 140,204 45,567 94,637 45,567Refunding Bonds 535,000 265,000 270,000 270,000Public Improvements 8,430,000 410,000 8,020,000 415,000 Bond Premium 14,700 988 13,712 988Refunding Bonds 139,160 69,580 69,580 69,580 Bond Premium 1,206 1,033 173 173Public Improvement 5,535,000 300,000 5,235,000 315,000 Bond Premium 56,395 4,126 52,269 4,126Public Improvement 3,230,000 430,000 2,800,000 435,000 Bond Premium 106,897 16,237 90,660 16,237 Total General Obligation Bonds 21,348,562 0 2,932,531 18,416,031 2,536,671
Other Long - Term DebtMississippi Department of Transportation 4,198,300 4,198,300Madison County Contract Payable 219,650 106,950 112,700 112,700Mississippi Development Authority 1,434,677 286,935 1,147,742 286,935Compensated Absences 573,746 225,507 193,896 605,357 30,268 Total Other Long - Term Debt 6,426,373 225,507 587,781 6,064,099 429,903Total General Long - Term Debt $ 27,774,935 225,507 3,520,312 24,480,130 2,966,574
B. Currently Outstanding Long - Term Obligations
General obligation bonds and other debt currently outstanding are as follows:
81

City of Ridgeland, MississippiNotes to the Financial StatementsFor the Year Ended September 30, 2013
Date of Date of Interest Original BalanceObligation Maturity Rate Amount 9-30-2013
General Obligation BondsPublic Improvement 3/29/05 9/30/17 4.150% $ 410,000 160,000Public Improvement 10/1/97 10/1/12 4.5-6.4% 5,000,000 0Refunding Bonds 7/4/03 9/30/14 2.0-3.0% 2,615,000 270,000Public Improvement 8/16/07 9/30/27 4.25-5.25% 10,165,000 8,020,000 Unamortized Bond Premium 19,760 13,712Refunding Bonds 3/1/10 9/1/16 3.0-4.5% 4,160,000 1,610,000 Unamortized Bond Premium 273,400 94,637Refunding Bonds 11/4/10 11/1/23 2-3.1% 208,739 69,580 Unamortized Bond Premium 9,515 173Public Improvement 5/31/11 5/1/26 3-4% 5,825,000 5,235,000 Unamortized Bond Premium 61,897 52,269Refunding Bonds 5/1/12 5/1/19 2.0% 3,230,000 2,800,000 Unamortized Bond Premium 113,662 90,660
Total $ 32,091,973 18,416,031
Other Long - Term DebtMadison County Contract Payable 6/1/91 6/1/14 6.10-6.4% 2,500,000 112,700Mississippi Department of Transportation 10/11/06 6/30/26 5.0% 5,072,000 4,198,300Mississippi Development Authority 12/1/09 12/1/16 0% 2,295,482 1,147,742
Total $ 9,867,482 5,458,742
C. Summary of Annual Debt Service Requirements To Maturity - Annual Principal &Interest
General Obligation Bonds
The City issues general obligation bonds to provide funds for City improvements. These aredirect obligations and pledge the full faith and credit of the City. Annual debt service require-ments to maturity for general obligation bonds are as follows:
Year Ending June 30 Principal Interest Total
2014 $ 2,469,580 670,323 3,139,9032015 1,585,000 586,744 2,171,7442016 1,650,000 528,259 2,178,2592017 1,350,000 470,599 1,820,5992018 1,355,000 429,219 1,784,2192019 - 2023 5,460,000 1,530,669 6,990,6692024 - 2028 4,295,000 431,050 4,726,050
Total $ 18,164,580 4,646,863 22,811,443
82
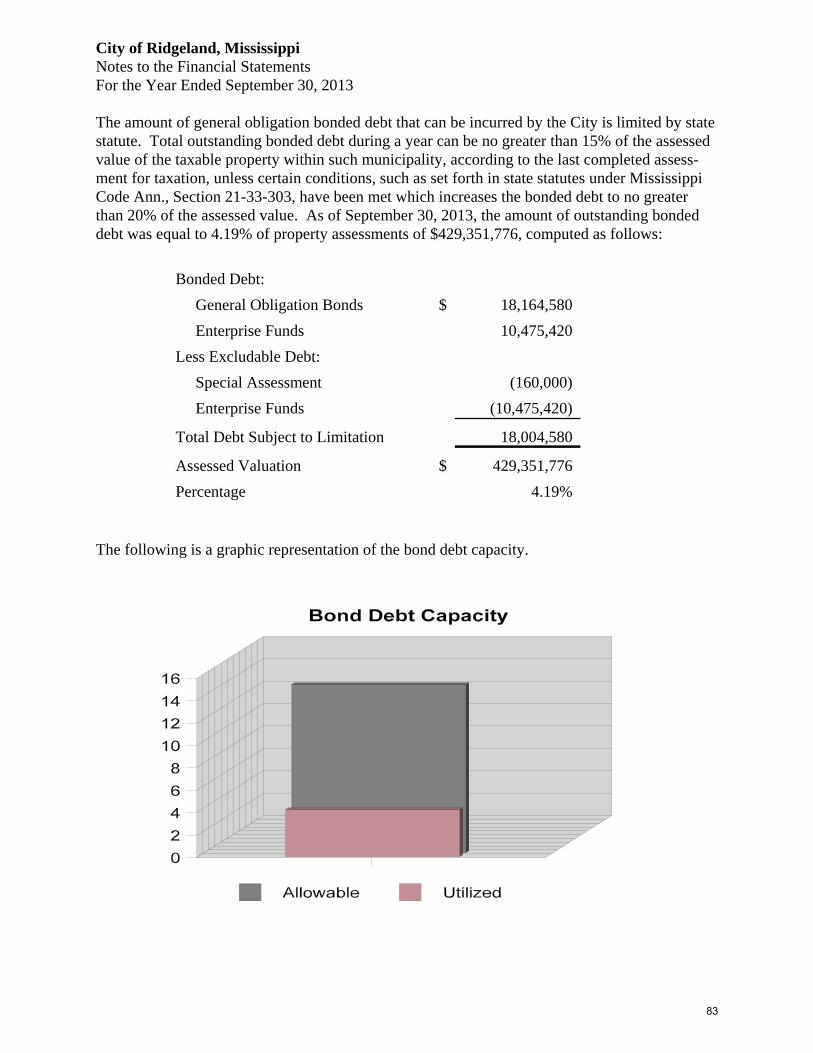
City of Ridgeland, MississippiNotes to the Financial StatementsFor the Year Ended September 30, 2013
The amount of general obligation bonded debt that can be incurred by the City is limited by statestatute. Total outstanding bonded debt during a year can be no greater than 15% of the assessedvalue of the taxable property within such municipality, according to the last completed assess-ment for taxation, unless certain conditions, such as set forth in state statutes under MississippiCode Ann., Section 21-33-303, have been met which increases the bonded debt to no greaterthan 20% of the assessed value. As of September 30, 2013, the amount of outstanding bondeddebt was equal to 4.19% of property assessments of $429,351,776, computed as follows:
Bonded Debt:
General Obligation Bonds $ 18,164,580
Enterprise Funds 10,475,420
Less Excludable Debt:
Special Assessment (160,000)
Enterprise Funds (10,475,420)
Total Debt Subject to Limitation 18,004,580
Assessed Valuation $ 429,351,776
Percentage 4.19%
The following is a graphic representation of the bond debt capacity.
83
City of Ridgeland, MississippiNotes to the Financial StatementsFor the Year Ended September 30, 2013
Prior Year Defeasance of Debt
In prior year, the City of Ridgeland, Mississippi defeased certain Public Improvement Bonds,Series 2004 by placing the proceeds of new bonds in an irrevocable trust to provide for all futuredebt service payments on the old bonds. Accordingly, the trust account assets and liabilities forthe defeased bonds are not included in the City’s financial statements. On September 30, 2013,$2,830,000 of bonds outstanding are defeased.
Other Long - Term Debt
The fund to retire each debt and a maturity schedule for the loans (and/or comments, whereapplicable) are as follows:
Madison County Contract Payable
Annual debt service requirements to maturity for Madison County Contract Payable are asfollows:
Original Amount Issue Date Maturity Date $2,500,000 6/1/91 6/1/14
Year Ending September 30 Principal Interest Total
2014 $ 112,700 5,634 118,334
This debt is to be retired from the Debt Service Fund (General Obligation Bonds and NotesFund).
As explained above the City entered into an agreement with Madison County to initiate aparkway. When the actual costs of the parkway exceeded the original projection, in the 1991fiscal year, the City authorized Madison County, Mississippi, to issue bonds of up to $2.5million to pay for the excess. The City would, by this agreement, retire these bonds of theCounty. Madison County issued these bonds during the year ended September 30, 1994; theCity’s liability is reflected as “Madison County Contract Payable” in the Schedule of Long-termDebt in these financial statements.
84
City of Ridgeland, MississippiNotes to the Financial StatementsFor the Year Ended September 30, 2013
Mississippi Department of Transportation
Annual debt service requirements to maturity are as follows:
Original Amount Issue Date Maturity Date $5,072,000 10/11/06 6/30/26
Year Ending September 30 Principal Interest Total
2014 $ 02015 02016 02017 260,400 157,240 417,6402018 273,400 143,895 417,2952019 - 2023 1,586,200 494,753 2,080,9532024 - 2026 2,078,300 838,650 2,916,950
Total $ 4,198,300 1,634,538 5,832,838
This debt is to be retired from the Debt Service Fund.
Mississippi Development Authority
Annual debt service requirements to maturity are as follows:
Original Amount Issue Date Maturity Date $2,295,482 12/01/09 12/01/16
Year EndingSeptember 30 Principal
2014 $ 286,9352015 286,9352016 286,9352017 286,937
Total $ 1,147,742
This debt is to be retired from the Debt Service Fund.
85

City of Ridgeland, MississippiNotes to the Financial StatementsFor the Year Ended September 30, 2013
Bond Premiums:Balance Balance9-30-12 Reductions 9-30-13
2010 issue $ 140,204 45,567 94,6372010 issue 14,700 988 13,7122011 issue 56,395 4,126 52,2692011 issue 1,206 1,033 1732012 issue 106,897 16,237 90,660
Total $ 319,402 67,951 251,451
Bond Issuance Costs:Balance Balance9-30-12 Reductions 9-30-13
2010 issue $ 47,494 13,900 33,5942011 issue 66,579 4,872 61,7072011 issue 4,324 3,083 1,2412012 issue 67,112 10,195 56,917
Total $ 185,509 32,050 153,459
7. BUSINESS-TYPE ACTIVITIES - CAPITAL ASSETS
The following is a summary of the capital assets of the Enterprise Funds at September 30, 2013.
Public Revenue
Public Revenue
Balance Completed Balance10-1-2012 Additions Deletions Construction 9-30-2013
Non-depreciable capital assets: Land $ 661,814 496,564 1,158,378 Construction in progress 15,453,450 890,798 (6,958,012) 9,386,236
Total non-depreciable capital assets 16,115,264 890,798 0 (6,461,448) 10,544,614
Depreciable capital assets: Buildings 782,034 782,034 Utility Systems 27,559,784 205,046 6,461,448 34,226,278 Vehicles 1,157,034 6,046 16,616 1,146,464 Machinery and equipment 1,095,012 31,024 8,497 1,117,539
Total depreciable capital assets 30,593,864 242,116 25,113 6,461,448 37,272,315
86
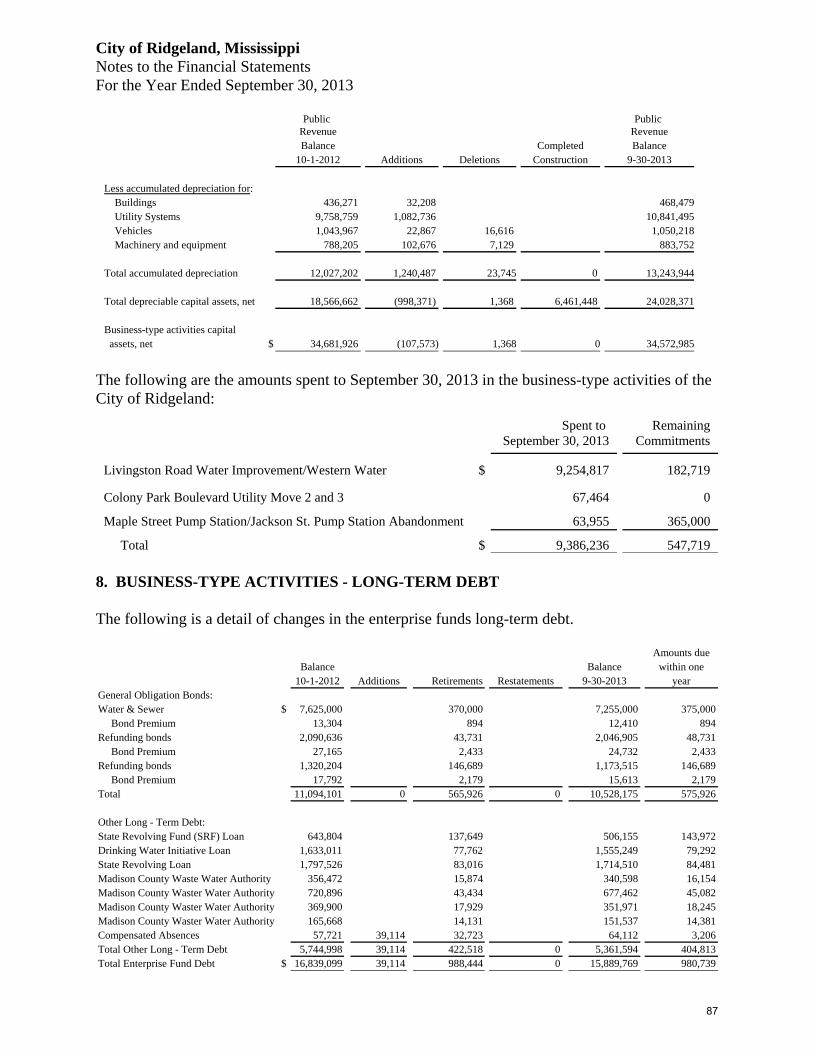
City of Ridgeland, MississippiNotes to the Financial StatementsFor the Year Ended September 30, 2013
Public Revenue
Public Revenue
Balance Completed Balance10-1-2012 Additions Deletions Construction 9-30-2013
Less accumulated depreciation for: Buildings 436,271 32,208 468,479 Utility Systems 9,758,759 1,082,736 10,841,495 Vehicles 1,043,967 22,867 16,616 1,050,218 Machinery and equipment 788,205 102,676 7,129 883,752
Total accumulated depreciation 12,027,202 1,240,487 23,745 0 13,243,944
Total depreciable capital assets, net 18,566,662 (998,371) 1,368 6,461,448 24,028,371
Business-type activities capital assets, net $ 34,681,926 (107,573) 1,368 0 34,572,985
The following are the amounts spent to September 30, 2013 in the business-type activities of theCity of Ridgeland:
Spent to September 30, 2013
RemainingCommitments
Livingston Road Water Improvement/Western Water $ 9,254,817 182,719
Colony Park Boulevard Utility Move 2 and 3 67,464 0
Maple Street Pump Station/Jackson St. Pump Station Abandonment 63,955 365,000
Total $ 9,386,236 547,719
8. BUSINESS-TYPE ACTIVITIES - LONG-TERM DEBT
The following is a detail of changes in the enterprise funds long-term debt.
Amounts dueBalance Balance within one
10-1-2012 Additions Retirements Restatements 9-30-2013 yearGeneral Obligation Bonds:Water & Sewer $ 7,625,000 370,000 7,255,000 375,000 Bond Premium 13,304 894 12,410 894Refunding bonds 2,090,636 43,731 2,046,905 48,731 Bond Premium 27,165 2,433 24,732 2,433Refunding bonds 1,320,204 146,689 1,173,515 146,689 Bond Premium 17,792 2,179 15,613 2,179Total 11,094,101 0 565,926 0 10,528,175 575,926
Other Long - Term Debt:State Revolving Fund (SRF) Loan 643,804 137,649 506,155 143,972Drinking Water Initiative Loan 1,633,011 77,762 1,555,249 79,292State Revolving Loan 1,797,526 83,016 1,714,510 84,481Madison County Waste Water Authority 356,472 15,874 340,598 16,154Madison County Waster Water Authority 720,896 43,434 677,462 45,082Madison County Waster Water Authority 369,900 17,929 351,971 18,245Madison County Waster Water Authority 165,668 14,131 151,537 14,381Compensated Absences 57,721 39,114 32,723 64,112 3,206Total Other Long - Term Debt 5,744,998 39,114 422,518 0 5,361,594 404,813Total Enterprise Fund Debt $ 16,839,099 39,114 988,444 0 15,889,769 980,739
87

City of Ridgeland, MississippiNotes to the Financial StatementsFor the Year Ended September 30, 2013
General Obligation Bonds
General obligation enterprise bonds are, as their name implies, general obligations of the City ofRidgeland, Mississippi. The public utility refunding bonds refunded part of the generalobligation enterprise bonds. The Water & Sewer bonds bear interest at a variable rate of 4.25%to 5.25% and the refunding bonds at a variable rate of 2.0% to 3.1%. Accordingly, such annualdebt service requirements to maturity for the City’s proprietary fund bonds are as follows:
Year Ending June 30 Principal Interest Total
2014 $ 570,420 411,664 982,0842015 665,000 387,559 1,052,5592016 690,000 361,371 1,051,3712017 715,000 336,109 1,051,1092018 740,000 310,546 1,050,5462019 - 2023 4,185,003 1,097,594 5,282,5972024 - 2027 2,909,997 289,333 3,199,330
Total $ 10,475,420 3,194,176 13,669,596
This debt will be paid from the Public Utility Fund.
Other Long - Term Debt
State Revolving Fund (SRF) Loan
Original Issue MaturityAmount Date Date Interest Rate$2,135,283 4/3/97 1/3/17 4.5%
Year Ending September 30 Principal Interest Total
2014 $ 143,972 19,832 163,8042015 150,586 12,079 162,6652016 157,504 6,300 163,8042017 54,093 508 54,601
Total $ 506,155 38,719 544,874
This debt will be retired from the Public Utility Fund.
88
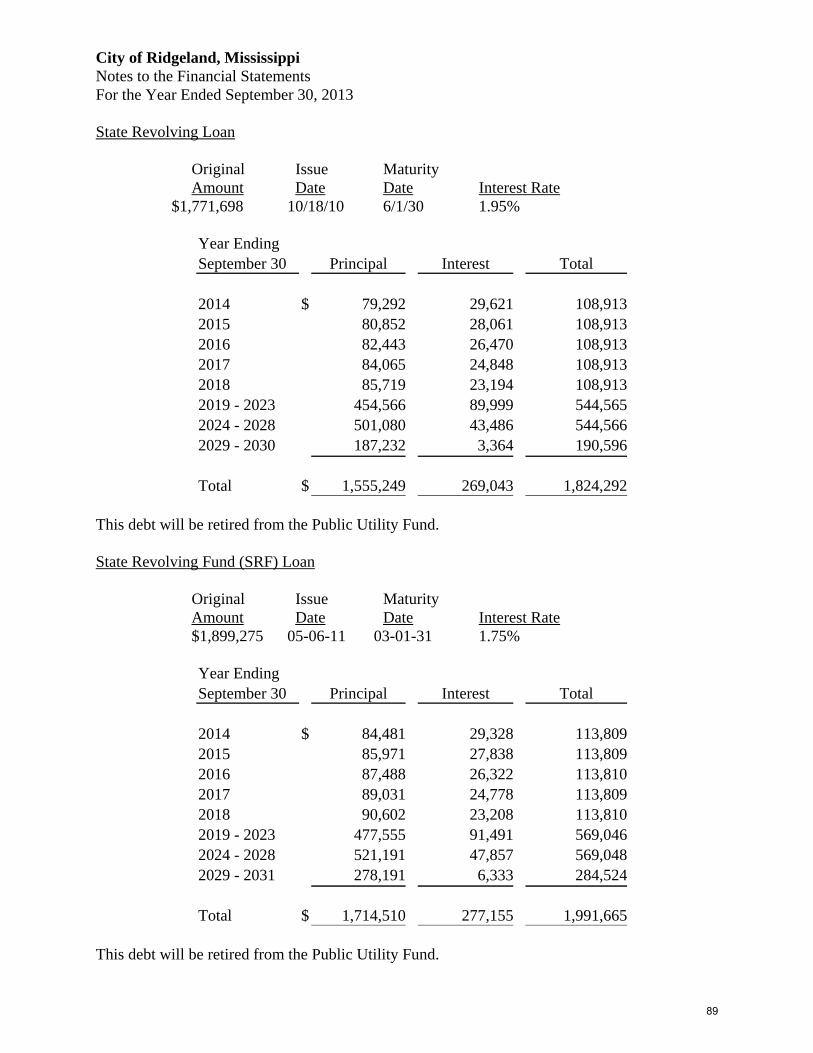
City of Ridgeland, MississippiNotes to the Financial StatementsFor the Year Ended September 30, 2013
State Revolving Loan
Original Issue MaturityAmount Date Date Interest Rate
$1,771,698 10/18/10 6/1/30 1.95%
Year Ending September 30 Principal Interest Total
2014 $ 79,292 29,621 108,9132015 80,852 28,061 108,9132016 82,443 26,470 108,9132017 84,065 24,848 108,9132018 85,719 23,194 108,9132019 - 2023 454,566 89,999 544,5652024 - 2028 501,080 43,486 544,5662029 - 2030 187,232 3,364 190,596
Total $ 1,555,249 269,043 1,824,292
This debt will be retired from the Public Utility Fund.
State Revolving Fund (SRF) Loan
Original Issue MaturityAmount Date Date Interest Rate$1,899,275 05-06-11 03-01-31 1.75%
Year Ending September 30 Principal Interest Total
2014 $ 84,481 29,328 113,8092015 85,971 27,838 113,8092016 87,488 26,322 113,8102017 89,031 24,778 113,8092018 90,602 23,208 113,8102019 - 2023 477,555 91,491 569,0462024 - 2028 521,191 47,857 569,0482029 - 2031 278,191 6,333 284,524
Total $ 1,714,510 277,155 1,991,665
This debt will be retired from the Public Utility Fund.
89

City of Ridgeland, MississippiNotes to the Financial StatementsFor the Year Ended September 30, 2013
Madison County Waste Water Authority - Bozeman Pump/Forcemain
Original Issue MaturityAmount Date Date Interest Rate$363,006 02-15-12 10-05-31 1.75%
Year Ending September 30 Principal Interest Total
2014 $ 16,154 5,831 21,9852015 16,439 5,546 21,9852016 16,729 5,256 21,9852017 17,025 4,961 21,9862018 17,325 4,661 21,9862019 - 2023 91,318 18,611 109,9292024 - 2028 99,662 10,266 109,9282029 - 2031 65,946 1,844 67,790
Total $ 340,598 56,976 397,574
This debt will be retired from the Public Utility Fund.
Madison County Waste Water Authority - Bank Plus Loan
Original Issue MaturityAmount Date Date Interest Rate$800,000 11-01-10 11-01-25 3.73%
Year Ending September 30 Principal Interest Total
2014 $ 45,082 24,637 69,7192015 46,792 22,926 69,7182016 48,568 21,150 69,7182017 50,411 19,308 69,7192018 52,323 17,395 69,7182019 - 2023 289,407 58,724 348,1312024 - 2026 144,879 6,159 151,038
Total $ 677,462 170,299 847,761
This debt will be retired from the Public Utility Fund.
90
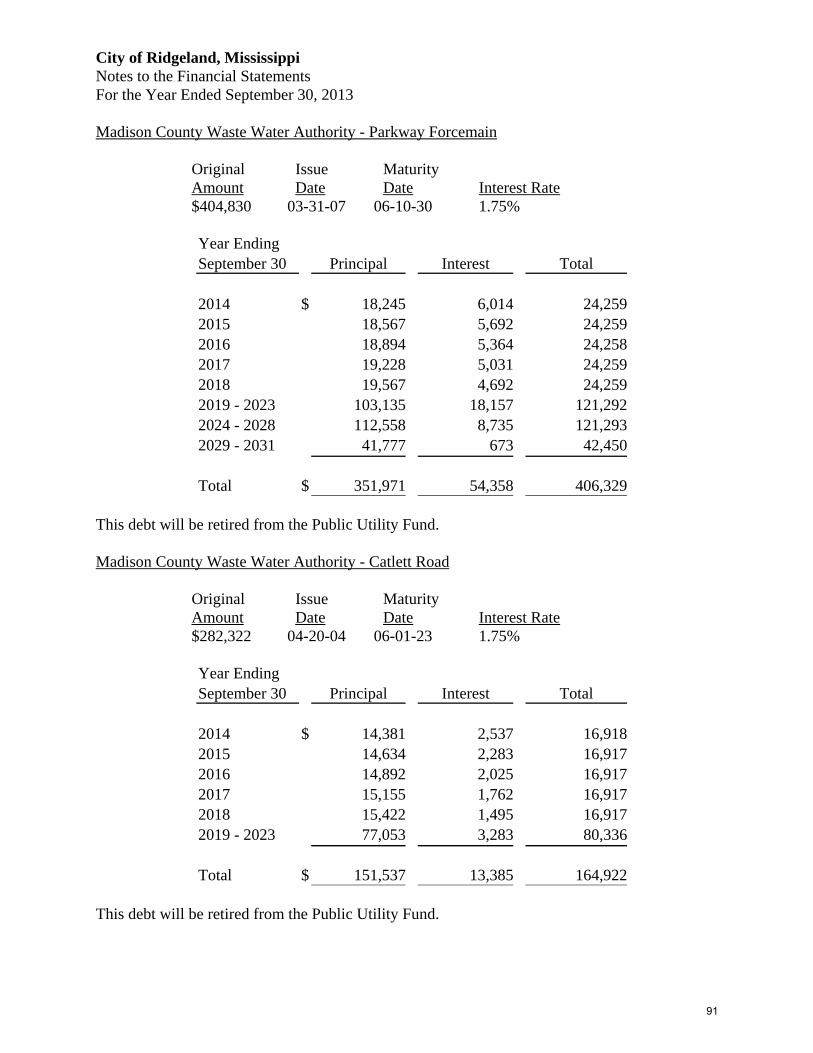
City of Ridgeland, MississippiNotes to the Financial StatementsFor the Year Ended September 30, 2013
Madison County Waste Water Authority - Parkway Forcemain
Original Issue MaturityAmount Date Date Interest Rate$404,830 03-31-07 06-10-30 1.75%
Year Ending September 30 Principal Interest Total
2014 $ 18,245 6,014 24,2592015 18,567 5,692 24,2592016 18,894 5,364 24,2582017 19,228 5,031 24,2592018 19,567 4,692 24,2592019 - 2023 103,135 18,157 121,2922024 - 2028 112,558 8,735 121,2932029 - 2031 41,777 673 42,450
Total $ 351,971 54,358 406,329
This debt will be retired from the Public Utility Fund.
Madison County Waste Water Authority - Catlett Road
Original Issue MaturityAmount Date Date Interest Rate$282,322 04-20-04 06-01-23 1.75%
Year Ending September 30 Principal Interest Total
2014 $ 14,381 2,537 16,9182015 14,634 2,283 16,9172016 14,892 2,025 16,9172017 15,155 1,762 16,9172018 15,422 1,495 16,9172019 - 2023 77,053 3,283 80,336
Total $ 151,537 13,385 164,922
This debt will be retired from the Public Utility Fund.
91
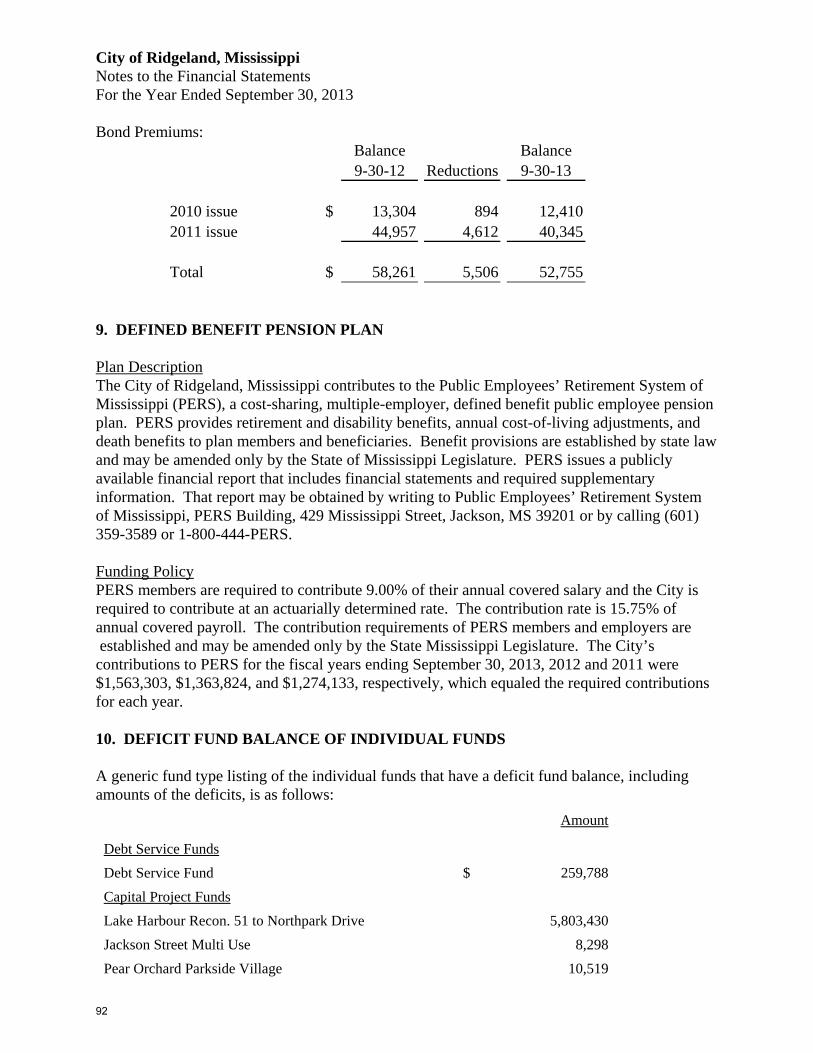
City of Ridgeland, MississippiNotes to the Financial StatementsFor the Year Ended September 30, 2013
Bond Premiums:Balance Balance9-30-12 Reductions 9-30-13
2010 issue $ 13,304 894 12,4102011 issue 44,957 4,612 40,345
Total $ 58,261 5,506 52,755
9. DEFINED BENEFIT PENSION PLAN
Plan DescriptionThe City of Ridgeland, Mississippi contributes to the Public Employees’ Retirement System ofMississippi (PERS), a cost-sharing, multiple-employer, defined benefit public employee pensionplan. PERS provides retirement and disability benefits, annual cost-of-living adjustments, anddeath benefits to plan members and beneficiaries. Benefit provisions are established by state lawand may be amended only by the State of Mississippi Legislature. PERS issues a publiclyavailable financial report that includes financial statements and required supplementaryinformation. That report may be obtained by writing to Public Employees’ Retirement Systemof Mississippi, PERS Building, 429 Mississippi Street, Jackson, MS 39201 or by calling (601)359-3589 or 1-800-444-PERS.
Funding PolicyPERS members are required to contribute 9.00% of their annual covered salary and the City isrequired to contribute at an actuarially determined rate. The contribution rate is 15.75% ofannual covered payroll. The contribution requirements of PERS members and employers are established and may be amended only by the State Mississippi Legislature. The City’scontributions to PERS for the fiscal years ending September 30, 2013, 2012 and 2011 were$1,563,303, $1,363,824, and $1,274,133, respectively, which equaled the required contributionsfor each year.
10. DEFICIT FUND BALANCE OF INDIVIDUAL FUNDS
A generic fund type listing of the individual funds that have a deficit fund balance, includingamounts of the deficits, is as follows:
Amount
Debt Service Funds
Debt Service Fund $ 259,788
Capital Project Funds
Lake Harbour Recon. 51 to Northpark Drive 5,803,430
Jackson Street Multi Use 8,298
Pear Orchard Parkside Village 10,519
92
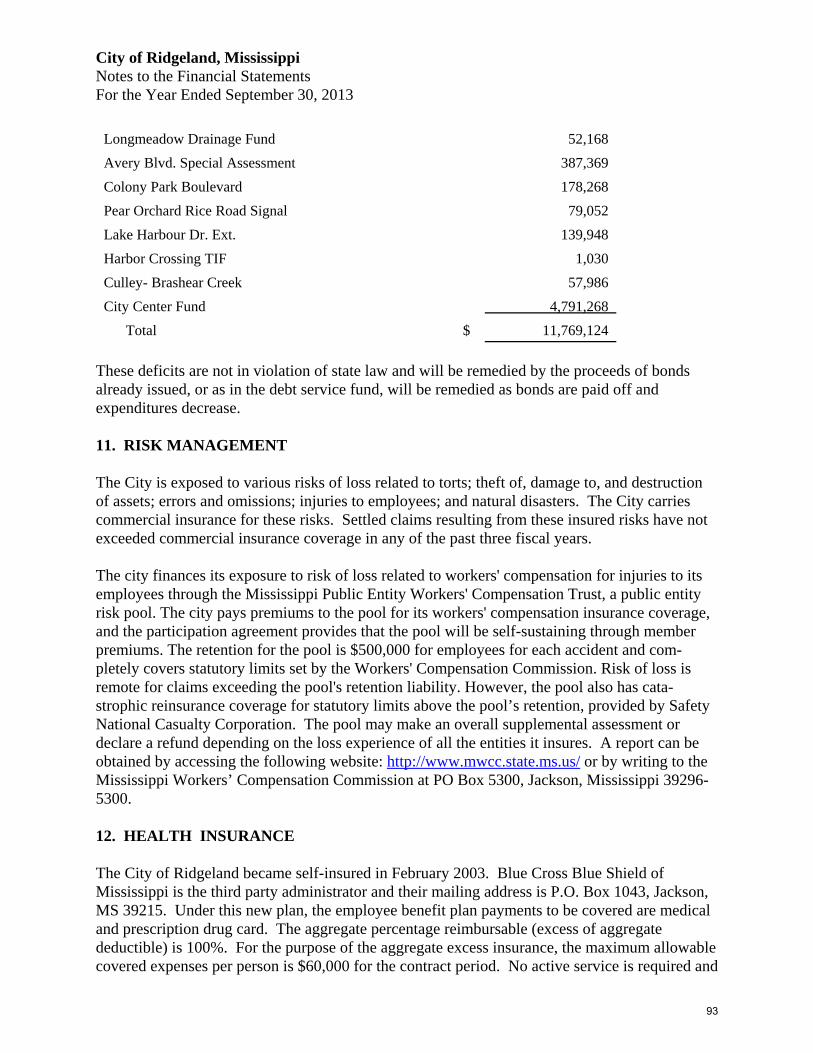
City of Ridgeland, MississippiNotes to the Financial StatementsFor the Year Ended September 30, 2013
Longmeadow Drainage Fund 52,168
Avery Blvd. Special Assessment 387,369
Colony Park Boulevard 178,268
Pear Orchard Rice Road Signal 79,052
Lake Harbour Dr. Ext. 139,948
Harbor Crossing TIF 1,030
Culley- Brashear Creek 57,986
City Center Fund 4,791,268
Total $ 11,769,124
These deficits are not in violation of state law and will be remedied by the proceeds of bondsalready issued, or as in the debt service fund, will be remedied as bonds are paid off andexpenditures decrease.
11. RISK MANAGEMENT
The City is exposed to various risks of loss related to torts; theft of, damage to, and destructionof assets; errors and omissions; injuries to employees; and natural disasters. The City carriescommercial insurance for these risks. Settled claims resulting from these insured risks have notexceeded commercial insurance coverage in any of the past three fiscal years.
The city finances its exposure to risk of loss related to workers' compensation for injuries to itsemployees through the Mississippi Public Entity Workers' Compensation Trust, a public entityrisk pool. The city pays premiums to the pool for its workers' compensation insurance coverage,and the participation agreement provides that the pool will be self-sustaining through memberpremiums. The retention for the pool is $500,000 for employees for each accident and com-pletely covers statutory limits set by the Workers' Compensation Commission. Risk of loss isremote for claims exceeding the pool's retention liability. However, the pool also has cata-strophic reinsurance coverage for statutory limits above the pool’s retention, provided by SafetyNational Casualty Corporation. The pool may make an overall supplemental assessment ordeclare a refund depending on the loss experience of all the entities it insures. A report can beobtained by accessing the following website: http://www.mwcc.state.ms.us/ or by writing to theMississippi Workers’ Compensation Commission at PO Box 5300, Jackson, Mississippi 39296-5300.
12. HEALTH INSURANCE
The City of Ridgeland became self-insured in February 2003. Blue Cross Blue Shield ofMississippi is the third party administrator and their mailing address is P.O. Box 1043, Jackson,MS 39215. Under this new plan, the employee benefit plan payments to be covered are medicaland prescription drug card. The aggregate percentage reimbursable (excess of aggregatedeductible) is 100%. For the purpose of the aggregate excess insurance, the maximum allowablecovered expenses per person is $60,000 for the contract period. No active service is required and
93

City of Ridgeland, MississippiNotes to the Financial StatementsFor the Year Ended September 30, 2013
retirees are not covered. The City has a stop loss policy in effect in the event that the reimburse-ment maximum exceeds $1,025,602.
13. SUBSEQUENT EVENTS
Events that occur after the Statement of Net Position date but before the financial statements areavailable to be issued must be evaluated for recognition or disclosure. The effects of subsequentevents that provide evidence about conditions that existed at the Statement of Net Position dateare recognized in the accompanying financial statements. Subsequent events which provideevidence about conditions that existed after the Statement of Net Position date require disclosurein the accompanying notes. Management of the City of Ridgeland, Mississippi evaluated theactivity of the city through the date the financial statements were available to be issued, anddetermined that no subsequent events have occurred that require disclosure in the notes to thefinancial statements.
94

This page is intentionally left blank.
95

REQUIRED SUPPLEMENTARY INFORMATION
96

GENERAL FUND
The general fund is used to account for resources traditionally associated with government whichare not required to be accounted for in another fund.
The City maintains one general fund.
97
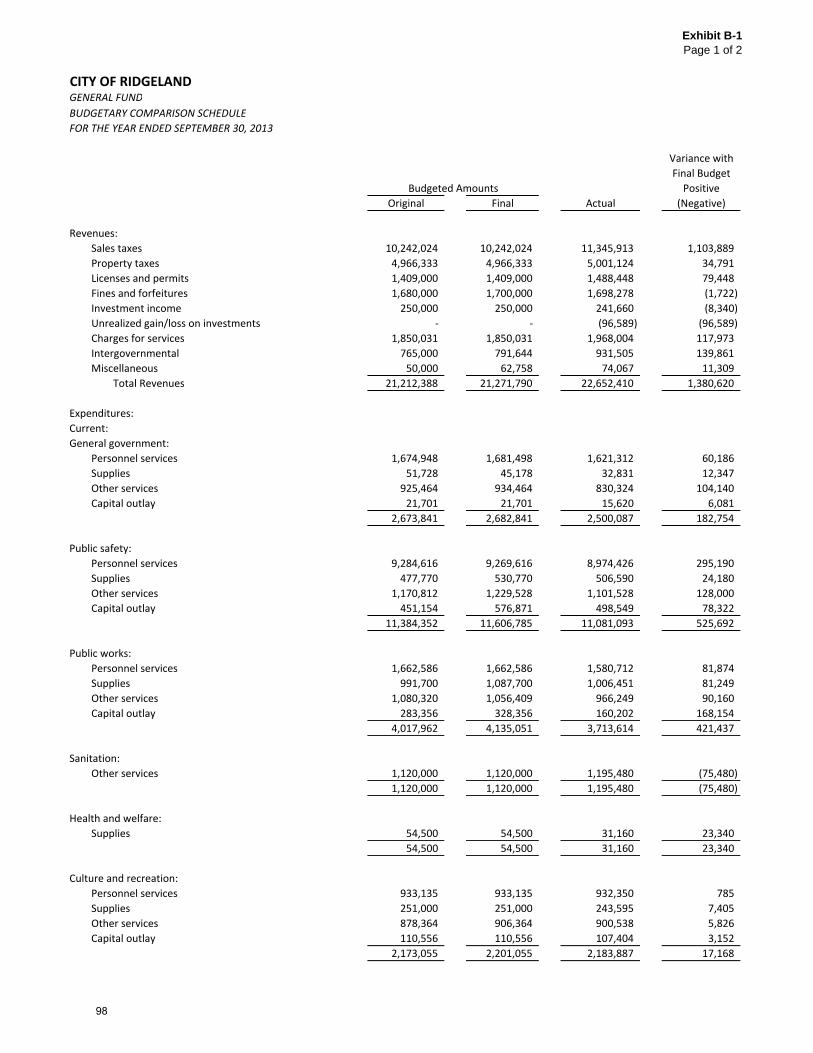
Exhibit B-1Page 1 of 2
CITY OF RIDGELANDGENERAL FUND
BUDGETARY COMPARISON SCHEDULE
FOR THE YEAR ENDED SEPTEMBER 30, 2013
Variance with
Final Budget
Positive
Original Final Actual (Negative)
Revenues:
Sales taxes 10,242,024 10,242,024 11,345,913 1,103,889
Property taxes 4,966,333 4,966,333 5,001,124 34,791
Licenses and permits 1,409,000 1,409,000 1,488,448 79,448
Fines and forfeitures 1,680,000 1,700,000 1,698,278 (1,722)
Investment income 250,000 250,000 241,660 (8,340)
Unrealized gain/loss on investments ‐ ‐ (96,589) (96,589)
Charges for services 1,850,031 1,850,031 1,968,004 117,973
Intergovernmental 765,000 791,644 931,505 139,861
Miscellaneous 50,000 62,758 74,067 11,309
Total Revenues 21,212,388 21,271,790 22,652,410 1,380,620
Expenditures:
Current:
General government:
Personnel services 1,674,948 1,681,498 1,621,312 60,186
Supplies 51,728 45,178 32,831 12,347
Other services 925,464 934,464 830,324 104,140
Capital outlay 21,701 21,701 15,620 6,081
2,673,841 2,682,841 2,500,087 182,754
Public safety:
Personnel services 9,284,616 9,269,616 8,974,426 295,190
Supplies 477,770 530,770 506,590 24,180
Other services 1,170,812 1,229,528 1,101,528 128,000
Capital outlay 451,154 576,871 498,549 78,322
11,384,352 11,606,785 11,081,093 525,692
Public works:
Personnel services 1,662,586 1,662,586 1,580,712 81,874
Supplies 991,700 1,087,700 1,006,451 81,249
Other services 1,080,320 1,056,409 966,249 90,160
Capital outlay 283,356 328,356 160,202 168,154
4,017,962 4,135,051 3,713,614 421,437
Sanitation:
Other services 1,120,000 1,120,000 1,195,480 (75,480)
1,120,000 1,120,000 1,195,480 (75,480)
Health and welfare:
Supplies 54,500 54,500 31,160 23,340
54,500 54,500 31,160 23,340
Culture and recreation:
Personnel services 933,135 933,135 932,350 785
Supplies 251,000 251,000 243,595 7,405
Other services 878,364 906,364 900,538 5,826
Capital outlay 110,556 110,556 107,404 3,152
2,173,055 2,201,055 2,183,887 17,168
Budgeted Amounts
98

Exhibit B-1Page 2 of 2
CITY OF RIDGELANDGENERAL FUND
BUDGETARY COMPARISON SCHEDULE
FOR THE YEAR ENDED SEPTEMBER 30, 2013
Variance with
Final Budget
Positive
Original Final Actual (Negative)
Budgeted Amounts
Economic development:
Other services 75,000 75,000 50,000 25,000
75,000 75,000 50,000 25,000
Capital Outlay:
Capital Outlay ‐ 20,000 17,478 2,522
‐ 20,000 17,478 2,522
Debt service:
Principal 69,580 69,580 69,580 ‐
Interest and fiscal charges 2,761 2,761 2,761 ‐
72,341 72,341 72,341 ‐
Total expenditures 21,571,051 21,967,573 20,845,140 1,119,911
Excess (deficiency) of revenues over (under) expenditures (358,663) (695,783) 1,807,270 260,709
Other financing sources (uses):
Transfers in ‐ ‐ 41 41
Transfers out (800,000) (797,170) (17,170) 780,000
Sale of equipment 32,000 32,000 33,194 1,194
Total other financing sources (uses) (768,000) (765,170) 16,065 781,235
Excess of revenues and other financing sources over
(under) expenditures and other financing uses (1,126,663) (1,460,953) 1,823,335 1,041,944
Fund balance ‐ beginning 13,368,810 13,368,810 13,368,810 ‐
Fund balance, September 30 12,242,147 11,907,857 15,192,145 3,284,288
99
City of Ridgeland, Mississippi
Notes to the Required Supplementary InformationFor the Year Ended September 30, 2013
Budgetary Comparison Schedule
(1) Basis of Presentation.
All funds of the City of Ridgeland, Mississippi, governmental and enterprise, arebudgeted, and are presented in either the accompanying financial statements or inschedules thereto. For comparison purposes, the final, amended budget is utilized, and itis presented on a modified cash basis of accounting as required by the State of Missis-sippi, which is not consistent with generally accepted accounting principles. Allbudgetary appropriations lapse at year-end.
(2) Budget amendments and revisions.
The budget is adopted and may be amended by the Board of Aldermen. A budgetarycomparison is presented for the general fund and each major fund and is presented on amodified cash basis of accounting.
(3) This year there were no adjustments to reconcile the modified cash basis of accounting toGAAP.
100
OTHER SUPPLEMENTARY INFORMATION
Supplementary information is presented to providegreater detailed information than reported in thepreceding financial statements. This information, inmany cases, has been spread throughout the report andis brought together here for greater clarity. Financialschedules are not necessary for fair presentation, inorder to be in conformity with Generally AcceptedAccounting Principles.
101
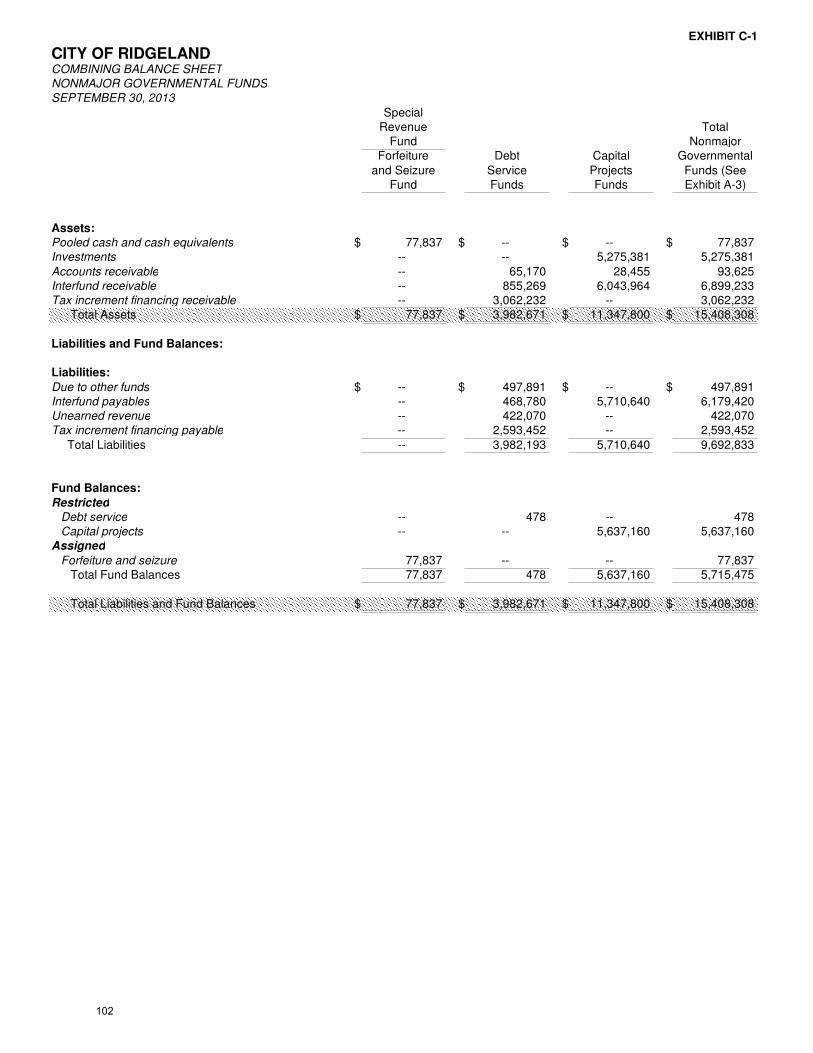
EXHIBIT C-1
CITY OF RIDGELANDCOMBINING BALANCE SHEET
NONMAJOR GOVERNMENTAL FUNDS
SEPTEMBER 30, 2013
SpecialRevenue Total
Fund NonmajorForfeiture Debt Capital Governmental
and Seizure Service Projects Funds (SeeFund Funds Funds Exhibit A-3)
Assets:
Pooled cash and cash equivalents $ 77,837 $ -- $ -- $ 77,837Investments -- -- 5,275,381 5,275,381
Accounts receivable -- 65,170 28,455 93,625Interfund receivable -- 855,269 6,043,964 6,899,233Tax increment financing receivable -- 3,062,232 -- 3,062,232 Total Assets $ 77,837 $ 3,982,671 $ 11,347,800 $ 15,408,308
Liabilities and Fund Balances:
Liabilities:
Due to other funds $ -- $ 497,891 $ -- $ 497,891Interfund payables -- 468,780 5,710,640 6,179,420Unearned revenue -- 422,070 -- 422,070Tax increment financing payable -- 2,593,452 -- 2,593,452
Total Liabilities -- 3,982,193 5,710,640 9,692,833
Fund Balances:
Restricted
Debt service -- 478 -- 478 Capital projects -- -- 5,637,160 5,637,160Assigned
Forfeiture and seizure 77,837 -- -- 77,837 Total Fund Balances 77,837 478 5,637,160 5,715,475
Total Liabilities and Fund Balances $ 77,837 $ 3,982,671 $ 11,347,800 $ 15,408,308
102
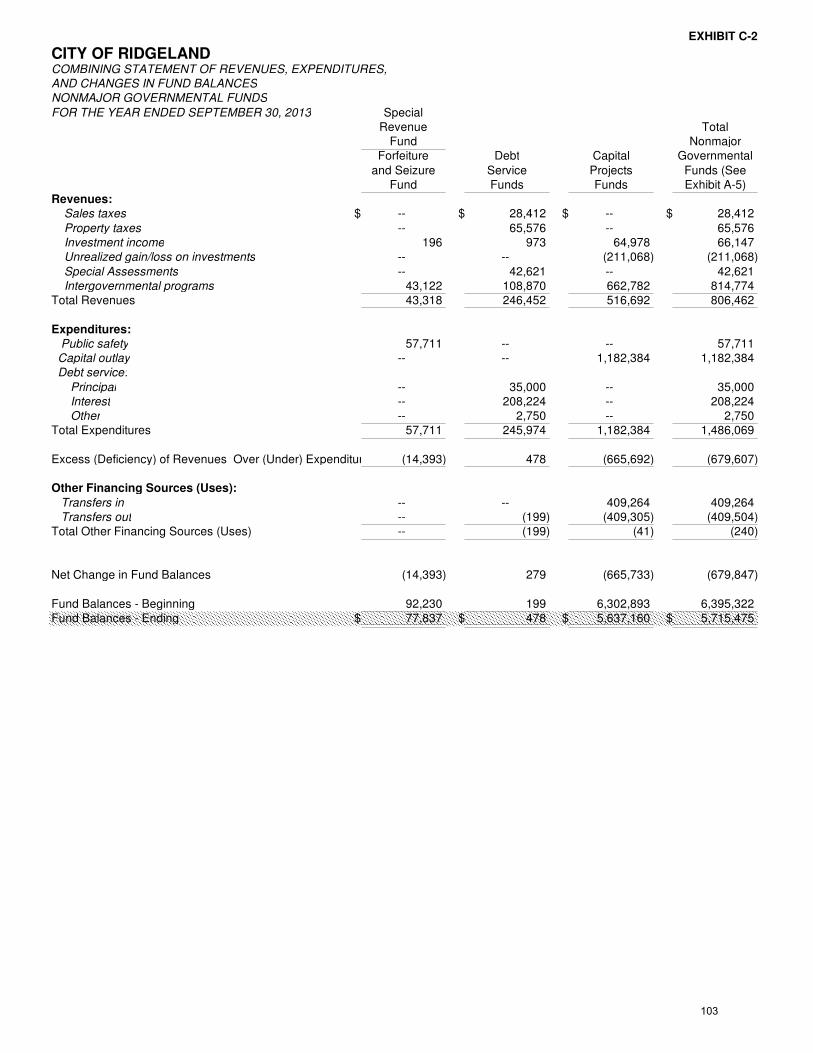
EXHIBIT C-2
CITY OF RIDGELANDCOMBINING STATEMENT OF REVENUES, EXPENDITURES,
AND CHANGES IN FUND BALANCES
NONMAJOR GOVERNMENTAL FUNDS
FOR THE YEAR ENDED SEPTEMBER 30, 2013 SpecialRevenue Total
Fund NonmajorForfeiture Debt Capital Governmental
and Seizure Service Projects Funds (SeeFund Funds Funds Exhibit A-5)
Revenues:
Sales taxes $ -- $ 28,412 $ -- $ 28,412
Property taxes -- 65,576 -- 65,576 Investment income 196 973 64,978 66,147 Unrealized gain/loss on investments -- -- (211,068) (211,068)
Special Assessments -- 42,621 -- 42,621 Intergovernmental programs 43,122 108,870 662,782 814,774Total Revenues 43,318 246,452 516,692 806,462
Expenditures:
Public safety 57,711 -- -- 57,711 Capital outlay -- -- 1,182,384 1,182,384 Debt service:
Principal -- 35,000 -- 35,000 Interest -- 208,224 -- 208,224 Other -- 2,750 -- 2,750Total Expenditures 57,711 245,974 1,182,384 1,486,069
Excess (Deficiency) of Revenues Over (Under) Expenditures (14,393) 478 (665,692) (679,607)
Other Financing Sources (Uses):
Transfers in -- -- 409,264 409,264 Transfers out -- (199) (409,305) (409,504)Total Other Financing Sources (Uses) -- (199) (41) (240)
Net Change in Fund Balances (14,393) 279 (665,733) (679,847)
Fund Balances - Beginning 92,230 199 6,302,893 6,395,322Fund Balances - Ending $ 77,837 $ 478 $ 5,637,160 $ 5,715,475
103
SPECIAL REVENUE FUND
The special revenue fund is used to account for the proceeds of specific revenue sources (otherthan major capital projects) that are legally restricted for specific expenditure purposes.
The City maintains one special revenue fund:
1. Forfeiture and Seizures - This fund accounts for the revenues and related expenditures for forfeitures and seizures of the Ridgeland Police Department.
104

City of Ridgeland Exhibit C‐3
Forfeiture and Seizure Fund
Special Revenue Fund
Budgetary Comparison Schedule
For the year ended September 30, 2013
Variance with
Final Budget
Original Final Actual Positive (Negative)
Revenues:
Investment income $ ‐ ‐ 196 196
Intergovernmental programs ‐ ‐ 43,122 43,122
Total Revenues ‐ ‐ 43,318 43,318
Expenditures:
Public Safety 90,000 90,000 57,711 32,289
Total Expenditures 90,000 90,000 57,711 32,289
Excess (Deficiency) of Revenues Over (Under) Expenditures (90,000) (90,000) (14,393) 75,607
Net Change in Fund Balances (90,000) (90,000) (14,393) 75,607
Fund Balances ‐ Beginning 92,230 92,230 92,230 ‐
Fund Balances ‐ Ending $ 2,230 2,230 77,837 75,607
Budgeted Amounts
105
This page is intentionally left blank.
106
DEBT SERVICE FUNDS
The Debt Service Funds are used to account for the accumulation of resources and payment ofgeneral obligation bond principal and interest from governmental resources and special assess-ment bond principal which are obligated in some manner for payment.
The City maintains the following six (6) debt service funds to accomplish the afore statedpurposes:
1. Debt Service Fund - This fund accounts for the payment of general obligationbonds.
2. Colony Park TIF Bond Debt - This fund accounts for the collections of taxincrement financing (TIF) distributions for payment of the Colony Park TIFbonds.
3. S. A. School Creek Intercept - This fund is used for the collection of the SpecialAssessments.
4. Avery Boulevard Special Assessment Bond Fund - This fund accounts for thecollection of Special Assessments Bonds.
5. TIF Bond Debt Lowes - This fund accounts for the collections for the TIF bonddebt Lowes.
6. Bonds Issued Fund - This fund accounts for payment for bond issuance fees.
107

City of Ridgeland Exhibit C‐4
Debt Service Fund
Debt Service Fund
Budgetary Comparison Schedule
For the year ended September 30, 2013
Variance with
Final Budget
Original Final Actual Positive (Negative)
Revenues:
Property taxes $ 3,369,124 3,369,124 3,367,866 (1,258)
Investment income 10,000 10,000 6,565 (3,435)
Intergovernmental programs 13,300 13,300 14,764 1,464
Total Revenues 3,392,424 3,392,424 3,389,195 (3,229)
Expenditures:
Debt Service:
Principal 3,368,085 3,368,085 3,153,885 214,200
Interest 968,117 968,117 763,555 204,562
Other 15,000 15,000 7,164 7,836
Total Expenditures 4,351,202 4,351,202 3,924,604 426,598
Excess (Deficiency) of Revenues Over (Under) Expenditures (958,778) (958,778) (535,409) 423,369
Other Financing Sources (Uses):
Transfers in 800,000 800,000 199 (799,801)
Total Other Financing Sources (Uses) 800,000 800,000 199 (799,801)
Net Change in Fund Balances (158,778) (158,778) (535,210) (376,432)
Fund Balances ‐ Beginning 275,422 275,422 275,422 ‐
Fund Balances ‐ Ending $ 116,644 116,644 (259,788) (376,432)
Budgeted Amounts
108
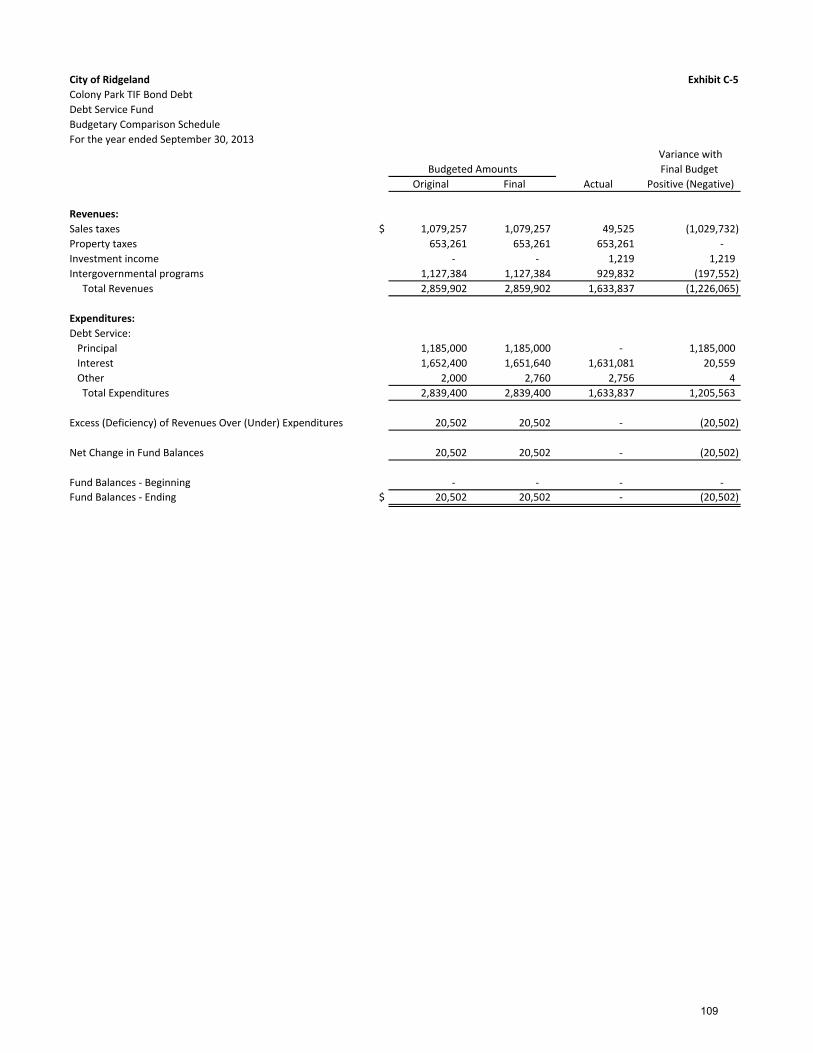
City of Ridgeland Exhibit C‐5
Colony Park TIF Bond Debt
Debt Service Fund
Budgetary Comparison Schedule
For the year ended September 30, 2013
Variance with
Final Budget
Original Final Actual Positive (Negative)
Revenues:
Sales taxes $ 1,079,257 1,079,257 49,525 (1,029,732)
Property taxes 653,261 653,261 653,261 ‐
Investment income ‐ ‐ 1,219 1,219
Intergovernmental programs 1,127,384 1,127,384 929,832 (197,552)
Total Revenues 2,859,902 2,859,902 1,633,837 (1,226,065)
Expenditures:
Debt Service:
Principal 1,185,000 1,185,000 ‐ 1,185,000
Interest 1,652,400 1,651,640 1,631,081 20,559
Other 2,000 2,760 2,756 4
Total Expenditures 2,839,400 2,839,400 1,633,837 1,205,563
Excess (Deficiency) of Revenues Over (Under) Expenditures 20,502 20,502 ‐ (20,502)
Net Change in Fund Balances 20,502 20,502 ‐ (20,502)
Fund Balances ‐ Beginning ‐ ‐ ‐ ‐
Fund Balances ‐ Ending $ 20,502 20,502 ‐ (20,502)
Budgeted Amounts
109

This page is intentionally left blank.
110

EXHIBIT C-6
CITY OF RIDGELANDCOMBINING BALANCE SHEET
NONMAJOR DEBT SERVICE FUNDS
SEPTEMBER 30, 2013
TotalNonmajor
DebtS.A. Avery Blvd TIF Bond Service
School Creek SA Bond Debt Funds (SeeIntercept Fund Lowes Exhibit C-1)
Assets:
Accounts receivable $ 65,170 $ -- $ -- $ 65,170Interfund receivable 433,199 422,070 -- 855,269
Tax increment financing receivable -- -- 3,062,232 3,062,232 Total Assets $ 498,369 $ 422,070 $ 3,062,232 $ 3,982,671
Liabilities and Fund Balances:
Liabilities:
Due to other funds $ 497,891 $ -- $ -- $ 497,891Interfund payables -- -- 468,780 468,780
Unearned revenue -- 422,070 -- 422,070Tax increment financing payable -- -- 2,593,452 2,593,452 Total Liabilities 497,891 422,070 3,062,232 3,982,193
Fund Balances:
Restricted
Debt service 478 -- -- 478
Total Fund Balances 478 -- -- 478
Total Liabilities and Fund Balances $ 498,369 $ 422,070 $ 3,062,232 $ 3,982,671
111

CITY OF RIDGELANDCOMBINING STATEMENT OF REVENUES, EXPENDITURES,
AND CHANGES IN FUND BALANCES
NONMAJOR DEBT SERVICE FUNDS
FOR THE YEAR ENDED SEPTEMBER 30, 2013
S.A. Avery Blvd
School Creek SA BondIntercept Fund
Revenues:
Sales taxes $ -- $ -- Property taxes -- --
Investment income 478 495
Special Assessments -- 42,621
Intergovernmental programs -- --Total Revenues 478 43,116
Expenditures:
Debt service:
Principal -- 35,000
Interest -- 7,366
Other -- 750
Total Expenditures -- 43,116
Excess (Deficiency) of Revenues Over (Under) Expenditures 478 --
Other Financing Sources (Uses):
Transfers out -- --
Total Other Financing Sources (Uses) -- --
Net Change in Fund Balances 478 --
Fund Balances - Beginning -- --Fund Balances - Ending $ 478 $ --
112
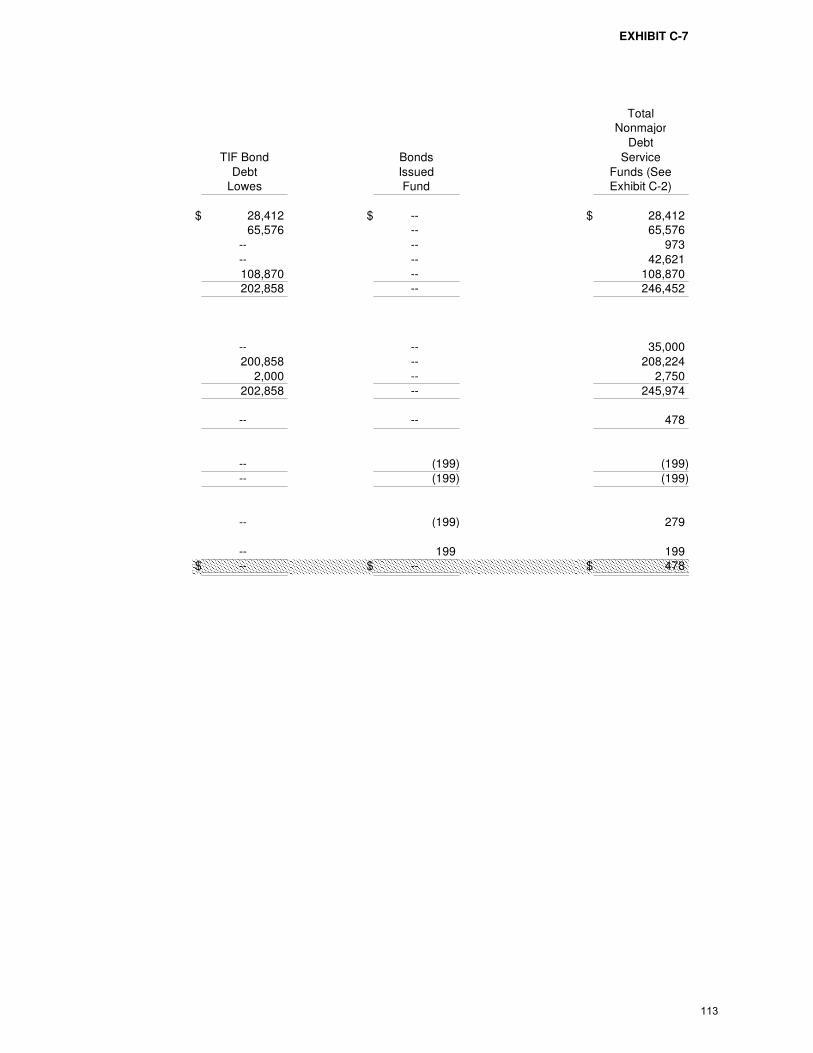
EXHIBIT C-7
TotalNonmajor
Debt
TIF Bond Bonds Service
Debt Issued Funds (SeeLowes Fund Exhibit C-2)
$ 28,412 $ -- $ 28,41265,576 -- 65,576
-- -- 973
-- -- 42,621
108,870 -- 108,870202,858 -- 246,452
-- -- 35,000
200,858 -- 208,224
2,000 -- 2,750
202,858 -- 245,974
-- -- 478
-- (199) (199)
-- (199) (199)
-- (199) 279
-- 199 199$ -- $ -- $ 478
113
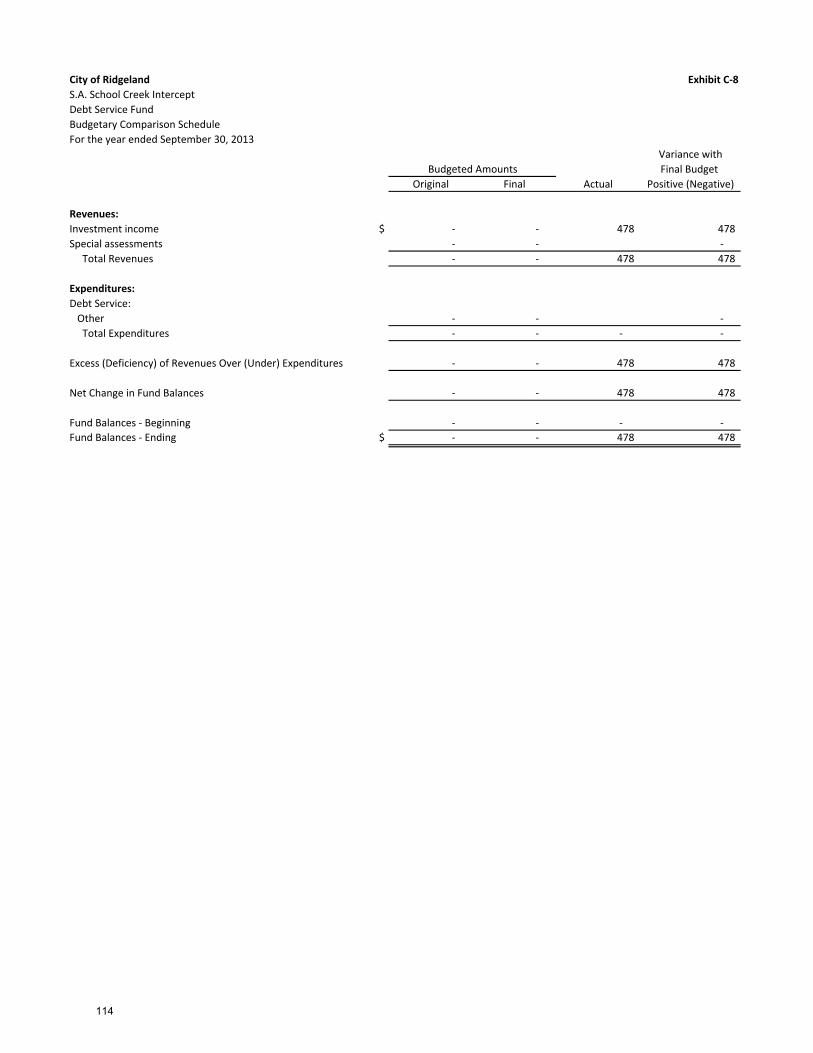
City of Ridgeland Exhibit C‐8
S.A. School Creek Intercept
Debt Service Fund
Budgetary Comparison Schedule
For the year ended September 30, 2013
Variance with
Final Budget
Original Final Actual Positive (Negative)
Revenues:
Investment income $ ‐ ‐ 478 478
Special assessments ‐ ‐ ‐
Total Revenues ‐ ‐ 478 478
Expenditures:
Debt Service:
Other ‐ ‐ ‐
Total Expenditures ‐ ‐ ‐ ‐
Excess (Deficiency) of Revenues Over (Under) Expenditures ‐ ‐ 478 478
Net Change in Fund Balances ‐ ‐ 478 478
Fund Balances ‐ Beginning ‐ ‐ ‐ ‐
Fund Balances ‐ Ending $ ‐ ‐ 478 478
Budgeted Amounts
114
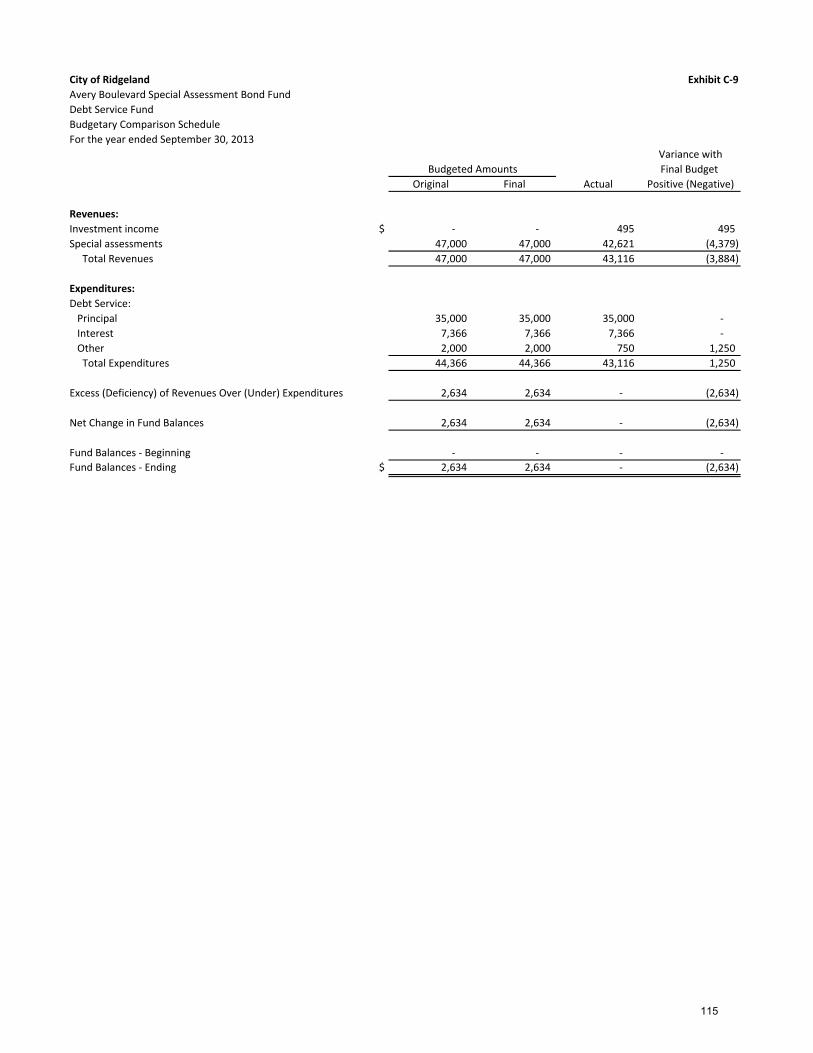
City of Ridgeland Exhibit C‐9
Avery Boulevard Special Assessment Bond Fund
Debt Service Fund
Budgetary Comparison Schedule
For the year ended September 30, 2013
Variance with
Final Budget
Original Final Actual Positive (Negative)
Revenues:
Investment income $ ‐ ‐ 495 495
Special assessments 47,000 47,000 42,621 (4,379)
Total Revenues 47,000 47,000 43,116 (3,884)
Expenditures:
Debt Service:
Principal 35,000 35,000 35,000 ‐
Interest 7,366 7,366 7,366 ‐
Other 2,000 2,000 750 1,250
Total Expenditures 44,366 44,366 43,116 1,250
Excess (Deficiency) of Revenues Over (Under) Expenditures 2,634 2,634 ‐ (2,634)
Net Change in Fund Balances 2,634 2,634 ‐ (2,634)
Fund Balances ‐ Beginning ‐ ‐ ‐ ‐
Fund Balances ‐ Ending $ 2,634 2,634 ‐ (2,634)
Budgeted Amounts
115

City of Ridgeland Exhibit C‐10
TIF Bond Debt Lowes
Debt Service Fund
Budgetary Comparison Schedule
For the year ended September 30, 2013
Variance with
Final Budget
Original Final Actual Positive (Negative)
Revenues:
Sales taxes $ 320,182 320,182 28,412 (291,770)
Property taxes 80,200 80,200 65,576 (14,624)
Intergovernmental programs 260,000 260,000 108,870 (151,130)
Total Revenues 660,382 660,382 202,858 (457,524)
Expenditures:
Debt Service:
Principal 477,800 477,800 ‐ 477,800
Interest 200,858 200,858 200,858 ‐
Other 2,000 2,000 2,000 ‐
Total Expenditures 680,658 680,658 202,858 477,800
Excess (Deficiency) of Revenues Over (Under) Expenditures (20,276) (20,276) ‐ 20,276
Net Change in Fund Balances (20,276) (20,276) ‐ 20,276
Fund Balances ‐ Beginning ‐ ‐ ‐ ‐
Fund Balances ‐ Ending $ (20,276) (20,276) ‐ 20,276
Budgeted Amounts
116
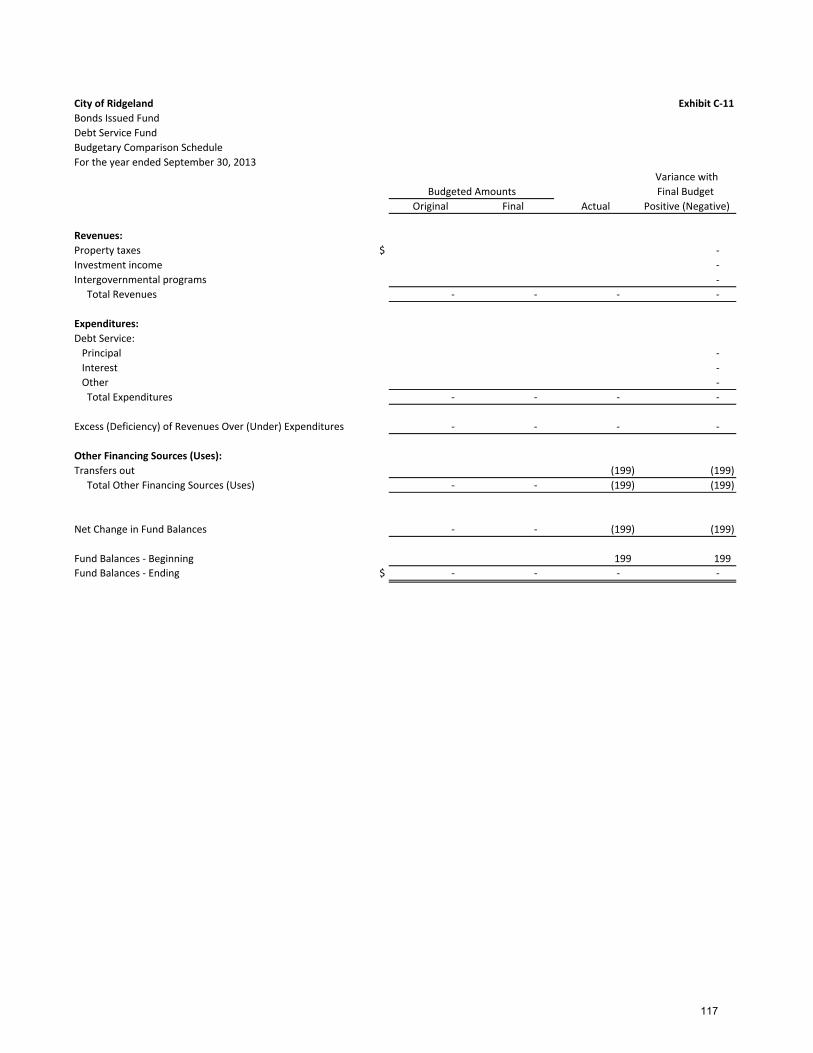
City of Ridgeland Exhibit C‐11
Bonds Issued Fund
Debt Service Fund
Budgetary Comparison Schedule
For the year ended September 30, 2013
Variance with
Final Budget
Original Final Actual Positive (Negative)
Revenues:
Property taxes $ ‐
Investment income ‐
Intergovernmental programs ‐
Total Revenues ‐ ‐ ‐ ‐
Expenditures:
Debt Service:
Principal ‐
Interest ‐
Other ‐
Total Expenditures ‐ ‐ ‐ ‐
Excess (Deficiency) of Revenues Over (Under) Expenditures ‐ ‐ ‐ ‐
Other Financing Sources (Uses):
Transfers out (199) (199)
Total Other Financing Sources (Uses) ‐ ‐ (199) (199)
Net Change in Fund Balances ‐ ‐ (199) (199)
Fund Balances ‐ Beginning 199 199
Fund Balances ‐ Ending $ ‐ ‐ ‐ ‐
Budgeted Amounts
117

This page is intentionally left blank.
118
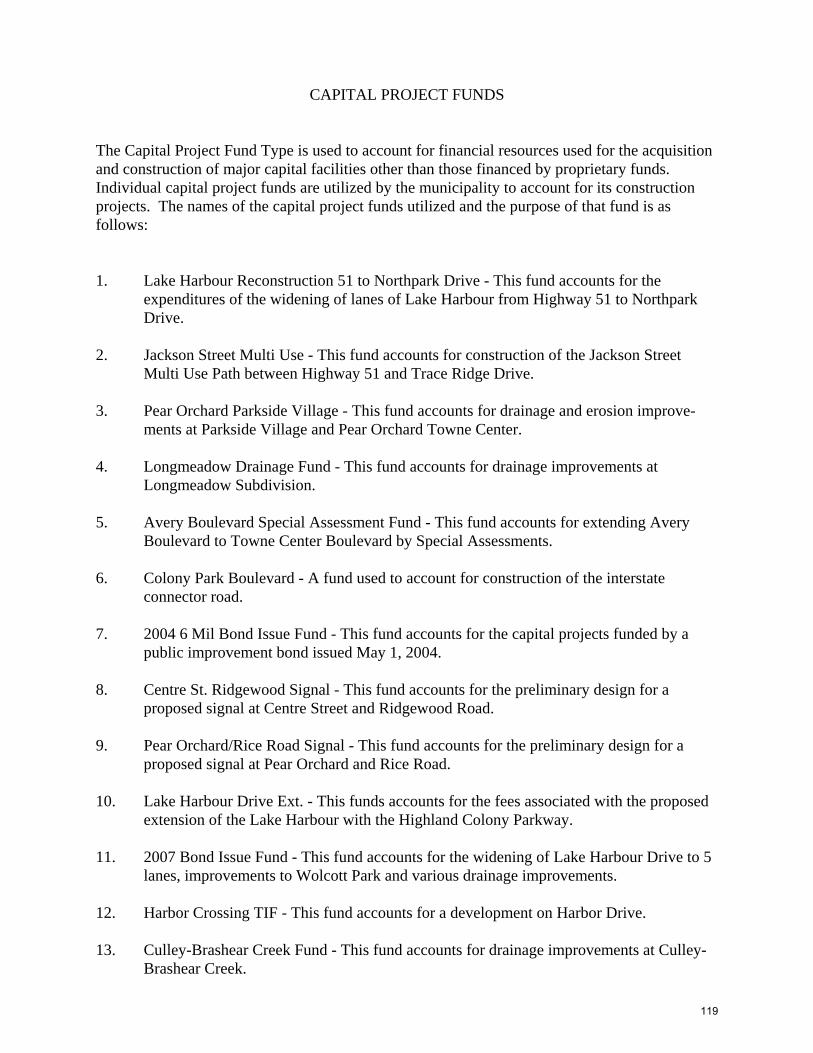
CAPITAL PROJECT FUNDS
The Capital Project Fund Type is used to account for financial resources used for the acquisitionand construction of major capital facilities other than those financed by proprietary funds.Individual capital project funds are utilized by the municipality to account for its constructionprojects. The names of the capital project funds utilized and the purpose of that fund is asfollows:
1. Lake Harbour Reconstruction 51 to Northpark Drive - This fund accounts for theexpenditures of the widening of lanes of Lake Harbour from Highway 51 to NorthparkDrive.
2. Jackson Street Multi Use - This fund accounts for construction of the Jackson StreetMulti Use Path between Highway 51 and Trace Ridge Drive.
3. Pear Orchard Parkside Village - This fund accounts for drainage and erosion improve-ments at Parkside Village and Pear Orchard Towne Center.
4. Longmeadow Drainage Fund - This fund accounts for drainage improvements atLongmeadow Subdivision.
5. Avery Boulevard Special Assessment Fund - This fund accounts for extending AveryBoulevard to Towne Center Boulevard by Special Assessments.
6. Colony Park Boulevard - A fund used to account for construction of the interstateconnector road.
7. 2004 6 Mil Bond Issue Fund - This fund accounts for the capital projects funded by apublic improvement bond issued May 1, 2004.
8. Centre St. Ridgewood Signal - This fund accounts for the preliminary design for aproposed signal at Centre Street and Ridgewood Road.
9. Pear Orchard/Rice Road Signal - This fund accounts for the preliminary design for aproposed signal at Pear Orchard and Rice Road.
10. Lake Harbour Drive Ext. - This funds accounts for the fees associated with the proposedextension of the Lake Harbour with the Highland Colony Parkway.
11. 2007 Bond Issue Fund - This fund accounts for the widening of Lake Harbour Drive to 5lanes, improvements to Wolcott Park and various drainage improvements.
12. Harbor Crossing TIF - This fund accounts for a development on Harbor Drive.
13. Culley-Brashear Creek Fund - This fund accounts for drainage improvements at Culley-Brashear Creek.
119

14. City Center Fund - This fund accounts for the acquisition of land to build the new CityHall/City Center.
15. Universal DES Playground Fund - This fund accounts for the playground project atFreedom Ridge Park. This project is funded by CDBG funds.
16. Craft Center Parking Lot Fund - This fund accounts for the parking lot project at the MSCraft Center.
17. 5.7 Mil Bond Issue Fund - This fund accounts for the capital projects funded by a publicimprovement bond issued May 31, 2011.
18. Rice Road Trail Head Improvements - This fund accounts for the project to build acovered pavilion with restrooms, picnic tables and a bike repair station at the multi usetrail head.
120
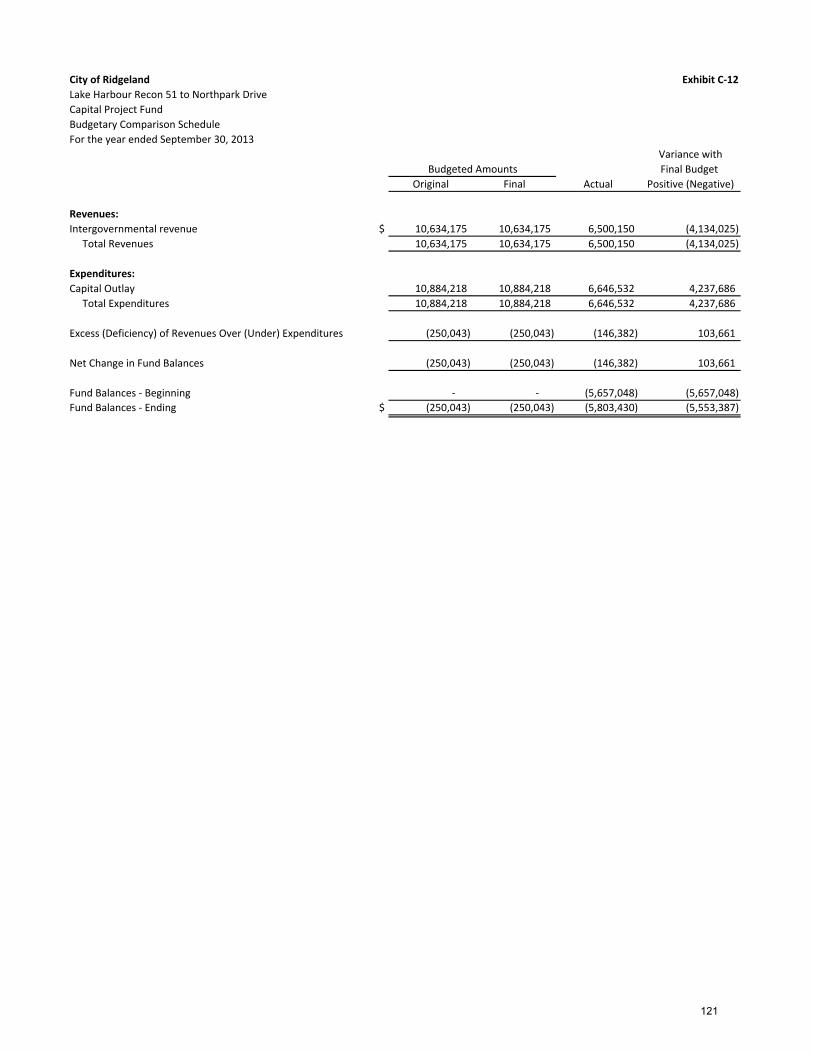
City of Ridgeland Exhibit C‐12
Lake Harbour Recon 51 to Northpark Drive
Capital Project Fund
Budgetary Comparison Schedule
For the year ended September 30, 2013
Variance with
Final Budget
Original Final Actual Positive (Negative)
Revenues:
Intergovernmental revenue $ 10,634,175 10,634,175 6,500,150 (4,134,025)
Total Revenues 10,634,175 10,634,175 6,500,150 (4,134,025)
Expenditures:
Capital Outlay 10,884,218 10,884,218 6,646,532 4,237,686
Total Expenditures 10,884,218 10,884,218 6,646,532 4,237,686
Excess (Deficiency) of Revenues Over (Under) Expenditures (250,043) (250,043) (146,382) 103,661
Net Change in Fund Balances (250,043) (250,043) (146,382) 103,661
Fund Balances ‐ Beginning ‐ ‐ (5,657,048) (5,657,048)
Fund Balances ‐ Ending $ (250,043) (250,043) (5,803,430) (5,553,387)
Budgeted Amounts
121
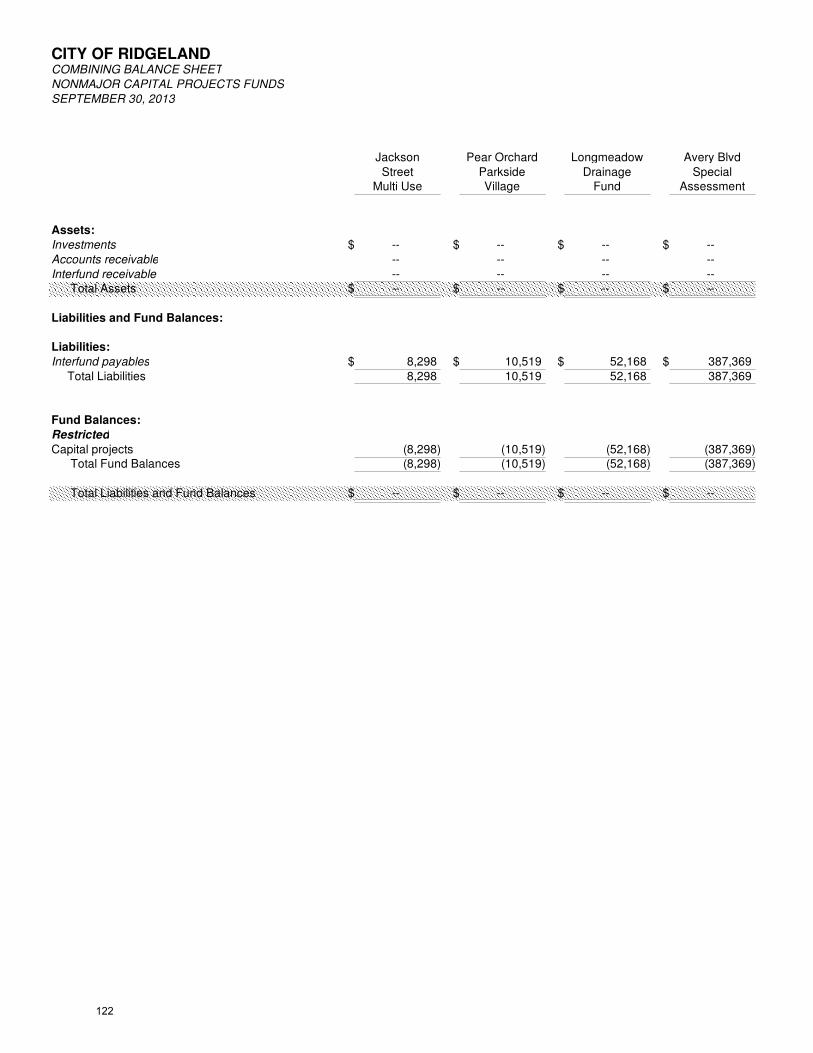
CITY OF RIDGELANDCOMBINING BALANCE SHEET
NONMAJOR CAPITAL PROJECTS FUNDS
SEPTEMBER 30, 2013
Jackson Pear Orchard Longmeadow Avery Blvd
Street Parkside Drainage SpecialMulti Use Village Fund Assessment
Assets:
Investments $ -- $ -- $ -- $ --
Accounts receivable -- -- -- --
Interfund receivable -- -- -- -- Total Assets $ -- $ -- $ -- $ --
Liabilities and Fund Balances:
Liabilities:
Interfund payables $ 8,298 $ 10,519 $ 52,168 $ 387,369
Total Liabilities 8,298 10,519 52,168 387,369
Fund Balances:
Restricted
Capital projects (8,298) (10,519) (52,168) (387,369) Total Fund Balances (8,298) (10,519) (52,168) (387,369)
Total Liabilities and Fund Balances $ -- $ -- $ -- $ --
122
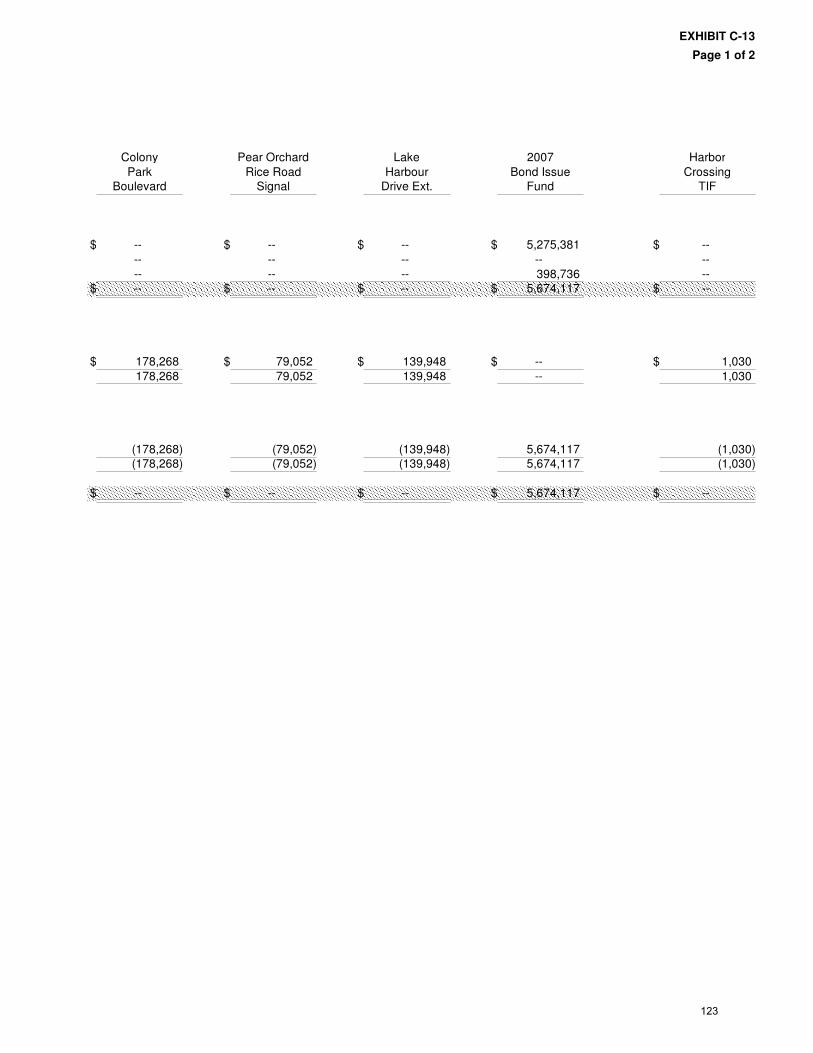
EXHIBIT C-13
Page 1 of 2
Colony Pear Orchard Lake 2007 Harbor
Park Rice Road Harbour Bond Issue CrossingBoulevard Signal Drive Ext. Fund TIF
$ -- $ -- $ -- $ 5,275,381 $ --
-- -- -- -- --
-- -- -- 398,736 --$ -- $ -- $ -- $ 5,674,117 $ --
$ 178,268 $ 79,052 $ 139,948 $ -- $ 1,030
178,268 79,052 139,948 -- 1,030
(178,268) (79,052) (139,948) 5,674,117 (1,030)(178,268) (79,052) (139,948) 5,674,117 (1,030)
$ -- $ -- $ -- $ 5,674,117 $ --
123
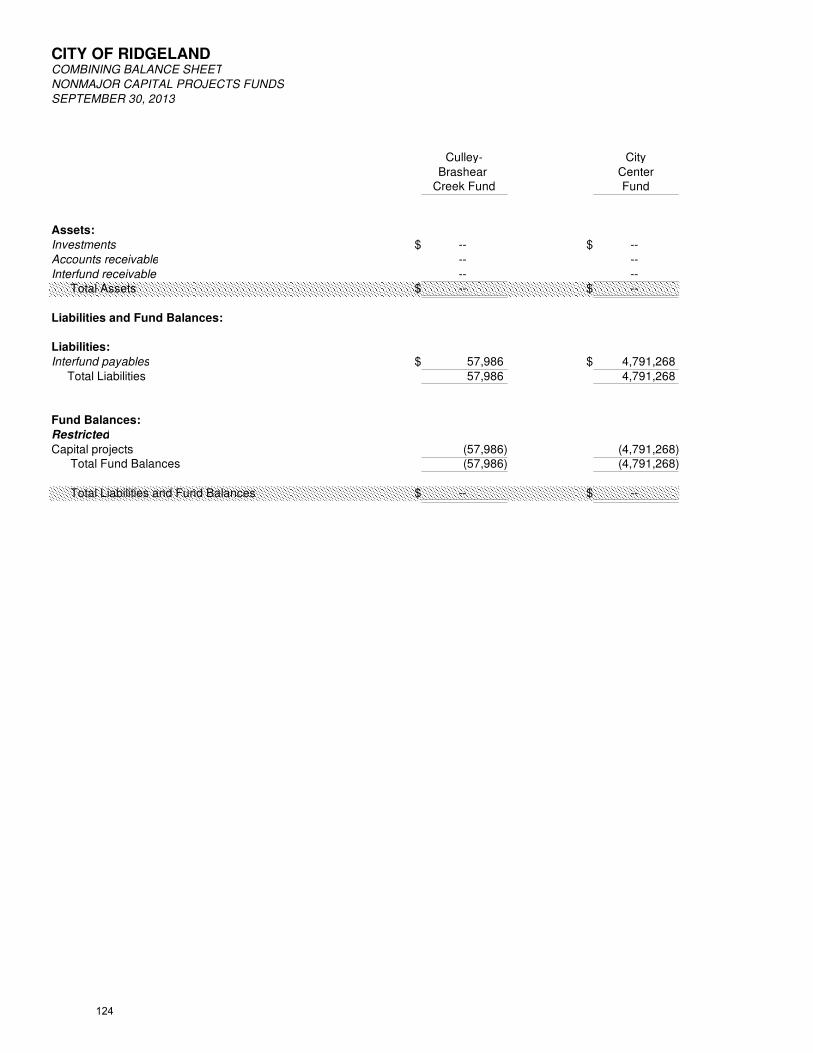
CITY OF RIDGELANDCOMBINING BALANCE SHEET
NONMAJOR CAPITAL PROJECTS FUNDS
SEPTEMBER 30, 2013
Culley- City
Brashear CenterCreek Fund Fund
Assets:
Investments $ -- $ --
Accounts receivable -- --
Interfund receivable -- -- Total Assets $ -- $ --
Liabilities and Fund Balances:
Liabilities:
Interfund payables $ 57,986 $ 4,791,268
Total Liabilities 57,986 4,791,268
Fund Balances:
Restricted
Capital projects (57,986) (4,791,268) Total Fund Balances (57,986) (4,791,268)
Total Liabilities and Fund Balances $ -- $ --
124
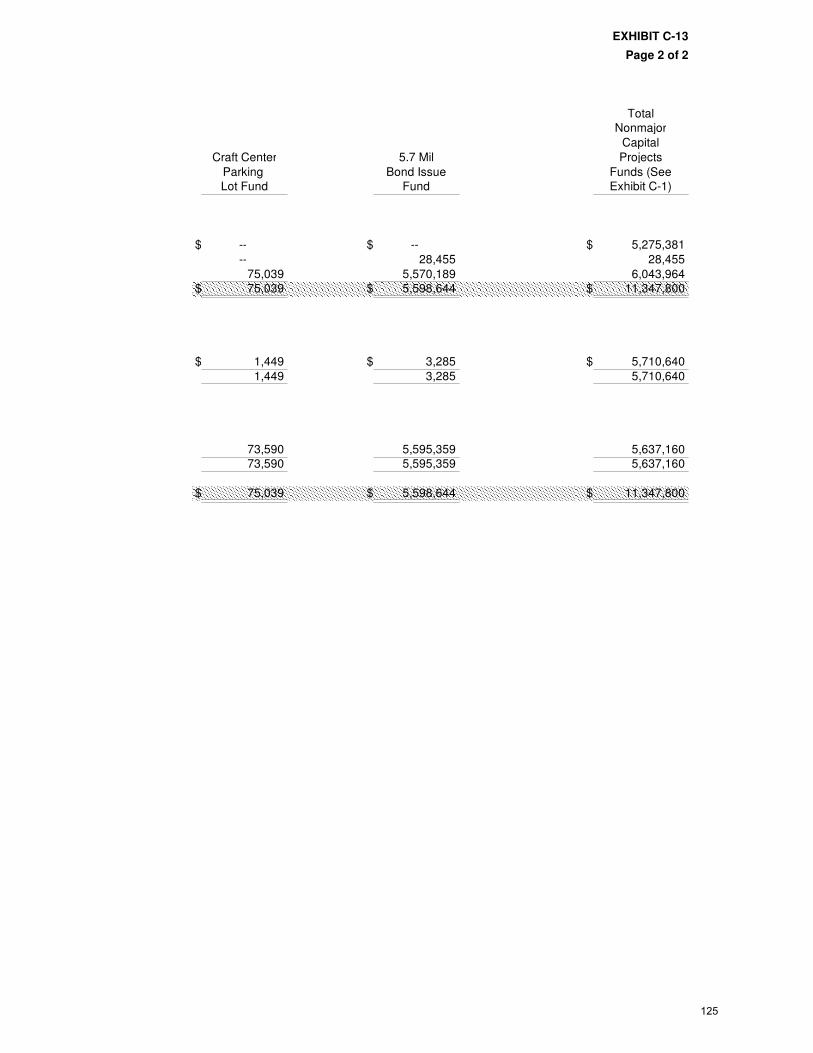
EXHIBIT C-13
Page 2 of 2
TotalNonmajor
Capital
Craft Center 5.7 Mil Projects
Parking Bond Issue Funds (SeeLot Fund Fund Exhibit C-1)
$ -- $ -- $ 5,275,381
-- 28,455 28,455
75,039 5,570,189 6,043,964$ 75,039 $ 5,598,644 $ 11,347,800
$ 1,449 $ 3,285 $ 5,710,640
1,449 3,285 5,710,640
73,590 5,595,359 5,637,16073,590 5,595,359 5,637,160
$ 75,039 $ 5,598,644 $ 11,347,800
125

CITY OF RIDGELANDCOMBINING STATEMENT OF REVENUES, EXPENDITURES,
AND CHANGES IN FUND BALANCES
NONMAJOR CAPITAL PROJECTS FUNDS
FOR THE YEAR ENDED SEPTEMBER 30, 2013
Jackson Pear Orchard Longmeadow Avery Blvd
Street Parkside Drainage SpecialMulti Use Village Fund Assessment
Revenues:
Investment income $ -- $ -- $ -- $ -- Unrealized gain/loss on investments -- -- -- --
Intergovernmental programs -- -- -- --
Total Revenues -- -- -- --
Expenditures:
Capital outlay 8,298 10,519 -- --
Total Expenditures 8,298 10,519 -- --
Excess (Deficiency) of Revenues Over (Under) Expenditures (8,298) (10,519) -- --
Other Financing Sources (Uses):
Transfers in -- -- -- -- Transfers out -- -- -- --
Total Other Financing Sources (Uses) -- -- -- --
Net Change in Fund Balances (8,298) (10,519) -- --
Fund Balances - Beginning -- -- (52,168) (387,369)Fund Balances - Ending $ (8,298) $ (10,519) $ (52,168) $ (387,369)
126

EXHIBIT C-14
Page 1 of 2
Colony 2004 Centre St. Pear Orchard Lake
Park 6 Mil Bond Ridgewood Rice Road HarbourBoulevard Issue Fund Signal Signal Drive Ext.
$ -- $ 336 $ -- $ -- $ ---- -- -- -- --
-- -- -- 51,440 214,833
-- 336 -- 51,440 214,833
169,648 -- -- -- 269,770
169,648 -- -- -- 269,770
(169,648) 336 -- 51,440 (54,937)
-- -- 154,065 150,077 ---- (304,142) -- -- --
-- (304,142) 154,065 150,077 --
(169,648) (303,806) 154,065 201,517 (54,937)
(8,620) 303,806 (154,065) (280,569) (85,011)$ (178,268) $ -- $ -- $ (79,052) $ (139,948)
127

CITY OF RIDGELANDCOMBINING STATEMENT OF REVENUES, EXPENDITURES,
AND CHANGES IN FUND BALANCES
NONMAJOR CAPITAL PROJECTS FUNDS
FOR THE YEAR ENDED SEPTEMBER 30, 2013
2007 Harbor Culley- City
Bond Issue Crossing Brashear CenterFund TIF Creek Fund Fund
Revenues:
Investment income $ -- $ -- $ -- $ -- Unrealized gain/loss on investments (211,068) -- -- --
Intergovernmental programs -- -- -- --
Total Revenues (211,068) -- -- --
Expenditures:
Capital outlay -- -- -- 204,635
Total Expenditures -- -- -- 204,635
Excess (Deficiency) of Revenues Over (Under) Expenditures (211,068) -- -- (204,635)
Other Financing Sources (Uses):
Transfers in -- -- -- -- Transfers out -- -- -- --
Total Other Financing Sources (Uses) -- -- -- --
Net Change in Fund Balances (211,068) -- -- (204,635)
Fund Balances - Beginning 5,885,185 (1,030) (57,986) (4,586,633)Fund Balances - Ending $ 5,674,117 $ (1,030) $ (57,986) $ (4,791,268)
128
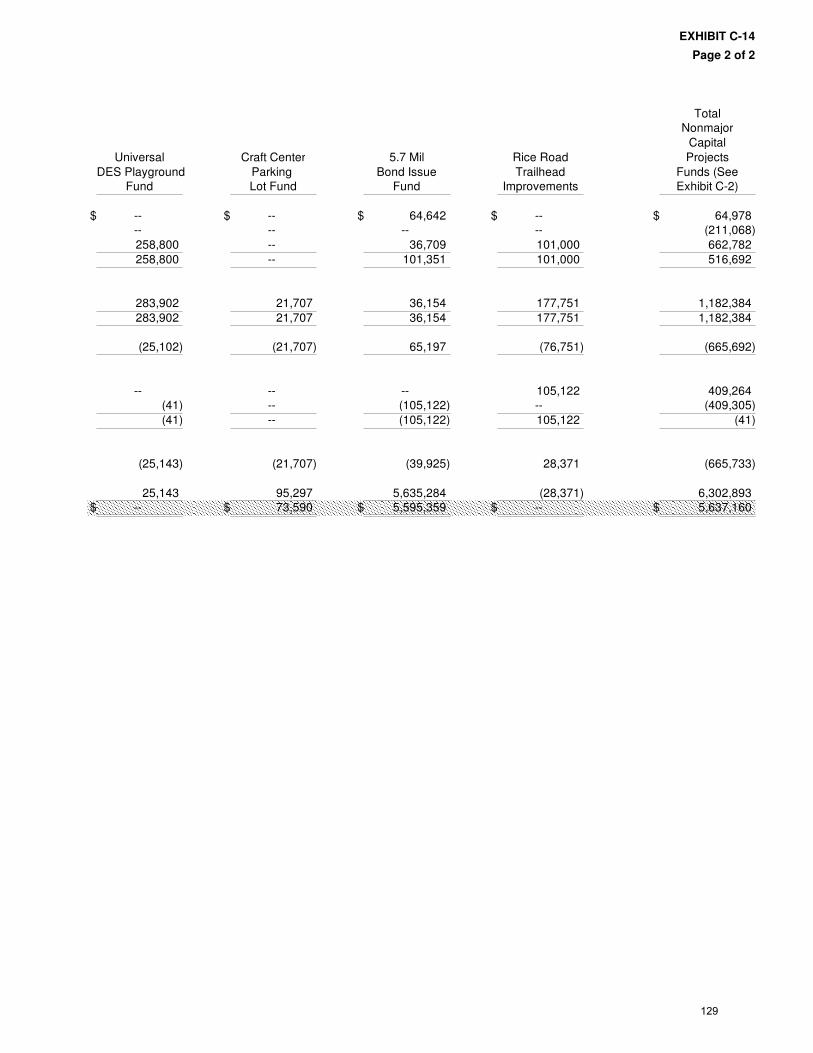
EXHIBIT C-14
Page 2 of 2
TotalNonmajor
Capital
Universal Craft Center 5.7 Mil Rice Road Projects
DES Playground Parking Bond Issue Trailhead Funds (SeeFund Lot Fund Fund Improvements Exhibit C-2)
$ -- $ -- $ 64,642 $ -- $ 64,978-- -- -- -- (211,068)
258,800 -- 36,709 101,000 662,782
258,800 -- 101,351 101,000 516,692
283,902 21,707 36,154 177,751 1,182,384
283,902 21,707 36,154 177,751 1,182,384
(25,102) (21,707) 65,197 (76,751) (665,692)
-- -- -- 105,122 409,264(41) -- (105,122) -- (409,305)
(41) -- (105,122) 105,122 (41)
(25,143) (21,707) (39,925) 28,371 (665,733)
25,143 95,297 5,635,284 (28,371) 6,302,893$ -- $ 73,590 $ 5,595,359 $ -- $ 5,637,160
129

City of Ridgeland Exhibit C‐15
Jackson Street Multi Use
Capital Project Fund
Budgetary Comparison Schedule
For the year ended September 30, 2013
Variance with
Final Budget
Original Final Actual Positive (Negative)
Revenues:
Total Revenues ‐ ‐ ‐ ‐
Expenditures:
Capital Outlay ‐ 23,300 8,298 15,002
Total Expenditures ‐ 23,300 8,298 15,002
Excess (Deficiency) of Revenues Over (Under) Expenditures ‐ (23,300) (8,298) 15,002
Net Change in Fund Balances ‐ (23,300) (8,298) 15,002
Fund Balances ‐ Beginning ‐ ‐ ‐ ‐
Fund Balances ‐ Ending $ ‐ (23,300) (8,298) 15,002
Budgeted Amounts
130

City of Ridgeland Exhibit C‐16
Pear Orchard Parkside Village
Capital Project Fund
Budgetary Comparison Schedule
For the year ended September 30, 2013
Variance with
Final Budget
Original Final Actual Positive (Negative)
Revenues:
Total Revenues ‐ ‐ ‐ ‐
Expenditures:
Capital Outlay ‐ 25,300 10,519 14,781
Total Expenditures ‐ 25,300 10,519 14,781
Excess (Deficiency) of Revenues Over (Under) Expenditures ‐ (25,300) (10,519) 14,781
Net Change in Fund Balances ‐ (25,300) (10,519) 14,781
Fund Balances ‐ Beginning ‐ ‐ ‐ ‐
Fund Balances ‐ Ending $ ‐ (25,300) (10,519) 14,781
Budgeted Amounts
131
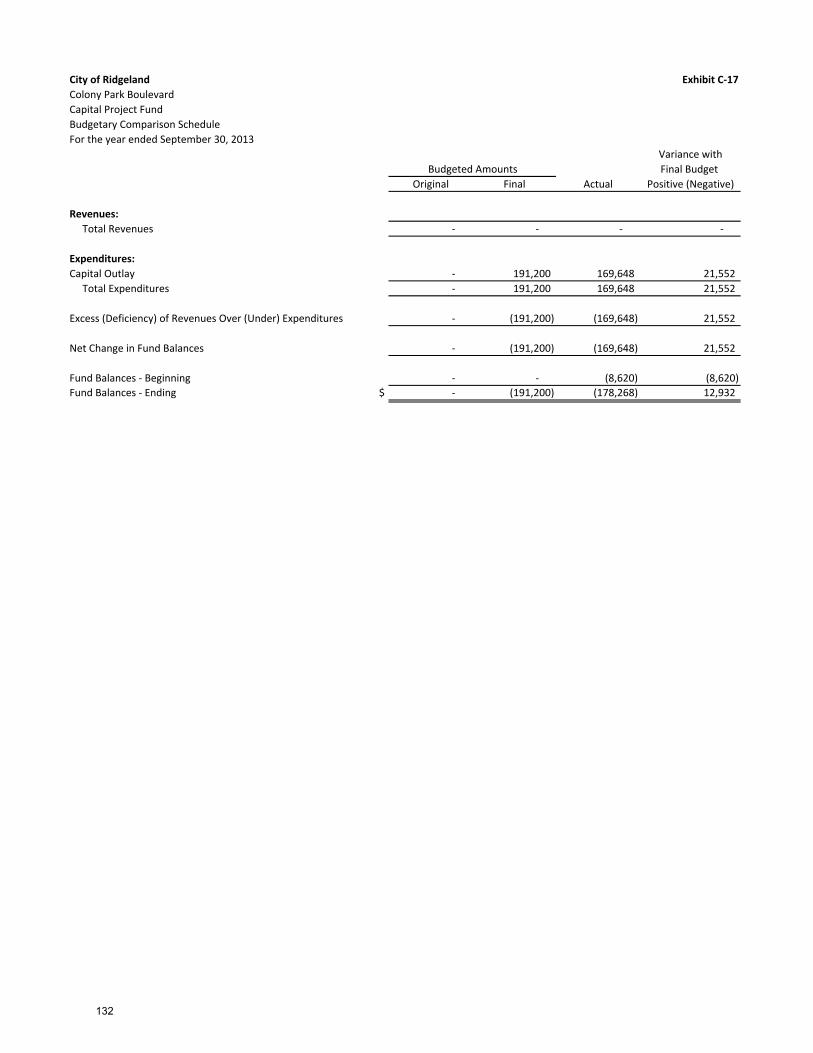
City of Ridgeland Exhibit C‐17
Colony Park Boulevard
Capital Project Fund
Budgetary Comparison Schedule
For the year ended September 30, 2013
Variance with
Final Budget
Original Final Actual Positive (Negative)
Revenues:
Total Revenues ‐ ‐ ‐ ‐
Expenditures:
Capital Outlay ‐ 191,200 169,648 21,552
Total Expenditures ‐ 191,200 169,648 21,552
Excess (Deficiency) of Revenues Over (Under) Expenditures ‐ (191,200) (169,648) 21,552
Net Change in Fund Balances ‐ (191,200) (169,648) 21,552
Fund Balances ‐ Beginning ‐ ‐ (8,620) (8,620)
Fund Balances ‐ Ending $ ‐ (191,200) (178,268) 12,932
Budgeted Amounts
132
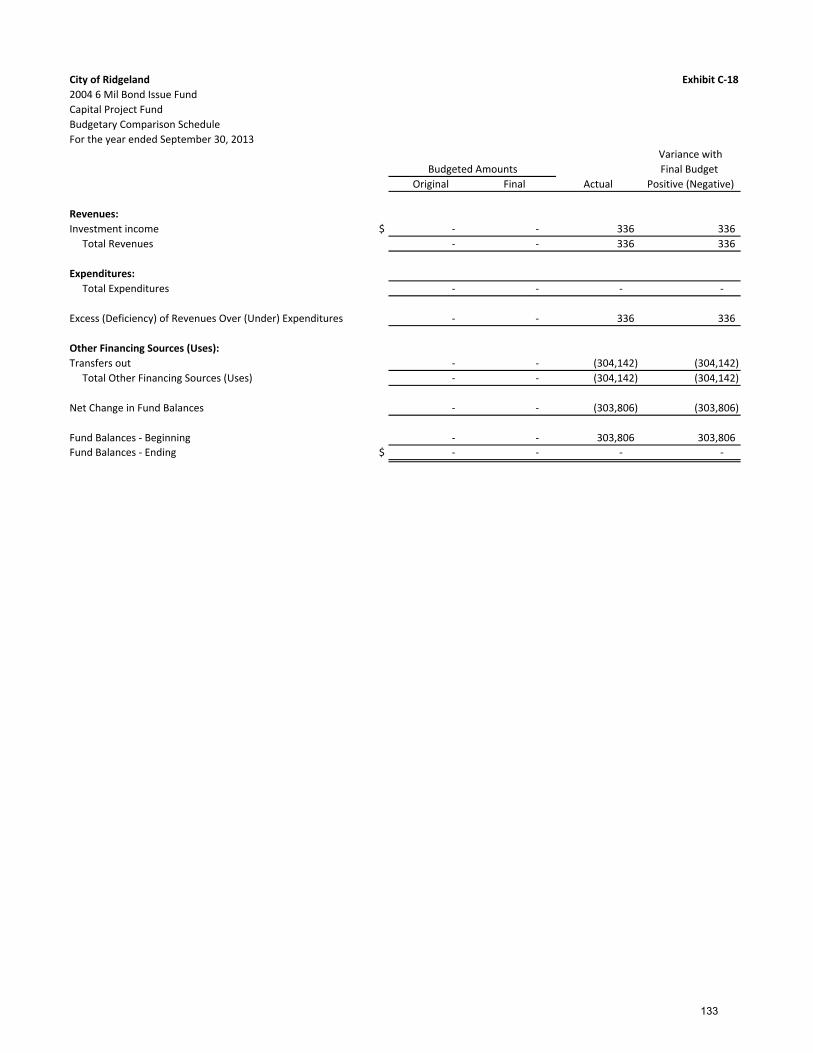
City of Ridgeland Exhibit C‐18
2004 6 Mil Bond Issue Fund
Capital Project Fund
Budgetary Comparison Schedule
For the year ended September 30, 2013
Variance with
Final Budget
Original Final Actual Positive (Negative)
Revenues:
Investment income $ ‐ ‐ 336 336
Total Revenues ‐ ‐ 336 336
Expenditures:
Total Expenditures ‐ ‐ ‐ ‐
Excess (Deficiency) of Revenues Over (Under) Expenditures ‐ ‐ 336 336
Other Financing Sources (Uses):
Transfers out ‐ ‐ (304,142) (304,142)
Total Other Financing Sources (Uses) ‐ ‐ (304,142) (304,142)
Net Change in Fund Balances ‐ ‐ (303,806) (303,806)
Fund Balances ‐ Beginning ‐ ‐ 303,806 303,806
Fund Balances ‐ Ending $ ‐ ‐ ‐ ‐
Budgeted Amounts
133
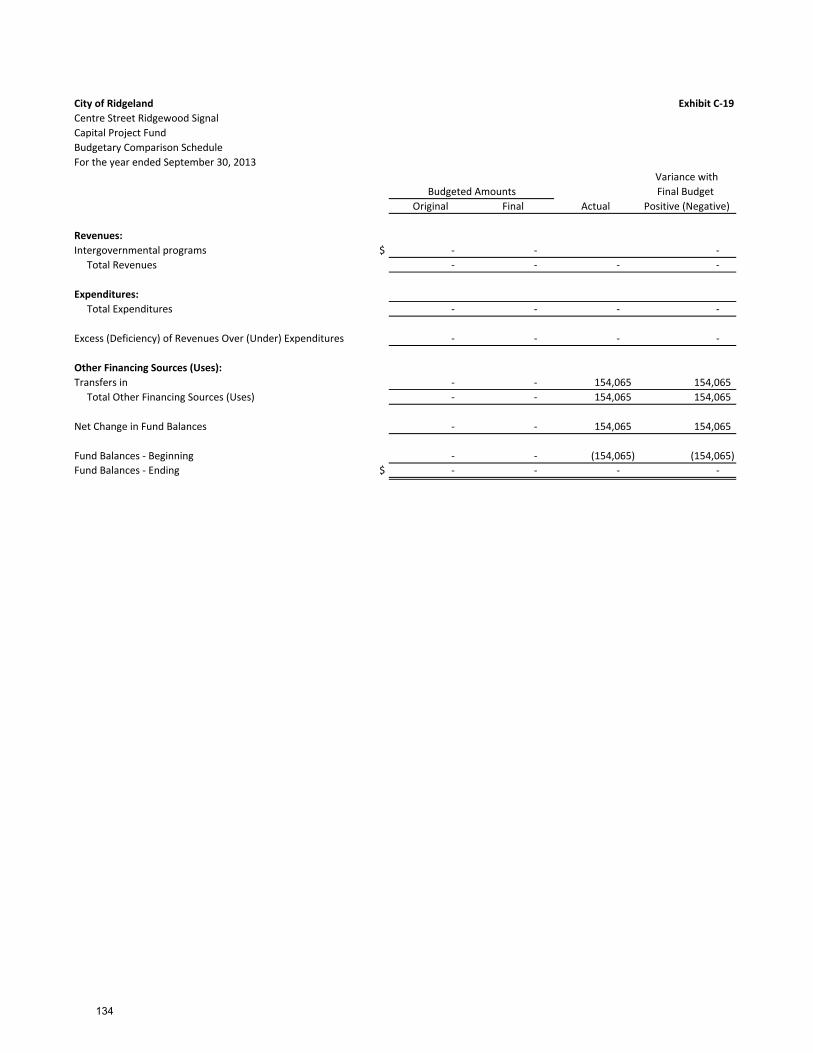
City of Ridgeland Exhibit C‐19
Centre Street Ridgewood Signal
Capital Project Fund
Budgetary Comparison Schedule
For the year ended September 30, 2013
Variance with
Final Budget
Original Final Actual Positive (Negative)
Revenues:
Intergovernmental programs $ ‐ ‐ ‐
Total Revenues ‐ ‐ ‐ ‐
Expenditures:
Total Expenditures ‐ ‐ ‐ ‐
Excess (Deficiency) of Revenues Over (Under) Expenditures ‐ ‐ ‐ ‐
Other Financing Sources (Uses):
Transfers in ‐ ‐ 154,065 154,065
Total Other Financing Sources (Uses) ‐ ‐ 154,065 154,065
Net Change in Fund Balances ‐ ‐ 154,065 154,065
Fund Balances ‐ Beginning ‐ ‐ (154,065) (154,065)
Fund Balances ‐ Ending $ ‐ ‐ ‐ ‐
Budgeted Amounts
134
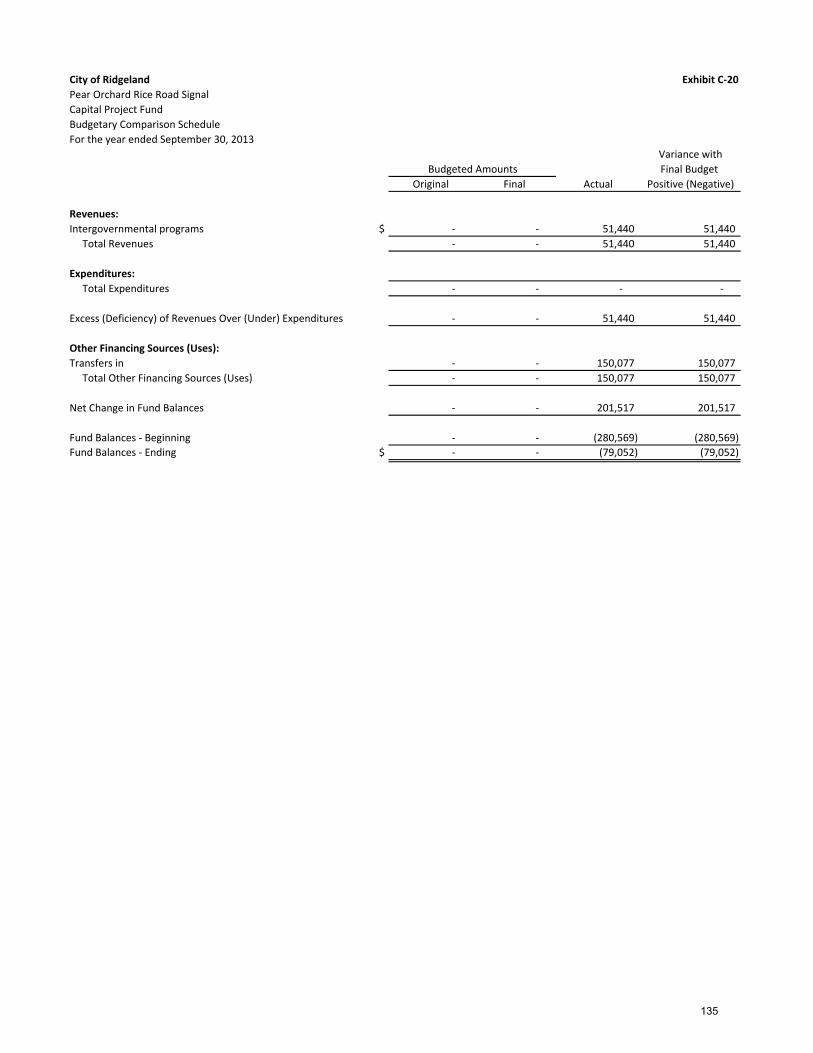
City of Ridgeland Exhibit C‐20
Pear Orchard Rice Road Signal
Capital Project Fund
Budgetary Comparison Schedule
For the year ended September 30, 2013
Variance with
Final Budget
Original Final Actual Positive (Negative)
Revenues:
Intergovernmental programs $ ‐ ‐ 51,440 51,440
Total Revenues ‐ ‐ 51,440 51,440
Expenditures:
Total Expenditures ‐ ‐ ‐ ‐
Excess (Deficiency) of Revenues Over (Under) Expenditures ‐ ‐ 51,440 51,440
Other Financing Sources (Uses):
Transfers in ‐ ‐ 150,077 150,077
Total Other Financing Sources (Uses) ‐ ‐ 150,077 150,077
Net Change in Fund Balances ‐ ‐ 201,517 201,517
Fund Balances ‐ Beginning ‐ ‐ (280,569) (280,569)
Fund Balances ‐ Ending $ ‐ ‐ (79,052) (79,052)
Budgeted Amounts
135
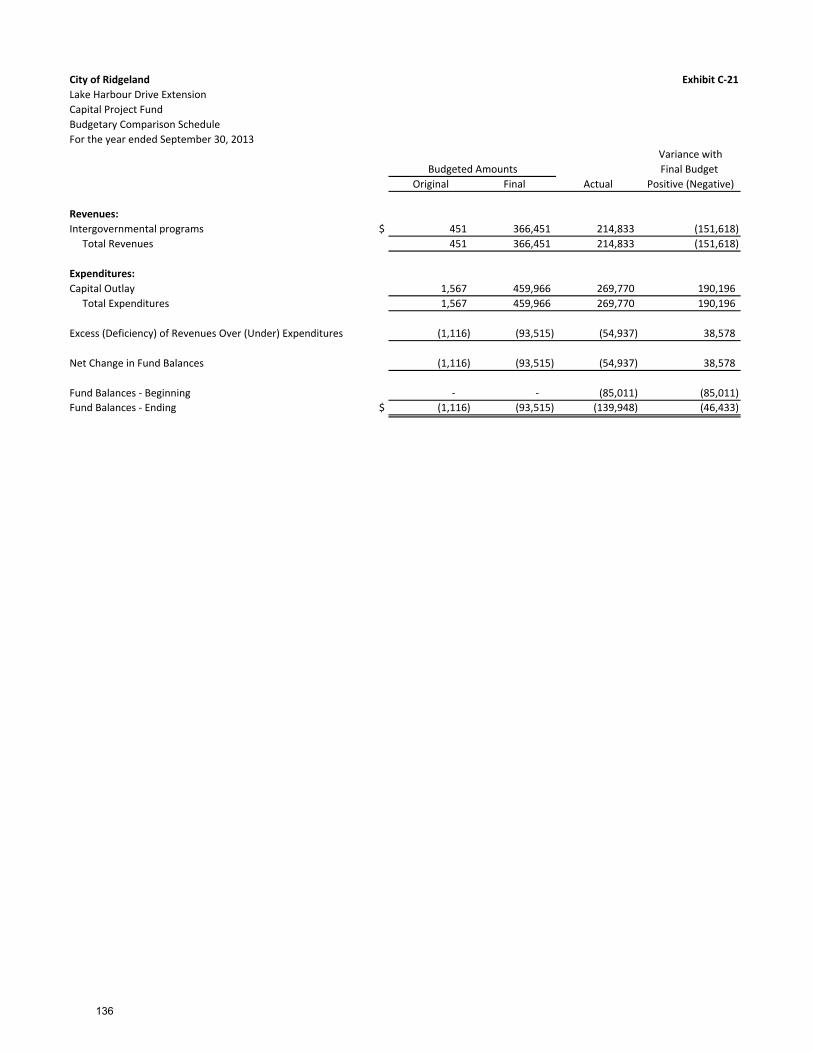
City of Ridgeland Exhibit C‐21
Lake Harbour Drive Extension
Capital Project Fund
Budgetary Comparison Schedule
For the year ended September 30, 2013
Variance with
Final Budget
Original Final Actual Positive (Negative)
Revenues:
Intergovernmental programs $ 451 366,451 214,833 (151,618)
Total Revenues 451 366,451 214,833 (151,618)
Expenditures:
Capital Outlay 1,567 459,966 269,770 190,196
Total Expenditures 1,567 459,966 269,770 190,196
Excess (Deficiency) of Revenues Over (Under) Expenditures (1,116) (93,515) (54,937) 38,578
Net Change in Fund Balances (1,116) (93,515) (54,937) 38,578
Fund Balances ‐ Beginning ‐ ‐ (85,011) (85,011)
Fund Balances ‐ Ending $ (1,116) (93,515) (139,948) (46,433)
Budgeted Amounts
136

City of Ridgeland Exhibit C‐22
2007 Bond Issue Fund
Capital Project Fund
Budgetary Comparison Schedule
For the year ended September 30, 2013
Variance with
Final Budget
Original Final Actual Positive (Negative)
Revenues:
Unrealized gain/loss on investments $ ‐ ‐ (211,068) (211,068)
Total Revenues ‐ ‐ (211,068) (211,068)
Expenditures:
Capital Outlay ‐
Total Expenditures ‐ ‐ ‐ ‐
Excess (Deficiency) of Revenues Over (Under) Expenditures ‐ ‐ (211,068) (211,068)
Net Change in Fund Balances ‐ ‐ (211,068) (211,068)
Fund Balances ‐ Beginning ‐ ‐ 5,885,185 5,885,185
Fund Balances ‐ Ending $ ‐ ‐ 5,674,117 5,674,117
Budgeted Amounts
137
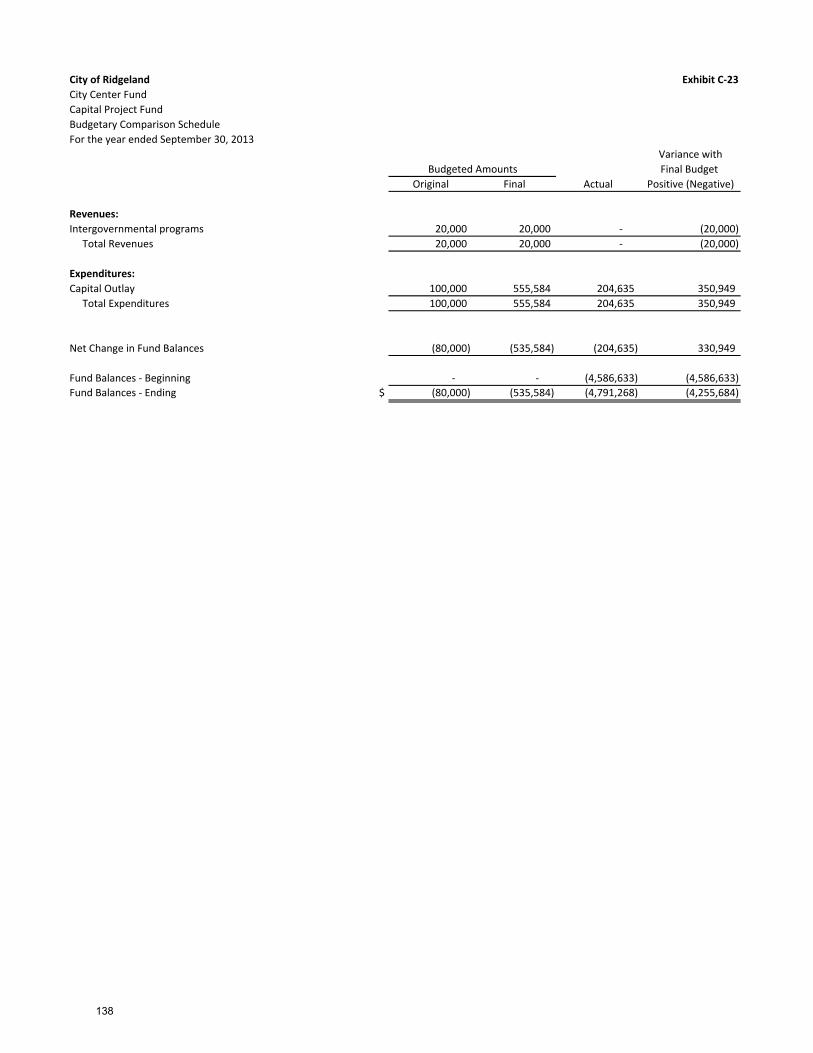
City of Ridgeland Exhibit C‐23
City Center Fund
Capital Project Fund
Budgetary Comparison Schedule
For the year ended September 30, 2013
Variance with
Final Budget
Original Final Actual Positive (Negative)
Revenues:
Intergovernmental programs 20,000 20,000 ‐ (20,000)
Total Revenues 20,000 20,000 ‐ (20,000)
Expenditures:
Capital Outlay 100,000 555,584 204,635 350,949
Total Expenditures 100,000 555,584 204,635 350,949
Net Change in Fund Balances (80,000) (535,584) (204,635) 330,949
Fund Balances ‐ Beginning ‐ ‐ (4,586,633) (4,586,633)
Fund Balances ‐ Ending $ (80,000) (535,584) (4,791,268) (4,255,684)
Budgeted Amounts
138

City of Ridgeland Exhibit C‐24
Universal DES Playground
Capital Project Fund
Budgetary Comparison Schedule
For the year ended September 30, 2013
Variance with
Final Budget
Original Final Actual Positive (Negative)
Revenues:
Intergovernmental programs ‐ 258,800 258,800 ‐
Total Revenues ‐ 258,800 258,800 ‐
Expenditures:
Capital Outlay ‐ 283,901 283,902 (1)
Total Expenditures ‐ 283,901 283,902 (1)
Excess (Deficiency) of Revenues Over (Under) Expenditures ‐ (25,101) (25,102) (1)
Other Financing Sources (Uses):
Transfers out ‐ ‐ (41) (41)
Total Other Financing Sources (Uses) ‐ ‐ (41) (41)
Net Change in Fund Balances ‐ (25,101) (25,143) (42)
Fund Balances ‐ Beginning ‐ ‐ 25,143 25,143
Fund Balances ‐ Ending $ ‐ (25,101) ‐ 25,101
Budgeted Amounts
139
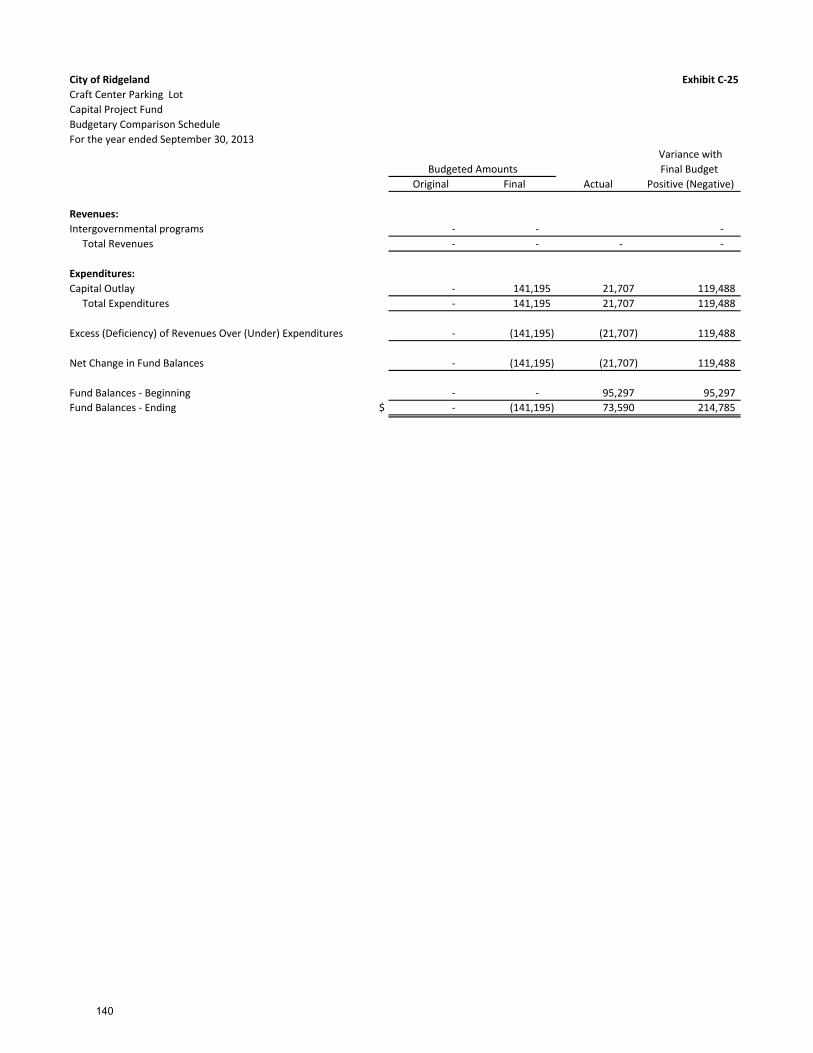
City of Ridgeland Exhibit C‐25
Craft Center Parking Lot
Capital Project Fund
Budgetary Comparison Schedule
For the year ended September 30, 2013
Variance with
Final Budget
Original Final Actual Positive (Negative)
Revenues:
Intergovernmental programs ‐ ‐ ‐
Total Revenues ‐ ‐ ‐ ‐
Expenditures:
Capital Outlay ‐ 141,195 21,707 119,488
Total Expenditures ‐ 141,195 21,707 119,488
Excess (Deficiency) of Revenues Over (Under) Expenditures ‐ (141,195) (21,707) 119,488
Net Change in Fund Balances ‐ (141,195) (21,707) 119,488
Fund Balances ‐ Beginning ‐ ‐ 95,297 95,297
Fund Balances ‐ Ending $ ‐ (141,195) 73,590 214,785
Budgeted Amounts
140
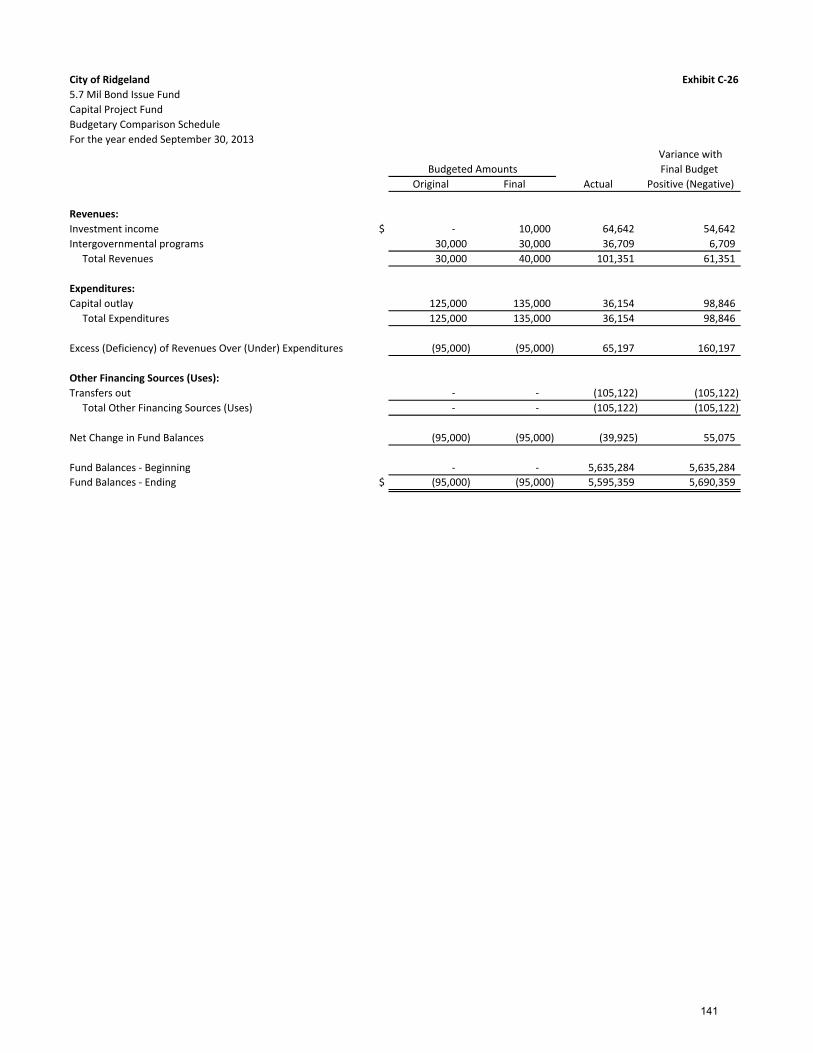
City of Ridgeland Exhibit C‐26
5.7 Mil Bond Issue Fund
Capital Project Fund
Budgetary Comparison Schedule
For the year ended September 30, 2013
Variance with
Final Budget
Original Final Actual Positive (Negative)
Revenues:
Investment income $ ‐ 10,000 64,642 54,642
Intergovernmental programs 30,000 30,000 36,709 6,709
Total Revenues 30,000 40,000 101,351 61,351
Expenditures:
Capital outlay 125,000 135,000 36,154 98,846
Total Expenditures 125,000 135,000 36,154 98,846
Excess (Deficiency) of Revenues Over (Under) Expenditures (95,000) (95,000) 65,197 160,197
Other Financing Sources (Uses):
Transfers out ‐ ‐ (105,122) (105,122)
Total Other Financing Sources (Uses) ‐ ‐ (105,122) (105,122)
Net Change in Fund Balances (95,000) (95,000) (39,925) 55,075
Fund Balances ‐ Beginning ‐ ‐ 5,635,284 5,635,284
Fund Balances ‐ Ending $ (95,000) (95,000) 5,595,359 5,690,359
Budgeted Amounts
141

City of Ridgeland Exhibit C‐27
Rice Road Trail Head Improvements
Capital Project Fund
Budgetary Comparison Schedule
For the year ended September 30, 2013
Variance with
Final Budget
Original Final Actual Positive (Negative)
Revenues:
Intergovernmental programs $ 100,000 101,000 101,000 ‐
Total Revenues 100,000 101,000 101,000 ‐
Expenditures:
Capital outlay 165,000 174,474 177,751 (3,277)
Total Expenditures 165,000 174,474 177,751 (3,277)
Excess (Deficiency) of Revenues Over (Under) Expenditures (65,000) (73,474) (76,751) (3,277)
Other Financing Sources (Uses):
Transfers in ‐ ‐ 105,122 105,122
Total Other Financing Sources (Uses) ‐ ‐ 105,122 105,122
Net Change in Fund Balances (65,000) (73,474) 28,371 101,845
Fund Balances ‐ Beginning ‐ ‐ (28,371) (28,371)
Fund Balances ‐ Ending $ (65,000) (73,474) ‐ 73,474
Budgeted Amounts
142

This page is intentionally left blank.
143

ENTERPRISE FUND
Enterprise Funds are used to account for operations that are financed and operated in a mannersimilar to private business enterprises - where the services to the general public on a continuingbasis are financed or recovered primarily through user charges; or where the government'scouncil has decided that periodic determination of net income is appropriate for accountabilitypurposes.
The City of Ridgeland, Mississippi operates the following Enterprise Fund:
Public Utility Fund - This fund is used to account for the water and sewer revenue of themunicipality, as well as its water related expenses and sewer cost-sharing.
144

City of Ridgeland Exhibit C‐28
Public Utility Fund
Enterprise Fund
Budgetary Comparison Schedule
For the year ended September 30, 2013
Variance with
Final Budget
Original Final Actual Positive (Negative)
Revenues:
Charges for services $ 6,032,500 6,032,500 6,079,849 47,349
Total Revenues 6,032,500 6,032,500 6,079,849 47,349
Expenses:
Personal services ‐ salaries and wages 1,048,268 1,047,538 1,022,160 25,378
Personal services ‐ employee benefits 379,624 380,354 366,658 13,696
Purchased professional and technical services 1,952,023 1,930,196 1,784,682 145,514
Supplies 529,000 635,499 546,532 88,967
Property 2,169,261 2,273,698 2,273,698
Depreciation ‐ ‐ 1,240,487 (1,240,487)
Total Expenses 6,078,176 6,267,285 4,960,519 1,306,766
Operating Income (Loss) (45,676) (234,785) 1,119,330 1,354,115
Non‐Operating Revenues (Expenses):
Interest revenue 105,000 105,000 52,352 (52,648)
Grants and contributions 48,019 92,814 44,795 (48,019)
Gain or Loss on sale of capital assets ‐ ‐ 2,854 2,854
Other revenues ‐ 7,707 166,093
Loss on investments ‐ ‐ (195,052) (195,052)
Debt service interest (1,360,563) (1,360,563) (562,814) 797,749
Total Non‐Operating Revenues (Expenses) (1,207,544) (1,155,042) (491,772) 663,270
Net Income (Loss) before Operating Transfers
Transfers in ‐ 17,170 17,170 ‐
Transfers out ‐ (150,000) (150,000) ‐
Net Income (Loss) (1,253,220) (1,522,657) 494,728 2,017,385
Net Position ‐ Beginning 28,919,766 28,919,766 28,919,766 ‐
Net Position ‐ Ending $ 27,666,546 27,397,109 29,414,494 2,017,385
Budgeted Amounts
145

INTERNAL SERVICE FUNDS
Internal Service Funds are used to account for the financing of goods and services provided byone department or agency to other departments or agencies of the government and to othergovernment units, on a cost reimbursement basis.
The City of Ridgeland, Mississippi operates the following Internal Service Funds.
1. East Madison County Regional Sewer Fund - This fund is used to account for the sewerexpenses of the City, plus the interlocal cost-sharing arrangement between the City ofRidgeland, Mississippi, the City of Madison, Mississippi, and the Pearl River ValleyWater Authority.
2. Insurance Trust Fund - accounts for the insurance transactions handled by the City fortheir self insured employee health insurance program.
146
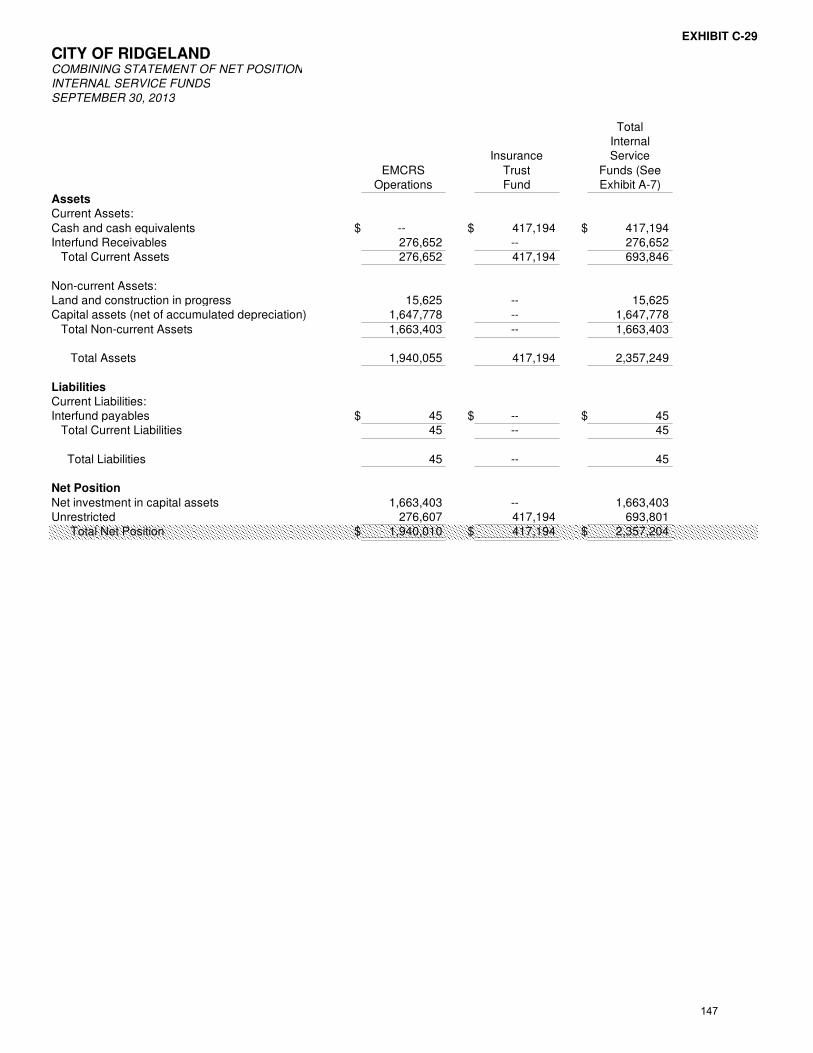
EXHIBIT C-29
CITY OF RIDGELANDCOMBINING STATEMENT OF NET POSITION
INTERNAL SERVICE FUNDS
SEPTEMBER 30, 2013
TotalInternal
Insurance Service
EMCRS Trust Funds (SeeOperations Fund Exhibit A-7)
Assets
Current Assets:
Cash and cash equivalents $ -- $ 417,194 $ 417,194Interfund Receivables 276,652 -- 276,652 Total Current Assets 276,652 417,194 693,846
Non-current Assets:Land and construction in progress 15,625 -- 15,625Capital assets (net of accumulated depreciation) 1,647,778 -- 1,647,778
Total Non-current Assets 1,663,403 -- 1,663,403
Total Assets 1,940,055 417,194 2,357,249
Liabilities
Current Liabilities:Interfund payables $ 45 $ -- $ 45 Total Current Liabilities 45 -- 45
Total Liabilities 45 -- 45
Net Position
Net investment in capital assets 1,663,403 -- 1,663,403Unrestricted 276,607 417,194 693,801 Total Net Position $ 1,940,010 $ 417,194 $ 2,357,204
147

EXHIBIT C-30
CITY OF RIDGELANDCOMBINING STATEMENT OF REVENUES, EXPENSES,
AND CHANGES IN NET POSITION
INTERNAL SERVICE FUNDS
FOR THE YEAR ENDED SEPTEMBER 30, 2013
TotalInternal
Insurance Service
EMCRS Trust Funds (SeeOperations Fund Exhibit A-8)
Operating Revenues:
Charges for services $ 1,568,680 $ -- $ 1,568,680
Premiums -- 1,342,481 1,342,481 Total Operating Revenues 1,568,680 1,342,481 2,911,161
Operating Expenses:
Personal services - salaries and wages 46,195 -- 46,195Personal services - employee benefits 16,388 -- 16,388Purchased professional and technical services 1,258,132 1,492,055 2,750,187
Supplies 413,763 -- 413,763Depreciation 97,788 -- 97,788 Total Operating Expenses 1,832,266 1,492,055 3,324,321
Operating Income (Loss) (263,586) (149,574) (413,160)
Non-Operating Revenues (Expenses):
Interest revenue 427 1,168 1,595
Total Non-operating Revenues (Expenses) 427 1,168 1,595
Net Income (Loss) before Operating Transfers (263,159) (148,406) (411,565)
Transfers in 150,000 -- 150,000
Net income (113,159) (148,406) (261,565)
Net Position- Beginning 2,053,169 565,600 2,618,769Net Position - Ending $ 1,940,010 $ 417,194 $ 2,357,204
148
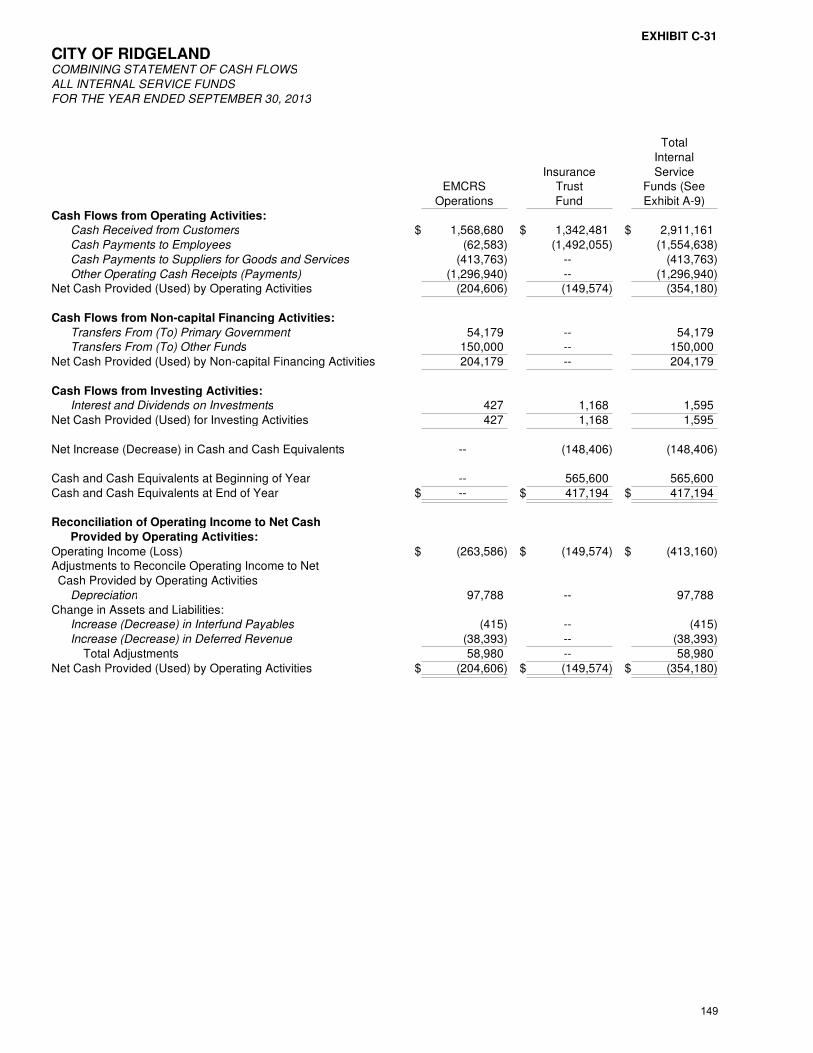
EXHIBIT C-31
CITY OF RIDGELANDCOMBINING STATEMENT OF CASH FLOWS
ALL INTERNAL SERVICE FUNDS
FOR THE YEAR ENDED SEPTEMBER 30, 2013
Total
Internal
Insurance ServiceEMCRS Trust Funds (See
Operations Fund Exhibit A-9)
Cash Flows from Operating Activities:
Cash Received from Customers $ 1,568,680 $ 1,342,481 $ 2,911,161
Cash Payments to Employees (62,583) (1,492,055) (1,554,638)
Cash Payments to Suppliers for Goods and Services (413,763) -- (413,763)
Other Operating Cash Receipts (Payments) (1,296,940) -- (1,296,940)Net Cash Provided (Used) by Operating Activities (204,606) (149,574) (354,180)
Cash Flows from Non-capital Financing Activities:
Transfers From (To) Primary Government 54,179 -- 54,179Transfers From (To) Other Funds 150,000 -- 150,000
Net Cash Provided (Used) by Non-capital Financing Activities 204,179 -- 204,179
Cash Flows from Investing Activities:
Interest and Dividends on Investments 427 1,168 1,595
Net Cash Provided (Used) for Investing Activities 427 1,168 1,595
Net Increase (Decrease) in Cash and Cash Equivalents -- (148,406) (148,406)
Cash and Cash Equivalents at Beginning of Year -- 565,600 565,600
Cash and Cash Equivalents at End of Year $ -- $ 417,194 $ 417,194
Reconciliation of Operating Income to Net Cash
Provided by Operating Activities:
Operating Income (Loss) $ (263,586) $ (149,574) $ (413,160)Adjustments to Reconcile Operating Income to Net
Cash Provided by Operating Activities
Depreciation 97,788 -- 97,788
Change in Assets and Liabilities:Increase (Decrease) in Interfund Payables (415) -- (415)
Increase (Decrease) in Deferred Revenue (38,393) -- (38,393)
Total Adjustments 58,980 -- 58,980
Net Cash Provided (Used) by Operating Activities $ (204,606) $ (149,574) $ (354,180)
149
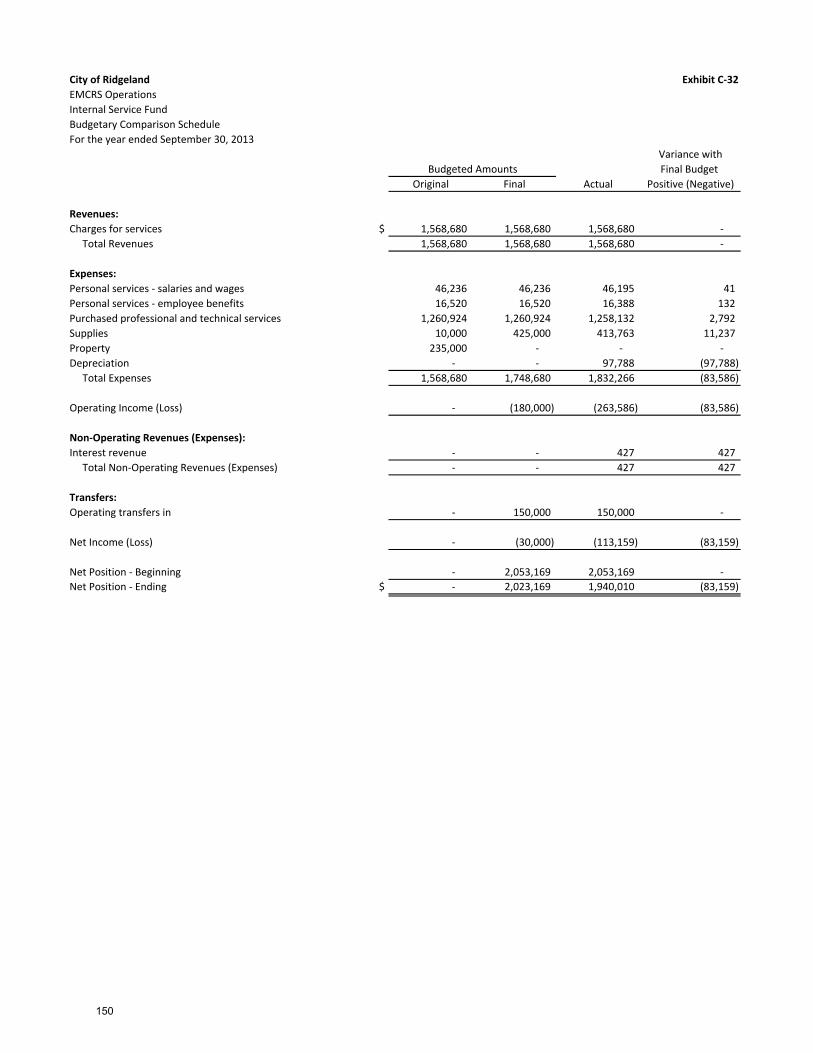
City of Ridgeland Exhibit C‐32
EMCRS Operations
Internal Service Fund
Budgetary Comparison Schedule
For the year ended September 30, 2013
Variance with
Final Budget
Original Final Actual Positive (Negative)
Revenues:
Charges for services $ 1,568,680 1,568,680 1,568,680 ‐
Total Revenues 1,568,680 1,568,680 1,568,680 ‐
Expenses:
Personal services ‐ salaries and wages 46,236 46,236 46,195 41
Personal services ‐ employee benefits 16,520 16,520 16,388 132
Purchased professional and technical services 1,260,924 1,260,924 1,258,132 2,792
Supplies 10,000 425,000 413,763 11,237
Property 235,000 ‐ ‐ ‐
Depreciation ‐ ‐ 97,788 (97,788)
Total Expenses 1,568,680 1,748,680 1,832,266 (83,586)
Operating Income (Loss) ‐ (180,000) (263,586) (83,586)
Non‐Operating Revenues (Expenses):
Interest revenue ‐ ‐ 427 427
Total Non‐Operating Revenues (Expenses) ‐ ‐ 427 427
Transfers:
Operating transfers in ‐ 150,000 150,000 ‐
Net Income (Loss) ‐ (30,000) (113,159) (83,159)
Net Position ‐ Beginning ‐ 2,053,169 2,053,169 ‐
Net Position ‐ Ending $ ‐ 2,023,169 1,940,010 (83,159)
Budgeted Amounts
150
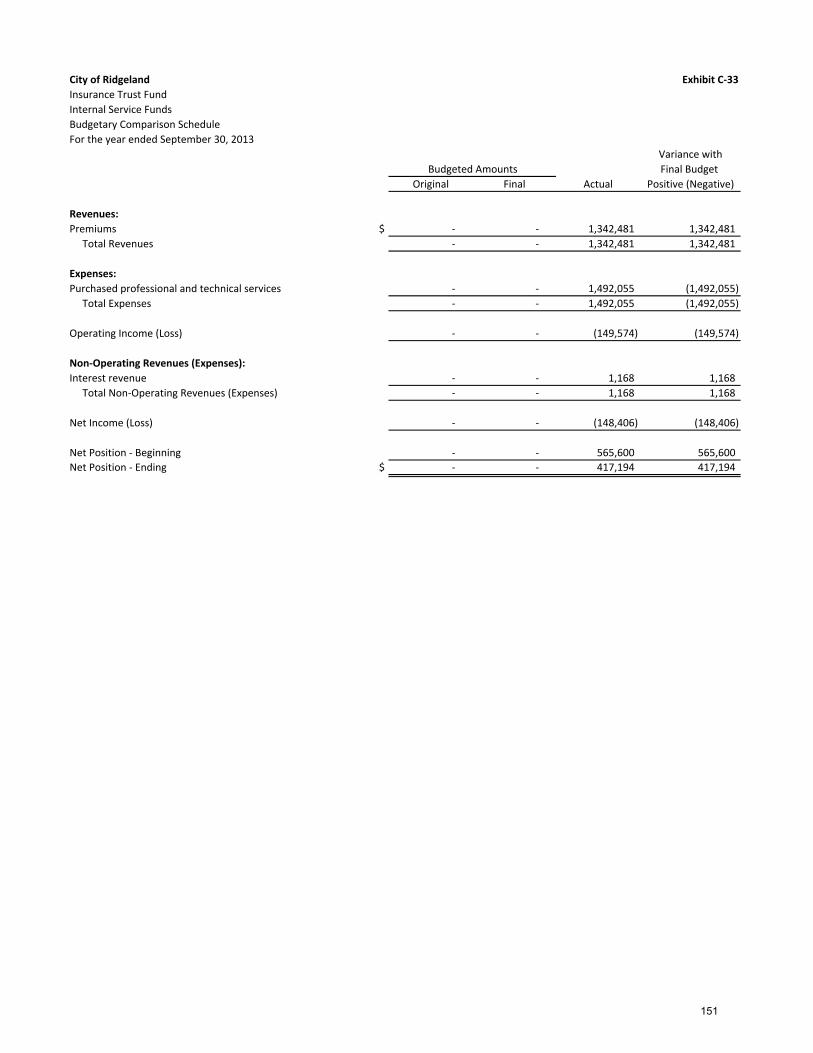
City of Ridgeland Exhibit C‐33
Insurance Trust Fund
Internal Service Funds
Budgetary Comparison Schedule
For the year ended September 30, 2013
Variance with
Final Budget
Original Final Actual Positive (Negative)
Revenues:
Premiums $ ‐ ‐ 1,342,481 1,342,481
Total Revenues ‐ ‐ 1,342,481 1,342,481
Expenses:
Purchased professional and technical services ‐ ‐ 1,492,055 (1,492,055)
Total Expenses ‐ ‐ 1,492,055 (1,492,055)
Operating Income (Loss) ‐ ‐ (149,574) (149,574)
Non‐Operating Revenues (Expenses):
Interest revenue ‐ ‐ 1,168 1,168
Total Non‐Operating Revenues (Expenses) ‐ ‐ 1,168 1,168
Net Income (Loss) ‐ ‐ (148,406) (148,406)
Net Position ‐ Beginning ‐ ‐ 565,600 565,600
Net Position ‐ Ending $ ‐ ‐ 417,194 417,194
Budgeted Amounts
151
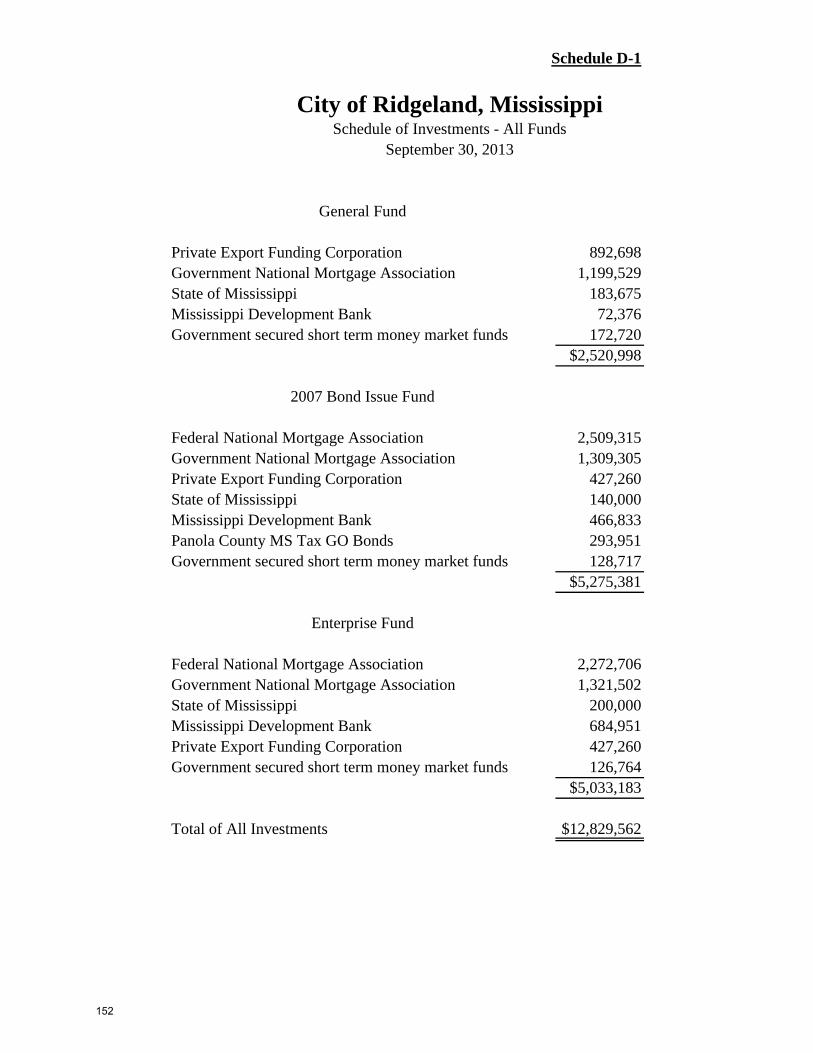
Schedule D-1
City of Ridgeland, MississippiSchedule of Investments - All Funds
September 30, 2013
General Fund
Private Export Funding Corporation 892,698Government National Mortgage Association 1,199,529State of Mississippi 183,675Mississippi Development Bank 72,376Government secured short term money market funds 172,720
$2,520,998
2007 Bond Issue Fund
Federal National Mortgage Association 2,509,315Government National Mortgage Association 1,309,305Private Export Funding Corporation 427,260State of Mississippi 140,000Mississippi Development Bank 466,833Panola County MS Tax GO Bonds 293,951Government secured short term money market funds 128,717
$5,275,381
Enterprise Fund
Federal National Mortgage Association 2,272,706Government National Mortgage Association 1,321,502State of Mississippi 200,000Mississippi Development Bank 684,951Private Export Funding Corporation 427,260Government secured short term money market funds 126,764
$5,033,183
Total of All Investments $12,829,562
152
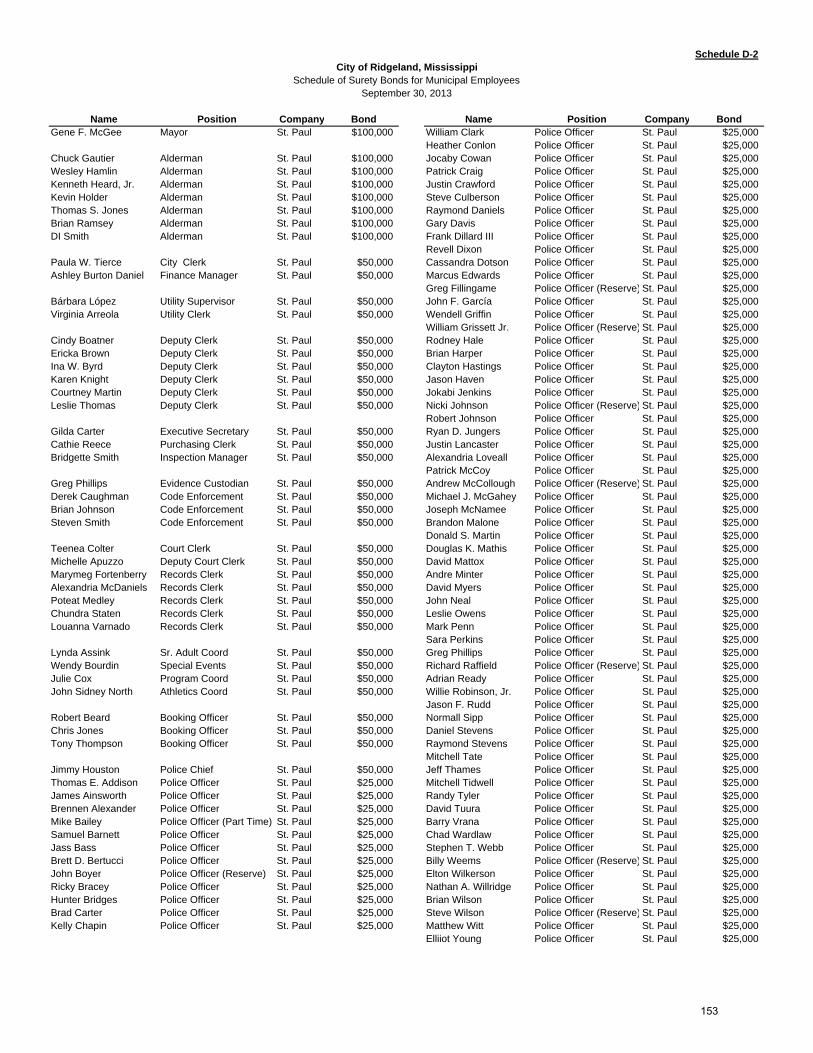
Schedule D-2
Name Position Company Bond Name Position Company BondGene F. McGee Mayor St. Paul $100,000 William Clark Police Officer St. Paul $25,000
Heather Conlon Police Officer St. Paul $25,000Chuck Gautier Alderman St. Paul $100,000 Jocaby Cowan Police Officer St. Paul $25,000Wesley Hamlin Alderman St. Paul $100,000 Patrick Craig Police Officer St. Paul $25,000Kenneth Heard, Jr. Alderman St. Paul $100,000 Justin Crawford Police Officer St. Paul $25,000Kevin Holder Alderman St. Paul $100,000 Steve Culberson Police Officer St. Paul $25,000Thomas S. Jones Alderman St. Paul $100,000 Raymond Daniels Police Officer St. Paul $25,000Brian Ramsey Alderman St. Paul $100,000 Gary Davis Police Officer St. Paul $25,000DI Smith Alderman St. Paul $100,000 Frank Dillard III Police Officer St. Paul $25,000
Revell Dixon Police Officer St. Paul $25,000Paula W. Tierce City Clerk St. Paul $50,000 Cassandra Dotson Police Officer St. Paul $25,000Ashley Burton Daniel Finance Manager St. Paul $50,000 Marcus Edwards Police Officer St. Paul $25,000
Greg Fillingame Police Officer (Reserve) St. Paul $25,000Bárbara López Utility Supervisor St. Paul $50,000 John F. García Police Officer St. Paul $25,000Virginia Arreola Utility Clerk St. Paul $50,000 Wendell Griffin Police Officer St. Paul $25,000
William Grissett Jr. Police Officer (Reserve) St. Paul $25,000Cindy Boatner Deputy Clerk St. Paul $50,000 Rodney Hale Police Officer St. Paul $25,000Ericka Brown Deputy Clerk St. Paul $50,000 Brian Harper Police Officer St. Paul $25,000Ina W. Byrd Deputy Clerk St. Paul $50,000 Clayton Hastings Police Officer St. Paul $25,000Karen Knight Deputy Clerk St. Paul $50,000 Jason Haven Police Officer St. Paul $25,000Courtney Martin Deputy Clerk St. Paul $50,000 Jokabi Jenkins Police Officer St. Paul $25,000Leslie Thomas Deputy Clerk St. Paul $50,000 Nicki Johnson Police Officer (Reserve) St. Paul $25,000
Robert Johnson Police Officer St. Paul $25,000Gilda Carter Executive Secretary St. Paul $50,000 Ryan D. Jungers Police Officer St. Paul $25,000Cathie Reece Purchasing Clerk St. Paul $50,000 Justin Lancaster Police Officer St. Paul $25,000Bridgette Smith Inspection Manager St. Paul $50,000 Alexandria Loveall Police Officer St. Paul $25,000
Patrick McCoy Police Officer St. Paul $25,000Greg Phillips Evidence Custodian St. Paul $50,000 Andrew McCollough Police Officer (Reserve) St. Paul $25,000Derek Caughman Code Enforcement St. Paul $50,000 Michael J. McGahey Police Officer St. Paul $25,000Brian Johnson Code Enforcement St. Paul $50,000 Joseph McNamee Police Officer St. Paul $25,000Steven Smith Code Enforcement St. Paul $50,000 Brandon Malone Police Officer St. Paul $25,000
Donald S. Martin Police Officer St. Paul $25,000Teenea Colter Court Clerk St. Paul $50,000 Douglas K. Mathis Police Officer St. Paul $25,000Michelle Apuzzo Deputy Court Clerk St. Paul $50,000 David Mattox Police Officer St. Paul $25,000Marymeg Fortenberry Records Clerk St. Paul $50,000 Andre Minter Police Officer St. Paul $25,000Alexandria McDaniels Records Clerk St. Paul $50,000 David Myers Police Officer St. Paul $25,000Poteat Medley Records Clerk St. Paul $50,000 John Neal Police Officer St. Paul $25,000Chundra Staten Records Clerk St. Paul $50,000 Leslie Owens Police Officer St. Paul $25,000Louanna Varnado Records Clerk St. Paul $50,000 Mark Penn Police Officer St. Paul $25,000
Sara Perkins Police Officer St. Paul $25,000Lynda Assink Sr. Adult Coord St. Paul $50,000 Greg Phillips Police Officer St. Paul $25,000Wendy Bourdin Special Events St. Paul $50,000 Richard Raffield Police Officer (Reserve) St. Paul $25,000Julie Cox Program Coord St. Paul $50,000 Adrian Ready Police Officer St. Paul $25,000John Sidney North Athletics Coord St. Paul $50,000 Willie Robinson, Jr. Police Officer St. Paul $25,000
Jason F. Rudd Police Officer St. Paul $25,000Robert Beard Booking Officer St. Paul $50,000 Normall Sipp Police Officer St. Paul $25,000Chris Jones Booking Officer St. Paul $50,000 Daniel Stevens Police Officer St. Paul $25,000Tony Thompson Booking Officer St. Paul $50,000 Raymond Stevens Police Officer St. Paul $25,000
Mitchell Tate Police Officer St. Paul $25,000Jimmy Houston Police Chief St. Paul $50,000 Jeff Thames Police Officer St. Paul $25,000Thomas E. Addison Police Officer St. Paul $25,000 Mitchell Tidwell Police Officer St. Paul $25,000James Ainsworth Police Officer St. Paul $25,000 Randy Tyler Police Officer St. Paul $25,000Brennen Alexander Police Officer St. Paul $25,000 David Tuura Police Officer St. Paul $25,000Mike Bailey Police Officer (Part Time) St. Paul $25,000 Barry Vrana Police Officer St. Paul $25,000Samuel Barnett Police Officer St. Paul $25,000 Chad Wardlaw Police Officer St. Paul $25,000Jass Bass Police Officer St. Paul $25,000 Stephen T. Webb Police Officer St. Paul $25,000Brett D. Bertucci Police Officer St. Paul $25,000 Billy Weems Police Officer (Reserve) St. Paul $25,000John Boyer Police Officer (Reserve) St. Paul $25,000 Elton Wilkerson Police Officer St. Paul $25,000Ricky Bracey Police Officer St. Paul $25,000 Nathan A. Willridge Police Officer St. Paul $25,000Hunter Bridges Police Officer St. Paul $25,000 Brian Wilson Police Officer St. Paul $25,000Brad Carter Police Officer St. Paul $25,000 Steve Wilson Police Officer (Reserve) St. Paul $25,000Kelly Chapin Police Officer St. Paul $25,000 Matthew Witt Police Officer St. Paul $25,000
Elliiot Young Police Officer St. Paul $25,000
City of Ridgeland, MississippiSchedule of Surety Bonds for Municipal Employees
September 30, 2013
153
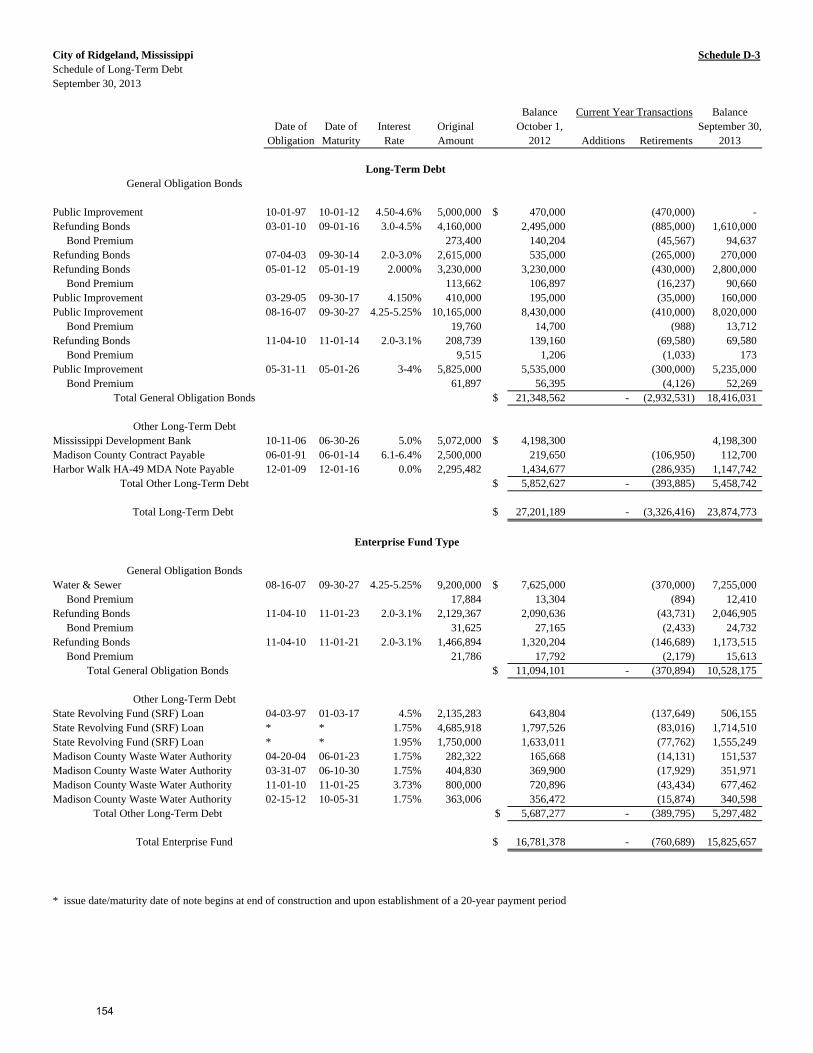
City of Ridgeland, Mississippi Schedule D-3Schedule of Long-Term DebtSeptember 30, 2013
Balance Current Year Transactions BalanceDate of Date of Interest Original October 1, September 30,
Obligation Maturity Rate Amount 2012 Additions Retirements 2013
Long-Term Debt General Obligation Bonds
Public Improvement 10-01-97 10-01-12 4.50-4.6% 5,000,000 $ 470,000 (470,000) - Refunding Bonds 03-01-10 09-01-16 3.0-4.5% 4,160,000 2,495,000 (885,000) 1,610,000 Bond Premium 273,400 140,204 (45,567) 94,637 Refunding Bonds 07-04-03 09-30-14 2.0-3.0% 2,615,000 535,000 (265,000) 270,000 Refunding Bonds 05-01-12 05-01-19 2.000% 3,230,000 3,230,000 (430,000) 2,800,000 Bond Premium 113,662 106,897 (16,237) 90,660 Public Improvement 03-29-05 09-30-17 4.150% 410,000 195,000 (35,000) 160,000 Public Improvement 08-16-07 09-30-27 4.25-5.25% 10,165,000 8,430,000 (410,000) 8,020,000 Bond Premium 19,760 14,700 (988) 13,712 Refunding Bonds 11-04-10 11-01-14 2.0-3.1% 208,739 139,160 (69,580) 69,580 Bond Premium 9,515 1,206 (1,033) 173 Public Improvement 05-31-11 05-01-26 3-4% 5,825,000 5,535,000 (300,000) 5,235,000 Bond Premium 61,897 56,395 (4,126) 52,269
Total General Obligation Bonds $ 21,348,562 - (2,932,531) 18,416,031
Other Long-Term Debt Mississippi Development Bank 10-11-06 06-30-26 5.0% 5,072,000 $ 4,198,300 4,198,300 Madison County Contract Payable 06-01-91 06-01-14 6.1-6.4% 2,500,000 219,650 (106,950) 112,700 Harbor Walk HA-49 MDA Note Payable 12-01-09 12-01-16 0.0% 2,295,482 1,434,677 (286,935) 1,147,742
Total Other Long-Term Debt $ 5,852,627 - (393,885) 5,458,742
Total Long-Term Debt $ 27,201,189 - (3,326,416) 23,874,773
Enterprise Fund Type
General Obligation BondsWater & Sewer 08-16-07 09-30-27 4.25-5.25% 9,200,000 $ 7,625,000 (370,000) 7,255,000 Bond Premium 17,884 13,304 (894) 12,410 Refunding Bonds 11-04-10 11-01-23 2.0-3.1% 2,129,367 2,090,636 (43,731) 2,046,905 Bond Premium 31,625 27,165 (2,433) 24,732 Refunding Bonds 11-04-10 11-01-21 2.0-3.1% 1,466,894 1,320,204 (146,689) 1,173,515 Bond Premium 21,786 17,792 (2,179) 15,613
Total General Obligation Bonds $ 11,094,101 - (370,894) 10,528,175
Other Long-Term DebtState Revolving Fund (SRF) Loan 04-03-97 01-03-17 4.5% 2,135,283 643,804 (137,649) 506,155 State Revolving Fund (SRF) Loan * * 1.75% 4,685,918 1,797,526 (83,016) 1,714,510 State Revolving Fund (SRF) Loan * * 1.95% 1,750,000 1,633,011 (77,762) 1,555,249 Madison County Waste Water Authority 04-20-04 06-01-23 1.75% 282,322 165,668 (14,131) 151,537 Madison County Waste Water Authority 03-31-07 06-10-30 1.75% 404,830 369,900 (17,929) 351,971 Madison County Waste Water Authority 11-01-10 11-01-25 3.73% 800,000 720,896 (43,434) 677,462 Madison County Waste Water Authority 02-15-12 10-05-31 1.75% 363,006 356,472 (15,874) 340,598
Total Other Long-Term Debt $ 5,687,277 - (389,795) 5,297,482
Total Enterprise Fund $ 16,781,378 - (760,689) 15,825,657
* issue date/maturity date of note begins at end of construction and upon establishment of a 20-year payment period
154

City of Ridgeland, Mississippi Schedule D-4Schedule of Expenditure of Federal AwardsFor the Year Ended September 30, 2013
Federal Grantor/ Federal Agency orPass-through Grantor/ CFDA Pass-through FederalProgram Title Number Number Expenditures
U.S Department of TransportationPassed-through the Mississippi Department of Transportation
Highway Planning and Construction Cluster: Highway Planning and Construction 20.205 STP-8323-00(003) $ 3,441,353 Recreational Trails Program 20.219 28-RTP-206 100,000 Total Highway Planning and Construction Cluster 3,541,353 Total Passed-through the Mississippi Department of Transportation 3,541,353
Passed-through the Mississippi Department of Public SafetyAlcohol Open Container Requirements 20.607 13-TA-230-1 84,760 Total Passed-through the Mississippi Department of Public Safety 84,760
Total U.S. Department of Transportation 3,626,113
U.S. Office of National Drug Control PolicyPassed-through the Mississippi Bureau of Narcotics - Gulf Coast HIDTA
High Intensity Drug Trafficking Area - State and Local Assistance 07.xxx I8PGCP5402 21,806 Total Passed-through the Mississippi Bureau of Narcotics 21,806
Total U.S. Office of National Drug Control Policy 21,806
U.S. Department of JusticePassed-through the Mississippi Department of Public Safety
Edward Byrne Memorial Justice Assistance Grant Program 16.738 2011-DJ-BX-2694 3,004 Total Passed-through the Mississippi Department of Public Safety 3,004
Direct Program - Drug Enforcement AgencyDEA State and Local Task Force Overtime Assignment 16.xxx N/A 19,440
Direct Program - U.S. Marshall's OfficeEquitable Sharing of Federally Forfeited Property 16.xxx N/A 57,710
Direct Program -Bureau of Justice AssistanceBulletproof Vest Partnership Program 16.607 N/A 3,441
Total U.S. Department of Justice 83,595
U.S. Department of Housing and Urban DevelopmentPassed-through the Mississippi Development Authority
Community Development Block Grant - Special Purpose Grants 14.225 1128-11-316-PF-01 258,800 Total Passed-through the Mississippi Development Authority 258,800
Total U.S. Department of Housing and Urban Development 258,800
U.S. Department of Homeland SecurityPassed-through the Mississippi Emergency Management Agency
Disaster Grants - Public Assistance (Presidentially Declared Disasters 97.036 1604-DR-MS 28,319 Total Passed-through the Mississippi Emergency Management Agency 28,319
Passed-through the Mississippi Office of Homeland SecurityHomeland Security Grant Program 97.067 09HS316 20,000 Homeland Security Grant Program 97.067 10HS316T 16,000 Total Passed-through the Mississippi Office of Homeland Security 36,000
Total U.S. Department of Homeland Security 64,319
Total Expenditures of Federal Awards $ 4,054,633
NOTES TO SCHEDULE OF EXPENDITURES OF FEDERAL AWARDS
1. The accompanying Schedule of Expenditures of Federal Awards is prepared on the modified accrual basis of accounting2. In prior years, the City of Ridgeland received federal assistance in the form of a loan through the MS Department of Environmental Quality. The balance of this loan at September 30, 2013 was $506,155 as reported on Schedule D-3 of the City of Ridgeland's audit report for the year ended September 30, 2013 under SRF loan payable. 3. In prior years, the City of Ridgeland received federal assistance in the form of a loan through the MS Department of Health. The balance of this loan at September 30, 2013 was $1,555,249 as reported on Schedule D-3 of the City of Ridgeland's audit report for the year ended September 30, 2013 under SRF Loan payable.
155

This page is intentionally left blank.
156

III
STATISTICALSECTION
This part of the City of Ridgeland’s comprehensive annual financial report presents detailed information as a context for understanding what the information in the financial statements, note disclosures, and required supplementary information says about the City’s overall financial health.
Financial TrendsThese schedules contain financial trends information intended to assist the reader in understanding and assessing how a government’s financial position has changed over time.
Revenue CapacityThese schedules contain information to help the reader assess the factors affecting the City’s ability to generate its own-source revenues-property and sales taxes.
Debt CapacityThese schedules present information to help the reader assess the affordability of the City’s current levels of outstanding debt and the City’s ability to issue additional debt in the future.
Demographic and Economic InformationThese schedules offer demographic and economic indicators to help the reader understand the environment within which the City’s financial activities take place and to help make comparisons over time and with other governments.
157

This page is intentionally left blank.
158

III STATISTICAL
SECTIONThis part of the City of Ridgeland’s comprehensive annual financial report presents detailed informationas a context for understanding what the information in the financial statements, note disclosures, andrequired supplementary information says about the city’s overall financial health.
Financial Trends
Table 1 General Governmental Expenditures by FunctionTable 2 General Revenues by SourceTable 3 Fund Balance and Net Assets InformationTable 4 Schedule of Changes in Net AssetsTable 5 Schedule of Changes in Fund Balance
Revenue Capacity
Table 6 Property Tax Levies and CollectionsTable 7 Assessed and Actual Value of PropertyTable 8 Property Tax Rates - Direct and Overlapping GovernmentsTable 9 Principal TaxpayersTable 10 Special Assessment Billings and Collections
Debt Capacity
Table 11 Computation of Direct and Overlapping Bonded DebtTable 12 Ratios of Outstanding Debt by TypeTable 13 Legal Debt Margin InformationTable 14 Ratio of Net General Obligation Debt to Assessed Value and Net General
Obligation Bonded Debt Per CapitaTable 15 Ratio of Annual Debt Service Expenditures for G.O. Bonded Debt to Total
Governmental Expenditures
Demographic and Economic Information
Table 16 Construction ActivityTable 17 Property Value and ConstructionTable 18 Demographic and Economic StatisticsTable 19 Education Related InformationTable 20 Principal EmployersTable 21 Full-time Equivalent Government Employees by FunctionTable 22 Operating Indicators by FunctionTable 23 Capital Assets Indicators by FunctionTable 24 Miscellaneous Statistics
159

Cit
y of
Rid
gela
ndT
able
1G
ener
al G
over
nm
enta
l Exp
end
itu
res
by
Fu
nct
ion
L
ast T
en F
isca
l Yea
rs(a
mou
nts
expr
esse
d in
thou
sand
s)
Hea
lth
Cul
ture
Fis
cal
Gen
eral
Pub
lic
Pub
lic
and
and
Eco
nom
icC
apit
al
Deb
tY
ear
Gov
ernm
ent
Saf
ety
Wor
ksS
anit
atio
nW
elfa
reR
ecre
atio
nD
evel
opm
ent
Out
lay
Ser
vice
Tot
al
2004
2,31
2
8,
005
3,50
7
74
7
44
1,
663
44
-
2,
890
19,2
12
2005
2,22
9
8,
056
2,84
3
72
4
45
1,
687
3
6,02
3
4,
255
25,8
65
2006
2,34
3
9,
084
3,54
2
89
0
45
1,
806
4
13,8
83
3,50
9
35
,106
20
072,
465
10,4
88
2,84
1
89
6
56
1,
959
313
5,
698
3,73
2
28
,448
20
082,
560
11,0
64
3,99
8
94
4
50
2,
302
112
7,
261
4,93
9
33
,230
20
092,
148
10,4
42
3,48
2
85
8
54
2,
061
82
4,
271
4,60
3
28
,001
20
102,
558
11,0
74
3,41
1
1,
043
29
2,
112
70
3,
962
4,13
3
28
,392
20
112,
624
11,2
96
4,04
7
1,
068
45
2,
108
53
5,
674
6,50
2
33
,417
20
122,
553
10,7
07
3,55
4
1,
190
39
2,
090
38
1,
231
8,19
3
29
,595
20
132,
500
11,1
39
3,71
4
1,
195
31
2,
184
50
7,
846
5,87
7
34
,536
160
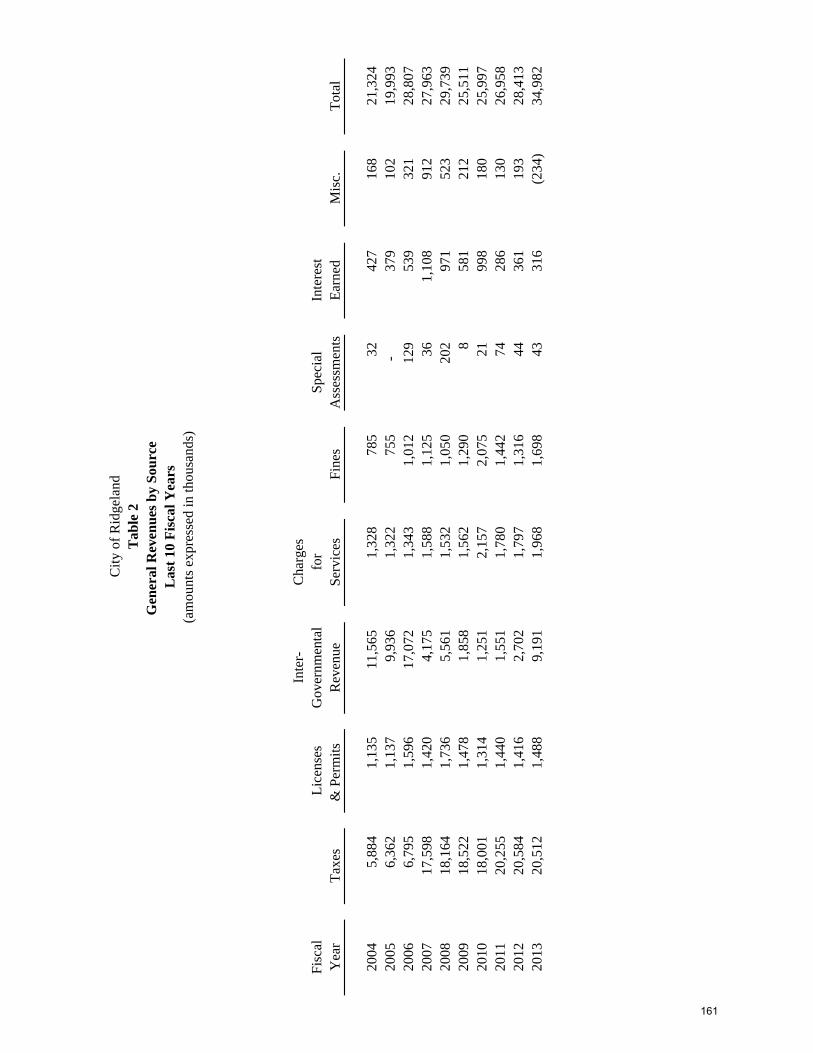
Cit
y of
Rid
gela
ndT
able
2G
ener
al R
even
ues
by
Sou
rce
Las
t 10
Fis
cal Y
ears
(am
ount
s ex
pres
sed
in th
ousa
nds)
Inte
r-C
harg
esF
isca
lL
icen
ses
Gov
ernm
enta
lfo
rS
peci
alIn
tere
stY
ear
Tax
es&
Per
mit
s R
even
ueS
ervi
ces
Fin
esA
sses
smen
tsE
arne
dM
isc.
Tot
al
2004
5,88
4
1,13
5
11
,565
1,32
8
78
5
32
42
7
16
8
21
,324
20
056,
362
1,
137
9,93
6
1,32
2
75
5
-
37
9
10
2
19
,993
20
066,
795
1,
596
17,0
72
1,
343
1,01
2
129
539
321
28,8
07
2007
17,5
98
1,42
0
4,
175
1,
588
1,12
5
36
1,10
8
912
27,9
63
2008
18,1
64
1,73
6
5,
561
1,
532
1,05
0
202
971
523
29,7
39
2009
18,5
22
1,47
8
1,
858
1,
562
1,29
0
8
58
1
21
2
25
,511
20
1018
,001
1,
314
1,25
1
2,15
7
2,
075
21
99
8
18
0
25
,997
20
1120
,255
1,
440
1,55
1
1,78
0
1,
442
74
28
6
13
0
26
,958
20
1220
,584
1,
416
2,70
2
1,79
7
1,
316
44
36
1
19
3
28
,413
20
1320
,512
1,
488
9,19
1
1,96
8
1,
698
43
31
6
(2
34)
34,9
82
161

2004
2005
2006
2007
2008
2009
2010
2011
2012
2013
Gov
ernm
enta
l Fun
ds F
und
Bal
ance
sG
ener
al F
und
Res
erve
d$1
,462
$1,8
71$2
,483
$1,4
54$1
,340
$1,3
97$5
14U
nres
erve
d7,
461
8,14
2
9,
496
11,3
02
11,3
75
11,3
19
12,4
48
Non
spen
dabl
e57
$
56$
79
$
Res
tric
ted
455
33
0
263
A
ssig
ned
46
46
45
U
nass
igne
d12
,749
12
,937
14
,805
T
otal
Gen
eral
Fun
d8,
923
10,0
13
11,9
79
12,7
56
12,7
15
12,7
16
12,9
62
13,3
07
13,3
69
15,1
92
All
Oth
er G
over
nmen
tal F
unds
Res
erve
d$9
39$7
17$5
25U
nres
erve
d, r
epor
ted
in:
Spe
cial
Rev
enue
Fun
ds49
1
434
$
35
8$
270
$
44
9
Cap
ital
Pro
ject
s F
unds
5,19
5
1,
274
467
8,
727
5,59
0
3,
025
$
29
1
Deb
t Ser
vice
Fun
ds71
4
808
1,
353
2,14
0
1,
963
2,34
3
1,
634
Non
spen
dabl
e52
9$
1,35
1$
90
0$
Res
tric
ted
1,39
7
11
,945
5,
638
Ass
igne
d96
92
78
Tot
al A
ll O
ther
Gov
ernm
enta
l Fun
ds$6
,848
$3,2
90$2
,254
$11,
225
$7,8
23$5
,368
$2,8
992,
022
13,3
88
6,61
6
Gov
ernm
ent-
Wid
e F
unds
Pos
itio
nG
over
nmen
tal A
ctiv
itie
s:N
et I
nves
tmen
t in
Cap
ital
Ass
ets
$150
,342
$154
,560
$164
,732
$160
,918
$157
,935
$174
,407
$180
,216
$176
,163
$177
,810
$180
,121
Res
tric
ted
7,28
7
3,
725
15,2
08
12,2
75
18,7
76
16,6
28
1,80
1
92
3
1,06
8
49
8
Unr
estr
icte
d7,
718
8,62
0
(1
,437
)
11,7
10
12,3
24
2,26
6
4,
729
8,09
7
7,
283
14,3
63
Tot
al G
over
nmen
tal A
ctiv
itie
s$1
65,3
47$1
66,9
05$1
78,5
03$1
84,9
03$1
89,0
35$1
93,3
01$1
86,7
46$1
85,1
83$1
86,1
61$1
94,9
82
Bus
ines
s-T
ype
Act
ivit
ies:
Net
Inv
estm
ent i
n C
apit
al A
sset
s$1
2,58
7$1
3,79
9$1
2,13
8$4
,481
$7,8
69$1
2,29
4$1
3,54
0$1
7,54
8$1
7,90
1$1
8,74
7R
estr
icte
d-
3,
869
2,19
7
2,
865
1,77
7
1,
898
2,65
3
4,
808
1,53
2
1,
631
Unr
estr
icte
d6,
550
2,49
4
4,
567
13,0
59
12,1
16
9,56
1
9,
957
7,48
9
9,
487
9,03
6
T
otal
Bus
ines
s-T
ype
Act
ivit
ies
$19,
137
$20,
162
$18,
902
$20,
405
$21,
762
$23,
753
$26,
150
$29,
845
$28,
920
$29,
414
Tot
al P
rim
ary
Gov
ernm
ent:
Net
Inv
estm
ent i
n C
apit
al A
sset
s$1
62,9
29$1
68,3
59$1
76,8
70$1
65,3
99$1
65,8
04$1
86,7
01$1
93,7
56$1
93,7
11$1
95,7
11$1
98,8
68R
estr
icte
d7,
287
7,59
4
17
,405
15
,140
20
,553
18
,526
4,
454
5,73
1
2,
600
2,12
9
U
nres
tric
ted
14,2
68
11,1
14
3,13
0
24
,769
24
,440
11
,827
14
,686
15
,586
16
,770
23
,399
T
otal
Pri
mar
y G
over
nmen
t$1
84,4
84$1
87,0
67$1
97,4
05$2
05,3
08$2
10,7
97$2
17,0
54$2
12,8
96$2
15,0
28$2
15,0
81$2
24,3
96
*Fun
d B
alan
ce in
form
atio
n w
ith
resp
ect t
o th
ese
cate
gori
es f
or y
ears
200
4-20
10 is
una
vail
able
bef
ore
GA
SB
54
impl
emen
tati
on.
(am
ount
s ex
pres
sed
in th
ousa
nds)
Cit
y of
Rid
gela
ndT
able
3F
un
d B
alan
ce a
nd
Net
Ass
ets
Info
rmat
ion
Las
t T
en F
isca
l Yea
rs
162

2004 2005 2006 2007 2008 2009 2010 2011 2012 2013ExpensesGovernmental activities:
General government $1,937,776 $2,388,901 $2,187,137 $2,692,248 $3,007,277 $3,028,618 $3,199,279 $4,521,154 $3,228,505 $2,553,006Public safety 7,918,447 8,497,814 9,179,522 11,008,321 12,903,567 11,897,508 11,659,112 12,087,140 12,814,753 11,866,217 Public services 2,574,182 8,887,719 6,559,406 6,343,785 7,012,323 6,669,369 6,644,378 6,287,857 6,361,475 6,012,898 Sanitation 747,241 724,460 890,237 895,962 1,028,599 1,168,278 1,197,268 1,068,017 1,190,088 1,195,480 Culture and recreation 1,867,953 1,836,401 1,961,476 1,970,320 2,856,290 2,318,882 2,392,918 2,585,834 2,651,248 2,745,227 Interest on long-term debt 1,215,779 1,075,688 1,159,709 1,749,539 2,315,192 1,379,803 1,166,440 3,634,380 4,527,589 4,835,167
Total governmental activities expenses 16,261,378 23,410,983 21,937,487 24,660,175 29,123,248 26,462,458 26,259,395 30,184,382 30,773,658 29,207,995 Business-type activities
Public utility 3,611,452 3,460,951 3,889,257 4,599,966 4,849,367 6,097,504 5,230,644 5,316,389 6,169,137 5,523,333 Total business-type activities expenses 3,611,452 3,460,951 3,889,257 4,599,966 4,849,367 6,097,504 5,230,644 5,316,389 6,169,137 5,523,333
Total primary government expenses $19,872,830 $26,871,934 $25,826,744 $29,260,141 $33,972,615 $32,559,962 $31,490,039 $35,500,771 $36,942,795 $34,731,328
Program RevenuesGovernmental activities
Charges for services: General government $2,261,447 $2,308,903 $3,194,277 $3,291,461 $3,757,473 $4,864,424 $4,153,899 $3,670,562 $3,528,904 $5,418,368 Public safety - - - - - - 425,878 65,181 6,924 24,983 Public services 136,046 181,700 581,085 111,855 140,088 137,110 241,992 222,472 235,415 357,404 Sanitation 780,247 792,853 802,343 874,048 846,801 950,764 988,514 1,024,248 1,046,418 1,071,152 Culture and recreation 276,504 230,127 309,858 264,542 343,741 322,090 305,115 339,400 337,168 309,528 Operating grants and contributions 438,915 141,989 601,744 783,887 1,002,075 265,170 197,840 325,835 167,048 229,503 Capital grants and contributions 177,258 2,256,295 4,902,603 2,320,673 3,305,020 221,610 340,748 227,263 439,969 7,125,223
Total governmental activities program revenues 4,070,417 5,911,867 10,391,910 7,646,466 9,395,198 6,761,168 6,653,986 5,874,961 5,761,846 14,536,161
Business-type activities:Charges for services: Public utility 3,586,750 3,840,558 4,017,816 5,125,787 5,205,288 6,236,767 7,401,968 6,284,449 5,651,266 6,079,849 Operating grants and contributions - - - - - - - - 668,479 44,795
Total business-type activities progam revenues 3,586,750 3,840,558 4,017,816 5,125,787 5,205,288 6,236,767 7,401,968 6,284,449 6,319,745 6,124,644
Total primary government program revenues $7,657,167 $9,752,425 $14,409,726 $12,772,253 $14,600,486 $12,997,935 $14,055,954 $12,159,410 $12,081,591 $20,660,805
Net (Expense)/RevenueGovernmental activities ($12,190,961) ($17,499,116) ($11,545,577) ($17,013,709) ($19,728,050) ($19,701,290) ($19,605,409) ($24,309,421) ($25,011,812) ($14,671,834)
Business-type activities (24,702) 379,607 128,559 525,821 355,921 139,263 2,171,324 968,060 150,608 601,311
Total primary government net expense ($12,215,663) ($17,119,509) ($11,417,018) ($16,487,888) ($19,372,129) ($19,562,027) ($17,434,085) ($23,341,361) ($24,861,204) ($14,070,523)
General Revenues and Other Changes in Net PositionGovernmental Activities:
Intergovernmental/ unrestricted - - $10,396,863 $10,618,743 $10,807,261 $11,074,804 $11,281,550 $10,193,709 $10,360,517 $11,423,850Taxes Property taxes 7,570,657$ 6,362,605$ 6,297,064 7,003,460 7,382,045 7,474,340 6,745,223 10,088,629 10,254,456 9,176,327 Sales taxes 8,928,548 - - - - - - - - - Other taxes 660,443 9,299,239 1,115,955 994,135 1,113,787 1,221,927 554,151 586,236 613,215 606,549 Unrestricted investment income 394,420 557,388 541,230 1,111,956 971,255 632,456 1,000,545 287,157 362,606 315,591 Miscellaneous 2,523,246 553,728 - - - - - - - - Other - 2,284,206 2,718,745 3,930,647 3,586,289 2,027,489 1,999,810 1,605,181 4,282,234 1,836,331 Transfers - - 2,073,279 - - - (30,172) - 188,636 132,830
Total governmental activities 20,077,314 19,057,166 23,143,136 23,658,941 23,860,637 22,431,016 21,551,107 22,760,912 26,061,664 23,491,478
Business-type activities:Unrestricted investment income 13,461 - 93,381 382,856 568,053 569,710 242,779 167,933 76,918 52,352 Miscellaneous 518,176 - - - - - - - - - Other - 645,737 591,161 594,847 433,131 348,497 6,374 234,702 364,761 (26,105) Transfers - - (2,073,279) - - - 30,172 - (188,636) (132,830)
Total business-type activities 531,637 645,737 (1,388,737) 977,703 1,001,184 918,207 279,325 402,635 253,043 (106,583)
Total primary government $20,608,951 $19,702,903 $21,754,399 $24,636,644 $24,861,821 $23,349,223 $21,830,432 $23,163,547 $26,314,707 $23,384,895
Change in Net PositionGovernmental activities $7,886,353 $1,558,050 $11,597,559 $6,645,232 $4,132,587 $2,729,726 $1,945,698 ($1,548,509) $1,049,852 $8,819,644Business-type activities 506,935 1,025,344 (1,260,178) 1,503,524 1,357,105 1,057,470 2,450,649 1,370,695 403,651 494,728
Total primary government $8,393,288 $2,583,394 $10,337,381 $8,148,756 $5,489,692 $3,787,196 $4,396,347 ($177,814) $1,453,503 $9,314,372
City of RidgelandTable 4
Schedule of Changes in Net Position Last Ten Fiscal Years(accrual basis of accounting)
163
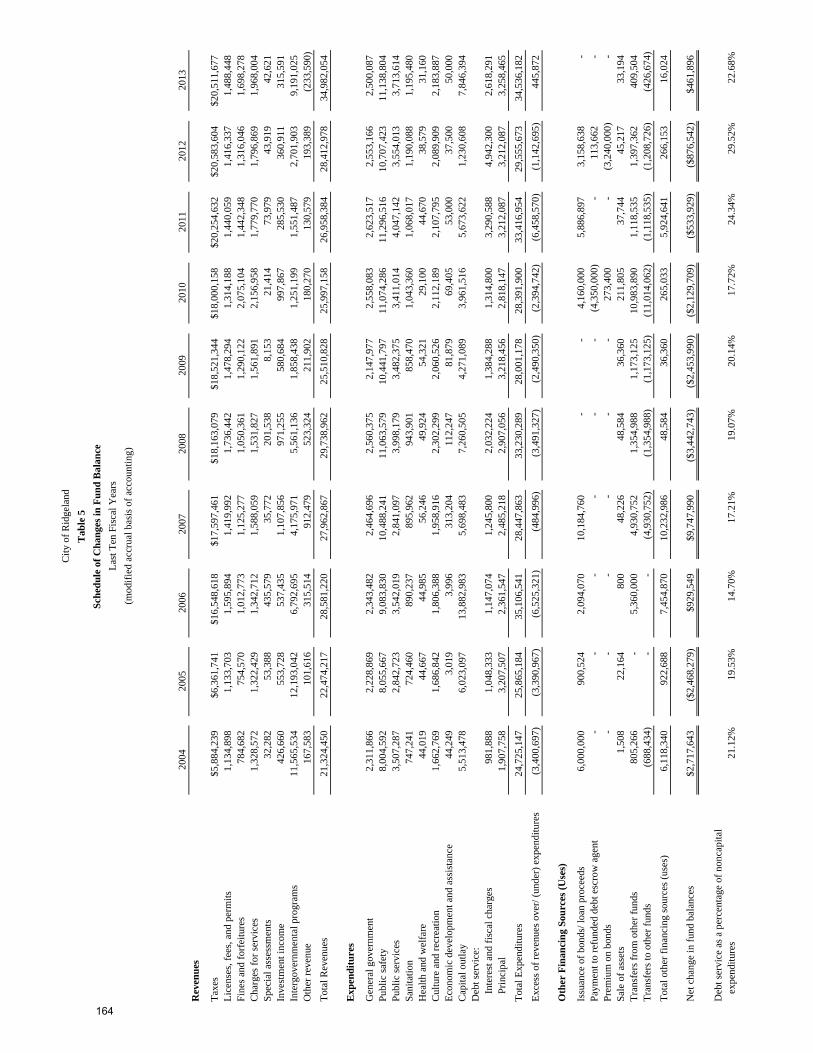
2004
2005
2006
2007
2008
2009
2010
2011
2012
2013
Rev
enu
es
Tax
es$5
,884
,239
$6,3
61,7
41$1
6,54
8,61
8$1
7,59
7,46
1$1
8,16
3,07
9$1
8,52
1,34
4$1
8,00
0,15
8$2
0,25
4,63
2$2
0,58
3,60
4$2
0,51
1,67
7L
icen
ses,
fee
s, a
nd p
erm
its
1,13
4,89
81,
133,
703
1,59
5,89
41,
419,
992
1,73
6,44
21,
478,
294
1,31
4,18
81,
440,
059
1,41
6,33
71,
488,
448
Fin
es a
nd f
orfe
itur
es78
4,68
275
4,57
01,
012,
773
1,12
5,27
71,
050,
361
1,29
0,12
22,
075,
104
1,44
2,34
81,
316,
046
1,69
8,27
8C
harg
es f
or s
ervi
ces
1,32
8,57
21,
322,
429
1,34
2,71
21,
588,
059
1,53
1,82
71,
561,
891
2,15
6,95
81,
779,
770
1,79
6,86
91,
968,
004
Spe
cial
ass
essm
ents
32,2
8253
,388
435,
579
35,7
7220
1,53
88,
153
21,4
1473
,979
43,9
1942
,621
Inve
stm
ent i
ncom
e42
6,66
055
3,72
853
7,43
51,
107,
856
971,
255
580,
684
997,
867
285,
530
360,
911
315,
591
Inte
rgov
ernm
enta
l pro
gram
s11
,565
,534
12,1
93,0
426,
792,
695
4,17
5,97
15,
561,
136
1,85
8,43
81,
251,
199
1,55
1,48
72,
701,
903
9,19
1,02
5O
ther
rev
enue
167,
583
101,
616
315,
514
912,
479
523,
324
211,
902
180,
270
130,
579
193,
389
(233
,590
)
Tot
al R
even
ues
21,3
24,4
5022
,474
,217
28,5
81,2
2027
,962
,867
29,7
38,9
6225
,510
,828
25,9
97,1
5826
,958
,384
28,4
12,9
7834
,982
,054
Exp
end
itu
res
Gen
eral
gov
ernm
ent
2,31
1,86
62,
228,
869
2,34
3,48
22,
464,
696
2,56
0,37
52,
147,
977
2,55
8,08
32,
623,
517
2,55
3,16
62,
500,
087
Pub
lic
safe
ty8,
004,
592
8,05
5,66
79,
083,
830
10,4
88,2
4111
,063
,579
10,4
41,7
9711
,074
,286
11,2
96,5
1610
,707
,423
11,1
38,8
04P
ubli
c se
rvic
es3,
507,
287
2,84
2,72
33,
542,
019
2,84
1,09
73,
998,
179
3,48
2,37
53,
411,
014
4,04
7,14
23,
554,
013
3,71
3,61
4S
anit
atio
n74
7,24
172
4,46
089
0,23
789
5,96
294
3,90
185
8,47
01,
043,
360
1,06
8,01
71,
190,
088
1,19
5,48
0H
ealt
h an
d w
elfa
re44
,019
44,6
6744
,985
56,2
4649
,924
54,3
2129
,100
44,6
7038
,579
31,1
60C
ultu
re a
nd r
ecre
atio
n1,
662,
769
1,68
6,84
21,
806,
388
1,95
8,91
62,
302,
299
2,06
0,52
62,
112,
189
2,10
7,79
52,
089,
909
2,18
3,88
7E
cono
mic
dev
elop
men
t and
ass
ista
nce
44,2
493,
019
3,99
631
3,20
411
2,24
781
,879
69,4
0553
,000
37,5
0050
,000
Cap
ital
out
lay
5,51
3,47
86,
023,
097
13,8
82,9
835,
698,
483
7,26
0,50
54,
271,
089
3,96
1,51
65,
673,
622
1,23
0,60
87,
846,
394
Deb
t ser
vice
:
Inte
rest
and
fis
cal c
harg
es98
1,88
81,
048,
333
1,14
7,07
41,
245,
800
2,03
2,22
41,
384,
288
1,31
4,80
03,
290,
588
4,94
2,30
02,
618,
291
P
rinc
ipal
1,90
7,75
83,
207,
507
2,36
1,54
72,
485,
218
2,90
7,05
63,
218,
456
2,81
8,14
73,
212,
087
3,21
2,08
73,
258,
465
Tot
al E
xpen
ditu
res
24,7
25,1
4725
,865
,184
35,1
06,5
4128
,447
,863
33,2
30,2
8928
,001
,178
28,3
91,9
0033
,416
,954
29,5
55,6
7334
,536
,182
Exc
ess
of r
even
ues
over
/ (un
der)
exp
endi
ture
s(3
,400
,697
)(3
,390
,967
)(6
,525
,321
)(4
84,9
96)
(3,4
91,3
27)
(2,4
90,3
50)
(2,3
94,7
42)
(6,4
58,5
70)
(1,1
42,6
95)
445,
872
Oth
er F
inan
cin
g S
ourc
es (
Use
s)
Issu
ance
of
bond
s/ lo
an p
roce
eds
6,00
0,00
090
0,52
42,
094,
070
10,1
84,7
60-
-
4,16
0,00
05,
886,
897
3,15
8,63
8-
P
aym
ent t
o re
fund
ed d
ebt e
scro
w a
gent
-
-
-
-
-
-
(4
,350
,000
)-
11
3,66
2-
P
rem
ium
on
bond
s-
-
-
-
-
-
273,
400
-
(3,2
40,0
00)
-
Sal
e of
ass
ets
1,50
822
,164
800
48,2
2648
,584
36,3
6021
1,80
537
,744
45,2
1733
,194
Tra
nsfe
rs f
rom
oth
er f
unds
805,
266
-
5,
360,
000
4,93
0,75
21,
354,
988
1,17
3,12
510
,983
,890
1,11
8,53
51,
397,
362
409,
504
Tra
nsfe
rs to
oth
er f
unds
(688
,434
)-
-
(4
,930
,752
)(1
,354
,988
)(1
,173
,125
)(1
1,01
4,06
2)(1
,118
,535
)(1
,208
,726
)(4
26,6
74)
Tot
al o
ther
fin
anci
ng s
ourc
es (
uses
)6,
118,
340
922,
688
7,45
4,87
010
,232
,986
48,5
8436
,360
265,
033
5,92
4,64
126
6,15
316
,024
Net
cha
nge
in f
und
bala
nces
$2,7
17,6
43($
2,46
8,27
9)$9
29,5
49$9
,747
,990
($3,
442,
743)
($2,
453,
990)
($2,
129,
709)
($53
3,92
9)($
876,
542)
$461
,896
Deb
t ser
vice
as
a pe
rcen
tage
of
nonc
apit
al
expe
ndit
ures
21.1
2%19
.53%
14.7
0%17
.21%
19.0
7%20
.14%
17.7
2%24
.34%
29.5
2%22
.68%
(mod
ifie
d ac
crua
l bas
is o
f ac
coun
ting
)
Cit
y of
Rid
gela
nd
Tab
le 5
Sch
edu
le o
f C
han
ges
in F
un
d B
alan
ce
Las
t Ten
Fis
cal Y
ears
164
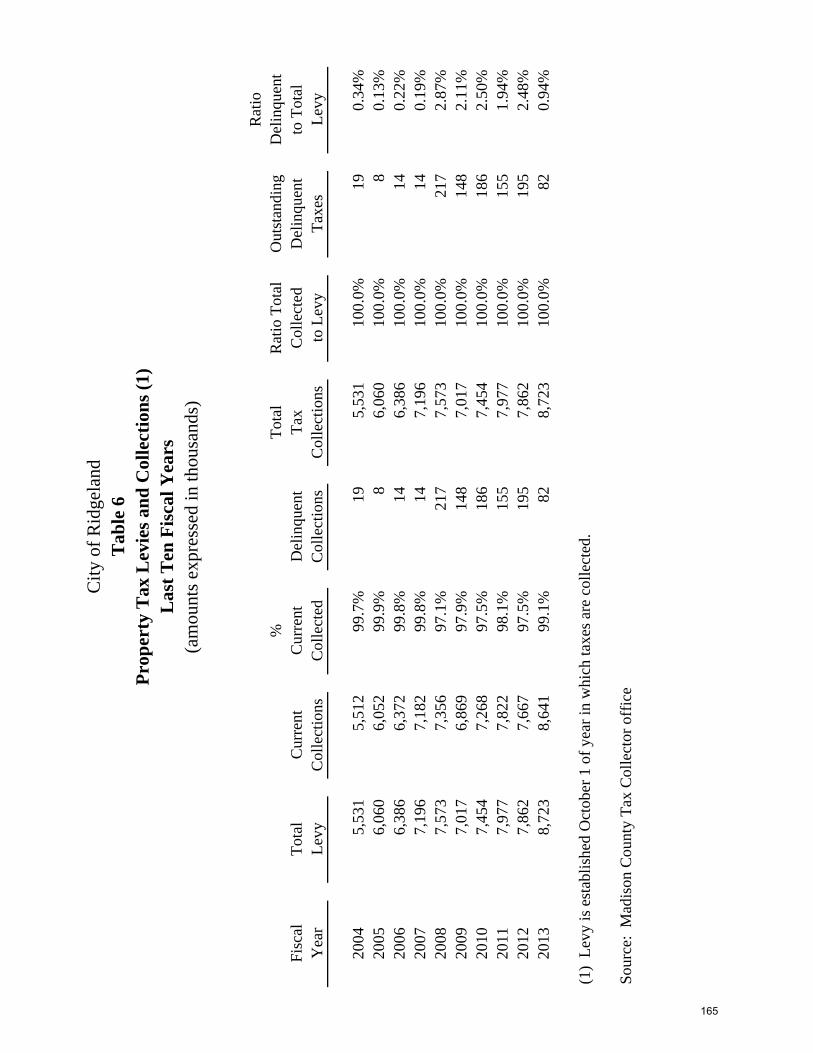
Cit
y of
Rid
gela
ndT
able
6P
rop
erty
Tax
Lev
ies
and
Col
lect
ion
s (1
)L
ast
Ten
Fis
cal Y
ears
(am
ount
s ex
pres
sed
in th
ousa
nds)
Rat
io%
Tot
alR
atio
Tot
alO
utst
andi
ngD
elin
quen
tF
isca
lT
otal
Cur
rent
Cur
rent
Del
inqu
ent
Tax
Col
lect
edD
elin
quen
tto
Tot
alY
ear
Lev
yC
olle
ctio
nsC
olle
cted
Col
lect
ions
Col
lect
ions
to L
evy
Tax
esL
evy
2004
5,53
15,
512
99.7
%19
5,53
110
0.0%
190.
34%
2005
6,06
06,
052
99.9
%8
6,06
010
0.0%
80.
13%
2006
6,38
66,
372
99.8
%14
6,38
610
0.0%
140.
22%
2007
7,19
67,
182
99.8
%14
7,19
610
0.0%
140.
19%
2008
7,57
37,
356
97.1
%21
77,
573
100.
0%21
72.
87%
2009
7,01
76,
869
97.9
%14
87,
017
100.
0%14
82.
11%
2010
7,45
47,
268
97.5
%18
67,
454
100.
0%18
62.
50%
2011
7,97
77,
822
98.1
%15
57,
977
100.
0%15
51.
94%
2012
7,86
27,
667
97.5
%19
57,
862
100.
0%19
52.
48%
2013
8,72
38,
641
99.1
%82
8,72
310
0.0%
820.
94%
(1)
Lev
y is
est
abli
shed
Oct
ober
1 o
f ye
ar in
whi
ch ta
xes
are
coll
ecte
d.
Sou
rce:
Mad
ison
Cou
nty
Tax
Col
lect
or o
ffic
e
165

Cit
y of
Rid
gela
ndT
able
7A
sses
sed
an
d A
ctu
al V
alu
e of
Pro
per
ty (
1)L
ast
Ten
Fis
cal Y
ears
(am
ount
s ex
pres
sed
in th
ousa
nds)
RE
AL
PR
OP
ER
TY
PE
RS
ON
AL
PR
OP
ER
TY
UT
ILIT
IES
VE
HIC
LE
ST
OT
AL
S%
Ass
esse
dF
isca
lA
sses
sed
Act
ual
Ass
esse
dA
ctua
lA
sses
sed
Act
ual
Ass
esse
dA
ctua
lA
sses
sed
Act
ual
Incr
ease
Yea
rV
alue
Val
ueV
alue
Val
ueV
alue
Val
ueV
alue
Val
ueV
alue
Val
ue(D
ecre
ase)
2004
192,
427
1,40
6,63
035
,467
236,
447
6,97
446
,493
55,1
6518
3,88
329
0,03
31,
873,
453
33.6
%(2
)20
0521
1,00
31,
542,
420
36,7
3724
4,91
37,
653
51,0
2052
,112
173,
707
307,
505
2,01
2,06
06.
0%20
0622
2,63
81,
627,
471
39,0
2526
0,16
78,
020
53,4
6754
,359
181,
197
324,
042
2,12
2,30
15.
4%20
0724
4,47
51,
787,
098
58,0
3838
6,92
05,
612
37,4
1356
,359
187,
863
364,
484
2,39
9,29
512
.5%
(3)
2008
255,
521
1,86
7,84
463
,575
423,
833
6,51
543
,433
57,7
1019
2,36
738
3,32
22,
527,
477
5.2%
2009
270,
611
1,97
8,15
153
,656
357,
707
6,49
043
,267
56,2
1018
7,36
738
6,96
72,
566,
491
1.0%
2010
294,
179
2,15
0,43
160
,092
400,
613
6,64
544
,300
51,8
9117
2,97
041
2,80
72,
768,
315
6.7%
2011
311,
607
2,27
7,82
965
,939
439,
593
5,21
834
,787
49,2
8316
4,27
743
2,04
72,
916,
486
4.7%
2012
315,
729
2,30
7,96
151
,047
340,
313
5,61
337
,420
48,2
9816
0,99
342
0,68
72,
846,
687
-2.6
%20
1331
8,90
52,
331,
177
54,6
9336
4,62
07,
063
47,0
8748
,691
162,
303
429,
352
2,90
5,18
72.
1%
(1)
Ass
essm
ent r
ates
are
as
foll
ows:
Rea
l Pro
pert
y -
Ass
esse
d at
10%
of
actu
al v
alue
for
hom
eow
ner-
occu
pied
, 15%
for
all
oth
ers.
Per
sona
l Pro
pert
y -
Ass
esse
d at
15%
of
actu
al v
alue
.U
tili
ties
- A
sses
sed
at 1
5% o
f ac
tual
val
ue.
Veh
icle
s -
Ass
esse
d at
30%
of
actu
al v
alue
.A
bove
sch
edue
use
s es
tim
ated
com
bine
d as
sess
men
t rat
io o
f 13
.68%
for
rea
l pro
pert
y.(2
) L
arge
incr
ease
due
in p
art t
o a
reas
sess
men
t.(3
) L
arge
incr
ease
due
in p
art t
o ar
ea a
nnex
ed g
oing
on
the
tax
roll
s.(4
) T
he w
eigh
ted
aver
age
of a
ll in
divi
dual
dir
ect r
ates
is 1
4.9%
.S
ourc
e: M
adis
on C
ount
y T
ax A
sses
sor
166
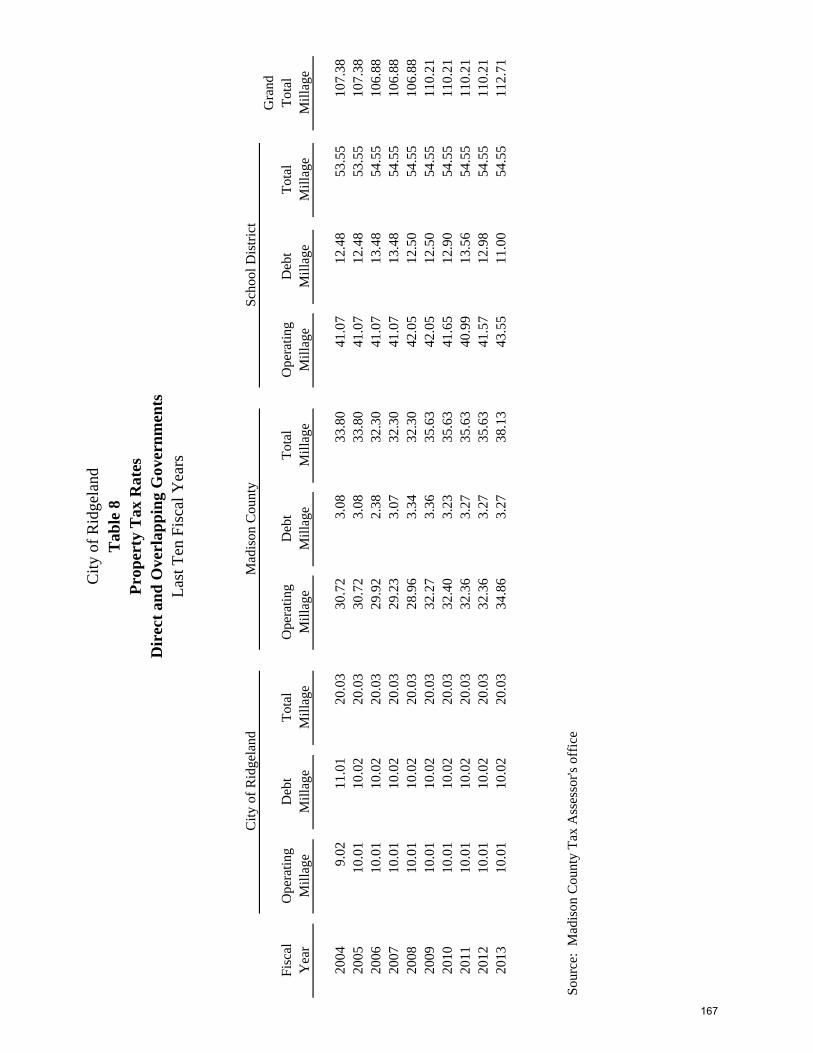
Cit
y of
Rid
gela
ndT
able
8P
rop
erty
Tax
Rat
esD
irec
t an
d O
verl
app
ing
Gov
ern
men
tsL
ast T
en F
isca
l Yea
rs
Cit
y of
Rid
gela
ndM
adis
on C
ount
yS
choo
l Dis
tric
tG
rand
Fis
cal
Ope
rati
ngD
ebt
Tot
alO
pera
ting
Deb
tT
otal
Ope
rati
ngD
ebt
Tot
alT
otal
Yea
rM
illa
geM
illa
geM
illa
geM
illa
geM
illa
geM
illa
geM
illa
geM
illa
geM
illa
geM
illa
ge
2004
9.02
11.0
120
.03
30.7
23.
0833
.80
41.0
712
.48
53.5
510
7.38
2005
10.0
110
.02
20.0
330
.72
3.08
33.8
041
.07
12.4
853
.55
107.
3820
0610
.01
10.0
220
.03
29.9
22.
3832
.30
41.0
713
.48
54.5
510
6.88
2007
10.0
110
.02
20.0
329
.23
3.07
32.3
041
.07
13.4
854
.55
106.
8820
0810
.01
10.0
220
.03
28.9
63.
3432
.30
42.0
512
.50
54.5
510
6.88
2009
10.0
110
.02
20.0
332
.27
3.36
35.6
342
.05
12.5
054
.55
110.
2120
1010
.01
10.0
220
.03
32.4
03.
2335
.63
41.6
512
.90
54.5
511
0.21
2011
10.0
110
.02
20.0
332
.36
3.27
35.6
340
.99
13.5
654
.55
110.
2120
1210
.01
10.0
220
.03
32.3
63.
2735
.63
41.5
712
.98
54.5
511
0.21
2013
10.0
110
.02
20.0
334
.86
3.27
38.1
343
.55
11.0
054
.55
112.
71
Sou
rce:
Mad
ison
Cou
nty
Tax
Ass
esso
r's o
ffic
e
167

Cit
y of
Rid
gela
ndT
able
9P
rin
cip
al T
axp
ayer
sC
urre
nt a
nd N
ine
Yea
rs A
go(a
mou
nts
expr
esse
d in
thou
sand
s)
2013
2004
% o
f T
otal
% o
f T
otal
Typ
e of
Ass
esse
dA
sses
sed
Typ
e of
Ass
esse
dA
sses
sed
Tax
paye
rB
usin
ess
Val
uati
onR
ank
Val
uati
onB
usin
ess
Val
uati
onR
ank
Val
uati
onR
enai
ssan
ce a
t Col
ony
Par
k, L
LC
Lif
esty
le C
ente
r8,
922
$
12.
34%
Nor
thpa
rk M
all L
PS
hopp
ing
Mal
l7,
765
22.
04%
$7,3
231
4.28
%
200
Ren
aiss
ance
, LL
CO
ffic
e B
uild
ing
7,52
2
3
1.98
%
300
Ren
aiss
ance
, LL
CO
ffic
e B
uild
ing
4,77
1
4
1.25
%
Tra
ce A
part
men
ts, L
PA
part
men
ts2,
976
50.
78%
Leg
acy
Par
k A
part
men
ts, L
LC
Apa
rtm
ents
2,79
06
0.73
%
Nat
chez
Tra
ce -
BH
, LL
CA
part
men
ts2,
657
70.
70%
Sou
ther
n F
arm
Bur
eau
Cas
ualt
y In
sura
nce
Insu
ranc
e2,
628
80.
69%
2,19
67
1.28
%
Sun
chas
e of
Rid
gela
nd, L
td.
Apa
rtm
ents
2,58
79
0.68
%2,
152
81.
26%
Mid
-Am
eric
a C
apit
al P
artn
ers,
LP
Apa
rtm
ents
2,56
710
0.67
%1,
991
91.
16%
AT
&T
WS
IT
elec
omm
unic
atio
n s4,
240
22.
48%
Col
onia
l Rea
lty,
LP
Apa
rtm
ents
4,20
83
2.46
%
Ent
ergy
Mis
siss
ippi
, Inc
.E
nerg
y3,
729
42.
18%
Bel
lSou
th T
elec
omm
unic
atio
ns, I
nc.
Tel
ecom
mun
icat
ion s
3,51
55
2.05
%
TM
Van
Mar
k P
artn
ers
Ltd
Apa
rtm
ents
2,50
36
1.46
%
Mad
ison
Apa
rtm
ents
the
LL
CA
part
men
ts1,
785
101.
04%
Tot
al ta
xabl
e as
sess
ed v
alue
of
10 la
rges
t tax
paye
rs45
,185
11.8
7%$3
3,64
219
.65%
Tot
al ta
xabl
e as
sess
ed v
alue
of
othe
r ta
xpay
ers
335,
476
88.1
3%13
7,58
380
.35%
Tot
al ta
xabl
e as
sess
ed v
alue
of
all t
axpa
yers
$380
,661
100.
00%
$171
,225
100.
00%
Sou
rce:
M
adis
on C
ount
y T
ax A
sses
sor's
Off
ice
168
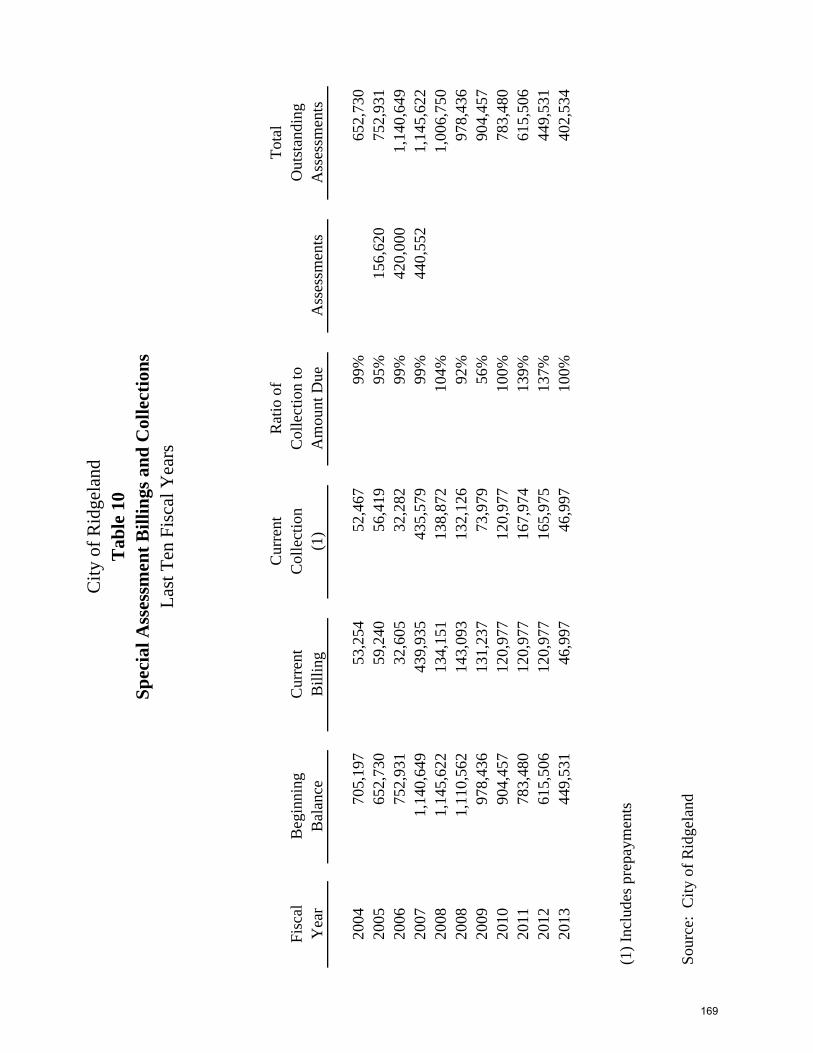
Cit
y of
Rid
gela
ndT
able
10
Sp
ecia
l Ass
essm
ent
Bil
lin
gs a
nd
Col
lect
ion
sL
ast T
en F
isca
l Yea
rs
Cur
rent
Rat
io o
fT
otal
Fis
cal
Beg
inni
ngC
urre
ntC
olle
ctio
nC
olle
ctio
n to
Out
stan
ding
Yea
rB
alan
ceB
illi
ng(1
)A
mou
nt D
ueA
sses
smen
tsA
sses
smen
ts
2004
705,
197
53,2
5452
,467
99%
652,
730
2005
652,
730
59,2
4056
,419
95%
156,
620
752,
931
2006
752,
931
32,6
0532
,282
99%
420,
000
1,14
0,64
920
071,
140,
649
439,
935
435,
579
99%
440,
552
1,14
5,62
220
081,
145,
622
134,
151
138,
872
104%
1,00
6,75
020
081,
110,
562
143,
093
132,
126
92%
978,
436
2009
978,
436
131,
237
73,9
7956
%90
4,45
720
1090
4,45
712
0,97
712
0,97
710
0%78
3,48
020
1178
3,48
012
0,97
716
7,97
413
9%61
5,50
620
1261
5,50
612
0,97
716
5,97
513
7%44
9,53
120
1344
9,53
146
,997
46,9
9710
0%40
2,53
4
(1)
Incl
udes
pre
paym
ents
Sou
rce:
Cit
y of
Rid
gela
nd
169
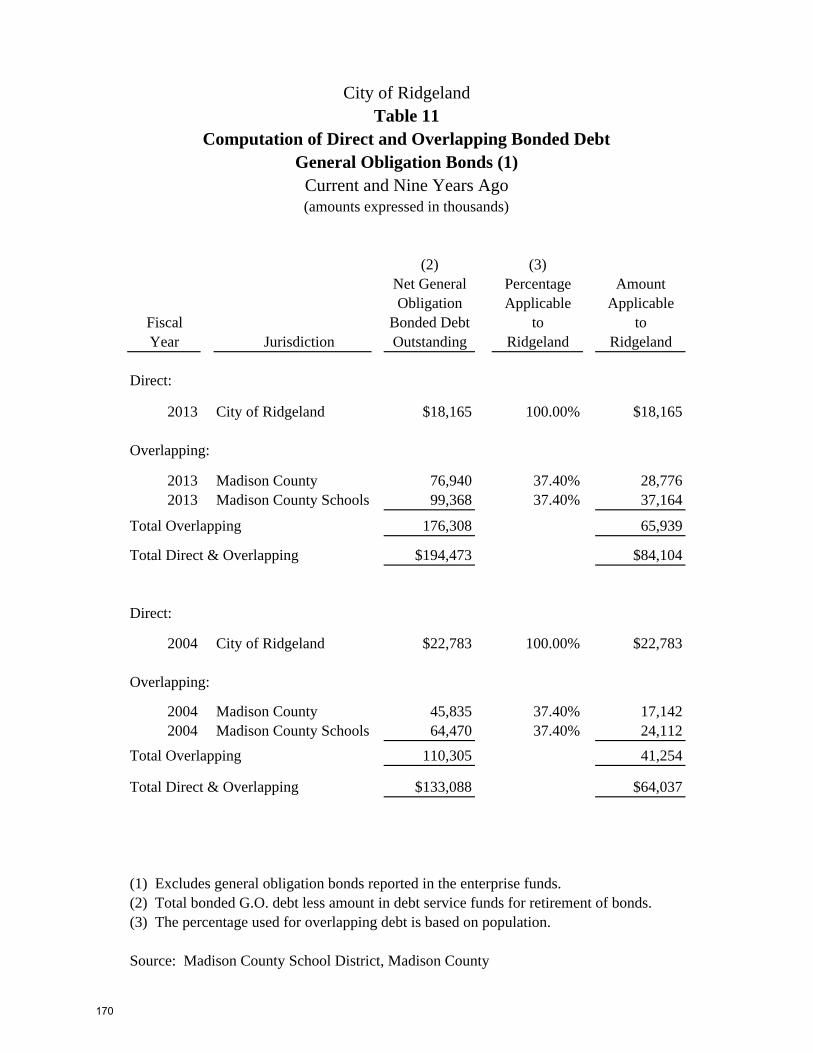
(2) (3)Net General Percentage AmountObligation Applicable Applicable
Fiscal Bonded Debt to toYear Jurisdiction Outstanding Ridgeland Ridgeland
Direct:
2013 City of Ridgeland $18,165 100.00% $18,165
Overlapping:
2013 Madison County 76,940 37.40% 28,7762013 Madison County Schools 99,368 37.40% 37,164
Total Overlapping 176,308 65,939
Total Direct & Overlapping $194,473 $84,104
Direct:
2004 City of Ridgeland $22,783 100.00% $22,783
Overlapping:
2004 Madison County 45,835 37.40% 17,1422004 Madison County Schools 64,470 37.40% 24,112
Total Overlapping 110,305 41,254
Total Direct & Overlapping $133,088 $64,037
(1) Excludes general obligation bonds reported in the enterprise funds.(2) Total bonded G.O. debt less amount in debt service funds for retirement of bonds.(3) The percentage used for overlapping debt is based on population.
Source: Madison County School District, Madison County
(amounts expressed in thousands)
City of RidgelandTable 11
Computation of Direct and Overlapping Bonded DebtGeneral Obligation Bonds (1)
Current and Nine Years Ago
170
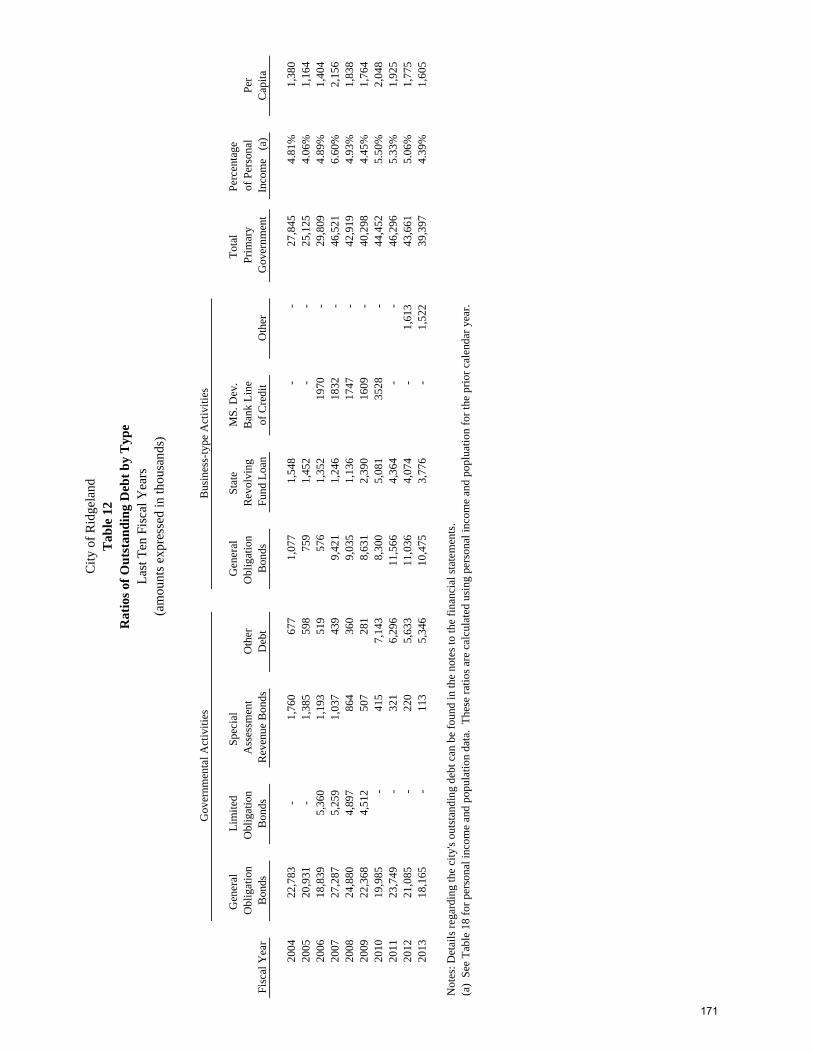
Cit
y of
Rid
gela
ndT
able
12
Rat
ios
of O
uts
tan
din
g D
ebt
by
Typ
eL
ast T
en F
isca
l Yea
rs(a
mou
nts
expr
esse
d in
thou
sand
s)
Gov
ernm
enta
l Act
ivit
ies
Bus
ines
s-ty
pe A
ctiv
itie
s
Gen
eral
L
imit
edS
peci
al
Gen
eral
Sta
te
MS
. Dev
.T
otal
P
erce
ntag
e O
blig
atio
nO
blig
atio
n A
sses
smen
tO
ther
Obl
igat
ion
Rev
olvi
ng
Ban
k L
ine
Pri
mar
yof
Per
sona
lP
erF
isca
l Yea
rB
onds
Bon
dsR
even
ue B
onds
Deb
tB
onds
Fun
d L
oan
of C
redi
tO
ther
Gov
ernm
ent
Inco
me
(a)
Cap
ita
2004
22,7
83-
1,76
067
71,
077
1,54
8-
-
27
,845
4.81
%1,
380
2005
20,9
31-
1,38
559
875
91,
452
-
-
25,1
254.
06%
1,16
420
0618
,839
5,36
01,
193
519
576
1,35
219
70-
29,8
094.
89%
1,40
420
0727
,287
5,25
91,
037
439
9,42
11,
246
1832
-
46
,521
6.60
%2,
156
2008
24,8
804,
897
864
360
9,03
51,
136
1747
-
42
,919
4.93
%1,
838
2009
22,3
684,
512
507
281
8,63
12,
390
1609
-
40
,298
4.45
%1,
764
2010
19,9
85
-
41
5
7,14
3
8,30
0
5,08
1
3528
-
44
,452
5.50
%2,
048
2011
23,7
49
-
32
1
6,29
6
11,5
66
4,36
4
-
-
46,2
965.
33%
1,92
520
1221
,085
-
220
5,
633
11
,036
4,
074
-
1,61
343
,661
5.06
%1,
775
2013
18,1
65
-
11
3
5,34
6
10,4
75
3,77
6
-
1,
522
39,3
974.
39%
1,60
5
Not
es: D
etai
ls r
egar
ding
the
city
's o
utst
andi
ng d
ebt c
an b
e fo
und
in th
e no
tes
to th
e fi
nanc
ial s
tate
men
ts.
(a)
See
Tab
le 1
8 fo
r pe
rson
al in
com
e an
d po
pula
tion
dat
a. T
hese
rat
ios
are
calc
ulat
ed u
sing
per
sona
l inc
ome
and
popl
uati
on f
or th
e pr
ior
cale
ndar
yea
r.
171
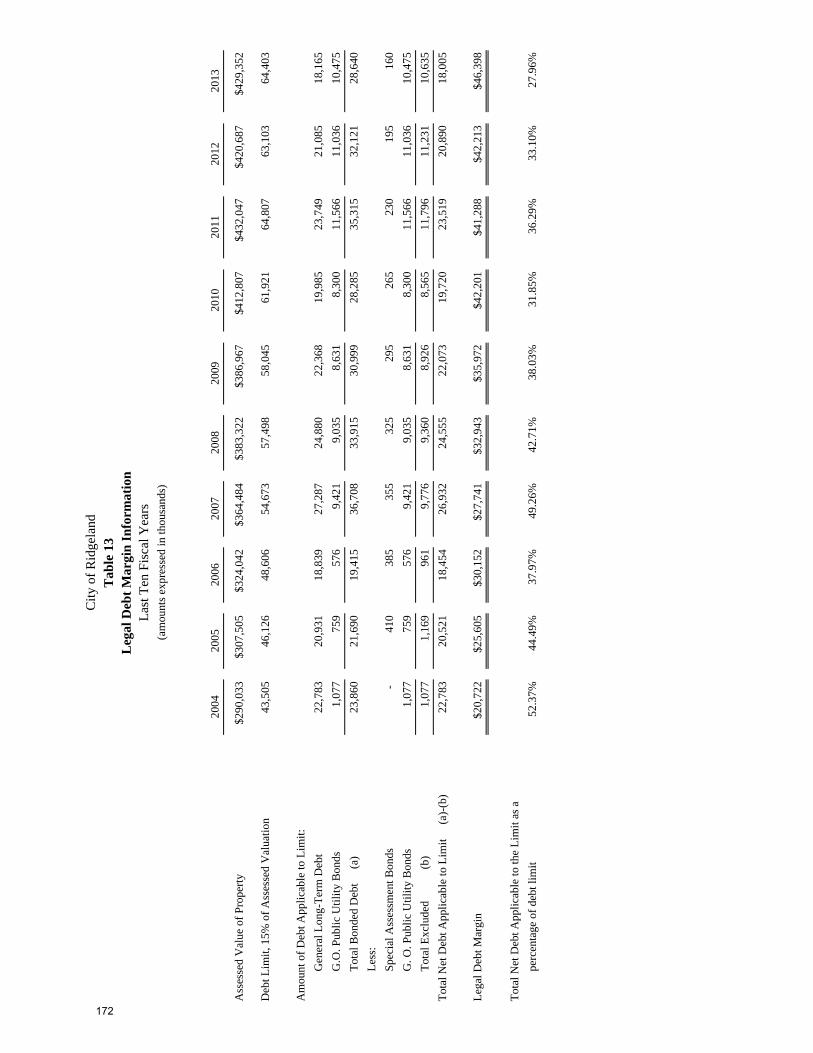
2004
2005
2006
2007
2008
2009
2010
2011
2012
2013
Ass
esse
d V
alue
of
Pro
pert
y$2
90,0
33$3
07,5
05$3
24,0
42$3
64,4
84$3
83,3
22$3
86,9
67$4
12,8
07$4
32,0
47$4
20,6
87$4
29,3
52
Deb
t Lim
it, 1
5% o
f A
sses
sed
Val
uati
on43
,505
46,1
2648
,606
54,6
7357
,498
58,0
4561
,921
64,8
0763
,103
64,4
03
Am
ount
of
Deb
t App
lica
ble
to L
imit
:
Gen
eral
Lon
g-T
erm
Deb
t22
,783
20,9
3118
,839
27,2
8724
,880
22,3
6819
,985
23,7
4921
,085
18,1
65
G.O
. Pub
lic
Uti
lity
Bon
ds1,
077
759
576
9,42
19,
035
8,63
18,
300
11,5
6611
,036
10,4
75
Tot
al B
onde
d D
ebt
(a
)23
,860
21,6
9019
,415
36,7
0833
,915
30,9
9928
,285
35,3
1532
,121
28,6
40
Les
s:
Spe
cial
Ass
essm
ent B
onds
-
410
385
355
325
295
265
230
195
160
G. O
. Pub
lic
Uti
lity
Bon
ds1,
077
759
576
9,42
19,
035
8,63
18,
300
11,5
6611
,036
10,4
75
Tot
al E
xclu
ded
(
b)1,
077
1,16
996
19,
776
9,36
08,
926
8,56
511
,796
11,2
3110
,635
Tot
al N
et D
ebt A
ppli
cabl
e to
Lim
it
(a)
-(b)
22,7
8320
,521
18,4
5426
,932
24,5
5522
,073
19,7
2023
,519
20,8
9018
,005
Leg
al D
ebt M
argi
n$2
0,72
2$2
5,60
5$3
0,15
2$2
7,74
1$3
2,94
3$3
5,97
2$4
2,20
1$4
1,28
8$4
2,21
3$4
6,39
8
Tot
al N
et D
ebt A
ppli
cabl
e to
the
Lim
it a
s a
perc
enta
ge o
f de
bt li
mit
52.3
7%44
.49%
37.9
7%49
.26%
42.7
1%38
.03%
31.8
5%36
.29%
33.1
0%27
.96%
(am
ount
s ex
pres
sed
in th
ousa
nds)
Cit
y of
Rid
gela
ndT
able
13
Leg
al D
ebt
Mar
gin
In
form
atio
nL
ast T
en F
isca
l Yea
rs
172
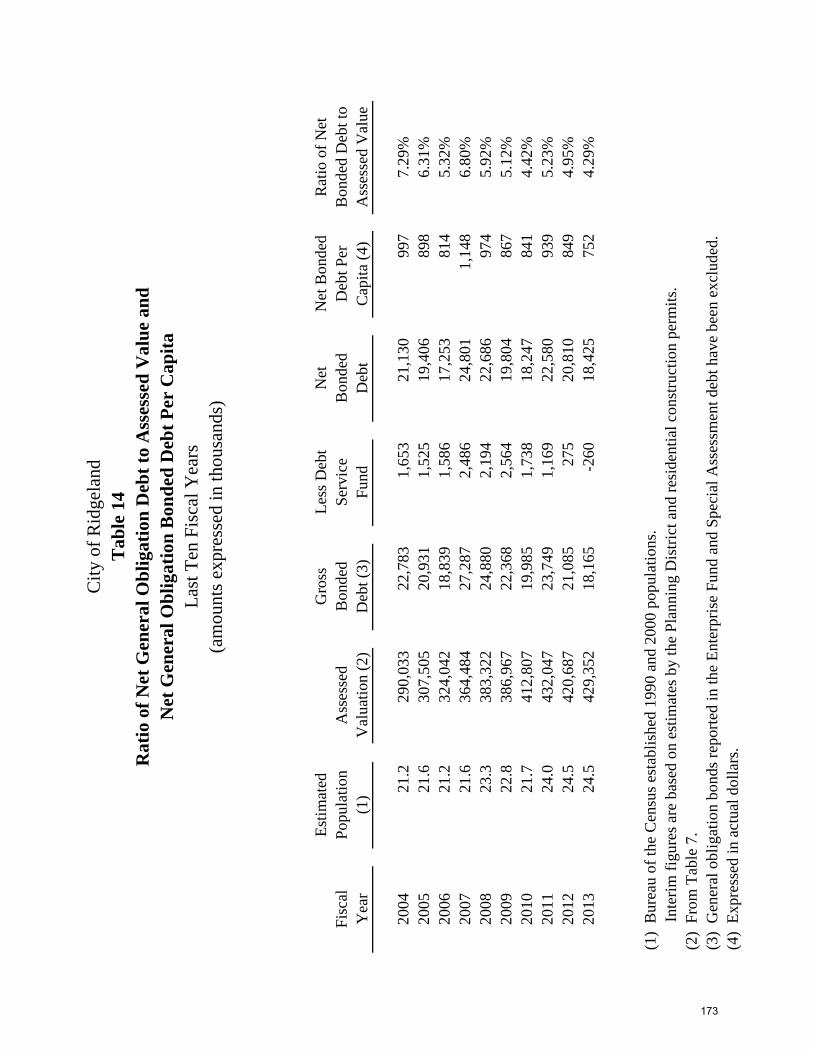
Cit
y of
Rid
gela
ndT
able
14
Rat
io o
f N
et G
ener
al O
bli
gati
on D
ebt
to A
sses
sed
Val
ue
and
Net
Gen
eral
Ob
liga
tion
Bon
ded
Deb
t P
er C
apit
aL
ast T
en F
isca
l Yea
rs(a
mou
nts
expr
esse
d in
thou
sand
s)
Est
imat
edG
ross
Les
s D
ebt
Net
Net
Bon
ded
Rat
io o
f N
etF
isca
lP
opul
atio
nA
sses
sed
Bon
ded
Ser
vice
Bon
ded
Deb
t Per
Bon
ded
Deb
t to
Yea
r(1
)V
alua
tion
(2)
Deb
t (3)
Fun
dD
ebt
Cap
ita
(4)
Ass
esse
d V
alue
2004
21.2
290,
033
22,7
831,
653
21,1
3099
77.
29%
2005
21.6
307,
505
20,9
311,
525
19,4
0689
86.
31%
2006
21.2
324,
042
18,8
391,
586
17,2
5381
45.
32%
2007
21.6
364,
484
27,2
872,
486
24,8
011,
148
6.80
%20
0823
.338
3,32
224
,880
2,19
422
,686
974
5.92
%20
0922
.838
6,96
722
,368
2,56
419
,804
867
5.12
%20
1021
.741
2,80
719
,985
1,73
818
,247
841
4.42
%20
1124
.043
2,04
723
,749
1,16
922
,580
939
5.23
%20
1224
.542
0,68
721
,085
275
20,8
1084
94.
95%
2013
24.5
429,
352
18,1
65-2
6018
,425
752
4.29
%
(1)
Bur
eau
of th
e C
ensu
s es
tabl
ishe
d 19
90 a
nd 2
000
popu
lati
ons.
Int
erim
fig
ures
are
bas
ed o
n es
tim
ates
by
the
Pla
nnin
g D
istr
ict a
nd r
esid
enti
al c
onst
ruct
ion
perm
its.
(2)
Fro
m T
able
7.
(3)
Gen
eral
obl
igat
ion
bond
s re
port
ed in
the
Ent
erpr
ise
Fun
d an
d S
peci
al A
sses
smen
t deb
t hav
e be
en e
xclu
ded.
(4)
Exp
ress
ed in
act
ual d
olla
rs.
173

Cit
y of
Rid
gela
ndT
able
15
Rat
io o
f A
nn
ual
Deb
t S
ervi
ce E
xpen
dit
ure
s fo
rG
ener
al O
bli
gati
on B
ond
ed D
ebt
to T
otal
Gov
ern
men
tal E
xpen
dit
ure
s (
1)L
ast T
en F
isca
l Yea
rs(a
mou
nts
expr
esse
d in
thou
sand
s)
Rat
io o
f D
ebt
Tot
alT
otal
Ser
vice
to G
ener
alF
isca
lD
ebt
Gov
ernm
enta
lG
over
nmen
tal
Yea
rP
rinc
ipal
Inte
rest
Ser
vice
Exp
endi
ture
sE
xpen
ditu
res
2004
1,90
898
22,
890
19,2
1215
.04%
2005
2,47
195
83,
429
25,8
6513
.26%
2006
2,28
01,
102
3,38
235
,106
9.63
%20
072,
110
592
2,70
228
,448
9.50
%20
082,
907
2,01
24,
919
33,2
3014
.80%
2009
3,21
81,
384
4,60
228
,001
16.4
4%20
102,
218
935
3,15
328
,392
11.1
1%20
113,
212
3,19
46,
406
33,4
1719
.17%
2012
3,47
44,
627
8,10
129
,595
27.3
7%20
133,
258
2,60
65,
864
34,5
3616
.98%
(1)
Inc
lude
s S
peci
al A
sses
smen
t Bon
ds.
Gen
eral
Obl
igat
ion
bond
s re
port
ed in
the
Ent
erpr
ise
Fun
d ha
ve b
een
excl
uded
.
174
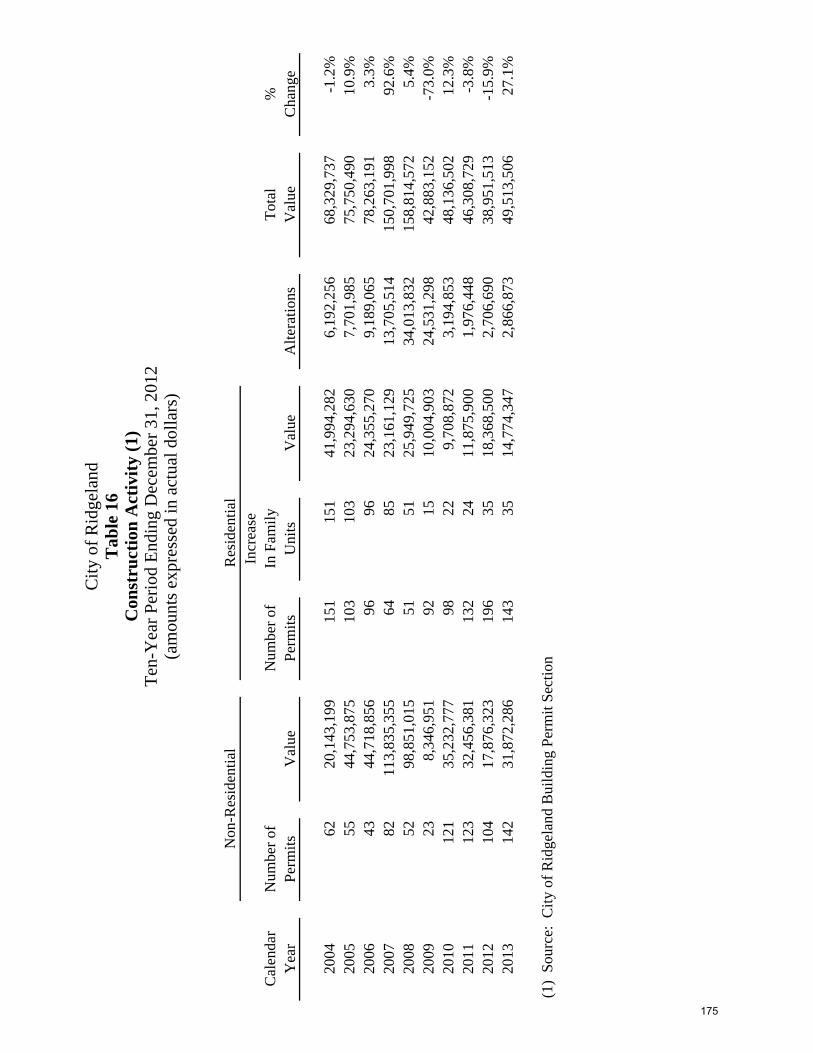
Incr
ease
Cal
enda
rN
umbe
r of
Num
ber
ofIn
Fam
ily
Tot
al%
Yea
rP
erm
its
Val
ueP
erm
its
Uni
tsV
alue
Alt
erat
ions
Val
ueC
hang
e
2004
6220
,143
,199
151
151
41,9
94,2
826,
192,
256
68,3
29,7
37-1
.2%
2005
5544
,753
,875
103
103
23,2
94,6
307,
701,
985
75,7
50,4
9010
.9%
2006
4344
,718
,856
9696
24,3
55,2
709,
189,
065
78,2
63,1
913.
3%20
0782
113,
835,
355
6485
23,1
61,1
2913
,705
,514
150,
701,
998
92.6
%20
0852
98,8
51,0
1551
5125
,949
,725
34,0
13,8
3215
8,81
4,57
25.
4%20
0923
8,34
6,95
192
1510
,004
,903
24,5
31,2
9842
,883
,152
-73.
0%20
1012
135
,232
,777
9822
9,70
8,87
23,
194,
853
48,1
36,5
0212
.3%
2011
123
32,4
56,3
8113
224
11,8
75,9
001,
976,
448
46,3
08,7
29-3
.8%
2012
104
17,8
76,3
2319
635
18,3
68,5
002,
706,
690
38,9
51,5
13-1
5.9%
2013
142
31,8
72,2
8614
335
14,7
74,3
472,
866,
873
49,5
13,5
0627
.1%
(1)
Sou
rce:
Cit
y of
Rid
gela
nd B
uild
ing
Per
mit
Sec
tion
Res
iden
tial
Cit
y of
Rid
gela
ndT
able
16
Con
stru
ctio
n A
ctiv
ity
(1)
Ten
-Yea
r P
erio
d E
ndin
g D
ecem
ber
31, 2
012
(am
ount
s ex
pres
sed
in a
ctua
l dol
lars
)
Non
-Res
iden
tial
175

Cit
y of
Rid
gela
ndT
able
17
Pro
per
ty V
alu
e an
d C
onst
ruct
ion
Las
t Ten
Cal
enda
r Y
ears
(am
ount
s ex
pres
sed
in th
ousa
nds)
Non
-Res
iden
tial
Res
iden
tial
Add
itio
ns/
Con
stru
ctio
n (1
)C
onst
ruct
ion
(1)
Alt
erat
ions
(1)
Rea
lF
isca
lP
rope
rty
Num
ber
Num
ber
Num
ber
Yea
rV
alue
(2)
of U
nits
Val
ueof
Uni
tsV
alue
of U
nits
Val
ue
2004
1,40
6,63
062
20,1
4315
141
,994
160
6,19
220
051,
542,
420
5544
,754
103
23,2
9515
87,
702
2006
1,62
7,47
143
44,7
1996
24,3
5515
89,
189
2007
1,78
7,09
882
113,
835
8523
,161
209
13,7
0620
081,
867,
844
5298
,851
5125
,950
*34
,014
2009
1,97
8,15
123
8,34
715
10,0
0593
24,5
3120
102,
150,
431
121
35,2
3322
9,70
976
3,19
520
112,
277,
829
123
32,4
5624
11,8
7610
81,
976
2012
2,30
7,96
110
417
,876
3518
,369
161
2,70
720
132,
331,
177
142
31,8
7235
14,7
7410
82,
867
(1)
Fro
m T
able
16
(2)
Tot
al e
stim
ated
act
ual v
alue
fro
m T
able
7
Sou
rce:
Cit
y of
Rid
gela
nd
* 2
008
info
rmat
ion
was
not
ava
ilab
le a
t the
tim
e th
is r
epor
t was
pre
pare
d
176

Cit
y of
Rid
gela
ndT
able
18
Dem
ogra
ph
ic a
nd
Eco
nom
ic S
tati
stic
sL
ast T
en C
alen
dar
Yea
rs
Per
sona
lP
erIn
com
eC
apit
aC
ount
yC
alen
dar
(tho
usan
dsP
erso
nal
Med
ian
Sch
ool
Une
mpl
oym
ent
Yea
rP
opul
atio
nof
dol
lars
)In
com
eA
geE
nrol
lmen
tR
ate
2004
20,1
73
579,
046
28,7
04
31.9
10,2
49
4.3%
2005
21,5
77
619,
346
28,7
04
31.9
10,6
97
3.2%
2006
21,2
37
609,
587
28,7
04
31.9
10,6
58
4.7%
2007
21,5
77
705,
028
32,6
75
33.9
10,7
77
4.5%
2008
23,3
47
871,
170
37,3
14
33.5
10,8
96
5.8%
2009
22,8
49
904,
957
39,6
06
32.0
11,4
87
6.3%
2010
21,7
08
807,
538
37,2
00
34.4
11,5
75
5.7%
2011
24,0
47
869,
299
36,1
50
34.4
12,1
59
7.6%
2012
24,5
96
863,
147
35,0
93
34.4
11,8
11
6.5%
2013
24,5
42
898,
360
36,6
05
34.2
12,1
82
6.3%
Sou
rce:
U. S
. Cen
sus
Bur
eau
Mis
siss
ippi
Dev
elop
men
t Aut
hori
ty
E
cono
mic
and
Com
mun
ity
Dev
elop
men
t Sec
tion
U. S
. Lab
or B
urea
u S
tati
stic
s
177

Cit
y of
Rid
gela
ndT
able
19
Ed
uca
tion
Rel
ated
In
form
atio
nL
ast 1
0 F
isca
l Yea
rs
Tot
alF
isca
lE
lem
enta
ry
Mid
dle
Hig
hV
ocat
iona
lJu
nior
C
ount
yY
ear
Sch
ools
Sch
ools
Sch
ools
Sch
ools
Col
lege
Enr
ollm
ent
2004
21
11
110
,249
2005
21
11
110
,697
2006
21
11
110
,658
2007
21
11
110
,777
2008
21
11
110
,896
2009
21
11
111
,487
2010
21
11
111
,575
2011
21
11
112
,159
2012
21
11
111
,811
2013
21
11
112
,182
Sou
rce:
Cit
y of
Rid
gela
nd
178
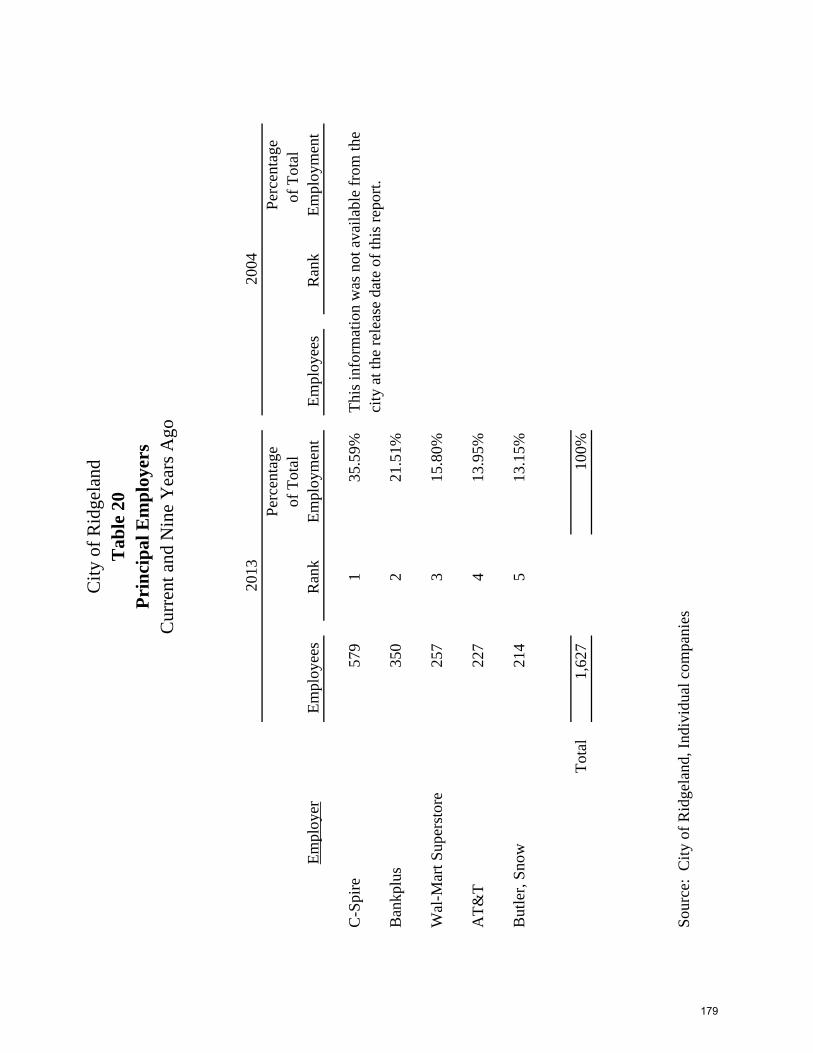
Per
cent
age
Per
cent
age
of T
otal
of T
otal
E
mpl
oyer
Em
ploy
ees
Ran
kE
mpl
oym
ent
Em
ploy
ees
Ran
kE
mpl
oym
ent
C-S
pire
579
135
.59%
Thi
s in
form
atio
n w
as n
ot a
vail
able
fro
m th
eci
ty a
t the
rel
ease
dat
e of
this
rep
ort.
Ban
kplu
s35
0
2
21.5
1%
Wal
-Mar
t Sup
erst
ore
257
315
.80%
AT
&T
227
413
.95%
But
ler,
Sno
w21
4
5
13.1
5%
Tot
al1,
627
10
0%
Sou
rce:
Cit
y of
Rid
gela
nd, I
ndiv
idua
l com
pani
es
2013
2004
Cit
y of
Rid
gela
ndT
able
20
Pri
nci
pal
Em
plo
yers
Cur
rent
and
Nin
e Y
ears
Ago
179
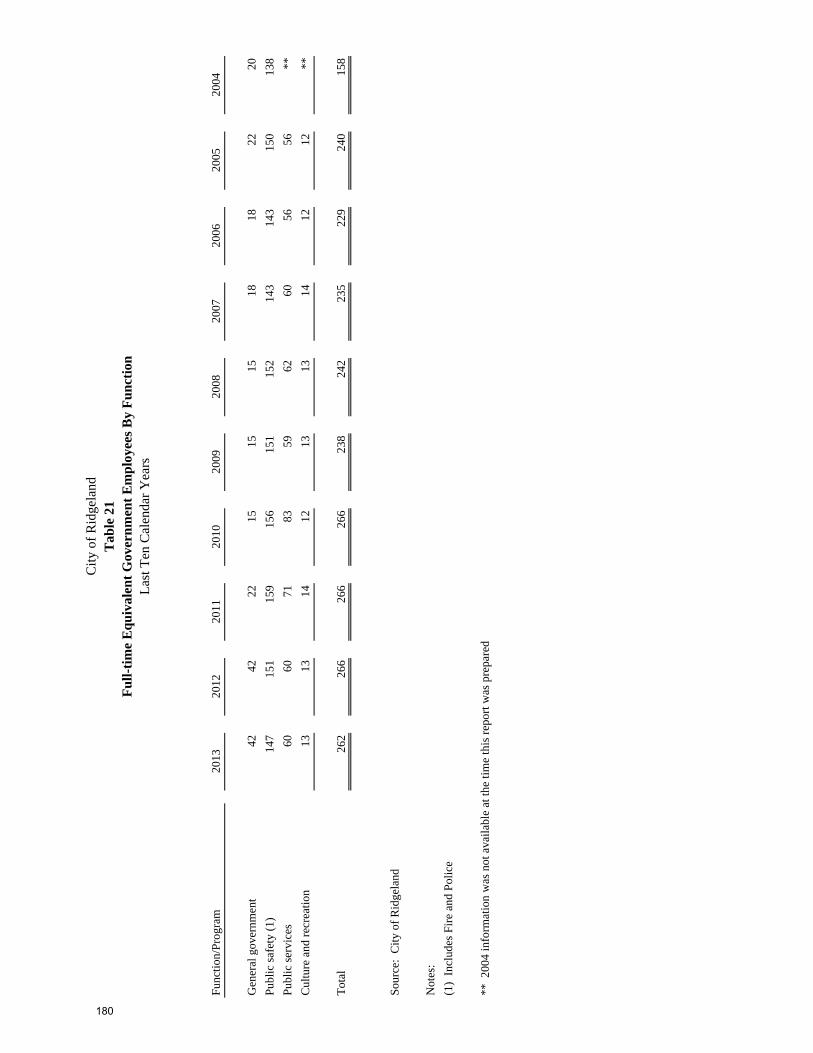
Cit
y of
Rid
gela
ndT
able
21
Fu
ll-t
ime
Eq
uiv
alen
t G
over
nm
ent
Em
plo
yees
By
Fu
nct
ion
Las
t Ten
Cal
enda
r Y
ears
Fun
ctio
n/P
rogr
am20
1320
1220
1120
1020
0920
0820
0720
0620
0520
04
Gen
eral
gov
ernm
ent
4242
2215
1515
1818
2220
Pub
lic
safe
ty (
1)14
715
115
915
615
115
214
314
315
013
8
Pub
lic
serv
ices
6060
7183
5962
6056
56**
Cul
ture
and
rec
reat
ion
1313
1412
1313
1412
12**
Tot
al26
226
626
626
623
824
223
522
924
015
8
Sou
rce:
Cit
y of
Rid
gela
nd
Not
es:
(1)
Inc
lude
s F
ire
and
Pol
ice
** 2
004
info
rmat
ion
was
not
ava
ilab
le a
t the
tim
e th
is r
epor
t was
pre
pare
d
180
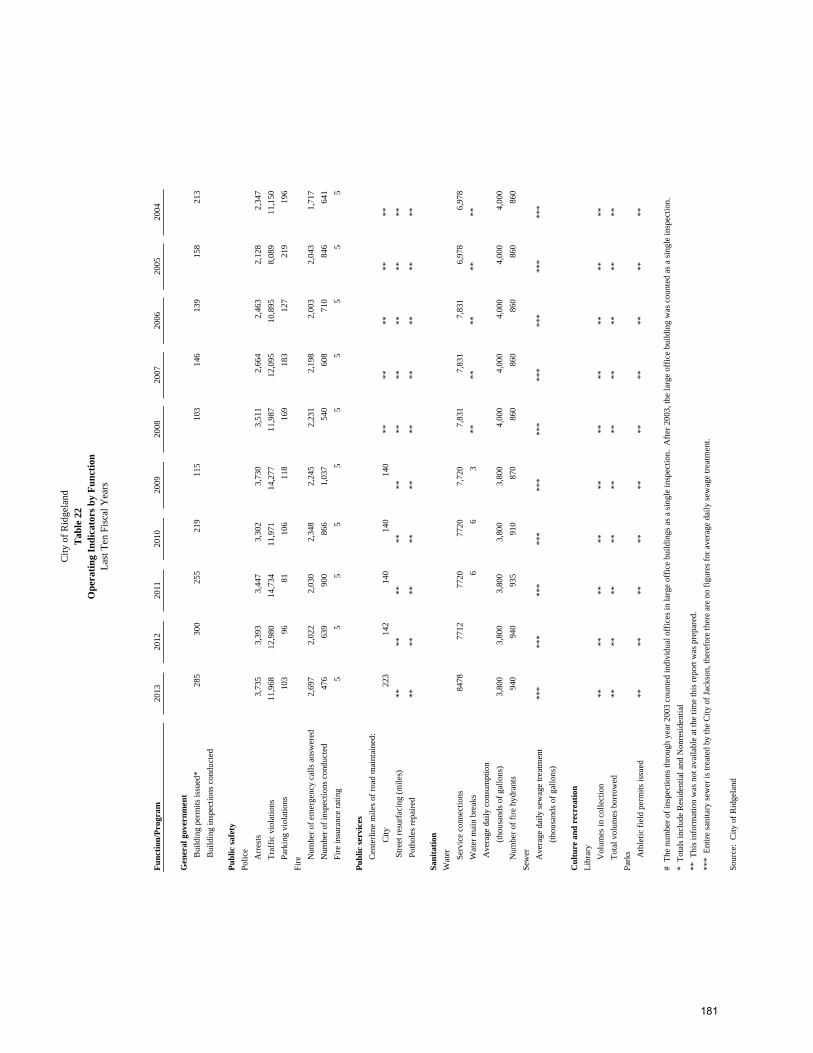
Cit
y of
Rid
gela
ndT
able
22
Op
erat
ing
Ind
icat
ors
by
Fu
nct
ion
Las
t Ten
Fis
cal Y
ears
Fu
nct
ion
/Pro
gram
2013
2012
2011
2010
2009
2008
2007
2006
2005
2004
Gen
eral
gov
ern
men
t
Bui
ldin
g pe
rmit
s is
sued
*28
530
025
521
911
510
314
613
915
821
3
Bui
ldin
g in
spec
tion
s co
nduc
ted
Pu
bli
c sa
fety
Pol
ice
A
rres
ts3,
735
3,
393
3,
447
3,
302
3,
730
3,51
12,
664
2,46
32,
128
2,34
7
T
raff
ic v
iola
tion
s11
,968
12,9
80
14
,734
11,9
71
14
,277
11
,987
12,0
9510
,895
8,08
911
,150
P
arki
ng v
iola
tion
s10
3
96
81
10
6
11
8
169
183
127
219
196
Fir
e
N
umbe
r of
em
erge
ncy
call
s an
swer
ed
2,69
7
2,02
2
2,03
0
2,34
8
2,24
5
2,
231
2,19
82,
003
2,04
31,
717
N
umbe
r of
insp
ecti
ons
cond
ucte
d47
6
63
9
90
0
86
6
1,
037
540
608
710
846
641
F
ire
insu
ranc
e ra
ting
5
5
5
5
55
55
55
Pu
bli
c se
rvic
es
C
ente
rlin
e m
iles
of
road
mai
ntai
ned:
Cit
y22
314
214
014
014
0**
****
****
Str
eet r
esur
faci
ng (
mil
es)
****
****
****
****
****
Pot
hole
s re
pair
ed**
****
****
****
****
**
San
itat
ion
Wat
er
S
ervi
ce c
onne
ctio
ns84
7877
1277
2077
207,
720
7,83
17,
831
7,83
16,
978
6,97
8
W
ater
mai
n br
eaks
66
3
**
****
****
Ave
rage
dai
ly c
onsu
mpt
ion
(th
ousa
nds
of g
allo
ns)
3,80
0
3,80
0
3,80
0
3,80
0
3,80
0
4,
000
4,00
04,
000
4,00
04,
000
N
umbe
r of
fir
e hy
dran
ts94
0
94
0
93
5
91
0
87
0
860
860
860
860
860
Sew
er
A
vera
ge d
aily
sew
age
trea
tmen
t**
***
***
***
***
***
***
***
***
***
*
(th
ousa
nds
of g
allo
ns)
Cu
ltu
re a
nd
rec
reat
ion
Lib
rary
V
olum
es in
col
lect
ion
****
****
****
****
****
T
otal
vol
umes
bor
row
ed**
****
****
****
****
**
Par
ks
Ath
leti
c fi
eld
perm
its
issu
ed**
****
****
****
****
**
# T
he n
umbe
r of
insp
ecti
ons
thro
ugh
year
200
3 co
unte
d in
divi
dual
off
ices
in la
rge
offi
ce b
uild
ings
as
a si
ngle
insp
ecti
on.
Aft
er 2
003,
the
larg
e of
fice
bui
ldin
g w
as c
ount
ed a
s a
sing
le in
spec
tion
.
* T
otal
s in
clud
e R
esid
enti
al a
nd N
onre
side
ntia
l
** T
his
info
rmat
ion
was
not
ava
ilab
le a
t the
tim
e th
is r
epor
t was
pre
pare
d.
***
Ent
ire
sani
tary
sew
er is
trea
ted
by th
e C
ity
of J
acks
on, t
here
fore
ther
e ar
e no
fig
ures
for
ave
rage
dai
ly s
ewag
e tr
eatm
ent.
Sou
rce:
Cit
y of
Rid
gela
nd
181

Cit
y of
Rid
gela
ndT
able
23
Cap
ital
Ass
ets
Ind
icat
ors
by
Fu
nct
ion
Las
t Ten
Fis
cal Y
ears
Fu
nct
ion
/Pro
gram
2013
2012
2011
2010
2009
2008
2007
2006
2005
2004
Pu
bli
c sa
fety
Pol
ice
N
umbe
r of
sta
tion
s1
1
1
1
1
11
11
1
Z
one
offi
ces
-
-
-
-
-
-
-
-
-
-
P
atro
l uni
ts68
70
71
64
62
6156
5857
48
Fir
e
N
umbe
r of
sta
tion
s4
4
4
4
4
44
44
3
Pu
bli
c se
rvic
es
S
tree
t mil
es23
3
16
4
16
2
16
2
16
216
216
216
225
025
0
S
tree
t Lig
hts
1,32
0
1,25
0
1,24
8
1,20
0
1200
1,20
01,
200
1,20
01,
150
1,15
0
T
raff
ic S
igna
ls42
42
42
42
42
4040
3936
35
San
itat
ion
Wat
er
Wat
er m
ains
(m
iles
)16
6
16
6
16
5
16
5
15
515
015
015
015
015
0
Sto
rage
cap
acit
y
(th
ousa
nds
of g
allo
ns)
3,30
0
3,30
0
3,30
0
3,30
0
2,80
0
2,80
02,
800
2,80
02,
800
2,80
0
Sew
er
San
itar
y se
wer
s (m
iles
)19
1
19
1
19
0
19
0
18
018
0**
****
**
Sto
rm s
ewer
s (m
iles
)15
0
15
0
15
0
15
0
15
015
0**
****
**
Tre
atm
ent c
apac
ity
**
**
**
**
**
(th
ousa
nds
of g
allo
ns)
Ref
use
coll
ecti
on
C
olle
ctio
n tr
ucks
N/A
N/A
N/A
N/A
N/A
N/A
N/A
N/A
N/A
N/A
Cu
ltu
re a
nd
rec
reat
ion
N
umbe
r of
Par
ks5
55
55
55
55
5
P
ark
Acr
eage
250
250
250
250
250
250
250
250
250
250
G
olf
Cou
rses
-
-
-
-
-
-
-
-
-
-
C
omm
unit
y C
ente
rs1
11
11
11
11
1
R
ecre
atio
nal T
rail
Mil
es7
77
77
****
****
**
Not
es:
No
capi
tal a
sset
s in
dica
tors
are
ava
ilab
le f
or th
e G
ener
al G
over
nmen
t fun
ctio
n.
* E
ntir
e sa
nita
ry s
ewer
is tr
eate
d by
the
Cit
y of
Jac
kson
, the
refo
re n
o tr
eatm
ent c
apac
ity
nece
ssar
y.
** T
he in
form
atio
n w
as n
ot a
vail
able
at t
he ti
me
this
rep
ort w
as p
repa
red.
Sou
rce:
Cit
y of
Rid
gela
nd
182

Cit
y of
Rid
gela
ndT
able
24
Mis
cell
aneo
us
Sta
tist
ics
Dat
e of
Inc
orpo
rati
on18
99A
vera
ge s
elli
ng p
rice
of
hom
es$1
69,8
66F
orm
of
Gov
ernm
ent
May
or/A
lder
men
Med
ian
inco
me-
- ho
useh
old
$53,
366
Pop
ulat
ion
(Est
imat
ed C
ensu
s)24
,047
Are
a in
squ
are
mil
es21
Maj
or h
ighw
ays:
1N
umbe
r of
em
ploy
ees
(exc
ludi
ng p
olic
e an
d fi
re):
Cla
ssif
ied
81R
ailr
oads
:C
anad
ian
Nt.
- Il
lino
is C
entr
al E
xem
pt34
Cit
y of
Rid
gela
nd f
acil
itie
s an
d se
rvic
es:
Nea
rest
com
mer
cial
air
port
:Ja
ckso
n In
tern
atio
nal,
18 m
iles
Cul
ture
and
Rec
reat
ion:
Run
way
leng
th 8
,500
fee
t
Bal
lfie
lds
11
Ten
nis
Cou
rts
17N
eare
st g
ener
al a
irpo
rt:
Bru
ce C
ampb
ell F
ield
, 3 m
iles
S
occe
r F
ield
s8
Run
way
leng
th 4
,444
fee
tP
olic
e P
rote
ctio
n:
Num
ber
of s
wor
n of
fice
rs65
Nea
rest
ful
l-se
rvic
e po
rt:
Por
t of
Vic
ksbu
rg, 5
5 m
iles
N
umbe
r of
res
iden
ts p
er s
wor
n of
fice
r32
1N
ame
of w
ater
way
- M
issi
ssip
pi R
iver
Wat
er S
yste
m:
M
axim
um c
apac
ity
in g
allo
ns p
er m
inut
es6,
166
Oth
er S
tati
stic
s:P
erce
ntag
e of
Pop
ulat
ion
(>
25
yrs.
) w
ith
at le
ast
H
igh
scho
ol d
iplo
ma
95.7
%
Bac
helo
r's d
egre
e52
.1%
Sou
rce:
C
ity
of R
idge
land
U. S
. Cen
sus
Bur
eau
183
This page is intentionally left blank.
184
REPORTS ON INTERNAL CONTROL AND COMPLIANCE
185

1929 Spillway Road, Suite BBrandon, Mississippi 39047
Telephone 601-992-5292 Fax 601-992-2033
INDEPENDENT AUDITOR’S REPORT ON INTERNAL CONTROL OVERFINANCIAL REPORTING AND ON COMPLIANCE AND OTHER MATTERS BASED
ON AN AUDIT OF THE FINANCIAL STATEMENTS PERFORMED IN ACCORDANCEWITH GOVERNMENT AUDITING STANDARDS
Mayor and Board of AldermenCity of Ridgeland, Mississippi
We have audited, in accordance with the auditing standards generally accepted in the UnitedStates of America and the standards applicable to financial audits contained in GovernmentAuditing Standards issued by the Comptroller General of the United States, the financialstatements of the governmental activities, business-type activities, each major fund, and theaggregate remaining fund information of the City of Ridgeland, Mississippi, as of and for theyear ended September 30, 2013, and the related notes to the financial statements, whichcollectively comprise the City’s basic financial statements, and have issued our report thereondated January 17, 2014.
Internal Control Over Financial Reporting
In planning and performing our audit of the financial statements, we considered the city’sinternal control over financial reporting (internal control) to determine the audit procedures thatare appropriate in the circumstances for the purpose of expressing our opinions on the financialstatements, but not for the purpose of expressing an opinion on the effectiveness of the city’sinternal control. Accordingly, we do not express an opinion on the effectiveness of the city’sinternal control.
A deficiency in internal control exists when the design or operation of a control does not allowmanagement or employees, in the normal course of performing their assigned functions, toprevent, or detect and correct, misstatements on a timely basis. A material weakness is adeficiency, or a combination of deficiencies, in internal control, such that there is a reasonablepossibility that a material misstatement of the entity’s financial statements will not be prevented,or detected and corrected on a timely basis. A significant deficiency is a deficiency, or acombination of deficiencies, in internal control that is less severe than a material weakness, yetimportant enough to merit attention by those charged with governance. Our consideration of internal control was for the limited purpose described in the first paragraphof this section and was not designed to identify all deficiencies in internal control that might bematerial weaknesses or significant deficiencies. Given these limitations, during our audit we didnot identify any deficiencies in internal control that we consider to be material weaknesses. However, material weaknesses may exist that have not been identified.
186

Compliance and Other Matters
As part of obtaining reasonable assurance about whether the City’s financial statements are freefrom material misstatement, we performed tests of its compliance with certain provisions oflaws, regulations, contracts, and grant agreements, noncompliance with which could have adirect and material effect on the determination of financial statement amounts. However,providing an opinion on compliance with those provisions was not an objective of our audit, andaccordingly, we do not express such an opinion. The results of our tests disclosed no instances ofnoncompliance or other matters that are required to be reported under Government AuditingStandards.
Purpose of this Report
The purpose of this report is solely to describe the scope of our testing of internal control andcompliance and the results of that testing, and not to provide an opinion on the effectiveness ofthe entity’s internal control or on compliance. This report is an integral part of an auditperformed in accordance with Government Auditing Standards in considering the entity’sinternal control and compliance. Accordingly, this communication is not suitable for any otherpurpose.
This report is intended solely for the information and use of the Mayor, the Board of Aldermen,management and federal awarding agencies and pass-through entities and is not intended to beand should not be used by anyone other than these specified parties.
Fortenberry & Ballard, PC Certified Public AccountantsJanuary 17, 2014
187
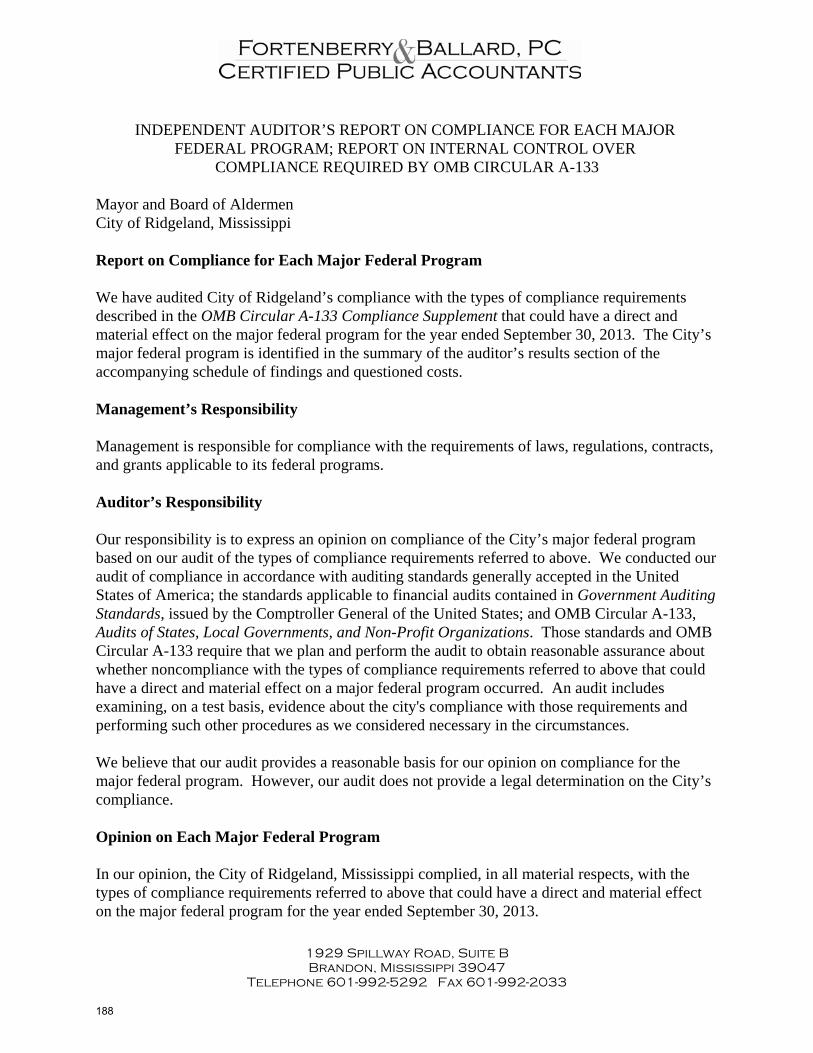
1929 Spillway Road, Suite BBrandon, Mississippi 39047
Telephone 601-992-5292 Fax 601-992-2033
INDEPENDENT AUDITOR’S REPORT ON COMPLIANCE FOR EACH MAJOR FEDERAL PROGRAM; REPORT ON INTERNAL CONTROL OVER
COMPLIANCE REQUIRED BY OMB CIRCULAR A-133
Mayor and Board of AldermenCity of Ridgeland, Mississippi
Report on Compliance for Each Major Federal Program
We have audited City of Ridgeland’s compliance with the types of compliance requirementsdescribed in the OMB Circular A-133 Compliance Supplement that could have a direct andmaterial effect on the major federal program for the year ended September 30, 2013. The City’smajor federal program is identified in the summary of the auditor’s results section of theaccompanying schedule of findings and questioned costs.
Management’s Responsibility
Management is responsible for compliance with the requirements of laws, regulations, contracts,and grants applicable to its federal programs.
Auditor’s Responsibility
Our responsibility is to express an opinion on compliance of the City’s major federal programbased on our audit of the types of compliance requirements referred to above. We conducted ouraudit of compliance in accordance with auditing standards generally accepted in the UnitedStates of America; the standards applicable to financial audits contained in Government AuditingStandards, issued by the Comptroller General of the United States; and OMB Circular A-133,Audits of States, Local Governments, and Non-Profit Organizations. Those standards and OMBCircular A-133 require that we plan and perform the audit to obtain reasonable assurance aboutwhether noncompliance with the types of compliance requirements referred to above that couldhave a direct and material effect on a major federal program occurred. An audit includesexamining, on a test basis, evidence about the city's compliance with those requirements andperforming such other procedures as we considered necessary in the circumstances.
We believe that our audit provides a reasonable basis for our opinion on compliance for themajor federal program. However, our audit does not provide a legal determination on the City’scompliance.
Opinion on Each Major Federal Program
In our opinion, the City of Ridgeland, Mississippi complied, in all material respects, with thetypes of compliance requirements referred to above that could have a direct and material effecton the major federal program for the year ended September 30, 2013.
188
Report on Internal Control Over Compliance
Management of the City of Ridgeland, Mississippi is responsible for establishing and maintain-ing effective internal control over compliance with the types of compliance requirementsreferred to above. In planning and performing our audit of compliance, we considered the City’sinternal control over compliance with the types of requirements that could have a direct andmaterial effect on the major federal program to determine the auditing procedures that areappropriate in the circumstances for the purpose of expressing an opinion on compliance for themajor federal program and to test and report on internal control over compliance in accordancewith OMB Circular A-133, but not for the purpose of expressing an opinion on the effectivenessof internal control over compliance. Accordingly, we do not express an opinion on the effective-ness of the City’s internal control over compliance.
A deficiency in internal control over compliance exists when the design or operation of a controlover compliance does not allow management or employees, in the normal course of performingtheir assigned functions, to prevent, or detect and correct, noncompliance with a type ofcompliance requirement of a federal program on a timely basis. A material weakness in internalcontrol over compliance is a deficiency, or combination of deficiencies, in internal control overcompliance, such that there is a reasonable possibility that material noncompliance with a type ofcompliance requirement of a federal program will not be prevented, or detected and corrected, ona timely basis. A significant deficiency in internal control over compliance is a deficiency, or acombination of deficiencies, in internal control over compliance with a type of compliancerequirement of a federal program that is less severe than a material weakness in internal controlover compliance, yet important enough to merit attention by those charged with governance.
Our consideration of the internal control over compliance was for the limited purpose describedin the first paragraph of this section and was not designed to identify all deficiencies in internalcontrol over compliance that might be material weaknesses or significant deficiencies. We didnot identify any deficiencies in internal control over compliance that we consider to be materialweaknesses. However, material weaknesses may exist that have not been identified.
The purpose of this report on internal control over compliance is solely to describe the scope ofout testing of internal control over compliance and the results of that testing based on therequirements of OMB Circular A-133. Accordingly, this report is not suitable for any otherpurpose.
This report is intended solely for the information and use of the Mayor, the Board of Aldermen,management, others within the entity, entities with accreditation overview and federal awardingagencies and pass-through entities and is not intended to be and should not be used by anyoneother than these specified parties.
Fortenberry & Ballard, PC Certified Public AccountantsJanuary 17, 2014
189
INDEPENDENT AUDITOR'S REPORT ON COMPLIANCE WITHSTATE LAWS AND REGULATIONS
Mayor and Board of AldermenCity of Ridgeland, Mississippi
We have audited the financial statements of the governmental activities, the business-typeactivities, each major fund, and the aggregate remaining fund information of the City ofRidgeland, Mississippi as of and for the year ended September 30, 2013, which collectivelycomprise the City of Ridgeland’s basic financial statements and have issued our report datedJanuary 17, 2014. We have conducted our audit in accordance with auditing standards generallyaccepted in the United States of America and the standards applicable to financial auditscontained in Government Auditing Standards.
As required by the state legal compliance audit program prescribed by the Office of the StateAuditor, we have also performed procedures to test compliance with certain state laws andregulations. However, providing an opinion on compliance with all state laws and regulationswas not an objective of our audit and, accordingly, we do not express such an opinion.
The results of those procedures and our audit of the basic financial statements disclosed nomaterial instances of noncompliance with state laws and regulations.
This report is intended solely for the information and use of the City’s management and theOffice of the State Auditor and is not intended to be and should not be used by anyone other thanthese specified parties. However, this report is a matter of public record and its distribution isnot limited.
Fortenberry & Ballard, PC Certified Public AccountantsJanuary 17, 2014
1929 Spillway Road, Suite BBrandon, Mississippi 39047
Telephone 601-992-5292 Fax 601-992-2033
190
SCHEDULE OF FINDINGS AND QUESTIONED COSTS
191

City of Ridgeland, Mississippi
Schedule of Findings and Questioned CostsFor the Year Ended September 30, 2013
Section I: Summary of Auditor’s Results
Financial Statements:
1. Type of auditor’s report issued: Unqualified
2. Internal control over financial reporting:
a. Material weakness(es) identified? No.b. Significant deficiency(ies) identified? None reported.
3. Noncompliance material to financial statements noted? No.
Federal Awards:
4. Internal control over major programs:
a. Material weakness(es) identified? No.b. Significant deficiency(ies) identified? None reported
5. Type of auditor’s report issued on compliance formajor programs: Unqualified.
6. Any audit findings disclosed that are required to be reported in accordance with Section 510(a) of OMB Circular A-133? No.
7. Identification of major programs:
a) CFDA 20.205 & 20.219 - Highway Planning and Construction Cluster
8. Dollar threshold used to distinguish between Type A and Type B programs:$300,000.
9. Auditee qualified as a low-risk auditee? Yes.
192

Section II: Financial Statements Findings
The results of our tests did not disclose any findings related to the financial statements that arerequired to be reported under Government Auditing Standards.
Section III: Federal Award Findings and Questioned Costs
The results of our tests did not disclose any findings and questioned costs related to the federalawards.
193