comprehensive annual financial report · conform to the requirements of the single audit act...
TRANSCRIPT

STATE OF ALABAMA
COMPREHENSIVE ANNUAL
FINANCIAL REPORT
For the Fiscal Year Ended September 30, 2017
Kay Ivey Governor
Young Boozer Clinton Carter Jim Zeigler State Treasurer Director of Finance State Auditor
Prepared by the Department of Finance, Office of the State Comptroller
Kathleen D. Baxter, Ph.D, CGFM, CPM • State Comptroller

STATE OF ALABAMA TABLE OF CONTENTS (Page 1 of 3)
ii
Page INTRODUCTORY SECTION
Letter of Transmittal ....................................................................... 2 Principal State Officials ..................................................................... 7 Organization Chart ......................................................................... 8 FINANCIAL SECTION Independent Auditor's Report ................................................................. 10 Management's Discussion and Analysis .......................................................... 14
BASIC FINANCIAL STATEMENTS Government-wide Financial Statements Statement of Net Position ................................................................. 28 Statement of Activities ................................................................... 30 Fund Financial Statements Governmental Fund Financial Statements Balance Sheet — Governmental Funds ....................................................... 32 Reconciliation of the Balance Sheet of Governmental Funds to the Statement of Net Position ................... 34 Statement of Revenues, Expenditures, and Changes in Fund Balances — Governmental Funds .................. 36 Reconciliation of the Statement of Revenues, Expenditures, and Changes in Fund Balances of Governmental Funds to the Statement of Activities .............................................. 38 Proprietary Fund Financial Statements Statement of Net Position — Proprietary Funds ................................................. 40 Statement of Revenues, Expenses, and Changes in Net Position — Proprietary Funds ........................ 42 Statement of Cash Flows — Proprietary Funds .................................................. 44 Fiduciary Fund Financial Statements Statement of Fiduciary Net Position — Fiduciary Funds ............................................ 48 Statement of Changes in Fiduciary Net Position — Fiduciary Funds .................................... 49 Component Unit Financial Statements Statement of Net Position — Component Units .................................................. 50 Statement of Activities — Component Units ................................................... 52 Notes to the Financial Statements ............................................................. 54
STATE OF ALABAMA TABLE OF CONTENTS (Page 2 of 3)
iii
Page REQUIRED SUPPLEMENTARY INFORMATION Budgetary Comparison Schedule — All Budgeted Funds ............................................. 140 Budgetary Comparison Schedule — Budget-to-GAAP Reconciliation .................................... 142 Notes on Budgetary Accounting and Reporting ................................................... 144 State Insurance Fund Ten Year Loss Development Information ........................................ 147 Ten Year Trend Information — Teachers’ Retirement System .......................................... 148 Ten Year Trend Information — Judicial Retirement Fund ............................................ 149 Ten Year Trend Information — Employees’ Retirement System ........................................ 150 Notes to Schedules for Employees’ Retirement System .............................................. 151 Schedule of Funding Progress for Retired State Employees’ Health Care Trust .............................. 152 Notes to Schedule of Funding Progress for Retired State Employees’ Health Care Trust ......................... 153 Information about Infrastructure Assets Reported Using the Modified Approach .............................. 154 COMBINING AND INDIVIDUAL FUND STATEMENTS AND SCHEDULES Governmental Funds Combining Balance Sheet — Nonmajor Governmental Funds by Fund Type ................................ 158 Combining Statement of Revenues, Expenditures, and Changes in Fund Balances — Nonmajor Governmental Funds by Fund Type .......................................... 159 Combining Balance Sheet — Nonmajor Special Revenue Funds ........................................ 162 Combining Statement of Revenues, Expenditures, and Changes in Fund Balances – Nonmajor Special Revenue Funds.................................................... 164 Combining Balance Sheet — Other Nonmajor Special Revenue Funds .................................... 166 Combining Statement of Revenues, Expenditures, and Changes in Fund Balances — Other Nonmajor Special Revenue Funds ........................................................... 168 Combining Balance Sheet — Nonmajor Debt Service Funds ........................................... 172 Combining Statement of Revenues, Expenditures, and Changes in Fund Balances — Nonmajor Debt Service Funds ...... 174 Combining Balance Sheet — Nonmajor Capital Projects Funds ......................................... 178 Combining Statement of Revenues, Expenditures, and Changes in Fund Balances — Nonmajor Capital Projects Funds .... 180 Combining Balance Sheet — Nonmajor Permanent Funds ............................................ 184 Combining Statement of Revenues, Expenditures, and Changes in Fund Balances — Nonmajor Permanent Funds ....... 185 Detail Schedule of Budget and Actual Expenditures — All Agencies and Appropriations, Non-GAAP, Budget Basis ......................................... 188 Schedule of Revenues by Principal Sources — Governmental Funds in State Treasury — Cash Basis, Transfers Excluded ................................ 222 Schedule of Revenues by Principal Sources and Distributions of Revenues — Governmental Funds in State Treasury — Cash Basis, Transfers Excluded ................................ 224 Proprietary Funds Combining Statement of Net Position — Nonmajor Enterprise Funds ..................................... 228 Combining Statement of Revenues, Expenses, and Changes in Net Position — Nonmajor Enterprise Funds ............ 230 Combining Statement of Cash Flows — Nonmajor Enterprise Funds ..................................... 232 Combining Statement of Net Position — Internal Service Funds ........................................ 238 Combining Statement of Revenues, Expenses, and Changes in Net Position — Internal Service Funds ............... 240 Combining Statement of Cash Flows — Internal Service Funds ......................................... 242 Fiduciary Funds Combining Statement of Plan Net Position — Pension and Other Employee Benefit Trust Funds ................... 248 Combining Statement of Changes in Plan Net Position — Pension and Other Employee Benefit Trust Funds ........... 250 Combining Statement of Fiduciary Net Position — Private-Purpose Trust Funds ............................. 254 Combining Statement of Changes in Fiduciary Net Position — Private-Purpose Trust Funds ..................... 255 Combining Statement of Fiduciary Assets and Liabilities — Agency Funds ................................. 258 Combining Statement of Changes in Fiduciary Assets and Liabilities — Agency Funds ......................... 260
STATE OF ALABAMA TABLE OF CONTENTS (Page 3 of 3)
iv
Page Component Units Combining Statement of Net Position — Nonmajor Component Units .................................... 264 Combining Statement of Activities — Nonmajor Component Units ...................................... 266 Combining Statement of Net Position — Other Nonmajor Component Units ................................ 268 Combining Statement of Activities — Other Nonmajor Component Units .................................. 270 Supplemental Statements and Schedules Schedule of Federal Revenues by Agency — All Funds and Component Units except Higher Education .............. 274 STATISTICAL SECTION Financial Trends Net Position by Component — Last Ten Fiscal Years .............................................. 276 Changes in Net Position — Last Ten Fiscal Years ................................................ 278 Fund Balances of Governmental Funds — Last Ten Fiscal Years ...................................... 282 Changes in Fund Balances of Governmental Funds — Last Ten Fiscal Years .............................. 284 Revenue Capacity Major Revenue Base: Personal Income by Industry — Last Ten Years .................................. 286 Revenue Rates: Individual and Corporate Income Tax Rates — Last Ten Calendar Years ...................... 288 Principal Revenue Payers: Individual Income Tax Filers and Liability — Last Ten Years ...................... 290 Principal Revenue Payers: Corporate Income Tax Filers and Liability — Last Nine Years ...................... 292 Debt Capacity Ratios of Outstanding Debt — Last Ten Fiscal Years .............................................. 294 Ratios of General Bonded Debt Outstanding — Last Ten Fiscal Years ................................... 296 Debt Limitations ...................................................................... 297 Pledged Revenue Coverage – Primary Government Bonds — Last Ten Fiscal Years ......................... 298 Demographic and Economic Information Labor Force Statistics — Last Ten Years ...................................................... 302 Population/Per Capita Personal Income Statistics — Last Ten Years .................................... 303 Top Ten Employers in Alabama — Last Ten Years ............................................... 304 Operating Information State Government Employment by Function — Last Ten Years ....................................... 306 Indicators of Demand or Level of Service — Last Nine Fiscal Years .................................... 308 Indicators of Volume, Usage, and Nature of Capital Assets — Last Ten Fiscal Years ......................... 310

STATE OF ALABAMA INTRODUCTORY SECTION
1
STATE OF ALABAMA
Department of Finance Office of the State Comptroller
100 North Union Street, Suite 220 Montgomery, Alabama 36130-2620
Telephone (334) 242-7050 Fax (334) 242-7466 www.comptroller.alabama.gov
Kay Ivey Governor
Kelly Butler Acting Director of Finance
Kathleen D. Baxter, PhD, CGFM, CPM State Comptroller
Michael G. Hudson, CGFM Deputy State Comptroller
2
November 20, 2018
To the Honorable Governor, Members of the State Legislature, and the Citizens of Alabama:
I am pleased to submit to you the Comprehensive Annual Financial Report (CAFR) for the State of Alabama for the year ended September 30, 2017. I believe the information as presented is accurate in all material respects and complies with Article IV, Section 72 of the Constitution of Alabama of 1901 and Section 41-4-3(4) of the Code of Alabama 1975, as amended. The completeness and fairness of the presentation, including all disclosures, rests with the State’s management. This report complies with Article V, Section 137 of the Constitution of Alabama of 1901 and Section 36-16-1(6) of the Code of Alabama 1975, as amended, as the financial report for the State Auditor, State Treasurer, and State Comptroller.
Introduction to the Report
Internal Controls The internal controls in the State's accounting system have been designed to comply with Alabama statutes requiring the audit of receipts and receivables; the determination of legality and correctness of each claim and expenditure; and that funds are appropriated, allotted, and on deposit in the State Treasury before any warrant is issued. The internal controls include manual pre-audit and automated system edits. As an additional control, the State Auditor's Office is responsible for a post-audit of the accounts and records of the Department of Finance and the State Treasurer's Office. These internal accounting controls provide reasonable, but not absolute, assurance regarding the safeguarding of assets against loss or unauthorized disposition and the reliability of the financial records from which the financial reports are prepared. The concept of reasonable assurance recognizes that the cost of a control should not exceed the resulting benefits.
Audit This CAFR has been audited by the Department of Examiners of Public Accounts. The Examiners conducted their audit in accordance with auditing standards generally accepted in the United States of America and the standards applicable to financial audits contained in Government Auditing Standards issued by the Comptroller General of the United States. The Examiners' unmodified opinion appears at the beginning of the financial section of this report. The State will also undergo an audit of federal programs to conform to the requirements of the Single Audit Act Amendments of 1996 and the U.S. Office of Management and Budget Circular A-133, Audits of States, Local Governments, and Non-Profit Organizations and Title 2 U.S. Code of Federal Regulations, Part 200, Uniform Administrative Requirements, Cost Principles, and Audit Requirements (Uniform Guidance). Information relating to the single audit, including the schedule of expenditures of federal awards, and audit findings and recommendations, is issued in a separate report and will be available at a later date from the Department of Examiners of Public Accounts.
STATE OF ALABAMA
3
Management’s Discussion and Analysis Governmental Accounting Standards Board (GASB) Statement No. 34 requires that management provide a narrative introduction, overview and analysis to accompany the Basic Financial Statements in the form of Management’s Discussion and Analysis (MD&A). This letter of transmittal is intended to complement MD&A and should be read in conjunction with it. The MD&A can be found immediately following the Independent Auditor’s Report. The MD&A provides an overview of the State’s financial activities addressing both governmental and business-type activities reported in the government-wide financial statements. In addition, the MD&A focuses on the State’s major funds, such as the General Fund, Education Trust Fund, Alabama Trust Fund, and Unemployment Compensation Trust Fund.
Profile of the Government Reporting Entity This report presents financial information on all of State government as a single reporting entity. While state law allows many state organizations to operate largely independent of the daily central control and scrutiny of the Department of Finance, State Auditor, and State Treasurer, this report combines the financial data of all state organizations in order to present a comprehensive picture of state finances. The numerous departments, agencies, elected officials, boards, commissions, authorities, colleges, universities, and other organizational units of the State are included in this report in accordance with standards established by the Governmental Accounting Standards Board. These standards make a distinction between organizations which are considered to be part of the primary government of the State and those which are component units. A component unit is defined as a legally separate corporate entity for which the State is considered to be financially accountable. The criteria used to determine financial accountability include the appointment of a majority of the governing board, the ability of the State to impose its will on the organization, and the potential for the organization to be a financial benefit or financial burden to the State. The State is also considered financially accountable for any organization having an independently appointed board if that organization is fiscally dependent on the State. An organization is fiscally dependent if it is unable to adopt a budget, set rates or charges, or issue bonded debt without the approval of the State. Component units can be reported as if they are a part of the primary government (“blended presentation”) if they provide services solely to the government or if their debt is repaid solely by the government, but many of the State’s component units do not and are therefore presented separately (“discrete presentation”) in these financial statements. The largest of the blended component units includes the Public School and College Authority, Department of Mental Health, and the Federal Aid Highway Finance Authority. The major discretely presented component units are the University of Alabama, Auburn University, the University of South Alabama, the Alabama Housing Finance Authority, the Public Education Employees’ Health Insurance Board, and the Alabama Community College System. Note 1 to the financial statements provides a more complete description of the State’s reporting entity. Budgetary Controls Budgetary control is exercised through the Executive Budget Office of the Department of Finance based on the Appropriation Acts of the State Legislature. Alabama's annual Appropriation Acts include legally adopted budgets for the General Fund, the Education Trust Fund, and other budgeted funds. The Appropriation Acts identify the source of funding and the programmatic (functional) areas for which expenditures are authorized. Both the Constitution of Alabama of 1901 and the statutes require a balanced budget for annual financial operations. In the event that revenue collections do not meet budget projections, the Governor is required to prorate appropriations and restrict allotments to prevent an overdraft in any fiscal year for which appropriations are made. Allotments of appropriations are made quarterly based on plans of operations submitted by the departments and agencies. These appropriations and allotments are enforced by automated edits that prevent allotments in excess of appropriations and expenditures in excess of allotments. Encumbrance accounting is utilized as purchase orders are issued to insure that purchase orders plus expenditures do not exceed allotment balances. Controls are further tightened at fiscal year-end by verifying that the total of purchase orders plus expenditures plus any obligations (accounts payable) incurred against fiscal year appropriations do not exceed allotments, and remaining allotments do not exceed cash in the Treasury.
STATE OF ALABAMA
4
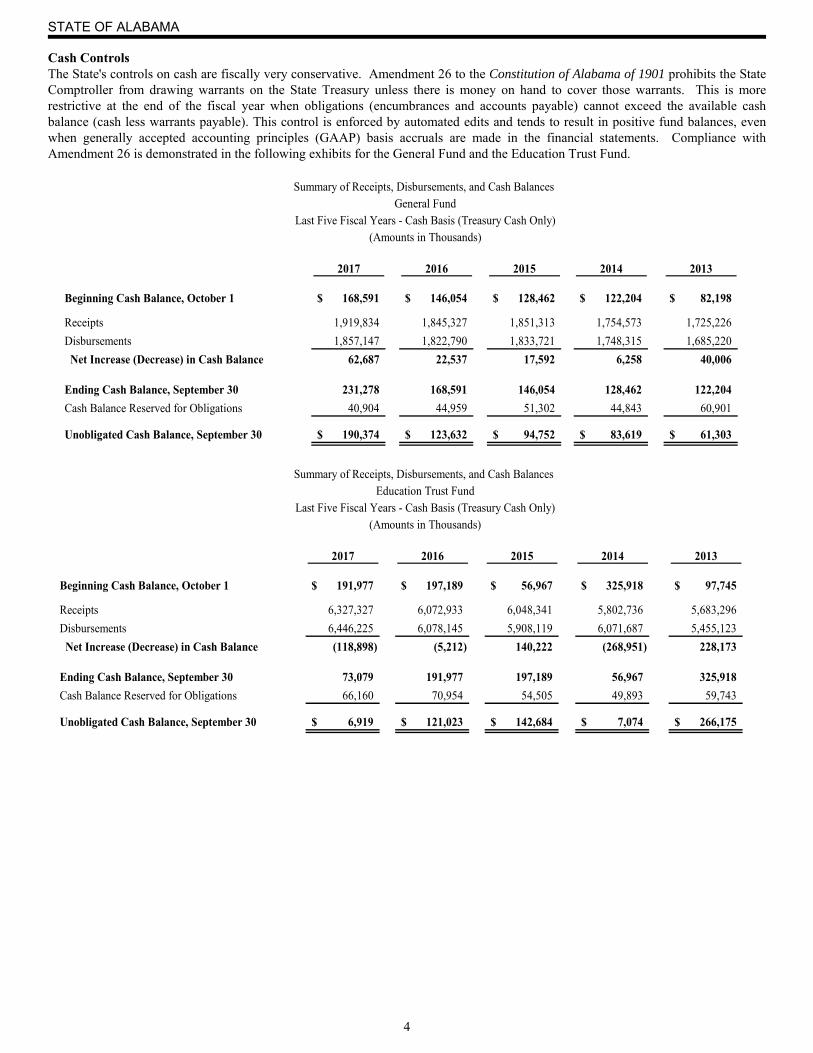
Cash Controls The State's controls on cash are fiscally very conservative. Amendment 26 to the Constitution of Alabama of 1901 prohibits the State Comptroller from drawing warrants on the State Treasury unless there is money on hand to cover those warrants. This is more restrictive at the end of the fiscal year when obligations (encumbrances and accounts payable) cannot exceed the available cash balance (cash less warrants payable). This control is enforced by automated edits and tends to result in positive fund balances, even when generally accepted accounting principles (GAAP) basis accruals are made in the financial statements. Compliance with Amendment 26 is demonstrated in the following exhibits for the General Fund and the Education Trust Fund.
2017 2016 2015 2014 2013
Beginning Cash Balance, October 1 168,591$ 146,054$ 128,462$ 122,204$ 82,198$
Receipts 1,919,834 1,845,327 1,851,313 1,754,573 1,725,226
Disbursements 1,857,147 1,822,790 1,833,721 1,748,315 1,685,220
Net Increase (Decrease) in Cash Balance 62,687 22,537 17,592 6,258 40,006
Ending Cash Balance, September 30 231,278 168,591 146,054 128,462 122,204
Cash Balance Reserved for Obligations 40,904 44,959 51,302 44,843 60,901
Unobligated Cash Balance, September 30 190,374$ 123,632$ 94,752$ 83,619$ 61,303$
Summary of Receipts, Disbursements, and Cash Balances General Fund
Last Five Fiscal Years - Cash Basis (Treasury Cash Only)(Amounts in Thousands)
2017 2016 2015 2014 2013
Beginning Cash Balance, October 1 191,977$ 197,189$ 56,967$ 325,918$ 97,745$
Receipts 6,327,327 6,072,933 6,048,341 5,802,736 5,683,296
Disbursements 6,446,225 6,078,145 5,908,119 6,071,687 5,455,123
Net Increase (Decrease) in Cash Balance (118,898) (5,212) 140,222 (268,951) 228,173
Ending Cash Balance, September 30 73,079 191,977 197,189 56,967 325,918
Cash Balance Reserved for Obligations 66,160 70,954 54,505 49,893 59,743
Unobligated Cash Balance, September 30 6,919$ 121,023$ 142,684$ 7,074$ 266,175$
Summary of Receipts, Disbursements, and Cash Balances Education Trust Fund
Last Five Fiscal Years - Cash Basis (Treasury Cash Only)(Amounts in Thousands)
STATE OF ALABAMA
5
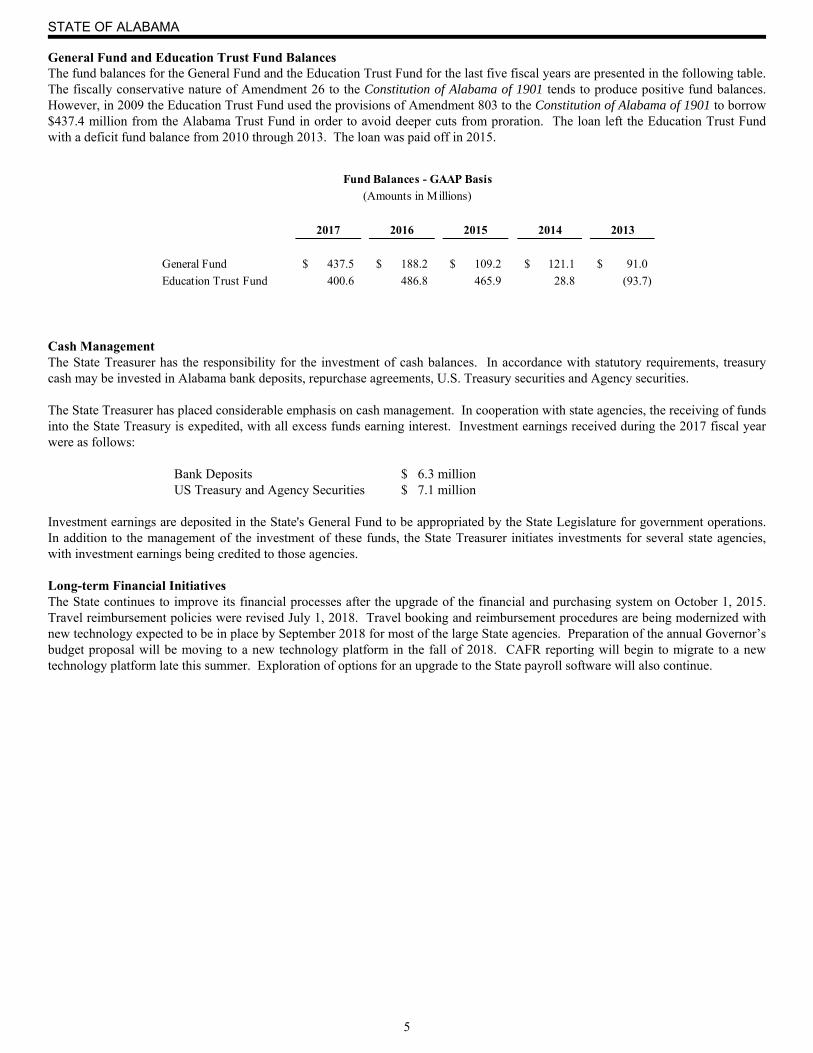
General Fund and Education Trust Fund Balances The fund balances for the General Fund and the Education Trust Fund for the last five fiscal years are presented in the following table. The fiscally conservative nature of Amendment 26 to the Constitution of Alabama of 1901 tends to produce positive fund balances. However, in 2009 the Education Trust Fund used the provisions of Amendment 803 to the Constitution of Alabama of 1901 to borrow $437.4 million from the Alabama Trust Fund in order to avoid deeper cuts from proration. The loan left the Education Trust Fund with a deficit fund balance from 2010 through 2013. The loan was paid off in 2015.
Cash Management The State Treasurer has the responsibility for the investment of cash balances. In accordance with statutory requirements, treasury cash may be invested in Alabama bank deposits, repurchase agreements, U.S. Treasury securities and Agency securities. The State Treasurer has placed considerable emphasis on cash management. In cooperation with state agencies, the receiving of funds into the State Treasury is expedited, with all excess funds earning interest. Investment earnings received during the 2017 fiscal year were as follows: Bank Deposits $ 6.3 million US Treasury and Agency Securities $ 7.1 million Investment earnings are deposited in the State's General Fund to be appropriated by the State Legislature for government operations. In addition to the management of the investment of these funds, the State Treasurer initiates investments for several state agencies, with investment earnings being credited to those agencies. Long-term Financial Initiatives The State continues to improve its financial processes after the upgrade of the financial and purchasing system on October 1, 2015. Travel reimbursement policies were revised July 1, 2018. Travel booking and reimbursement procedures are being modernized with new technology expected to be in place by September 2018 for most of the large State agencies. Preparation of the annual Governor’s budget proposal will be moving to a new technology platform in the fall of 2018. CAFR reporting will begin to migrate to a new technology platform late this summer. Exploration of options for an upgrade to the State payroll software will also continue.
2017 2016 2015 2014 2013
General Fund 437.5$ 188.2$ 109.2$ 121.1$ 91.0$
Education Trust Fund 400.6 486.8 465.9 28.8 (93.7)
Fund Balances - GAAP Basis
(Amounts in Millions)
STATE OF ALABAMA
6
Economic Condition and Outlook In 2017, Alabama’s economy grew at a slightly higher pace than in 2016. Consumer spending moderately increased in 2017 as Alabama’s gross domestic product (ALGDP) rose by 2.2 percent. The State’s unemployment rate decreased to 3.7 percent in 2017 which is below the national average of 4.1 percent. Total state tax revenues increased 3 percent. Alabama gained 31,600 jobs during 2017. Industries with significant job increases included healthcare and social assistance, accommodation and food services, professional, scientific and technical service, and financial services. Federal jobs increased slightly along with both state and local government sectors. Other industries such as retailers saw considerable losses primarily due to a competitive environment from discount stores and online marketplace. Manufacturing sector output rose by 1.8 percent from October 2016, with an upsurge of 5.5 percent for motor vehicles, body, trailer, and parts manufacturing. Primary metals along with petroleum and coal products also contributed to the growth in manufacturing output with an increase of 5 percent and 10 percent, respectively. The construction sector’s output showed some improvement in the period October 2016 to October 2017 with real output growing by 2.7 percent. Wholesale trade slightly increased 0.8 percent and was accompanied by an increase of 600 jobs in employment for the period October 2016 to October 2017. Although retail output rose 1.8 percent, retail trade employment declined by 1.8 percent. Alabama exports saw an increase to $16.2 billion in the first nine months of 2017 compared to exports of $15.1 billion during the first nine-month period of 2016. Exports to Canada, Alabama’s largest trade partner, increased by 3.1 percent for the first nine months of 2017. Other major export destinations for Alabama products included China, Germany, Mexico, the United Kingdom, Japan, Belgium, South Korea, France, and Brazil. For the first three quarters of 2017, transportation equipment exports totaled $10.7 billion. Other major exports during the first three quarters of 2017 were chemicals, primary metals, machinery manufacturing, paper products, computer and electronic products, mineral and ores, fabricated metals, and plastic and rubber products. Alabama’s economy is expected to expand moderately by 2.4 percent in 2018. Non-agricultural employment is expected to experience a slight gain of 1.3 percent, adding approximately 27,000 jobs. Manufacturing of motor vehicles and parts and other transportation equipment will be the major economic drivers in 2018. These include firms in industries such as transportation equipment, aerospace, motor vehicles, and machinery manufacturing. However, until uncertainties about federal spending priorities, as well as deficit reduction plans are resolved, many private contractors and government facilities engaged in defense-related projects will be cautious in hiring and investment. Acknowledgements Production of this report would not have been possible without the assistance of all state organizations which supplied financial information vital to the accuracy of this report. As we strive to produce this report in future years and to further enhance its quality, the continued support and cooperation of all agencies remain essential. I also wish to express my appreciation to the entire staff in the Division of Control and Accounts, whose daily efforts to improve the accountability of state government make the quality of this report possible.
Respectfully submitted, Kathleen D. Baxter, Ph.D., CGFM, CPM
State Comptroller
STATE OF ALABAMA
7
PRINCIPAL STATE OFFICIALS
September 30, 2017
EXECUTIVE JUDICIAL LEGISLATIVE BRANCH BRANCH BRANCH
Kay Ivey Lyn Stuart Del Marsh Governor Chief Justice of the Supreme Court Senate President, Pro Tempore
Vacant Justices of the Supreme Court Mac McCutcheon Lt. Governor Speaker of the House Michael F. Bolin Young Boozer Ronald L. Jones State Treasurer Tom Parker Examiners of Public Accounts John H. Merrill Glenn Murdock Othni J. Lathram, Director Secretary of State Legislative Services Agency Greg Shaw John McMillan Commissioner of Agriculture James Allen Main and Industries
Alisa Kelli Wise Steve Marshall Attorney General Tommy Bryan Jim Zeigler William B. Sellers State Auditor EXECUTIVE BRANCH DEPARTMENTS Clinton Carter Nichelle Nix Colonel Jeff Dunn Department of Finance Office of Minority Affairs Department of Corrections H. Mac Gipson Kenneth W. Boswell Art Faulkner ABC Board ADECA Emergency Management Agency Greg Canfield Major General Perry G. Smith John R. Cooper Department of Commerce State Military Department Department of Transportation Neal Morrison Nancy Buckner Dr. Joanne Hale Department of Senior Services Department of Human Resources Secretary of Information Technology Michael E. Hill Fitzgerald Washington Stephanie Azar State Banking Department Department of Labor Alabama Medicaid Agency Chris Blankenship, Interim Jim Perdue Vernon Barnett Department of Conservation Department of Mental Health Department of Revenue and Natural Resources
Lee Sentell Jim L. Ridling Hal Taylor, Acting Department of Tourism Department of Insurance Alabama Law Enforcement Agency Jeana Ross Department of Early Childhood Education
STATE OF ALABAMA
8
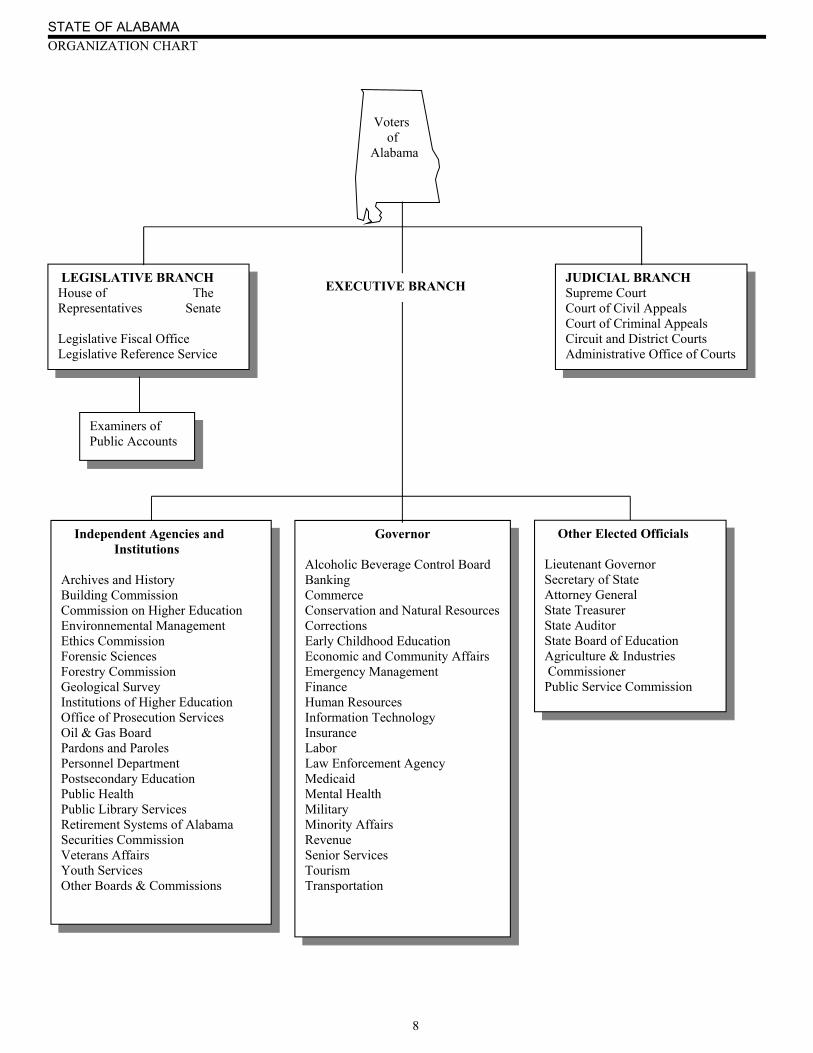
ORGANIZATION CHART Voters of Alabama
eE
LEGISLATIVE BRANCH House of The Representatives Senate Legislative Fiscal Office Legislative Reference Service
Governor Alcoholic Beverage Control Board Banking Commerce Conservation and Natural Resources Corrections Early Childhood Education Economic and Community Affairs Emergency Management Finance Human Resources Information Technology Insurance Labor Law Enforcement Agency Medicaid Mental Health Military Minority Affairs Revenue Senior Services Tourism Transportation
JUDICIAL BRANCH Supreme Court Court of Civil Appeals Court of Criminal Appeals Circuit and District Courts Administrative Office of Courts
EXECUTIVE BRANCH
Examiners of Public Accounts
Other Elected Officials Lieutenant Governor Secretary of State Attorney General State Treasurer State Auditor State Board of Education Agriculture & Industries Commissioner Public Service Commission
Independent Agencies and Institutions Archives and History Building Commission Commission on Higher Education Environnemental Management Ethics Commission Forensic Sciences Forestry Commission Geological Survey Institutions of Higher Education Office of Prosecution Services Oil & Gas Board Pardons and Paroles Personnel Department Postsecondary Education Public Health Public Library Services Retirement Systems of Alabama Securities Commission Veterans Affairs Youth Services Other Boards & Commissions

STATE OF ALABAMA
9
FINANCIAL SECTION


STATE OF ALABAMA
14
MANAGEMENT’S DISCUSSION AND ANALYSIS The following is a narrative overview and analysis of the financial activities of the State of Alabama for the fiscal year ended September 30, 2017. Please consider the information presented here in conjunction with the letter of transmittal, which is located in the Introductory Section of this report, and the State’s financial statements, which immediately follow this discussion and analysis.
Financial Highlights
The State’s net position increased by $544 million during the fiscal year. The assets and deferred outflows of the State exceeded its liabilities and deferred inflows at the close of the fiscal year by $21.5 billion (net position). $20.9 billion was the net invested in capital assets, and $3.2 billion was Alabama Trust Capital.
The State had a net pension liability of $3.7 billion for the primary government. The Change in Net Position in governmental activities was $461 million. Governmental activities have $5.1 billion in investments, $3.2 billion of which is held in the Alabama Trust Fund. Tax revenues increased $261 million, or 3 percent as the economy improved. Income tax revenues increased $218 million, or 6 percent, because of the improved economy. Sales and use tax revenues
increased $16 million, or 1 percent. Revenues and expenses increased modestly. Revenues increased $658 million or 3 percent while expenses increased $766
million, or 4 percent. The business-type activities reported net position at year-end of $964 million, an increase of $83 million, or 9 percent, for the
fiscal year. The Unemployment Compensation Trust Fund cash grew by $49 million. The operating revenues for the State Port Authority increased by 5 percent as a result of a recovery in the global steel markets.
The State’s total bond debt at the end of the fiscal year was $5.8 billion, an increase of $1.024 billion. The State issued revenue bonds with a par value of $416.6 million and premiums of $76.9 million for transportation capital
improvements. The State issued general obligation bonds with a par value of $105 million and premiums of $23.1 million. The Alabama Economic Settlement Authority issued revenue bonds with a par value of $628.7 million and a discount of $2.6
million. The debt will be serviced with BP Settlement funds. $74 million will be used for various projects, $400 million was used to repay the General Fund Rainy Day Account and to repay transfers of the Alabama Trust Fund, $120 million will be used to fund Medicaid, and $29.6 was issued to pay interest costs prior to receipt of the BP Settlement funds.
Capital Assets increased $356 million to $22.3 billion, which includes $19.7 billion in infrastructure assets. The Alabama Trust Fund balance increased by $453 million, or 17 percent, and now stands at $3.2 billion. The Alabama Trust Fund investment earnings increased from $253 million to $333 million. General Fund revenues increased $85 million, while expenditures increased $54 million. Education Trust Fund revenues increased $211 million, while expenditures increased $309 million. On a budgetary basis, General Fund revenues and other sources exceeded expenditures and other uses by $188 million.
However, on a GAAP (Generally Accepted Accounting Principles) basis, General Fund revenues and other sources exceeded expenditures and other uses by $249 million. The Budgetary Comparison Schedule in Required Supplementary Information reconciles these amounts and lists the accounting basis differences.
The General Fund was not prorated and the Medicaid Agency has unexpended General Fund appropriations of $47 million to carry over to fiscal year 2018.
STATE OF ALABAMA
15
Overview of the Financial Statements
This discussion and analysis is an introduction to the State of Alabama’s basic financial statements. The State’s basic financial statements comprise three components: 1) government-wide financial statements, 2) fund financial statements, and 3) notes to the financial statements. This report also contains required supplementary information and other supplementary information in addition to the basic financial statements. Government-wide Financial Statements The government-wide financial statements provide a broad overview of the State’s financial position and activities measured in a manner similar to a private-sector business. These statements consist of the Statement of Net Position and the Statement of Activities, which are prepared using the economic resources measurement focus and accrual basis of accounting. The government-wide financial statements exclude fiduciary activities. The Statement of Net Position presents information on all of the State’s assets, deferred outflows of resources, liabilities, and deferred inflows of resources at the end of the fiscal year. Net position represents the difference between all other elements in this statement. Increases or decreases in net position from year to year may serve as a useful indicator of whether the financial position of the State is improving or not. The Statement of Activities presents information showing how the State’s net position changed during the most recent fiscal year. All changes in net position are reported as soon as the underlying event giving rise to the change occurs, regardless of the timing of related cash flows. Thus, revenues and expenses are reported in this statement for some items that will only result in cash flows in future fiscal periods (e.g., uncollected taxes and earned but unused vacation leave). Both of the government-wide financial statements distinguish functions of the State that are principally supported by taxes and intergovernmental revenues (governmental activities) from other functions that are intended to recover all or a significant portion of their costs through user fees and charges (business-type activities). The governmental activities of the State include general government, economic development and regulation, education and cultural resources, natural resources and recreation, health- physical and mental, social services, protection of persons and property, and transportation. Examples of business-type activities of the State are unemployment compensation services, operation of facilities for the distribution and sale of alcoholic beverages, and shipping services at the Port of Mobile. The government-wide financial statements include not only the State of Alabama itself (known as the primary government), but also legally separate component units for which the State is financially accountable. The major component units include the Housing Finance Authority, Public Education Employees’ Health Insurance Board, University of Alabama, Auburn University, University of South Alabama, and the Alabama Community College System. Financial information for the component units is reported in a separate column from the financial information presented for the primary government. The government-wide financial statements can be found immediately following this discussion and analysis. Fund Financial Statements A fund is a fiscal and accounting entity with a self-balancing set of accounts that the State uses to keep track of specific sources of funding and spending for a particular purpose. Fund accounting is used to ensure and demonstrate compliance with finance-related legal requirements. All of the funds of the State can be divided into three categories: governmental funds, proprietary funds, and fiduciary funds. Governmental funds Most of the State’s basic services are reported in governmental funds. The governmental fund financial statements focus on near-term inflows and outflows of resources of these funds and the balances of those resources available at year-end. These funds are measured and reported using the current financial resources measurement focus and the modified accrual basis of accounting. Because the focus of governmental funds is narrower than that of the government-wide financial statements, it is useful to compare the information presented for governmental funds with similar information presented for governmental activities in the government-wide financial statements. By doing so, readers may better understand the long-term impact of the government’s near-term financing decisions. Both the governmental fund Balance Sheet and the governmental fund Statement of Revenues, Expenditures, and Changes in Fund Balances are followed by a reconciliation to the government–wide statements. The types of funds which are categorized as governmental funds are the General Fund, special revenue funds, capital projects funds, debt service funds, and permanent funds. Information is presented separately in the governmental fund Balance Sheet and in the governmental fund Statement of Revenues, Expenditures, and Changes in Fund Balances for the General Fund, Alabama Trust Fund, Education Trust Fund, Public Road and Bridge Fund, Public Welfare Trust Fund, and Alabama Medicaid Fund, all of which are
STATE OF ALABAMA
16
considered to be major funds. Data from the nonmajor governmental funds are combined into a single aggregated column on the basic financial statements. Individual fund data for each of the nonmajor governmental funds can be found in the combining and individual fund statements and schedules section of this report. Proprietary funds Services for which the State charges customers a fee are generally reported in proprietary funds. The State maintains two different types of proprietary funds: enterprise funds and internal service funds. Like the government-wide statements, proprietary funds use the accrual basis of accounting. Enterprise funds are used to report the same functions presented as business-type activities in the government-wide financial statements. These funds report activities that provide supplies and services to external users in a manner similar to private business enterprises. The major enterprise funds are the Unemployment Compensation Trust, State Port Authority, and the Alcoholic Beverage Control Board. Individual fund data for each of the nonmajor enterprise funds can be found in the combining and individual fund statements and schedules section of this report. Internal service funds report activities that provide supplies and services to other state agencies on a cost-reimbursement basis. These funds are reported as governmental activities on the government-wide financial statements. These funds provide computer services, information technology, telecommunications, rental of office buildings, janitorial services, building maintenance, manufacturing activities, and liability protection. The internal service funds are aggregated in a single column on the proprietary fund statements. Fiduciary funds The State acts as a trustee or fiduciary for its employee pension plans. It is also responsible for other assets that, because of a trust arrangement, can be used only for the trust beneficiaries. The State’s fiduciary activities are reported in separate Statements of Fiduciary Net Position and Changes in Fiduciary Net Position. These funds, which include pension and other employee benefits, private-purpose, and agency funds are reported using accrual accounting. The government-wide financial statements exclude fiduciary fund activities and balances because the resources of those funds are not available to support the State’s own programs. Notes to the Financial Statements The notes to the financial statements are an integral part of the financial statements. They explain amounts shown in the financial statements and provide additional information that is essential to the fair presentation of the government-wide and fund financial statements. Required Supplementary Information In addition to the basic financial statements and accompanying notes, this report also presents certain required supplementary information which includes (1) budgetary comparison schedule reconciling the budgetary fund balances and generally accepted accounting principles fund balances at fiscal year-end, (2) ten year loss development information for the State Insurance Fund, (3) Ten Year Trend Information for Teachers’ Retirement System, Judicial Retirement System, and Employees’ Retirement System (4) related notes to trend schedules for Employees’ Retirement System, (5) a schedule of funding progress for the Retired State Employees’ Health Care Trust and related notes, and (6) information about infrastructure assets reported using the modified approach. Other Supplementary Information Other supplementary information includes combining financial statements for nonmajor governmental funds, nonmajor enterprise funds, internal service funds, fiduciary funds, and nonmajor discretely presented component units. These funds are added together by fund type and presented in single columns in the basic financial statements.
STATE OF ALABAMA
17
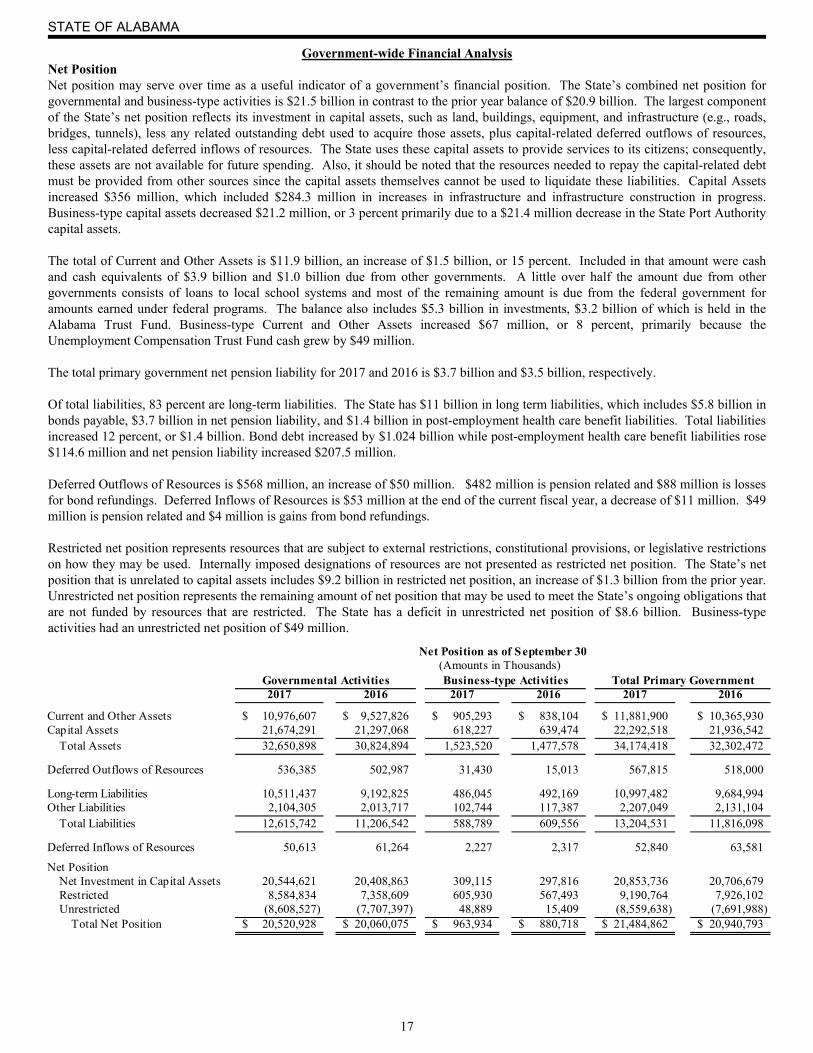
Government-wide Financial Analysis Net Position Net position may serve over time as a useful indicator of a government’s financial position. The State’s combined net position for governmental and business-type activities is $21.5 billion in contrast to the prior year balance of $20.9 billion. The largest component of the State’s net position reflects its investment in capital assets, such as land, buildings, equipment, and infrastructure (e.g., roads, bridges, tunnels), less any related outstanding debt used to acquire those assets, plus capital-related deferred outflows of resources, less capital-related deferred inflows of resources. The State uses these capital assets to provide services to its citizens; consequently, these assets are not available for future spending. Also, it should be noted that the resources needed to repay the capital-related debt must be provided from other sources since the capital assets themselves cannot be used to liquidate these liabilities. Capital Assets increased $356 million, which included $284.3 million in increases in infrastructure and infrastructure construction in progress. Business-type capital assets decreased $21.2 million, or 3 percent primarily due to a $21.4 million decrease in the State Port Authority capital assets. The total of Current and Other Assets is $11.9 billion, an increase of $1.5 billion, or 15 percent. Included in that amount were cash and cash equivalents of $3.9 billion and $1.0 billion due from other governments. A little over half the amount due from other governments consists of loans to local school systems and most of the remaining amount is due from the federal government for amounts earned under federal programs. The balance also includes $5.3 billion in investments, $3.2 billion of which is held in the Alabama Trust Fund. Business-type Current and Other Assets increased $67 million, or 8 percent, primarily because the Unemployment Compensation Trust Fund cash grew by $49 million. The total primary government net pension liability for 2017 and 2016 is $3.7 billion and $3.5 billion, respectively. Of total liabilities, 83 percent are long-term liabilities. The State has $11 billion in long term liabilities, which includes $5.8 billion in bonds payable, $3.7 billion in net pension liability, and $1.4 billion in post-employment health care benefit liabilities. Total liabilities increased 12 percent, or $1.4 billion. Bond debt increased by $1.024 billion while post-employment health care benefit liabilities rose $114.6 million and net pension liability increased $207.5 million. Deferred Outflows of Resources is $568 million, an increase of $50 million. $482 million is pension related and $88 million is losses for bond refundings. Deferred Inflows of Resources is $53 million at the end of the current fiscal year, a decrease of $11 million. $49 million is pension related and $4 million is gains from bond refundings. Restricted net position represents resources that are subject to external restrictions, constitutional provisions, or legislative restrictions on how they may be used. Internally imposed designations of resources are not presented as restricted net position. The State’s net position that is unrelated to capital assets includes $9.2 billion in restricted net position, an increase of $1.3 billion from the prior year. Unrestricted net position represents the remaining amount of net position that may be used to meet the State’s ongoing obligations that are not funded by resources that are restricted. The State has a deficit in unrestricted net position of $8.6 billion. Business-type activities had an unrestricted net position of $49 million.
2017 2016 2017 2016 2017 2016
Current and Other Assets 10,976,607$ 9,527,826$ 905,293$ 838,104$ 11,881,900$ 10,365,930$ Capital Assets 21,674,291 21,297,068 618,227 639,474 22,292,518 21,936,542 Total Assets 32,650,898 30,824,894 1,523,520 1,477,578 34,174,418 32,302,472
Deferred Outflows of Resources 536,385 502,987 31,430 15,013 567,815 518,000
Long-term Liabilities 10,511,437 9,192,825 486,045 492,169 10,997,482 9,684,994 Other Liabilities 2,104,305 2,013,717 102,744 117,387 2,207,049 2,131,104 Total Liabilities 12,615,742 11,206,542 588,789 609,556 13,204,531 11,816,098
Deferred Inflows of Resources 50,613 61,264 2,227 2,317 52,840 63,581
Net Position Net Investment in Capital Assets 20,544,621 20,408,863 309,115 297,816 20,853,736 20,706,679 Restricted 8,584,834 7,358,609 605,930 567,493 9,190,764 7,926,102 Unrestricted (8,608,527) (7,707,397) 48,889 15,409 (8,559,638) (7,691,988) Total Net Position 20,520,928$ 20,060,075$ 963,934$ 880,718$ 21,484,862$ 20,940,793$
Governmental Activities Business-type Activities Total Primary Government (Amounts in Thousands)
Net Position as of September 30
STATE OF ALABAMA
18
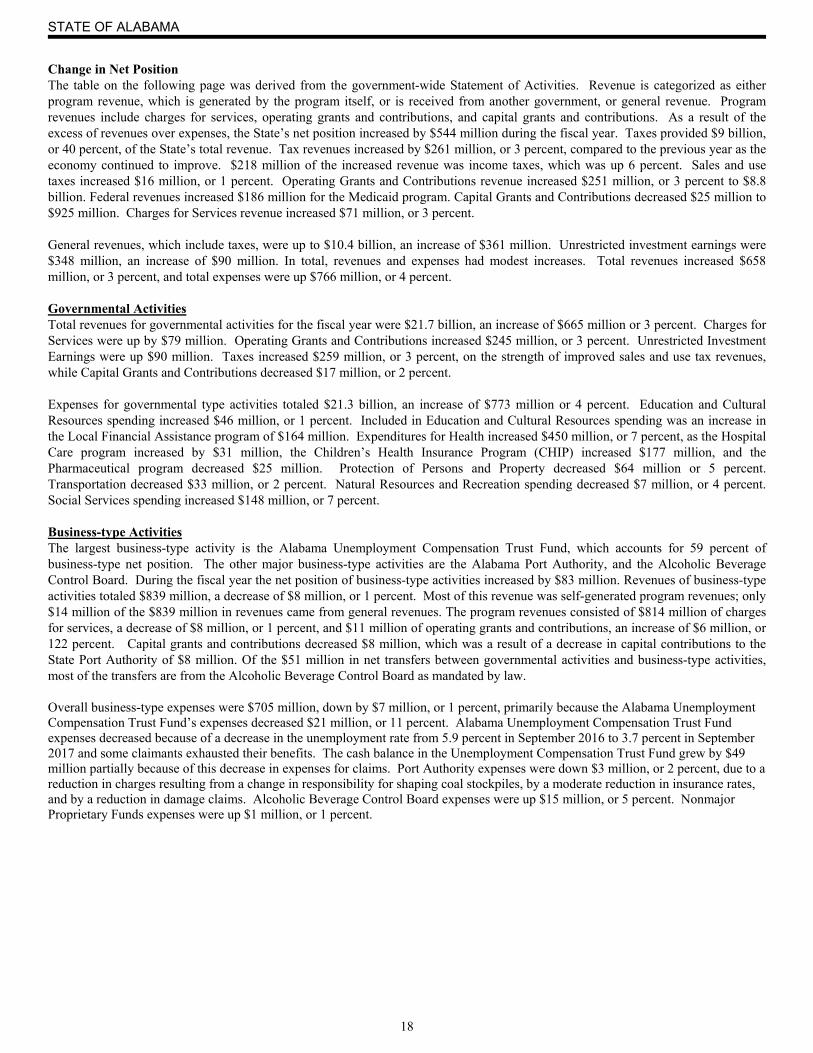
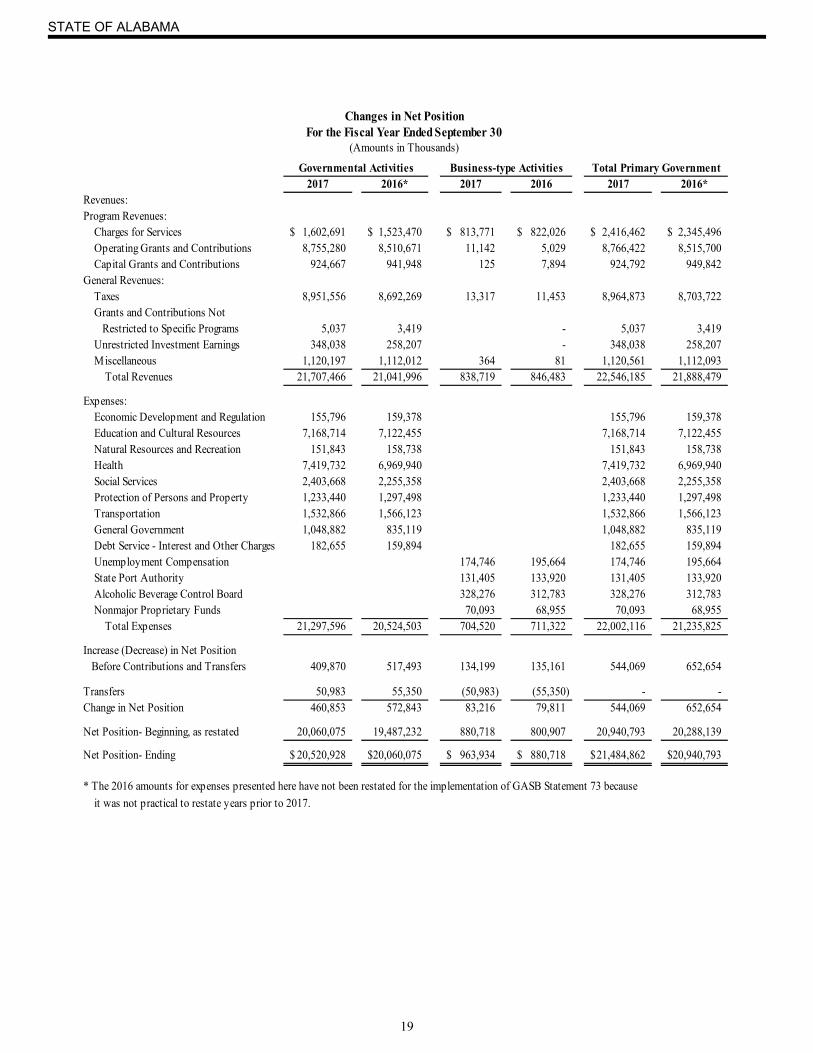
Change in Net Position The table on the following page was derived from the government-wide Statement of Activities. Revenue is categorized as either program revenue, which is generated by the program itself, or is received from another government, or general revenue. Program revenues include charges for services, operating grants and contributions, and capital grants and contributions. As a result of the excess of revenues over expenses, the State’s net position increased by $544 million during the fiscal year. Taxes provided $9 billion, or 40 percent, of the State’s total revenue. Tax revenues increased by $261 million, or 3 percent, compared to the previous year as the economy continued to improve. $218 million of the increased revenue was income taxes, which was up 6 percent. Sales and use taxes increased $16 million, or 1 percent. Operating Grants and Contributions revenue increased $251 million, or 3 percent to $8.8 billion. Federal revenues increased $186 million for the Medicaid program. Capital Grants and Contributions decreased $25 million to $925 million. Charges for Services revenue increased $71 million, or 3 percent. General revenues, which include taxes, were up to $10.4 billion, an increase of $361 million. Unrestricted investment earnings were $348 million, an increase of $90 million. In total, revenues and expenses had modest increases. Total revenues increased $658 million, or 3 percent, and total expenses were up $766 million, or 4 percent. Governmental Activities Total revenues for governmental activities for the fiscal year were $21.7 billion, an increase of $665 million or 3 percent. Charges for Services were up by $79 million. Operating Grants and Contributions increased $245 million, or 3 percent. Unrestricted Investment Earnings were up $90 million. Taxes increased $259 million, or 3 percent, on the strength of improved sales and use tax revenues, while Capital Grants and Contributions decreased $17 million, or 2 percent. Expenses for governmental type activities totaled $21.3 billion, an increase of $773 million or 4 percent. Education and Cultural Resources spending increased $46 million, or 1 percent. Included in Education and Cultural Resources spending was an increase in the Local Financial Assistance program of $164 million. Expenditures for Health increased $450 million, or 7 percent, as the Hospital Care program increased by $31 million, the Children’s Health Insurance Program (CHIP) increased $177 million, and the Pharmaceutical program decreased $25 million. Protection of Persons and Property decreased $64 million or 5 percent. Transportation decreased $33 million, or 2 percent. Natural Resources and Recreation spending decreased $7 million, or 4 percent. Social Services spending increased $148 million, or 7 percent. Business-type Activities The largest business-type activity is the Alabama Unemployment Compensation Trust Fund, which accounts for 59 percent of business-type net position. The other major business-type activities are the Alabama Port Authority, and the Alcoholic Beverage Control Board. During the fiscal year the net position of business-type activities increased by $83 million. Revenues of business-type activities totaled $839 million, a decrease of $8 million, or 1 percent. Most of this revenue was self-generated program revenues; only $14 million of the $839 million in revenues came from general revenues. The program revenues consisted of $814 million of charges for services, a decrease of $8 million, or 1 percent, and $11 million of operating grants and contributions, an increase of $6 million, or 122 percent. Capital grants and contributions decreased $8 million, which was a result of a decrease in capital contributions to the State Port Authority of $8 million. Of the $51 million in net transfers between governmental activities and business-type activities, most of the transfers are from the Alcoholic Beverage Control Board as mandated by law. Overall business-type expenses were $705 million, down by $7 million, or 1 percent, primarily because the Alabama Unemployment Compensation Trust Fund’s expenses decreased $21 million, or 11 percent. Alabama Unemployment Compensation Trust Fund expenses decreased because of a decrease in the unemployment rate from 5.9 percent in September 2016 to 3.7 percent in September 2017 and some claimants exhausted their benefits. The cash balance in the Unemployment Compensation Trust Fund grew by $49 million partially because of this decrease in expenses for claims. Port Authority expenses were down $3 million, or 2 percent, due to a reduction in charges resulting from a change in responsibility for shaping coal stockpiles, by a moderate reduction in insurance rates, and by a reduction in damage claims. Alcoholic Beverage Control Board expenses were up $15 million, or 5 percent. Nonmajor Proprietary Funds expenses were up $1 million, or 1 percent.
STATE OF ALABAMA
19
2017 2016* 2017 2016 2017 2016*Revenues:Program Revenues: Charges for Services 1,602,691$ 1,523,470$ 813,771$ 822,026$ 2,416,462$ 2,345,496$ Operating Grants and Contributions 8,755,280 8,510,671 11,142 5,029 8,766,422 8,515,700 Capital Grants and Contributions 924,667 941,948 125 7,894 924,792 949,842General Revenues: Taxes 8,951,556 8,692,269 13,317 11,453 8,964,873 8,703,722 Grants and Contributions Not Restricted to Specific Programs 5,037 3,419 - 5,037 3,419 Unrestricted Investment Earnings 348,038 258,207 - 348,038 258,207 Miscellaneous 1,120,197 1,112,012 364 81 1,120,561 1,112,093 Total Revenues 21,707,466 21,041,996 838,719 846,483 22,546,185 21,888,479
Expenses: Economic Development and Regulation 155,796 159,378 155,796 159,378 Education and Cultural Resources 7,168,714 7,122,455 7,168,714 7,122,455 Natural Resources and Recreation 151,843 158,738 151,843 158,738 Health 7,419,732 6,969,940 7,419,732 6,969,940 Social Services 2,403,668 2,255,358 2,403,668 2,255,358 Protection of Persons and Property 1,233,440 1,297,498 1,233,440 1,297,498 Transportation 1,532,866 1,566,123 1,532,866 1,566,123 General Government 1,048,882 835,119 1,048,882 835,119 Debt Service - Interest and Other Charges 182,655 159,894 182,655 159,894 Unemployment Compensation 174,746 195,664 174,746 195,664 State Port Authority 131,405 133,920 131,405 133,920 Alcoholic Beverage Control Board 328,276 312,783 328,276 312,783 Nonmajor Proprietary Funds 70,093 68,955 70,093 68,955 Total Expenses 21,297,596 20,524,503 704,520 711,322 22,002,116 21,235,825
Increase (Decrease) in Net Position Before Contributions and Transfers 409,870 517,493 134,199 135,161 544,069 652,654
Transfers 50,983 55,350 (50,983) (55,350) - - Change in Net Position 460,853 572,843 83,216 79,811 544,069 652,654
Net Position- Beginning, as restated 20,060,075 19,487,232 880,718 800,907 20,940,793 20,288,139
Net Position- Ending 20,520,928$ 20,060,075$ 963,934$ 880,718$ 21,484,862$ 20,940,793$
* The 2016 amounts for expenses presented here have not been restated for the implementation of GASB Statement 73 because
it was not practical to restate years prior to 2017.
Changes in Net PositionFor the Fiscal Year Ended September 30
(Amounts in Thousands)
Governmental Activities Business-type Activities Total Primary Government
STATE OF ALABAMA
20
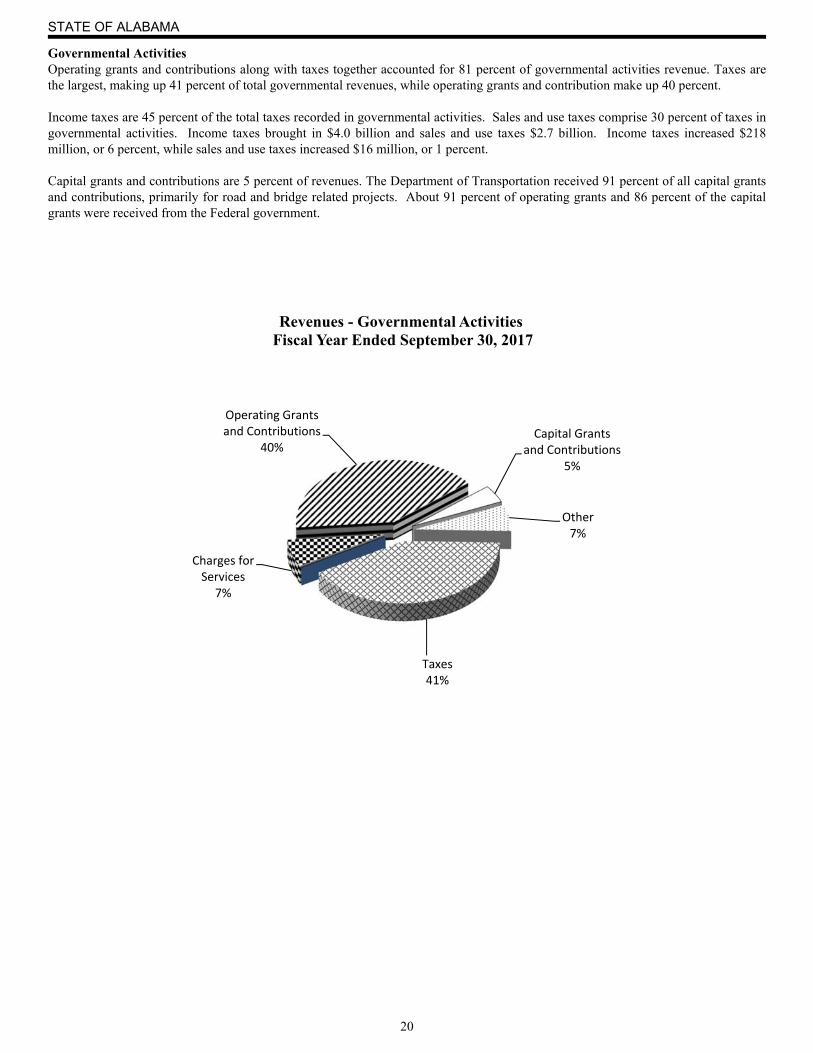
Governmental Activities Operating grants and contributions along with taxes together accounted for 81 percent of governmental activities revenue. Taxes are the largest, making up 41 percent of total governmental revenues, while operating grants and contribution make up 40 percent. Income taxes are 45 percent of the total taxes recorded in governmental activities. Sales and use taxes comprise 30 percent of taxes in governmental activities. Income taxes brought in $4.0 billion and sales and use taxes $2.7 billion. Income taxes increased $218 million, or 6 percent, while sales and use taxes increased $16 million, or 1 percent. Capital grants and contributions are 5 percent of revenues. The Department of Transportation received 91 percent of all capital grants and contributions, primarily for road and bridge related projects. About 91 percent of operating grants and 86 percent of the capital grants were received from the Federal government.
Charges for Services
7%
Operating Grants and Contributions
40%Capital Grants
and Contributions5%
Other7%
Taxes41%
Revenues - Governmental ActivitiesFiscal Year Ended September 30, 2017
STATE OF ALABAMA
21
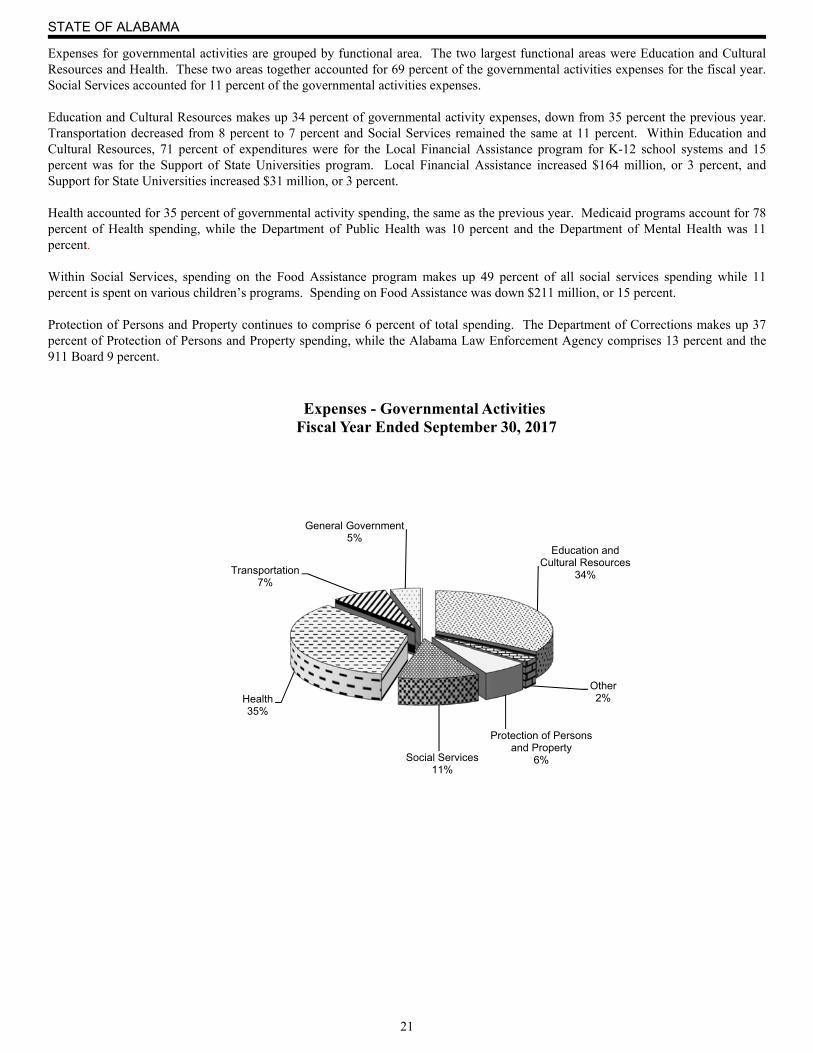
Expenses for governmental activities are grouped by functional area. The two largest functional areas were Education and Cultural Resources and Health. These two areas together accounted for 69 percent of the governmental activities expenses for the fiscal year. Social Services accounted for 11 percent of the governmental activities expenses. Education and Cultural Resources makes up 34 percent of governmental activity expenses, down from 35 percent the previous year. Transportation decreased from 8 percent to 7 percent and Social Services remained the same at 11 percent. Within Education and Cultural Resources, 71 percent of expenditures were for the Local Financial Assistance program for K-12 school systems and 15 percent was for the Support of State Universities program. Local Financial Assistance increased $164 million, or 3 percent, and Support for State Universities increased $31 million, or 3 percent. Health accounted for 35 percent of governmental activity spending, the same as the previous year. Medicaid programs account for 78 percent of Health spending, while the Department of Public Health was 10 percent and the Department of Mental Health was 11 percent. Within Social Services, spending on the Food Assistance program makes up 49 percent of all social services spending while 11 percent is spent on various children’s programs. Spending on Food Assistance was down $211 million, or 15 percent. Protection of Persons and Property continues to comprise 6 percent of total spending. The Department of Corrections makes up 37 percent of Protection of Persons and Property spending, while the Alabama Law Enforcement Agency comprises 13 percent and the 911 Board 9 percent.
Education and Cultural Resources
34%
Other2%
Protection of Persons and Property
6%Social Services11%
Health35%
Transportation7%
General Government5%
Expenses - Governmental ActivitiesFiscal Year Ended September 30, 2017

STATE OF ALABAMA
22
Financial Analysis of the State’s Funds
Governmental Funds The focus of the State’s governmental funds is to provide information on near-term inflows, outflows, and balances of spendable resources. Such information is useful in assessing the State’s financing requirements. In particular, unassigned General Fund balance may serve as a useful measure of a government’s net resources available for spending at the end of the fiscal year. At the end of the fiscal year, the governmental funds reported combined ending fund balances of $8.1 billion. Nonspendable fund balance was $127 million and assigned fund balance was $92 million. Spending restricted for specific purposes comprised $7.6 billion. Those restrictions have been imposed by external parties, constitutional provisions, or enabling legislation. The largest restricted amount of $3.2 billion is for Alabama Trust Capital. The Alabama Trust Fund originally was a permanent fund, but is now a special revenue fund because of Amendment 666 and Amendment 856 to the Constitution of Alabama of 1901 which allow limited spending of principal. An additional $4.4 billion of governmental fund balance has been restricted for a wide variety of purposes which includes $1.1 billion restricted for various capital projects and debt service. The General Fund is the primary operating fund of the State. At the end of the current fiscal year, unassigned fund balance of the General Fund was $431 million, $4 million nonspendable fund balance, and $2 million assigned fund balance. Revenues for the General Fund were up $85 million, or 5 percent, as taxes increased $61 million. The largest increase in tax revenues to the General Fund was $22 million in insurance premium tax and $19 million in simplified sellers use tax. Expenditures for the General Fund increased $54 million, or 4 percent. Health expenditures increased $16 million, or 2 percent. 95 percent of the General Fund health expenditures were in the Medicaid Agency. Physician Care increased $29 million while Hospital Care rose $18 million. Spending on General Government in the General Fund increased $24 million. Judicial Operations remained the same while Prosecution Services increased $4 million. Protection of Persons and Property expenditures increased $15 million. The largest spending for Protection of Persons and Property in the General Fund was $405 million for the Department of Corrections, an increase of $10 million from the previous year. Due to other funds decreased by $163 million primarily because of the repayment of the amount owed by the General Fund to the General Fund Rainy Day account within the Alabama Trust Fund. The Alabama Economic Settlement Authority bond proceeds were the source of funds for this repayment pursuant to Act 2016-469. The Education Trust Fund (ETF) is the largest operating fund of the State. Revenues credited to the ETF are used for the support, maintenance and development of public education in Alabama, debt service and capital improvements relating to educational facilities, and other functions related to educating the state's citizens. Programs and agencies supported by the ETF include K-12 education, public library services, performing and fine arts, various scholarship programs, the state's education regulatory departments, and two-year and four-year colleges and universities. Funding from the ETF is also provided to non-state agencies that provide educational services to the people of Alabama, including the arts, disease counseling and education, and youth development. Ten tax sources are allocated to the ETF, the largest of which are the individual and corporate income tax, sales tax, utility tax, and use tax. Tax revenues in the ETF for the fiscal year were up $204 million, or 3 percent as compared to the previous fiscal year. Sales and use tax revenues decreased by $25 million and income tax revenues were up by $218 million while mobile telecommunications tax decreased $2 million. Expenditures, as limited by the budget, were up 5 percent, or $309 million. A large portion of the increase, $164 million, was in the Local Financial Assistance program. The ETF transferred out $312 million, with the largest of these transfers going to supplement operations of the Prepaid Affordable College Tuition Fund (PACT), a Fiduciary fund. Prepaid Affordable College Tuition Fund received $64 million in transfers as mandated by the legislature in the appropriations acts. Due to Other Funds in the ETF is $8 million, down from $12 million. The ETF fund balance decreased $86 million to a balance of $401 million, as cash and cash equivalents decreased $103 million. The fund balance, while legally restricted to a variety of educational purposes, is all available for those purposes in the next fiscal year. The Alabama Trust Fund consists of income from the sale or lease of rights for offshore exploration and drilling for oil and gas off the Alabama coast, as well as investment income earned on the accumulated capital. Revenues from royalties and other payments related to the production of oil and gas increased by $12 million during the fiscal year. Investment earnings increased from $253 million to $333 million during the fiscal year. Various amendments to the Constitution of Alabama of 1901 require that Alabama Trust income be used to support the General Fund, Forever Wild Land Trust, and a variety of state and local capital projects and debt service. In compliance with constitutional requirements, $159 million was transferred out to support these other funds. $98 million was transferred to the General Fund. During the fiscal year, the amount constitutionally restricted for Trust Capital increased by $457 million, an increase of more than 17 percent. Due from other funds decreased by $149 million primarily because of the repayment to the General Fund Rainy Day Account within the Alabama Trust Fund. $400 million was deposited in the Alabama Trust Fund from the Alabama Economic Settlement Authority pursuant to Act 2016-469. $162 million was a repayment to the General Fund Rainy Day Account of the Alabama Trust Fund. $238 million was a repayment of transfers from the Alabama Trust Fund. The Medicaid Fund accounts for the portion of the Medicaid program that is funded 89 percent by Federal revenues. Federal revenues increased 4 percent, or $190 million. Expenditures increased 7 percent or $300 million. Pharmaceutical Care program expenditures decreased $25 million, Hospital Care increased $31 million, Nursing Home Care increased $128 million, and the
STATE OF ALABAMA
23
Children’s Health Insurance Plan (CHIP) increased $177 million. The net change in fund balance for Medicaid was a $1.8 million decrease, bringing the total fund balance to a deficit of $53.5 million. The Public Road and Bridge Fund is the general operating fund of the Department of Transportation (DOT). The Fund receives all state revenues for that department, including all federal aid reimbursements. Amendment No. 93 (as amended by Amendment No. 354) to the Constitution of Alabama of 1901 provides that monies derived from any fee, excise or license taxes levied by the State on motor fuels shall be expended for the cost of construction, reconstruction, maintenance and repair of public highways and bridges; the cost of highway rights-of-way; the payment of highway obligations; the cost of traffic regulations; and the expense of enforcing state traffic and motor vehicle laws. Revenues from federal grants were 60 percent of fund revenues while gasoline and motor fuel taxes were 26 percent. Federal revenues increased $9 million, or 1 percent. Expenditures increased $24 million or 2 percent. The cash balance increased from $464 million to $466 million. Of the $513 million fund balance, $30 million is in inventory of materials on hand and $483 million is restricted to cover existing construction and maintenance contracts. The Public Welfare Trust Fund is used to account for a broad range of social, protective, and financial assistance programs for citizens. This is the major operating fund of the Department of Human Resources. Revenues from federal funds comprise 89 percent, and is supplemented by whiskey tax and a portion of the Alabama Alcoholic Beverage Control Board profits, sales tax, franchise tax, and beer tax. Overall spending decreased $27 million, or 1 percent. The Food Assistance program accounts for 67 percent of total expenditures. The fund balance at year end is $46 million, an increase of $3 million. The small fund balance is normal for this fund, since the Federal Cash Management Improvement Act does not allow the State to draw money and hold it for more than a few days. The fund balance, while legally restricted to a variety of social service programs, is all available for those programs in the next fiscal year. The Medicaid Fund had a negative fund balance at September 30. This is not typical for the State’s major governmental funds because the fiscally conservative nature of the State’s controls generally results in positive fund balances. Constitutional Amendment 26 requires the State to have on hand at year end in each budgeted fund enough cash to cover all outstanding warrants and any remaining unspent obligations (encumbrances and accounts payable). Medicaid often has a negative fund balance because GAAP requires the accrual of claims payable and the related federal receivable, but not the State matching amounts which will be recorded as revenues when received in the next fiscal year. The Public Road and Bridge Fund retains enough cash to cover its outstanding construction contracts and commitments, so that fund historically has a large fund balance. Proprietary Funds The State’s proprietary fund financial statements provide the same type of information found in the government-wide financial statements, but in more detail. During the fiscal year, total net position for all enterprise funds increased by $83 million. The Unemployment Compensation Trust Fund has again improved its financial condition. The net position increased in 2017 by $67 million, and in 2016 net position increased by $75 million. The minimum employer rate remained at 0.00065 and the maximum employer rate remained at 0.0068 for the employer shared cost. Revenues decreased in 2017 as compared to 2016 due to a decrease in the amount of Unemployment Compensation (UC) taxes received. There was a $32 million decrease in the amount of UC taxes received in 2017 compared to 2016. Federal UC Drawdown programs remained at $2 million. Benefits paid dropped $21 million, a decrease of 10 percent. The trust fund cash grew from $530 million to $579 million; net position now stands at $570 million. The net position of the State Port Authority is $324 million, a decrease of $1 million. Operating revenues were $126 million, an increase of $6 million, or 5 percent over the prior year, resulting largely from recovery in the global steel markets, affecting demand for metallurgical coal and impacting import and export volumes of semi-finished and finished steel. Revenue at the Authority’s McDuffie Coal Terminal increased by $7 million, or 14 percent, which included a $1 million allocation of energy port funds collected through the federal harbor maintenance tax. Even with a strong year for steel products, General Cargo/Intermodal revenues decreased by nearly $1 million, or 3 percent, largely due to the reduced allocation of energy port funds, which were $2 million in fiscal 2016, compared with $0.1 million in fiscal 2017. The Terminal Railway revenues were $3 million, a decrease of 15 percent due to a reduction in rail activity. The net position of the Alcoholic Beverage Control Board decreased by $8 million in fiscal year 2017, increasing the deficit in net position to $90 million. The Board is required by law to distribute all of its profits and cannot own real property; therefore, net position generally will remain negative. Non-current liabilities, such as compensated absences of $5 million, other post-employment benefits of $34 million, net pension liability of $62 million, and some of the current liabilities are not deducted from the distribution amount. The deficit increase of $8 million in 2017 is due to expenses accrued for these non-current liabilities.
STATE OF ALABAMA
24
Budgetary Highlights
General Fund The original budget for the General Fund was increased by a net of $9 million during fiscal year 2017. Expenditures were increased by $20 million and Transfers Out decreased by $11 million. These budgetary changes are reflected in the final budget on the Budgetary Comparison Schedule. The General Fund was not prorated during fiscal year 2017. Budgeted revenues were increased by $8 million and actual tax revenues were $61 million greater than the final budget because of the improved economy. There were significant budgetary variances between the final budget and actual results. Unexpended and reverted appropriations from fiscal year 2017 were re-appropriated to fiscal year 2018; therefore, many agencies did not spend all of their appropriations during fiscal year 2017. The Medicaid Agency and the Legislature have $47 million and $7 million, respectively to carryover to fiscal year 2018. The Department of Corrections and the Department of Finance have carryovers of approximately $6 million and $2 million, respectively. These appropriations will be needed in the future primarily because expenditures are expected to increase. There were no supplemental appropriations. Conditional and other appropriations were approximately $9.5 million to various agencies. $7.5 million of conditional appropriations were transferred to the Fair Trial Tax Fund for indigent defense. Conditional amounts are not included in the budget until the conditions have been met. Some expenditures are required by law to be fully funded, and estimated amounts are approved in the General Fund appropriation bill. Increases to these estimated amounts do not require a new bill and are included as other appropriations. Emergency appropriations of $2 million are included in the original budget and are included in the budgeted amounts as Other on the Budgetary Comparison Schedule. Emergency appropriations cannot exceed two percent of the total amount appropriated. On a budgetary basis, General Fund revenues and other sources exceeded expenditures and other uses by $188 million. However, on a GAAP (Generally Accepted Accounting Principles) basis, General Fund revenues and other sources exceeded expenditures and other uses by $249 million. The Budgetary Comparison Schedule in Required Supplementary Information reconciles these amounts and lists the accounting basis differences.

STATE OF ALABAMA
25
Capital Asset and Debt Administration Capital Assets At the end of fiscal year 2017 the State had invested $22.3 billion, net of accumulated depreciation, in a broad range of capital assets (see the table below). Depreciation charges for the fiscal year totaled $129.6 million.
As allowed by GASB Statement No. 34, the State has adopted the modified approach for reporting roadway and bridge infrastructure assets. Under the modified approach, depreciation is not recorded. Infrastructure costs that result in an increase in the capacity or an improvement in the efficiency of the infrastructure network are capitalized and added to the historical cost of the assets. Costs that allow the infrastructure network to be used efficiently over the expected useful life of the assets are expensed as general maintenance costs. Certain maintenance costs that extend the useful life of the assets but do not increase capacity or efficiency are classified as preservation costs. Preservation costs are expensed and reported in lieu of a charge for depreciation expense. Extensive project documentation is required to meet various federal and state guidelines concerning the construction of infrastructure. The completeness of this documentation affects the timing of project capitalization. The State capitalizes infrastructure when all costs for a project are incurred and all project documentation is satisfactorily completed, filed, and accepted with the appropriate entities. Projects that meet the cost and documentation criteria are closed, and appropriate entries are made to adjust the Infrastructure Construction in Progress and Infrastructure asset accounts annually. Due to the documentation requirements, there can be substantial time lags between the date a project is put into service on the State’s roadway network and the date the project is capitalized. A significant portion of Infrastructure Construction in Progress consists of projects that have been put into service and maintenance costs could have been incurred. The State uses the International Roughness Index (IRI) to measure and monitor pavement conditions. The IRI is a standard representing the perceived smoothness of pavements while traveling in passenger cars. A lower IRI measurement represents a smoother condition of pavement. The United States Department of Transportation developed suggested values for IRI of <60 inches/mile to >220 inches/mile to grade the smoothness condition of the roadway. A range of 60 to 94 is considered “Good” condition, with negligible maintenance required, and a range of 95-119 for Interstate Highways or 95-170 for non-interstate highways is considered “Fair”, requiring routine maintenance such as pavement patching. The weighted average rating of Alabama’s roads was 79.79, which exceeds the State’s goal. The State maintains 5,395 bridges and culverts. The State rates the major structural components and deck area of the bridge or culvert on a scale of one to ten and assigns a weighted rating to the bridge or culvert. The State expects those bridges and culverts to be maintained at a rating within the range of 5 - 6.99, which is considered “satisfactory,” meaning the structural elements are sound but
(Amounts in Thousands)
2017 2016 2017 2016 2017 2016
Capital Assets Not Being Depreciated:
Land 386,201$ 348,854$ 77,258$ 77,259$ 463,459$ 426,113$
Historical Exhibits 4,126 4,158 2,350 2,350 6,476 6,508
Construction In Progress 149,579 155,710 5,383 4,907 154,962 160,617
Intangible Assets Under Development - 55,658 - - - 55,658
Construction In Progress - Infrastructure 3,304,624 3,610,772 - - 3,304,624 3,610,772
Infrastructure 16,386,881 15,796,402 - - 16,386,881 15,796,402
Inexhaustible Intangible Assets - - 10 10 10 10
Total Capital Assets
Not Being Depreciated 20,231,411 19,971,554 85,001 84,526 20,316,412 20,056,080
Capital Assets Being Depreciated:
Buildings 1,824,769 1,756,178 682,225 677,547 2,506,994 2,433,725
Equipment 722,129 661,588 406,419 403,739 1,128,548 1,065,327
Software and Other Intangible Assets 96,448 42,003 3,266 3,266 99,714 45,269
Total Capital Assets
Being Depreciated 2,643,346 2,459,769 1,091,910 1,084,552 3,735,256 3,544,321
Less Accumulated Depreciation 1,200,466 1,134,199 558,684 529,604 1,759,150 1,663,803
Total Capital Assets
Being Depreciated, Net 1,442,880 1,325,570 533,226 554,948 1,976,106 1,880,518
Capital Assets, Net 21,674,291$ 21,297,124$ 618,227$ 639,474$ 22,292,518$ 21,936,598$
Governmental Activities Business-type Activities Total Primary Government
Capital Assets as of September 30
STATE OF ALABAMA
26
have minor deterioration. The actual weighted average rating for the most recent condition assessment was 6.51, in the upper end of the satisfactory range. For fiscal years 2017 and 2016, the State estimated it would need to spend $361,768,000 and $323,600,000, respectively, to preserve and maintain all roadway assets and $10 million in each year to preserve all bridge assets at or above the “Established Condition Levels” presented above. In fiscal year 2017, the State spent $372,860,000 for roadway preservation and $286,279,000 for bridge preservation. The State spent $324,726,000 for roadway preservation and $163,389,000 for bridge preservation in fiscal year 2016. In the next fiscal year, the Alabama Department of Transportation estimates that it will need to spend approximately $361,768,000 to preserve all roadway assets and approximately $10,000,000 to preserve all bridge assets at or above the “Established Condition Levels” presented above. More detailed information about the State’s capital assets is presented in Note 4 to the financial statements and in the Required Supplementary Information section. Long-term Debt The only method under which general obligation debt can be incurred by the State is by amendment to the Constitution of Alabama of 1901. The debt prohibition does not apply to debts incurred by separate public corporations functioning as State instrumentalities. The revenue bonds issued by these corporations are limited obligations of the corporation, not general obligations of the State, and the full faith and credit of the State is not pledged for their repayment. Certain revenues, usually earmarked taxes or revenues generated from the project financed are pledged for the payment of the debt. These corporations are blended with the primary government. The State and its component units issue serial and term bonds. Alabama has traditionally received high bond ratings from both Standard and Poor’s Corporation and Moody’s Investors Service.
The State issued $105,140,000 in new general obligation bonds. Additionally, the State issued $1,421,730,000 in new revenue bonds, which includes $628,715,000 in Alabama Economic Settlement Authority bonds and $793,015,000 in Alabama Federal Aid Highway Finance Authority bonds. The Alabama Federal Aid Highway Finance Authority bonds were issued to fund transportation projects and to refund previously issued bonds. Additional detailed information regarding the State’s long-term debt is presented in Note 5 to the financial statements.
Economic Factors and Next Year’s Budgets and Rates
The General Fund budget was increased from fiscal year 2017 to 2018. The Department of Corrections and Pardons and Paroles received increases of $38 million and $8 million, respectively. The General Fund Rainy Day account was fully repaid in fiscal year 2017. The total ETF budget for fiscal year 2018 is $6.42 billion. The Rolling Reserve Act (Act 2011-3) cap on the fiscal year 2018 appropriations is $6.42 billion. The K-12 Local Boards of Education received an appropriation increase of $24 million for fiscal year 2018 over fiscal year 2017 from the Education Trust Fund. The four-year Universities received an increase of $1 million. Total tax collections are up approximately 3.6 percent for fiscal year 2018 as compared to fiscal year 2017. The State’s seasonally adjusted unemployment rate, at 3.8 percent in April 2018, was down from March 2018’s rate of 4.1 percent, and below April 2017’s rate of 4.8 percent. The number of employed workers increased from April 2017 to April 2018 from 2,067,000 to 2,086,000.
Requests for Information
This financial report is designed to provide a general overview of the State of Alabama’s finances for all those with an interest in the government’s finances. Questions concerning any of the information provided in this report or requests for additional financial information should be addressed to: Office of the State Comptroller, Financial Reporting Section, RSA Union, Suite 298, Montgomery, AL 36130-2602.
2017 2016 2017 2016 2017 2016
General Obligation Bonds 673,634$ 722,383$ -$ -$ 673,634$ 722,383$
Revenue Bonds 4,753,950 3,667,728 327,401 344,610 5,081,351 4,012,338
Total 5,427,584$ 4,390,111$ 327,401$ 344,610$ 5,754,985$ 4,734,721$
Outstanding Bonded Debt as of September 30
(Amounts in Thousands)
Governmental Activities Business-type Activities Total Primary Government

STATE OF ALABAMA
FINANCIAL SECTIONBasic Financial Statements
27
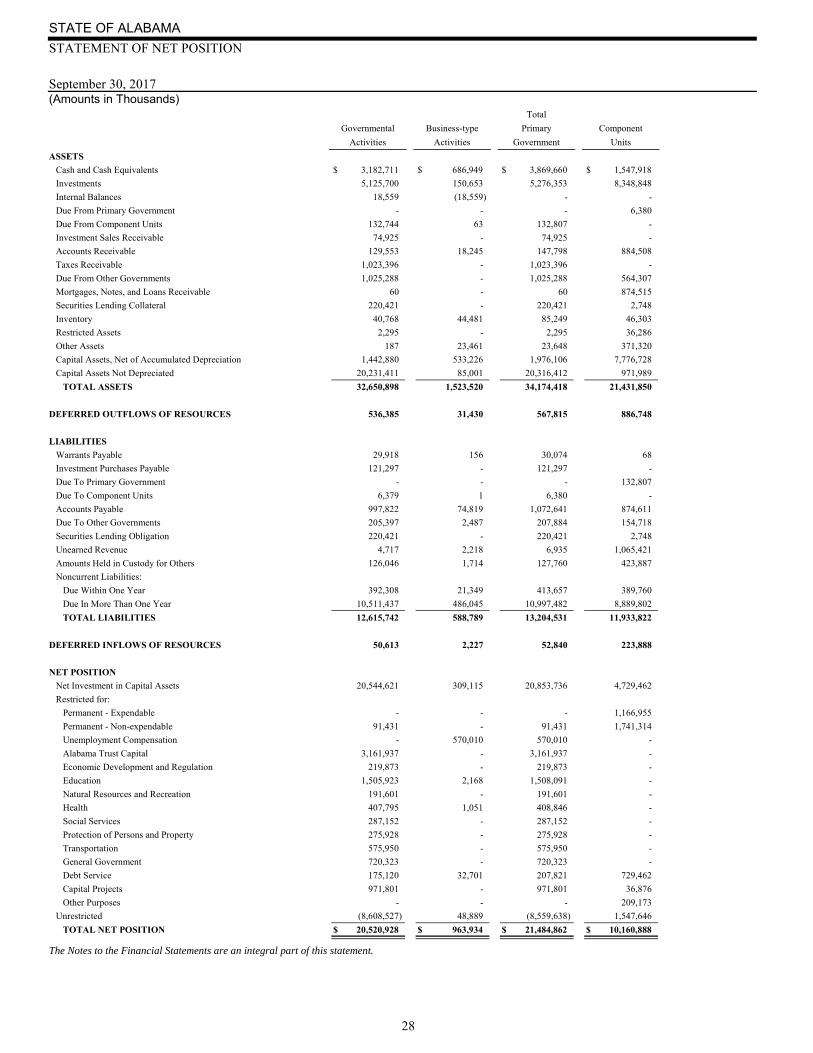
September 30, 2017(Amounts in Thousands)
STATE OF ALABAMA
STATEMENT OF NET POSITION
Total
Governmental Business-type Primary Component
Activities Activities Government Units
The Notes to the Financial Statements are an integral part of this statement.
ASSETS
Cash and Cash Equivalents $ 3,182,711 $ 686,949 $ 3,869,660 $ 1,547,918
Investments 5,125,700 150,653 5,276,353 8,348,848
Internal Balances 18,559 (18,559) - -
Due From Primary Government - - - 6,380
Due From Component Units 132,744 63 132,807 -
Investment Sales Receivable 74,925 - 74,925 -
Accounts Receivable 129,553 18,245 147,798 884,508
Taxes Receivable 1,023,396 - 1,023,396 -
Due From Other Governments 1,025,288 - 1,025,288 564,307
Mortgages, Notes, and Loans Receivable 60 - 60 874,515
Securities Lending Collateral 220,421 - 220,421 2,748
Inventory 40,768 44,481 85,249 46,303
Restricted Assets 2,295 - 2,295 36,286
Other Assets 187 23,461 23,648 371,320
Capital Assets, Net of Accumulated Depreciation 1,442,880 533,226 1,976,106 7,776,728
Capital Assets Not Depreciated 20,231,411 85,001 20,316,412 971,989
TOTAL ASSETS 32,650,898 1,523,520 34,174,418 21,431,850
DEFERRED OUTFLOWS OF RESOURCES 536,385 31,430 567,815 886,748
LIABILITIES
Warrants Payable 29,918 156 30,074 68
Investment Purchases Payable 121,297 - 121,297 -
Due To Primary Government - - - 132,807
Due To Component Units 6,379 1 6,380 -
Accounts Payable 997,822 74,819 1,072,641 874,611
Due To Other Governments 205,397 2,487 207,884 154,718
Securities Lending Obligation 220,421 - 220,421 2,748
Unearned Revenue 4,717 2,218 6,935 1,065,421
Amounts Held in Custody for Others 126,046 1,714 127,760 423,887
Noncurrent Liabilities:
Due Within One Year 392,308 21,349 413,657 389,760
Due In More Than One Year 10,511,437 486,045 10,997,482 8,889,802
TOTAL LIABILITIES 12,615,742 588,789 13,204,531 11,933,822
DEFERRED INFLOWS OF RESOURCES 50,613 2,227 52,840 223,888
NET POSITION
Net Investment in Capital Assets 20,544,621 309,115 20,853,736 4,729,462
Restricted for:
Permanent - Expendable - - - 1,166,955
Permanent - Non-expendable 91,431 - 91,431 1,741,314
Unemployment Compensation - 570,010 570,010 -
Alabama Trust Capital 3,161,937 - 3,161,937 -
Economic Development and Regulation 219,873 - 219,873 -
Education 1,505,923 2,168 1,508,091 -
Natural Resources and Recreation 191,601 - 191,601 -
Health 407,795 1,051 408,846 -
Social Services 287,152 - 287,152 -
Protection of Persons and Property 275,928 - 275,928 -
Transportation 575,950 - 575,950 -
General Government 720,323 - 720,323 -
Debt Service 175,120 32,701 207,821 729,462
Capital Projects 971,801 - 971,801 36,876
Other Purposes - - - 209,173
Unrestricted (8,608,527) 48,889 (8,559,638) 1,547,646
TOTAL NET POSITION $ 20,520,928 $ 963,934 $ 21,484,862 $ 10,160,888
28

29
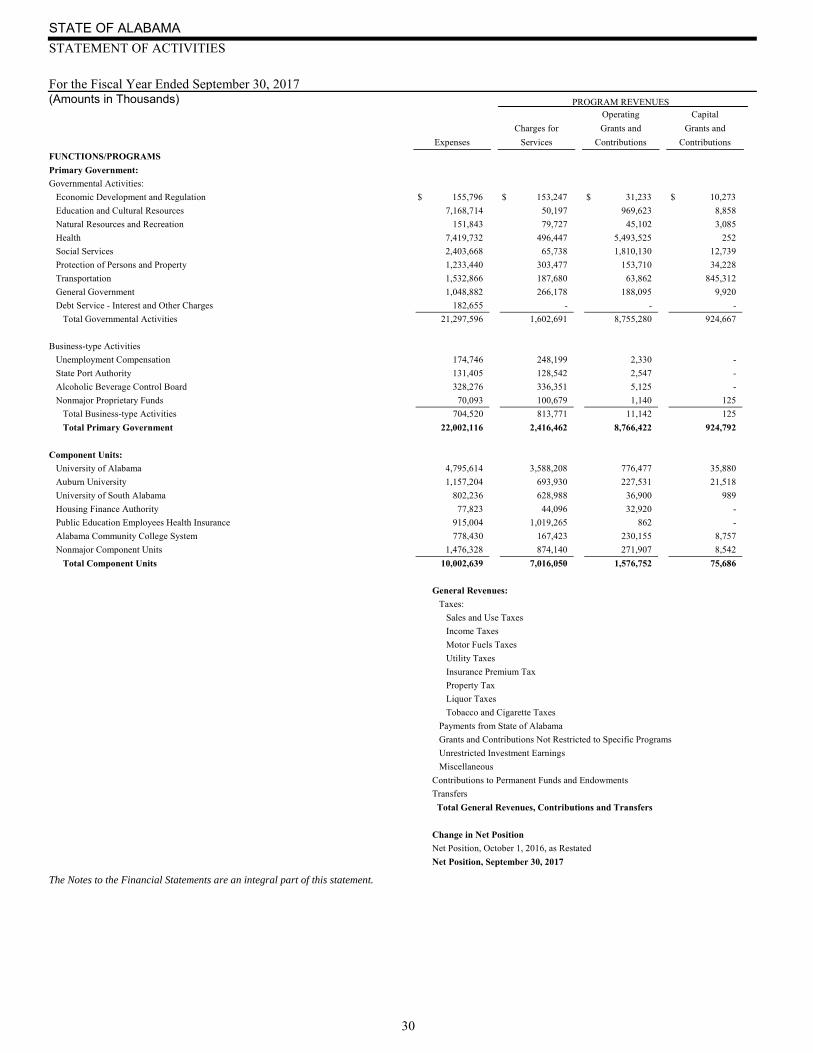
For the Fiscal Year Ended September 30, 2017 PROGRAM REVENUES (Amounts in Thousands)
STATE OF ALABAMA
STATEMENT OF ACTIVITIES
Operating Capital
Charges for Grants and Grants and
Expenses Services Contributions Contributions
The Notes to the Financial Statements are an integral part of this statement.
FUNCTIONS/PROGRAMS
Primary Government:
Governmental Activities:
Economic Development and Regulation $ 155,796 $ 153,247 $ 31,233 $ 10,273
Education and Cultural Resources 7,168,714 50,197 969,623 8,858
Natural Resources and Recreation 151,843 79,727 45,102 3,085
Health 7,419,732 496,447 5,493,525 252
Social Services 2,403,668 65,738 1,810,130 12,739
Protection of Persons and Property 1,233,440 303,477 153,710 34,228
Transportation 1,532,866 187,680 63,862 845,312
General Government 1,048,882 266,178 188,095 9,920
Debt Service - Interest and Other Charges 182,655 - - -
Total Governmental Activities 21,297,596 1,602,691 8,755,280 924,667
Business-type Activities
Unemployment Compensation 174,746 248,199 2,330 -
State Port Authority 131,405 128,542 2,547 -
Alcoholic Beverage Control Board 328,276 336,351 5,125 -
Nonmajor Proprietary Funds 70,093 100,679 1,140 125
Total Business-type Activities 704,520 813,771 11,142 125
Total Primary Government 22,002,116 2,416,462 8,766,422 924,792
Component Units:
University of Alabama 4,795,614 3,588,208 776,477 35,880
Auburn University 1,157,204 693,930 227,531 21,518
University of South Alabama 802,236 628,988 36,900 989
Housing Finance Authority 77,823 44,096 32,920 -
Public Education Employees Health Insurance 915,004 1,019,265 862 -
Alabama Community College System 778,430 167,423 230,155 8,757
Nonmajor Component Units 1,476,328 874,140 271,907 8,542
Total Component Units 10,002,639 7,016,050 1,576,752 75,686
General Revenues:
Taxes:
Sales and Use Taxes
Income Taxes
Motor Fuels Taxes
Utility Taxes
Insurance Premium Tax
Property Tax
Liquor Taxes
Tobacco and Cigarette Taxes
Payments from State of Alabama
Grants and Contributions Not Restricted to Specific Programs
Unrestricted Investment Earnings
Miscellaneous
Contributions to Permanent Funds and Endowments
Transfers
Total General Revenues, Contributions and Transfers
Change in Net Position
Net Position, October 1, 2016, as Restated
Net Position, September 30, 2017
30
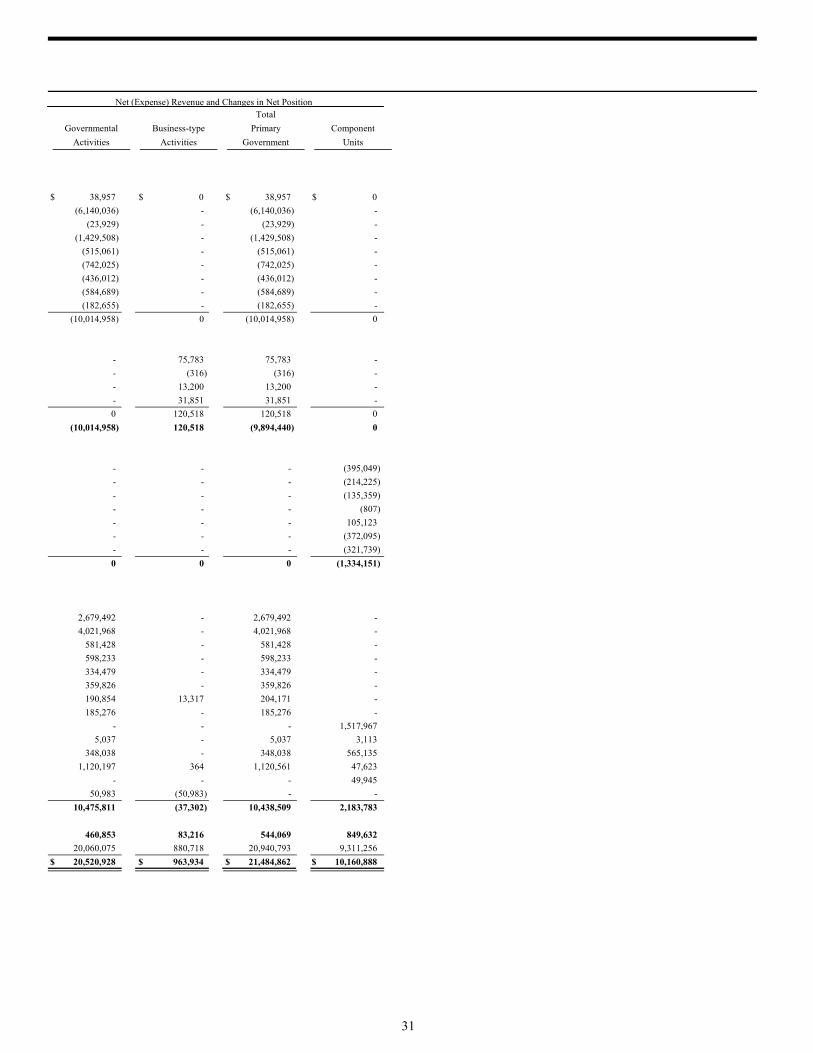
Net (Expense) Revenue and Changes in Net Position Total
Governmental Business-type Primary Component
Activities Activities Government Units
$ 38,957 $ 0 $ 38,957 $ 0
(6,140,036) - (6,140,036) -
(23,929) - (23,929) -
(1,429,508) - (1,429,508) -
(515,061) - (515,061) -
(742,025) - (742,025) -
(436,012) - (436,012) -
(584,689) - (584,689) -
(182,655) - (182,655) -
(10,014,958) 0 (10,014,958) 0
- 75,783 75,783 -
- (316) (316) -
- 13,200 13,200 -
- 31,851 31,851 -
0 120,518 120,518 0
(10,014,958) 120,518 (9,894,440) 0
- - - (395,049)
- - - (214,225)
- - - (135,359)
- - - (807)
- - - 105,123
- - - (372,095)
- - - (321,739)
0 0 0 (1,334,151)
2,679,492 - 2,679,492 -
4,021,968 - 4,021,968 -
581,428 - 581,428 -
598,233 - 598,233 -
334,479 - 334,479 -
359,826 - 359,826 -
190,854 13,317 204,171 -
185,276 - 185,276 -
- - - 1,517,967
5,037 - 5,037 3,113
348,038 - 348,038 565,135
1,120,197 364 1,120,561 47,623
- - - 49,945
50,983 (50,983) - -
10,475,811 (37,302) 10,438,509 2,183,783
460,853 83,216 544,069 849,632
20,060,075 880,718 20,940,793 9,311,256
$ 20,520,928 $ 963,934 $ 21,484,862 $ 10,160,888
31
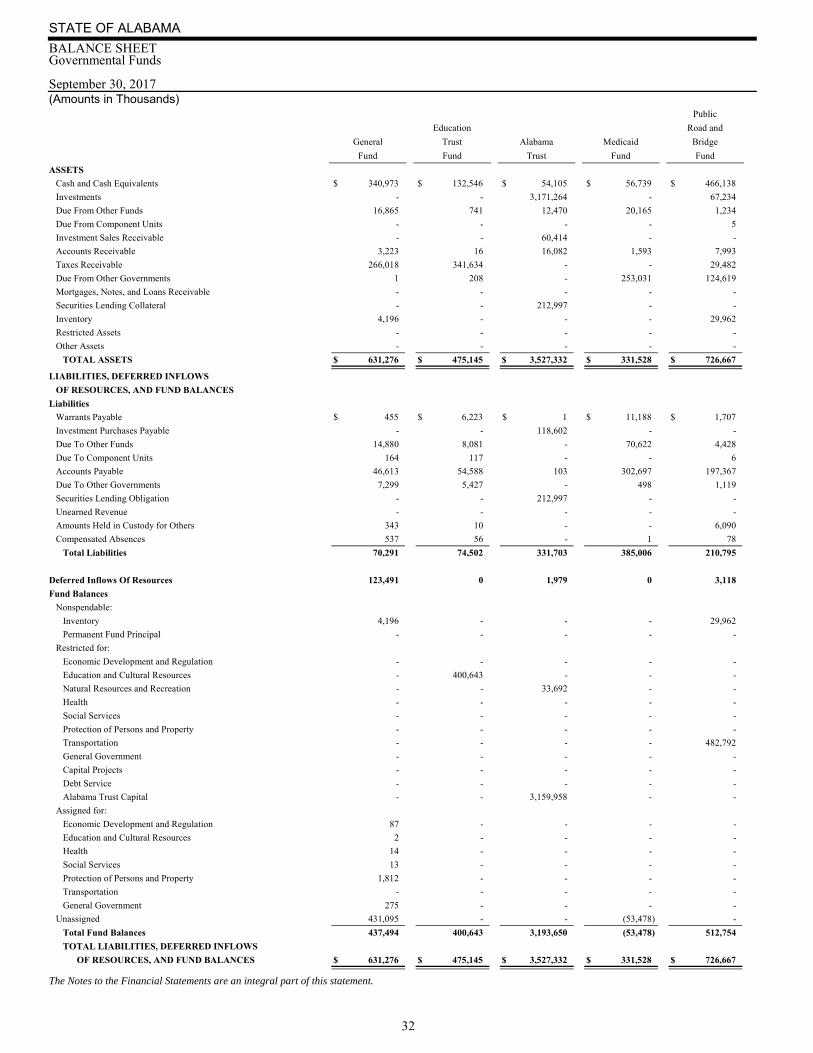
September 30, 2017(Amounts in Thousands)
STATE OF ALABAMA
BALANCE SHEETGovernmental Funds
Public
Education Road and
General Trust Alabama Medicaid Bridge
Fund Fund Trust Fund Fund
The Notes to the Financial Statements are an integral part of this statement.
ASSETS
Cash and Cash Equivalents $ 340,973 $ 132,546 $ 54,105 $ 56,739 $ 466,138
Investments - - 3,171,264 - 67,234
Due From Other Funds 16,865 741 12,470 20,165 1,234
Due From Component Units - - - - 5
Investment Sales Receivable - - 60,414 - -
Accounts Receivable 3,223 16 16,082 1,593 7,993
Taxes Receivable 266,018 341,634 - - 29,482
Due From Other Governments 1 208 - 253,031 124,619
Mortgages, Notes, and Loans Receivable - - - - -
Securities Lending Collateral - - 212,997 - -
Inventory 4,196 - - - 29,962
Restricted Assets - - - - -
Other Assets - - - - -
TOTAL ASSETS $ 631,276 $ 475,145 $ 3,527,332 $ 331,528 $ 726,667
LIABILITIES, DEFERRED INFLOWS
OF RESOURCES, AND FUND BALANCES
Liabilities
Warrants Payable $ 455 $ 6,223 $ 1 $ 11,188 $ 1,707
Investment Purchases Payable - - 118,602 - -
Due To Other Funds 14,880 8,081 - 70,622 4,428
Due To Component Units 164 117 - - 6
Accounts Payable 46,613 54,588 103 302,697 197,367
Due To Other Governments 7,299 5,427 - 498 1,119
Securities Lending Obligation - - 212,997 - -
Unearned Revenue - - - - -
Amounts Held in Custody for Others 343 10 - - 6,090
Compensated Absences 537 56 - 1 78
Total Liabilities 70,291 74,502 331,703 385,006 210,795
Deferred Inflows Of Resources 123,491 0 1,979 0 3,118
Fund Balances
Nonspendable:
Inventory 4,196 - - - 29,962
Permanent Fund Principal - - - - -
Restricted for:
Economic Development and Regulation - - - - -
Education and Cultural Resources - 400,643 - - -
Natural Resources and Recreation - - 33,692 - -
Health - - - - -
Social Services - - - - -
Protection of Persons and Property - - - - -
Transportation - - - - 482,792
General Government - - - - -
Capital Projects - - - - -
Debt Service - - - - -
Alabama Trust Capital - - 3,159,958 - -
Assigned for:
Economic Development and Regulation 87 - - - -
Education and Cultural Resources 2 - - - -
Health 14 - - - -
Social Services 13 - - - -
Protection of Persons and Property 1,812 - - - -
Transportation - - - - -
General Government 275 - - - -
Unassigned 431,095 - - (53,478) -
Total Fund Balances 437,494 400,643 3,193,650 (53,478) 512,754
TOTAL LIABILITIES, DEFERRED INFLOWS
OF RESOURCES, AND FUND BALANCES $ 631,276 $ 475,145 $ 3,527,332 $ 331,528 $ 726,667
32
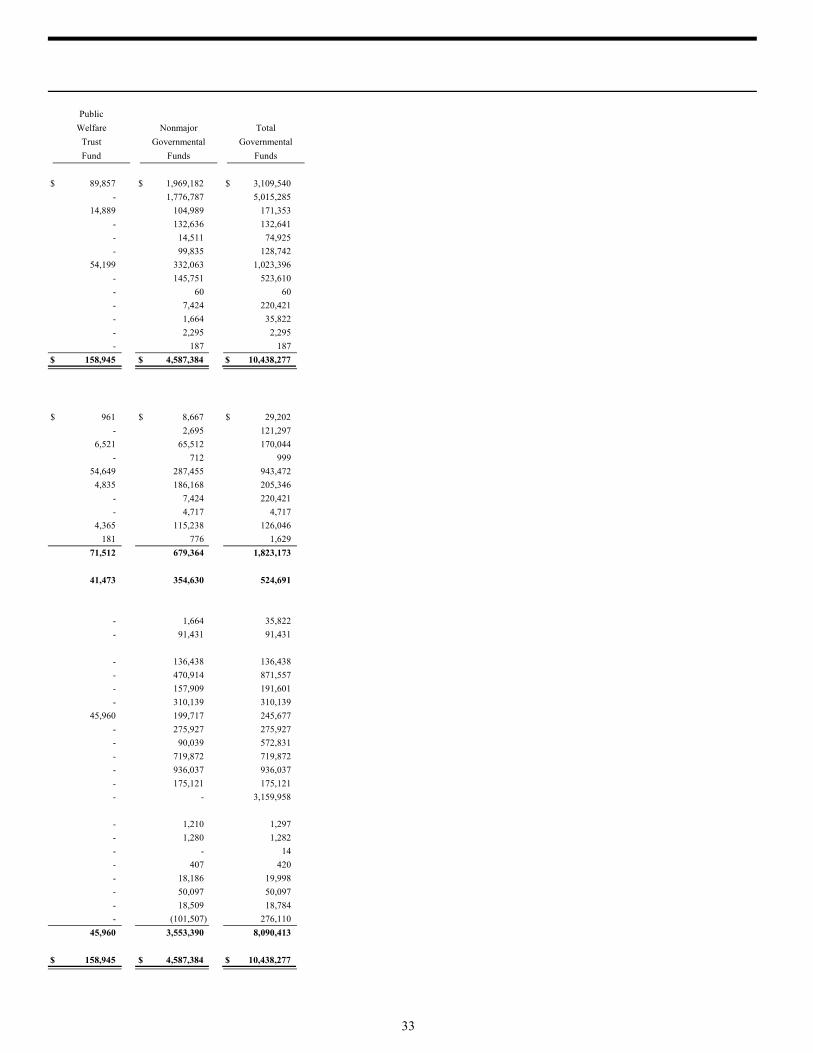
Public
Welfare Nonmajor Total
Trust Governmental Governmental
Fund Funds Funds
$ 89,857 $ 1,969,182 $ 3,109,540
- 1,776,787 5,015,285
14,889 104,989 171,353
- 132,636 132,641
- 14,511 74,925
- 99,835 128,742
54,199 332,063 1,023,396
- 145,751 523,610
- 60 60
- 7,424 220,421
- 1,664 35,822
- 2,295 2,295
- 187 187
$ 158,945 $ 4,587,384 $ 10,438,277
$ 961 $ 8,667 $ 29,202
- 2,695 121,297
6,521 65,512 170,044
- 712 999
54,649 287,455 943,472
4,835 186,168 205,346
- 7,424 220,421
- 4,717 4,717
4,365 115,238 126,046
181 776 1,629
71,512 679,364 1,823,173
41,473 354,630 524,691
- 1,664 35,822
- 91,431 91,431
- 136,438 136,438
- 470,914 871,557
- 157,909 191,601
- 310,139 310,139
45,960 199,717 245,677
- 275,927 275,927
- 90,039 572,831
- 719,872 719,872
- 936,037 936,037
- 175,121 175,121
- - 3,159,958
- 1,210 1,297
- 1,280 1,282
- - 14
- 407 420
- 18,186 19,998
- 50,097 50,097
- 18,509 18,784
- (101,507) 276,110
45,960 3,553,390 8,090,413
$ 158,945 $ 4,587,384 $ 10,438,277
33
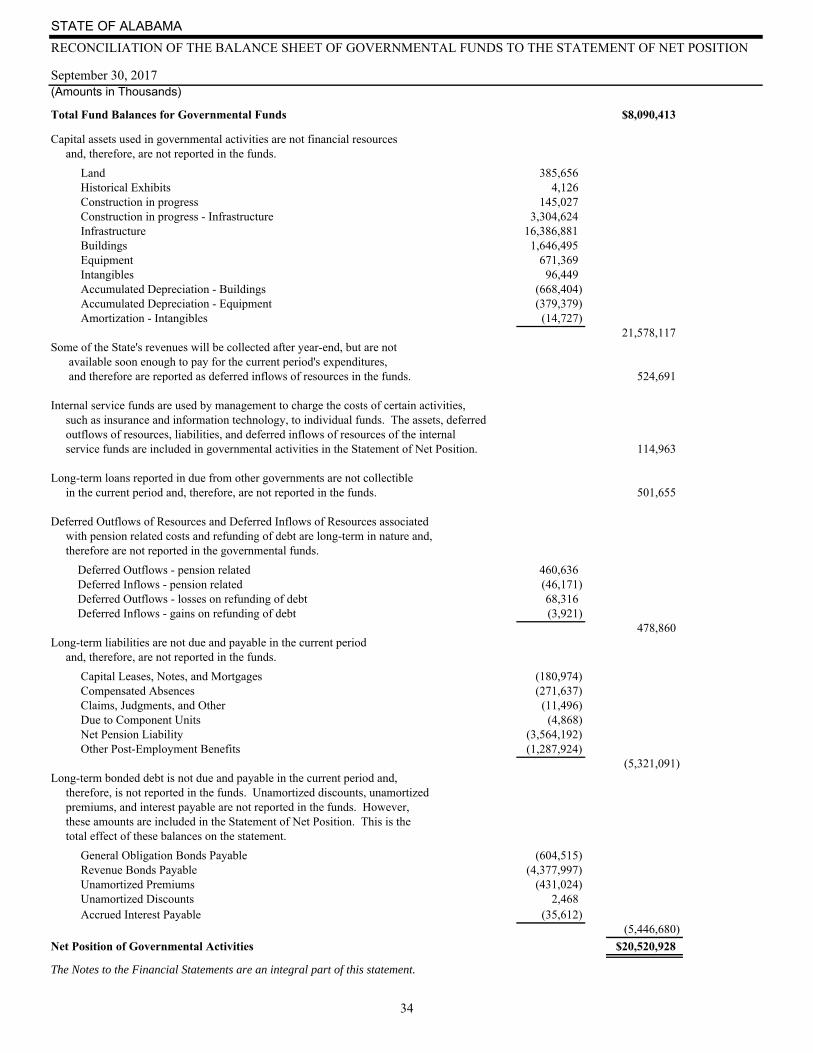
STATE OF ALABAMA
RECONCILIATION OF THE BALANCE SHEET OF GOVERNMENTAL FUNDS TO THE STATEMENT OF NET POSITION
September 30, 2017(Amounts in Thousands)
Total Fund Balances for Governmental Funds $8,090,413
Capital assets used in governmental activities are not financial resources and, therefore, are not reported in the funds.
Land 385,656 Historical Exhibits 4,126 Construction in progress 145,027 Construction in progress - Infrastructure 3,304,624 Infrastructure 16,386,881 Buildings 1,646,495 Equipment 671,369 Intangibles 96,449 Accumulated Depreciation - Buildings (668,404) Accumulated Depreciation - Equipment (379,379) Amortization - Intangibles (14,727)
21,578,117Some of the State's revenues will be collected after year-end, but are not available soon enough to pay for the current period's expenditures, and therefore are reported as deferred inflows of resources in the funds. 524,691
Internal service funds are used by management to charge the costs of certain activities, such as insurance and information technology, to individual funds. The assets, deferred outflows of resources, liabilities, and deferred inflows of resources of the internal service funds are included in governmental activities in the Statement of Net Position. 114,963
Long-term loans reported in due from other governments are not collectible in the current period and, therefore, are not reported in the funds. 501,655
Deferred Outflows of Resources and Deferred Inflows of Resources associated with pension related costs and refunding of debt are long-term in nature and, therefore are not reported in the governmental funds.
Deferred Outflows - pension related 460,636 Deferred Inflows - pension related (46,171) Deferred Outflows - losses on refunding of debt 68,316 Deferred Inflows - gains on refunding of debt (3,921)
478,860Long-term liabilities are not due and payable in the current period and, therefore, are not reported in the funds.
Capital Leases, Notes, and Mortgages (180,974) Compensated Absences (271,637) Claims, Judgments, and Other (11,496) Due to Component Units (4,868) Net Pension Liability (3,564,192) Other Post-Employment Benefits (1,287,924)
(5,321,091)Long-term bonded debt is not due and payable in the current period and, therefore, is not reported in the funds. Unamortized discounts, unamortized premiums, and interest payable are not reported in the funds. However, these amounts are included in the Statement of Net Position. This is the total effect of these balances on the statement.
General Obligation Bonds Payable (604,515) Revenue Bonds Payable (4,377,997) Unamortized Premiums (431,024) Unamortized Discounts 2,468 Accrued Interest Payable (35,612)
(5,446,680)
Net Position of Governmental Activities $20,520,928
The Notes to the Financial Statements are an integral part of this statement.
34

35
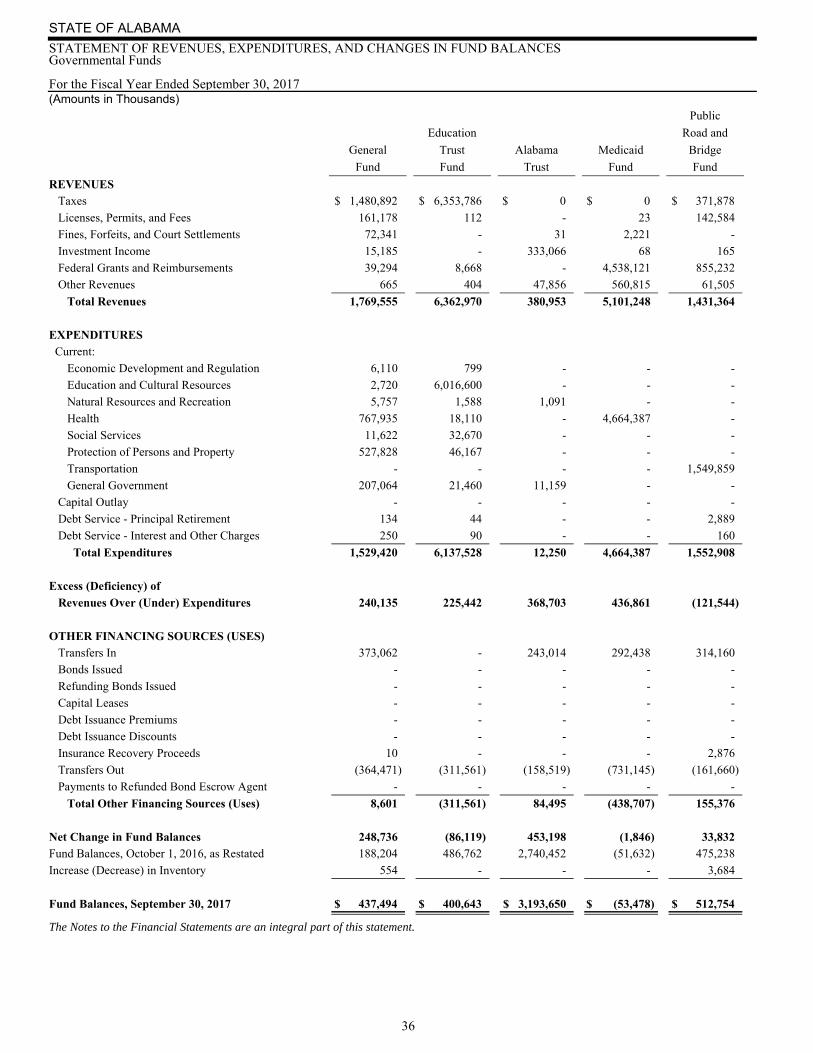
For the Fiscal Year Ended September 30, 2017(Amounts in Thousands)
STATE OF ALABAMA
STATEMENT OF REVENUES, EXPENDITURES, AND CHANGES IN FUND BALANCESGovernmental Funds
Public
Education Road and
General Trust Alabama Medicaid Bridge
Fund Fund Trust Fund Fund
The Notes to the Financial Statements are an integral part of this statement.
REVENUES Taxes $ 1,480,892 $ 6,353,786 $ 0 $ 0 $ 371,878
Licenses, Permits, and Fees 161,178 112 - 23 142,584
Fines, Forfeits, and Court Settlements 72,341 - 31 2,221 -
Investment Income 15,185 - 333,066 68 165
Federal Grants and Reimbursements 39,294 8,668 - 4,538,121 855,232
Other Revenues 665 404 47,856 560,815 61,505
Total Revenues 1,769,555 6,362,970 380,953 5,101,248 1,431,364
EXPENDITURES Current:
Economic Development and Regulation 6,110 799 - - -
Education and Cultural Resources 2,720 6,016,600 - - -
Natural Resources and Recreation 5,757 1,588 1,091 - -
Health 767,935 18,110 - 4,664,387 -
Social Services 11,622 32,670 - - -
Protection of Persons and Property 527,828 46,167 - - -
Transportation - - - - 1,549,859
General Government 207,064 21,460 11,159 - -
Capital Outlay - - - - -
Debt Service - Principal Retirement 134 44 - - 2,889
Debt Service - Interest and Other Charges 250 90 - - 160
Total Expenditures 1,529,420 6,137,528 12,250 4,664,387 1,552,908
Excess (Deficiency) of
Revenues Over (Under) Expenditures 240,135 225,442 368,703 436,861 (121,544)
OTHER FINANCING SOURCES (USES) Transfers In 373,062 - 243,014 292,438 314,160
Bonds Issued - - - - -
Refunding Bonds Issued - - - - -
Capital Leases - - - - -
Debt Issuance Premiums - - - - -
Debt Issuance Discounts - - - - -
Insurance Recovery Proceeds 10 - - - 2,876
Transfers Out (364,471) (311,561) (158,519) (731,145) (161,660)
Payments to Refunded Bond Escrow Agent - - - - -
Total Other Financing Sources (Uses) 8,601 (311,561) 84,495 (438,707) 155,376
Net Change in Fund Balances 248,736 (86,119) 453,198 (1,846) 33,832Fund Balances, October 1, 2016, as Restated 188,204 486,762 2,740,452 (51,632) 475,238
Increase (Decrease) in Inventory 554 - - - 3,684
Fund Balances, September 30, 2017 $ 437,494 $ 400,643 $ 3,193,650 $ (53,478) $ 512,754
36
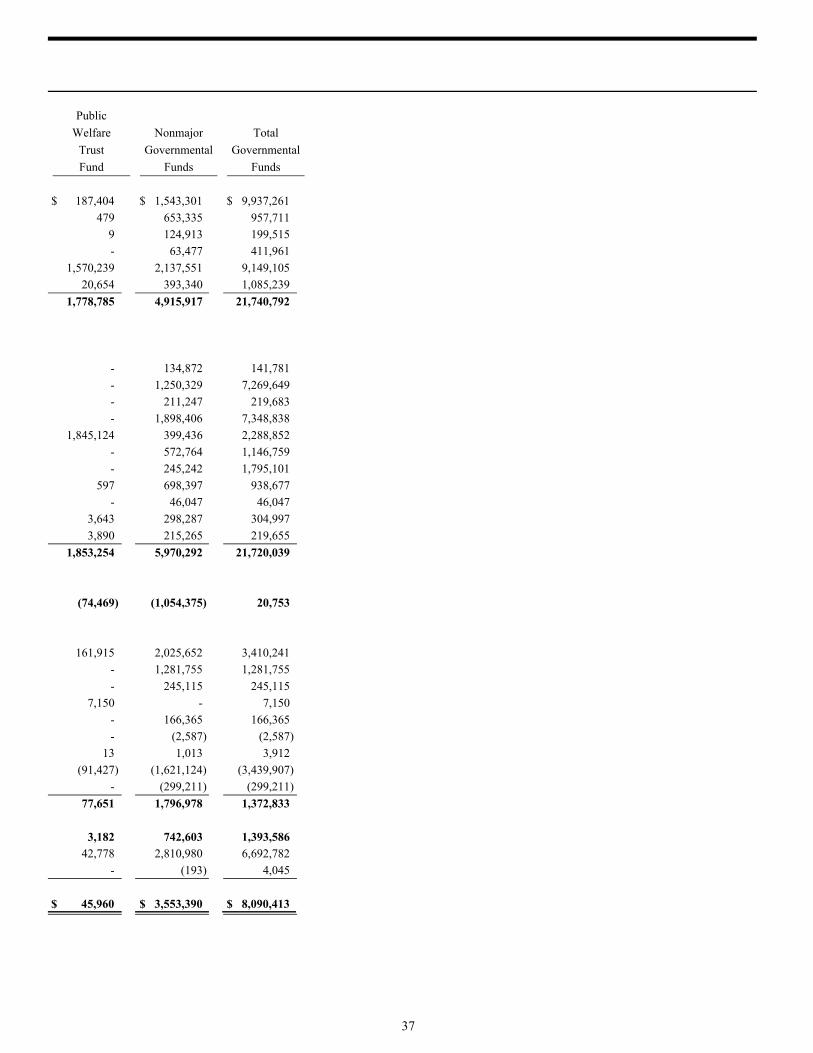
Public
Welfare Nonmajor Total
Trust Governmental Governmental
Fund Funds Funds
$ 187,404 $ 1,543,301 $ 9,937,261
479 653,335 957,711
9 124,913 199,515
- 63,477 411,961
1,570,239 2,137,551 9,149,105
20,654 393,340 1,085,239
1,778,785 4,915,917 21,740,792
- 134,872 141,781
- 1,250,329 7,269,649
- 211,247 219,683
- 1,898,406 7,348,838
1,845,124 399,436 2,288,852
- 572,764 1,146,759
- 245,242 1,795,101
597 698,397 938,677
- 46,047 46,047
3,643 298,287 304,997
3,890 215,265 219,655
1,853,254 5,970,292 21,720,039
(74,469) (1,054,375) 20,753
161,915 2,025,652 3,410,241
- 1,281,755 1,281,755
- 245,115 245,115
7,150 - 7,150
- 166,365 166,365
- (2,587) (2,587)
13 1,013 3,912
(91,427) (1,621,124) (3,439,907)
- (299,211) (299,211)
77,651 1,796,978 1,372,833
3,182 742,603 1,393,586 42,778 2,810,980 6,692,782
- (193) 4,045
$ 45,960 $ 3,553,390 $ 8,090,413
37
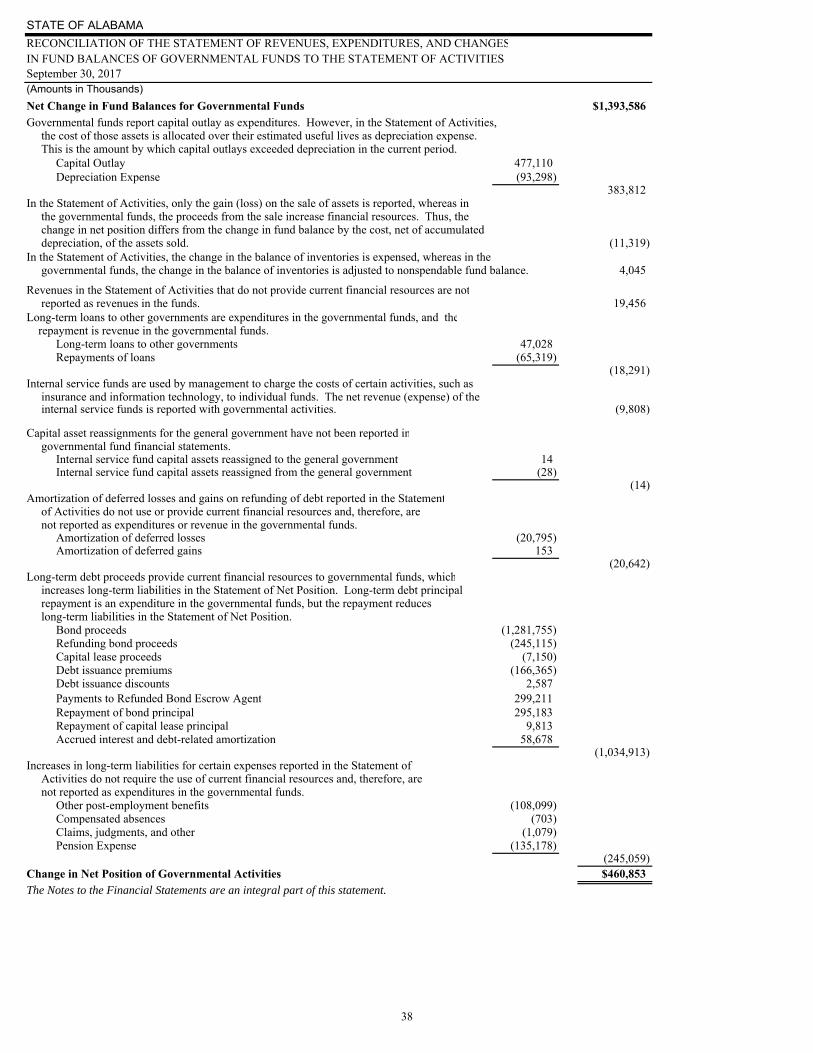
STATE OF ALABAMA
RECONCILIATION OF THE STATEMENT OF REVENUES, EXPENDITURES, AND CHANGESIN FUND BALANCES OF GOVERNMENTAL FUNDS TO THE STATEMENT OF ACTIVITIES September 30, 2017(Amounts in Thousands)
Net Change in Fund Balances for Governmental Funds $1,393,586
Governmental funds report capital outlay as expenditures. However, in the Statement of Activities, the cost of those assets is allocated over their estimated useful lives as depreciation expense. This is the amount by which capital outlays exceeded depreciation in the current period. Capital Outlay 477,110 Depreciation Expense (93,298)
383,812In the Statement of Activities, only the gain (loss) on the sale of assets is reported, whereas in the governmental funds, the proceeds from the sale increase financial resources. Thus, the change in net position differs from the change in fund balance by the cost, net of accumulated depreciation, of the assets sold. (11,319)In the Statement of Activities, the change in the balance of inventories is expensed, whereas in the governmental funds, the change in the balance of inventories is adjusted to nonspendable fund balance. 4,045
Revenues in the Statement of Activities that do not provide current financial resources are not reported as revenues in the funds. 19,456Long-term loans to other governments are expenditures in the governmental funds, and the repayment is revenue in the governmental funds. Long-term loans to other governments 47,028 Repayments of loans (65,319)
(18,291)Internal service funds are used by management to charge the costs of certain activities, such as insurance and information technology, to individual funds. The net revenue (expense) of the internal service funds is reported with governmental activities. (9,808)
Capital asset reassignments for the general government have not been reported in governmental fund financial statements. Internal service fund capital assets reassigned to the general government 14 Internal service fund capital assets reassigned from the general government (28)
(14)Amortization of deferred losses and gains on refunding of debt reported in the Statement of Activities do not use or provide current financial resources and, therefore, are not reported as expenditures or revenue in the governmental funds. Amortization of deferred losses (20,795) Amortization of deferred gains 153
(20,642)Long-term debt proceeds provide current financial resources to governmental funds, which increases long-term liabilities in the Statement of Net Position. Long-term debt principal repayment is an expenditure in the governmental funds, but the repayment reduces long-term liabilities in the Statement of Net Position. Bond proceeds (1,281,755) Refunding bond proceeds (245,115) Capital lease proceeds (7,150) Debt issuance premiums (166,365) Debt issuance discounts 2,587 Payments to Refunded Bond Escrow Agent 299,211 Repayment of bond principal 295,183 Repayment of capital lease principal 9,813 Accrued interest and debt-related amortization 58,678
(1,034,913)Increases in long-term liabilities for certain expenses reported in the Statement of Activities do not require the use of current financial resources and, therefore, are not reported as expenditures in the governmental funds. Other post-employment benefits (108,099) Compensated absences (703) Claims, judgments, and other (1,079) Pension Expense (135,178) (245,059)Change in Net Position of Governmental Activities $460,853The Notes to the Financial Statements are an integral part of this statement.
38

39
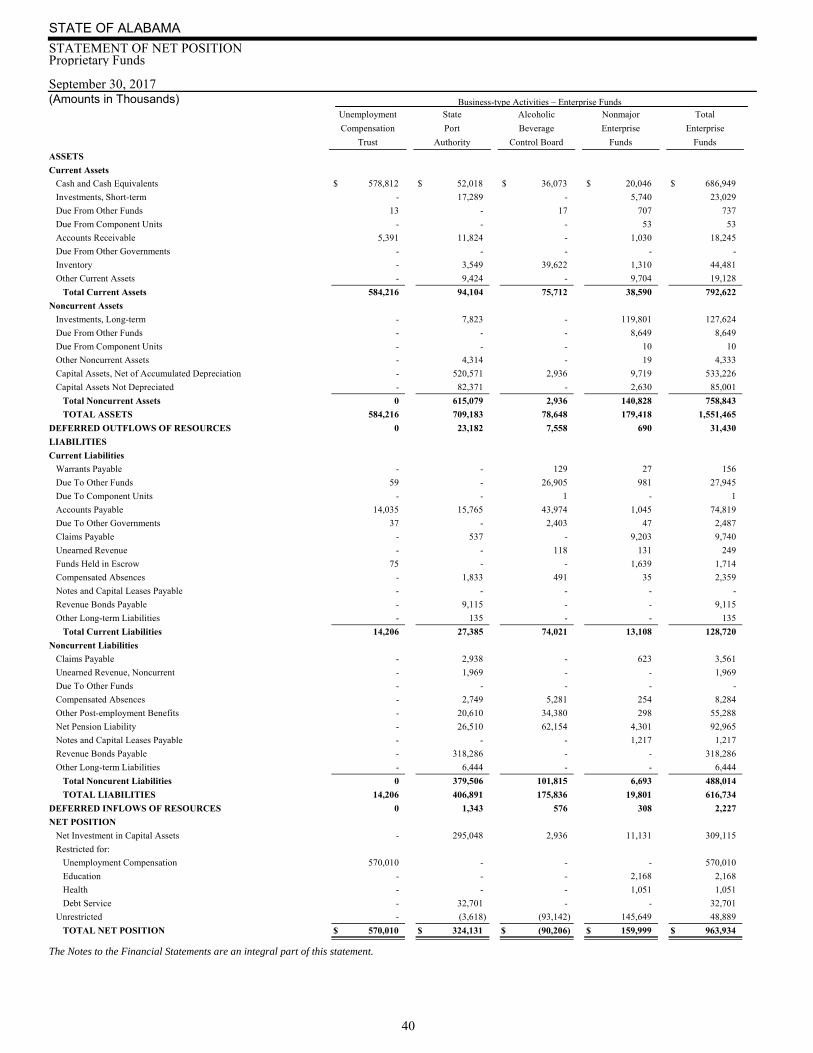
September 30, 2017 Business-type Activities – Enterprise Funds (Amounts in Thousands)
STATE OF ALABAMA
STATEMENT OF NET POSITIONProprietary Funds
Unemployment State Alcoholic Nonmajor Total
Compensation Port Beverage Enterprise Enterprise
Trust Authority Control Board Funds Funds
The Notes to the Financial Statements are an integral part of this statement.
ASSETS
Current Assets
Cash and Cash Equivalents $ 578,812 $ 52,018 $ 36,073 $ 20,046 $ 686,949
Investments, Short-term - 17,289 - 5,740 23,029
Due From Other Funds 13 - 17 707 737
Due From Component Units - - - 53 53
Accounts Receivable 5,391 11,824 - 1,030 18,245
Due From Other Governments - - - - -
Inventory - 3,549 39,622 1,310 44,481
Other Current Assets - 9,424 - 9,704 19,128
Total Current Assets 584,216 94,104 75,712 38,590 792,622
Noncurrent Assets
Investments, Long-term - 7,823 - 119,801 127,624
Due From Other Funds - - - 8,649 8,649
Due From Component Units - - - 10 10
Other Noncurrent Assets - 4,314 - 19 4,333
Capital Assets, Net of Accumulated Depreciation - 520,571 2,936 9,719 533,226
Capital Assets Not Depreciated - 82,371 - 2,630 85,001
Total Noncurrent Assets 0 615,079 2,936 140,828 758,843
TOTAL ASSETS 584,216 709,183 78,648 179,418 1,551,465
DEFERRED OUTFLOWS OF RESOURCES 0 23,182 7,558 690 31,430
LIABILITIES
Current Liabilities
Warrants Payable - - 129 27 156
Due To Other Funds 59 - 26,905 981 27,945
Due To Component Units - - 1 - 1
Accounts Payable 14,035 15,765 43,974 1,045 74,819
Due To Other Governments 37 - 2,403 47 2,487
Claims Payable - 537 - 9,203 9,740
Unearned Revenue - - 118 131 249
Funds Held in Escrow 75 - - 1,639 1,714
Compensated Absences - 1,833 491 35 2,359
Notes and Capital Leases Payable - - - - -
Revenue Bonds Payable - 9,115 - - 9,115
Other Long-term Liabilities - 135 - - 135
Total Current Liabilities 14,206 27,385 74,021 13,108 128,720
Noncurrent Liabilities
Claims Payable - 2,938 - 623 3,561
Unearned Revenue, Noncurrent - 1,969 - - 1,969
Due To Other Funds - - - - -
Compensated Absences - 2,749 5,281 254 8,284
Other Post-employment Benefits - 20,610 34,380 298 55,288
Net Pension Liability - 26,510 62,154 4,301 92,965
Notes and Capital Leases Payable - - - 1,217 1,217
Revenue Bonds Payable - 318,286 - - 318,286
Other Long-term Liabilities - 6,444 - - 6,444
Total Noncurent Liabilities 0 379,506 101,815 6,693 488,014
TOTAL LIABILITIES 14,206 406,891 175,836 19,801 616,734
DEFERRED INFLOWS OF RESOURCES 0 1,343 576 308 2,227
NET POSITION
Net Investment in Capital Assets - 295,048 2,936 11,131 309,115
Restricted for:
Unemployment Compensation 570,010 - - - 570,010
Education - - - 2,168 2,168
Health - - - 1,051 1,051
Debt Service - 32,701 - - 32,701
Unrestricted - (3,618) (93,142) 145,649 48,889
TOTAL NET POSITION $ 570,010 $ 324,131 $ (90,206) $ 159,999 $ 963,934
40

Governmental Activities Internal
Service
Funds
$ 73,171
3,113
19,195
103
804
23
4,946
-
101,355
107,302
-
-
-
91,077
5,096
203,475
304,830
7,433
716
1,138
512
18,739
51
4,900
-
-
407
2,203
1,950
-
30,616
63,405
-
801
4,375
17,752
56,143
9,120
14,567
-
166,163
196,779
521
68,967
-
-
-
-
45,996
$ 114,963
41
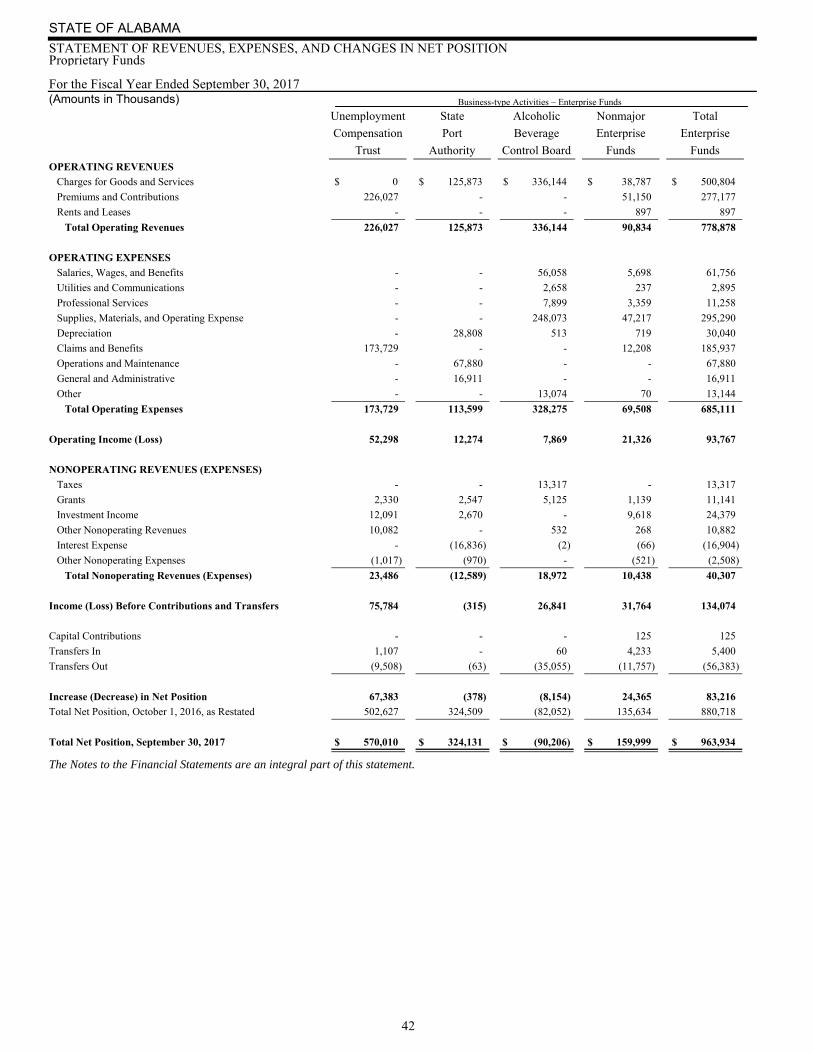
For the Fiscal Year Ended September 30, 2017 Business-type Activities – Enterprise Funds (Amounts in Thousands)
STATE OF ALABAMA
STATEMENT OF REVENUES, EXPENSES, AND CHANGES IN NET POSITIONProprietary Funds
Unemployment State Alcoholic Nonmajor Total
Compensation Port Beverage Enterprise Enterprise
Trust Authority Control Board Funds Funds
The Notes to the Financial Statements are an integral part of this statement.
OPERATING REVENUES
Charges for Goods and Services $ 0 $ 125,873 $ 336,144 $ 38,787 $ 500,804
Premiums and Contributions 226,027 - - 51,150 277,177
Rents and Leases - - - 897 897
Total Operating Revenues 226,027 125,873 336,144 90,834 778,878
OPERATING EXPENSES
Salaries, Wages, and Benefits - - 56,058 5,698 61,756
Utilities and Communications - - 2,658 237 2,895
Professional Services - - 7,899 3,359 11,258
Supplies, Materials, and Operating Expense - - 248,073 47,217 295,290
Depreciation - 28,808 513 719 30,040
Claims and Benefits 173,729 - - 12,208 185,937
Operations and Maintenance - 67,880 - - 67,880
General and Administrative - 16,911 - - 16,911
Other - - 13,074 70 13,144
Total Operating Expenses 173,729 113,599 328,275 69,508 685,111
Operating Income (Loss) 52,298 12,274 7,869 21,326 93,767
NONOPERATING REVENUES (EXPENSES)
Taxes - - 13,317 - 13,317
Grants 2,330 2,547 5,125 1,139 11,141
Investment Income 12,091 2,670 - 9,618 24,379
Other Nonoperating Revenues 10,082 - 532 268 10,882
Interest Expense - (16,836) (2) (66) (16,904)
Other Nonoperating Expenses (1,017) (970) - (521) (2,508)
Total Nonoperating Revenues (Expenses) 23,486 (12,589) 18,972 10,438 40,307
Income (Loss) Before Contributions and Transfers 75,784 (315) 26,841 31,764 134,074
Capital Contributions - - - 125 125
Transfers In 1,107 - 60 4,233 5,400
Transfers Out (9,508) (63) (35,055) (11,757) (56,383)
Increase (Decrease) in Net Position 67,383 (378) (8,154) 24,365 83,216
Total Net Position, October 1, 2016, as Restated 502,627 324,509 (82,052) 135,634 880,718
Total Net Position, September 30, 2017 $ 570,010 $ 324,131 $ (90,206) $ 159,999 $ 963,934
42
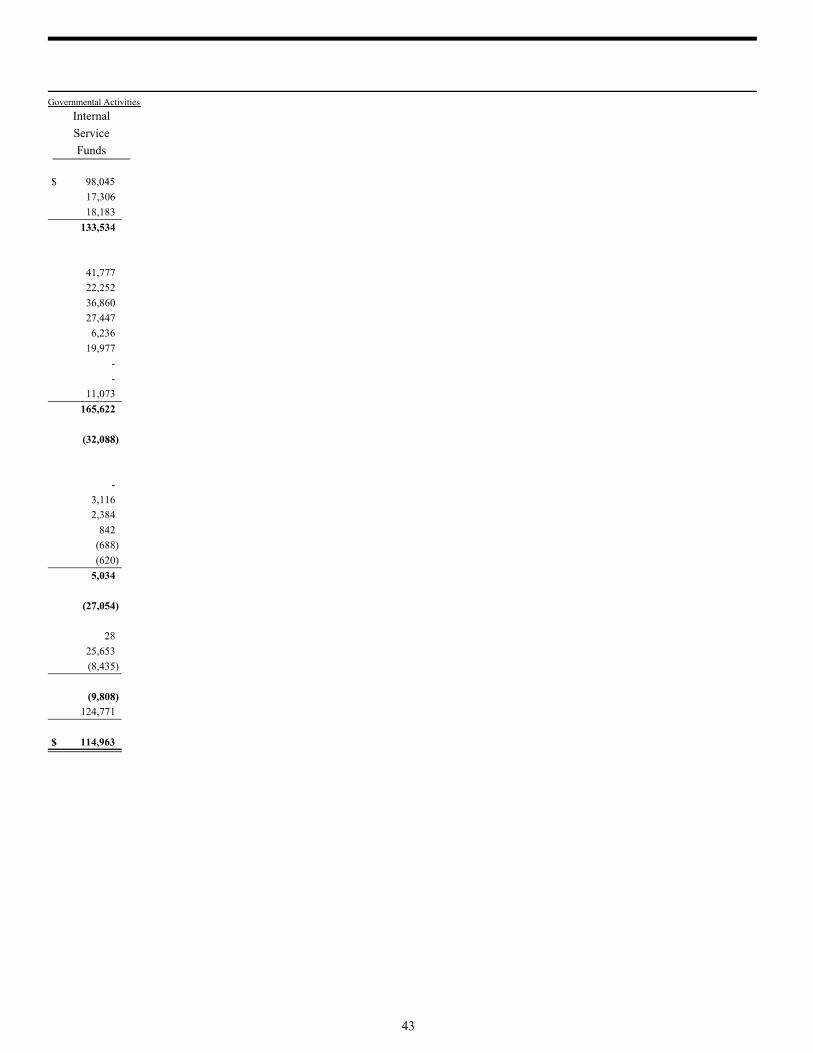
Governmental Activities
Internal
Service
Funds
$ 98,045
17,306
18,183
133,534
41,777
22,252
36,860
27,447
6,236
19,977
-
-
11,073
165,622
(32,088)
-
3,116
2,384
842
(688)
(620)
5,034
(27,054)
28
25,653
(8,435)
(9,808)
124,771
$ 114,963
43

For the Fiscal Year Ended September 30, 2017 Business-type Activities – Enterprise Funds (Amounts in Thousands)
STATE OF ALABAMA
STATEMENT OF CASH FLOWSProprietary Funds
Unemployment State Alcoholic Nonmajor Total
Compensation Port Beverage Enterprise Enterprise
Trust Authority Control Board Funds Funds
The Notes to the Financial Statements are an integral part of this statement.
Cash Flows from Operating Activities:
Receipts from Customer & User Charges $ 249,659 $ 126,589 $ 344,757 $ 87,152 $ 808,157
Receipts from Interfund Services - - 43 6,601 6,644
Receipts from Operating Grants 2,362 - - 927 3,289
Receipts from Interfund Reimbursements 3,951 - - - 3,951
Receipts from Other Operating Activities 9,576 - 31,584 3,006 44,166
Payments for Goods Held for Resale - - (240,785) (24,137) (264,922)
Payments for Other Goods & Services - (47,714) (26,238) (24,113) (98,065)
Payments for Employees Services - (33,543) (42,185) (5,300) (81,028)
Payments for Interfund Services - - (2,026) (26) (2,052)
Payments for Other Operating Activities (41,624) - (26,815) (49) (68,488)
Payments for Claims (177,695) - - (12,746) (190,441)
Net Cash Provided by (Used In) Operating Activities 46,229 45,332 38,335 31,315 161,211
Cash Flows from Noncapital Financing Activities:
Receipts from Noncapital Financing Grants & Donations 1,614 - - 605 2,219
Transfers from Other Funds for Noncapital Financing 183 - 60 4,233 4,476
Payments for Noncapital Financing Grants & Donations (1,068) - - - (1,068)
Transfers to Other Funds for Noncapital Financing (9,736) - (36,951) (14,395) (61,082)
Net Cash Provided By (Used In)
Noncapital Financing Activities (9,007) 0 (36,891) (9,557) (55,455)
Cash Flows From Capital & Related Financing Activities:
Proceeds from Revenue Bonds & Other Capital Debt - 287,177 - - 287,177
Receipts from Capital Grants & Contributions - 2,091 - 125 2,216
Transfers from Other Funds for Capital Financing - - - - -
Receipts from Sale of Capital Assets & Insurance Proceeds - 417 273 - 690
Payments to Acquire, Construct, & Improve Capital Assets - (7,219) (801) (1,295) (9,315)
Principal Paid on Revenue Bonds & Other Capital Debt - (307,500) (236) (96) (307,832)
Interest Paid on Revenue Bonds & Other Capital Debt - (16,861) (2) (66) (16,929)
Net Cash Provided by (Used in)
Capital and Related Financing Activities 0 (41,895) (766) (1,332) (43,993)
Cash Flows From Investing Activities
Receipts from Sales & Maturities of Investments - 36,539 - 7,316 43,855
Receipts from Interest & Dividends on Investments & Loans 11,833 2,621 - 1,795 16,249
Purchase of Investments - (28,551) - (18,234) (46,785)
Net Cash Provided By (Used In) Investing Activities 11,833 10,609 0 (9,123) 13,319
Net Increase (Decrease) In Cash and Cash Equivalents 49,055 14,046 678 11,303 75,082
Cash Balance as Restated, October 1, 2016 529,757 37,972 35,266 8,716 611,711
Cash Balance, September 30, 2017 578,812 52,018 35,944 20,019 686,793
Add: Warrants Payable - - 129 27 156
Cash and Cash Equivalents,
as Reported on Balance Sheet $ 578,812 $ 52,018 $ 36,073 $ 20,046 $ 686,949
44
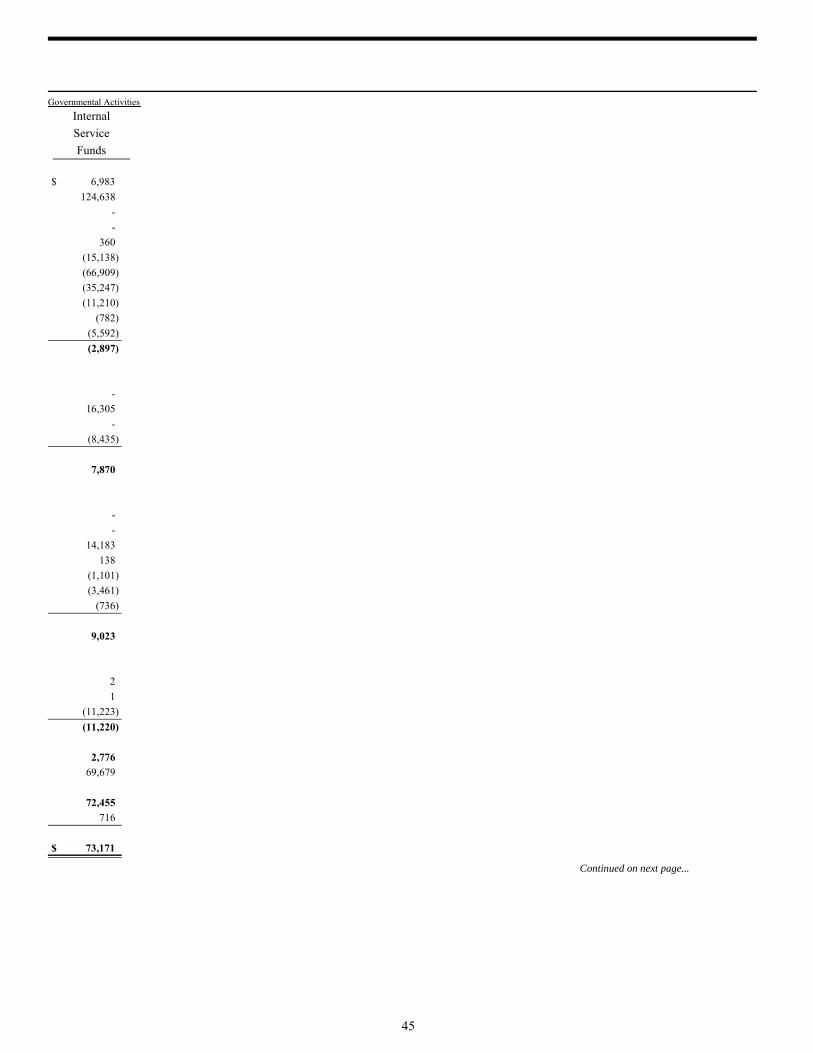
Governmental Activities
Internal
Service
Funds
Continued on next page...
$ 6,983
124,638
-
-
360
(15,138)
(66,909)
(35,247)
(11,210)
(782)
(5,592)
(2,897)
-
16,305
-
(8,435)
7,870
-
-
14,183
138
(1,101)
(3,461)
(736)
9,023
2
1
(11,223)
(11,220)
2,776
69,679
72,455
716
$ 73,171
45
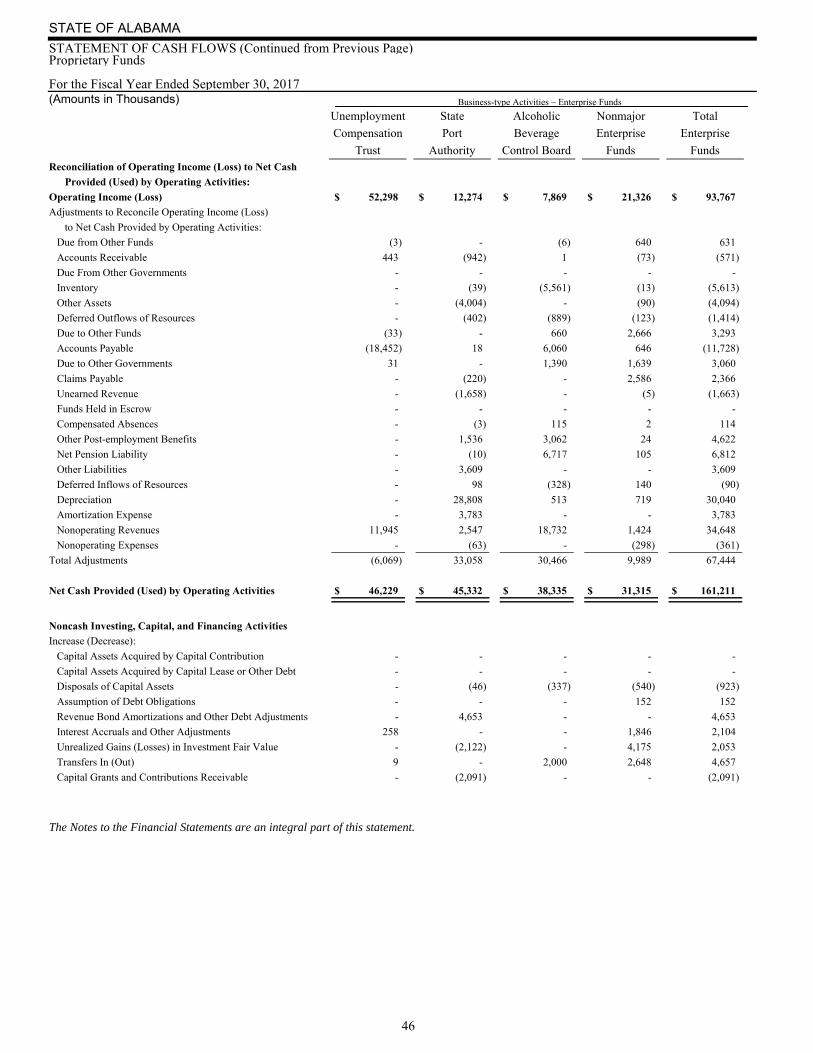
For the Fiscal Year Ended September 30, 2017 Business-type Activities – Enterprise Funds (Amounts in Thousands)
STATE OF ALABAMA
STATEMENT OF CASH FLOWS (Continued from Previous Page)Proprietary Funds
Unemployment State Alcoholic Nonmajor Total
Compensation Port Beverage Enterprise Enterprise
Trust Authority Control Board Funds Funds
The Notes to the Financial Statements are an integral part of this statement.
Reconciliation of Operating Income (Loss) to Net Cash
Provided (Used) by Operating Activities:
Operating Income (Loss) $ 52,298 $ 12,274 $ 7,869 $ 21,326 $ 93,767
Adjustments to Reconcile Operating Income (Loss)
to Net Cash Provided by Operating Activities:
Due from Other Funds (3) - (6) 640 631
Accounts Receivable 443 (942) 1 (73) (571)
Due From Other Governments - - - - -
Inventory - (39) (5,561) (13) (5,613)
Other Assets - (4,004) - (90) (4,094)
Deferred Outflows of Resources - (402) (889) (123) (1,414)
Due to Other Funds (33) - 660 2,666 3,293
Accounts Payable (18,452) 18 6,060 646 (11,728)
Due to Other Governments 31 - 1,390 1,639 3,060
Claims Payable - (220) - 2,586 2,366
Unearned Revenue - (1,658) - (5) (1,663)
Funds Held in Escrow - - - - -
Compensated Absences - (3) 115 2 114
Other Post-employment Benefits - 1,536 3,062 24 4,622
Net Pension Liability - (10) 6,717 105 6,812
Other Liabilities - 3,609 - - 3,609
Deferred Inflows of Resources - 98 (328) 140 (90)
Depreciation - 28,808 513 719 30,040
Amortization Expense - 3,783 - - 3,783
Nonoperating Revenues 11,945 2,547 18,732 1,424 34,648
Nonoperating Expenses - (63) - (298) (361)
Total Adjustments (6,069) 33,058 30,466 9,989 67,444
Net Cash Provided (Used) by Operating Activities $ 46,229 $ 45,332 $ 38,335 $ 31,315 $ 161,211
Noncash Investing, Capital, and Financing Activities
Increase (Decrease):
Capital Assets Acquired by Capital Contribution - - - - -
Capital Assets Acquired by Capital Lease or Other Debt - - - - -
Disposals of Capital Assets - (46) (337) (540) (923)
Assumption of Debt Obligations - - - 152 152
Revenue Bond Amortizations and Other Debt Adjustments - 4,653 - - 4,653
Interest Accruals and Other Adjustments 258 - - 1,846 2,104
Unrealized Gains (Losses) in Investment Fair Value - (2,122) - 4,175 2,053
Transfers In (Out) 9 - 2,000 2,648 4,657
Capital Grants and Contributions Receivable - (2,091) - - (2,091)
46
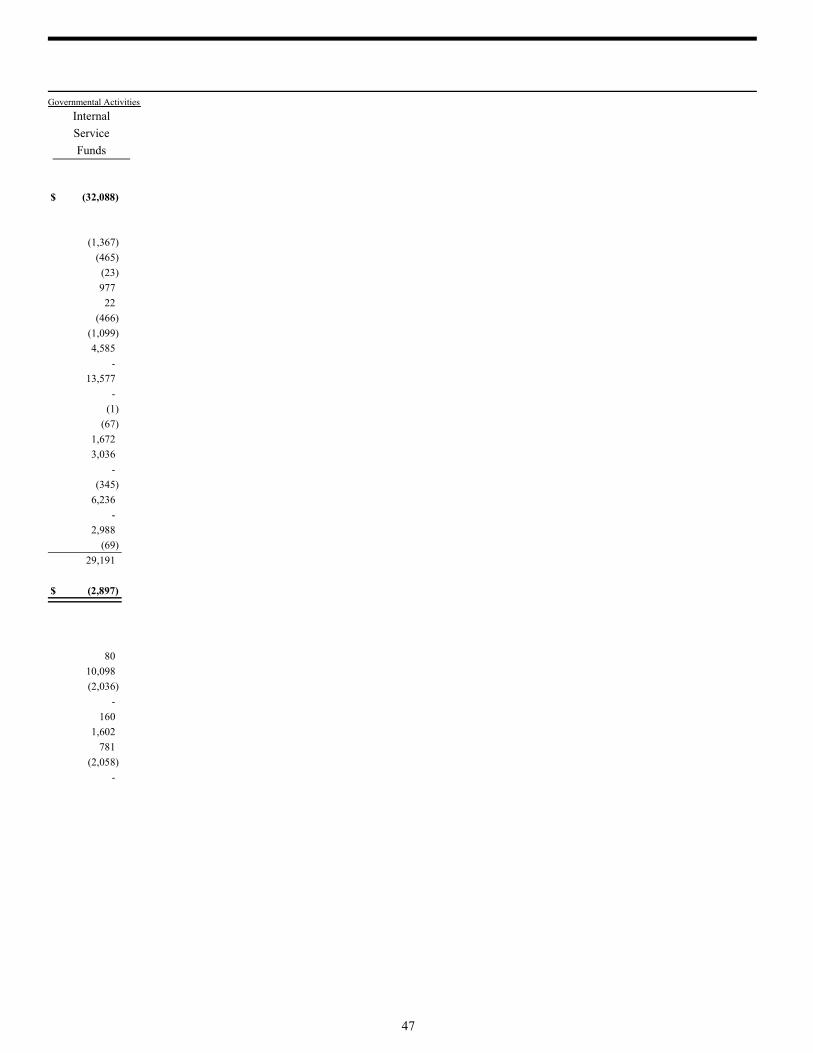
Governmental Activities
Internal
Service
Funds
$ (32,088)
(1,367)
(465)
(23)
977
22
(466)
(1,099)
4,585
-
13,577
-
(1)
(67)
1,672
3,036
-
(345)
6,236
-
2,988
(69)
29,191
$ (2,897)
80
10,098
(2,036)
-
160
1,602
781
(2,058)
-
47
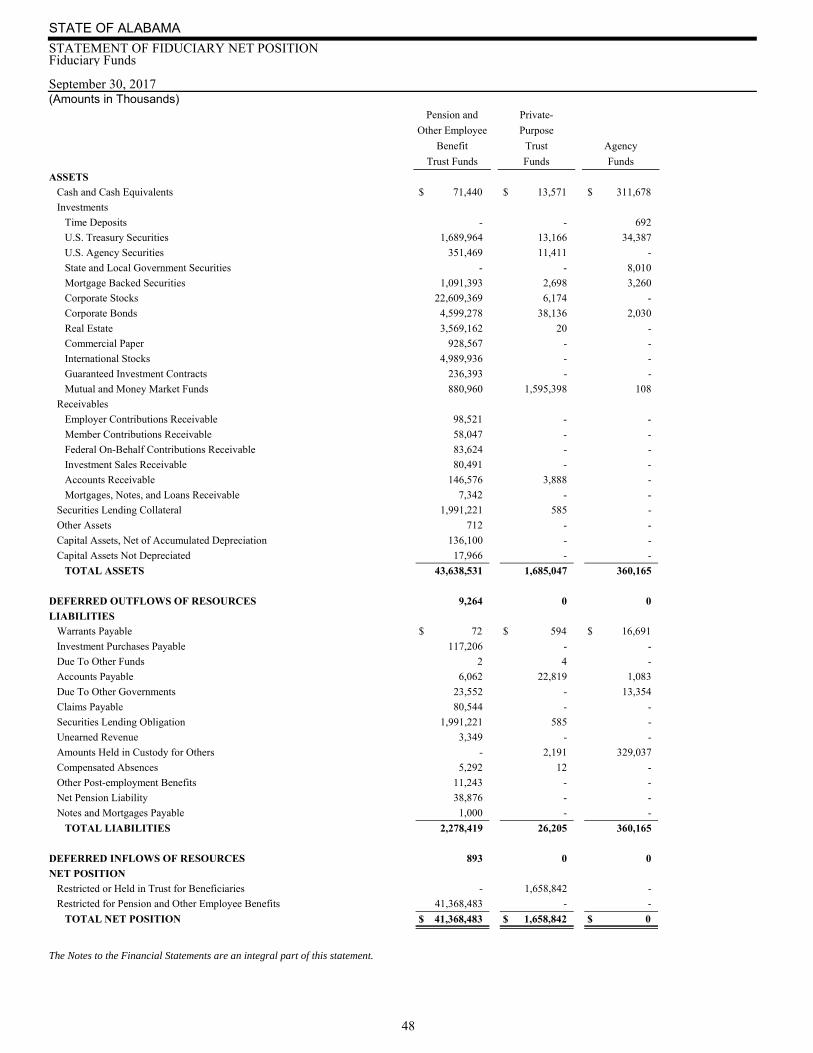
September 30, 2017 (Amounts in Thousands)
STATE OF ALABAMA
STATEMENT OF FIDUCIARY NET POSITIONFiduciary Funds
Pension and Private-
Other Employee Purpose
Benefit Trust Agency
Trust Funds Funds Funds
The Notes to the Financial Statements are an integral part of this statement.
ASSETS
Cash and Cash Equivalents $ 71,440 $ 13,571 $ 311,678
Investments
Time Deposits - - 692
U.S. Treasury Securities 1,689,964 13,166 34,387
U.S. Agency Securities 351,469 11,411 -
State and Local Government Securities - - 8,010
Mortgage Backed Securities 1,091,393 2,698 3,260
Corporate Stocks 22,609,369 6,174 -
Corporate Bonds 4,599,278 38,136 2,030
Real Estate 3,569,162 20 -
Commercial Paper 928,567 - -
International Stocks 4,989,936 - -
Guaranteed Investment Contracts 236,393 - -
Mutual and Money Market Funds 880,960 1,595,398 108
Receivables
Employer Contributions Receivable 98,521 - -
Member Contributions Receivable 58,047 - -
Federal On-Behalf Contributions Receivable 83,624 - -
Investment Sales Receivable 80,491 - -
Accounts Receivable 146,576 3,888 -
Mortgages, Notes, and Loans Receivable 7,342 - -
Securities Lending Collateral 1,991,221 585 -
Other Assets 712 - -
Capital Assets, Net of Accumulated Depreciation 136,100 - -
Capital Assets Not Depreciated 17,966 - -
TOTAL ASSETS 43,638,531 1,685,047 360,165
DEFERRED OUTFLOWS OF RESOURCES 9,264 0 0
LIABILITIES
Warrants Payable $ 72 $ 594 $ 16,691
Investment Purchases Payable 117,206 - -
Due To Other Funds 2 4 -
Accounts Payable 6,062 22,819 1,083
Due To Other Governments 23,552 - 13,354
Claims Payable 80,544 - -
Securities Lending Obligation 1,991,221 585 -
Unearned Revenue 3,349 - -
Amounts Held in Custody for Others - 2,191 329,037
Compensated Absences 5,292 12 -
Other Post-employment Benefits 11,243 - -
Net Pension Liability 38,876 - -
Notes and Mortgages Payable 1,000 - -
TOTAL LIABILITIES 2,278,419 26,205 360,165
DEFERRED INFLOWS OF RESOURCES 893 0 0
NET POSITION
Restricted or Held in Trust for Beneficiaries - 1,658,842 -
Restricted for Pension and Other Employee Benefits 41,368,483 - -
TOTAL NET POSITION $ 41,368,483 $ 1,658,842 $ 0
48
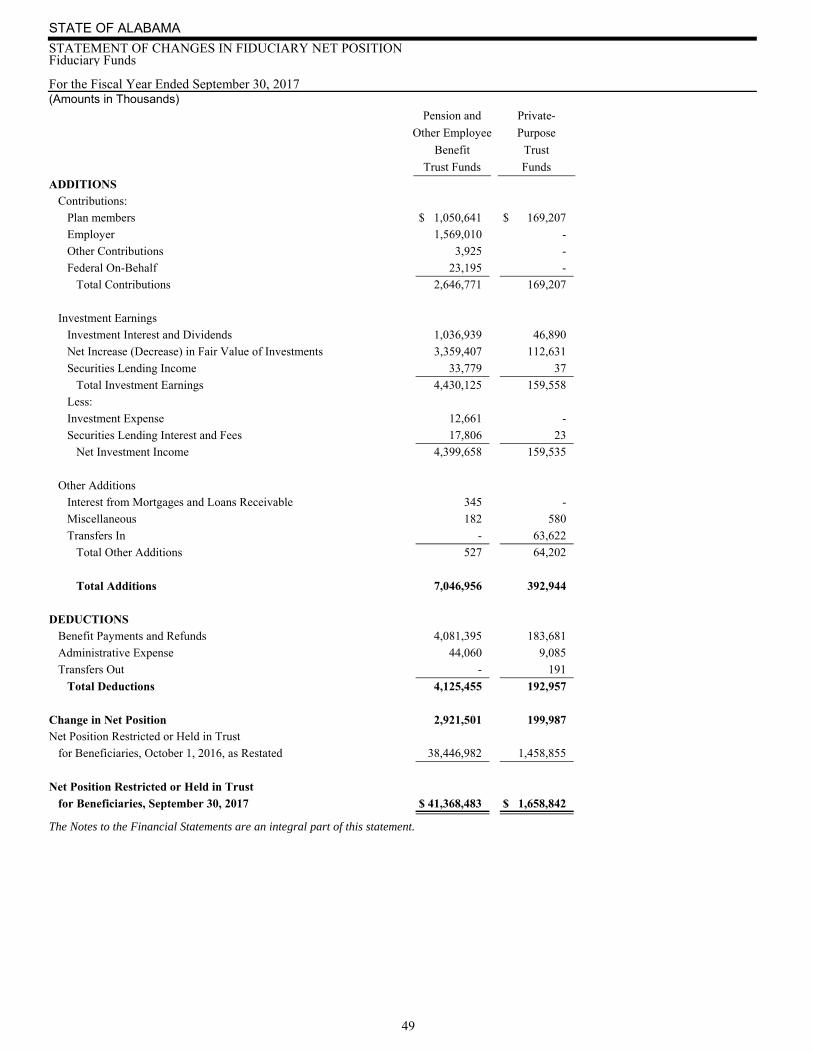
For the Fiscal Year Ended September 30, 2017 (Amounts in Thousands)
STATE OF ALABAMA
STATEMENT OF CHANGES IN FIDUCIARY NET POSITIONFiduciary Funds
Pension and Private-
Other Employee Purpose
Benefit Trust
Trust Funds Funds
The Notes to the Financial Statements are an integral part of this statement.
ADDITIONS Contributions:
Plan members $ 1,050,641 $ 169,207
Employer 1,569,010 -
Other Contributions 3,925 -
Federal On-Behalf 23,195 -
Total Contributions 2,646,771 169,207
Investment Earnings
Investment Interest and Dividends 1,036,939 46,890
Net Increase (Decrease) in Fair Value of Investments 3,359,407 112,631
Securities Lending Income 33,779 37
Total Investment Earnings 4,430,125 159,558
Less:
Investment Expense 12,661 -
Securities Lending Interest and Fees 17,806 23
Net Investment Income 4,399,658 159,535
Other Additions
Interest from Mortgages and Loans Receivable 345 -
Miscellaneous 182 580
Transfers In - 63,622
Total Other Additions 527 64,202
Total Additions 7,046,956 392,944
DEDUCTIONS Benefit Payments and Refunds 4,081,395 183,681
Administrative Expense 44,060 9,085
Transfers Out - 191
Total Deductions 4,125,455 192,957
Change in Net Position 2,921,501 199,987Net Position Restricted or Held in Trust
for Beneficiaries, October 1, 2016, as Restated 38,446,982 1,458,855
Net Position Restricted or Held in Trust
for Beneficiaries, September 30, 2017 $ 41,368,483 $ 1,658,842
49
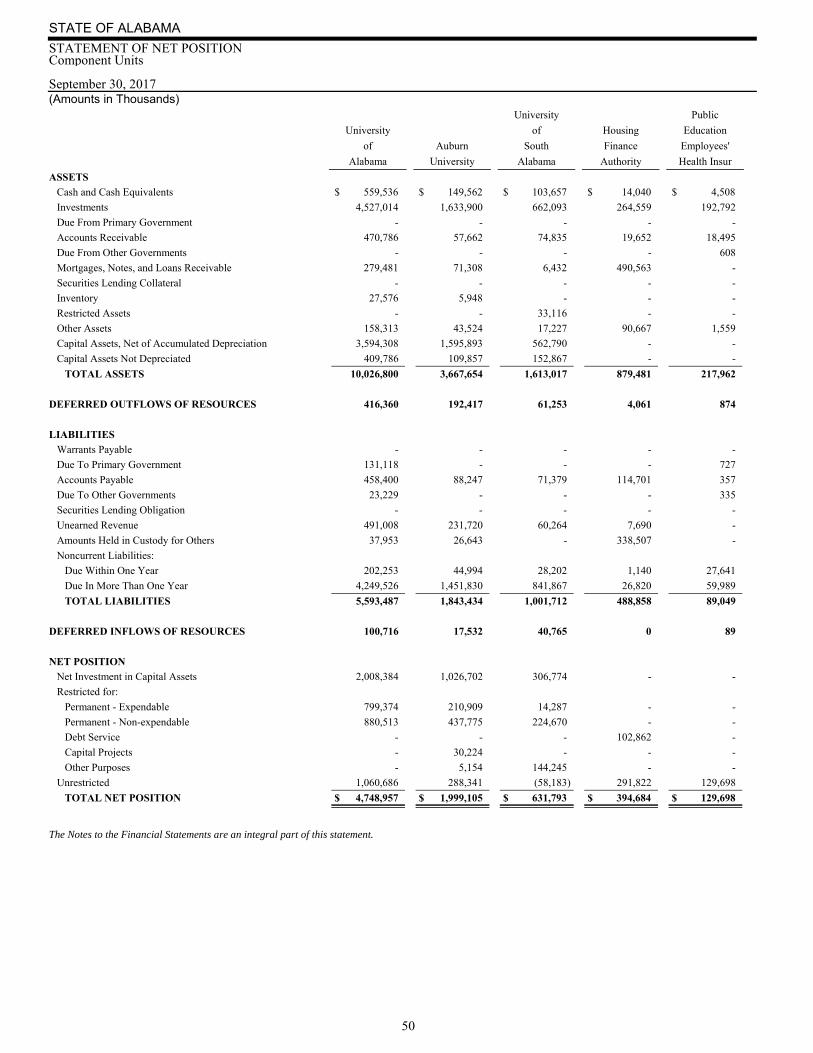
September 30, 2017(Amounts in Thousands)
STATE OF ALABAMA
STATEMENT OF NET POSITIONComponent Units
University Public
University of Housing Education
of Auburn South Finance Employees'
Alabama University Alabama Authority Health Insur
The Notes to the Financial Statements are an integral part of this statement.
ASSETS
Cash and Cash Equivalents $ 559,536 $ 149,562 $ 103,657 $ 14,040 $ 4,508
Investments 4,527,014 1,633,900 662,093 264,559 192,792
Due From Primary Government - - - - -
Accounts Receivable 470,786 57,662 74,835 19,652 18,495
Due From Other Governments - - - - 608
Mortgages, Notes, and Loans Receivable 279,481 71,308 6,432 490,563 -
Securities Lending Collateral - - - - -
Inventory 27,576 5,948 - - -
Restricted Assets - - 33,116 - -
Other Assets 158,313 43,524 17,227 90,667 1,559
Capital Assets, Net of Accumulated Depreciation 3,594,308 1,595,893 562,790 - -
Capital Assets Not Depreciated 409,786 109,857 152,867 - -
TOTAL ASSETS 10,026,800 3,667,654 1,613,017 879,481 217,962
DEFERRED OUTFLOWS OF RESOURCES 416,360 192,417 61,253 4,061 874
LIABILITIES
Warrants Payable - - - - -
Due To Primary Government 131,118 - - - 727
Accounts Payable 458,400 88,247 71,379 114,701 357
Due To Other Governments 23,229 - - - 335
Securities Lending Obligation - - - - -
Unearned Revenue 491,008 231,720 60,264 7,690 -
Amounts Held in Custody for Others 37,953 26,643 - 338,507 -
Noncurrent Liabilities:
Due Within One Year 202,253 44,994 28,202 1,140 27,641
Due In More Than One Year 4,249,526 1,451,830 841,867 26,820 59,989
TOTAL LIABILITIES 5,593,487 1,843,434 1,001,712 488,858 89,049
DEFERRED INFLOWS OF RESOURCES 100,716 17,532 40,765 0 89
NET POSITION
Net Investment in Capital Assets 2,008,384 1,026,702 306,774 - -
Restricted for:
Permanent - Expendable 799,374 210,909 14,287 - -
Permanent - Non-expendable 880,513 437,775 224,670 - -
Debt Service - - - 102,862 -
Capital Projects - 30,224 - - -
Other Purposes - 5,154 144,245 - -
Unrestricted 1,060,686 288,341 (58,183) 291,822 129,698
TOTAL NET POSITION $ 4,748,957 $ 1,999,105 $ 631,793 $ 394,684 $ 129,698
50
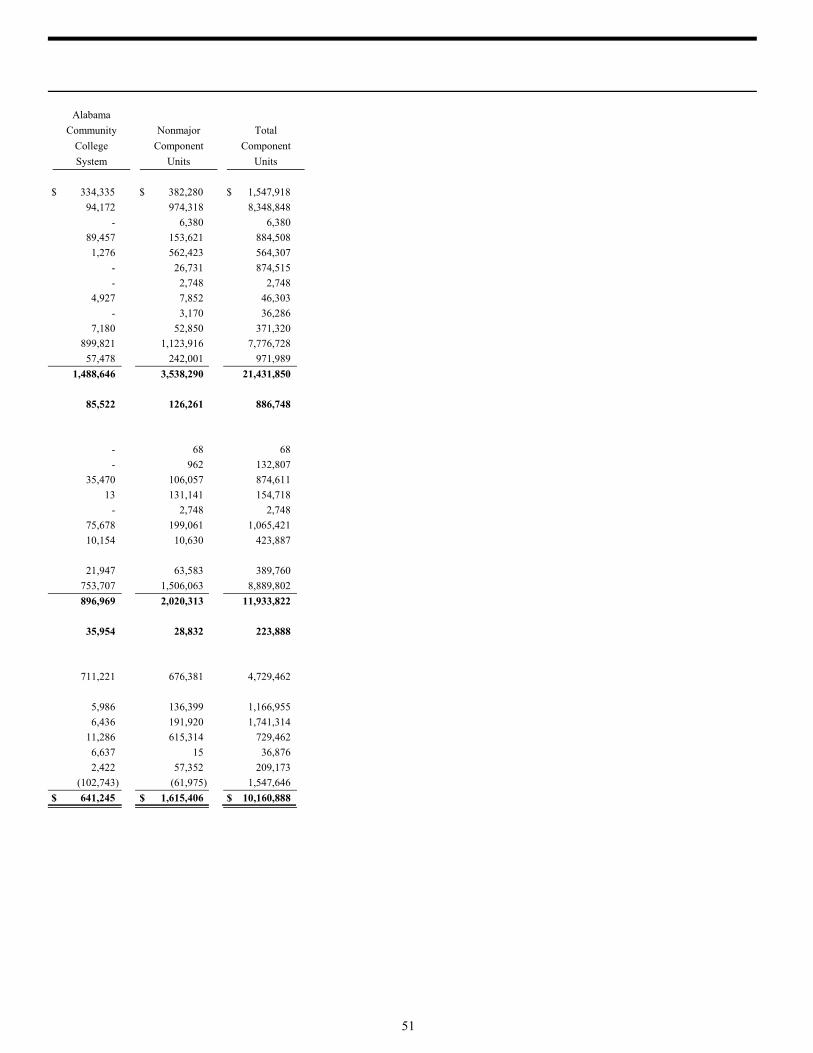
Alabama
Community Nonmajor Total
College Component Component
System Units Units
$ 334,335 $ 382,280 $ 1,547,918
94,172 974,318 8,348,848
- 6,380 6,380
89,457 153,621 884,508
1,276 562,423 564,307
- 26,731 874,515
- 2,748 2,748
4,927 7,852 46,303
- 3,170 36,286
7,180 52,850 371,320
899,821 1,123,916 7,776,728
57,478 242,001 971,989
1,488,646 3,538,290 21,431,850
85,522 126,261 886,748
- 68 68
- 962 132,807
35,470 106,057 874,611
13 131,141 154,718
- 2,748 2,748
75,678 199,061 1,065,421
10,154 10,630 423,887
21,947 63,583 389,760
753,707 1,506,063 8,889,802
896,969 2,020,313 11,933,822
35,954 28,832 223,888
711,221 676,381 4,729,462
5,986 136,399 1,166,955
6,436 191,920 1,741,314
11,286 615,314 729,462
6,637 15 36,876
2,422 57,352 209,173
(102,743) (61,975) 1,547,646
$ 641,245 $ 1,615,406 $ 10,160,888
51
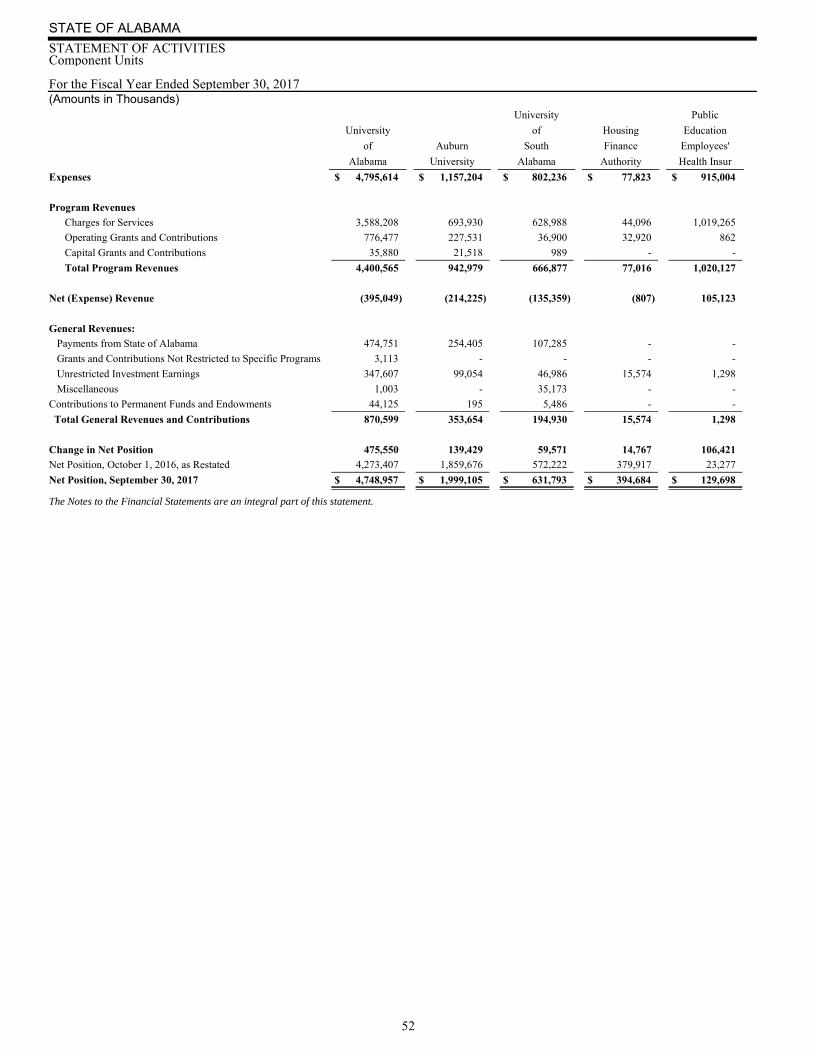
For the Fiscal Year Ended September 30, 2017(Amounts in Thousands)
STATE OF ALABAMA
STATEMENT OF ACTIVITIESComponent Units
University Public
University of Housing Education
of Auburn South Finance Employees'
Alabama University Alabama Authority Health Insur
The Notes to the Financial Statements are an integral part of this statement.
Expenses $ 4,795,614 $ 1,157,204 $ 802,236 $ 77,823 $ 915,004
Program Revenues
Charges for Services 3,588,208 693,930 628,988 44,096 1,019,265
Operating Grants and Contributions 776,477 227,531 36,900 32,920 862
Capital Grants and Contributions 35,880 21,518 989 - -
Total Program Revenues 4,400,565 942,979 666,877 77,016 1,020,127
Net (Expense) Revenue (395,049) (214,225) (135,359) (807) 105,123
General Revenues:
Payments from State of Alabama 474,751 254,405 107,285 - -
Grants and Contributions Not Restricted to Specific Programs 3,113 - - - -
Unrestricted Investment Earnings 347,607 99,054 46,986 15,574 1,298
Miscellaneous 1,003 - 35,173 - -
Contributions to Permanent Funds and Endowments 44,125 195 5,486 - -
Total General Revenues and Contributions 870,599 353,654 194,930 15,574 1,298
Change in Net Position 475,550 139,429 59,571 14,767 106,421
Net Position, October 1, 2016, as Restated 4,273,407 1,859,676 572,222 379,917 23,277
Net Position, September 30, 2017 $ 4,748,957 $ 1,999,105 $ 631,793 $ 394,684 $ 129,698
52
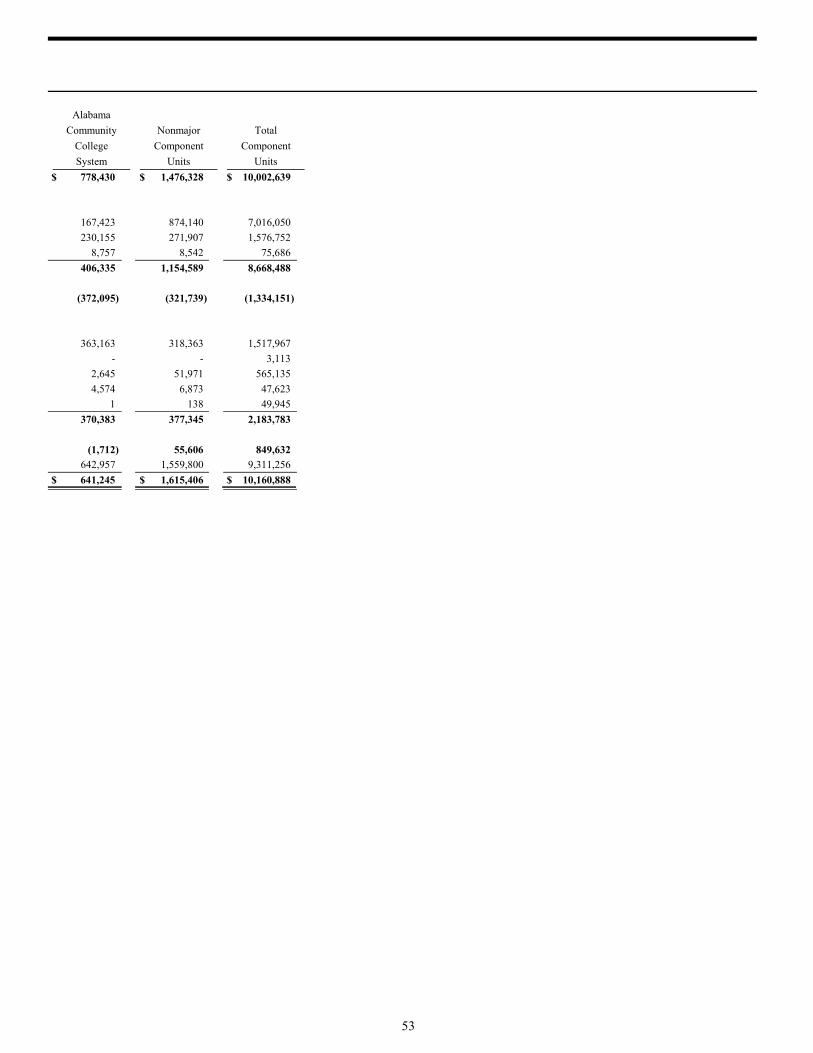
Alabama
Community Nonmajor Total
College Component Component
System Units Units
$ 778,430 $ 1,476,328 $ 10,002,639
167,423 874,140 7,016,050
230,155 271,907 1,576,752
8,757 8,542 75,686
406,335 1,154,589 8,668,488
(372,095) (321,739) (1,334,151)
363,163 318,363 1,517,967
- - 3,113
2,645 51,971 565,135
4,574 6,873 47,623
1 138 49,945
370,383 377,345 2,183,783
(1,712) 55,606 849,632
642,957 1,559,800 9,311,256
$ 641,245 $ 1,615,406 $ 10,160,888
53
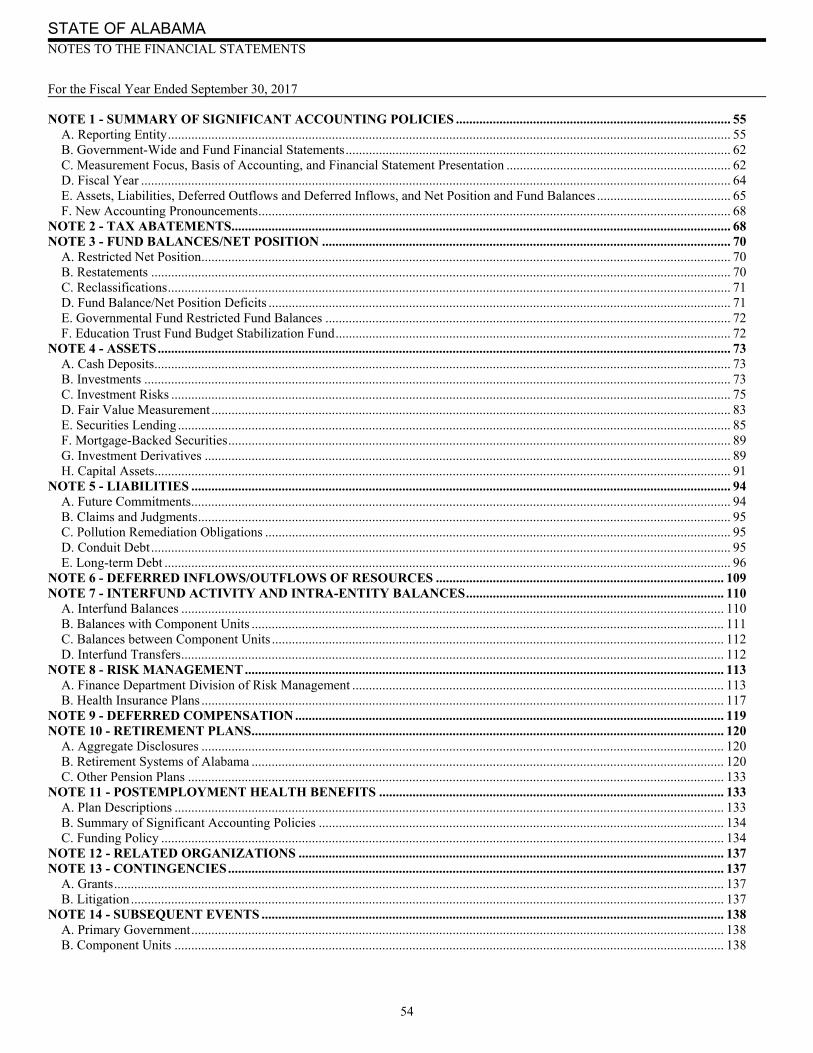
STATE OF ALABAMA NOTES TO THE FINANCIAL STATEMENTS For the Fiscal Year Ended September 30, 2017
54
NOTE 1 - SUMMARY OF SIGNIFICANT ACCOUNTING POLICIES .................................................................................. 55 A. Reporting Entity ........................................................................................................................................................................ 55 B. Government-Wide and Fund Financial Statements ................................................................................................................... 62 C. Measurement Focus, Basis of Accounting, and Financial Statement Presentation ................................................................... 62 D. Fiscal Year ................................................................................................................................................................................ 64 E. Assets, Liabilities, Deferred Outflows and Deferred Inflows, and Net Position and Fund Balances ........................................ 65 F. New Accounting Pronouncements ............................................................................................................................................. 68
NOTE 2 - TAX ABATEMENTS ..................................................................................................................................................... 68 NOTE 3 - FUND BALANCES/NET POSITION .......................................................................................................................... 70
A. Restricted Net Position .............................................................................................................................................................. 70 B. Restatements ............................................................................................................................................................................. 70 C. Reclassifications ........................................................................................................................................................................ 71 D. Fund Balance/Net Position Deficits .......................................................................................................................................... 71 E. Governmental Fund Restricted Fund Balances ......................................................................................................................... 72 F. Education Trust Fund Budget Stabilization Fund ...................................................................................................................... 72
NOTE 4 - ASSETS ........................................................................................................................................................................... 73 A. Cash Deposits ............................................................................................................................................................................ 73 B. Investments ............................................................................................................................................................................... 73 C. Investment Risks ....................................................................................................................................................................... 75 D. Fair Value Measurement ........................................................................................................................................................... 83 E. Securities Lending ..................................................................................................................................................................... 85 F. Mortgage-Backed Securities ...................................................................................................................................................... 89 G. Investment Derivatives ............................................................................................................................................................. 89 H. Capital Assets ............................................................................................................................................................................ 91
NOTE 5 - LIABILITIES ................................................................................................................................................................. 94 A. Future Commitments ................................................................................................................................................................. 94 B. Claims and Judgments ............................................................................................................................................................... 95 C. Pollution Remediation Obligations ........................................................................................................................................... 95 D. Conduit Debt ............................................................................................................................................................................. 95 E. Long-term Debt ......................................................................................................................................................................... 96
NOTE 6 - DEFERRED INFLOWS/OUTFLOWS OF RESOURCES ...................................................................................... 109 NOTE 7 - INTERFUND ACTIVITY AND INTRA-ENTITY BALANCES ............................................................................. 110
A. Interfund Balances .................................................................................................................................................................. 110 B. Balances with Component Units ............................................................................................................................................. 111 C. Balances between Component Units ....................................................................................................................................... 112 D. Interfund Transfers .................................................................................................................................................................. 112
NOTE 8 - RISK MANAGEMENT ............................................................................................................................................... 113 A. Finance Department Division of Risk Management ............................................................................................................... 113 B. Health Insurance Plans ............................................................................................................................................................ 117
NOTE 9 - DEFERRED COMPENSATION ................................................................................................................................ 119 NOTE 10 - RETIREMENT PLANS ............................................................................................................................................. 120
A. Aggregate Disclosures ............................................................................................................................................................ 120 B. Retirement Systems of Alabama ............................................................................................................................................. 120 C. Other Pension Plans ................................................................................................................................................................ 133
NOTE 11 - POSTEMPLOYMENT HEALTH BENEFITS ....................................................................................................... 133 A. Plan Descriptions .................................................................................................................................................................... 133 B. Summary of Significant Accounting Policies ......................................................................................................................... 134 C. Funding Policy ........................................................................................................................................................................ 134
NOTE 12 - RELATED ORGANIZATIONS ............................................................................................................................... 137 NOTE 13 - CONTINGENCIES .................................................................................................................................................... 137
A. Grants ...................................................................................................................................................................................... 137 B. Litigation ................................................................................................................................................................................. 137
NOTE 14 - SUBSEQUENT EVENTS .......................................................................................................................................... 138 A. Primary Government ............................................................................................................................................................... 138 B. Component Units .................................................................................................................................................................... 138
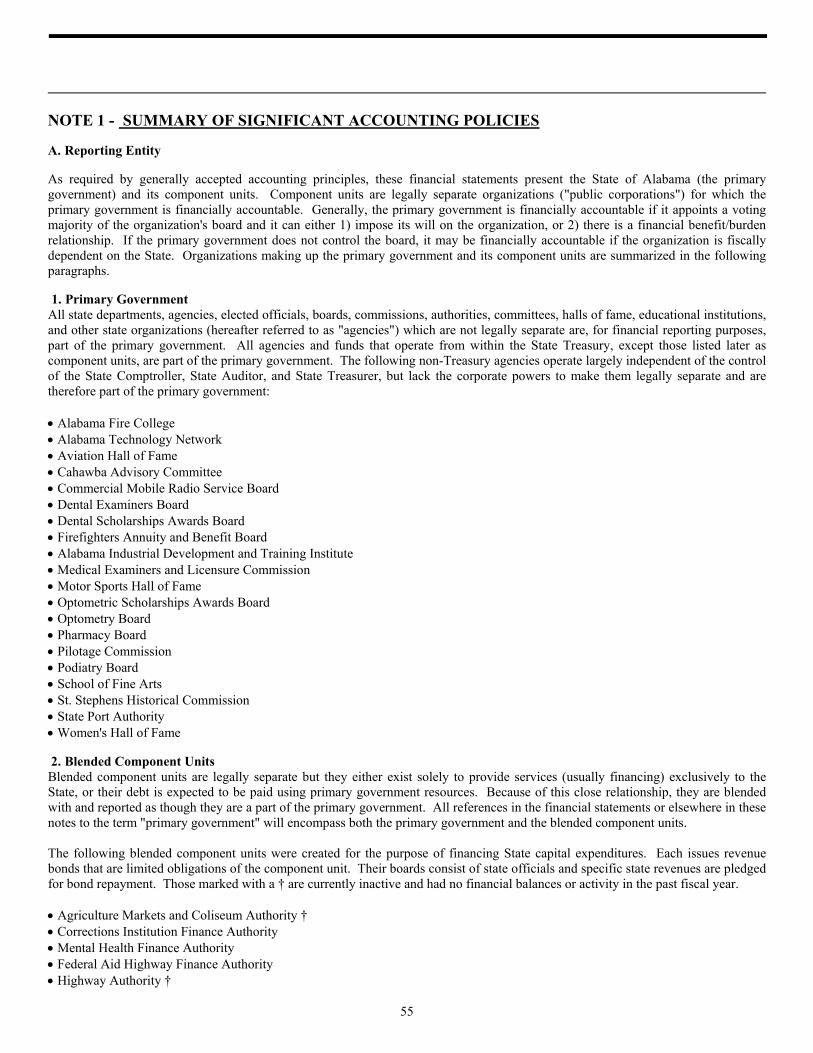
55
NOTE 1 - SUMMARY OF SIGNIFICANT ACCOUNTING POLICIES
A. Reporting Entity
As required by generally accepted accounting principles, these financial statements present the State of Alabama (the primary government) and its component units. Component units are legally separate organizations ("public corporations") for which the primary government is financially accountable. Generally, the primary government is financially accountable if it appoints a voting majority of the organization's board and it can either 1) impose its will on the organization, or 2) there is a financial benefit/burden relationship. If the primary government does not control the board, it may be financially accountable if the organization is fiscally dependent on the State. Organizations making up the primary government and its component units are summarized in the following paragraphs.
1. Primary Government All state departments, agencies, elected officials, boards, commissions, authorities, committees, halls of fame, educational institutions, and other state organizations (hereafter referred to as "agencies") which are not legally separate are, for financial reporting purposes, part of the primary government. All agencies and funds that operate from within the State Treasury, except those listed later as component units, are part of the primary government. The following non-Treasury agencies operate largely independent of the control of the State Comptroller, State Auditor, and State Treasurer, but lack the corporate powers to make them legally separate and are therefore part of the primary government: Alabama Fire College Alabama Technology Network Aviation Hall of Fame Cahawba Advisory Committee Commercial Mobile Radio Service Board Dental Examiners Board Dental Scholarships Awards Board Firefighters Annuity and Benefit Board Alabama Industrial Development and Training Institute Medical Examiners and Licensure Commission Motor Sports Hall of Fame Optometric Scholarships Awards Board Optometry Board Pharmacy Board Pilotage Commission Podiatry Board School of Fine Arts St. Stephens Historical Commission State Port Authority Women's Hall of Fame
2. Blended Component Units Blended component units are legally separate but they either exist solely to provide services (usually financing) exclusively to the State, or their debt is expected to be paid using primary government resources. Because of this close relationship, they are blended with and reported as though they are a part of the primary government. All references in the financial statements or elsewhere in these notes to the term "primary government" will encompass both the primary government and the blended component units. The following blended component units were created for the purpose of financing State capital expenditures. Each issues revenue bonds that are limited obligations of the component unit. Their boards consist of state officials and specific state revenues are pledged for bond repayment. Those marked with a † are currently inactive and had no financial balances or activity in the past fiscal year. Agriculture Markets and Coliseum Authority † Corrections Institution Finance Authority Mental Health Finance Authority Federal Aid Highway Finance Authority Highway Authority †
STATE OF ALABAMA NOTES TO THE FINANCIAL STATEMENTS For the Fiscal Year Ended September 30, 2017
56
Highway Finance Corporation Industrial Access Road and Bridge Authority † Toll Road, Bridge and Tunnel Authority † Judicial Building Authority Alabama Trade School and Junior College Authority † Gulf State Park Authority† The Building Renovation Finance Authority has the same characteristics as those in the previous paragraph, but has the added responsibility of operating, maintaining, and renting buildings in the capitol complex that are occupied by state departments. The following blended component units were created primarily for the purpose of financing capital grants and loans. These grants and loans are made to local school systems for building and equipping school buildings, or to local industrial development boards, or to industries locating in or expanding in the State. Each issues revenue bonds that are limited obligations of the component unit. Their boards consist of a majority of state officials and specific state revenues are pledged for bond repayment. Those marked with a † are currently inactive and had no financial balances or activity in the past fiscal year. Alabama Public School and College Authority Alabama Incentives Financing Authority Alabama Twenty-first Century Authority State Industrial Development Authority Revolving Loan Fund Authority Tennessee Valley Exhibit Commission † The Department of Mental Health provides mental health services to the people of Alabama. The Governor of the State and the commissioner of the Department constitute a public corporation and are advised by a sixteen-member board of trustees. The commissioner and ten of the board members are appointed at the discretion of the Governor. All of the department’s debt is repaid with resources of the primary government. The Public Historical Sites and Parks Improvement Corporation issues bonds and uses the proceeds to renovate, improve, maintain, and construct State owned public historical sites and parks not under the jurisdiction of the Department of Conservation and Natural Resources as well as non-State owned public historical sites and parks. The six members of the Corporation are state officials. The debt is repaid entirely with resources of the primary government. The State Parks System Improvement Corporation renovates, improves, maintains, and constructs assets belonging to the State Parks System. The six members of the Corporation are state officials. The debt of the Corporation is repaid entirely with resources of the primary government. The Tombigbee Valley Development Authority consists of six state officials who oversee the development and improvements along the Tombigbee River. The debt of the Authority is repaid entirely with resources of the primary government. The Coosa Valley Development Authority oversees developments and improvements along the Coosa River. Six of the seven members of the Authority are state officials. The debt of the Authority is repaid entirely with resources of the primary government. The Forensic Science Bond Authority has the power to acquire, construct, and equip laboratories and other facilities for the State Department of Forensic Sciences. The four members of the Authority are state officials. The Authority had no financial activity in the past fiscal year. The Alabama State Parking Deck Authority has the authority to sell bonds, operate, maintain, and rent space in a parking deck on a block in the capitol complex. The members of the Authority are State officials and the debt will be repaid with State resources. The Educational Television Foundation Authority raises and manages money and property solely for the benefit of the Alabama Educational Television Commission, a State agency. The Authority consists of thirteen members who are appointed by the Alabama Educational Television Commission. The Authority provides fund raising and promotion flexibility that the Commission, as part of the primary government, would not otherwise have. The Public Health Care Authority was created solely to build, furnish, and maintain facilities for the use of the Department of Public Health, a State agency, financing those facilities with debt issuances which are backed by leases with the Department. Three of the
57
seven board members are state officials but the remaining board members are not appointed by the State and the Authority is not fiscally dependent on the State. The Authority is included in these financial statements because it would be misleading to exclude them due to the close relationship with the State. The Alabama Economic Settlement Authority was created to issue bonds for the purpose of making payments to the Alabama Trust Fund, for additional funds to the Medicaid Agency, for transportation projects, and to appropriate and pledge a portion of the revenues to be received by the State from the settlement of certain claims against BP Exploration and Production, Inc. (and its corporate affiliates) as the source of payment of the bonds. The bonds issued by the Authority are limited obligations of the Authority. The six members of the Authority are state officials.
3. Discretely Presented Component Units Discretely presented component units are organizations, which are legally separate and do not exist to provide services exclusively to the primary government. Providing services to the citizens of the state is not considered the same as providing services to the primary government institution. Financial information for discretely presented component units is segregated on the financial statements and the notes in the "Component Unit" columns in order to emphasize that they are legally separate. Most of the discretely presented component units have boards that are controlled by the primary government through the appointment of a majority of the board members. The State has been determined to be financially accountable for each organization because it can impose its will on each organization. Unless otherwise noted, financial accountability for each organization described below exists at least in the ability of the State to modify the component unit's budget. Other manifestations of financial accountability may also exist. For discretely presented component units whose boards are not controlled by the State, the organization has been determined to be fiscally dependent on the State. Unless otherwise noted, fiscal dependency exists at a minimum in the State’s ability to modify the component unit’s budget. Other manifestations of fiscal dependency may also exist. When audited financial statements for a discretely presented component unit exist, the address at which such financial statements can be obtained is included in the following paragraphs describing each component unit. For all other discretely presented component units, complete financial statements may be obtained from the State of Alabama, Office of State Comptroller, RSA Union Building, Suite 298, Montgomery, AL 36130-2602. The Water Pollution Control Authority operates a revolving loan fund to aid municipalities in financing the construction of wastewater treatment facilities. A five-member board of directors made up of ex officio members governs the Authority. Audited financial statements of the Authority may be obtained from the Alabama Department of Environmental Management, 1400 Coliseum Boulevard, Montgomery, AL 36130. The Alabama Drinking Water Finance Authority operates a revolving loan fund to aid local governments in financing the construction of sanitary drinking water facilities. A five-member board of directors made up of ex officio members governs the Authority. Audited financial statements of the Authority may be obtained from the Alabama Department of Environmental Management, 1400 Coliseum Boulevard, Montgomery, AL 36130. The Crime Victims Compensation Commission awards compensation for economic losses arising from criminal conduct and works to change laws to benefit crime victims. The Commission consists of three members who are appointed by the Governor. The Alabama Education Foundation encourages donations of money for local school systems and invests the money for the benefit of each local system. The Foundation is governed by a twelve-member board that is made up of state officials and other individuals appointed by state authorities. The Supercomputer Authority operates a supercomputer for the use of educational and governmental research institutions, private businesses, and individuals. The twenty directors of the Authority are appointed by state officials. The Public Education Employees’ Health Insurance Board operates a health insurance plan for employees of public school systems, state junior colleges, colleges, universities, and related education administrative employees. The State does not appoint a majority of the Board but the Board is fiscally dependent on the State. Audited financial statements of the board may be obtained at 201 South Union Street, Montgomery, AL 36104-0001.

STATE OF ALABAMA NOTES TO THE FINANCIAL STATEMENTS For the Fiscal Year Ended September 30, 2017
58
The State Employees’ Insurance Board operates health insurance plans for state employees. The State does not appoint a majority of the Board but the Board is fiscally dependent on the State. Audited financial statements of the board may be obtained at Suite 200, 201 South Union Street, Montgomery, AL 36104. The Alabama Community College System operates a system of community and technical colleges within the State. The System is governed by a board of trustees consisting of the Governor and nine members appointed by the Governor. The boards of the four-year colleges of the State, except for the University of Alabama, are appointed by the State. Those colleges are: Alabama A&M University, Alabama State University, Athens State University, Auburn University, Jacksonville State University, University of Montevallo, University of West Alabama, University of North Alabama, University of South Alabama, and Troy University. The University of Alabama board of trustees is not controlled by the State, but the University is subject to budgetary control by the State. The Crimson Tide Foundation, UAB Research Foundation, Triton Health Systems, LLC, Alabama Care Plan, UAB Hospital Management, LLC, and UAB Athletics Foundation are blended component units of the University of Alabama and are therefore included in all amounts reported for the University. The University of South Alabama includes the Professional Liability Trust Fund, the General Liability Trust Fund, USA HealthCare Management, LLC, and the University of South Alabama Health Services Foundation as blended component units. In addition to the blended component units, there are other legally separate, tax exempt organizations that are discretely presented component units of the universities. These organizations generally exist to raise funds to benefit a specific university. Although the university may not control the timing or amount of receipts from these foundations, the majority of resources that the foundations hold and invest are restricted to benefit the activities of the universities by the donors. Because the resources are held for the benefit of the universities, the foundations are considered discretely presented component units of the universities and are included in each of the universities’ financial statements. For the University of Alabama, the University’s discretely presented component units are the National Alumni Association of the University of Alabama, the Capstone Foundation, the 1831 Foundation, the Capstone Health Services Foundation, the University of Alabama Law School Foundation, the Donor Advised Fund, Southern Research Institute, and the University of Alabama Huntsville Foundation. For Alabama State University, the Alabama State University Foundation, Inc. and the Trust for Educational Excellence at Alabama State University are component units. For Auburn University, the University’s component units are the Auburn University Foundation, Tigers Unlimited Foundation, Auburn Alumni Association, and Auburn Research and Technology Foundation. The University of Montevallo Foundation is a component unit of the University of Montevallo and is included in the amounts reported for Montevallo. The University of South Alabama has two component units, the University of South Alabama Foundation and USA Research and Technology Corporation. The Troy University Foundation is a component unit of Troy University. Jacksonville State University’s component unit is Jacksonville State University Foundation, Inc. For the University of North Alabama, the University of North Alabama Foundation is a component unit and is included in the amount reported for North Alabama. The Alabama A&M University has two component units – The Alabama A&M University Foundation, Inc. and the Trust for Educational Excellence at Alabama A&M University. For Athens State University, the Athens State University Foundation is a component unit. The University of West Alabama Foundation is a component unit of The University of West Alabama. Complete financial statements for the universities which are audited by other auditors may be obtained at the following addresses: Chief Fiscal Officer, University of South Alabama, Business Office AD 380, Mobile, AL 36688-0002; Office of the Vice President for Business and Finance, Alabama A&M University, 105 Patton Building, Normal, AL 35762; Vice President for Financial Affairs, University of Alabama at Tuscaloosa, P.O. Box 870142, Tuscaloosa, AL 35487-0142; Office of Accounting and Financial Reporting, The University of Alabama in Huntsville, 301 Sparkman Drive, Huntsville, AL 35899; Office of the Vice President for Financial Affairs and Administration, University of Alabama at Birmingham, AB 1030, 1720 2nd Avenue South, Birmingham, AL 35294-0106; Controller, Auburn University, 126 Ingram Hall, Auburn University, AL 36849-5161; Controller, University of Montevallo, Station 6060, Montevallo, AL 35115-6000; Vice President for Business and Finance, Alabama State University, 915 S. Jackson Street, Montgomery, AL 36104; Vice President for Financial Affairs, Athens State University, 300 North Beaty Street, Athens, AL 35611; Vice President for Administrative and Business Affairs, Jacksonville State University, 700 Pelham Road North, Jacksonville, AL 36265-1602; Comptroller, University of West Alabama, UWA Station 2, Livingston, AL 35470; Vice President for Business and Financial Affairs, University of North Alabama, Bibb Graves Hall Room 103, Florence, AL 35632-0001; Senior Vice Chancellor Finance and Business, Troy University, Adams Administration Building Suite 159, Troy, AL 36082. The Alabama Institute for the Deaf and Blind (AIDB) is an educational institution governed by a fourteen-member board, twelve of whom are appointed by the Governor. The Alabama Institute of Deaf and Blind Foundation, Inc. is a component unit of AIDB and is included in the amount reported. The Marine Environmental Sciences Consortium provides educational programs in marine sciences for the graduate and undergraduate level and conducts research in marine sciences. The board of directors is composed of the chief executive officers of the member institutions.

59
The U.S.S. Alabama Battleship Commission consists of eighteen members appointed by the Governor. The Commission operates a memorial park centered near the historic battleship. The fourteen-member board of directors of the Housing Finance Authority is appointed by various state officials. The Authority sells bonds and uses the proceeds to make it possible for lenders to make low interest rate mortgages available to low income home buyers. The primary government does not affect the Authority's budget, but the legislature has historically limited the Authority's ability to issue bonds. Audited financial statements may be obtained from the Authority, P.O. Box 242967, 7460 Halcyon Pointe drive, Suite 200, Montgomery, AL 36124-2967. The Alabama Historic Ironworks Commission operates an historic park based on one of the State's early ironworks. Fourteen of the eighteen members of the commission are appointed by the Governor. Part of the Commission's budget is subject to State control. The Space Science Exhibit Commission operates the Alabama Space and Rocket Center along with the Space Camp. All eighteen members of the Commission are appointed by the Governor and part of the Commission's budget is subject to State approval. Audited financial statements may be obtained from the Commission at the Alabama Space and Rocket Center, P. O. Box 070015, 1 Tranquility Base, Huntsville, AL 35807-7015. The Historical Commission is responsible for the preservation of historic sites, buildings, and objects. The twenty-member Commission is not controlled by the State, but the Commission's budget is subject to State control. The Choctawhatchee Pea and Yellow Rivers Watershed Management Authority develops and executes plans for water conservation and usage, flood control and prevention, water pollution control, wildlife habitat protection, and erosion control within the boundaries of the Authority. The directors of the Authority are elected by local residents, but the Authority is subject to State budgetary control. The Agricultural Museum Board exists to preserve and exhibit agricultural artifacts. The Board is not controlled by the State, but it is subject to State budgetary control. The Music Hall of Fame operates a public exhibit displaying music memorabilia in honor of Alabamians who have made a lasting contribution to music. The Hall has both an independent board and is fiscally independent of the State. The Hall is included in these financial statements because it would be misleading to exclude. The State has some limited budgetary influence and the State funded the construction of the Hall's facilities with a general obligation bond issue. The Historic Blakeley Authority preserves the historic site of the town of Blakeley and operates a park on the site. The Authority has both an independent board and is fiscally independent of the State. The Authority is included in the reporting entity because the State has some limited budgetary influence and the State provides the majority of the Authority's funding. The Agricultural Development Authority promotes development of agriculture in the State by making low interest loans available to persons engaged in agricultural operations. The seven-member board is made up of three state officials and four other persons appointed by the State. The Red Mountain Greenway and Recreational Area Commission is responsible for preserving, restoring, and promoting as a greenway, recreational area, or historic site certain land in Birmingham which played an important role in the steel industry of the State. The fifteen member Commission is not controlled by the State, but the Commission is fiscally dependent on the State.
4. Fiduciary Component Units Component units that are fiduciary in nature are required by GAAP to be reported with the fiduciary funds of the primary government rather than as discretely presented component units. In accordance with GAAP, primary government fiduciary funds and component units that are fiduciary in nature are excluded from the government-wide financial statements. The Employees’ Retirement System (ERS), a discretely presented component unit, operates several pension (and other employee benefit) trust funds for the benefit of state and local governmental employees. The ERS is governed by a thirteen-member board of control, seven of whom are either primary government officials or appointees of the Governor. The Teachers’ Retirement System (TRS), a discretely presented component unit, operates a pension plan for the benefit of all employees of public education institutions throughout the State. It is governed by a fourteen-member board, ten of whom are elected from among the member employees. The administrative budget of TRS is subject to approval by the State. Audited financial
STATE OF ALABAMA NOTES TO THE FINANCIAL STATEMENTS For the Fiscal Year Ended September 30, 2017
60
statements for the TRS and ERS may be obtained from the RSA at 201 South Union Street, P.O. Box 302150, Montgomery, AL 36130-2150.
5. Excluded Organizations Other entities have been examined but failed to meet the criteria for inclusion in the State's reporting entity. City and county boards of education are legally separate organizations whose boards are not controlled by the State. They are fiscally dependent on both the State and local government. It is more appropriate that they be included in a local government's reporting entity. The Local Government Health Insurance Board, Elk River Development Agency, Bear Creek Development Authority, Cahaba Trace Commission, and North Alabama Agriplex Board are legally separate organizations whose boards are not controlled by the State nor are they fiscally dependent on the State. All five of these organizations are excluded. The many local soil and water conservation districts are legally separate organizations which have independent boards and are fiscally independent. In keeping with their independence, they are excluded from this report.
6. Sources of Information The majority of state organizations, whether primary government or component unit, conduct their financial operations from the State Treasury through the State's central accounting system under the supervision and review of the State Comptroller, State Treasurer, and State Auditor. The source of information on these agencies is the State's central accounting system. For these agencies, the recording of cash, warrants payable, encumbrances, salaries payable, compensated absences, most investments, most short-term payables, most revenues, and most expenditures/expenses are controlled by the State Comptroller and/or the State Treasurer and are therefore subject to extensive scrutiny. Accruals of revenues, a few accruals of expenditures/expenses, and all other accounts, such as depreciation, capital assets, inventories, and capital leases, generally are based on data provided by the individual agencies. The data provided by the agencies are reviewed and recorded once a year and are believed to be materially correct even though they are not generally subject to extensive scrutiny by the State Comptroller, State Treasurer, or State Auditor. There are some organizations and funds which meet the criteria for inclusion as part of the reporting entity even though they have the authority to conduct their financial operations through bank accounts and accounting systems outside the State Treasury, independent of the direct daily control of the State Comptroller, State Treasurer, and State Auditor. These non-Treasury agencies are included in the financial statements based on information provided to the State Comptroller once a year by the agency or the agency's auditors. Whenever possible, the non-Treasury agencies are reported as they appeared in the information submitted to the State Comptroller. However, corrections or modifications have been made whenever required to comply with generally accepted accounting principles or wherever necessary to ensure consistent statewide report presentation. The following non-Treasury agencies and funds are included in this report:
Primary Government Alabama College Education Savings Trust Fund Alabama Deferred Compensation Plan Alabama Health Insurance Plan Alabama Industrial Development Training Institute Alabama School of Fine Arts Alabama State Port Authority Alabama Fire College Alabama Technology Network Attorney General Outside Accounts Aviation Hall of Fame Blind Vendors Fund C.C. Smith Trust Fund Cahawba Advisory Committee Charlotte Thorn Endowment Fund Corrections Bank Accounts and Agency Funds Corrections Canteen Funds Court System Local Accounts Dental Examiners Board Dental Scholarships Awards Board Department of Human Resources Local Funds Educational Television Foundation Authority Geological Survey Library Revolving Fund

61
High School of Math and Science Insurance Department Statutory Deposits Insurance Department Receivership Medicaid Agency Lien Account Medical Scholarships Awards Account Medical Examiners and Licensure Commission Men’s Hall of Fame Outside Account Military Department Unit Funds Motor Sports Hall of Fame National Guard Canteen Funds Optometry Board Optometric Scholarships Awards Board Peace Officers' Annuity and Benefit Investment Account Pharmacy Board Pilotage Commission Podiatry Board Public Health Care Authority Public Health Local Funds Public Safety Narcotics Funds Sports Hall of Fame Checking Account St. Stephens Historical Commission State Bar Checking Account State Bar Client Security State Bar Foundation State Port Authority Hourly Pension Plan State Port Authority Railway Pension Plan State Port Authority Hourly Defined Contribution Plan Stonewall Jackson Memorial Fund Supreme Court Checking Account Supreme Court Law Library Checking Account Unemployment Compensation Funds Victims Services Fund W.V. Chambliss Trust Fund Wireless 911 Board Women's Hall of Fame Youth Service Student Accounts and Local Funds
Discretely Presented Component Units Alabama Agricultural and Mechanical University labama Agricultural Development Authority Alabama Community College System Alabama Drinking Water Finance Authority Alabama Historic Ironworks Commission Alabama Housing Finance Authority Alabama Institute for Deaf and Blind Alabama State University Athens State University Auburn University Historic Blakeley Authority Crime Victims’ Compensation Fund Jacksonville State University Marine Environmental Sciences Consortium Mental Health Capital Projects - Bank Account Music Hall of Fame Red Mountain Greenway and Recreational Area Commission
STATE OF ALABAMA NOTES TO THE FINANCIAL STATEMENTS For the Fiscal Year Ended September 30, 2017
62
Space Science Exhibit Commission and Space Science Exhibit Finance Authority Troy University U.S.S. Alabama Battleship Commission University of Alabama in Birmingham University of Alabama in Huntsville University of Alabama System Office University of Alabama in Tuscaloosa University of Montevallo University of North Alabama University of South Alabama University of West Alabama Water Pollution Control Authority
B. Government-Wide and Fund Financial Statements
1. Government-Wide Financial Statements Government-wide financial statements include two basic financial statements: the Statement of Net Position and the Statement of Activities. The two statements report the State’s governmental activities separately from its business-type activities. Governmental activities generally are financed through taxes, intergovernmental revenues, and other nonexchange revenues. Business-type activities are financed in whole or in part by fees charged to external parties for goods or services. Fiduciary funds and fiduciary-type component units are excluded from the government-wide financial statements. The Statement of Net Position presents the reporting entity’s non-fiduciary assets, deferred outflows of resources, liabilities, and deferred inflows of resources with the difference reported as net position. Net Position is reported in three categories: Net Investment in Capital Assets consists of capital assets less accumulated depreciation, plus capital-related deferred outflows of resources, less capital-related deferred inflows of resources, and less outstanding balances for bonds, notes, and other debt that are attributed to the acquisition, construction, or improvement of those assets. Restricted Net Position results when constraints placed on net position are either externally imposed by creditors, grantors, contributors, and the like, or imposed by law through constitutional provisions or enabling legislation. Unrestricted Net Position consists of net position that does not meet the definition of the two preceding categories. The Statement of Activities demonstrates the degree to which the direct expenses of a given function or segment is offset by program revenues. Direct expenses are those that are clearly identifiable within a specific function. Program revenues include 1) charges to customers or applicants who purchase, use, or directly benefit from goods, services, or privileges provided by a given function and 2) grants and contributions that are restricted to meeting the operational or capital requirements of a particular function. Taxes and other items not meeting the definition of program revenues are reported as general revenue.
2. Fund Financial Statements Separate fund financial statements are provided for governmental funds, proprietary funds, and fiduciary funds, even though the latter are excluded from the government-wide statements. Major individual governmental funds and major individual proprietary funds are reported as separate columns in the fund financial statements, with nonmajor funds being combined into a single column.
C. Measurement Focus, Basis of Accounting, and Financial Statement Presentation
1. Measurement Focus and Basis of Accounting These financial statements are reported in conformity with generally accepted accounting principles (GAAP) unless otherwise noted on the face of the statement or in the Notes to the Financial Statements. GAAP basis reporting differs considerably in some ways from the budgetary and cash basis accounting under which the State budgets and operates.
Accrual Basis Under GAAP, the government-wide statements are reported using the economic resources measurement focus and the accrual basis of accounting, as are the proprietary and fiduciary fund financial statements. Agency funds, however, do not have a measurement focus. Revenues are recognized and recorded when earned and expenses are recorded when a liability is incurred for exchange and exchange-like transactions, regardless of the timing of cash flows. For nonexchange transactions, revenues and expenditures and
63
related assets and liabilities are recognized as required by GASB Statement No. 33, as amended by GASB Statement No. 65. For derived nonexchange transactions, receivables and revenues are recognized when the underlying exchange has occurred. For imposed nonexchange transactions, receivables are recognized when an enforceable legal claim has arisen. Revenues are recognized when resources are required to be used or the first period that use is permitted. Property taxes are recognized as revenues in the year for which they are levied. For government mandated nonexchange revenues such as grants, GAAP require the recognition of assets, revenues, liabilities, and expenditures when all eligibility requirements have been met. Resources received before time requirements are met, but after all other eligibility requirements have been met, are reported as deferred inflows of resources. Agency funds, fiduciary in nature, do not recognize revenues and expenditures. Proprietary funds report operating revenues and expenses separately from non-operating items. Operating items generally result from producing and delivering goods and services that are a normal part of the primary business of the fund. Operating expenses for enterprise funds and internal service funds include the cost of sales and services, administrative expenses and depreciation on capital assets. Revenues and expenses not meeting this definition are reported as non-operating revenues and expenses.
Modified Accrual Basis Governmental fund financial statements are reported using the current financial resources measurement focus and the modified accrual basis of accounting. Under this focus, only current assets, deferred outflows of resources, current liabilities, and deferred inflows of resources generally are included on the balance sheet. Recognition criteria are different for exchange and nonexchange transactions. Revenues are considered to be available when they are collected within the current period or soon enough thereafter to pay liabilities of the current period. For this purpose, the State generally considers tax revenues and court settlements to be available if they are collected within sixty days of the end of the fiscal period. Revenues that the State earns by incurring obligations are recognized in the period when all applicable eligibility requirements have been met and the resources are available. The State considers revenues earned by incurring obligations to be available if they are collected within sixty days of the end of the fiscal period. For exchange and exchange-like transactions in governmental fund financial statements, revenues are recognized when measurable and available to finance operations during the year or if available to liquidate liabilities existing at the end of the year. Expenditures are recognized when the related fund liability is incurred, except for items that are not expected to be liquidated with expendable available resources, such as debt service, the long-term portion of compensated absences payable, and claims and judgments. The State uses sixty days after fiscal year end as the availability criteria for the recognition of revenues in governmental funds. However, changes in fair value of investments are recognized as revenue immediately. For nonexchange transactions, revenues and expenditures and related assets and liabilities are recognized as required by GASB Statement No. 33, as amended by GASB Statement No. 65. For income taxes, general sales taxes, utility taxes, insurance premium taxes, general use taxes, gasoline taxes, motor fuels tax, electric public utility tax, and other derived nonexchange transactions, revenues are recognized when the underlying exchange has occurred and the resources are available. For property taxes, business privilege tax, and other imposed nonexchange transactions, receivables are recognized when an enforceable legal claim has arisen. Revenues are recognized when resources are required to be used or the first period that use is permitted and the resources are available. For property taxes, revenues are recognized if received within sixty days; otherwise, deferred inflows of resources are reported. For federal grants and other government mandated nonexchange revenues, assets, revenues, liabilities, and expenditures are recognized when all eligibility requirements have been met and (for revenues) resources are available. Deferred inflows of resources are reported until the revenue becomes available. For reimbursement-type federal grants, eligibility requirements are met when recipients incur allowable costs, not when those costs are submitted for reimbursement. Material accruals are for income taxes, general sales taxes, utility taxes, insurance premium taxes, general use taxes, gasoline taxes, motor fuels tax, electric public utilities tax, property taxes, business privilege tax, nursing facility tax, pharmaceutical services tax, federal grants, oil and gas royalties, investment sales receivables, and interest.
2. Financial Statement Presentation
Major Funds The State reports six major governmental funds. The General Fund is the State’s primary operating fund. It is used to account for and report all financial resources not accounted for and reported in another fund. The Education Trust Fund accounts for the revenues collected for the support, maintenance, and development of public education in Alabama. General sales and uses taxes, income taxes, and utilities taxes are the primary revenues restricted to this fund. The Alabama Trust Fund consists of income from the sale or lease of rights for offshore exploration and drilling for oil and gas off the Alabama coast. Investment income earned on the trust balance is used to support the General Fund, Forever Wild Land Trust, and a variety of capital projects and debt service. Medicaid accounts for the portion of the Medicaid program that is funded by Federal revenues and Medicaid provider taxes. The
STATE OF ALABAMA NOTES TO THE FINANCIAL STATEMENTS For the Fiscal Year Ended September 30, 2017
64
Public Road and Bridge Fund accounts for funds used to construct and maintain public highways. Revenues in the fund consist of federal revenues, gasoline taxes, and other motor fuel taxes. The Public Welfare Trust Fund accounts for the administration of a broad range of social and protective services programs that provide financial assistance to individuals. Revenues restricted to the fund include federal revenues, property taxes, and liquor and wine taxes. The State reports three major enterprise funds. The Unemployment Compensation Trust accounts for the activities of the federal unemployment insurance program including employer contributions, Federal Unemployment Trust advances, and benefit claims to the unemployed. The State Port Authority was created to engage in promoting, developing, constructing, maintaining, and operating harbors, seaports, and river ports within the State of Alabama. The Alcoholic Beverage Control Board was created to control alcoholic beverages through distribution, licensing, and enforcement.
Nonmajor Funds The State reports a number of nonmajor governmental funds, proprietary funds, and fiduciary funds. Governmental Fund Types: Special Revenue Funds account for the proceeds of specific revenue resources that are restricted or committed to specified purposes other than debt service or capital projects. Examples include public health, education, and corrections. Debt Service Funds account for financial resources that are restricted, committed or assigned to expenditures for governmental debt principal and interest. Capital Projects Funds account for financial resources that are restricted, committed, or assigned to expenditures for the acquisition, construction, and improvement of major general governmental capital assets. Permanent Funds account for resources that are legally restricted to the extent that only earnings, and not principal, may be used for purposes that benefit the government or its citizenry. Proprietary Fund Types: Enterprise Funds report the activities for which fees are charged to external users for goods or services such as health insurance. Internal Service Funds provide goods or services primarily to other agencies or funds of the State, rather than to the general public. Examples include information technology, telecommunications, office building rentals, and the State Motor Pool. In the government-wide statements, internal service funds are included with governmental activities. Eliminations have been made to minimize the double counting of internal activity, including internal service fund type activity on the government-wide financial statements. Fiduciary Fund Types: Pension and Other Employee Benefit Trust Funds account for resources that are restricted or held in trust for the members and beneficiaries of the State’s defined benefit pension plans, deferred compensation plans, individual retirement accounts, post-employment health care plans, and flexible employees’ benefit plans. The defined benefit pension plans include plans for state employees, state police, some city and county employees, teachers, judges, peace officers, and state dock employees. Private Purpose Trust Funds account for resources of all other trust arrangements in which principal and income benefit individuals, private organizations, or other governments. The State’s largest private purpose funds are education related for either college tuition benefits or local public schools. There are three endowment funds established by private citizens that the State manages as trustee for local school systems and reports as Local Education Endowments. Agency Funds report assets and liabilities for deposits and investments entrusted to the State as an agent for others. The State has agency funds that account for some taxes collected, payroll withholdings, child support payments, cash bonds, and other purposes.
D. Fiscal Year
The State fiscal year ends on September 30. One nonmajor component unit, the Alabama Space Science Exhibit Commission, has the power to set its own fiscal year (Code of Alabama 1975, Section 41-10-307, as amended). The Commission has set its fiscal year to end on the last Sunday in September. The difference in fiscal years has no material effect on the financial statements.
65
E. Assets, Liabilities, Deferred Outflows and Deferred Inflows, and Net Position and Fund Balances
1. Cash and Cash Equivalents Cash and Cash Equivalents, as reported on the financial statements (the government-wide and the fund financial statements), are under the control of the State Treasurer or other administrative bodies as determined by law. The cash in all funds operating from the State Treasury is pooled as treasury cash and invested by the State Treasurer. The State Treasurer has statutory authority to deposit treasury cash in any available bank product in any bank or savings association that is a qualified public depository and that has been designated as a state depository according to law, so long as the bank or savings association agrees to pay interest on the money. Also, the State Treasurer may invest in 1) bonds, notes, or treasury bills of the United States or in obligations of any agency or instrumentality of the United States of America, including but not limited to the Federal Land Bank, Federal Home Loan Bank, Federal National Mortgage Association, Federal Intermediate Credit Bank, banks for cooperatives, Resolution Trust Corporation, or any of its other agencies, or in any other obligations guaranteed as to principal and interest by the United States, or in money market mutual funds which invest solely in securities otherwise authorized by law; 2) obligations of the United States or its agencies under a repurchase agreement for a shorter time than the maturity date of the security itself; and 3) commercial paper with the highest quality credit rating at the time of purchase and in banker’s acceptances. All of the cash and investments in the State Treasury cash management pool are reported as cash and cash equivalents because the pool is used essentially as a demand deposit account. Commercial paper is reported as an investment regardless of the original maturity date. For funds operating outside the State Treasury, cash and cash equivalents generally include demand deposit accounts, petty cash accounts, and short-term, highly liquid investments with a maturity date of three months or less when purchased.
2. Receivables In the government-wide and governmental fund financial statements the largest receivables are amounts due from other governments. More than half is due from local governments, primarily for long term loans made by the Alabama Public School and College Authority. The rest consists of grants and reimbursements due from the federal government where collectability is reasonably assured. All receivables are recorded net of allowance for uncollectible accounts. The second largest receivables are taxes receivable, the largest of which are for income taxes, general sales taxes, utility taxes, insurance premium taxes, general use taxes, gasoline taxes, motor fuels taxes, oil and gas production privilege tax, and property taxes as required by GASB Statement 33. The property tax calendar for the State is simple. The levy date, the assessment date, and the lien date are all the same date – October 1. On October 1, the assessed value of all property is multiplied by the applicable rates to levy the property tax. On that date, the State has a lien (a legal claim) against the property. The property tax is not due until October 1 the following year. The property tax is paid in arrears between October 1 and December 31. After December 31, it is delinquent. The most significant Accounts Receivable are recorded in the Public Road and Bridge Fund for revenue earned on transportation projects and the Alabama Trust Fund for oil and gas royalties earned on natural gas produced in Alabama’s offshore waters. The primary government has minimal amounts of Notes and Loans Receivable; as such agreements would constitute an illegal extension of credit by the State for any fund operating from the State Treasury. Investment Sales Receivable consists of amounts receivable for investments sold but the transaction was not settled before year-end. For component units, the largest portion of Mortgages, Notes, and Loans Receivable consists of loans made by the Alabama Housing Finance Authority. The mortgage loans of the Authority are carried at their unpaid principal balances less an allowance for loan losses. Also included in this category are student loans owed to various State universities. The loans are reported net of an allowance for uncollectible loans. Due from Other Governments as reported for the component units consists almost entirely of amounts owed by local governments. Most of the amount consists of loans made to local governments by the Water Pollution Control and Drinking Water Finance Authorities. Accounts Receivable as reported for the component units are comprised primarily of amounts owed to State universities.
3. Interfund Activity and Balances Activity between funds that are representative of lending/borrowing arrangements outstanding at the end of the fiscal year are reported as either Due To Other Funds or Due From Other Funds. Any residual balances outstanding between the governmental activities and business-type activities are reported in the government-wide financial statements as Internal Balances. Receivables and payables involving fiduciary funds are presented as accounts payable or receivable on the government-wide Statement of Net Position. Eliminations have been made to minimize the double-counting of internal activity, including internal service fund type activity on the government-wide financial statements. However, interfund services, provided and used between different functions, have not been

STATE OF ALABAMA NOTES TO THE FINANCIAL STATEMENTS For the Fiscal Year Ended September 30, 2017
66
eliminated in order to avoid distorting the direct costs and program revenues of the applicable functions. Transfers between governmental and business-type activities are reported at the net amount on the government-wide financial statements. In the fund financial statements, transactions for services rendered by one fund to another are treated as revenues of the recipient fund and expenditures/expenses of the disbursing fund. Reimbursements of expenditures/expenses made by one fund for another are recorded as expenditures/expenses in the reimbursing fund and as a reduction of expenditures/expenses in the reimbursed fund. Transfers represent flows of assets between funds of the primary government without equivalent flows of assets in return and without a requirement for payment.
4. Inventories Inventories of supplies in governmental fund financial statements are reported at cost using the purchases method. An inventory asset account is reported on the balance sheet with an offset to Nonspendable Fund Balance. The consumption method is used on the proprietary funds financial statements and the government-wide financial statements. Inventories of materials and supplies on proprietary fund financial statements are determined by both physical counts and through perpetual inventory systems and are valued at the lower of cost or market. Valuation methods used on the government-wide, proprietary and governmental fund financial statements include first-in first-out, average cost, weighted average, and retail inventory method.
5. Investments Most investments are required to be measured at fair value per GASB Statement No.72, Fair Value Measurement and Application. Money market investments and participating interest-earning contracts that have a remaining maturity at the time of purchase of one year or less may be reported at amortized cost, provided that the fair value of those investments is not significantly affected by the impairment of the credit standing of the issuer or by other factors. Money market investments are short-term, highly liquid debt instruments including commercial paper, bankers’ acceptances, and U.S. Treasury and agency obligations. The other investments that are not reported at fair value are common stock using the equity method if the government has significant influence over the operating and financial policies of the investee, investments held by 2a7-like external investment pools, investments in 2a7-like pools measured at the NAV per share provided by the pool, nonparticipating interest-earning investment contracts, nonparticipating unallocated insurance contracts, synthetic guaranteed investment contracts that are fully benefit-responsive, and life insurance contracts.
6. Restricted Assets Assets required to be held and/or used as specified in bond covenants, other debt agreements, donor specifications, and court settlements have been recorded as "Restricted Assets." These assets consist primarily of cash and cash equivalents, U.S. Treasury obligations, certificates of deposit and mutual funds.
7. Capital Assets Capital assets, including buildings, land, equipment, intangibles, and infrastructure (e.g., roads and bridges), are reported in the applicable governmental or business-type activities columns in the government-wide financial statements. Most capital assets are defined by the State as having an initial cost of at least $15,000 and have initial useful lives extending beyond a single reporting period. Real Property must have an initial cost of at least $250,000. Software and other intangibles must have an initial cost of at least $1,000,000. Proprietary funds can set lower thresholds in accordance with business needs. Capitalized assets are recorded at historical cost or estimated historical cost if purchased or constructed. Donated capital assets are recorded at acquisition value at the date of donation. The cost of normal maintenance and repairs that do not add to the value of the asset or materially extend assets lives are not capitalized. Major outlays for capital assets and improvements are capitalized as projects are constructed. Capital assets are depreciated using the straight-line method over the following estimated useful lives: Assets Years Buildings 40 Improvements Other than Buildings 25 Equipment 5-12 Software 10 Land, infrastructure, construction in progress and historical artifacts are not depreciated. The State has elected to apply the modified approach to accounting for infrastructure (e.g., roadways, bridges, and tunnels). Under this approach, the infrastructure assets are not depreciated because the State is committed to maintaining the assets at a minimum condition level that the Department of Transportation (ALDOT) has determined to be adequate to meet the needs of the citizens. Costs for maintenance and preservation are expensed in the period incurred. Additions and improvements are capitalized. The ALDOT maintains an inventory of all infrastructure assets and performs regular condition assessments of those assets to establish that they are in fact being maintained at or above the condition level established. ALDOT also makes an annual estimate of the cost necessary to maintain and preserve those

67
infrastructure assets at the target condition level. The cost of infrastructure reported includes historical costs from 1980 to the present as required by GASB Statement No. 34 as well as historical costs preceding 1980. Extensive project documentation is required to meet various Federal and State guidelines concerning the construction of infrastructure. The completeness of this documentation affects the timing of project capitalization. The State capitalizes road and bridge infrastructure annually when all costs for a project are incurred and all project documentation is satisfactorily completed, filed and accepted with the appropriate entities. Projects that meet the cost and documentation criteria are closed and appropriate entries are made to adjust the Infrastructure Construction in Progress and Infrastructure asset accounts annually. Due to the documentation requirements, there can be substantial time lags between the date a project is put into service on the State’s roadway network and the date the project is capitalized. A significant portion of Infrastructure Construction in Progress consists of projects that have been put into service and maintenance costs could have been incurred.
8. Compensated Absences Employees in permanent positions accrue annual leave at a rate of four hours and twenty minutes to nine hours and forty-five minutes semi-monthly, depending upon their length of service. Upon separation from service, an eligible employee is paid for the actual number of annual leave days he has earned, up to a maximum of sixty days, with the amount being computed on the basis of his daily pay rate at time of separation multiplied by the number of days leave due. Sick leave is accrued at a rate of four hours and twenty minutes semi-monthly. Employees may accumulate up to a maximum of 150 days sick leave. Employees may be compensated for one-half of the maximum accrued sick leave only upon retirement from state service. Tier 1 employees must have twenty-five years of service or have attained the age of 60 and have at least ten years of service to be eligible to retire. Tier 2 employees must have attained the age of 62 and have at least ten years of service to be eligible to retire. Tier 1 State Troopers must have twenty-five years of service or have attained the age of 52 and have at least ten years of service to be eligible to retire. Tier 2 State Troopers must have attained the age of 56 and have at least 10 years of service to be eligible to retire. If a state employee in the classified service dies while in active service to the State, the estate of the deceased employee receives a payment of fifty percent of the accrued and unused sick leave, not to exceed 600 hours, which the employee was credited with at the time of his or her death. The monetary value of accumulated annual and sick leave payable upon termination or retirement is included in the government-wide statement of net position, proprietary fund financial statements, and fiduciary fund financial statements. In the governmental fund financial statements, amounts reported are for unused, matured leave amounts payable to employees whose employment was terminated by September 30. These amounts are paid to the employees during the first month after the end of the fiscal year so those actual payments were used to compute the amount payable. Amounts not payable from expendable available resources (long-term liabilities) are reported in the government-wide Statement of Net Position. The liability for compensated absences was computed using salary rates effective at fiscal year-end including the employer's share of social security and Medicare taxes payable and represents annual and sick leave earned up to the allowable ceilings. The sick leave is calculated separately for vested and non-vested employees. Sick leave is subjected to an actuarially determined probability multiplier that the employee will remain to retire and collect sick leave. The probability multipliers are as follows:
Vested Non-vested Public Education Employees 85.8% 47.8% State Employees 82.1 37.0
9. Long-Term Obligations Long-term debt is recognized as a liability in governmental fund financial statements when due, or when resources have been accumulated in the debt service fund for payment early in the following year. For other long-term obligations, only that portion expected to be financed from expendable available financial resources is reported as a liability in governmental fund financial statements. The remaining portion of such obligations is reported in the government-wide financial statements. Long-term liabilities expected to be financed from proprietary fund operations are accounted for in those funds in the proprietary fund financial statements.
10. Deferred Outflows and Deferred Inflows Deferred outflow of resources represents a consumption of net position that applies to a future period and so will not be recognized as an outflow of resources in the current period. Deferred inflow of resources represents an acquisition of net position that applies to a future period and so will not be recognized as an inflow of resources until then.
STATE OF ALABAMA NOTES TO THE FINANCIAL STATEMENTS For the Fiscal Year Ended September 30, 2017
68
11. Net Position and Fund Balances As discussed previously, net position on the government-wide financial statements and the proprietary fund financial statements are reported in three categories: (1) net investment in capital assets; (2) restricted net position; and (3) unrestricted net position. Fund balances reported in the governmental fund financial statements are classified as nonspendable, restricted, committed, assigned, or unassigned. Nonspendable fund balance includes amounts that cannot be spent because they are either 1) not in spendable form, such as inventory and long term receivables; or 2) legally and contractually required to be maintained intact, such as the principal of a permanent fund. Restricted fund balances have constraints placed on the use of the resources that are either 1) externally imposed by creditors, grantors, contributors, or laws of other governments or 2) imposed by law through constitutional provisions or enabling legislation. Committed fund balances include amounts constrained by formal action of the State’s highest decision-making authority. The authorization should have the consent of both the legislative and executive branches of government. Commitments may be changed or lifted only through an equivalent formal high level action. Commitments are not considered to be legally enforceable by an external party. External parties such as citizens or the judiciary can compel the State through legal action to honor restrictions but not commitments. The State does not have any policy or procedure for establishing committed fund balances and none are reported in these financial statements. Assigned fund balances are amounts that are constrained by the government’s intent to be used for specific purposes. Assigned fund balances include 1) all remaining non-negative amounts reported in governmental funds other than the General Fund and 2) amounts in the General Fund that are constrained by the State’s intent to be used for a specific purpose, but are neither restricted nor committed. Intent is expressed by the State legislature or by its delegation to a State official. The State Finance Department, under the legal authority of the State Finance Director, has established Fiscal Policies and Procedures which enable agency heads to establish assigned amounts. Unassigned fund balance is the residual classification and only the General Fund can report a positive unassigned fund balance. Negative unassigned fund balance can be reported in any governmental fund if expenditures incurred for specific purposes exceeded the amount restricted, committed or assigned to those purposes. When an expenditure is incurred for purposes for which both restricted and unrestricted fund balance is available, it is the State’s policy to spend unrestricted fund balance before restricted. Unrestricted fund balance is considered spent in the following order: unassigned, assigned, committed.
F. New Accounting Pronouncements
During the current fiscal year, the State implemented the following new accounting pronouncements: GASB Statement No. 73: Accounting and Financial Reporting for Pensions and Related Assets That Are Not within the
Scope of GASB Statement 68, and Amendments to Certain Provisions of GASB Statements 67 and 68 (the requirements of this Statement for pensions that are provided through pension plans that are not administered through trusts that meet the criteria in paragraph 4)
GASB Statement No. 74: Financial Reporting for Postemployment Benefit Plans Other Than Pension Plans GASB Statement No. 77: Tax Abatement Disclosures GASB Statement No. 78: Pensions Provided through Certain Multiple-Employer Defined Benefit Pension Plans GASB Statement No. 79: Certain External Investment Pools and Pool Participants (provisions in paragraphs 18, 19, 23-26,
and 40) GASB Statement No. 80: Blending Requirements for Certain Component Units – an amendment of GASB Statement No. 14 GASB Statement No. 82: Pension Issues – an amendment of GASB Statements No. 67, No. 68, and No. 73 (except for the
requirements of paragraph 7 in a circumstance in which an employer’s pension liability is measured as of a date other than the employer’s most recent fiscal year end)
NOTE 2 - TAX ABATEMENTS
As of September 30, 2017, the State participates in the following tax abatement programs: The Jobs Credit is intended to promote job creation in the State. Companies receiving the tax incentive must agree to a jobs commitment and minimum average wage commitment in a project agreement with the State. Pursuant to the Code of Alabama, Section 40-18-375, the jobs credit is equal to 3 percent of the previous year’s payroll for eligible employees for a maximum of 10 years. Also, additional incentives can be granted for the following: (a) 1 percent credit for companies locating in a targeted county (b) .5 percent credit for wages paid to veterans for companies employing at least 12 percent veterans, and (c) .5 percent credit for companies locating within a former active duty military base that was closed by the Base Realignment and Closure process.

69
forward up to 5 years. A company claiming more wages or jobs than paid or created is liable for the unearned portion of the jobs credit. No taxes were abated for fiscal year 2017 as a result of the Jobs Credit. The Investment Credit is intended to promote capital investment in the State. Pursuant to the Code of Alabama, Section 40-18-376, the investment credit is equal to 1.5 percent of the capital investment up to 10 years or up to 15 years for targeted counties. Taxpayers receiving the tax incentive must agree to a jobs commitment and minimum wage commitment in a project agreement with the State. Income taxes, financial institution excise taxes, insurance premium taxes, or utility taxes can be abated. Depending on the project agreement, the investment credit may be claimed as a credit against taxes actually paid and carried forward up to 5 years. Also, credits may be transferred, or sold, at 85 percent or more of face value for the first 3 years if approved by the Governor. No taxes were abated for fiscal year 2017 as a result of the Investment Credit. The Apprenticeship Alabama program is intended to ensure the advancement and expansion of registered apprenticeships in the State. Pursuant to the Code of Alabama, Section 40-18-422, the apprenticeship tax credit is equal to one thousand dollars for each apprentice up to a maximum of five. The employer must have a United States Department of Labor Registered Apprenticeship program in one of five industry sectors (advanced manufacturing, construction, healthcare, information technology, and transportation and logistics.) There are no penalties or claw back provisions. Income taxes or financial institution excise taxes can be abated. No taxes were abated for fiscal year 2017 as a result of the Apprenticeship Alabama program. The Certified Capital Company (CAPCO) program is intended to increase the amount of available venture capital for small technology businesses. Pursuant to the Code of Alabama, Section 40-14B, the CAPCO tax credit is equal to 100 percent of the investment in a CAPCO. Up to 5 percent may be taken each year through 2013 and up to 17.5 percent credit may be taken each year thereafter until the credits equal 100 percent of the investor’s capital. The qualifying activities of the business must be manufacturing, processing, assembling products, or conducting research and development. Failure to meet the requirements could result in decertification and result in recapture of credits claimed and forfeiture of future credits. Insurance premium tax can be abated for insurance companies who invest on a CAPCO. The amount of abated taxes for fiscal year 2017 is $16,226,000 as a result of the CAPCO program. The Enterprise Zone program is intended to stimulate business and industrial growth in depressed areas of the State both urban and rural. Pursuant to the Code of Alabama, Section 41-23-24, a tax credit of $2,500 per new permanent employee can be claimed. Also, pursuant to the Code of Alabama, Section 41-23-30, sales and use taxes for construction and equipment, income taxes for 5 years, and business privilege taxes for 5 years can be abated. No taxes were abated for fiscal year 2017 for the Enterprise Zone program. The Film Incentive is intended to attract investment for qualified productions and qualified production companies, and increase employment opportunities. Pursuant to the Code of Alabama, Section 41-7A-3, a rebate of 25 percent of all state certified expenditures and 35 percent of all payroll can be claimed, and exemptions from sales, use and lodgings taxes. Income taxes can be abated for qualified production companies. The total amount of abated taxes for fiscal year 2017 is $4,745,000 as a result of the Film Incentive. The Growing Alabama Credit is intended to promote growth of business, industry and economic development in the State. Pursuant to the Code of Alabama, Section 40-18-403, a credit equal to contributions to a local economic development organization can be claimed. Income taxes can be abated. The amount of abated taxes for fiscal year 2017 is $6,619,000 as a result of the Growing Alabama Credit. The Historic Rehabilitation Tax Credit Program is intended to promote the rehabilitation, preservation, and development of historic structures in the State. Pursuant to the Code of Alabama, Section 40-9F-4, a 25 percent credit of qualified rehabilitation expenditures can be claimed. Income taxes or financial institution excise taxes can be abated. The amount of abated taxes for fiscal year 2017 is $2,929,000 as a result of the Historic Rehabilitation Tax Credit Program. The New Markets Tax Credit is intended to promote investments in qualifying businesses in impoverished and low income communities. Pursuant to the Code of Alabama, Section 41-9-218, the tax incentive is equal to 50 percent of the investment. The taxpayer must make a Qualified Equity Investment in the qualified community development entity which must be certified under the Federal New Market Tax Credit program. Income taxes, insurance premium tax or financial institution excise taxes can be abated. The amount of abated taxes for fiscal year 2017 is $16,626,000 as a result of the New Markets Tax Credit. The Port Credit is intended to promote increased usage of the State’s ports. Pursuant to the Code of Alabama, Section 40-18-403, the credit is $50 per twenty-foot equivalent unit (TEU), $3 per net ton of bulk cargo or $0.04 per net kilogram for air cargo. New distribution or warehouse shippers investing at least $20 million and creating at least 75 net new jobs can be eligible to receive up to
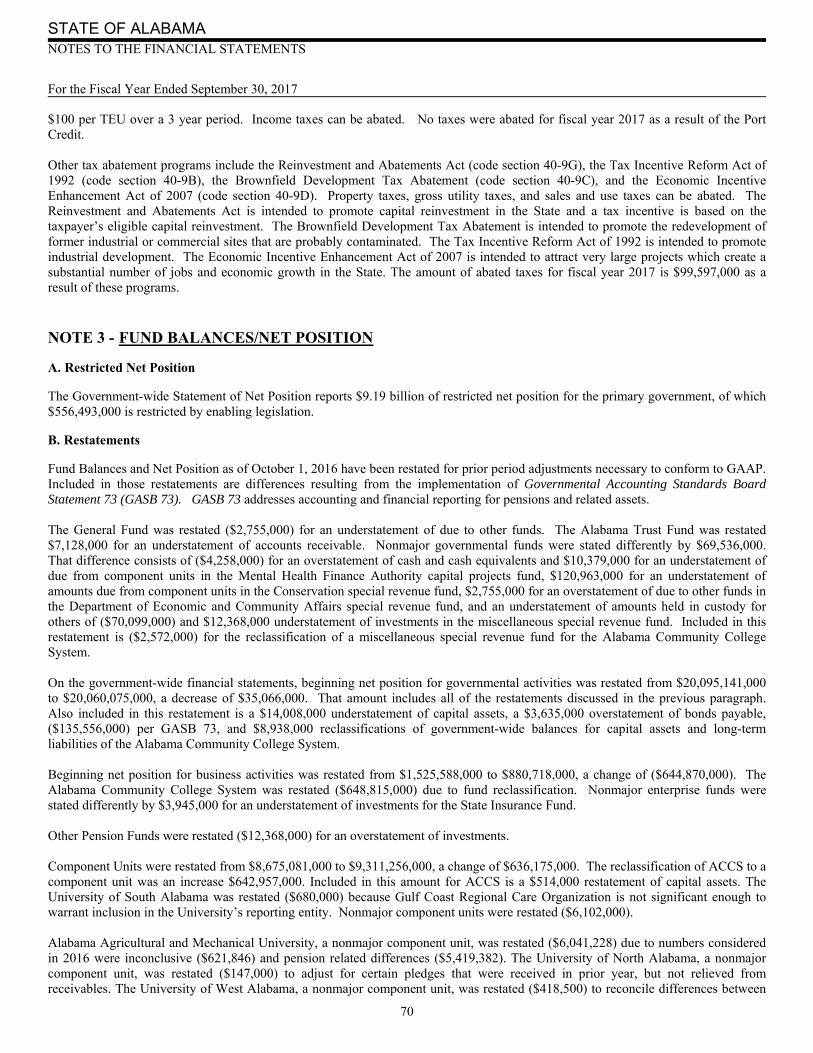
STATE OF ALABAMA NOTES TO THE FINANCIAL STATEMENTS For the Fiscal Year Ended September 30, 2017
70
$100 per TEU over a 3 year period. Income taxes can be abated. No taxes were abated for fiscal year 2017 as a result of the Port Credit. Other tax abatement programs include the Reinvestment and Abatements Act (code section 40-9G), the Tax Incentive Reform Act of 1992 (code section 40-9B), the Brownfield Development Tax Abatement (code section 40-9C), and the Economic Incentive Enhancement Act of 2007 (code section 40-9D). Property taxes, gross utility taxes, and sales and use taxes can be abated. The Reinvestment and Abatements Act is intended to promote capital reinvestment in the State and a tax incentive is based on the taxpayer’s eligible capital reinvestment. The Brownfield Development Tax Abatement is intended to promote the redevelopment of former industrial or commercial sites that are probably contaminated. The Tax Incentive Reform Act of 1992 is intended to promote industrial development. The Economic Incentive Enhancement Act of 2007 is intended to attract very large projects which create a substantial number of jobs and economic growth in the State. The amount of abated taxes for fiscal year 2017 is $99,597,000 as a result of these programs.
NOTE 3 - FUND BALANCES/NET POSITION
A. Restricted Net Position
The Government-wide Statement of Net Position reports $9.19 billion of restricted net position for the primary government, of which $556,493,000 is restricted by enabling legislation.
B. Restatements
Fund Balances and Net Position as of October 1, 2016 have been restated for prior period adjustments necessary to conform to GAAP. Included in those restatements are differences resulting from the implementation of Governmental Accounting Standards Board Statement 73 (GASB 73). GASB 73 addresses accounting and financial reporting for pensions and related assets. The General Fund was restated ($2,755,000) for an understatement of due to other funds. The Alabama Trust Fund was restated $7,128,000 for an understatement of accounts receivable. Nonmajor governmental funds were stated differently by $69,536,000. That difference consists of ($4,258,000) for an overstatement of cash and cash equivalents and $10,379,000 for an understatement of due from component units in the Mental Health Finance Authority capital projects fund, $120,963,000 for an understatement of amounts due from component units in the Conservation special revenue fund, $2,755,000 for an overstatement of due to other funds in the Department of Economic and Community Affairs special revenue fund, and an understatement of amounts held in custody for others of ($70,099,000) and $12,368,000 understatement of investments in the miscellaneous special revenue fund. Included in this restatement is ($2,572,000) for the reclassification of a miscellaneous special revenue fund for the Alabama Community College System. On the government-wide financial statements, beginning net position for governmental activities was restated from $20,095,141,000 to $20,060,075,000, a decrease of $35,066,000. That amount includes all of the restatements discussed in the previous paragraph. Also included in this restatement is a $14,008,000 understatement of capital assets, a $3,635,000 overstatement of bonds payable, ($135,556,000) per GASB 73, and $8,938,000 reclassifications of government-wide balances for capital assets and long-term liabilities of the Alabama Community College System. Beginning net position for business activities was restated from $1,525,588,000 to $880,718,000, a change of ($644,870,000). The Alabama Community College System was restated ($648,815,000) due to fund reclassification. Nonmajor enterprise funds were stated differently by $3,945,000 for an understatement of investments for the State Insurance Fund. Other Pension Funds were restated ($12,368,000) for an overstatement of investments. Component Units were restated from $8,675,081,000 to $9,311,256,000, a change of $636,175,000. The reclassification of ACCS to a component unit was an increase $642,957,000. Included in this amount for ACCS is a $514,000 restatement of capital assets. The University of South Alabama was restated ($680,000) because Gulf Coast Regional Care Organization is not significant enough to warrant inclusion in the University’s reporting entity. Nonmajor component units were restated ($6,102,000). Alabama Agricultural and Mechanical University, a nonmajor component unit, was restated ($6,041,228) due to numbers considered in 2016 were inconclusive ($621,846) and pension related differences ($5,419,382). The University of North Alabama, a nonmajor component unit, was restated ($147,000) to adjust for certain pledges that were received in prior year, but not relieved from receivables. The University of West Alabama, a nonmajor component unit, was restated ($418,500) to reconcile differences between
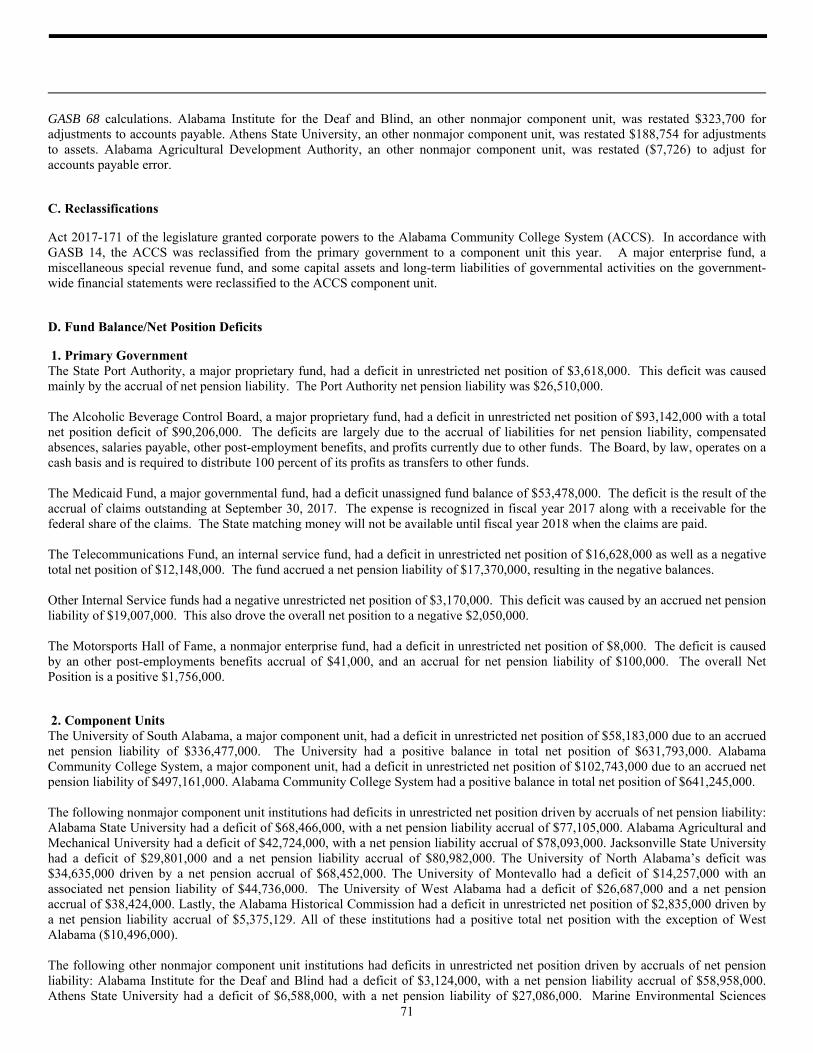
71
GASB 68 calculations. Alabama Institute for the Deaf and Blind, an other nonmajor component unit, was restated $323,700 for adjustments to accounts payable. Athens State University, an other nonmajor component unit, was restated $188,754 for adjustments to assets. Alabama Agricultural Development Authority, an other nonmajor component unit, was restated ($7,726) to adjust for accounts payable error.
C. Reclassifications
Act 2017-171 of the legislature granted corporate powers to the Alabama Community College System (ACCS). In accordance with GASB 14, the ACCS was reclassified from the primary government to a component unit this year. A major enterprise fund, a miscellaneous special revenue fund, and some capital assets and long-term liabilities of governmental activities on the government-wide financial statements were reclassified to the ACCS component unit.
D. Fund Balance/Net Position Deficits
1. Primary Government The State Port Authority, a major proprietary fund, had a deficit in unrestricted net position of $3,618,000. This deficit was caused mainly by the accrual of net pension liability. The Port Authority net pension liability was $26,510,000. The Alcoholic Beverage Control Board, a major proprietary fund, had a deficit in unrestricted net position of $93,142,000 with a total net position deficit of $90,206,000. The deficits are largely due to the accrual of liabilities for net pension liability, compensated absences, salaries payable, other post-employment benefits, and profits currently due to other funds. The Board, by law, operates on a cash basis and is required to distribute 100 percent of its profits as transfers to other funds. The Medicaid Fund, a major governmental fund, had a deficit unassigned fund balance of $53,478,000. The deficit is the result of the accrual of claims outstanding at September 30, 2017. The expense is recognized in fiscal year 2017 along with a receivable for the federal share of the claims. The State matching money will not be available until fiscal year 2018 when the claims are paid. The Telecommunications Fund, an internal service fund, had a deficit in unrestricted net position of $16,628,000 as well as a negative total net position of $12,148,000. The fund accrued a net pension liability of $17,370,000, resulting in the negative balances. Other Internal Service funds had a negative unrestricted net position of $3,170,000. This deficit was caused by an accrued net pension liability of $19,007,000. This also drove the overall net position to a negative $2,050,000. The Motorsports Hall of Fame, a nonmajor enterprise fund, had a deficit in unrestricted net position of $8,000. The deficit is caused by an other post-employments benefits accrual of $41,000, and an accrual for net pension liability of $100,000. The overall Net Position is a positive $1,756,000.
2. Component Units The University of South Alabama, a major component unit, had a deficit in unrestricted net position of $58,183,000 due to an accrued net pension liability of $336,477,000. The University had a positive balance in total net position of $631,793,000. Alabama Community College System, a major component unit, had a deficit in unrestricted net position of $102,743,000 due to an accrued net pension liability of $497,161,000. Alabama Community College System had a positive balance in total net position of $641,245,000. The following nonmajor component unit institutions had deficits in unrestricted net position driven by accruals of net pension liability: Alabama State University had a deficit of $68,466,000, with a net pension liability accrual of $77,105,000. Alabama Agricultural and Mechanical University had a deficit of $42,724,000, with a net pension liability accrual of $78,093,000. Jacksonville State University had a deficit of $29,801,000 and a net pension liability accrual of $80,982,000. The University of North Alabama’s deficit was $34,635,000 driven by a net pension accrual of $68,452,000. The University of Montevallo had a deficit of $14,257,000 with an associated net pension liability of $44,736,000. The University of West Alabama had a deficit of $26,687,000 and a net pension accrual of $38,424,000. Lastly, the Alabama Historical Commission had a deficit in unrestricted net position of $2,835,000 driven by a net pension liability accrual of $5,375,129. All of these institutions had a positive total net position with the exception of West Alabama ($10,496,000). The following other nonmajor component unit institutions had deficits in unrestricted net position driven by accruals of net pension liability: Alabama Institute for the Deaf and Blind had a deficit of $3,124,000, with a net pension liability accrual of $58,958,000. Athens State University had a deficit of $6,588,000, with a net pension liability of $27,086,000. Marine Environmental Sciences

STATE OF ALABAMA NOTES TO THE FINANCIAL STATEMENTS For the Fiscal Year Ended September 30, 2017
72
Consortium’s deficit was $4,795,000, and their net pension liability was $7,422,000. All of these institutions had positive total net positions. The Space and Science Exhibit Commission, an other nonmajor component unit, had a deficit in unrestricted net position of $9,023,000. The main factor leading to the negative balance is the Commission’s large liability for revenue bonds payable of $9,444,281. The Commission has a positive total net position of $29,998,000. The Historic Ironworks Commission, an other nonmajor component unit, had a deficit in unrestricted net position of $1,218,000 with a net pension liability accrual of $1,001,946. However, the fund had a positive balance in overall net position of $1,300,000.
E. Governmental Fund Restricted Fund Balances
(Amounts in Thousands)
F. Education Trust Fund Budget Stabilization Fund
The Rolling Reserve Act (Act 2011-003, as amended by Act 2015-538) created an Education Trust Fund Budget Stabilization Fund. This fund will generally be used to reduce any future proration in the Education Trust Fund (ETF). The Education Trust Fund Rainy Day Account within the Alabama Trust Fund has been repaid in full; therefore, the ETF Budget Stabilization Fund and the ETF Advancement and Technology Fund receive money when the ETF has revenues in excess of an appropriation cap defined in the Act. The cap is the sum of recurring revenues deposited into the ETF in the last completed fiscal year preceding the calculation year adjusted up or down by: (1) the average annual percentage change in recurring revenues for the 14 highest of the 15 completed fiscal years preceding the date on which the calculation is made; (2) if legislation is enacted that will increase recurring revenues deposited into the ETF, an amount equal to 95 percent of the fiscal note attached to the legislative act is added to the cap; (3) if legislation is enacted that will decrease recurring revenues deposited into the ETF, the negative impact, based on the enacted fiscal note is subtracted from the cap; (4) any nonrecurring revenue; and (5) the amount required to be appropriated from the ETF to the Prepaid Affordable College Tuition Trust Fund. The Finance Director and the Legislative Fiscal Officer must certify their computation of the cap at the same time as the certification required by Amendment 803 to the Constitution of Alabama of 1901 (prior to the third day of
Economic Development and Regulation Social ServicesEconomic Development Incentives 68,201$ Department of Human Resources 45,960 Economic Regulation Programs 68,237 Rehabilitation Services 23,830 Total Economic Development and Regulation 136,438 Veterans 142,489
Education and Cultural Resources Employment Security 22,620 Alabama Public School and College Authority 77,882 Other 10,778 Local Schools 129,275 Total Social Services 245,677 Industrial Training 61,987 Protection of Persons and PropertyEducation Budget Stabilization 400,639 Professional and Occupational Licensing 58,917 Education Trust Fund 178,752 Law Enforcement and Investigations 78,738 Other 23,022 Agricultural Products Oversight 32,389 Total Education and Cultural Resources 871,557 Mine Reclamation 9,076
Natural Resources and Recreation Youth Services 21,191 Department of Conservation 133,501 911 Service 16,740 Forever Wild Land Trust 19,118 Other 58,876 Forever Wild Stewardship 33,692 Protection of Persons and Property 275,927 Other 5,290 Transportation Total Natural Resources and Recreation 191,601 State Roads and Bridges 556,995
Health Local Government Transportation Programs 310 Health Department 56,824 Airfields 15,526 Medicaid 120,344 Total Transportation 572,831 Mental Health 80,356 General GovernmentEnvironmental Management 47,016 County and Municipal Capital Improvements 493,259 Other 5,599 Judicial System 25,198 Total Health 310,139 Local Government Programs 83,213
Financial Administration 68,814 Other 49,388 Total General Government 719,872

73
each Regular Session). The Legislature may appropriate from the ETF Budget Stabilization Fund an amount equal to the difference between the preceding fiscal year’s total appropriations from the ETF and the cap. Except as provided in the previous sentence, amounts in the ETF Budget Stabilization Fund may be withdrawn only to prevent proration in the ETF. The Governor must certify to the State Comptroller and notify the Legislature that proration would occur in the ETF before funds may be withdrawn. The ETF Budget Stabilization Fund has a balance of $178 million at the end of fiscal year 2017.
NOTE 4 - ASSETS
A. Cash Deposits
The State Treasurer has statutory authority to deposit treasury cash in any available bank product in any bank or savings association that is a qualified public depository and that has been designated as a state depository according to law. Bank deposits of both the primary government and its component units are entirely insured by Federal depository insurance or protected under the Security for Alabama Funds Enhancement (SAFE) Program. The Code of Alabama 1975, as amended, requires all State organizations, including component units, to deposit monies in a bank that participates in the SAFE Program. The SAFE Program is a multiple financial institution collateral pool administered by the State Treasurer. Each qualified public depository is required to pledge collateral in accordance with the rules established by the SAFE Board of Directors. In the event that a qualified public depository defaults or becomes insolvent and the pledged collateral is insufficient to satisfy the claims of public depositors, the Code of Alabama 1975, Section 41-14A-9(3) authorizes the State Treasurer to make assessments against the other qualified public depositories in the pool so that there will be no loss of public funds. Also, all other public funds not managed by the State Treasurer are required to be deposited in a qualified public depository or placed through a qualified public depository which arranges for the funds to be deposited in federally insured banks or savings associations so that the funds and accrued interest earned on them are fully insured by the Federal Deposit Insurance Corporation and, at the same time, the qualified public depository receives or is credited with deposits from other banks or savings associations in an amount equal to or greater than the amount it arranged to be deposited in other banks and savings associations.
B. Investments
Investments are made in accordance with the statutes creating the various agencies of the State of Alabama. The following describes the investments made by the major investing agencies of the State:
1. Primary Government State Treasurer - The State Treasurer may legally invest state funds in 1) bonds, notes, or treasury bills of the United States or in obligations of any agency or instrumentality of the United States of America, including but not limited to the Federal Land Bank, Federal Home Loan Bank, Federal National Mortgage Association, Federal Intermediate Credit Bank, banks for cooperatives, Resolution Trust Corporation, or any of its other agencies, or in any other obligations guaranteed as to principal and interest by the United States, or in money market mutual funds which invest solely in securities otherwise authorized by law; 2) obligations of the United States or its agencies under a repurchase agreement for a shorter time than the maturity date of the security itself; 3) commercial paper with the highest quality credit rating at the time of purchase and in bankers’ acceptances; 4) money market mutual funds which invest solely in securities noted above; 5) direct obligations of the State of Israel; and 6) interest earning bank deposits. Alabama Trust Fund – Investments are limited to those authorized by law for the Retirement Systems of Alabama. The investments authorized for the Retirement Systems are described later in this section. Prepaid Affordable College Tuition (PACT) Program - The State is responsible for the management of the investments of the PACT program, although the investments are not property of the State. The funds may be invested in any instrument, obligation, security or property that constitutes legal investments for investment of public funds in the State, including legal investments of the State Treasurer and the Alabama Trust Fund that are deemed most appropriate by the PACT Board. Alabama College Education Savings (ACES) Plan – The Board of Trustees administers the program. The Board of Trustees has entered into a contract with UBT 529 Fund Services (Union Bank), a division of Union Bank and Trust Company. Union Bank is the Program Manager and the Board of Trustees has delegated day to day administration to the State Treasurer. The investment alternatives are made available through investment portfolios each of which represents a separate, segregated portfolio of investments in mutual funds.
STATE OF ALABAMA NOTES TO THE FINANCIAL STATEMENTS For the Fiscal Year Ended September 30, 2017
74
2. Fiduciary Funds Retirement Systems of Alabama (RSA) - The RSA administers the Teachers’ Retirement System (TRS), Employees’ Retirement System (ERS), and Judicial Retirement Fund (JRF). RSA may invest in any types of investments that the Board of Control of each individual system approves. Each Board is limited only by the "Prudent Person Rule" which requires it to use due care, skill, prudence, and diligence under the prevailing circumstances that a prudent person acting in a like capacity and familiar with such matters would use in investing. Deferred Compensation Plan (RSA-1) – A deferred compensation plan is administered by the Retirement Systems of Alabama (RSA). The plan is named the Public Employees' Individual Retirement Account/Deferred Compensation Plan, and is commonly referred to as RSA-1. By law, RSA-1 investments are made under the same rules, regulations, conditions, and guidelines governing the RSA.
3. Component Units Alabama Housing Finance Authority - The Authority is authorized to invest in bonds or other obligations issued or guaranteed by the U.S. Government, or any agency thereof, or the State of Alabama. In addition, the Authority may invest in interest-bearing bank and savings and loan association deposits, any obligations in which a State-chartered savings and loan association may invest its funds, any agreement to repurchase any of the foregoing, or any combination thereof. Each of the trust indentures established under the Authority's mortgage revenue bond programs contain further restrictions on the investment of non-expended bond proceeds; however, each trust indenture must be consistent with the Authority's authorizing legislation with respect to the definition of eligible investments. The Authority's program investments consist of Government National Mortgage Association (GNMA) or Federal National Mortgage Association (FNMA) pass-through certificates, all of which are pledged as security for the mortgage revenue bonds. Other investments include temporary and debt service reserve funds established under the provisions of various trust indentures, and investments of the Authority's general and housing assistance funds. Investments Made by Colleges and Universities - The colleges and universities invest funds in accordance with the applicable limits set forth in the gift instruments, Board of Trustees guidelines, or other applicable laws. Certain bond indentures require that the bond funds invest all amounts in federal securities or eligible certificates. In accordance with GASB Statement No. 31, most investments are stated at fair value.

75
The State’s investments at September 30, 2017, are as follows:
C. Investment Risks
1. Credit Risk Credit risk is the risk that an issuer or other counterparty to an investment will not fulfill its obligations. Nationally recognized statistical rating organizations provide ratings of debt securities quality based on a variety of factors, such as the financial condition of the issuers, which provide investors with some idea of the issuer’s ability to meet its obligations.
Fiduciary Funds Discretely
Governmental Business-Type (including Fiduciary Presented Investment Types Activities Activities Component Units) Component Units
U S Treasury Strips 24,403$ 11,451$ -$ -$
U S Government Guaranteed Securities 873,752 9,340 1,779,386 761,217
U S Agency Securities 379,276 6,527 378,923 863,666
State and Local Government Securities 3,864 177 - 20,242
Mortgage Backed Securities 347,633 1,296 1,107,888 386,164
Commercial Paper 30,073 60 928,837 37,989
Corporate Bonds 366,332 16,151 2,437,899 265,353
Private Placements 109,178 - 2,166,954 358,878
Repurchase Agreements 50,790 - - -
International Bonds 26,615 52 232 70,003
Bond Mutual Funds 729,132 47,440 1,317,353 1,121,042
Domestic Equities 1,432,242 30,707 22,615,542 420,575
International Equities 639,284 - 4,989,937 85,567
Other Mutual Funds 75,591 - 1,178,029 591,360
Real Estate 275,985 8,110 3,569,182 153,464
Commingled Funds 89,985 - - 2,516,924
Derivative Instruments 626 - - -
Guaranteed Investment Contracts - - 236,393 -
5,454,761$ 131,311$ 42,706,555$ 7,652,444$
Reconciliation to the Government-wide Statement of Net Position and Statement of Fiduciary Net Position
Investments Per Investment Note 5,454,761$ 131,311$ 42,706,555$ 7,652,444$
Certificates of Deposit † 27,123 32,420 692 84,573
Money Market Accounts - Savings † 317,330 1,243 18,932 203,461
Other Cash Equivalents † (621,405) (14,321) (64,198) (113,491)
Investments Classified as Restricted Assets † (1,319) - - -
Repurchase Agreements †† (50,790) - - - Foundations and pooled investments § - - - 521,861
Investments per Statements 5,125,700$ 150,653$ 42,661,981$ 8,348,848$
† Investment types not required to be presented in the investment credit note.
†† Short-term repurchase agreements are included as cash equivalents; however, these investments are subject to investment risk disclosures.
§ University foundations follow the investment reporting requirements of the FASB and are not subject to GASB disclosure requirements. For this reason some of the investment information is not available. Also, investments of affiliated entities are included in an investment pool. The investment information that is available is being disclosed.
Investment Types and Fair Value
(Amounts in Thousands)
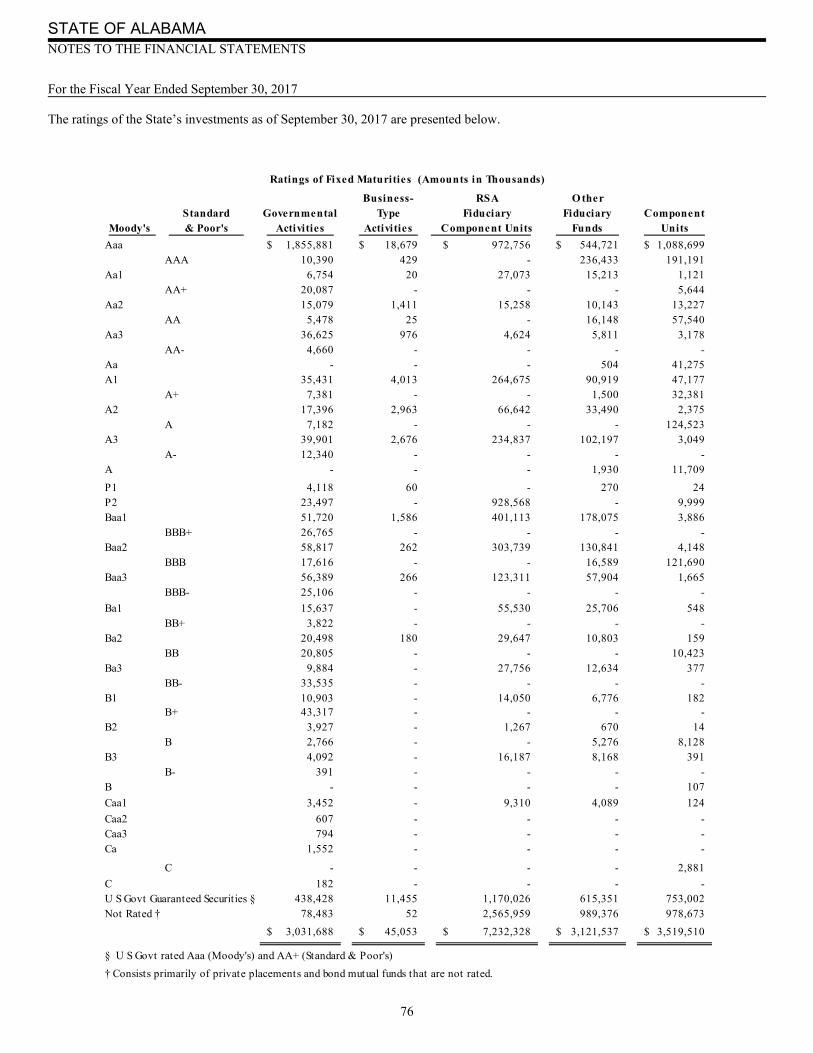
STATE OF ALABAMA NOTES TO THE FINANCIAL STATEMENTS For the Fiscal Year Ended September 30, 2017
76
The ratings of the State’s investments as of September 30, 2017 are presented below.
Business- RSA O therStandard Governmental Type Fiduciary Fiduciary Component
Moody's & Poor's Activities Activities Component Units Funds Units
Aaa 1,855,881$ 18,679$ 972,756$ 544,721$ 1,088,699$ AAA 10,390 429 - 236,433 191,191
Aa1 6,754 20 27,073 15,213 1,121 AA+ 20,087 - - - 5,644
Aa2 15,079 1,411 15,258 10,143 13,227 AA 5,478 25 - 16,148 57,540
Aa3 36,625 976 4,624 5,811 3,178 AA- 4,660 - - - -
Aa - - - 504 41,275 A1 35,431 4,013 264,675 90,919 47,177
A+ 7,381 - - 1,500 32,381 A2 17,396 2,963 66,642 33,490 2,375
A 7,182 - - - 124,523 A3 39,901 2,676 234,837 102,197 3,049
A- 12,340 - - - - A - - - 1,930 11,709
P1 4,118 60 - 270 24 P2 23,497 - 928,568 - 9,999 Baa1 51,720 1,586 401,113 178,075 3,886
BBB+ 26,765 - - - - Baa2 58,817 262 303,739 130,841 4,148
BBB 17,616 - - 16,589 121,690 Baa3 56,389 266 123,311 57,904 1,665
BBB- 25,106 - - - -
Ba1 15,637 - 55,530 25,706 548 BB+ 3,822 - - - -
Ba2 20,498 180 29,647 10,803 159 BB 20,805 - - - 10,423
Ba3 9,884 - 27,756 12,634 377 BB- 33,535 - - - -
B1 10,903 - 14,050 6,776 182 B+ 43,317 - - - -
B2 3,927 - 1,267 670 14 B 2,766 - - 5,276 8,128
B3 4,092 - 16,187 8,168 391 B- 391 - - - -
B - - - - 107
Caa1 3,452 - 9,310 4,089 124
Caa2 607 - - - - Caa3 794 - - - - Ca 1,552 - - - -
C - - - - 2,881
C 182 - - - - U S Govt Guaranteed Securities § 438,428 11,455 1,170,026 615,351 753,002 Not Rated † 78,483 52 2,565,959 989,376 978,673
3,031,688$ 45,053$ 7,232,328$ 3,121,537$ 3,519,510$
§ U S Govt rated Aaa (Moody's) and AA+ (Standard & Poor's)
† Consists primarily of private placements and bond mutual funds that are not rated.
Ratings of Fixed Maturities (Amounts in Thousands)

77
The investments allowed for Treasury monies are U.S. government or agency securities, repurchase agreements backed by U.S government or U.S. government agency securities, or mutual funds investing in U.S government or U.S. government agency securities. The U.S. government and U.S. government agency securities are rated Aaa or AA+. Bond mutual funds may or may not be rated. Bank of Israel bonds are not rated. As mentioned earlier the investments of the Alabama Trust Fund are limited to those authorized for the Retirement Systems of Alabama. Domestic fixed-maturity investments may consist of rated or non-rated securities. International fixed-maturity investments may consist of securities with a rating of at least A by one of the principal rating agencies at the time of purchase or acquisition, except that up to 2 percent of the fair value of each System’s total portfolio may be invested in obligations of sovereign countries with a rating of BBB or BAA at the time of purchase. The Systems may hedge against the possible adverse effects of currency fluctuations on each System’s portfolio of international fixed income obligations when it is considered appropriate. Short-term investments may consist of commercial paper rated at least A-2 and/or P-2, repurchase agreements, short-term U.S. securities, and other money market investments.
2. Interest Rate Risk Interest rate risk is the risk that changes in interest rates of debt investments will adversely affect the fair value of those investments. The Treasurer’s Office investment guidelines state that the maximum effective maturity of any purchase will be five years. Market accepted average life at time of purchase shall be used in lieu of final maturity for the purpose of maturity acceptability of mortgage-backed securities. Average effective duration should be plus or minus 30 percent of the index duration. The majority of the portfolio is benchmarked against the Barclays Capital 1 - 3 Year Government Index. The fair value of fixed-maturity investments fluctuate in response to changes in market interest rates. Increases in prevailing interest rates generally translate into decreases in fair value of those instruments. The fair value of interest sensitive instruments may also be affected by the creditworthiness of the issuer, prepayment options, relative values of alternative investments, and other general market conditions. Certain fixed maturity investments have call provisions that could result in shorter maturity periods. The investment policy of the Alabama Trust Fund states that the fixed income portfolio’s average duration is not to exceed 1.5 times that of the benchmark index. As of September 30, 2017, the State had the following investments and maturities:
Less More TotalInvestment Type Than 1 1-5 6-10 Than 10 Fair Value
U S Treasury Strips 15,147$ 4,420$ 4,837$ -$ 24,404$ U S Government Guaranteed Securities 107,232 570,336 78,099 118,085 873,752 U S Agency Securities 20,035 287,133 5,181 66,928 379,277 State and Local Government Securities 436 1,254 477 1,697 3,864 Mortgage Backed Securities 288 18,614 31,774 296,958 347,634 Commercial Paper 30,073 - - - 30,073 Corporate Bonds 25,345 116,236 134,341 90,410 366,332 Derivative Instruments (292) 194 477 244 623 Repurchase Agreements 50,790 - - - 50,790 International Bonds 896 9,205 7,934 8,579 26,614 Private Placements 871 17,489 32,985 57,834 109,179
Bond Mutual Funds 717,743 11,419 - - 729,162
Commingled Funds - 19,475 54,472 16,037 89,984 Total 968,564$ 1,055,775$ 350,577$ 656,772$ 3,031,688$
Governmental Activities(Amounts in Thousands)
Maturity in Years at Fair Value

STATE OF ALABAMA NOTES TO THE FINANCIAL STATEMENTS For the Fiscal Year Ended September 30, 2017
78
Less More Total
Investment Type Than 1 1-5 6-10 Than 10 Fair Value
U S Treasury Strips 2,912$ 8,538$ -$ -$ 11,450$
U S Government Guaranteed Securities 1,661 7,679 - - 9,340
U S Agency Securities 1,166 5,166 195 - 6,527
State and Local Government Securities - 50 96 31 177
Mortgage Backed Securities 1 72 370 854 1,297
Commercial Paper 60 - - - 60
International Bonds 17 34 - - 51
Corporate Bonds 3,391 12,542 218 - 16,151
Total 9,208$ 34,081$ 879$ 885$ 45,053$
Business-Type Activities
(Amounts in Thousands)
Maturity in Years at Fair Value
Less More Total
Investment Type Than 1 1-5 6-10 Than 10 Fair Value
U S Government Guaranteed Securities -$ 521,710$ 458,336$ 150,932$ 1,130,978$
U S Agency Securities 25,968 137,567 77,453 - 240,988
Mortgage Backed Securities 10,280 440 47,780 685,776 744,276
Commercial Paper 928,567 - - - 928,567 Corporate Bonds 212,405 530,161 404,853 506,941 1,654,360 Private Placements - 297,175 631,449 1,231,853 2,160,477 International Bonds 372,682 - - - 372,682
Total 1,549,902$ 1,487,053$ 1,619,871$ 2,575,502$ 7,232,328$
Maturity in Years at Fair Value
Retirement Systems of Alabama
(Fiduciary Component Units)
(Amounts in Thousands)
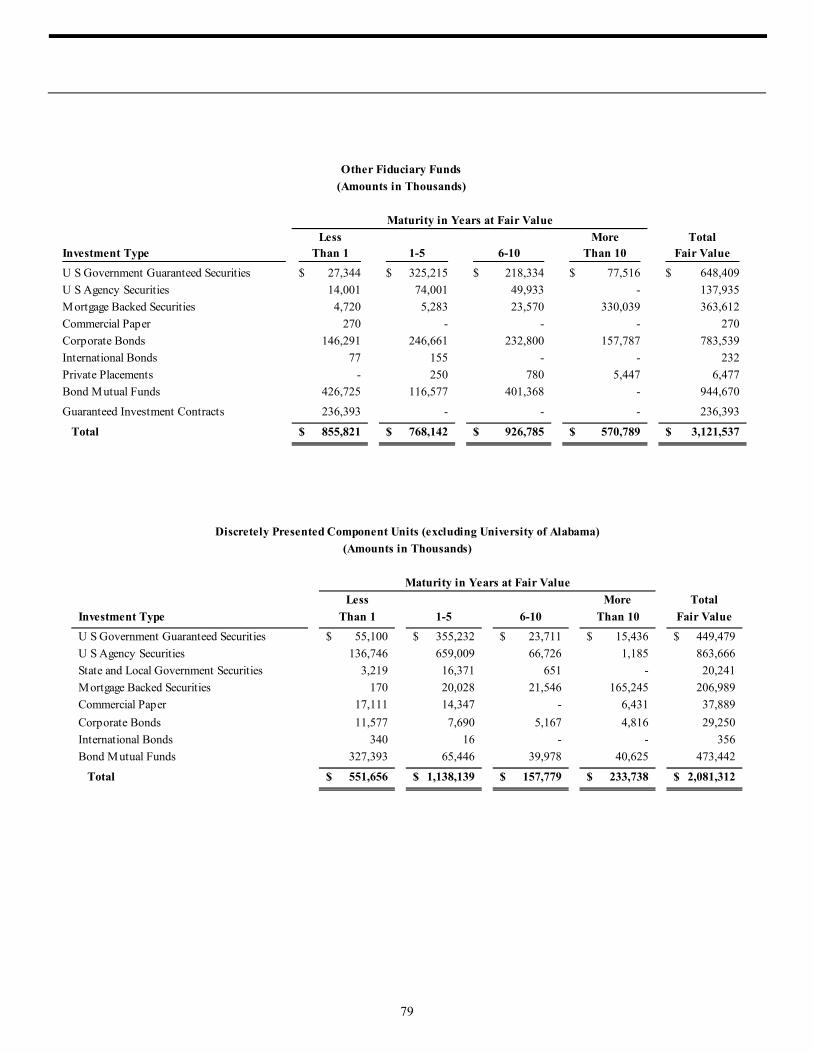
79
Less More TotalInvestment Type Than 1 1-5 6-10 Than 10 Fair Value
U S Government Guaranteed Securities 27,344$ 325,215$ 218,334$ 77,516$ 648,409$
U S Agency Securities 14,001 74,001 49,933 - 137,935
Mortgage Backed Securities 4,720 5,283 23,570 330,039 363,612
Commercial Paper 270 - - - 270
Corporate Bonds 146,291 246,661 232,800 157,787 783,539
International Bonds 77 155 - - 232
Private Placements - 250 780 5,447 6,477
Bond Mutual Funds 426,725 116,577 401,368 - 944,670
Guaranteed Investment Contracts 236,393 - - - 236,393
Total 855,821$ 768,142$ 926,785$ 570,789$ 3,121,537$
Other Fiduciary Funds
(Amounts in Thousands)
Maturity in Years at Fair Value
Less More Total
Investment Type Than 1 1-5 6-10 Than 10 Fair Value
U S Government Guaranteed Securities 55,100$ 355,232$ 23,711$ 15,436$ 449,479$
U S Agency Securities 136,746 659,009 66,726 1,185 863,666
State and Local Government Securities 3,219 16,371 651 - 20,241
Mortgage Backed Securities 170 20,028 21,546 165,245 206,989
Commercial Paper 17,111 14,347 - 6,431 37,889
Corporate Bonds 11,577 7,690 5,167 4,816 29,250
International Bonds 340 16 - - 356
Bond Mutual Funds 327,393 65,446 39,978 40,625 473,442
Total 551,656$ 1,138,139$ 157,779$ 233,738$ 2,081,312$
Discretely Presented Component Units (excluding University of Alabama)
(Amounts in Thousands)
Maturity in Years at Fair Value

STATE OF ALABAMA NOTES TO THE FINANCIAL STATEMENTS For the Fiscal Year Ended September 30, 2017
80
The University of Alabama discloses the interest rate risk for the System Pool using the effective duration method. The prices of fixed income securities with a longer time to maturity, measured by effective duration, tend to be more sensitive to changes in interest rates and, therefore, more volatile than those with shorter durations. Effective duration is the approximate change in price of a security resulting from a 100 basis point (1 percentage point) change in the level of interest rates. It is not a measure of time. The University does not have a specific policy relative to interest rate risk.
3. Foreign Currency Risk Foreign currency risk is the risk that changes in exchange rates will adversely affect the fair value of an investment. The investment policy of the Alabama Trust Fund states that the aggregate market value of international equities is limited to 29 percent of the aggregate market value of the total portfolio with a target of 24 percent of the total portfolio. The exposure to emerging market securities shall be limited to 20 percent of the market value of the international portfolio. Not more than 5 percent of the total stock portfolio may be invested in the common stock of any one corporation at the time of purchase and no more than 7 percent in any one corporation at market. Not more than 5 percent of the outstanding shares of any one company may be held by the portfolio. In addition, no more than the lesser of (2 times the sector weight in the index and 40 percent) valued at market may be held in any one economic sector as defined by the MSCI EAFE (Morgan Stanley Capital International Europe, Australasia, and the Far East) index classifications for developed market portfolios and by MSCI Emerging Markets index classifications for emerging markets portfolios. In order for an international security to be eligible for purchase by the Retirement Systems of Alabama (RSA), the issuing company must be incorporated in a country whose debt securities are eligible for purchase, and the fair value of the aggregate outstanding equity of the issuing company must be at least $100 million.
EffectiveInvestment Type Fair Value Duration
Endowment Fund:U S Government Guaranteed Securities 8,499$ 8.7 Mortgage Backed Securities 6,136 3.5 Corporate Bonds 21,041 4.8 Commingled Bond Funds 87,428 2.4
Non-U S Bonds 3,039 4.8
Long Term Reserve Pool Fund:U S Government Guaranteed Securities 14,143 8.4 Mortgage Backed Securities 11,840 3.3 Corporate Bonds 35,516 5.0 Commingled Bond Funds 114,439 2.1 Non-U S Bonds 5,480 5.0
Short Term Liquidity Pool Fund:U S Government Guaranteed Securities 244,194 1.9 Mortgage Backed Securities 149,208 1.0 Collateralized Mortgage Obligations 11,990 2.2 Corporate Bonds 165,646 1.9 Commingled Bond Funds 205,630 2.8 Non-U S Bonds 61,129 1.9
Total 1,145,358$
University of Alabama System Pool
(Amounts in Thousands)
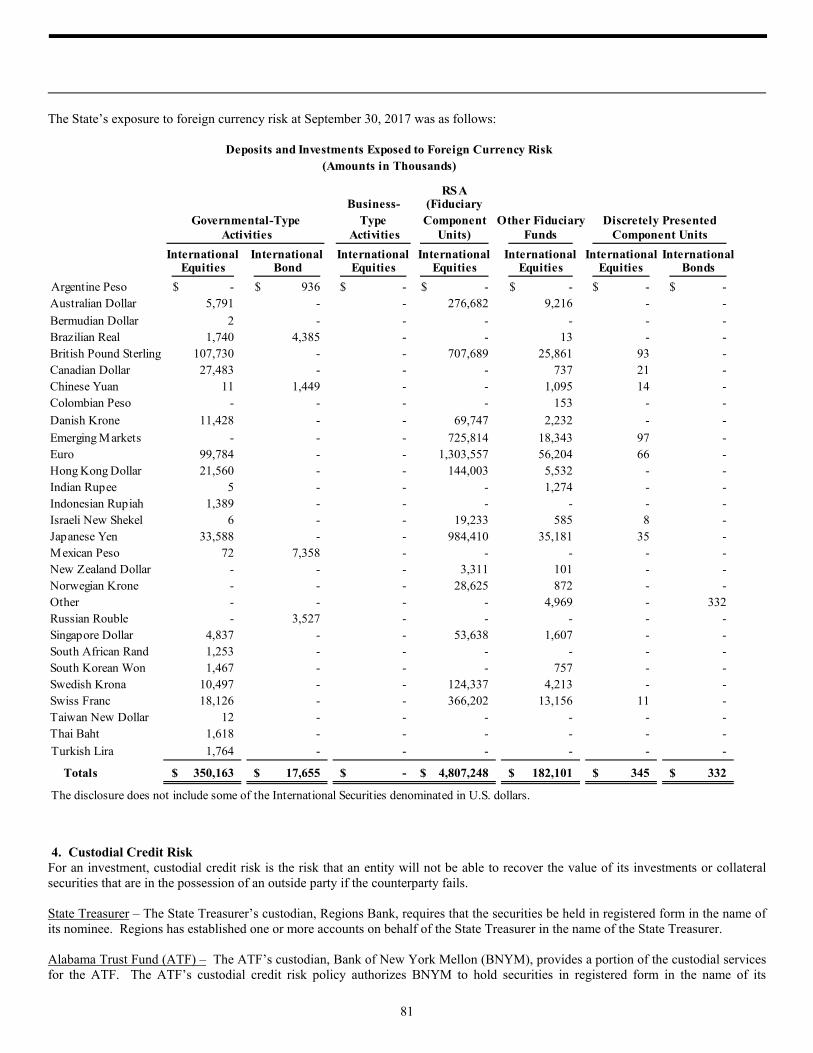
81
The State’s exposure to foreign currency risk at September 30, 2017 was as follows:
4. Custodial Credit Risk For an investment, custodial credit risk is the risk that an entity will not be able to recover the value of its investments or collateral securities that are in the possession of an outside party if the counterparty fails. State Treasurer – The State Treasurer’s custodian, Regions Bank, requires that the securities be held in registered form in the name of its nominee. Regions has established one or more accounts on behalf of the State Treasurer in the name of the State Treasurer. Alabama Trust Fund (ATF) – The ATF’s custodian, Bank of New York Mellon (BNYM), provides a portion of the custodial services for the ATF. The ATF’s custodial credit risk policy authorizes BNYM to hold securities in registered form in the name of its
RSABusiness- (Fiduciary
Type Component Other Fiduciary Activities Units) Funds
International International International International International International InternationalEquities Bond Equities Equities Equities Equities Bonds
Argentine Peso -$ 936$ -$ -$ -$ -$ -$ Australian Dollar 5,791 - - 276,682 9,216 - -
Bermudian Dollar 2 - - - - - - Brazilian Real 1,740 4,385 - - 13 - - British Pound Sterling 107,730 - - 707,689 25,861 93 - Canadian Dollar 27,483 - - - 737 21 - Chinese Yuan 11 1,449 - - 1,095 14 - Colombian Peso - - - - 153 - -
Danish Krone 11,428 - - 69,747 2,232 - -
Emerging Markets - - - 725,814 18,343 97 - Euro 99,784 - - 1,303,557 56,204 66 - Hong Kong Dollar 21,560 - - 144,003 5,532 - - Indian Rupee 5 - - - 1,274 - - Indonesian Rupiah 1,389 - - - - - - Israeli New Shekel 6 - - 19,233 585 8 - Japanese Yen 33,588 - - 984,410 35,181 35 - Mexican Peso 72 7,358 - - - - - New Zealand Dollar - - - 3,311 101 - - Norwegian Krone - - - 28,625 872 - - Other - - - - 4,969 - 332 Russian Rouble - 3,527 - - - - - Singapore Dollar 4,837 - - 53,638 1,607 - - South African Rand 1,253 - - - - - - South Korean Won 1,467 - - - 757 - - Swedish Krona 10,497 - - 124,337 4,213 - - Swiss Franc 18,126 - - 366,202 13,156 11 - Taiwan New Dollar 12 - - - - - - Thai Baht 1,618 - - - - - -
Turkish Lira 1,764 - - - - - -
Totals 350,163$ 17,655$ -$ 4,807,248$ 182,101$ 345$ 332$
The disclosure does not include some of the International Securities denominated in U.S. dollars.
Deposits and Investments Exposed to Foreign Currency Risk(Amounts in Thousands)
Governmental-Type Discretely Presented Activities Component Units

STATE OF ALABAMA NOTES TO THE FINANCIAL STATEMENTS For the Fiscal Year Ended September 30, 2017
82
nominee. The policy requires BNYM to establish and maintain one or more securities accounts (book entry system) in which BNYM will hold the securities. These accounts are in the name of the ATF. Retirement Systems of Alabama (RSA) – The RSA’s custodial credit risk policy requires the custodial agent to hold or direct its agents or sub-custodians to hold, for the account of the RSA all securities and other non-cash property other than securities in the Federal Reserve book-entry system, in a clearing agency which acts as a securities depository, or in another book-entry system. The RSA’s safekeeping agent holds all investments of the RSA in the RSA’s name with the exception of securities purchased with securities lending cash collateral.
5. Concentration of Credit Risk Concentration of credit risk is the risk of loss attributable to the magnitude of a government’s investments with a single issuer. The State of Alabama has investments in U.S. Government obligations which are disclosed in the tables in this note. Standard & Poor’s downgraded the rating of the U.S. Government to AA+; however the Moody’s rating is still Aaa. The investment policy of the Alabama Trust Fund states that the investment portfolio shall be diversified by both asset class and within asset classes, by economic sector and industry. For equity investments, the aggregate investment in equity securities of any one issuing corporation shall not exceed 1 percent of the outstanding capital of such corporation. For fixed income investments, the portfolio is to be diversified so that no more than 15 percent is invested in one industry (does not apply to U.S. government and agency securities), and no more than 5 percent of the total fixed income portfolio may be invested in securities of any one corporation. As of September 30, 2017, there were no investments that exceeded the 5 percent of the total fixed income portfolio limit in any one corporation. The investment policies of the Retirement Systems of Alabama limit the aggregate amount that can be invested in each class of investments. Domestic equity, international equity, fixed income, alternative investments, real estate, and short-term investments are limited to 60 percent, 25 percent, 50 percent, 20 percent, 15 percent, and 7 percent respectively, of the fair value of each System’s aggregate portfolio. As of September 30, 2017, the Teachers’ Retirement System (TRS), Employees’ Retirement System (ERS), and Judicial Retirement Fund (JRF) owned debt and equity securities of Goldman Sachs Group, Inc. which represented approximately 7.03 percent of TRS investments, 6.21 percent of ERS investments, and 6.48 percent of JRF investments. TRS and ERS owned debt and equity securities of Raycom Media Corporation which represented approximately 8.05 percent and 9.73 percent, respectively, of the TRS and the ERS investments. Additionally, TRS owned debt and equity securities of New Water Street Corporation which represented 5.19 percent of TRS investments.
Governmental Business- Fiduciary DiscretelyType Type Funds Other Presented
Activities Activities Than RSA Component Units
U S Government Guaranteed Securities 17,832$ -$ 27,841$ 614$
U S Agency Securities 80,375 - - 78
Mortgage Backed Securities 8,451 - 8,010 603 Commercial Paper 2,458 - - - Corporate Bonds 1,447 - 3,260 941 Private Placements - - 2,030 - Repurchase Agreements 50,790 - - - Domestic Equities 3 - - 1,198 International Equities - - - 89 Other Investments 8,497 - - - Total 169,853$ -$ 41,141$ 3,523$
Investments Exposed to Custodial Credit Risk(Amounts in Thousands)

83
D. Fair Value Measurement
GASB 72 sets forth the framework for measuring fair value. That framework provides a fair value hierarchy that prioritizes the inputs to valuation techniques used to measure fair value. The hierarchy gives the highest priority to quoted prices in an active market for identical assets or liabilities (Level 1 measurements) and the lowest priority to unobservable inputs (Level 3 measurements). The inputs to the three levels of the fair value hierarchy are described as follows:
Level 1: Quoted (unadjusted) prices in an active market for identical assets or liabilities. Level 2: Other inputs which are observable either directly or indirectly, including quoted prices for similar assets or liabilities, quoted prices for identical or similar assets or liabilities in a less active market, or other market-corroborated inputs. Level 3: Valuations derived from valuation techniques using significant unobservable inputs for assets or liabilities.
GASB 72 allows for the use of net asset value (“NAV”) as a practical expedient for valuation purposes. The categorization of investments within the hierarchy is based upon pricing transparency of the instrument and should not be perceived as the particular investment’s risk. Investments in securities classified as Level 1 are valued using quoted prices in an active market for those securities. Investments in securities classified as Level 2 are valued using non-proprietary information that is readily available to market participants from multiple independent sources, which are known to be actively involved in the market. Pricing inputs may include market quotation, yields, maturities, call features, and ratings. Investments in private equity, debt, and direct investments in Real Estate are classified as Level 3 due to lack of observable pricing inputs and are valued using annual appraisals based on a combination of market data and projected cash flows. As of September 30, 2017, the State had the following fair market value hierarchies:
Investment Types Level 1 Level 2 Level 3 NAV Total
U S Treasury Strips 24,403$ -$ -$ -$ 24,403$
U S Government Guaranteed Securities 851,355 22,397 - - 873,752
U S Agency Securities 308,014 71,262 - - 379,276
State and Local Government Securities 39 3,825 - - 3,864
Mortgage Backed Securities 12,670 337,432 - - 350,102
Commercial Paper 3,451 26,622 - - 30,073
Corporate Bonds 36,453 330,674 145 - 367,272
Derivative Instruments (406) 1,029 - - 623
Private Placements - 105,769 - - 105,769
Repurchase Agreements 37,641 - 13,149 - 50,790
International Bonds - 2,687 23,928 - 26,615
Bond Mutual Funds 721,443 7,722 - - 729,165
Domestic Equities 1,209,202 580 222,460 - 1,432,242
International Equities 587,583 - 51,701 - 639,284
Other Mutual Funds 67,222 - 8,339 - 75,561
Real Estate - - 275,985 - 275,985
Commingled Funds - - 89,985 - 89,985
Total 3,859,070$ 909,999$ 685,692$ -$ 5,454,761$
Governmental Activities
(Amounts in Thousands)

STATE OF ALABAMA NOTES TO THE FINANCIAL STATEMENTS For the Fiscal Year Ended September 30, 2017
84
Investment Types Level 1 Level 2 Level 3 NAV Total
U S Treasury Strips 11,451$ -$ -$ -$ 11,451$
U S Government Guaranteed Securities 9,340 - - - 9,340
U S Agency Securities 6,527 - - - 6,527
State and Local Government Securities 177 - - - 177
Mortgage Backed Securities 6 1,291 - - 1,297
Commercial Paper 60 - - - 60
Corporate Bonds 16,151 - - - 16,151 International Bonds - 52 - - 52
Domestic Equities 30,706 - - - 30,706
Other Mutual Funds 47,440 - - - 47,440
Real Estate - - 8,110 - 8,110
Total 121,858$ 1,343$ 8,110$ -$ 131,311$
Business-Type Activities
(Amounts in Thousands)
Investment Types Level 1 Level 2 Level 3 NAV Total
U S Government Guaranteed Securities -$ 1,130,978$ -$ -$ 1,130,978$
U S Agency Securities - 240,988 - - 240,988
Mortgage Backed Securities - 842,461 - - 842,461
Commercial Paper - 928,567 - - 928,567
Corporate Bonds - 1,654,360 - - 1,654,360
Private Placements - - 2,160,477 - 2,160,477
Bond Mutual Funds - 274,497 - - 274,497
Domestic Equities 16,697,320 2,414,214 2,024,293 - 21,135,827
International Equities 4,762,181 - - - 4,762,181
Real Estate - - 3,569,162 - 3,569,162
Total 21,459,501$ 7,486,065$ 7,753,932$ -$ 36,699,498$
Retirement Systems of Alabama
(Amounts in Thousands)
(Fiduciary Component Units)
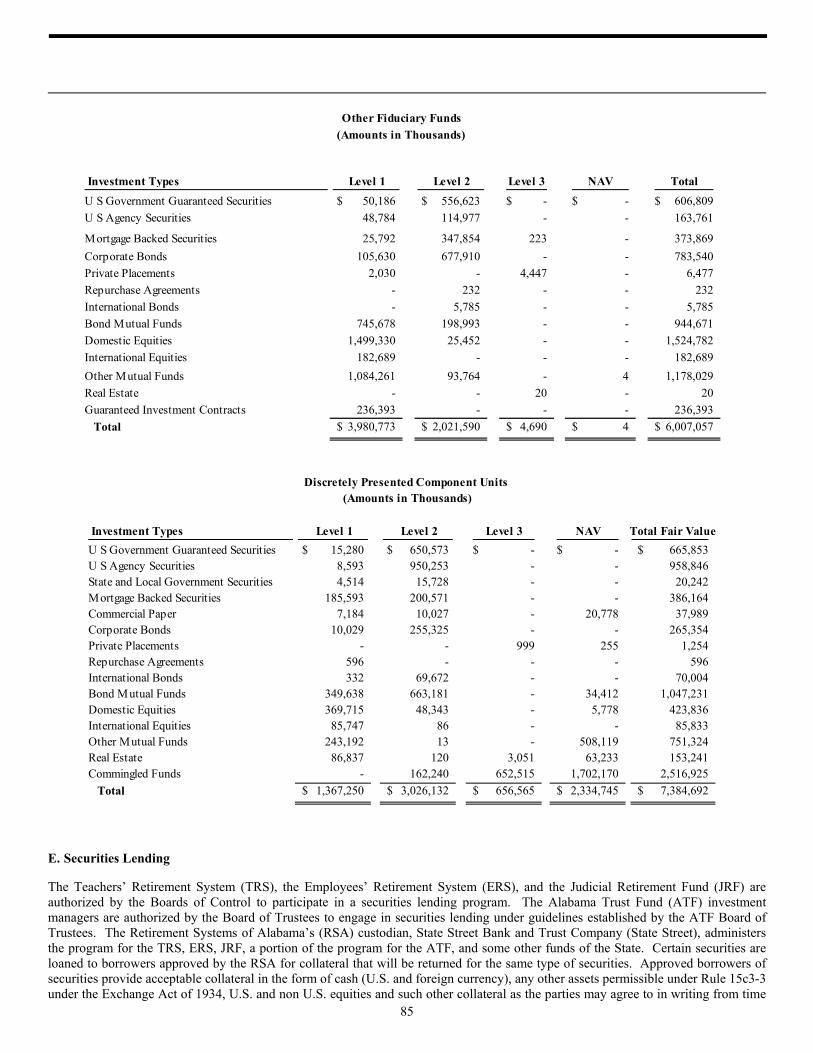
85
E. Securities Lending
The Teachers’ Retirement System (TRS), the Employees’ Retirement System (ERS), and the Judicial Retirement Fund (JRF) are authorized by the Boards of Control to participate in a securities lending program. The Alabama Trust Fund (ATF) investment managers are authorized by the Board of Trustees to engage in securities lending under guidelines established by the ATF Board of Trustees. The Retirement Systems of Alabama’s (RSA) custodian, State Street Bank and Trust Company (State Street), administers the program for the TRS, ERS, JRF, a portion of the program for the ATF, and some other funds of the State. Certain securities are loaned to borrowers approved by the RSA for collateral that will be returned for the same type of securities. Approved borrowers of securities provide acceptable collateral in the form of cash (U.S. and foreign currency), any other assets permissible under Rule 15c3-3 under the Exchange Act of 1934, U.S. and non U.S. equities and such other collateral as the parties may agree to in writing from time
Investment Types Level 1 Level 2 Level 3 NAV Total
U S Government Guaranteed Securities 50,186$ 556,623$ -$ -$ 606,809$
U S Agency Securities 48,784 114,977 - - 163,761
Mortgage Backed Securities 25,792 347,854 223 - 373,869
Corporate Bonds 105,630 677,910 - - 783,540
Private Placements 2,030 - 4,447 - 6,477
Repurchase Agreements - 232 - - 232
International Bonds - 5,785 - - 5,785
Bond Mutual Funds 745,678 198,993 - - 944,671
Domestic Equities 1,499,330 25,452 - - 1,524,782
International Equities 182,689 - - - 182,689
Other Mutual Funds 1,084,261 93,764 - 4 1,178,029
Real Estate - - 20 - 20
Guaranteed Investment Contracts 236,393 - - - 236,393
Total 3,980,773$ 2,021,590$ 4,690$ 4$ 6,007,057$
Other Fiduciary Funds
(Amounts in Thousands)
Investment Types Level 1 Level 2 Level 3 NAV Total Fair Value
U S Government Guaranteed Securities 15,280$ 650,573$ -$ -$ 665,853$ U S Agency Securities 8,593 950,253 - - 958,846 State and Local Government Securities 4,514 15,728 - - 20,242 Mortgage Backed Securities 185,593 200,571 - - 386,164 Commercial Paper 7,184 10,027 - 20,778 37,989 Corporate Bonds 10,029 255,325 - - 265,354 Private Placements - - 999 255 1,254 Repurchase Agreements 596 - - - 596 International Bonds 332 69,672 - - 70,004 Bond Mutual Funds 349,638 663,181 - 34,412 1,047,231 Domestic Equities 369,715 48,343 - 5,778 423,836 International Equities 85,747 86 - - 85,833 Other Mutual Funds 243,192 13 - 508,119 751,324 Real Estate 86,837 120 3,051 63,233 153,241 Commingled Funds - 162,240 652,515 1,702,170 2,516,925
Total 1,367,250$ 3,026,132$ 656,565$ 2,334,745$ 7,384,692$
Discretely Presented Component Units (Amounts in Thousands)
STATE OF ALABAMA NOTES TO THE FINANCIAL STATEMENTS For the Fiscal Year Ended September 30, 2017
86
to time. All security loans are open loans and can be terminated on demand by the lender or borrower. The initial collateral received shall have (depending on the nature of the loaned securities and the collateral received), a value of 102 percent or 105 percent of the fair value of the loaned securities, or such other value, but not less than 102 percent of the fair value of the loaned securities, as may be applicable in the jurisdiction in which such loaned securities are customarily traded. Pursuant to the terms of the applicable securities loan agreement, State Street shall, in accordance with State Street’s reasonable and customary practices, mark loaned securities and collateral to their fair value each business day based upon the fair value of the collateral and the loaned securities at the close of the business employing the most recently available pricing information and shall receive and deliver collateral in order to maintain the value of the collateral at no less than 100 percent of the fair value of the loaned securities. The lender cannot pledge or sell collateral securities received unless the borrower defaults. Cash collateral for TRS, ERS, and JRF is invested in the State Street Quality D Short-term Investments Fund (QDF). Cash collateral administered by State Street for ATF is invested in the State Street Global Securities Lending Trust (GSLT). Cash collateral investments are matured as needed to fulfill loan obligations. As of September 30, 2017, the average term of the loans secured by QDF was 12, 12, and 13 days, respectively for the TRS, ERS, and JRF. As of September 30, 2017, the average term of the loans secured by GSLT was 1 day for the ATF. Cash collateral investments are matured as needed to fulfill loan obligations. There is no direct matching of the maturities of the loans with the investments made with cash collateral. The following describes the QDF’s and the GSLT’s guidelines. The Investment Manager (State Street Bank) shall maintain the dollar-weighted average maturity of QDF and GSLT in a manner that the Investment Manager believes is appropriate to the objective of each; provided, that (i) in no event shall any eligible security be acquired with a remaining legal final maturity (i.e., the date on which principal must be repaid) of greater than 18 months, (ii) the Investment Manager shall endeavor to maintain a dollar-weighted average maturity of the QDF and GSLT not to exceed 75 calendar days and (iii) the Investment Manager shall endeavor to maintain a dollar-weighted average maturity to final of the QDF and GSLT not to exceed 180 calendar days. At the time of purchase (i) all eligible securities with maturities of 13 months or less shall (a) be rated at least A1, P1 or F1 by at least any two of the following nationally recognized statistical rating organizations: Standard & Poor’s Corp. (“S&P”), Moody’s Investor Services, Inc. (“Moody’s”), or Fitch, Inc. (“Fitch”), or (b) be determined by the Investment Manager to be of comparable quality and (ii) all eligible securities with maturities in excess of 13 months shall (a) be rated at least A-, A3 or A- by at least any two of S&P, Moody’s or Fitch, or (b) be determined by the Investment Manager to be of comparable quality. The QDF and the GSLT may invest up to 10 percent of its assets at time of purchase in commingled vehicles managed by State Street Global Advisors or its affiliates that conform to the Investment Policy Guidelines. The QDF and the GSLT both have duration pools. The duration pools include all asset backed securities (regardless of maturity) and securities of any type with a remaining maturity of 91 days or greater. Each investor owns a specified percentage interest in the duration pool which is redeemable only in kind, not in cash. The duration pools will not make additional investments. The Bank of New York Mellon (BNYM) administers a portion of the securities lending program for the ATF. Certain securities from ATF are loaned to borrowers approved by the ATF Board of Trustees. Approved borrowers of securities provide acceptable cash collateral in the form of Federal funds or New York Clearing House funds as applicable for a particular loan. All security loans are open loans and can be terminated on demand by the ATF, BNYM, or the borrower. The initial collateral received shall have (i) in the case of loaned securities denominated in United States Dollars, cash collateral in the amount of 102 percent of the market value of the loaned securities or (ii) in the case of loaned securities which are not denominated in United States Dollars, cash collateral in the amount of 105 percent of the market value of the loaned securities. Pursuant to the terms of the applicable securities loan agreement, BNYM shall, in accordance with BNYM’s reasonable and customary practices, mark loaned securities to their market value each business day based upon the market value of the loaned securities as of the close of business the preceding business day, employing the most recently available pricing information, and receive and deliver collateral in order to maintain the amount of cash collateral at no less than the collateral requirement. The ATF cannot pledge or sell collateral securities received unless the borrower defaults. As of September 30, 2017, the average term of the loans was 82 days. Cash collateral investments are matured as needed to fulfill loan obligations. All approved investments shall be for the account and risk of ATF. To the extent any loss arising out of approved investments results in a deficiency in the amount of collateral available for return to a borrower, ATF agrees to pay BNYM on demand cash in an amount equal to such deficiency.
87
The following describes the manner in which BNYM is authorized to invest and reinvest cash collateral for the ATF. Securities issued or fully guaranteed by the United States Government and any agency, instrumentality, or establishment of
the United States Government (“Government Securities”). High-grade commercial paper, notes, bonds, and other debt obligations including promissory notes, funding agreements, and
guaranteed investment contracts, whether or not registered under the Securities Act of 1933, as amended. Such obligations may have fixed, floating, or variable rate interest payment provisions.
Asset-backed securities which carry the highest credit rating by S&P or Moody’s. Certificates of deposit, time deposits and other bank obligations of U.S. banks, their branches and subsidiaries. Repurchase and reverse repurchase agreements collateralized by approved investments. Securities, units, shares and other participations in money market funds, unregistered short-term investment funds, pools or
trusts. Government securities have no maturity limit. Fixed rate instruments shall have a maturity of no greater than 13 months.
Floating rate instruments rated “A” or “AA” shall have maturities no greater than three years with resets no less frequent than three months. Floating rate instruments rated “AAA” shall have maturities no greater than five years with resets no less frequent than three months.
Investments purchased with cash collateral are held by the custodial agent, but not in the name of the lender. Securities pledged as collateral are held by the custodial agent, but not in the name of the lender. Letters of credit pledged as collateral are issued by the borrower’s bank and are irrevocable. The fair value of the securities on loan and the fair value of the collateral pledged by the borrowers are demonstrated in the securities lending table. Since the amounts owed by the State and its component units exceeded the amounts the borrowers owed, there was no credit risk exposure as of September 30, 2017. There were no significant violations of legal or contractual provisions, no borrower or lending agent default losses, and no recoveries of prior period losses during the year.
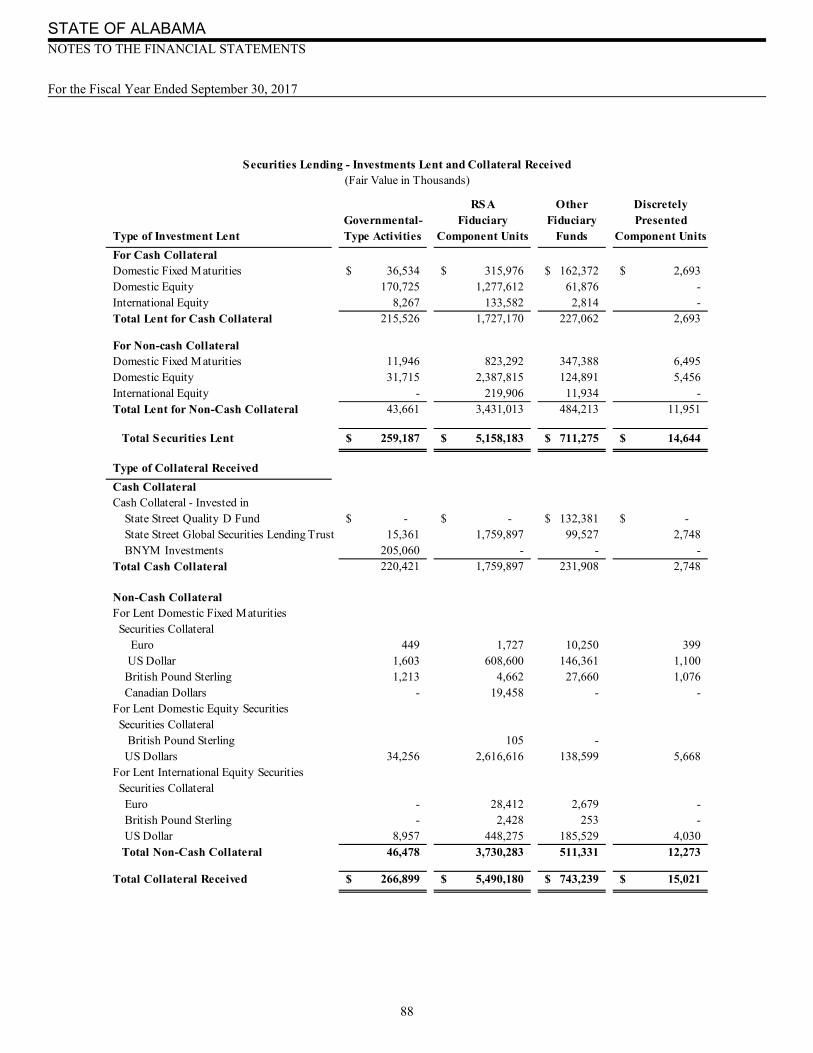
STATE OF ALABAMA NOTES TO THE FINANCIAL STATEMENTS For the Fiscal Year Ended September 30, 2017
88
RSA Other DiscretelyGovernmental- Fiduciary Fiduciary Presented
Type of Investment Lent Type Activities Component Units Funds Component Units
For Cash CollateralDomestic Fixed Maturities 36,534$ 315,976$ 162,372$ 2,693$ Domestic Equity 170,725 1,277,612 61,876 - International Equity 8,267 133,582 2,814 - Total Lent for Cash Collateral 215,526 1,727,170 227,062 2,693
For Non-cash CollateralDomestic Fixed Maturities 11,946 823,292 347,388 6,495 Domestic Equity 31,715 2,387,815 124,891 5,456 International Equity - 219,906 11,934 - Total Lent for Non-Cash Collateral 43,661 3,431,013 484,213 11,951
Total Securities Lent 259,187$ 5,158,183$ 711,275$ 14,644$
Type of Collateral Received
Cash CollateralCash Collateral - Invested in State Street Quality D Fund -$ -$ 132,381$ -$ State Street Global Securities Lending Trust 15,361 1,759,897 99,527 2,748 BNYM Investments 205,060 - - - Total Cash Collateral 220,421 1,759,897 231,908 2,748
Non-Cash CollateralFor Lent Domestic Fixed Maturities Securities Collateral Euro 449 1,727 10,250 399 US Dollar 1,603 608,600 146,361 1,100 British Pound Sterling 1,213 4,662 27,660 1,076 Canadian Dollars - 19,458 - - For Lent Domestic Equity Securities Securities Collateral British Pound Sterling 105 - US Dollars 34,256 2,616,616 138,599 5,668 For Lent International Equity Securities Securities Collateral Euro - 28,412 2,679 - British Pound Sterling - 2,428 253 - US Dollar 8,957 448,275 185,529 4,030 Total Non-Cash Collateral 46,478 3,730,283 511,331 12,273
Total Collateral Received 266,899$ 5,490,180$ 743,239$ 15,021$
Securities Lending - Investments Lent and Collateral Received(Fair Value in Thousands)

89
F. Mortgage-Backed Securities
The State of Alabama invests in mortgage-backed securities to improve yield and adjust the duration of the State’s fixed income portfolio. Embedded prepayment options cause these investments to be highly sensitive to changes in interest rates. Prepayments of the underlying assets reduce the total interest payments to be received. Generally, when interest rates fall, obligors tend to prepay the mortgages thus eliminating the stream of interest payments that would have been received under the original amortization schedule. The resulting reduction in cash flow diminishes the fair value of the mortgage-backed securities. The Alabama Trust Fund (ATF) invests in TBA (to be announced) purchase commitments, pursuant to which it agrees to purchase mortgage-backed securities. The TBA market developed in response to the demands of market participants for more liquidity in trading mortgage-backed securities. The TBA market is essentially a forward or delayed delivery market. The lender, or other market participant, will enter into a forward contract to sell mortgage-backed securities in the TBA market, promising to deliver mortgage-backed securities on the settlement date sometime in the future. At September 30, 2017, the ATF had investments in TBA mortgage-backed securities in the amount of $64,090,000. Included in investment purchases payable on the Statement of Net Position is a liability related to the cost of acquiring these securities. Generally, these securities are closed with a gain or loss prior to settlement. However, the ATF would be obligated for those amounts should the securities be delivered.
G. Investment Derivatives
Alabama State Port Authority - In December 2002, the Alabama State Port Authority entered into a swaption contract with an investment company in order to monetize potential debt service savings on the Authority’s callable 1996 Series bonds. The swaption gave the counterparty the option to enter into a variable-to-fixed interest rate swap at a specified future date. The counterparty exercised its option on July 18, 2006, and the interest rate swap commenced on October 1, 2006, with the Authority paying a fixed interest rate (5.38 percent) and the Authority receiving a variable interest rate (67 percent of the one-month LIBOR). The Authority may be exposed to various risks such as credit risk and interest rate risk through the interest rate swap. As the interest rate swap is a liability at September 30, 2017 and 2016, the impact of credit risk is minimized. The swap agreement is based on an amortized notional which was $36,205,000 at September 30, 2017, and expires on October 1, 2021. As of September 30, 2017 and 2016, the interest rate swap had a negative fair value of approximately $3,120,989 and $5,242,924, respectively, and is included in the Statement of Net Position in Noncurrent Liabilities: Due in More Than One Year as Other Long-Term Liabilities. In accordance with the swap agreement, the Authority posted collateral of approximately $7.6 million at September 30, 2017 and 2016 due to the negative position of the interest rate swap. The interest rate swap value is calculated using Level 2 inputs calculated using an industry accepted option pricing model that uses market interest rates and volatility assumptions on the valuation date. The interest rate and volatility data is used to calculate the present value of the potential future cash flows of the swap. University of South Alabama - In January 2008, the University of South Alabama entered into a synthetic advance refunding of the outstanding Series 2004 and 2006 bonds with a counterparty. This transaction was effected through the sale of two swaptions by the University to the counterparty. The transactions resulted in an up-front payment to the University totaling $9,328,000, which was recorded as a liability, in exchange for selling the counterparty the option to enter into an interest rate swap with respect to the Series 2004 and 2006 bonds in 2014 and 2016, respectively. The objective of this transaction is to realize debt service savings currently from future debt refunding and create an economic benefit to the University. In December 2013, the counterparty exercised its option with respect to the 2004 swaption. The University refunded its Series 2004 bonds, issued the Series 2014-A variable rate bond and terminated the Series 2004 swaption. As a result of this termination, the borrowing arising from the Series 2004 swaption of $1,696,000 and the investment derivative (liability) of $5,213,000 were written off and an investment loss of $2,229,000 was recognized and reported in the statements of revenues, expenses and changes in net position for the year ended September 30, 2014. An original borrowing arising from the 2014 swap of $9,138,000 was recognized and is reported, net of current year amortization, as long-term debt in the amounts of $5,940,000 and $6,854,000 in the statements of net position at September 30, 2017 and 2016, respectively. In September 2016, the counterparty exercised its option with respect to the 2006 swaption and, as a result, the Series 2006 swaption was terminated. The borrowing arising from the Series 2006 swaption of $6,939,000 and the investment derivative of $41,591,000 were written off. An original borrowing arising from the 2016 swap of $48,530,000 was recognized and is reported, net of current year amortization, as long-term debt in the amounts of $45,934,000 and $40,849,000 in the statements of net position at September 30, 2017 and 2016, respectively. Interest on the 2006 swaption was being accreted on, and added to the borrowings through the exercise date of the option, September 1, 2016. The Retirement Systems of Alabama (RSA) - The RSA enters into call and put options. The RSA uses these derivative instruments to make an investment, control risk with certain investment positions, or as a yield enhancement strategy. During the fiscal year, these investment derivative instruments were used exclusively within the RSA’s domestic and international equity portfolios and are presented in the financial statements in their respective equity classifications. These derivative instruments are either listed options or executed in the over-the-counter (OTC) market using only credit worthy counterparties. The fair value of the investment derivatives is

STATE OF ALABAMA NOTES TO THE FINANCIAL STATEMENTS For the Fiscal Year Ended September 30, 2017
90
based on market prices. Investment risks related to investment derivatives have been considered and included in the respective investment risks notes above in Note 3.c. The following table presents the investment derivative instruments outstanding as of September 30, 2017 (in thousands), as reported in the Statement of Fiduciary Net Position and Statement of Changes in Fiduciary Net Position:
Alabama Trust Fund (ATF) - Derivatives can be used by the ATF’s investment managers to manage cash positions, gain broad stock or bond market exposure and to manage risks with certain investment positions. The ATF Investment Policy allows derivative instruments to be used provided that the collateral is held in highly liquid securities and that they do not create the effect of leverage in the portfolio. GASB Statement No. 53 requires that the fair value of the financial arrangements called “derivatives” or “derivative instruments” be reported in the financial statements of state and local governments. The statement further requires that derivatives be categorized as either an investment derivative or a hedge derivative. All of the ATF’s derivative exposures as of September 30, 2017, are categorized as investment derivatives and therefore the hedge accounting provisions of GASB Statement No. 53 and No. 64 are not applicable. All derivative instruments are presented in the Statement of Net Position as Investments and are reported at fair value. ATF’s custodian, Bank of New York Mellon (BNYM), uses market prices when available. BNYM used two vendors to value derivatives when market values are not available. If market pricing is not available, BNYM uses pricing provided by Alabama Trust Funds’ investment managers. Investment risks related to investment derivatives have been considered and included in the respective investment risks notes above in Note 3.C. In the note, futures and credit default swaps are included in derivatives, and total return swaps and interest rate swaps are included in corporate bonds.
Amount Classification Amount Notional
TRS Domestic Options Written (12,691)$ Domestic Equity 0$ 0$
Domestic Options Purchased 13,739 Domestic Equity - -
Total Domestic Options 1,048$ 0 0
International Options Written (18) International Equity (463) (178,505) Total TRS Options 1,030$ (463)$ (178,505)$
ERS Domestic Options Written (6,061) Domestic Equity - - Domestic Options Purchased 6,562 Domestic Equity - - Total Domestic Options 501 0 0 International Options Written (9)$ International Equity (221)$ (85,247)$
Total ERS Options 492$ Totals (221)$ (85,247)$
JRF Domestic Options Written (190) Domestic Equity - - Domestic Options Purchased 205 Domestic Equity - - Total Domestic Options 15 0 0 International Options Written -$ International Stocks (7)$ (2,649)$
Total JRF Options 15$ Totals (7)$ (2,649)$
§ The changes in fair value are included in Net Increase (Decrease) in Fair Value of Investmentsin the Statement of Changes in Fiduciary Net Position
Fair Value
Investment Derivative Instruments
Changes in Fair Value §
(Amounts in thousands)

91
The following table presents the derivative instruments outstanding as of September 30, 2017 for ATF:
GASB Statement No. 53 requires the disclosure of the maximum amount of loss due to credit risk, based on the fair value of the instrument at the end of the fiscal year. The maximum amount of loss associated with all derivatives held by the ATF is $3,081,000. GASB Statement No. 53 also requires additional interest rate risk disclosures for investment derivatives that are highly sensitive to interest rate fluctuations.
H. Capital Assets
Historical costs for infrastructure assets are included in this report. The State elected to include the historical costs of all infrastructure assets, not just assets capitalized since 1980, as required by GASB Statement No. 34. The State capitalizes infrastructure when all costs for a project are incurred and all project documentation is completed and filed with the appropriate entities. Due to the documentation requirements, there can be substantial time lags between the date a project is put into service and the date the project is capitalized. A significant portion of Infrastructure Construction in Progress consists of projects that have been put into service and maintenance costs could have been incurred but the project documentation is not complete. For Business-Type activities, decreases in construction in progress are large relative to increases in buildings because Port Authority constructs some equipment assets.
Amount Amount Notional
Credit Default Swaps 259$ 1,029$ (52,040)$
Total Swaps 259$ 1,029$ (52,040)$
Futures (368)$ (403)$ (49,358)$
Total Futures (368)$ (403)$ (49,358)$
Total Derivatives (109)$ 626$ (101,398)$
§ Included in Unrestricted Investment Earnings in the Statement of Activities and Investment Income in the Statement of Revenues, Expenditures, and Changes in Fund Balances.
Investment Derivative Instruments
Fair Value as of September 30, 2017Changes in Fair Value §
(Amounts in thousands)

STATE OF ALABAMA NOTES TO THE FINANCIAL STATEMENTS For the Fiscal Year Ended September 30, 2017
92
As of September 30, 2017, the capital assets for the Primary Government and the Component Units are presented in the following three tables:
BeginningBalance Ending
as Restated Increases Decreases BalanceCapital assets not being depreciated: Land 348,854$ 38,943$ 1,596$ 386,201$ Historical Exhibits 4,158 32 4,126 Construction in progress 155,710 44,917 51,048 149,579 Construction in progress - Infrastructure 3,610,772 284,331 590,479 3,304,624
Infrastructure 15,796,402 590,479 - 16,386,881 Intangible Assets under Development 55,658 - 55,658 -
Total capital assets not being depreciated 19,971,554 958,670 698,813 20,231,411
Capital assets being depreciated: Buildings 1,756,178 71,886 3,295 1,824,769 Equipment 661,305 101,652 40,828 722,129
Software and Other Intangible Assets 42,003 54,445 - 96,448
Total capital assets being depreciated 2,459,486 227,983 44,123 2,643,346
Less accumulated depreciation: Buildings 736,722 41,229 2,817 775,134 Equipment 385,717 55,108 30,222 410,603 Software and Other Intangible Assets 11,533 3,196 - 14,729
Total accumulated depreciation 1,133,972 99,533 33,039 1,200,466
Total capital assets
being depreciated, net 1,325,514 128,450 11,084 1,442,880
Governmental-type activities
capital assets, net 21,297,068$ 1,087,120$ 709,897$ 21,674,291$
Depreciation Expense for the current year is charged as follows:
Economic Development and Regulation 5,461$
Social Services 6,978
Education and Cultural Resources 5,646
Natural Resources and Recreation 6,955
Health 10,419
General Government 10,542
Protection of Persons and Property 26,147
Transportation 27,385
Total Depreciation Expense 99,533$
GOVERNMENTAL-TYPE ACTIVITIES(Amounts in Thousands)
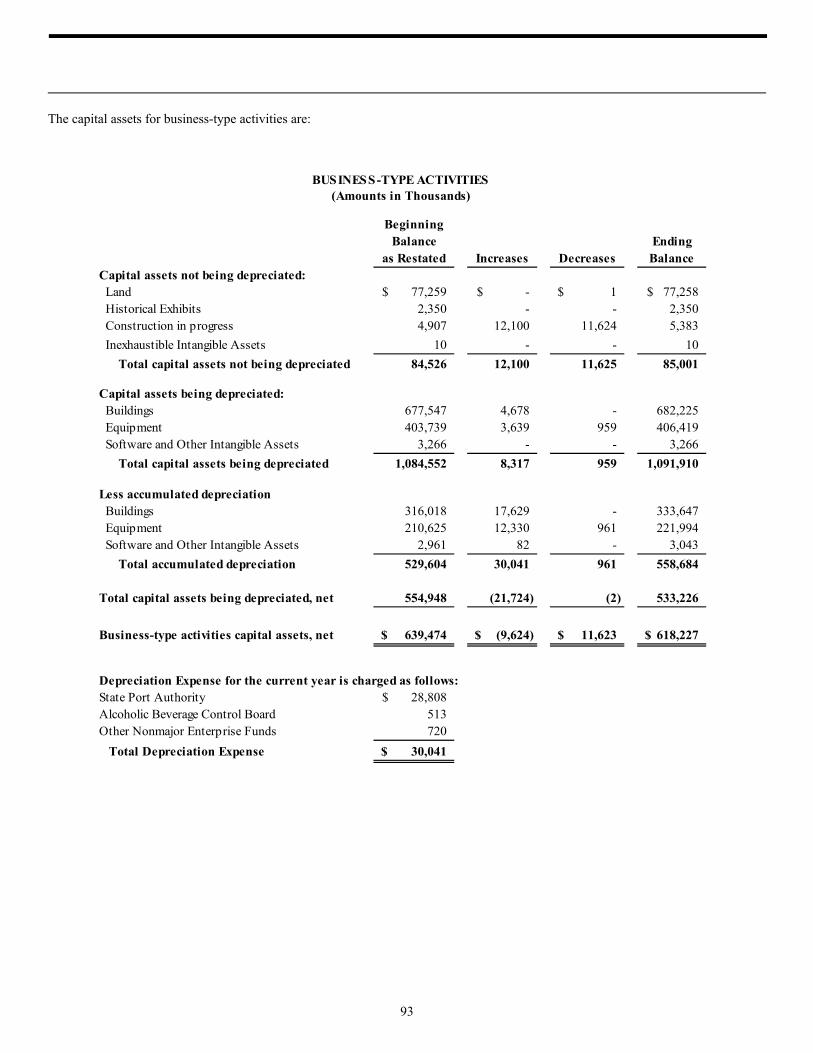
93
The capital assets for business-type activities are:
BeginningBalance Ending
as Restated Increases Decreases BalanceCapital assets not being depreciated: Land 77,259$ -$ 1$ 77,258$ Historical Exhibits 2,350 - - 2,350 Construction in progress 4,907 12,100 11,624 5,383
Inexhaustible Intangible Assets 10 - - 10
Total capital assets not being depreciated 84,526 12,100 11,625 85,001
Capital assets being depreciated: Buildings 677,547 4,678 - 682,225 Equipment 403,739 3,639 959 406,419 Software and Other Intangible Assets 3,266 - - 3,266
Total capital assets being depreciated 1,084,552 8,317 959 1,091,910
Less accumulated depreciation Buildings 316,018 17,629 - 333,647 Equipment 210,625 12,330 961 221,994 Software and Other Intangible Assets 2,961 82 - 3,043
Total accumulated depreciation 529,604 30,041 961 558,684
Total capital assets being depreciated, net 554,948 (21,724) (2) 533,226
Business-type activities capital assets, net 639,474$ (9,624)$ 11,623$ 618,227$
Depreciation Expense for the current year is charged as follows:State Port Authority 28,808$ Alcoholic Beverage Control Board 513 Other Nonmajor Enterprise Funds 720
Total Depreciation Expense 30,041$
BUSINESS-TYPE ACTIVITIES(Amounts in Thousands)

STATE OF ALABAMA NOTES TO THE FINANCIAL STATEMENTS For the Fiscal Year Ended September 30, 2017
94
NOTE 5 - LIABILITIES
A. Future Commitments
1. Construction Projects
Primary Government At September 30, 2017, the Department of Transportation had construction and maintenance contracts of $2,044,092,000. The amount already performed was $901,806,000, leaving an outstanding balance of $1,142,286,000. The funding sources for this amount are 57 percent federal funds and 43 percent State and local funds. The State Port Authority has contracts for several projects with estimated costs to complete of approximately $1.6 million.
Beginning
Balance Ending
as Restated Increases Decreases Balance
Capital assets not being depreciated:
Land 354,481$ 14,060$ 1,797$ 366,744$
Historical Exhibits 127,283 1,399 - 128,682
Construction in progress 363,326 489,881 376,644 476,563
Total capital assets not being depreciated 845,090 505,340 378,441 971,989
Capital assets being depreciated:
Buildings 10,749,028 483,295 19,546 11,212,777
Equipment 2,627,768 181,419 52,690 2,756,497
Software and Other Intangibles 154,165 6,425 1,075 159,515
Total capital assets being depreciated 13,530,961 671,139 73,311 14,128,789
Less accumulated depreciation
Buildings 3,873,953 290,245 3,823 4,160,375
Equipment 1,981,160 163,974 48,377 2,096,757
Software and Other Intangible Assets 87,885 7,583 539 94,929
Total accumulated depreciation 5,942,998 461,802 52,739 6,352,061
Total capital assets being depreciated, net 7,587,963 209,337 20,572 7,776,728
Component Units capital assets, net 8,433,053$ 714,677$ 399,013$ 8,748,717$
Depreciation Expense for the current year is charged as follows:
University of Alabama 236,022$
Auburn University 77,842
University of South Alabama 44,681
Alabama Community College System 45,021
Other Nonmajor Component Units 58,236
Total Depreciation Expense 461,802$
COMPONENT UNITS
(Amounts in Thousands)
95
Component Units The University of Alabama at Birmingham had construction and renovation commitments remaining at September 30, 2017 of approximately $222.9 million, which is expected to be financed from private gifts, grants, bond proceeds, and University of Alabama at Birmingham reserves. Auburn University has entered into projects for the construction and renovation contracts for various facilities that are estimated to cost approximately $488.9 million. At September 30, 2017, the estimated remaining cost to complete the projects was approximately $300.6 million which will be funded from University funds and bond proceeds. The University of Alabama at Tuscaloosa had construction and renovation contract commitments for several facilities at September 30, 2017. The estimated remaining costs to complete the construction and renovation was approximately $148.3 million which is expected to be financed from private gifts, grants, bond proceeds, and University funds. The University of Alabama at Huntsville contracted for the construction of various projects. At September 30, 2017, the estimated remaining cost to complete the construction was approximately $38.4 million dollars which is expected to be financed from University funds. At September 30, 2017, the University of South Alabama had commitments of approximately $19.7 million for various capital projects.
2. Operating Leases The State and its component units have entered into various lease agreements for real property. These leases do not represent material commitments by the State, therefore disclosure of minimum future lease payments is not provided.
3. Economic Development The State has made a variety of economic development grant commitments to the private sector to finance the cost of industries locating and expanding in the State, as well as the costs of training employees. As of September 30, 2017, the State has committed to funding economic development grants totaling $132,160,000. Available cash for these commitments includes $5,132,000 in Alabama Incentives Finance Authority bonds and $48,183,000 in 2016-A General Obligation bonds. The State anticipates that of these commitments, $78,845,000 will be paid in fiscal year 2019 and after.
4. Encumbrances Encumbrances represent commitments related to unperformed contracts and purchase orders for goods and services. Encumbrances are reported within governmental funds as restricted, committed, or assigned fund balance. At September 30, 2017, there were encumbrances in the General Fund totaling $2,158,000, the Education Trust Fund $1,911,000, the Public Road and Bridge Fund $67,642,000, the Medicaid Fund $117,000, the Public Welfare Trust Fund $5,295,000, the Alabama Trust Fund $179,000, and non-major governmental funds $48,286,000.
B. Claims and Judgments
The Department of Transportation finances its own risk for state employee injury compensation. The Department had $10,784,000 in claims liabilities at the end of the fiscal year.
C. Pollution Remediation Obligations
Auburn University conducts groundwater monitoring, monitored natural attenuation and clean-up in accordance with the Resource Conservation and Recovery Act (RCRA) and the Toxic Substances and Control Act. Additionally, asbestos abatement is necessary as older buildings on campus are demolished or renovated. The University, with the assistance of an outside consultant, prepared a 30-year Post Closure Cost Estimate related to all active and inactive solid waste management units managed through the University RCRA Facility permit. As of September 30, 2017, the total estimated pollution remediation liability (estimated using the expected cash-flow technique) is $6,989,000. The current portion of $220,000 is included in accounts payable and the long-term portion of $6,769,000 is included in Noncurrent Liabilities: Due In More Than One Year in the accompanying Statements of Net Position. The University does not expect to recover any funds from insurance or other third parties related to these obligations.
D. Conduit Debt
Revenue bonds were issued by Alabama Housing Finance Authority, a component unit, which constituted conduit debt outstanding at year-end totaling $151,215,000 to provide multifamily housing for the citizens of Alabama. The Authority does not actively monitor
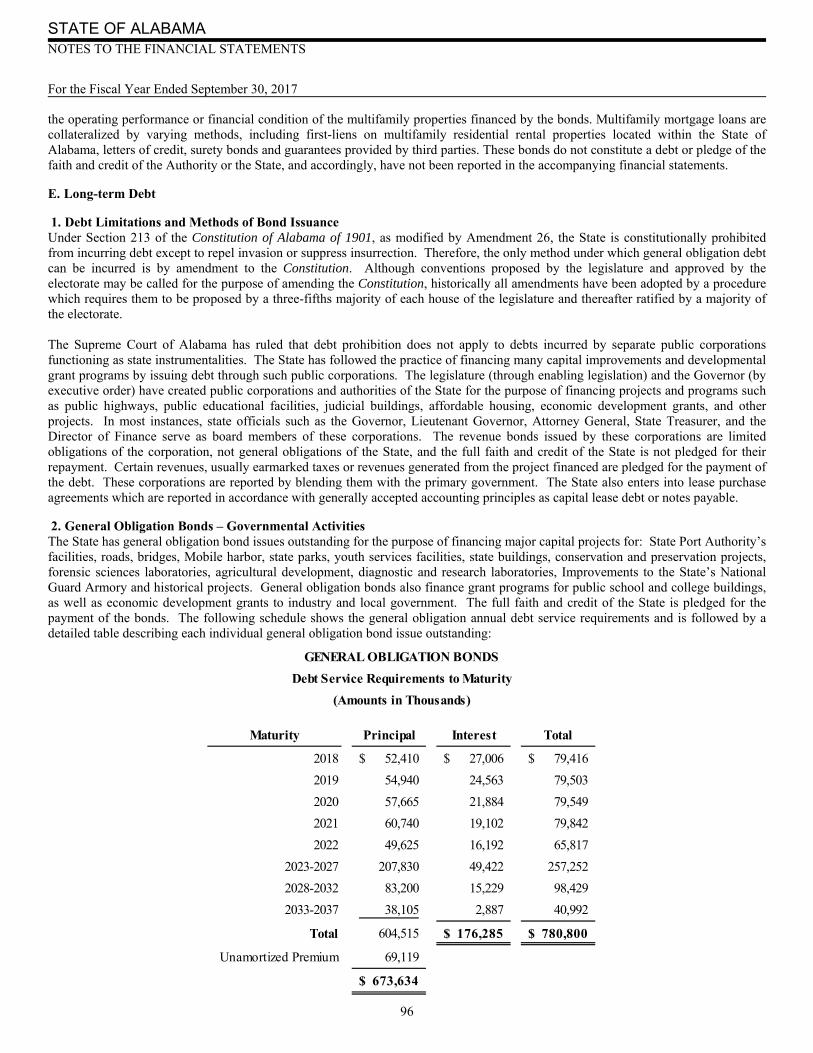
STATE OF ALABAMA NOTES TO THE FINANCIAL STATEMENTS For the Fiscal Year Ended September 30, 2017
96
the operating performance or financial condition of the multifamily properties financed by the bonds. Multifamily mortgage loans are collateralized by varying methods, including first-liens on multifamily residential rental properties located within the State of Alabama, letters of credit, surety bonds and guarantees provided by third parties. These bonds do not constitute a debt or pledge of the faith and credit of the Authority or the State, and accordingly, have not been reported in the accompanying financial statements.
E. Long-term Debt
1. Debt Limitations and Methods of Bond Issuance Under Section 213 of the Constitution of Alabama of 1901, as modified by Amendment 26, the State is constitutionally prohibited from incurring debt except to repel invasion or suppress insurrection. Therefore, the only method under which general obligation debt can be incurred is by amendment to the Constitution. Although conventions proposed by the legislature and approved by the electorate may be called for the purpose of amending the Constitution, historically all amendments have been adopted by a procedure which requires them to be proposed by a three-fifths majority of each house of the legislature and thereafter ratified by a majority of the electorate. The Supreme Court of Alabama has ruled that debt prohibition does not apply to debts incurred by separate public corporations functioning as state instrumentalities. The State has followed the practice of financing many capital improvements and developmental grant programs by issuing debt through such public corporations. The legislature (through enabling legislation) and the Governor (by executive order) have created public corporations and authorities of the State for the purpose of financing projects and programs such as public highways, public educational facilities, judicial buildings, affordable housing, economic development grants, and other projects. In most instances, state officials such as the Governor, Lieutenant Governor, Attorney General, State Treasurer, and the Director of Finance serve as board members of these corporations. The revenue bonds issued by these corporations are limited obligations of the corporation, not general obligations of the State, and the full faith and credit of the State is not pledged for their repayment. Certain revenues, usually earmarked taxes or revenues generated from the project financed are pledged for the payment of the debt. These corporations are reported by blending them with the primary government. The State also enters into lease purchase agreements which are reported in accordance with generally accepted accounting principles as capital lease debt or notes payable.
2. General Obligation Bonds – Governmental Activities The State has general obligation bond issues outstanding for the purpose of financing major capital projects for: State Port Authority’s facilities, roads, bridges, Mobile harbor, state parks, youth services facilities, state buildings, conservation and preservation projects, forensic sciences laboratories, agricultural development, diagnostic and research laboratories, Improvements to the State’s National Guard Armory and historical projects. General obligation bonds also finance grant programs for public school and college buildings, as well as economic development grants to industry and local government. The full faith and credit of the State is pledged for the payment of the bonds. The following schedule shows the general obligation annual debt service requirements and is followed by a detailed table describing each individual general obligation bond issue outstanding:
Maturity Principal Interest Total
2018 52,410$ 27,006$ 79,416$
2019 54,940 24,563 79,503
2020 57,665 21,884 79,549
2021 60,740 19,102 79,842
2022 49,625 16,192 65,817
2023-2027 207,830 49,422 257,252
2028-2032 83,200 15,229 98,429
2033-2037 38,105 2,887 40,992
Total 604,515 176,285$ 780,800$
Unamortized Premium 69,119
673,634$
GENERAL OBLIGATION BONDS
Debt Service Requirements to Maturity
(Amounts in Thousands)
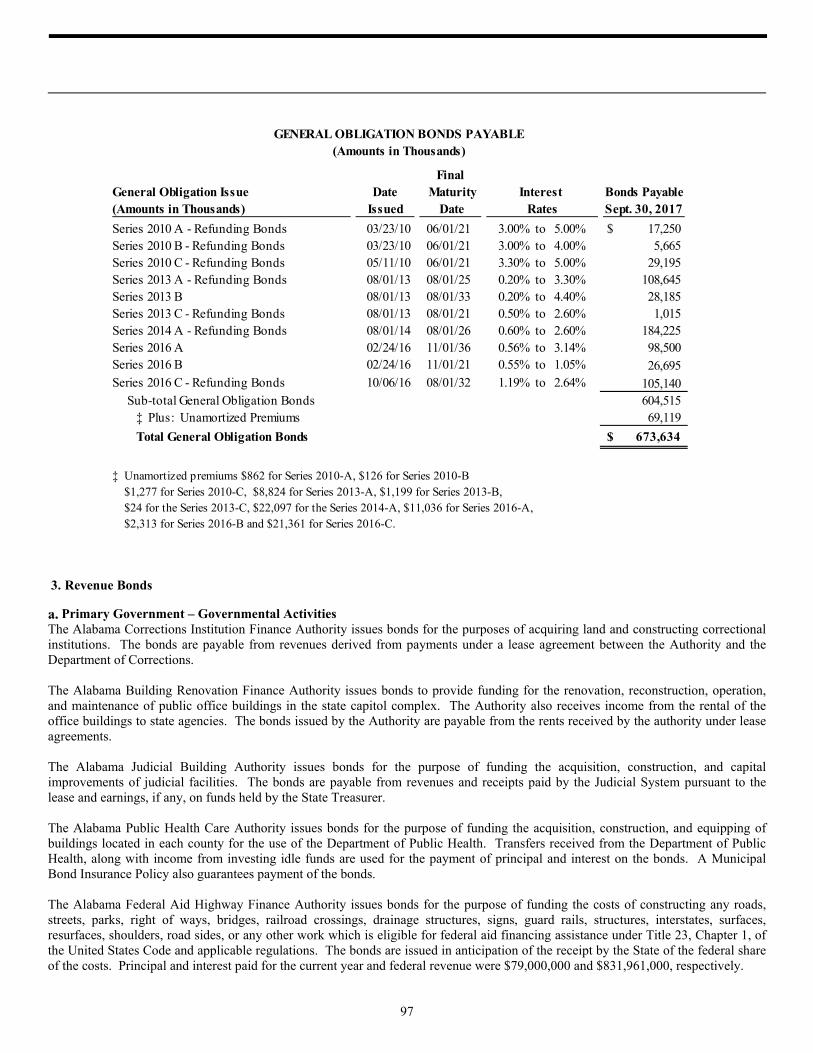
97
3. Revenue Bonds
Primary Government – Governmental Activities The Alabama Corrections Institution Finance Authority issues bonds for the purposes of acquiring land and constructing correctional institutions. The bonds are payable from revenues derived from payments under a lease agreement between the Authority and the Department of Corrections. The Alabama Building Renovation Finance Authority issues bonds to provide funding for the renovation, reconstruction, operation, and maintenance of public office buildings in the state capitol complex. The Authority also receives income from the rental of the office buildings to state agencies. The bonds issued by the Authority are payable from the rents received by the authority under lease agreements. The Alabama Judicial Building Authority issues bonds for the purpose of funding the acquisition, construction, and capital improvements of judicial facilities. The bonds are payable from revenues and receipts paid by the Judicial System pursuant to the lease and earnings, if any, on funds held by the State Treasurer. The Alabama Public Health Care Authority issues bonds for the purpose of funding the acquisition, construction, and equipping of buildings located in each county for the use of the Department of Public Health. Transfers received from the Department of Public Health, along with income from investing idle funds are used for the payment of principal and interest on the bonds. A Municipal Bond Insurance Policy also guarantees payment of the bonds. The Alabama Federal Aid Highway Finance Authority issues bonds for the purpose of funding the costs of constructing any roads, streets, parks, right of ways, bridges, railroad crossings, drainage structures, signs, guard rails, structures, interstates, surfaces, resurfaces, shoulders, road sides, or any other work which is eligible for federal aid financing assistance under Title 23, Chapter 1, of the United States Code and applicable regulations. The bonds are issued in anticipation of the receipt by the State of the federal share of the costs. Principal and interest paid for the current year and federal revenue were $79,000,000 and $831,961,000, respectively.
FinalGeneral Obligation Issue Date Maturity Bonds Payable(Amounts in Thousands) Issued Date Sept. 30, 2017
Series 2010 A - Refunding Bonds 03/23/10 06/01/21 3.00% to 5.00% 17,250$ Series 2010 B - Refunding Bonds 03/23/10 06/01/21 3.00% to 4.00% 5,665 Series 2010 C - Refunding Bonds 05/11/10 06/01/21 3.30% to 5.00% 29,195 Series 2013 A - Refunding Bonds 08/01/13 08/01/25 0.20% to 3.30% 108,645 Series 2013 B 08/01/13 08/01/33 0.20% to 4.40% 28,185 Series 2013 C - Refunding Bonds 08/01/13 08/01/21 0.50% to 2.60% 1,015 Series 2014 A - Refunding Bonds 08/01/14 08/01/26 0.60% to 2.60% 184,225 Series 2016 A 02/24/16 11/01/36 0.56% to 3.14% 98,500 Series 2016 B 02/24/16 11/01/21 0.55% to 1.05% 26,695 Series 2016 C - Refunding Bonds 10/06/16 08/01/32 1.19% to 2.64% 105,140 Sub-total General Obligation Bonds 604,515 ‡ Plus: Unamortized Premiums 69,119
Total General Obligation Bonds 673,634$
‡ Unamortized premiums $862 for Series 2010-A, $126 for Series 2010-B $1,277 for Series 2010-C, $8,824 for Series 2013-A, $1,199 for Series 2013-B, $24 for the Series 2013-C, $22,097 for the Series 2014-A, $11,036 for Series 2016-A, $2,313 for Series 2016-B and $21,361 for Series 2016-C.
Rates
GENERAL OBLIGATION BONDS PAYABLE
Interest
(Amounts in Thousands)
STATE OF ALABAMA NOTES TO THE FINANCIAL STATEMENTS For the Fiscal Year Ended September 30, 2017
98
The Alabama Incentives Finance Authority issues bonds to fund financial commitments to industries relocating to Alabama under the terms of the State’s Industrial Incentives legislation. Revenues from the Tennessee Valley Authority to the State “in lieu of taxes” are pledged for the payment of these bonds. Principal and interest paid for the current year and the “in lieu of taxes” revenue were $17,940,000 and $14,910,000, respectively. The Alabama Public School and College Authority is authorized to issue bonds to construct and improve educational buildings. Revenue from the sales and use taxes, the leasing tax, and the utilities gross receipts and use taxes are pledged for the payment of these bonds. Principal and interest paid for the current year was $281,983,000. Sales taxes, use taxes, leasing taxes, and utilities gross receipts and use taxes for the current year were $2,554,547,000. The Alabama Mental Health Finance Authority issues bonds for the acquisition, construction, improvement, and equipping of mental health facilities. Revenues from certain tobacco and liquor taxes are pledged for the payment of principal and interest on these bonds. Principal and interest paid for the current year was $2,093,000. Tobacco and liquor taxes for the current year were $4,523,000. The Alabama Twenty-first Century Authority issues bonds for the purpose of promoting economic development and industrial recruitment for the State of Alabama. The bonds are special obligations of the Authority payable solely from the Trust Estate created under the Indenture. Principal and interest paid for the current year and tobacco settlement revenue were $12,891,000 and $13,000,000, respectively. The Alabama Revolving Loan Fund Authority issues bonds for the purpose of making grants to the Regional Planning and Development Commissions which are utilized by the grantees as revolving loan funds. Revenues from privilege and license tax on providers of cellular radio telecommunication services are used to pay the debt. Principal and interest paid for the current year and cellular radio telecommunication privilege and license taxes were $1,839,000 and $45,051,000, respectively. The Alabama Highway Finance Corporation issues bonds for the purpose of funding the state’s share of the cost of constructing roads and bridges that the federal government and state funds jointly. The 0.07 gasoline tax, 0.13 diesel fuel tax, 0.06 diesel fuel tax, motor carrier tax, inspection fees, and identification marker fees are used to pay the debt. Principal and interest paid for the current year and specified taxes were $3,818,000 and $365,276,000, respectively. The Alabama Economic Settlement Authority issued bonds to deposit funds in the Alabama Trust Fund and the General Fund Rainy Day Account, to provide additional funds to the Alabama Medicaid Agency, for the payment of cost of certain transportation projects, and to create a special fund to be known as the BP Settlement Fund. Settlement of claims against BP Exploration and Production, Inc. and proceeds from the bonds issuance will be used for payment of the bond principal and interest. Principal and interest paid for the current year totaled $17,749,000. $29,581,000 of bond proceeds was set aside for debt service. The State will begin receiving BP claim settlement funds in fiscal year 2018.
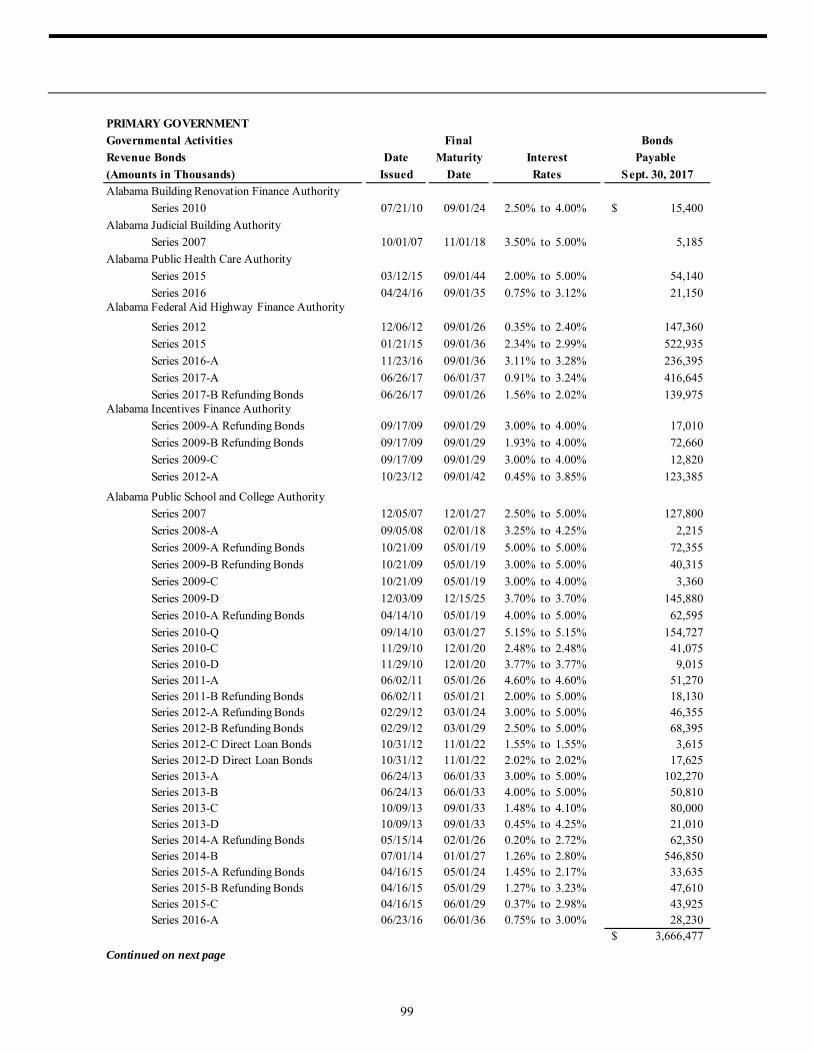
99
PRIMARY GOVERNMENT
Governmental Activities Final Bonds
Date Maturity Payable
Issued Date Sept. 30, 2017
Alabama Building Renovation Finance Authority
Series 2010 07/21/10 09/01/24 2.50% to 4.00% 15,400$
Alabama Judicial Building Authority
Series 2007 10/01/07 11/01/18 3.50% to 5.00% 5,185
Alabama Public Health Care Authority
Series 2015 03/12/15 09/01/44 2.00% to 5.00% 54,140
Series 2016 04/24/16 09/01/35 0.75% to 3.12% 21,150 Alabama Federal Aid Highway Finance Authority
Series 2012 12/06/12 09/01/26 0.35% to 2.40% 147,360
Series 2015 01/21/15 09/01/36 2.34% to 2.99% 522,935
Series 2016-A 11/23/16 09/01/36 3.11% to 3.28% 236,395
Series 2017-A 06/26/17 06/01/37 0.91% to 3.24% 416,645
Series 2017-B Refunding Bonds 06/26/17 09/01/26 1.56% to 2.02% 139,975 Alabama Incentives Finance Authority
Series 2009-A Refunding Bonds 09/17/09 09/01/29 3.00% to 4.00% 17,010
Series 2009-B Refunding Bonds 09/17/09 09/01/29 1.93% to 4.00% 72,660
Series 2009-C 09/17/09 09/01/29 3.00% to 4.00% 12,820
Series 2012-A 10/23/12 09/01/42 0.45% to 3.85% 123,385
Alabama Public School and College Authority
Series 2007 12/05/07 12/01/27 2.50% to 5.00% 127,800
Series 2008-A 09/05/08 02/01/18 3.25% to 4.25% 2,215
Series 2009-A Refunding Bonds 10/21/09 05/01/19 5.00% to 5.00% 72,355
Series 2009-B Refunding Bonds 10/21/09 05/01/19 3.00% to 5.00% 40,315
Series 2009-C 10/21/09 05/01/19 3.00% to 4.00% 3,360
Series 2009-D 12/03/09 12/15/25 3.70% to 3.70% 145,880
Series 2010-A Refunding Bonds 04/14/10 05/01/19 4.00% to 5.00% 62,595
Series 2010-Q 09/14/10 03/01/27 5.15% to 5.15% 154,727 Series 2010-C 11/29/10 12/01/20 2.48% to 2.48% 41,075 Series 2010-D 11/29/10 12/01/20 3.77% to 3.77% 9,015 Series 2011-A 06/02/11 05/01/26 4.60% to 4.60% 51,270 Series 2011-B Refunding Bonds 06/02/11 05/01/21 2.00% to 5.00% 18,130 Series 2012-A Refunding Bonds 02/29/12 03/01/24 3.00% to 5.00% 46,355 Series 2012-B Refunding Bonds 02/29/12 03/01/29 2.50% to 5.00% 68,395 Series 2012-C Direct Loan Bonds 10/31/12 11/01/22 1.55% to 1.55% 3,615 Series 2012-D Direct Loan Bonds 10/31/12 11/01/22 2.02% to 2.02% 17,625 Series 2013-A 06/24/13 06/01/33 3.00% to 5.00% 102,270 Series 2013-B 06/24/13 06/01/33 4.00% to 5.00% 50,810 Series 2013-C 10/09/13 09/01/33 1.48% to 4.10% 80,000 Series 2013-D 10/09/13 09/01/33 0.45% to 4.25% 21,010 Series 2014-A Refunding Bonds 05/15/14 02/01/26 0.20% to 2.72% 62,350 Series 2014-B 07/01/14 01/01/27 1.26% to 2.80% 546,850 Series 2015-A Refunding Bonds 04/16/15 05/01/24 1.45% to 2.17% 33,635 Series 2015-B Refunding Bonds 04/16/15 05/01/29 1.27% to 3.23% 47,610 Series 2015-C 04/16/15 06/01/29 0.37% to 2.98% 43,925 Series 2016-A 06/23/16 06/01/36 0.75% to 3.00% 28,230
3,666,477$
Continued on next page
Rates
InterestRevenue Bonds
(Amounts in Thousands)
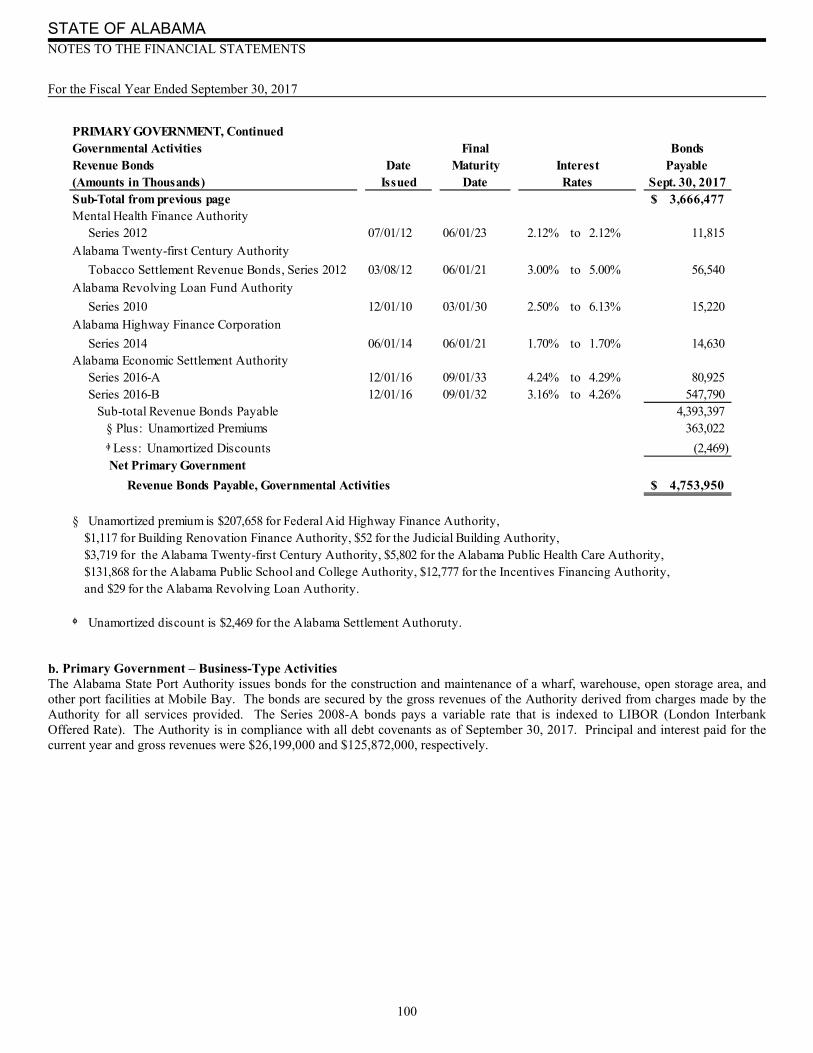
STATE OF ALABAMA NOTES TO THE FINANCIAL STATEMENTS For the Fiscal Year Ended September 30, 2017
100
Primary Government – Business-Type Activities The Alabama State Port Authority issues bonds for the construction and maintenance of a wharf, warehouse, open storage area, and other port facilities at Mobile Bay. The bonds are secured by the gross revenues of the Authority derived from charges made by the Authority for all services provided. The Series 2008-A bonds pays a variable rate that is indexed to LIBOR (London Interbank Offered Rate). The Authority is in compliance with all debt covenants as of September 30, 2017. Principal and interest paid for the current year and gross revenues were $26,199,000 and $125,872,000, respectively.
PRIMARY GOVERNMENT, ContinuedGovernmental Activities Final Bonds
Date Maturity Payable Issued Date Sept. 30, 2017
Sub-Total from previous page 3,666,477$ Mental Health Finance Authority
Series 2012 07/01/12 06/01/23 2.12% to 2.12% 11,815
Alabama Twenty-first Century Authority
Tobacco Settlement Revenue Bonds, Series 2012 03/08/12 06/01/21 3.00% to 5.00% 56,540
Alabama Revolving Loan Fund Authority
Series 2010 12/01/10 03/01/30 2.50% to 6.13% 15,220
Alabama Highway Finance Corporation
Series 2014 06/01/14 06/01/21 1.70% to 1.70% 14,630 Alabama Economic Settlement Authority
Series 2016-A 12/01/16 09/01/33 4.24% to 4.29% 80,925 Series 2016-B 12/01/16 09/01/32 3.16% to 4.26% 547,790 Sub-total Revenue Bonds Payable 4,393,397 § Plus: Unamortized Premiums 363,022
ᶲ Less: Unamortized Discounts (2,469) Net Primary Government
Revenue Bonds Payable, Governmental Activities 4,753,950$
§ Unamortized premium is $207,658 for Federal Aid Highway Finance Authority, $1,117 for Building Renovation Finance Authority, $52 for the Judicial Building Authority, $3,719 for the Alabama Twenty-first Century Authority, $5,802 for the Alabama Public Health Care Authority, $131,868 for the Alabama Public School and College Authority, $12,777 for the Incentives Financing Authority, and $29 for the Alabama Revolving Loan Authority.
ᶲ Unamortized discount is $2,469 for the Alabama Settlement Authoruty.
RatesInterestRevenue Bonds
(Amounts in Thousands)
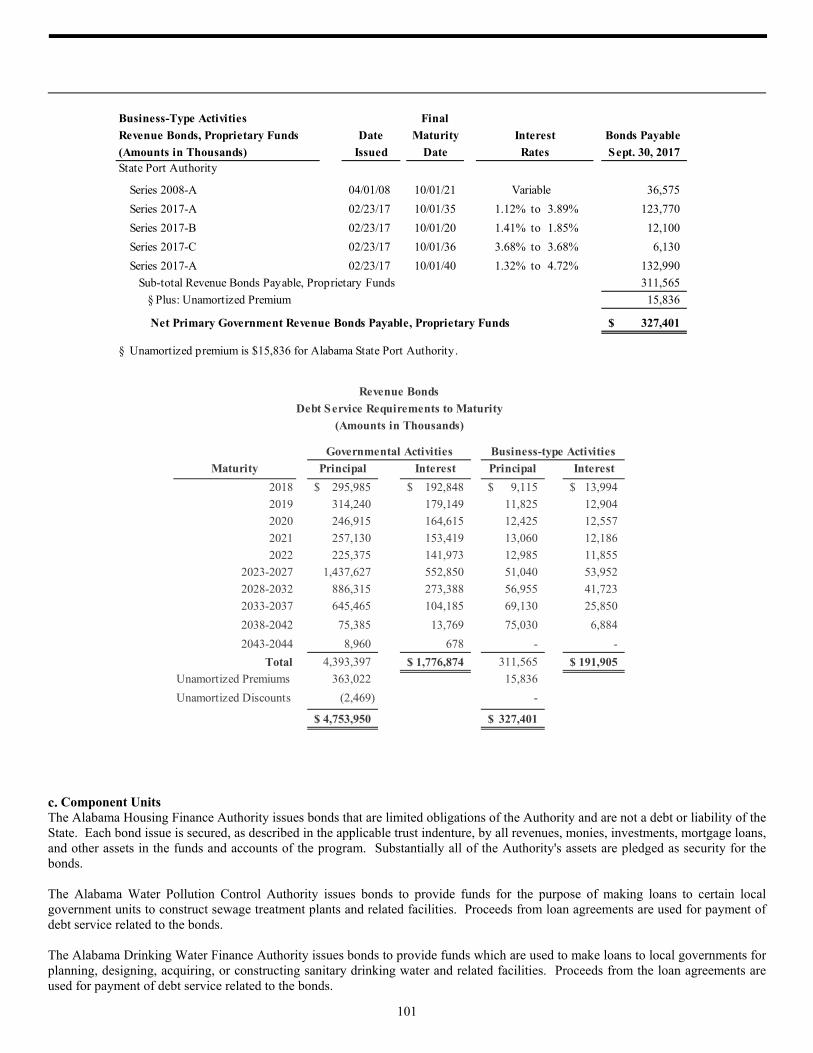
101
Component Units The Alabama Housing Finance Authority issues bonds that are limited obligations of the Authority and are not a debt or liability of the State. Each bond issue is secured, as described in the applicable trust indenture, by all revenues, monies, investments, mortgage loans, and other assets in the funds and accounts of the program. Substantially all of the Authority's assets are pledged as security for the bonds. The Alabama Water Pollution Control Authority issues bonds to provide funds for the purpose of making loans to certain local government units to construct sewage treatment plants and related facilities. Proceeds from loan agreements are used for payment of debt service related to the bonds. The Alabama Drinking Water Finance Authority issues bonds to provide funds which are used to make loans to local governments for planning, designing, acquiring, or constructing sanitary drinking water and related facilities. Proceeds from the loan agreements are used for payment of debt service related to the bonds.
Maturity Principal Interest Principal Interest
2018 295,985$ 192,848$ 9,115$ 13,994$
2019 314,240 179,149 11,825 12,904
2020 246,915 164,615 12,425 12,557
2021 257,130 153,419 13,060 12,186
2022 225,375 141,973 12,985 11,855
2023-2027 1,437,627 552,850 51,040 53,952
2028-2032 886,315 273,388 56,955 41,723
2033-2037 645,465 104,185 69,130 25,850
2038-2042 75,385 13,769 75,030 6,884
2043-2044 8,960 678 - -
Total 4,393,397 1,776,874$ 311,565 191,905$
Unamortized Premiums 363,022 15,836
Unamortized Discounts (2,469) -
4,753,950$ 327,401$
Revenue Bonds
Debt Service Requirements to Maturity
Business-type ActivitiesGovernmental Activities
(Amounts in Thousands)
Business-Type Activities Final
Date Maturity Bonds Payable
Issued Date Sept. 30, 2017State Port Authority
Series 2008-A 04/01/08 10/01/21 Variable 36,575
Series 2017-A 02/23/17 10/01/35 1.12% to 3.89% 123,770
Series 2017-B 02/23/17 10/01/20 1.41% to 1.85% 12,100
Series 2017-C 02/23/17 10/01/36 3.68% to 3.68% 6,130
Series 2017-A 02/23/17 10/01/40 1.32% to 4.72% 132,990
Sub-total Revenue Bonds Payable, Proprietary Funds 311,565
§ Plus: Unamortized Premium 15,836
Net Primary Government Revenue Bonds Payable, Proprietary Funds 327,401$
§ Unamortized premium is $15,836 for Alabama State Port Authority.
Revenue Bonds, Proprietary Funds Interest
Rates(Amounts in Thousands)
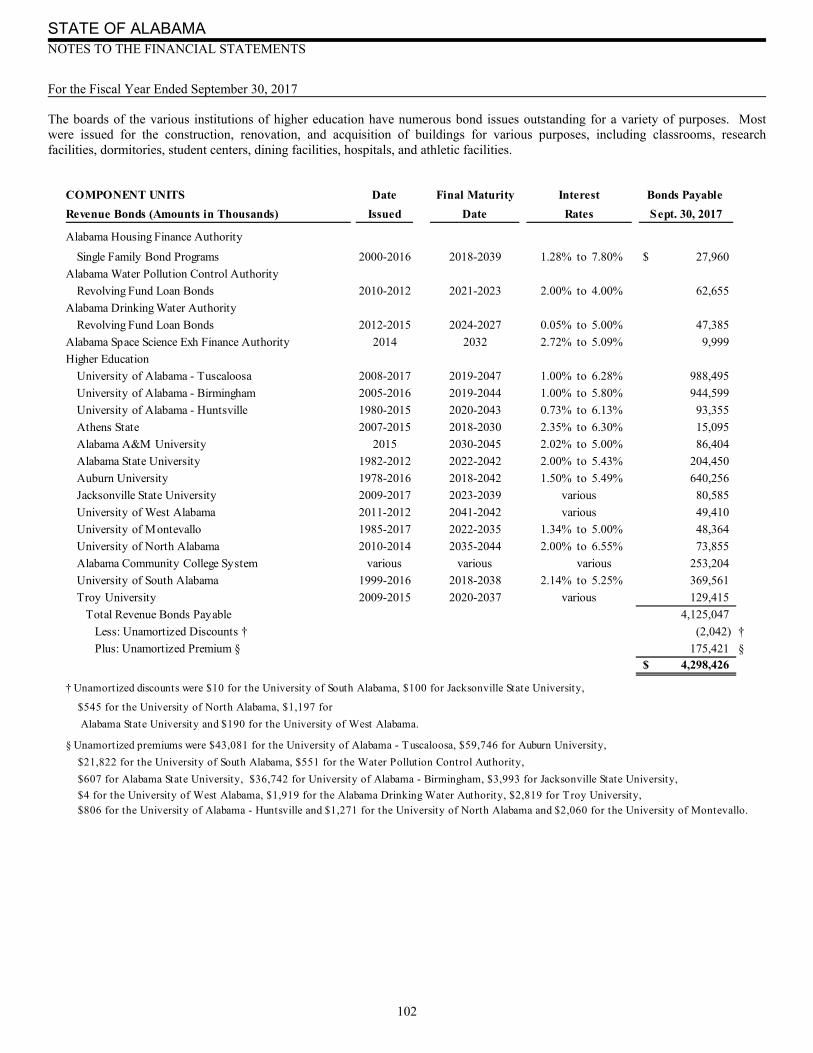
STATE OF ALABAMA NOTES TO THE FINANCIAL STATEMENTS For the Fiscal Year Ended September 30, 2017
102
The boards of the various institutions of higher education have numerous bond issues outstanding for a variety of purposes. Most were issued for the construction, renovation, and acquisition of buildings for various purposes, including classrooms, research facilities, dormitories, student centers, dining facilities, hospitals, and athletic facilities.
COMPONENT UNITS Date Final Maturity Bonds Payable
Issued Date Sept. 30, 2017
Alabama Housing Finance Authority
Single Family Bond Programs 2000-2016 2018-2039 1.28% to 7.80% 27,960$
Alabama Water Pollution Control Authority
Revolving Fund Loan Bonds 2010-2012 2021-2023 2.00% to 4.00% 62,655
Alabama Drinking Water Authority
Revolving Fund Loan Bonds 2012-2015 2024-2027 0.05% to 5.00% 47,385
Alabama Space Science Exh Finance Authority 2014 2032 2.72% to 5.09% 9,999
Higher Education
University of Alabama - Tuscaloosa 2008-2017 2019-2047 1.00% to 6.28% 988,495
University of Alabama - Birmingham 2005-2016 2019-2044 1.00% to 5.80% 944,599
University of Alabama - Huntsville 1980-2015 2020-2043 0.73% to 6.13% 93,355
Athens State 2007-2015 2018-2030 2.35% to 6.30% 15,095
Alabama A&M University 2015 2030-2045 2.02% to 5.00% 86,404
Alabama State University 1982-2012 2022-2042 2.00% to 5.43% 204,450
Auburn University 1978-2016 2018-2042 1.50% to 5.49% 640,256
Jacksonville State University 2009-2017 2023-2039 80,585
University of West Alabama 2011-2012 2041-2042 49,410
University of Montevallo 1985-2017 2022-2035 1.34% to 5.00% 48,364
University of North Alabama 2010-2014 2035-2044 2.00% to 6.55% 73,855
Alabama Community College System various various various 253,204
University of South Alabama 1999-2016 2018-2038 2.14% to 5.25% 369,561
Troy University 2009-2015 2020-2037 129,415
Total Revenue Bonds Payable 4,125,047
Less: Unamortized Discounts † (2,042) †
Plus: Unamortized Premium § 175,421 § 4,298,426$
† Unamortized discounts were $10 for the University of South Alabama, $100 for Jacksonville State University,
$545 for the University of North Alabama, $1,197 for
Alabama State University and $190 for the University of West Alabama.
§ Unamortized premiums were $43,081 for the University of Alabama - Tuscaloosa, $59,746 for Auburn University,
$21,822 for the University of South Alabama, $551 for the Water Pollution Control Authority,
$607 for Alabama State University, $36,742 for University of Alabama - Birmingham, $3,993 for Jacksonville State University,
$4 for the University of West Alabama, $1,919 for the Alabama Drinking Water Authority, $2,819 for Troy University, $806 for the University of Alabama - Huntsville and $1,271 for the University of North Alabama and $2,060 for the University of Montevallo.
Interest
RatesRevenue Bonds (Amounts in Thousands)
various
various
various
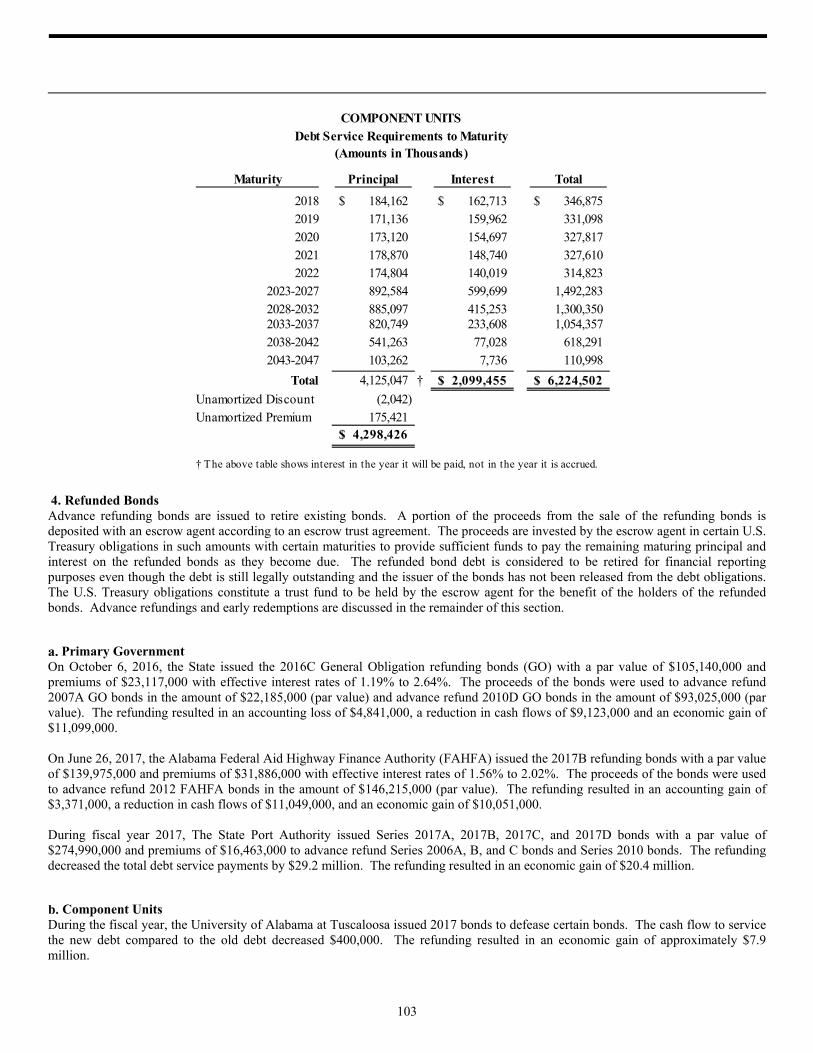
103
4. Refunded Bonds Advance refunding bonds are issued to retire existing bonds. A portion of the proceeds from the sale of the refunding bonds is deposited with an escrow agent according to an escrow trust agreement. The proceeds are invested by the escrow agent in certain U.S. Treasury obligations in such amounts with certain maturities to provide sufficient funds to pay the remaining maturing principal and interest on the refunded bonds as they become due. The refunded bond debt is considered to be retired for financial reporting purposes even though the debt is still legally outstanding and the issuer of the bonds has not been released from the debt obligations. The U.S. Treasury obligations constitute a trust fund to be held by the escrow agent for the benefit of the holders of the refunded bonds. Advance refundings and early redemptions are discussed in the remainder of this section.
Primary Government On October 6, 2016, the State issued the 2016C General Obligation refunding bonds (GO) with a par value of $105,140,000 and premiums of $23,117,000 with effective interest rates of 1.19% to 2.64%. The proceeds of the bonds were used to advance refund 2007A GO bonds in the amount of $22,185,000 (par value) and advance refund 2010D GO bonds in the amount of $93,025,000 (par value). The refunding resulted in an accounting loss of $4,841,000, a reduction in cash flows of $9,123,000 and an economic gain of $11,099,000. On June 26, 2017, the Alabama Federal Aid Highway Finance Authority (FAHFA) issued the 2017B refunding bonds with a par value of $139,975,000 and premiums of $31,886,000 with effective interest rates of 1.56% to 2.02%. The proceeds of the bonds were used to advance refund 2012 FAHFA bonds in the amount of $146,215,000 (par value). The refunding resulted in an accounting gain of $3,371,000, a reduction in cash flows of $11,049,000, and an economic gain of $10,051,000. During fiscal year 2017, The State Port Authority issued Series 2017A, 2017B, 2017C, and 2017D bonds with a par value of $274,990,000 and premiums of $16,463,000 to advance refund Series 2006A, B, and C bonds and Series 2010 bonds. The refunding decreased the total debt service payments by $29.2 million. The refunding resulted in an economic gain of $20.4 million.
Component Units During the fiscal year, the University of Alabama at Tuscaloosa issued 2017 bonds to defease certain bonds. The cash flow to service the new debt compared to the old debt decreased $400,000. The refunding resulted in an economic gain of approximately $7.9 million.
Maturity Principal Interest Total
2018 184,162$ 162,713$ 346,875$
2019 171,136 159,962 331,098
2020 173,120 154,697 327,817
2021 178,870 148,740 327,610 2022 174,804 140,019 314,823
2023-2027 892,584 599,699 1,492,283
2028-2032 885,097 415,253 1,300,350 2033-2037 820,749 233,608 1,054,357
2038-2042 541,263 77,028 618,291
2043-2047 103,262 7,736 110,998
Total 4,125,047 † 2,099,455$ 6,224,502$
Unamortized Discount (2,042)
Unamortized Premium 175,421 4,298,426$
† The above table shows interest in the year it will be paid, not in the year it is accrued.
COMPONENT UNITS
Debt Service Requirements to Maturity(Amounts in Thousands)

STATE OF ALABAMA NOTES TO THE FINANCIAL STATEMENTS For the Fiscal Year Ended September 30, 2017
104
In October 2016, the University of Alabama at Birmingham issued $65,215,000 in Series 2016A bonds and $302,530,000 in Series 2016B bonds to refund Series 2006A and Series 2008A, and Series 2012C bonds. The refundings resulted in a $40.1 million reduction in cash flow service for the new debt versus the old debt and an economic gain of approximately $30 million. In May 2017, the University of Alabama at Birmingham issued $18,385,000 in Series 2017A bonds and $44,810,000 in Series 2017B bonds to refund Series 2012B bonds. The refunding resulted in a $23.8 million reduction in cash flow service the new debt versus the old debt and an economic gain of approximately $18.1 million. In December 2016, the University of South Alabama issued Series 2016B, C, and D bonds in the amount of $100,000,000 to refund outstanding Series 2006 bonds.
Advance Refunded Bonds Advance refunded bonds with remaining balances at September 30, 2017:
5. Arbitrage The Tax Reform Act of 1986 requires that governmental entities issuing tax-exempt debt subsequent to August 1986, to calculate and rebate arbitrage earnings to the Federal Government. The U.S. Treasury has issued regulations on calculating the rebate amount and complying with the provisions of the Tax Reform Act of 1986. Governmental issuers must comply with the rebate regulation in order for their bonds to maintain tax-exempt status. The regulations require the excess of the aggregate amount earned on investments purchased with bond proceeds over the amount that would have been earned if the proceeds were invested at a rate equal to the bond yield to be rebated to the federal government. Income earned on excess earnings is also subject to rebate. Rebate payments, if required, are due at least once every five years over the life of the bonds. At September 30, 2017, there were no known outstanding liabilities for arbitrage. This arbitrage information is based on incomplete data since some bond issues have not yet been included in arbitrage calculations. Any refunded bond issue is subject to the rebate requirement until the last bond is redeemed. Bond issues that have already been redeemed may be subject to additional payments if an arbitrage rebate or spending payment is owed and has not been paid.
Primary Government AmountGeneral Obligation 2010-D 88,560,000$ Alabama Public School & College Authority 2007 574,150,000 Alabama Public School & College Authority 2008-A 29,540,000 Alabama Public School & College Authority 2009-A 35,035,000 Alabama Public School & College Authority 2009-C 22,415,000 Alabama Federal Aid Highway Finance Authority 146,215,000 Alabama State Port Authority Refunded Bonds 106,045,000
Component Units University of Alabama at Tuscaloosa 34,400,000 University of South Alabama 90,690,000
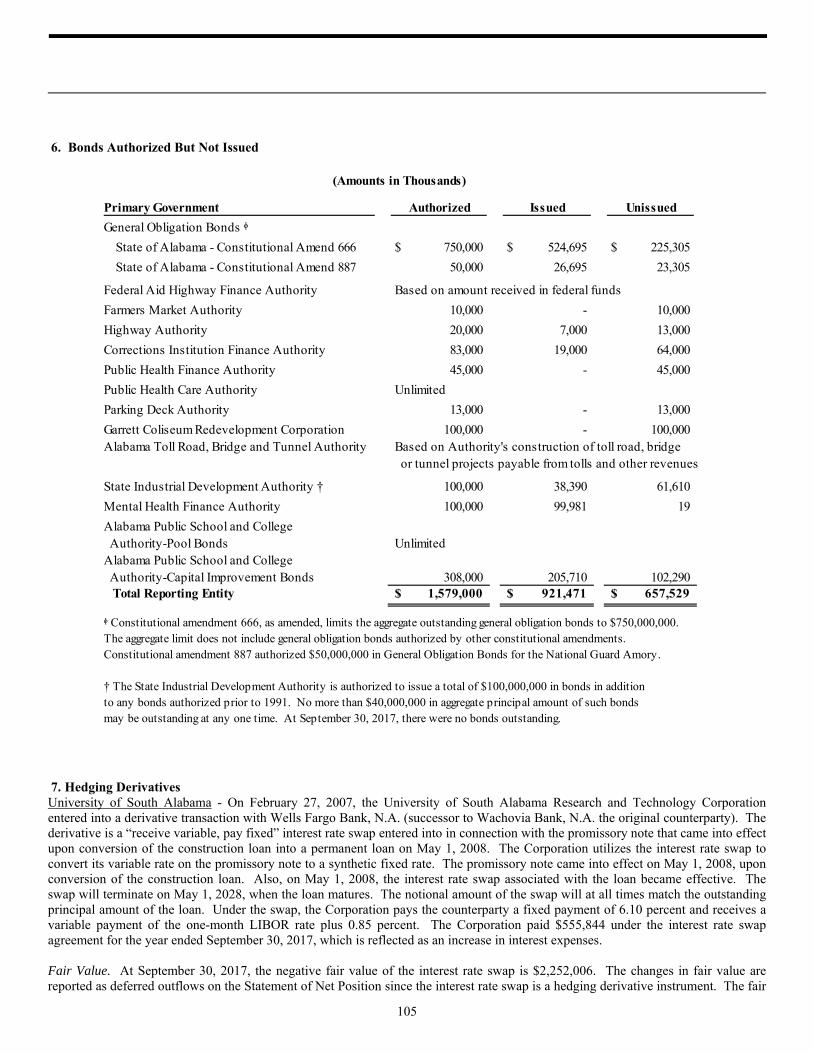
105
6. Bonds Authorized But Not Issued
7. Hedging Derivatives University of South Alabama - On February 27, 2007, the University of South Alabama Research and Technology Corporation entered into a derivative transaction with Wells Fargo Bank, N.A. (successor to Wachovia Bank, N.A. the original counterparty). The derivative is a “receive variable, pay fixed” interest rate swap entered into in connection with the promissory note that came into effect upon conversion of the construction loan into a permanent loan on May 1, 2008. The Corporation utilizes the interest rate swap to convert its variable rate on the promissory note to a synthetic fixed rate. The promissory note came into effect on May 1, 2008, upon conversion of the construction loan. Also, on May 1, 2008, the interest rate swap associated with the loan became effective. The swap will terminate on May 1, 2028, when the loan matures. The notional amount of the swap will at all times match the outstanding principal amount of the loan. Under the swap, the Corporation pays the counterparty a fixed payment of 6.10 percent and receives a variable payment of the one-month LIBOR rate plus 0.85 percent. The Corporation paid $555,844 under the interest rate swap agreement for the year ended September 30, 2017, which is reflected as an increase in interest expenses. Fair Value. At September 30, 2017, the negative fair value of the interest rate swap is $2,252,006. The changes in fair value are reported as deferred outflows on the Statement of Net Position since the interest rate swap is a hedging derivative instrument. The fair
Primary Government Authorized Issued Unissued
General Obligation Bonds ᶲ
State of Alabama - Constitutional Amend 666 750,000$ 524,695$ 225,305$
State of Alabama - Constitutional Amend 887 50,000 26,695 23,305
Federal Aid Highway Finance Authority Based on amount received in federal funds
Farmers Market Authority 10,000 - 10,000
Highway Authority 20,000 7,000 13,000
Corrections Institution Finance Authority 83,000 19,000 64,000
Public Health Finance Authority 45,000 - 45,000
Public Health Care Authority Unlimited
Parking Deck Authority 13,000 - 13,000
Garrett Coliseum Redevelopment Corporation 100,000 - 100,000 Alabama Toll Road, Bridge and Tunnel Authority Based on Authority's construction of toll road, bridge
or tunnel projects payable from tolls and other revenues
State Industrial Development Authority † 100,000 38,390 61,610
Mental Health Finance Authority 100,000 99,981 19
Alabama Public School and College Authority-Pool Bonds UnlimitedAlabama Public School and College Authority-Capital Improvement Bonds 308,000 205,710 102,290 Total Reporting Entity 1,579,000$ 921,471$ 657,529$
ᶲ Constitutional amendment 666, as amended, limits the aggregate outstanding general obligation bonds to $750,000,000.The aggregate limit does not include general obligation bonds authorized by other constitutional amendments.Constitutional amendment 887 authorized $50,000,000 in General Obligation Bonds for the National Guard Amory.
† The State Industrial Development Authority is authorized to issue a total of $100,000,000 in bonds in addition to any bonds authorized prior to 1991. No more than $40,000,000 in aggregate principal amount of such bondsmay be outstanding at any one time. At September 30, 2017, there were no bonds outstanding.
(Amounts in Thousands)

STATE OF ALABAMA NOTES TO THE FINANCIAL STATEMENTS For the Fiscal Year Ended September 30, 2017
106
value of the interest rate swap was estimated using the zero-coupon method. This method calculates the future net settlement payments required by the swap, assuming that the current forward rates implied by the yield curve correctly anticipate future spot interest rates. These payments are then discounted using the spot rates implied by the current yield curve for hypothetical zero-coupon bonds due on the date of each future net settlement. Interest Rate Risk. On the Corporation’s “receive-variable, pay-fixed” interest rate swap, as LIBOR decreases, the net payment on the swap increases. Credit Risk. As of September 30, 2017, the Corporation was not exposed to credit risk on the interest rate swap because it had a negative fair value. However, if interest rates change and the fair value of the derivative becomes positive, the Corporation would have a gross exposure to credit risk in the amount of the derivatives’ fair value. The counterparty was rated Aa2 by Moody’s Investors Services and AA- by Standard & Poor’s Ratings Services as of September 30, 2017. Termination Risk. The interest rate swap contracts use the International Swaps and Derivatives Association, Inc. Master Agreement, which includes standard default and termination events, such as failure to make payments, breach of agreement, and bankruptcy. At September 30, 2017, no events of default or termination had occurred. If the interest rate swap is terminated, interest rate risk associated with the variable rate debt would no longer be hedged. Also, if at the time of termination the interest rate swap had a negative fair value, the Corporation would be liable to the counterparty for a payment equal to the interest rate swap’s fair value. To allow the Corporation the maximum flexibility to manage the utilization of Building II and III while at the same time providing protection for the counterparty, the Corporation granted the counterparty a $2,000,000 mortgage secured by an interest in the ground lease with respect to the parcel of land on which Building II stands, an interest in Building II, a security interest in Building II tenant leases, and a security interest in income received from rental of Building II. Alabama State University – Alabama State University has entered into a pay-fixed interest rate swap agreement with J. P. Morgan Chase Bank with an objective of hedging cash flows on its 2004 Series General Revenue bonds with an effective date of August 27, 2004 and a maturity date of March 1, 2033. The terms of the agreement are for the University to pay 3.222 percent and receive 68 percent of the 30 day LIBOR rate. The notional amount at September 30, 2017 was $19,525,000 and the hedging derivative liability was a negative $3,063,000. The $1,590,000 decrease in fair value is reported in deferred outflows on the Statement of Net Position. As of September 30, 2017, the synthetic interest rates on the swapped portion of the 2004 general revenue bonds were 3.11% percent. The fair value of the pay-fixed rate swap was estimated through forecasting expected cash flows that are discounted. The University’s interest rate swap hedging derivatives have been determined to be effective using the synthetic instrument method. Interest Rate Risk. The University is exposed to interest rate risk on its interest rate swap. The fair value of this instrument is sensitive to interest rate changes. Because rates have changed since the effective date of the swap, a negative fair value existed at September 30, 2017. The negative fair value may be countered by a reduction in total interest payments required under the variable-rate bonds, creating lower synthetic interest rates. Because the coupons on the University’s variable-rate bonds adjust to changing interest rates, the bonds do not have corresponding fair value increases. As the yield curve rises, the value of the swap will increase and as rates fall, the value of the swap will decrease. Credit Risk. As of September 30, 2017, the University is not exposed to credit risk because the swap has a negative fair value. However, should interest rates change and the fair value of the swap become positive, the University would be exposed to credit risk in the amount of the derivatives’ fair value. Basis Risk. The University receives 68 percent of 1-month LIBOR Index from J.P. Morgan Chase Bank (JPM) and pays a floating rate to its bondholders set by the Remarketing Agent. The University incurs basis risk when its bonds trade at a yield above 68 percent of 1-month LIBOR Index. If the relationship of the University’s bonds trade to a percentage of LIBOR greater than 68 percent, the University will experience an increase in debt service above the fixed rate on the swap. Termination Risk. The interest rate swap agreement has a stated termination date of March 1, 2033; however, the University and counterparty, JPM have the right to terminate the agreement prior to such date upon the occurrence of certain extraordinary events, and further, JPM has retained an option to terminate the agreement at any time on or after March 1, 2012 for any reason with no obligation to make any termination payment other than the amount of any regular periodic payment accruing to the termination date. In addition, if the University terminates the agreement prior to March 1, 2033, the University would be liable to the counterparty for a payment equal to the swap’s negative fair value. Rollover Risk. The University is not exposed to rollover risk, because the maturity dates for hedged variable-rate bonds and the interest rate swap agreement are the same, March 2033.

107
8. Notes, Mortgages, and Capital Leases At September 30, 2017, assets recorded under capital leases were as follows (amounts expressed in thousands):
The State leases office buildings and equipment with varying terms and options. Most buildings under capital lease have a term of twenty-five to thirty years, but can range from twenty to forty years. Capital leases are recorded at the lower of the present value of the future minimum lease payments or fair market value. Principal and interest capital lease payments are recorded as expenditures of the applicable governmental function in the governmental fund. The largest capital leases in governmental activities are for buildings in county facilities used by the Department of Public Health and the Department of Human Resources.
Governmental Business-Type Component
Activities Activities Units
Maturity Principal Principal Principal
2018 22,764$ -$ 32,906$
2019 23,206 1,217 21,196
2020 22,088 - 18,010
2021 17,357 - 31,964
2022 15,587 - 13,493
2023-2027 78,818 - 48,712
2028-2032 61,850 - 37,037
2033-2037 15,054 - 34,178
2038-2042 5,208 - 9,266
2043-2047 842 - 3,043
2048-2052 351 - -
Total 263,125 1,217 249,805
Interest (70,828) - (51,986)
Net 192,297$ 1,217$ 197,819$
Debt Principal Requirements to Maturity
(Amounts in Thousands)
Governmental
Activities(Amts in Thousands)
Buildings 148,932$
Less: accumulated depreciation (57,785) Total 91,147$

STATE OF ALABAMA NOTES TO THE FINANCIAL STATEMENTS For the Fiscal Year Ended September 30, 2017
108
9. Changes in Noncurrent Liabilities
Beginning (Amounts in Thousands) Balance Ending Due Within
(As Restated) Additions Reductions Balance One YearPrimary Government
Governmental Activities:Bonds Payable: General Obligation Bonds 656,385$ 105,140$ 157,010$ 604,515$ 52,410$ Revenue Bonds 3,370,042 1,421,730 398,375 4,393,397 295,985 Total Bond Principal 4,026,427 1,526,870 555,385 4,997,912 348,395 Plus: Premiums 360,048 166,365 94,272 432,141 - Less: Discounts - 2,587 118 2,469 - Total Bonds Payable 4,386,475 1,690,648 649,539 5,427,584 348,395 Capital Leases/Notes/Mortgages 191,200 17,320 16,223 192,297 14,466 Claims & Judgments 64,802 25,877 10,873 79,806 5,912 Compensated Absences † 277,210 159,651 158,813 278,048 23,535 Net Pension Liabilities 3,419,659 1,078,121 877,446 3,620,334 - Other Long-Term Liabilities 343 - 343 - - Other Post-Employment Benefits 1,195,905 196,821 87,050 1,305,676 -
Total Governmental Activities 9,535,594 3,168,438 1,800,287 10,903,745 392,308
Business-type Activities:Revenue Bonds 344,610 290,291 307,500 327,401 9,115 Capital Leases/Notes/Mortgages 1,549 - 332 1,217 - Claims & Judgments 10,431 13,536 10,666 13,301 9,740 Compensated Absences † 10,518 3,255 3,130 10,643 2,359 Net Pension Liabilities 86,155 47,542 40,732 92,965 - Other Long-Term Liabilities ‡ 9,012 - 2,433 6,579 135 Other Post-Employment Benefits 50,668 8,284 3,664 55,288 -
Total Business-Type Activities 512,943 362,908 368,457 507,394 21,349
Total Primary Government 10,048,537$ 3,531,346$ 2,168,744$ 11,411,139$ 413,657$
Component Units:
Revenue Bonds 4,148,378$ 1,071,264$ 921,216$ 4,298,426$ 184,162$ Capital Leases/Notes/Mortgages 181,322 42,869 26,371 197,820 28,277 Compensated Absences † 177,884 9,921 5,887 181,918 140,505 Net Pension Liabilities 4,133,244 2,000,187 1,828,483 4,304,948 - Claims & Judgments 119,763 1,186,864 1,193,294 113,333 36,816 Other Long-Term Liabilities § 175,369 208 9,817 165,760 - Other Post-Employment Benefits 15,828 2,742 1,213 17,357 -
Total Component Units 8,951,788$ 4,314,055$ 3,986,281$ 9,279,562$ 389,760$
† Compensated Absences debt is liquidated proportionately by all funds having payroll costs.‡ Other Long-term liabilit ies are reported by the State Port Authority.§ Other Long-term liabilit ies are payable as follows: University of Alabama $26,786, Agricultural Development Authority $85, Auburn University $49,587, University of South Alabama, $84,496, University of North Alabama, $406, Alabama State University, $3,063, and the Alabama Community College System, $1,337.
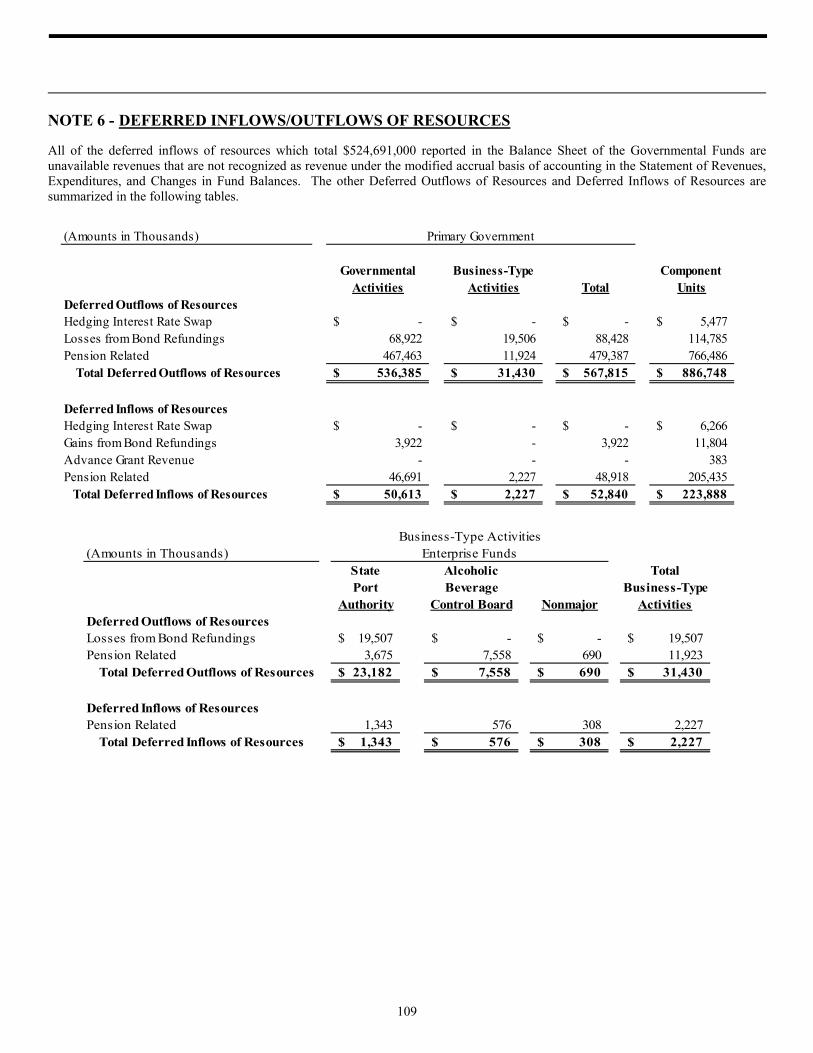
109
NOTE 6 - DEFERRED INFLOWS/OUTFLOWS OF RESOURCES
All of the deferred inflows of resources which total $524,691,000 reported in the Balance Sheet of the Governmental Funds are unavailable revenues that are not recognized as revenue under the modified accrual basis of accounting in the Statement of Revenues, Expenditures, and Changes in Fund Balances. The other Deferred Outflows of Resources and Deferred Inflows of Resources are summarized in the following tables.
(Amounts in Thousands)State Alcoholic TotalPort Beverage Business-Type
Authority Control Board Nonmajor ActivitiesDeferred Outflows of ResourcesLosses from Bond Refundings 19,507$ -$ -$ 19,507$ Pension Related 3,675 7,558 690 11,923 Total Deferred Outflows of Resources 23,182$ 7,558$ 690$ 31,430$
Deferred Inflows of ResourcesPension Related 1,343 576 308 2,227 Total Deferred Inflows of Resources 1,343$ 576$ 308$ 2,227$
Business-Type ActivitiesEnterprise Funds
(Amounts in Thousands)
Governmental Business-Type Component Activities Activities Total Units
Deferred Outflows of ResourcesHedging Interest Rate Swap -$ -$ -$ 5,477$ Losses from Bond Refundings 68,922 19,506 88,428 114,785 Pension Related 467,463 11,924 479,387 766,486 Total Deferred Outflows of Resources 536,385$ 31,430$ 567,815$ 886,748$
Deferred Inflows of ResourcesHedging Interest Rate Swap -$ -$ -$ 6,266$ Gains from Bond Refundings 3,922 - 3,922 11,804 Advance Grant Revenue - - - 383 Pension Related 46,691 2,227 48,918 205,435 Total Deferred Inflows of Resources 50,613$ 2,227$ 52,840$ 223,888$
Primary Government
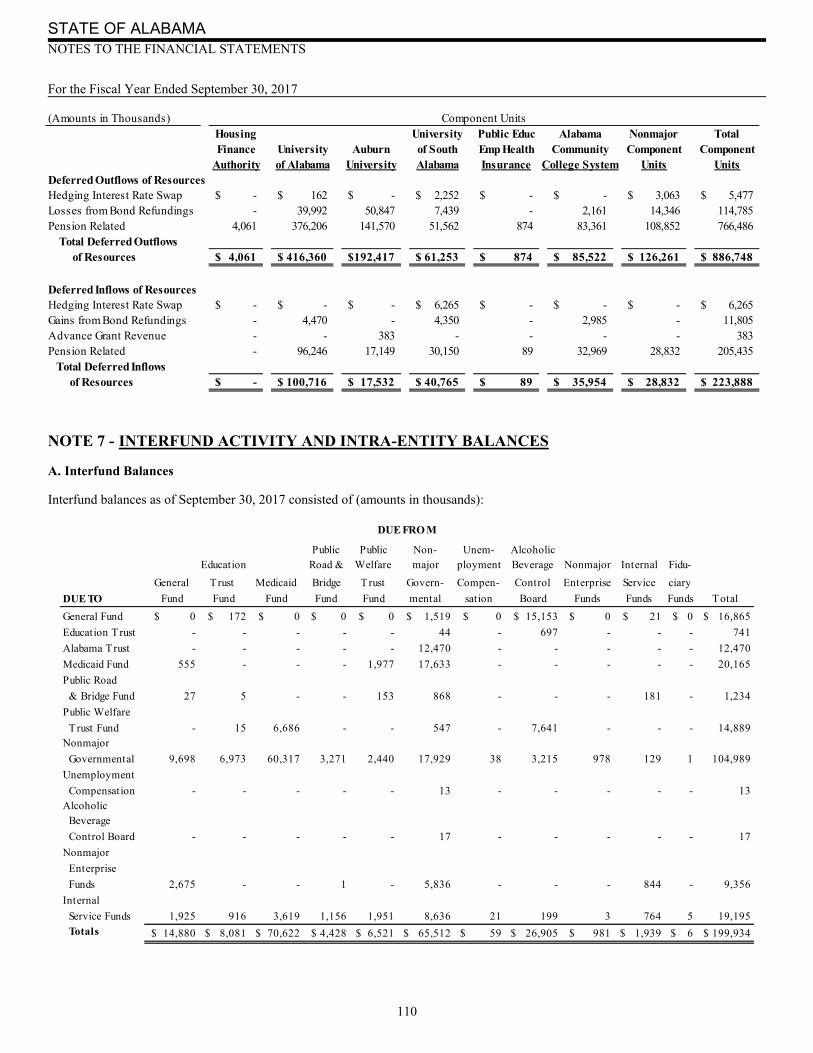
STATE OF ALABAMA NOTES TO THE FINANCIAL STATEMENTS For the Fiscal Year Ended September 30, 2017
110
NOTE 7 - INTERFUND ACTIVITY AND INTRA-ENTITY BALANCES
A. Interfund Balances
Interfund balances as of September 30, 2017 consisted of (amounts in thousands):
(Amounts in Thousands)Housing University Public Educ Alabama Nonmajor TotalFinance University Auburn of South Emp Health Community Component Component
Authority of Alabama University Alabama Insurance College System Units UnitsDeferred Outflows of ResourcesHedging Interest Rate Swap -$ 162$ -$ 2,252$ -$ -$ 3,063$ 5,477$ Losses from Bond Refundings - 39,992 50,847 7,439 - 2,161 14,346 114,785 Pension Related 4,061 376,206 141,570 51,562 874 83,361 108,852 766,486 Total Deferred Outflows of Resources 4,061$ 416,360$ 192,417$ 61,253$ 874$ 85,522$ 126,261$ 886,748$
Deferred Inflows of ResourcesHedging Interest Rate Swap -$ -$ -$ 6,265$ -$ -$ -$ 6,265$ Gains from Bond Refundings - 4,470 - 4,350 - 2,985 - 11,805 Advance Grant Revenue - - 383 - - - - 383 Pension Related - 96,246 17,149 30,150 89 32,969 28,832 205,435 Total Deferred Inflows of Resources -$ 100,716$ 17,532$ 40,765$ 89$ 35,954$ 28,832$ 223,888$
Component Units
Public Public Non- Unem- AlcoholicEducation Road & Welfare major ployment Beverage Nonmajor Internal Fidu-
General Trust Medicaid Bridge Trust Govern- Compen- Control Enterprise Service ciary
DUE TO Fund Fund Fund Fund Fund mental sation Board Funds Funds Funds Total
General Fund $ 0 $ 172 $ 0 $ 0 $ 0 $ 1,519 $ 0 $ 15,153 $ 0 $ 21 $ 0 $ 16,865
Education Trust - - - - - 44 - 697 - - - 741
Alabama Trust - - - - - 12,470 - - - - - 12,470
Medicaid Fund 555 - - - 1,977 17,633 - - - - - 20,165
Public Road
& Bridge Fund 27 5 - - 153 868 - - - 181 - 1,234
Public Welfare
T rust Fund - 15 6,686 - - 547 - 7,641 - - - 14,889 Nonmajor
Governmental 9,698 6,973 60,317 3,271 2,440 17,929 38 3,215 978 129 1 104,989
Unemployment
Compensation - - - - - 13 - - - - - 13 Alcoholic Beverage
Control Board - - - - - 17 - - - - - 17
Nonmajor
Enterprise
Funds 2,675 - - 1 - 5,836 - - - 844 - 9,356
Internal
Service Funds 1,925 916 3,619 1,156 1,951 8,636 21 199 3 764 5 19,195
Totals 14,880$ 8,081$ 70,622$ 4,428$ 6,521$ 65,512$ 59$ 26,905$ 981$ 1,939$ 6$ 199,934$
DUE FRO M

111
The majority of the interfund balances due to the Nonmajor Governmental Funds from the General Fund, Education Trust Fund, Medicaid, Unemployment Compensation Fund, and the Nonmajor Governmental Funds consist of routine short term borrowings of cash between funds of individual agencies. The General Fund has interfund payables totaling, $14,880,000 in total. Of that amount, $9,698,000 is to due to Nonmajor Governmental Funds. The majority of the interfund payables is $4,499,000 due to Department of Corrections, $4,183,000 due to Public Health, $939,000 owed to Alabama Department of Economic and Community Affairs, $47,000 due to the Emergency Management Agency, $22,000 to the Department of Commerce, and $8,000 to the Secretary of State. The Education Trust Fund has interfund payables of $8,081,000 in total. Of that amount, $6,973,000 was payable to Nonmajor Governmental Funds. Medicaid owed $6,686,000 to the Public Welfare Trust Fund and $60,317,000 to Nonmajor Governmental Funds. Of the amount owed to Nonmajor Governmental Funds, $42,391,000 is due to Mental Health, $8,085,000 is due to Senior Services, $6,776,000 is due to Public Health, $2,318,000 is due to Youth Services, $739,000 is due to Rehabilitation Services, with the remainder due to Attorney General and Legislative Reference Services. Nonmajor Governmental Funds have interfund payables totaling $65,512,000. Of that amount, $17,633,000 is owed to Medicaid, $17,929,000 is owed to other Nonmajor Governmental Funds, and $8,636,000 is owed to Internal Service Funds for goods and services. The Alcoholic Beverage Control Board (ABC) has interfund payables totaling $26,905,000. ABC owed $15,153,000 to the General Fund and $7,641,000 to the Public Welfare Trust Fund. ABC is required by law to distribute profits and certain taxes collected to those two funds and local governments. The law also allows ABC to delay distribution for 120 days in order to maintain sufficient operating cash. Nonmajor Governmental Funds has the largest interfund receivables, at $104,989,000. More than half, or $60,317,000 is due from Medicaid. The Medicaid Fund has the second most interfund receivables at $20,165,000. $13,126,000 of that amount is due from Department of Mental Health, a Nonmajor Governmental Fund. The Internal Service Funds rank third in interfund receivables, at $19,195,000. The Internal Service Fund receivables generally represent normal billings for services rendered or goods sold to the other funds late in the fiscal year which will be paid early in the subsequent fiscal year.
B. Balances with Component Units
Balances owed by state funds to component units at September 30, 2017, consisted of (amounts in thousands):
Water Pollution Control Authority, a Nonmajor component unit, has a long term receivable of $4,868,000 that is due from the primary government as a whole. The second largest payable of $712,000 is a short term payable owed by Nonmajor Governmental Funds to the Supercomputer Authority and other nonmajor component units.
Nonmajor
Component
PAYABLE BY Units
General Fund $ 164
Education Trust Fund 117
Public Road and Bridge Fund 6
Nonmajor Governmental 712
Alcoholic Beverage Control Board 1
Internal Service Funds 512
Primary Government 4,868
Totals $ 6,380

STATE OF ALABAMA NOTES TO THE FINANCIAL STATEMENTS For the Fiscal Year Ended September 30, 2017
112
Balances owed to state funds by component units at September 30, 2017 consisted of (amounts in thousands):
The component units of the State owe $132,807,000 to various funds of the State. The largest amount, $131,118,000, is owed by the University of Alabama to the Department of Mental Health for the purchase of the Bryce Hospital property and the construction of replacement facilities and to the Department of Conservation for a construction contract related to the Gulf State Park Project. $794,000 is owed to Nonmajor Governmental funds by Nonmajor Component Units. Of that amount, $136,000 is owed by the Water Pollution Control Authority. This payable is owed to the Department of Environmental Management primarily for administrative and payroll costs. State Insurance Fund, a Nonmajor Enterprise Fund, financed building renovations for Crime Victims Compensation, a Nonmajor Component Unit in the amount of $10,000 for a period of less than one year. The Internal Service Fund receivable of $103,000 is owed for routine billings of services rendered.
C. Balances between Component Units
There were not any balances owed between component units at September 30, 2017.
D. Interfund Transfers
Transfers among the various funds of the primary government during fiscal year 2017 were as follows (amounts in thousands):
PublicUniversity Education Nonmajor
of Employees' ComponentPAYABLE TO Alabama Health Insur Units Total
Public Road and Bridge Fund $ - $ - $ 5 $ 5
Nonmajor Governmental 131,118 724 794 132,636 Nonmajor Enterprise - - 63 63
Internal Service Funds - 3 100 103
Totals $ 131,118 $ 727 $ 962 $ 132,807
PAYABLE FROM
Public Public Non- Unem- Alcoholic Non-
Alabama Road & Welfare major ployment Beverage major Internal
TRANSFERS General Trust Medicaid Bridge Trust Govern- Compen- Control Enter- Service Fiduciary
O UT Fund Fund Fund Fund Fund mental sation Board prise Funds Funds Total
General Fund 0$ 0$ 20,645$ 0$ 61,371$ 277,977$ 0$ 0$ 0$ 4,478$ 0$ 364,471$
Education
Trust Fund - - 7,050 - 31,529 203,740 - - 4,233 1,387 63,622 311,561
Alabama Trust 98,040 - - - - 60,479 - - - - - 158,519
Medicaid - - - - 67,158 663,058 - - - 929 - 731,145 Public Road & Bridge Fund - - - - - 160,634 - - - 1,026 - 161,660
Public Welfare
T rust Fund - - 37,187 498 - 53,119 - - - 623 - 91,427
Nonmajor
Governmental 259,566 243,014 227,556 313,662 1,374 563,475 1,107 60 - 11,310 - 1,621,124
Unemployment
Compensation - - - - - 9,508 - - - - - 9,508
State Port Auth - - - - - 63 - - - - - 63
Alcoholic
Beverage
Control Board 15,456 - - - 483 18,949 - - - 167 - 35,055
Nonmajor Enterprise - - - - - 11,747 - - - 10 - 11,757
Internal Service Funds - - - - - 2,712 - - - 5,723 - 8,435
Fiduciary Funds - - - - - 191 - - - - - 191 Totals 373,062$ 243,014$ 292,438$ 314,160$ 161,915$ 2,025,652$ 1,107$ 60$ 4,233$ 25,653$ 63,622$ 3,504,916$
TRANSFERS IN
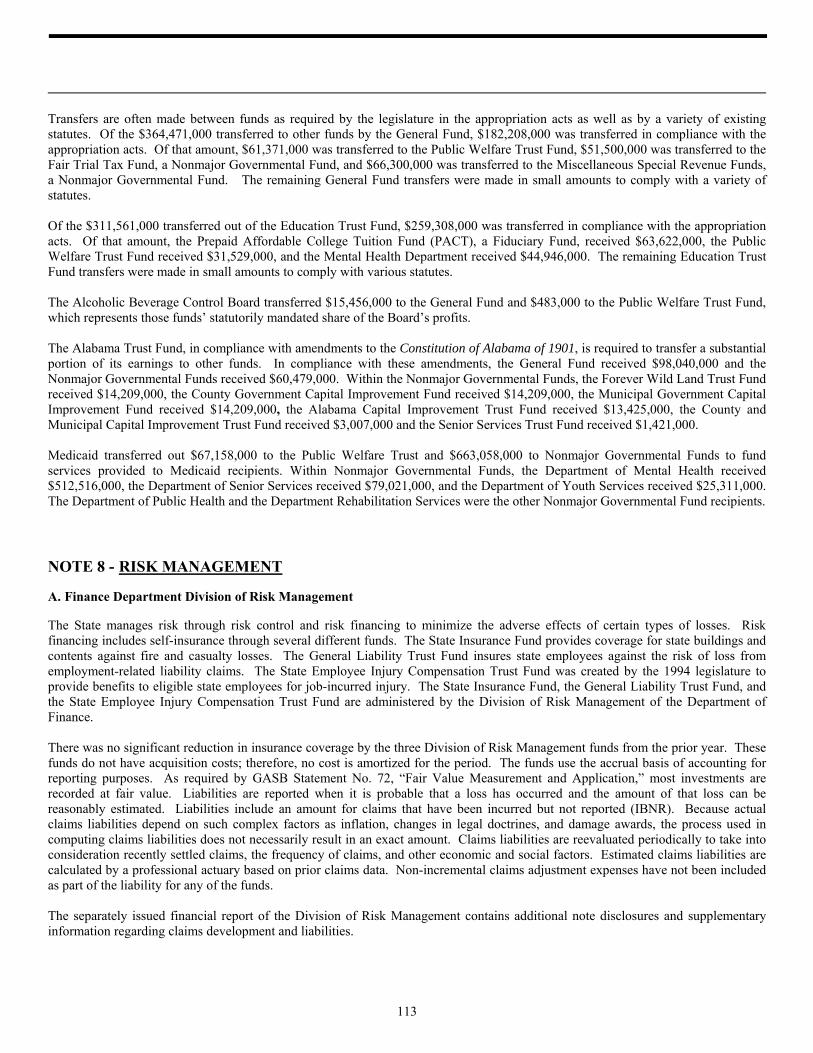
113
Transfers are often made between funds as required by the legislature in the appropriation acts as well as by a variety of existing statutes. Of the $364,471,000 transferred to other funds by the General Fund, $182,208,000 was transferred in compliance with the appropriation acts. Of that amount, $61,371,000 was transferred to the Public Welfare Trust Fund, $51,500,000 was transferred to the Fair Trial Tax Fund, a Nonmajor Governmental Fund, and $66,300,000 was transferred to the Miscellaneous Special Revenue Funds, a Nonmajor Governmental Fund. The remaining General Fund transfers were made in small amounts to comply with a variety of statutes. Of the $311,561,000 transferred out of the Education Trust Fund, $259,308,000 was transferred in compliance with the appropriation acts. Of that amount, the Prepaid Affordable College Tuition Fund (PACT), a Fiduciary Fund, received $63,622,000, the Public Welfare Trust Fund received $31,529,000, and the Mental Health Department received $44,946,000. The remaining Education Trust Fund transfers were made in small amounts to comply with various statutes. The Alcoholic Beverage Control Board transferred $15,456,000 to the General Fund and $483,000 to the Public Welfare Trust Fund, which represents those funds’ statutorily mandated share of the Board’s profits. The Alabama Trust Fund, in compliance with amendments to the Constitution of Alabama of 1901, is required to transfer a substantial portion of its earnings to other funds. In compliance with these amendments, the General Fund received $98,040,000 and the Nonmajor Governmental Funds received $60,479,000. Within the Nonmajor Governmental Funds, the Forever Wild Land Trust Fund received $14,209,000, the County Government Capital Improvement Fund received $14,209,000, the Municipal Government Capital Improvement Fund received $14,209,000, the Alabama Capital Improvement Trust Fund received $13,425,000, the County and Municipal Capital Improvement Trust Fund received $3,007,000 and the Senior Services Trust Fund received $1,421,000. Medicaid transferred out $67,158,000 to the Public Welfare Trust and $663,058,000 to Nonmajor Governmental Funds to fund services provided to Medicaid recipients. Within Nonmajor Governmental Funds, the Department of Mental Health received $512,516,000, the Department of Senior Services received $79,021,000, and the Department of Youth Services received $25,311,000. The Department of Public Health and the Department Rehabilitation Services were the other Nonmajor Governmental Fund recipients.
NOTE 8 - RISK MANAGEMENT
A. Finance Department Division of Risk Management
The State manages risk through risk control and risk financing to minimize the adverse effects of certain types of losses. Risk financing includes self-insurance through several different funds. The State Insurance Fund provides coverage for state buildings and contents against fire and casualty losses. The General Liability Trust Fund insures state employees against the risk of loss from employment-related liability claims. The State Employee Injury Compensation Trust Fund was created by the 1994 legislature to provide benefits to eligible state employees for job-incurred injury. The State Insurance Fund, the General Liability Trust Fund, and the State Employee Injury Compensation Trust Fund are administered by the Division of Risk Management of the Department of Finance. There was no significant reduction in insurance coverage by the three Division of Risk Management funds from the prior year. These funds do not have acquisition costs; therefore, no cost is amortized for the period. The funds use the accrual basis of accounting for reporting purposes. As required by GASB Statement No. 72, “Fair Value Measurement and Application,” most investments are recorded at fair value. Liabilities are reported when it is probable that a loss has occurred and the amount of that loss can be reasonably estimated. Liabilities include an amount for claims that have been incurred but not reported (IBNR). Because actual claims liabilities depend on such complex factors as inflation, changes in legal doctrines, and damage awards, the process used in computing claims liabilities does not necessarily result in an exact amount. Claims liabilities are reevaluated periodically to take into consideration recently settled claims, the frequency of claims, and other economic and social factors. Estimated claims liabilities are calculated by a professional actuary based on prior claims data. Non-incremental claims adjustment expenses have not been included as part of the liability for any of the funds. The separately issued financial report of the Division of Risk Management contains additional note disclosures and supplementary information regarding claims development and liabilities.

STATE OF ALABAMA NOTES TO THE FINANCIAL STATEMENTS For the Fiscal Year Ended September 30, 2017
114
1. State Insurance Fund The State Insurance Fund (SIF) was established in 1923 and is under the Code of Alabama 1975, Section 41-15-1 for the purpose of insuring direct physical loss on buildings and contents in which title in whole or in part is vested in the State of Alabama or any of its agencies or institutions or in which funds provided by the State have been used for the purchases of land, construction of buildings, purchase or maintenance of any equipment, machinery, furniture, fixtures or supplies in such buildings and public school buildings together with the contents of all such buildings. All covered property shall be insured for no more than its replacement cost and shall be insured for no less than 80 percent of its actual cash value. Salvage value coverage, used on property that is normally uninsurable, is determined by applying eight percent of the property’s reconstruction value. City boards of education may insure school buildings and property either in the State Insurance Fund or with an insurance company, whichever in the opinion of such board provides the best coverage for such school buildings and property. The principles of private industry insurance companies are utilized to establish rates, premium discounts, and experience credits to result in equitable premiums charged to policyholders. Excess insurance and reinsurance is acquired to assure the solvency of the fund. The State of Alabama, 122 city and county boards of education, and 19 entities in which State funds were used for capital acquisitions are participants in the pool. Losses are recorded as current liabilities and expenses in the year reported. IBNR recognizes losses that have occurred but have not yet been reported. This liability and expense is determined by a professional actuary. The SIF has a $10,000,000 cumulative loss annual deductible and a $3,500,000 specific loss deductible for all perils except named and numbered wind, and a $10,000,000 specific loss deductible for named and numbered wind losses. Excess insurance covers claims exceeding the deductible with a $450,000,000 limit for named wind storms and a $2,000,000,000 limit for all other perils. Payments received in fiscal years 2017 and 2016 for settlements in excess of deductibles totaled $3,143,000 and $0 respectively. The following table presents the changes in claims liabilities for the past two years: (Amounts in Thousands)
2017 2016Reported claims payable and estimated claims incurred but not reported at beginning of year $ 7,175 $ 6,855
Incurred claims and adjustment expenses:Provision for insured events of the current year 12,822 11,900 Increase (Decrease) in provision for insured events of prior years (6) (991) Total incurred claims and adjustment expenses 12,816 10,909
Payments:Claims and adjustment expenses attributable to insured events of the current year (5,240) (6,316)Claims and adjustment expenses attributable to insured events of prior years (4,925) (4,273) Total payments (10,165) (10,589)
Reported claims payable and estimated claims incurred but not reported at end of year $ 9,826 $ 7,175
September 30,
A schedule of ten-year loss development information for the State Insurance Fund is in the Required Supplementary Information section of the CAFR.
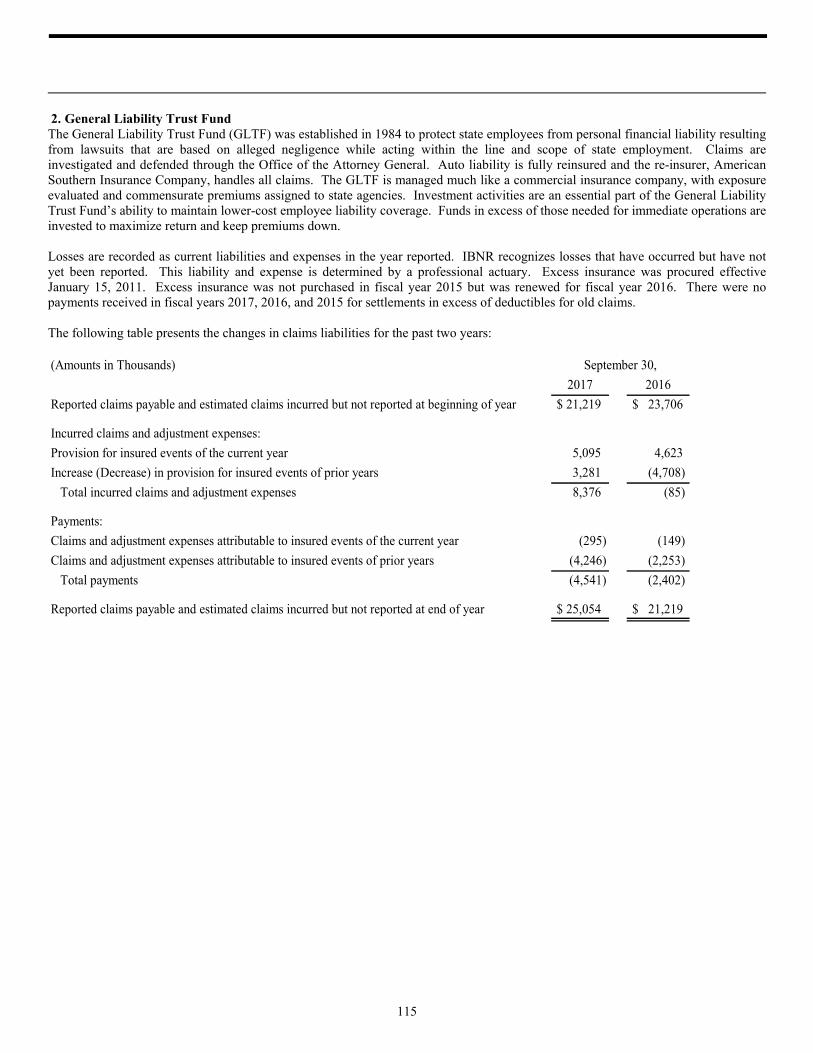
115
2. General Liability Trust Fund The General Liability Trust Fund (GLTF) was established in 1984 to protect state employees from personal financial liability resulting from lawsuits that are based on alleged negligence while acting within the line and scope of state employment. Claims are investigated and defended through the Office of the Attorney General. Auto liability is fully reinsured and the re-insurer, American Southern Insurance Company, handles all claims. The GLTF is managed much like a commercial insurance company, with exposure evaluated and commensurate premiums assigned to state agencies. Investment activities are an essential part of the General Liability Trust Fund’s ability to maintain lower-cost employee liability coverage. Funds in excess of those needed for immediate operations are invested to maximize return and keep premiums down. Losses are recorded as current liabilities and expenses in the year reported. IBNR recognizes losses that have occurred but have not yet been reported. This liability and expense is determined by a professional actuary. Excess insurance was procured effective January 15, 2011. Excess insurance was not purchased in fiscal year 2015 but was renewed for fiscal year 2016. There were no payments received in fiscal years 2017, 2016, and 2015 for settlements in excess of deductibles for old claims. The following table presents the changes in claims liabilities for the past two years: (Amounts in Thousands)
2017 2016
Reported claims payable and estimated claims incurred but not reported at beginning of year $ 21,219 $ 23,706
Incurred claims and adjustment expenses:
Provision for insured events of the current year 5,095 4,623
Increase (Decrease) in provision for insured events of prior years 3,281 (4,708)
Total incurred claims and adjustment expenses 8,376 (85)
Payments:
Claims and adjustment expenses attributable to insured events of the current year (295) (149)
Claims and adjustment expenses attributable to insured events of prior years (4,246) (2,253)
Total payments (4,541) (2,402)
Reported claims payable and estimated claims incurred but not reported at end of year $ 25,054 $ 21,219
September 30,
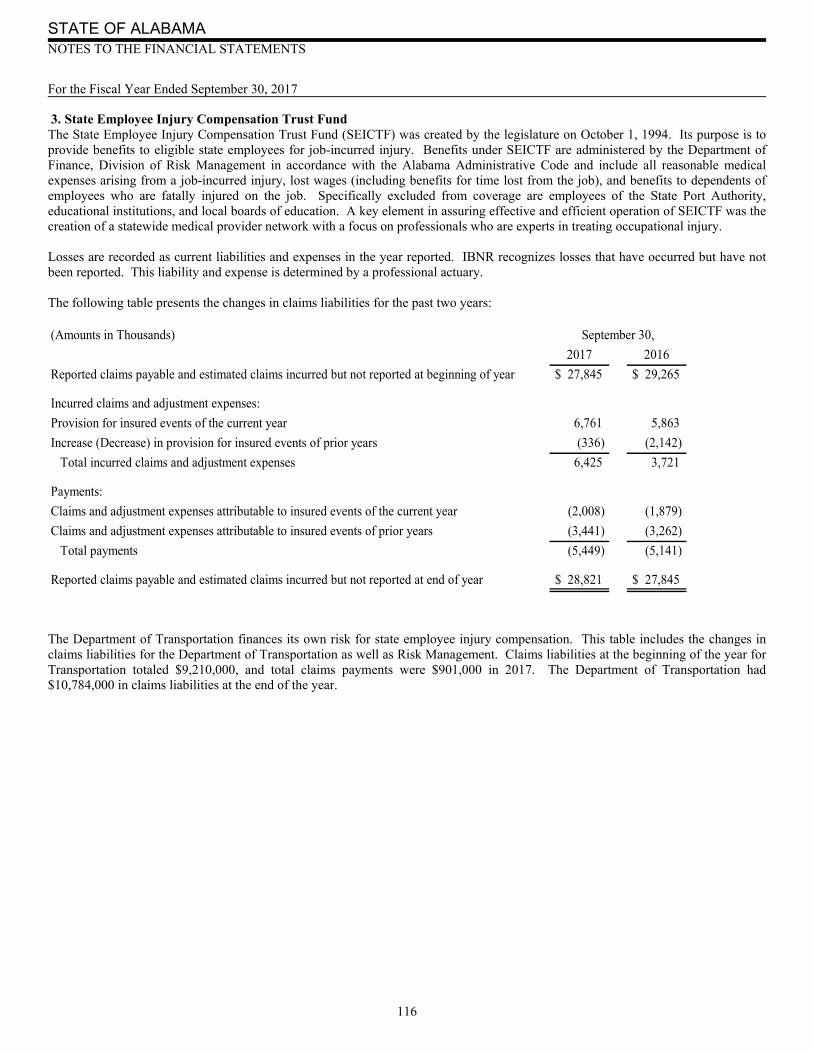
STATE OF ALABAMA NOTES TO THE FINANCIAL STATEMENTS For the Fiscal Year Ended September 30, 2017
116
3. State Employee Injury Compensation Trust Fund The State Employee Injury Compensation Trust Fund (SEICTF) was created by the legislature on October 1, 1994. Its purpose is to provide benefits to eligible state employees for job-incurred injury. Benefits under SEICTF are administered by the Department of Finance, Division of Risk Management in accordance with the Alabama Administrative Code and include all reasonable medical expenses arising from a job-incurred injury, lost wages (including benefits for time lost from the job), and benefits to dependents of employees who are fatally injured on the job. Specifically excluded from coverage are employees of the State Port Authority, educational institutions, and local boards of education. A key element in assuring effective and efficient operation of SEICTF was the creation of a statewide medical provider network with a focus on professionals who are experts in treating occupational injury. Losses are recorded as current liabilities and expenses in the year reported. IBNR recognizes losses that have occurred but have not been reported. This liability and expense is determined by a professional actuary. The following table presents the changes in claims liabilities for the past two years: (Amounts in Thousands)
2017 2016
Reported claims payable and estimated claims incurred but not reported at beginning of year $ 27,845 $ 29,265
Incurred claims and adjustment expenses:
Provision for insured events of the current year 6,761 5,863
Increase (Decrease) in provision for insured events of prior years (336) (2,142)
Total incurred claims and adjustment expenses 6,425 3,721
Payments:
Claims and adjustment expenses attributable to insured events of the current year (2,008) (1,879)
Claims and adjustment expenses attributable to insured events of prior years (3,441) (3,262)
Total payments (5,449) (5,141)
Reported claims payable and estimated claims incurred but not reported at end of year $ 28,821 $ 27,845
September 30,
The Department of Transportation finances its own risk for state employee injury compensation. This table includes the changes in claims liabilities for the Department of Transportation as well as Risk Management. Claims liabilities at the beginning of the year for Transportation totaled $9,210,000, and total claims payments were $901,000 in 2017. The Department of Transportation had $10,784,000 in claims liabilities at the end of the year.
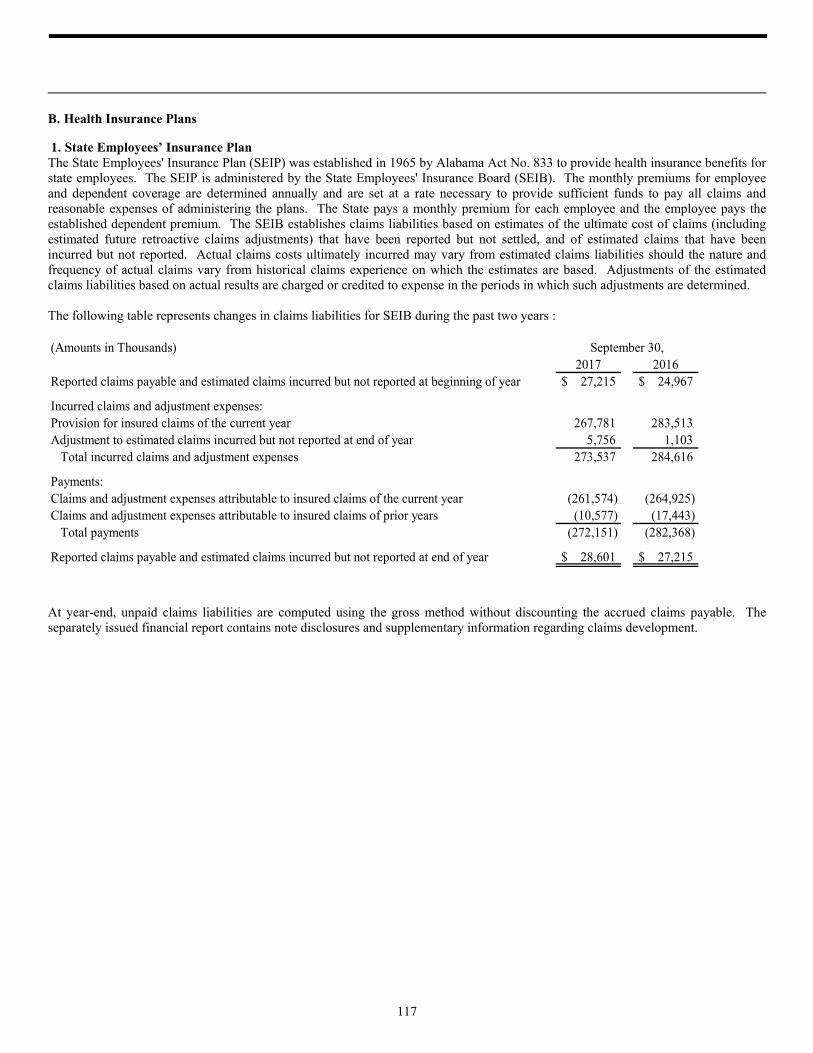
117
B. Health Insurance Plans
1. State Employees’ Insurance Plan The State Employees' Insurance Plan (SEIP) was established in 1965 by Alabama Act No. 833 to provide health insurance benefits for state employees. The SEIP is administered by the State Employees' Insurance Board (SEIB). The monthly premiums for employee and dependent coverage are determined annually and are set at a rate necessary to provide sufficient funds to pay all claims and reasonable expenses of administering the plans. The State pays a monthly premium for each employee and the employee pays the established dependent premium. The SEIB establishes claims liabilities based on estimates of the ultimate cost of claims (including estimated future retroactive claims adjustments) that have been reported but not settled, and of estimated claims that have been incurred but not reported. Actual claims costs ultimately incurred may vary from estimated claims liabilities should the nature and frequency of actual claims vary from historical claims experience on which the estimates are based. Adjustments of the estimated claims liabilities based on actual results are charged or credited to expense in the periods in which such adjustments are determined. The following table represents changes in claims liabilities for SEIB during the past two years : (Amounts in Thousands)
2017 2016Reported claims payable and estimated claims incurred but not reported at beginning of year $ 27,215 $ 24,967
Incurred claims and adjustment expenses:Provision for insured claims of the current year 267,781 283,513 Adjustment to estimated claims incurred but not reported at end of year 5,756 1,103 Total incurred claims and adjustment expenses 273,537 284,616
Payments:Claims and adjustment expenses attributable to insured claims of the current year (261,574) (264,925)Claims and adjustment expenses attributable to insured claims of prior years (10,577) (17,443) Total payments (272,151) (282,368)
Reported claims payable and estimated claims incurred but not reported at end of year $ 28,601 $ 27,215
September 30,
At year-end, unpaid claims liabilities are computed using the gross method without discounting the accrued claims payable. The separately issued financial report contains note disclosures and supplementary information regarding claims development.
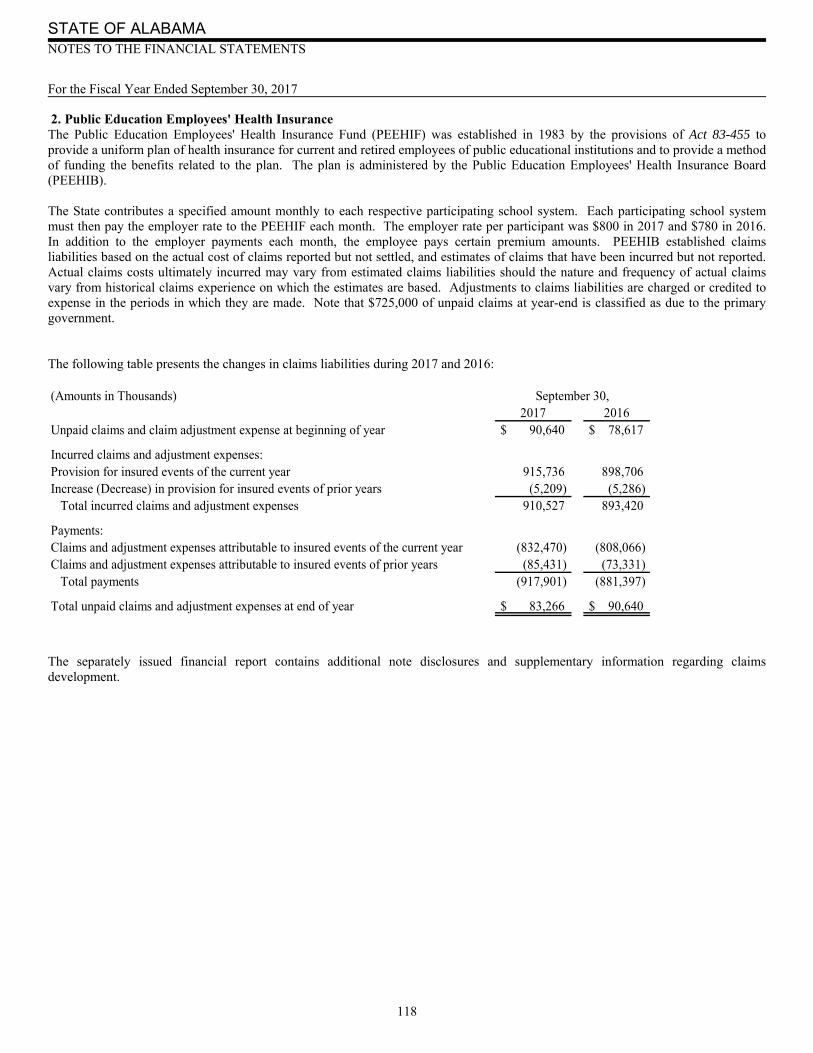
STATE OF ALABAMA NOTES TO THE FINANCIAL STATEMENTS For the Fiscal Year Ended September 30, 2017
118
2. Public Education Employees' Health Insurance The Public Education Employees' Health Insurance Fund (PEEHIF) was established in 1983 by the provisions of Act 83-455 to provide a uniform plan of health insurance for current and retired employees of public educational institutions and to provide a method of funding the benefits related to the plan. The plan is administered by the Public Education Employees' Health Insurance Board (PEEHIB). The State contributes a specified amount monthly to each respective participating school system. Each participating school system must then pay the employer rate to the PEEHIF each month. The employer rate per participant was $800 in 2017 and $780 in 2016. In addition to the employer payments each month, the employee pays certain premium amounts. PEEHIB established claims liabilities based on the actual cost of claims reported but not settled, and estimates of claims that have been incurred but not reported. Actual claims costs ultimately incurred may vary from estimated claims liabilities should the nature and frequency of actual claims vary from historical claims experience on which the estimates are based. Adjustments to claims liabilities are charged or credited to expense in the periods in which they are made. Note that $725,000 of unpaid claims at year-end is classified as due to the primary government. The following table presents the changes in claims liabilities during 2017 and 2016:
2017 2016Unpaid claims and claim adjustment expense at beginning of year $ 90,640 $ 78,617
Incurred claims and adjustment expenses:Provision for insured events of the current year 915,736 898,706 Increase (Decrease) in provision for insured events of prior years (5,209) (5,286) Total incurred claims and adjustment expenses 910,527 893,420
Payments:Claims and adjustment expenses attributable to insured events of the current year (832,470) (808,066)Claims and adjustment expenses attributable to insured events of prior years (85,431) (73,331) Total payments (917,901) (881,397)
Total unpaid claims and adjustment expenses at end of year $ 83,266 $ 90,640
(Amounts in Thousands) September 30,
The separately issued financial report contains additional note disclosures and supplementary information regarding claims development.
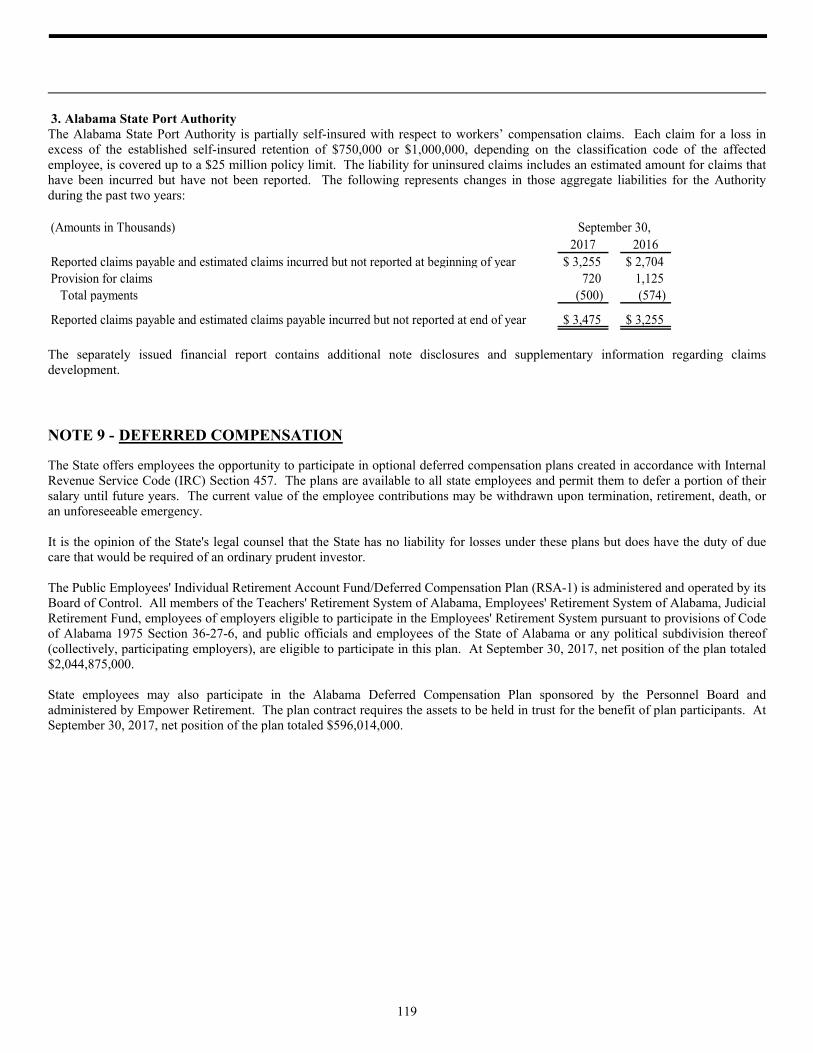
119
3. Alabama State Port Authority The Alabama State Port Authority is partially self-insured with respect to workers’ compensation claims. Each claim for a loss in excess of the established self-insured retention of $750,000 or $1,000,000, depending on the classification code of the affected employee, is covered up to a $25 million policy limit. The liability for uninsured claims includes an estimated amount for claims that have been incurred but have not been reported. The following represents changes in those aggregate liabilities for the Authority during the past two years: (Amounts in Thousands)
2017 2016Reported claims payable and estimated claims incurred but not reported at beginning of year $ 3,255 $ 2,704 Provision for claims 720 1,125 Total payments (500) (574)
Reported claims payable and estimated claims payable incurred but not reported at end of year $ 3,475 $ 3,255
September 30,
The separately issued financial report contains additional note disclosures and supplementary information regarding claims development.
NOTE 9 - DEFERRED COMPENSATION
The State offers employees the opportunity to participate in optional deferred compensation plans created in accordance with Internal Revenue Service Code (IRC) Section 457. The plans are available to all state employees and permit them to defer a portion of their salary until future years. The current value of the employee contributions may be withdrawn upon termination, retirement, death, or an unforeseeable emergency. It is the opinion of the State's legal counsel that the State has no liability for losses under these plans but does have the duty of due care that would be required of an ordinary prudent investor. The Public Employees' Individual Retirement Account Fund/Deferred Compensation Plan (RSA-1) is administered and operated by its Board of Control. All members of the Teachers' Retirement System of Alabama, Employees' Retirement System of Alabama, Judicial Retirement Fund, employees of employers eligible to participate in the Employees' Retirement System pursuant to provisions of Code of Alabama 1975 Section 36-27-6, and public officials and employees of the State of Alabama or any political subdivision thereof (collectively, participating employers), are eligible to participate in this plan. At September 30, 2017, net position of the plan totaled $2,044,875,000. State employees may also participate in the Alabama Deferred Compensation Plan sponsored by the Personnel Board and administered by Empower Retirement. The plan contract requires the assets to be held in trust for the benefit of plan participants. At September 30, 2017, net position of the plan totaled $596,014,000.
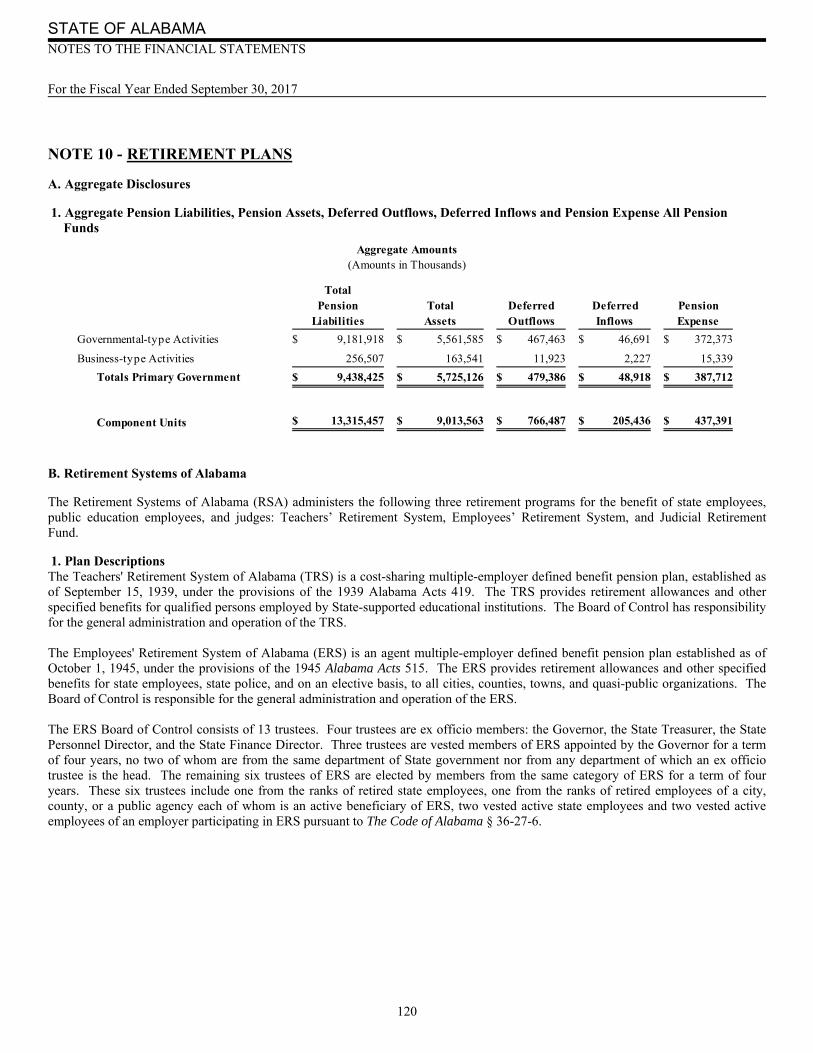
STATE OF ALABAMA NOTES TO THE FINANCIAL STATEMENTS For the Fiscal Year Ended September 30, 2017
120
NOTE 10 - RETIREMENT PLANS
A. Aggregate Disclosures
1. Aggregate Pension Liabilities, Pension Assets, Deferred Outflows, Deferred Inflows and Pension Expense All Pension Funds
B. Retirement Systems of Alabama
The Retirement Systems of Alabama (RSA) administers the following three retirement programs for the benefit of state employees, public education employees, and judges: Teachers’ Retirement System, Employees’ Retirement System, and Judicial Retirement Fund.
1. Plan Descriptions The Teachers' Retirement System of Alabama (TRS) is a cost-sharing multiple-employer defined benefit pension plan, established as of September 15, 1939, under the provisions of the 1939 Alabama Acts 419. The TRS provides retirement allowances and other specified benefits for qualified persons employed by State-supported educational institutions. The Board of Control has responsibility for the general administration and operation of the TRS. The Employees' Retirement System of Alabama (ERS) is an agent multiple-employer defined benefit pension plan established as of October 1, 1945, under the provisions of the 1945 Alabama Acts 515. The ERS provides retirement allowances and other specified benefits for state employees, state police, and on an elective basis, to all cities, counties, towns, and quasi-public organizations. The Board of Control is responsible for the general administration and operation of the ERS. The ERS Board of Control consists of 13 trustees. Four trustees are ex officio members: the Governor, the State Treasurer, the State Personnel Director, and the State Finance Director. Three trustees are vested members of ERS appointed by the Governor for a term of four years, no two of whom are from the same department of State government nor from any department of which an ex officio trustee is the head. The remaining six trustees of ERS are elected by members from the same category of ERS for a term of four years. These six trustees include one from the ranks of retired state employees, one from the ranks of retired employees of a city, county, or a public agency each of whom is an active beneficiary of ERS, two vested active state employees and two vested active employees of an employer participating in ERS pursuant to The Code of Alabama § 36-27-6.
TotalPension Total Deferred Deferred Pension
Liabilities Assets Outflows Inflows Expense
Governmental-type Activities 9,181,918$ 5,561,585$ 467,463$ 46,691$ 372,373$
Business-type Activities 256,507 163,541 11,923 2,227 15,339
Totals Primary Government 9,438,425$ 5,725,126$ 479,386$ 48,918$ 387,712$
Component Units 13,315,457$ 9,013,563$ 766,487$ 205,436$ 437,391$
Aggregate Amounts(Amounts in Thousands)
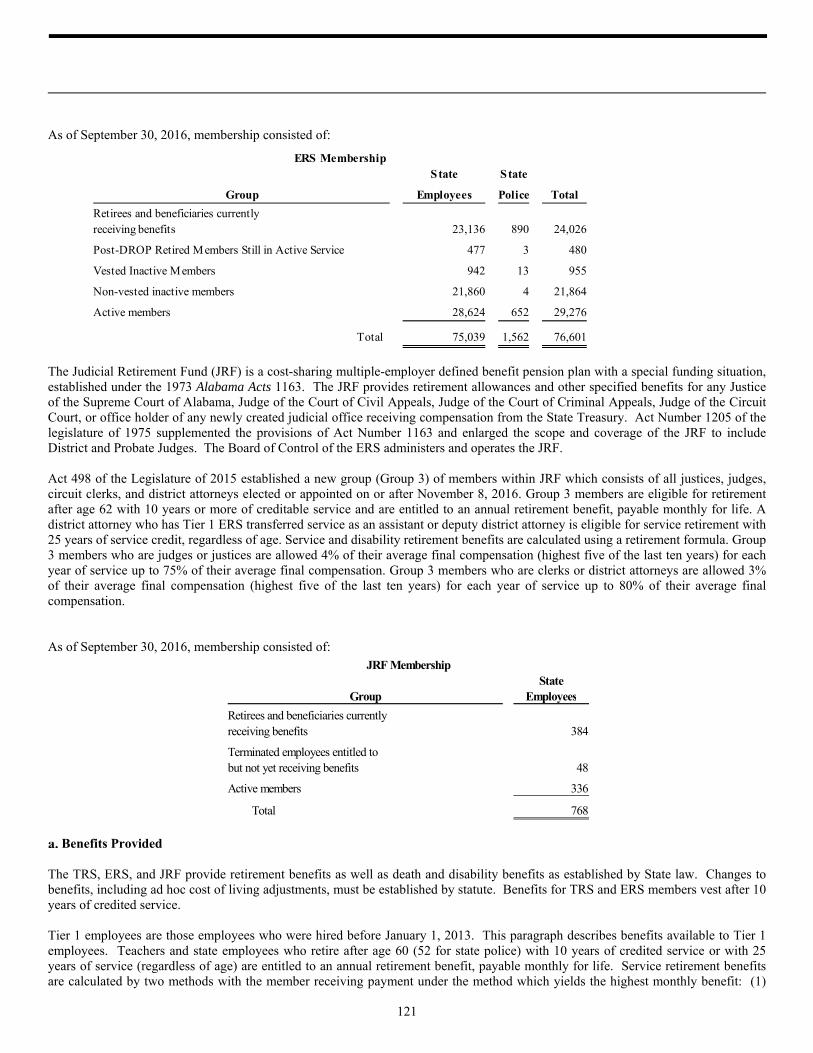
121
As of September 30, 2016, membership consisted of: The Judicial Retirement Fund (JRF) is a cost-sharing multiple-employer defined benefit pension plan with a special funding situation, established under the 1973 Alabama Acts 1163. The JRF provides retirement allowances and other specified benefits for any Justice of the Supreme Court of Alabama, Judge of the Court of Civil Appeals, Judge of the Court of Criminal Appeals, Judge of the Circuit Court, or office holder of any newly created judicial office receiving compensation from the State Treasury. Act Number 1205 of the legislature of 1975 supplemented the provisions of Act Number 1163 and enlarged the scope and coverage of the JRF to include District and Probate Judges. The Board of Control of the ERS administers and operates the JRF. Act 498 of the Legislature of 2015 established a new group (Group 3) of members within JRF which consists of all justices, judges, circuit clerks, and district attorneys elected or appointed on or after November 8, 2016. Group 3 members are eligible for retirement after age 62 with 10 years or more of creditable service and are entitled to an annual retirement benefit, payable monthly for life. A district attorney who has Tier 1 ERS transferred service as an assistant or deputy district attorney is eligible for service retirement with 25 years of service credit, regardless of age. Service and disability retirement benefits are calculated using a retirement formula. Group 3 members who are judges or justices are allowed 4% of their average final compensation (highest five of the last ten years) for each year of service up to 75% of their average final compensation. Group 3 members who are clerks or district attorneys are allowed 3% of their average final compensation (highest five of the last ten years) for each year of service up to 80% of their average final compensation. As of September 30, 2016, membership consisted of:
Benefits Provided The TRS, ERS, and JRF provide retirement benefits as well as death and disability benefits as established by State law. Changes to benefits, including ad hoc cost of living adjustments, must be established by statute. Benefits for TRS and ERS members vest after 10 years of credited service. Tier 1 employees are those employees who were hired before January 1, 2013. This paragraph describes benefits available to Tier 1 employees. Teachers and state employees who retire after age 60 (52 for state police) with 10 years of credited service or with 25 years of service (regardless of age) are entitled to an annual retirement benefit, payable monthly for life. Service retirement benefits are calculated by two methods with the member receiving payment under the method which yields the highest monthly benefit: (1)
State State
Employees Police Total
Retirees and beneficiaries currentlyreceiving benefits 23,136 890 24,026
Post-DROP Retired Members Still in Active Service 477 3 480
Vested Inactive Members 942 13 955
Non-vested inactive members 21,860 4 21,864
Active members 28,624 652 29,276
Total 75,039 1,562 76,601
Group
ERS Membership
StateEmployees
Retirees and beneficiaries currentlyreceiving benefits 384
Terminated employees entitled tobut not yet receiving benefits 48
Active members 336
Total 768
Group
JRF Membership

STATE OF ALABAMA NOTES TO THE FINANCIAL STATEMENTS For the Fiscal Year Ended September 30, 2017
122
minimum guaranteed, or (2) formula. Under the formula method, members of TRS and ERS (except state police) are allowed 2.0125 percent of their final average salary (highest 3 of the last 10 years) for each year of service. State police are allowed 2.875 percent for each year of state police service in computing the formula method. Disability retirement benefits are calculated in the same manner. JRF benefits vest from five to eighteen years. Except for justices or judges who were either disabled, elected prior to July 30, 1979, or have at least 25 years of credited service, no justice or judge shall be eligible to receive judicial service retirement pay prior to attaining sixty years of age. Service retirement benefits for justices and judges are dependent upon the particular office held in the judicial branch of government. A retirement benefit is payable upon the request of any member who has: (1) 25 years of credited service (regardless of age), (2) completed 12 years of credited service and has attained age 65, (3) completed 15 years of credited service and whose age plus service equals or exceeds 77, (4) completed 10 years of credited service and has attained age 70, or (5) been elected prior to July 30, 1979 and has 18 years of service (regardless of age). A member eligible to retire who has not requested his retirement benefit to commence at the end of the term in which his seventieth birthday occurs is entitled only to the refund of his contributions (except for members with at least 25 years of credited service). The service retirement benefit for circuit, appellate, and probate judges is 75 percent of the member’s salary at the time of separation from service. The service retirement benefit for a district judge is 75 percent of the position’s salary immediately prior to retirement. Act 377 of the Legislature of 2012 established a new tier of benefits (Tier 2) for TRS and ERS members hired on or after January 1, 2013. Tier 2 TRS and ERS members are eligible for retirement after age 62 (56 for State Police) with 10 years or more of credited service and are entitled to an annual retirement benefit, payable monthly for life. Service and disability retirement benefits are based on a guaranteed minimum or a formula method, with the member receiving payment under the method that yields the highest monthly benefit. Under the formula method, Tier 2 members of the TRS and ERS (except State Police) are allowed 1.65 percent of their average final compensation (highest 5 of the last 10 years) for each year of service. State Police are allowed 2.375 percent for each year of state police service in computing the formula method. A pre-retirement death benefit is offered in which the account is credited with TRS, ERS, and JRF employer contributions and investment income on such funds. The pre-retirement death benefit (group term life insurance) is paid in addition to the return of member contributions upon the death of an active TRS, ERS, or JRF Group 3 member who has completed at least one year of active membership in the system and whose date of death was within 180 days of the member's last date of actual service. However, a surviving spouse beneficiary of a deceased member who was eligible for service retirement may elect a survivor allowance in lieu of this benefit. The pre-retirement death benefit is equal to the annual earnable compensation of the member as reported to the system for the preceding year ending June 30 for TRS and September 30 for ERS and the JRF. When a member withdraws from service prior to becoming vested, the member's accumulated contributions and a portion of accumulated interest credited to the Annuity Savings account are returned to the member. The portion of accumulated interest, which by law is not payable to the member, is transferred to the Expense Fund.
Pension Plan Financial Report RSA issued a stand-alone financial report that includes financial statements and required supplementary information (including GASB Statement No. 67 disclosures) for the year ended September 30, 2017. Copies may be obtained from the RSA website at www.rsa-al.gov or by writing to: The Retirement Systems of Alabama P.O. Box 302150 201 South Union Street Montgomery, AL 36130-2150
2. Summary of Significant Accounting Policies
Basis of Accounting The TRS, ERS, and JRF pension plan fiduciary net positions have been determined on the same basis used by the pension plans. The TRS, ERS, and JRF financial statements are prepared using the economic resources measurement focus and accrual basis of accounting consistent with the plans. Contributions are recognized as revenues when earned, pursuant to plan requirements. Benefits and refunds are recognized when due and payable in accordance with the terms of the plans. The financial statements are prepared in accordance with requirements of the Governmental Accounting Standards Board. Under these requirements, the TRS, ERS, and JRF are considered component units of the State of Alabama.
Investments The Boards of Control of the Systems have the responsibility and authority to invest and reinvest available funds, through the Secretary-Treasurer and Investment Committee, in bonds, mortgage-backed securities, common and preferred stock, or other

123
investment vehicles with the care, skill, prudence and diligence under the circumstances then prevailing that a prudent person acting in a like capacity and familiar with such matters would use. All plan assets are carried at fair value. Securities traded on national or international exchanges are valued at the last reported sales price at current exchange rates. Short-term investments are reported at cost, which approximates fair value. Mortgage-backed securities are reported based on future principal and interest payments discounted at the prevailing interest rate for similar investments. Generally, private placements are valued based on the selling price of similar investments sold in the open market. In those instances where similar investments are not sold in the open market, an independent appraisal is performed to determine the fair value. RSA invests in limited partnerships which are long-term and generally illiquid. As a result, investors are subject to redemption restrictions which generally limit distributions and restrict the ability of limited partners to exit a partnership investment prior to dissolution. These partnership investments are valued using their respective net asset values (NAV). The most significant element of the NAV is the fair value of the investment holdings. These holdings are valued by the general partners in conjunction with management, investment advisors, and valuation specialists. The valuation techniques vary based on investment type and involve a certain degree of expert judgment. The fair value of these investments could differ significantly if a ready market for these assets existed. As of September 30, 2017, the TRS, ERS, and JRF owned debt and equity securities of Goldman Sachs Group, Inc. which represented approximately 7.03%, 6.21%, and 6.48%, respectively, of TRS, ERS, and JRF investments. The TRS and ERS owned debt and equity securities of Raycom Media Corporation which represented approximately 8.05% and 9.73%, respectively, of the TRS and ERS investments. Additionally, TRS owned debt and equity securities of New Water Street Corporation which represented 5.19% of the TRS investments.
3. Employee Contribution Requirements State Law established the contribution requirements and must be amended by state statute. The required contribution rate of active plan members for TRS and ERS (excluding state policemen, and certified firefighters, police officers and correctional officers) is 7.5 percent and 6.0 percent of earnable compensation for Tier 1 and Tier 2 members, respectively. State policemen are required to contribute 10 percent of earnable compensation. JRF members and Tier 1 certified firefighter, police officer, and correctional officer members of the TRS and ERS are required to contribute 8.5 percent of earnable compensation. Tier 2 certified law enforcement, correctional officers, and firefighters of the TRS and ERS are required by statute to contribute 7 percent of earnable compensation. Group 3 members of the JRF contribute 8.50% of earnable compensation to the JRF as required by statute.
4. Disclosures of Individual Plans of the Retirement Systems of Alabama
TRS Employer Contributions Required and Made As required by statute, the employer contribution rate is actuarially determined based on the amount needed in addition to employee contributions to fund the costs of member benefits earned during the year and to fund unfunded accrued liabilities. For fiscal year 2017, the required employer contribution rate was 12.01 percent for Tier 1 and 10.82 percent for Tier 2. Total employer contributions for fiscal year 2017 were $14,762,000 for the primary government ($14,450,000 for governmental activities, $312,000 for business-type activities), and $293,173,000 for discretely presented component units. Pension Liabilities, Pension Expense, and Deferred Outflows of Resources and Deferred Inflows of Resources Related to Pensions The collective net pension liability was measured as of September 30, 2016 and the total pension liability used to calculate the net pension liability (NPL) was determined by an actuarial valuation as of September 30, 2015. Update procedures were used to roll forward the NPL to the reporting date. Each participating TRS unit included in the State’s financial report has its own proportion of the collective net pension liability based on the individual participating units’ share of contributions to the pension plan relative to the total employer contributions of all participating TRS units. At September 30, 2017, the proportionate share of the primary government and component units’ net pension liability was as follows:

STATE OF ALABAMA NOTES TO THE FINANCIAL STATEMENTS For the Fiscal Year Ended September 30, 2017
124
For the year ended September 30, 2017, the primary government recognized pension expense of $21,690,000 (governmental-type activities - $21,355,000 and business-type activities - $335,000) and component units recognized a pension expense of $427,606,000. As of September 30, 2017 the State reported deferred outflows of resources and deferred inflows of resources related to pensions from the following sources: Employer contributions subsequent to the measurement date reported in the above tables as deferred outflows of resources will reduce the net pension liability reported as of September 30, 2018. Other amounts reported as deferred outflows and deferred inflows of resources will increase/ (decrease) pension expense reported in subsequent years as follows:
Current Year Prior Year Change inProportionate Proportionate Proportionate
Share Share Share
Governmental-type Activities 1.89 % 1.88 % 0.01 %Business-type Activities 0.03 0.04 (0.01)
Totals Primary Government 1.92 % 1.92 % - %
Component Units 39.10 % 38.80 % 0.30 %
TRSProportionate Share of Net Pension Liability
Govt- Business- Totaltype type Primary Component
Activities Activities Government Units
Deferred Outflows of ResourcesNet difference between projected and actual
earnings on pension plan investments 2,955$ 57$ 3,012$ 61,140$ Changes in proportion and differences between employer
contributions and proportionate share of contributions 6,987 - 6,987 99,761 Change in Assumptions 14,439 279 14,718 298,681 Employer contributions subsequent to the measurement date 14,450 312 14,762 293,173
Total Deferred Ouflows of Resources 38,831$ 648$ 39,479$ 752,755$
Deferred Inflows of ResourcesDifferences between expected and actual experience 5,267$ 102$ 5,369$ 108,945$ Changes in proportion and differences between employer
contributions and proportionate share of contributions 6,844 204 7,048 95,794
Total Deferred Inflows of Resources 12,111$ 306$ 12,417$ 204,739$
TRSDeferred Outflows and Inflows of Resources
(Amounts in Thousands)

125
Actuarial Assumptions The actuarial assumptions used to determine the total pension liability (TPL) in the September 30, 2015 valuation were updated to reflect changes resulting from a new experience study prepared as of September 30, 2015. The actuarial assumptions used to roll forward the TPL to the measurement date are as follows: Inflation 2.75% Projected salary increases 3.25% - 5.00% Investment rate of returns* 7.75% *Net of pension plan investment expense, including inflation Mortality rates for TRS service retirements and dependent beneficiaries were based on the RP-2000 White Collar Mortality Table projected to 2020 using scale BB and adjusted 115% for all ages for males and 112% for ages 78 and over for females. The rates of disabled mortality were based on the RP-2000 Disabled Mortality Table projected to 2020 using BB and adjusted 105% for males and 120% for females. The long-term expected rate of return on pension plan investments was determined using a log-normal distribution analysis in which best-estimate ranges of expected future real rates of return (expected returns, net of pension plan investment expense and inflation) are developed for each major asset class. These ranges are combined to produce the long-term expected rate of return by weighting the expected future real rates of return by the target asset allocation percentage and by adding expected inflation. The target asset allocation and best estimates of geometric real rates of return for each major asset class are as follows: Discount rate The discount rate used to measure the total pension liability was 7.75 percent. The projection of cash flows used to determine the discount rate assumed that plan member contributions will be made at the current contribution rate and that the employer contributions will be made at rates equal to the difference between actuarially determined contribution rates and the member rate. Based on those assumptions, components of the pension plan’s fiduciary net position were projected to be available to make all projected future benefit payments of current plan members. Therefore, the long-term expected rate of return on pension plan investments was applied to all periods of projected benefit payments to determine the total pension liability.
Fiscal Year Governmental Business-type ComponentEnded Activities Activities Units
2018 2,641$ 7$ 54,855$ 2019 2,641 6 54,854 2020 5,895 14 122,446 2021 388 1 8,045 2022 705 2 14,643
TRSIncrease/(Decrease) to Pension Expenses
(Amounts in Thousands)
Target Allocation
Long-Term Expected Rate of
Return* Fixed Income 17.00 % 4.40 %U.S. Large Stocks 32.00 8.00 U.S. Mid Stocks 9.00 10.00 U.S. Small Stocks 4.00 11.00 International Developed Market Stocks 12.00 9.50 International Emerging Market Stocks 3.00 11.00 Altermatives 10.00 10.10 Real Estate 10.00 7.50 Cash Equivalents 3.00 1.50
Total 100 %
*Includes assumed rate of inflation of 2.50%.
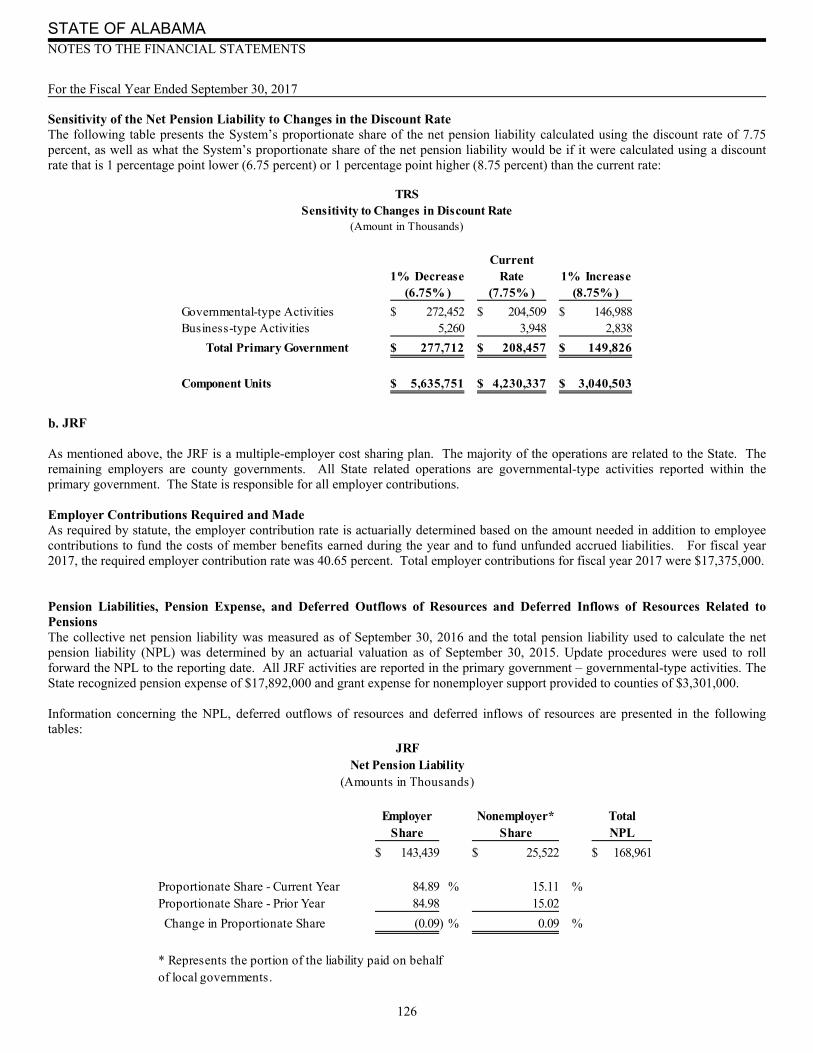
STATE OF ALABAMA NOTES TO THE FINANCIAL STATEMENTS For the Fiscal Year Ended September 30, 2017
126
Sensitivity of the Net Pension Liability to Changes in the Discount Rate The following table presents the System’s proportionate share of the net pension liability calculated using the discount rate of 7.75 percent, as well as what the System’s proportionate share of the net pension liability would be if it were calculated using a discount rate that is 1 percentage point lower (6.75 percent) or 1 percentage point higher (8.75 percent) than the current rate:
JRF As mentioned above, the JRF is a multiple-employer cost sharing plan. The majority of the operations are related to the State. The remaining employers are county governments. All State related operations are governmental-type activities reported within the primary government. The State is responsible for all employer contributions. Employer Contributions Required and Made As required by statute, the employer contribution rate is actuarially determined based on the amount needed in addition to employee contributions to fund the costs of member benefits earned during the year and to fund unfunded accrued liabilities. For fiscal year 2017, the required employer contribution rate was 40.65 percent. Total employer contributions for fiscal year 2017 were $17,375,000. Pension Liabilities, Pension Expense, and Deferred Outflows of Resources and Deferred Inflows of Resources Related to Pensions The collective net pension liability was measured as of September 30, 2016 and the total pension liability used to calculate the net pension liability (NPL) was determined by an actuarial valuation as of September 30, 2015. Update procedures were used to roll forward the NPL to the reporting date. All JRF activities are reported in the primary government – governmental-type activities. The State recognized pension expense of $17,892,000 and grant expense for nonemployer support provided to counties of $3,301,000. Information concerning the NPL, deferred outflows of resources and deferred inflows of resources are presented in the following tables:
Employer Nonemployer* TotalShare Share NPL
143,439$ 25,522$ 168,961$
Proportionate Share - Current Year 84.89 % 15.11 %Proportionate Share - Prior Year 84.98 15.02
Change in Proportionate Share (0.09) % 0.09 %
* Represents the portion of the liability paid on behalfof local governments.
JRFNet Pension Liability
(Amounts in Thousands)
Current1% Decrease Rate 1% Increase
(6.75% ) (7.75% ) (8.75% )
Governmental-type Activities 272,452$ 204,509$ 146,988$ Business-type Activities 5,260 3,948 2,838
Total Primary Government 277,712$ 208,457$ 149,826$
Component Units 5,635,751$ 4,230,337$ 3,040,503$
TRSSensitivity to Changes in Discount Rate
(Amount in Thousands)
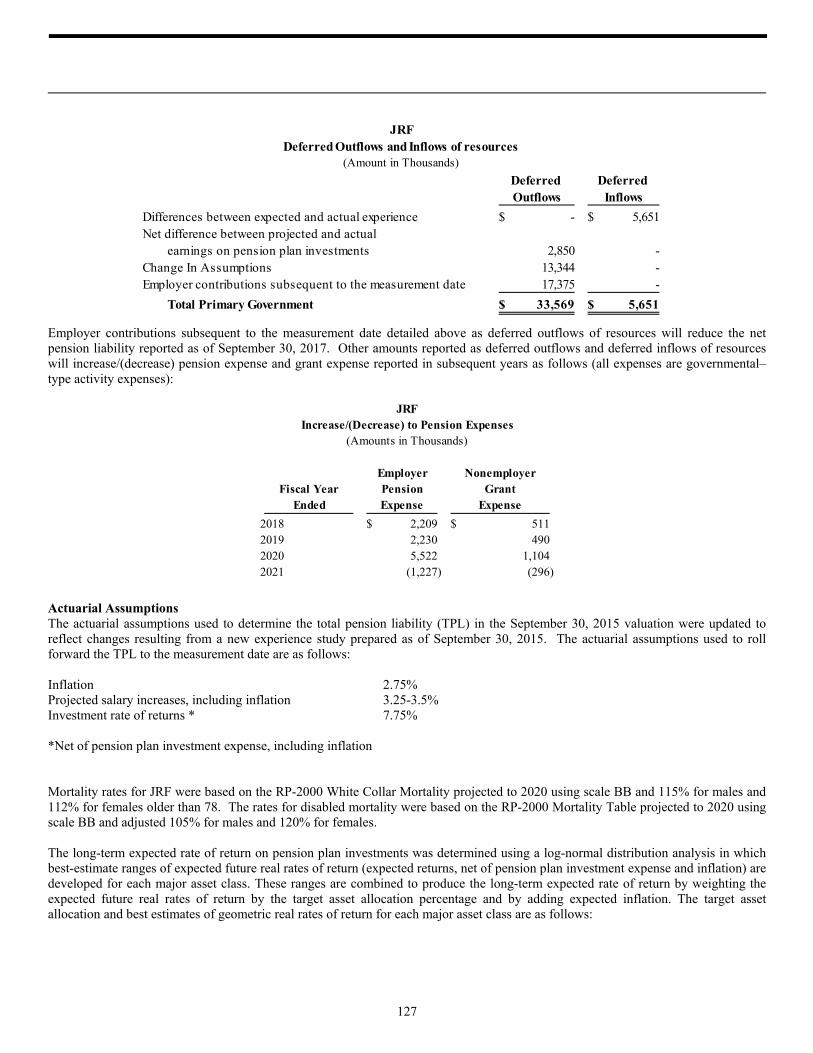
127
Employer contributions subsequent to the measurement date detailed above as deferred outflows of resources will reduce the net pension liability reported as of September 30, 2017. Other amounts reported as deferred outflows and deferred inflows of resources will increase/(decrease) pension expense and grant expense reported in subsequent years as follows (all expenses are governmental–type activity expenses): Actuarial Assumptions The actuarial assumptions used to determine the total pension liability (TPL) in the September 30, 2015 valuation were updated to reflect changes resulting from a new experience study prepared as of September 30, 2015. The actuarial assumptions used to roll forward the TPL to the measurement date are as follows: Inflation 2.75% Projected salary increases, including inflation 3.25-3.5% Investment rate of returns * 7.75% *Net of pension plan investment expense, including inflation Mortality rates for JRF were based on the RP-2000 White Collar Mortality projected to 2020 using scale BB and 115% for males and 112% for females older than 78. The rates for disabled mortality were based on the RP-2000 Mortality Table projected to 2020 using scale BB and adjusted 105% for males and 120% for females. The long-term expected rate of return on pension plan investments was determined using a log-normal distribution analysis in which best-estimate ranges of expected future real rates of return (expected returns, net of pension plan investment expense and inflation) are developed for each major asset class. These ranges are combined to produce the long-term expected rate of return by weighting the expected future real rates of return by the target asset allocation percentage and by adding expected inflation. The target asset allocation and best estimates of geometric real rates of return for each major asset class are as follows:
Employer NonemployerFiscal Year Pension Grant
Ended Expense Expense
2018 2,209$ 511$ 2019 2,230 490 2020 5,522 1,104 2021 (1,227) (296)
JRF
(Amounts in Thousands)Increase/(Decrease) to Pension Expenses
Deferred Deferred Outflows Inflows
Differences between expected and actual experience -$ 5,651$ Net difference between projected and actual
earnings on pension plan investments 2,850 - Change In Assumptions 13,344 - Employer contributions subsequent to the measurement date 17,375 -
Total Primary Government 33,569$ 5,651$
JRFDeferred Outflows and Inflows of resources
(Amount in Thousands)
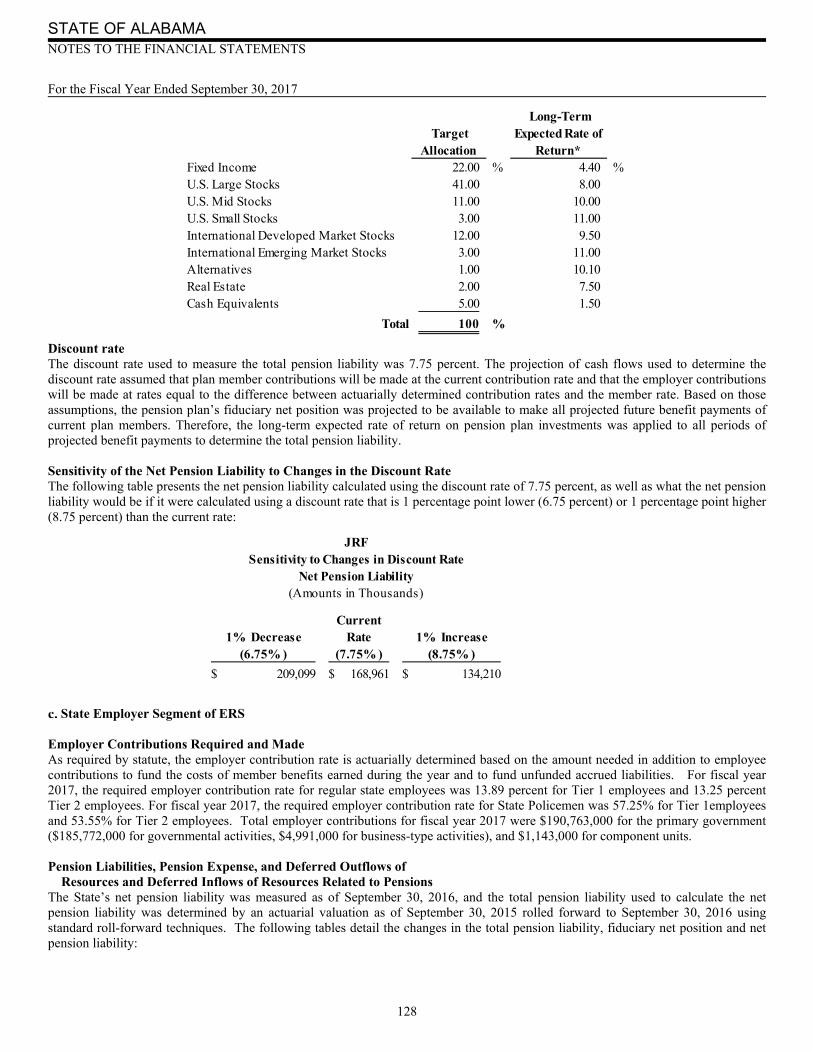
STATE OF ALABAMA NOTES TO THE FINANCIAL STATEMENTS For the Fiscal Year Ended September 30, 2017
128
Discount rate The discount rate used to measure the total pension liability was 7.75 percent. The projection of cash flows used to determine the discount rate assumed that plan member contributions will be made at the current contribution rate and that the employer contributions will be made at rates equal to the difference between actuarially determined contribution rates and the member rate. Based on those assumptions, the pension plan’s fiduciary net position was projected to be available to make all projected future benefit payments of current plan members. Therefore, the long-term expected rate of return on pension plan investments was applied to all periods of projected benefit payments to determine the total pension liability. Sensitivity of the Net Pension Liability to Changes in the Discount Rate The following table presents the net pension liability calculated using the discount rate of 7.75 percent, as well as what the net pension liability would be if it were calculated using a discount rate that is 1 percentage point lower (6.75 percent) or 1 percentage point higher (8.75 percent) than the current rate:
State Employer Segment of ERS Employer Contributions Required and Made As required by statute, the employer contribution rate is actuarially determined based on the amount needed in addition to employee contributions to fund the costs of member benefits earned during the year and to fund unfunded accrued liabilities. For fiscal year 2017, the required employer contribution rate for regular state employees was 13.89 percent for Tier 1 employees and 13.25 percent Tier 2 employees. For fiscal year 2017, the required employer contribution rate for State Policemen was 57.25% for Tier 1employees and 53.55% for Tier 2 employees. Total employer contributions for fiscal year 2017 were $190,763,000 for the primary government ($185,772,000 for governmental activities, $4,991,000 for business-type activities), and $1,143,000 for component units. Pension Liabilities, Pension Expense, and Deferred Outflows of Resources and Deferred Inflows of Resources Related to Pensions The State’s net pension liability was measured as of September 30, 2016, and the total pension liability used to calculate the net pension liability was determined by an actuarial valuation as of September 30, 2015 rolled forward to September 30, 2016 using standard roll-forward techniques. The following tables detail the changes in the total pension liability, fiduciary net position and net pension liability:
Target Allocation
Long-Term Expected Rate of
Return* Fixed Income 22.00 % 4.40 %U.S. Large Stocks 41.00 8.00 U.S. Mid Stocks 11.00 10.00 U.S. Small Stocks 3.00 11.00 International Developed Market Stocks 12.00 9.50 International Emerging Market Stocks 3.00 11.00 Alternatives 1.00 10.10 Real Estate 2.00 7.50 Cash Equivalents 5.00 1.50
Total 100 %
Current1% Decrease Rate 1% Increase
(6.75% ) (7.75% ) (8.75% )
209,099$ 168,961$ 134,210$
Sensitivity to Changes in Discount Rate
(Amounts in Thousands)
JRF
Net Pension Liability
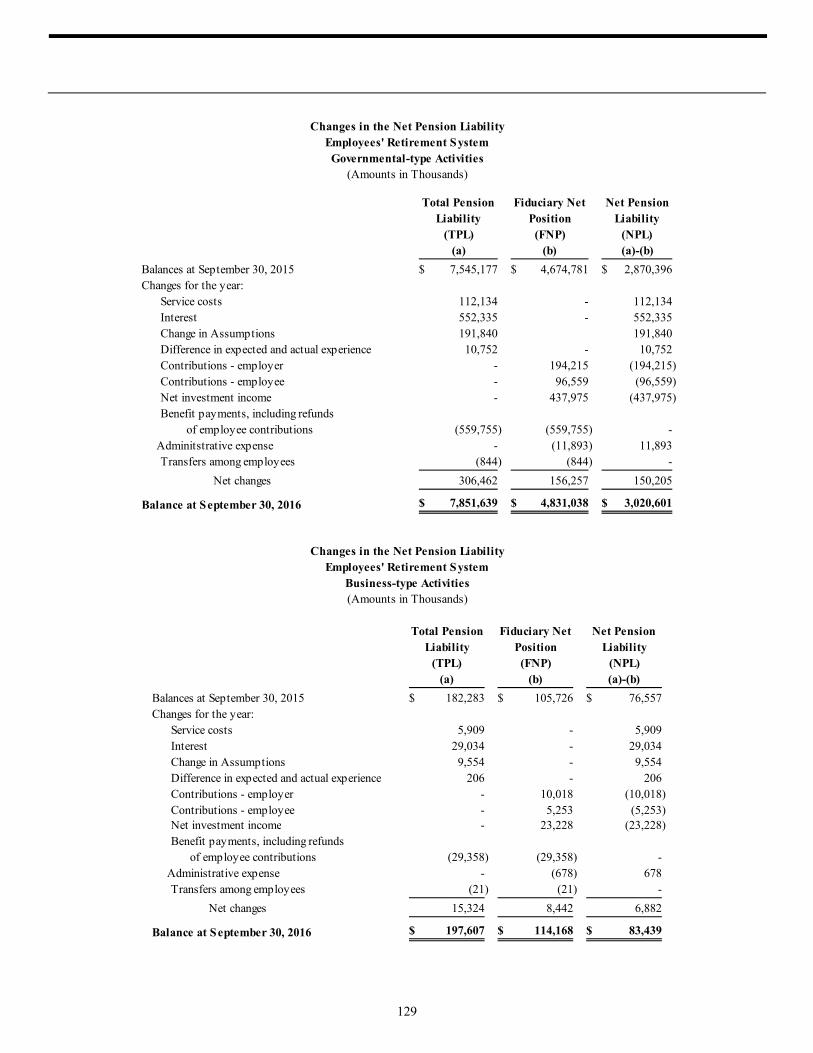
129
Total Pension Fiduciary Net Net PensionLiability Position Liability
(TPL) (FNP) (NPL)(a) (b) (a)-(b)
Balances at September 30, 2015 182,283$ 105,726$ 76,557$ Changes for the year:
Service costs 5,909 - 5,909 Interest 29,034 - 29,034 Change in Assumptions 9,554 - 9,554 Difference in expected and actual experience 206 - 206 Contributions - employer - 10,018 (10,018) Contributions - employee - 5,253 (5,253) Net investment income - 23,228 (23,228) Benefit payments, including refunds
of employee contributions (29,358) (29,358) - Administrative expense - (678) 678 Transfers among employees (21) (21) -
Net changes 15,324 8,442 6,882
Balance at September 30, 2016 197,607$ 114,168$ 83,439$
Changes in the Net Pension Liability
Business-type Activities(Amounts in Thousands)
Employees' Retirement System
Total Pension Fiduciary Net Net PensionLiability Position Liability
(TPL) (FNP) (NPL)(a) (b) (a)-(b)
Balances at September 30, 2015 7,545,177$ 4,674,781$ 2,870,396$ Changes for the year:
Service costs 112,134 - 112,134 Interest 552,335 - 552,335 Change in Assumptions 191,840 191,840 Difference in expected and actual experience 10,752 - 10,752 Contributions - employer - 194,215 (194,215) Contributions - employee - 96,559 (96,559) Net investment income - 437,975 (437,975) Benefit payments, including refunds
of employee contributions (559,755) (559,755) - Adminitstrative expense - (11,893) 11,893 Transfers among employees (844) (844) -
Net changes 306,462 156,257 150,205
Balance at September 30, 2016 7,851,639$ 4,831,038$ 3,020,601$
Changes in the Net Pension Liability
Governmental-type Activities(Amounts in Thousands)
Employees' Retirement System

STATE OF ALABAMA NOTES TO THE FINANCIAL STATEMENTS For the Fiscal Year Ended September 30, 2017
130
Total Pension Fiduciary Net Net PensionLiability Position Liability
(TPL) (FNP) (NPL)(a) (b) (a)-(b)
Balances at September 30, 2015 47,769$ 29,421$ 18,348$ Changes for the year:
Service costs 1,546 - 1,546 Interest 7,596 - 7,596 Chanve in Assumptions 2,500 - 2,500 Difference in expected and actual experience 54 - 54 Contributions - employer - 2,621 (2,621) Contributions - employee - 1,375 (1,375) Net investment income - 6,077 (6,077) Benefit payments, including refunds
of employee contributions (7,681) (7,681) - Administrative expense - (177) 177 Transfers among employees (6) (6) -
Net changes 4,009 2,209 1,800
Balance at September 30, 2016 51,778$ 31,630$ 20,148$
Changes in the Net Pension Liability
Component Units(Amounts in Thousands)
Employees' Retirement System
ERS
Total Pension Fiduciary Net Net PensionLiability Position Liability
(TPL) (FNP) (NPL)(a) (b) (a)-(b)
Balances at September 30, 2015 7,727,460$ 4,780,507$ 2,946,953$ Changes for the year:
Service costs 118,043 - 118,043 Interest 581,369 - 581,369 Change in Assumptions 201,394 201,394 Difference in expected and actual experience 10,958 - 10,958 Contributions - employer - 204,233 (204,233) Contributions - employee - 101,812 (101,812) Net investment income - 461,203 (461,203) Benefit payments, including refunds
of employee contributions (589,113) (589,113) - Administrative expense - (12,571) 12,571 Transfers among employees (865) (865) -
Net changes 321,786 164,699 157,087
Balance at September 30, 2016 8,049,246$ 4,945,206$ 3,104,040$
Changes in the Net Pension Liability
Primary Government - Totals(Amounts in Thousands)
Employees' Retirement System
ERS
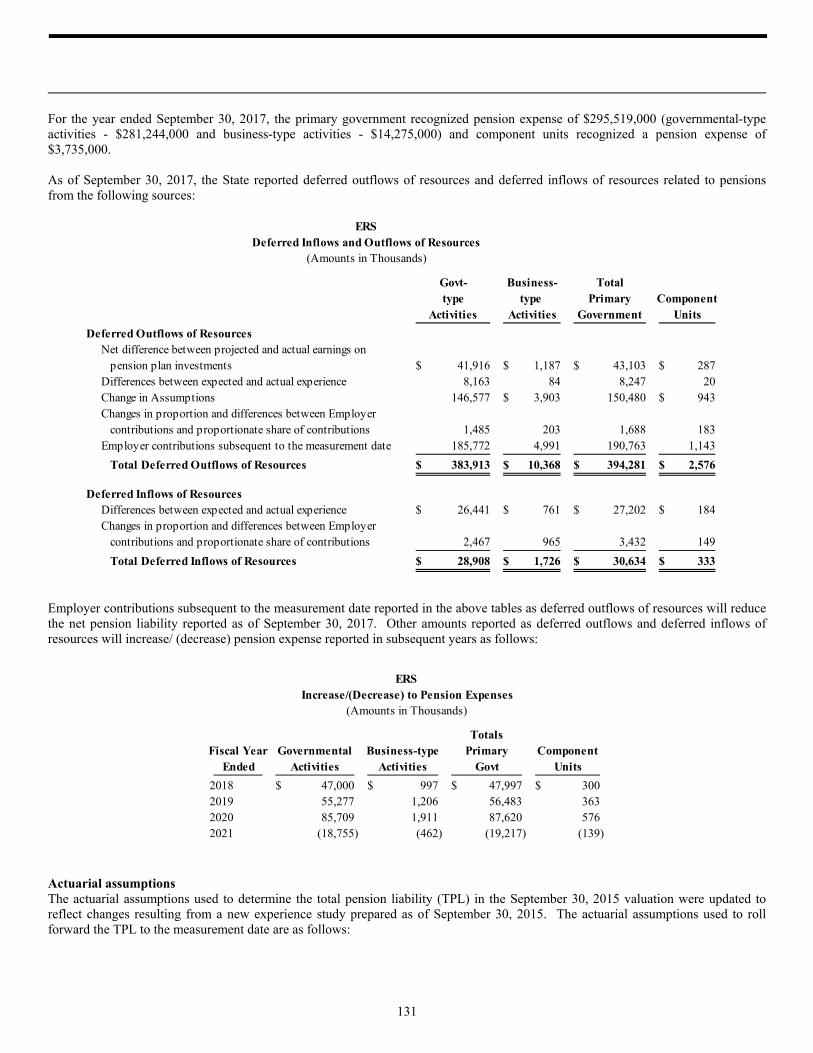
131
For the year ended September 30, 2017, the primary government recognized pension expense of $295,519,000 (governmental-type activities - $281,244,000 and business-type activities - $14,275,000) and component units recognized a pension expense of $3,735,000. As of September 30, 2017, the State reported deferred outflows of resources and deferred inflows of resources related to pensions from the following sources: Employer contributions subsequent to the measurement date reported in the above tables as deferred outflows of resources will reduce the net pension liability reported as of September 30, 2017. Other amounts reported as deferred outflows and deferred inflows of resources will increase/ (decrease) pension expense reported in subsequent years as follows: Actuarial assumptions The actuarial assumptions used to determine the total pension liability (TPL) in the September 30, 2015 valuation were updated to reflect changes resulting from a new experience study prepared as of September 30, 2015. The actuarial assumptions used to roll forward the TPL to the measurement date are as follows:
TotalsFiscal Year Governmental Business-type Primary Component
Ended Activities Activities Govt Units
2018 47,000$ 997$ 47,997$ 300$ 2019 55,277 1,206 56,483 363 2020 85,709 1,911 87,620 576 2021 (18,755) (462) (19,217) (139)
ERSIncrease/(Decrease) to Pension Expenses
(Amounts in Thousands)
Govt- Business- Totaltype type Primary Component
Activities Activities Government Units
Deferred Outflows of ResourcesNet difference between projected and actual earnings on pension plan investments 41,916$ 1,187$ 43,103$ 287$ Differences between expected and actual experience 8,163 84 8,247 20 Change in Assumptions 146,577 3,903$ 150,480 943$ Changes in proportion and differences between Employer contributions and proportionate share of contributions 1,485 203 1,688 183 Employer contributions subsequent to the measurement date 185,772 4,991 190,763 1,143
Total Deferred Outflows of Resources 383,913$ 10,368$ 394,281$ 2,576$
Deferred Inflows of ResourcesDifferences between expected and actual experience 26,441$ 761$ 27,202$ 184$ Changes in proportion and differences between Employer contributions and proportionate share of contributions 2,467 965 3,432 149
Total Deferred Inflows of Resources 28,908$ 1,726$ 30,634$ 333$
Deferred Inflows and Outflows of Resources(Amounts in Thousands)
ERS

STATE OF ALABAMA NOTES TO THE FINANCIAL STATEMENTS For the Fiscal Year Ended September 30, 2017
132
Inflation 2.75% Salary increases, including inflation 3.25-5.00% for State Employees and 4.50% For State Police, including inflation. Investment rate of return * 7.75% *Net of pension plan investment expense, including inflation. Mortality rates for ERS were based on the sex distinct RP-2000 Combined Mortality Table Projected with Scale AA to 2015 set forward three years for males and one year for females. The rates of mortality for the period after disability retirement are according to the sex distinct RP-2000 Disabled Mortality Table. The long-term expected rate of return on pension plan investments was determined using a log-normal distribution analysis in which best-estimate ranges of expected future real rates of return (expected returns, net of pension plan investment expense and inflation) are developed for each major asset class. These ranges are combined to produce the long-term expected rate of return by weighting the expected future real rates of return by the target asset allocation percentage and by adding expected inflation. The target asset allocation and best estimates of geometric real rates of return for each major asset class are as follows: Discount rate The discount rate used to measure the total pension liability was the long term rate of return, 7.75%. The projection of cash flows used to determine the discount rate assumed that plan member contributions will be made at the current contribution rates and that the employer contributions will be made in accordance with the funding policy adopted by the ERS Board of Control. Projected future benefit payments for all current members were projected for all years. Based on those assumptions, the pension plan’s fiduciary net position was projected to be available to make all projected future benefit payments of current plan members. Therefore, the long-term expected rate of return on pension plan investments was applied to all periods of projected benefit payments to determine the total pension liability. Sensitivity of the net pension liability to changes in the discount rate The following table presents the System’s proportionate share of the net pension liability calculated using the discount rate of 7.75%, as well as what the System’s proportionate share of the net pension liability would be if it were calculated using a discount rate that is 1 percentage point lower (6.75%) or 1 percentage point higher (8.75%) than the current rate:
Target Allocation
Long-Term Expected Rate of
Return* Fixed Income 17.00 % 4.40 %U.S. Large Stocks 32.00 8.00 U.S. Mid Stocks 9.00 10.00 U.S. Small Stocks 4.00 11.00 International Developed Market Stocks 12.00 9.50 International Emerging Market Stocks 3.00 11.00 Alternatives 10.00 10.10 Real Estate 10.00 7.50 Cash Equivalents 3.00 1.50
Total 100 %

133
C. Other Pension Plans
The State Port Authority administers three single-employer pension plans, the Hourly Plan, the Terminal Railway Plan, and the Hourly Defined Contribution Plan, for a small number of hourly workers and railway employees. The Peace Officers Annuity and Benefit Fund is a cost-sharing multiple-employer defined benefit pension plan that provides a small additional pension benefit to state and local peace officers beyond that which is paid by the Employees’ Retirement System. The Clerks and Registers Supernumerary Fund is a cost-sharing multiple-employer defined benefit pension plan that provides pension benefits to circuit clerks and registrars of courts. The Firefighters Annuity and Benefit Fund provides small pension benefits to Alabama certified firefighters. These pension plans are not material to the State.
NOTE 11 - POSTEMPLOYMENT HEALTH BENEFITS
In addition to the pension benefits described in the Retirement Plans note, the State provides postretirement health care benefits, in accordance with Code of Alabama 1975, Section 36-29-10, to all retired state employees through the State Employees' Health Insurance Plan (SEHIP) and, in accordance with Code of Alabama 1975, Section 16-25A-17, to all retired employees of state educational institutions through the Public Education Employees' Health Insurance Plan (PEEHIP). The retiree portion of the SEHIP is accounted for through the Alabama Retired State Employees’ Health Care Trust and the retiree portion of the PEEHIP is accounted for through the Alabama Retired Education Employees’ Health Care Trust (see plan description). Employees covered under these two plans who retire from active service and begin receiving monthly benefits from the Employees' Retirement System of Alabama or from the Teachers' Retirement System of Alabama may elect to continue coverage under the group insurance plan by consenting to have deducted from their monthly benefit payment the difference in the total cost of their insurance coverage and the portion authorized to be expended by the SEHIP or PEEHIP for coverage of such retired employees. The State Employees’ Insurance Board administers SEHIP, and the Public Education Employees’ Health Insurance Board administers PEEHIP. In order to fund the ongoing costs of these other postemployment benefits (OPEB), the State has established two trust funds as described below to comply with GASB Statements 43 and 45.
A. Plan Descriptions
The Alabama Retired Education Employees’ Health Care Trust is a multiple employer cost-sharing defined benefit health care plan established as an irrevocable trust in 2007 by Constitutional Amendment 798. As of the latest actuarial evaluation, there were 197 participating employers. The Alabama Retired State Employees’ Health Care Trust is a single employer defined benefit health care plan established as an irrevocable trust in 2007 by Constitutional Amendment 798. The Public Education Employees’ Health Insurance Board issued a stand-alone financial report for the Alabama Retired Education Employees’ Health Care Trust that includes financial statements and detailed disclosures for the year ended September 30, 2017. A copy may be obtained by writing to:
1% Decrease Current Rate 1% Increase(6.75%) (7.75)% (8.75%)
Governmental Activities 3,802,462$ 3,020,601$ 2,355,159$ Business-type Activities 105,425 83,439 64,735
Totals - Primary Government 3,907,887$ 3,104,040$ 2,419,894$
Component Units 25,457$ 20,148$ 15,632$
Sensitivity to Changes in Discount Rate(Amount in Thousands)
ERS
STATE OF ALABAMA NOTES TO THE FINANCIAL STATEMENTS For the Fiscal Year Ended September 30, 2017
134
The Public Education Employees’ Health Insurance Board P.O. Box 302150 201 South Union Street Montgomery, AL 36130-2150 The State Employees’ Insurance Board issued a stand-alone financial report that includes the Alabama Retired State Employees’ Health Care Trust financial statements and detailed disclosures for the year ended September 30, 2017. A copy may be obtained by writing to: State Employees’ Insurance Board P. O. Box 304900 201 South Union Street, Suite 200 Montgomery, AL 36130-4900
B. Summary of Significant Accounting Policies
1. Basis of Accounting Both Trusts are “other employee benefits trust funds” that operate under the accrual basis of accounting. Plan member contributions are recognized in the period in which contributions are due. Employer contributions are recognized when earned, pursuant to plan requirements. Benefits and refunds are recognized when due and payable in accordance with the terms of the plan.
2. Investments All plan assets are carried at fair value. Securities traded on national or international exchanges are valued at the last reported sales price at current exchange rates. Short-term investments are reported at cost, which approximates fair value. Mortgage-backed securities are reported based on future principal and interest payments discounted at the prevailing interest rate for similar instruments. Investments not traded on exchanges are valued based on the selling price of similar investments sold in the open market. In those instances where there are no similar investments sold in the open market, an independent appraisal is performed to determine the fair value of the investments.
C. Funding Policy
The cost of the teachers’ health care benefits is paid from the regular appropriations made to individual education entities. The Public Education Employees’ Health Insurance Board is authorized to set the contribution requirements for plan members and employers. The contribution requirements are certified to the Governor and the Legislature. The Legislature then sets the premium rate in the annual appropriation bill. The retired employee allocation is funded through the active employee premium. Retirees who are eligible for Medicare benefits must pay $25 per month for the Hospital/Medical coverage while those who are not eligible for Medicare must pay $166 per month for the coverage. Additional premiums are paid for dependents. Optionally, the retirees may use this insurance allocation to purchase two plans of optional insurance offered by PEEHIP with no out-of-pocket cost. The Employer Group Waiver Plan subsidy was $23,195,000. Of this amount, $185,000 was an on-behalf payment for the primary government of the State of Alabama and $5,642,000 was on-behalf payments of the major discretely presented component units of the State of Alabama. Most of the remaining amount was on-behalf payments for local school boards that are not part of the State’s reporting entity. The State provides health care benefits for retired state employees through SEHIP. The contribution requirements of the plan members and State agencies are established and may be amended by the Board of Directors of the State Employees’ Insurance Board. For retirees who retired prior to October 1, 2005, the State pays 100 percent of the premium for a retiree who is over 65 and eligible for Medicare. The State pays a portion of the premium for a retiree who is under 65. Under the SEHIP statute, the State contribution per month per retiree is funded on a pay-as-you-go basis through the active employee premiums each agency pays for its active employees. COBRA insurance is also available to state employees who terminate state service, but the employee is liable for the premiums. For retirees who retire other than for disability after October 1, 2005, the employer contribution is less for each year under twenty-five years of creditable coverage and more for each year over 25. For retirees on or after January 1, 2012, the employer contribution is also less for each year under the Medicare age. The retiree is responsible for the amount of contribution not covered by the State. The State may make additional contributions; however no additional funds were contributed during the fiscal year. The Employer Group Waiver Plan subsidy was $194,122,000 for fiscal year 2017. Of this amount, $185,941,000, $6,374,000, and $1,807,000, were on-behalf payments for the primary government, the component units, and the fiduciary funds, respectively.
1. Annual OPEB Cost and Net OPEB Obligation Government Accounting Standards Board Statement No. 45, Accounting and Financial Reporting by Employers for Postemployment Benefits Other than Pensions, requires additional reporting and disclosures for OPEB plans.

135
The PEEHIP is a cost-sharing multiple-employer plan. Contribution requirements are determined by statute. In all instances, the state and its discretely presented component units paid 100 percent of the statutorily determined contribution requirements. Therefore, the State has no net OPEB obligation related to the PEEHIP. The SEHIP is a single employer plan. The following OPEB amounts are for the SEHIP: The net OPEB obligation is liquidated proportionately by all funds paying employee health care benefits through SEHIP.
2. Funded Status and Funding Progress The funded status of the plan for the retired state employees as of the most recent actuarial valuation dated September 30, 2016, was as follows: Actuarial valuations involve estimates of the value of reported amounts and assumptions about the probability of events far into the future. Amounts determined regarding the funded status of the plan and the annual required contributions of the employer are subject to continual revision as actual results are compared to past expectations and new estimates are made about the future. The schedule of funding progress, presented as required supplementary information following the notes to the financial statements, presents multiyear trend information about whether the actuarial value of plan assets is increasing or decreasing over time relative to the actuarial accrued liabilities for benefits.
3. Actuarial Methods and Assumptions Projections of benefits for financial reporting purposes are based on the substantive plan (the plan as understood by the employer and the plan members) and include the types of benefits provided at the time of each valuation and the historical pattern of sharing of benefit costs between the employer and plan members to that point. The actuarial methods and assumptions used include techniques that are designed to reduce the effects of short-term volatility in actuarial accrued liabilities consistent with the long-term perspective of the calculations.
Actuarial Valuation Date 09/30/2016
Actuarial Accrued Liability (AAL) 2,346,946$ Actuarial Value of Assets (150,388) Unfunded Actuarial Accrued Liability (UAAL) 2,196,558$
Funded Ratio 6.41%
Covered Payroll 1,511,463$
UAAL as a Percentageof Covered Payroll 145.33%
Retired State Employees' Health Care Trust (SEHIP)(Amounts in thousands)
Primary Component(Amounts in thousands) Government Units FiduciaryAnnual required contribution 196,957$ 2,633$ 1,876$ Interest on net OPEB obligation 62,204 831 592 Adjustment to ARC (54,056) (722) (515) Annual OPEB cost 205,105 2,742 1,953 Contributions made (90,714) (1,213) (864) Increase in net OPEB obligation 114,391 1,529 1,089 Net OPEB obligation, beginning of year 1,246,573 15,828 10,154 Net OPEB obligation, end of year 1,360,964$ 17,357$ 11,243$
Percentage of annual OPEB cost contributed: 38%

STATE OF ALABAMA NOTES TO THE FINANCIAL STATEMENTS For the Fiscal Year Ended September 30, 2017
136
The actuarial methods and significant assumptions used to determine the ARC for fiscal year 2017 are as follows:
The assumed investment rate of return reflects the fact that as of September 30, 2016 the Plan had assets in a trust solely to provide benefits to retirees and their beneficiaries. A policy has been established to make regular contributions representing a partial payment toward the ARC each year. If the Plan starts fully pre-funding benefits, the discount rate may be increased to reflect equity investment the fund may have after full pre-funding begins. This investment rate of return assumption is independent of the inflation assumption.
4. Trend Information The following table details employer contributions to the Alabama Retired Education Employees’ Health Care Trust: The employer contributions and annual OPEB cost of the SEHIP is presented in the table below.
(Amounts in Thousands) 2017 2016 2015
Primary Government 857$ 1,119$ 827$
Major Component UnitsAuburn University 10,695 11,141 10,088 University of South Alabama 8,413 9,184 8,461 University of Alabama 33,022 35,216 31,333 Alabama Community College System 11,968 16,764 15,246
* 100% of the statutorily required contributions were contributed.
Statutorily Required Contribution*
Actuarial Methods for Retired State Employees' Health Care Trust
Valuation Date: September 30, 2016
Actuarial Cost Method: Projected Unit Credit
Asset Valuation Method: Market Value of Assets
Amortization Method: Level Percent of Pay
Remaining Amortization Period: 30 Years
Period Closed/Open: Open
Actuarial Assumptions for Retired State Employees' Health Care Trust
Investment Rate of Return: 5%
Medical Cost Trend Rate:
Medicare Eligible 5.75%
Pre-Medicare 7.75%
Ultimate Trend Rate:
Medicare Eligible 5%
Pre-Medicare 5%
Year of Ultimate Trend Rate: 2021
Dental Trend Rate: 4.5%
*Includes Inflation at 2.875%
(Amounts in Thousands)Annual Percentage Net
Employer OPEB of Annual OPEB OPEBContributions Cost Cost Contributed Obligation
2015 90,201 237,508 38% 1,142,178 2016 81,442 211,817 38% 1,272,554 2017 92,790 209,801 44% 1,389,566
137
NOTE 12 - RELATED ORGANIZATIONS
The State's officials are responsible for appointing a majority of the members of the boards of other organizations, but the State's accountability for these organizations does not extend beyond making appointments. The State appoints the nine-member board of the Private Colleges and Universities Facilities Authority and a majority of the eleven member board of the Alabama Family Trust Corporation
NOTE 13 - CONTINGENCIES
A. Grants
The State receives federal grants for specific purposes that are subject to review and audit by the grantor agencies. Entitlement to these resources is generally conditional upon compliance with the terms and conditions of grant agreements and applicable federal regulations, including the expenditure of resources for allowable purposes. Federal grantor agencies from time to time review state records to determine whether the State has complied with the terms and conditions of grant agreements and federal regulations. Any disallowance resulting from a federal audit may become a liability of the State but cannot be reasonably estimated at this time. It is believed that any liability resulting from a determination of noncompliance will not materially affect the State's financial condition.
B. Litigation
The State is a party to numerous legal proceedings that occur in the normal course of governmental operations, some of which involve potentially significant amounts. The lawsuits involving potentially significant amounts are described below. Other proceedings involving amounts that, when aggregated, have no material effect on the accompanying government-wide financial statements, may have an impact on the related individual state agencies and funds. The monetary impact, if any, of litigation resulting in adverse rulings is usually addressed in subsequent state budgets and modifications of state laws. Due to the uncertainty involving the ultimate outcome and amounts of the unresolved litigation described below, no provision for potential liability has been recorded in the accompanying financial statements. Blaylock, et al. v. American Tobacco Co., et al., filed in the Circuit Court of Montgomery County is an arbitration proceeding concerning the Master Settlement Agreement (MSA) that was negotiated with the tobacco industry in 1998. The MSA was entered into as a settlement of litigation brought against the participating tobacco products manufacturers by the Attorney Generals of the signatory states to reimburse the states for health care expenses in treating their citizens affected by the use of tobacco products sold by the manufacturers. The MSA contains a provision that allows an adjustment to reduce the payments by the tobacco industry if the MSA has been determined to be a significant factor in the loss of market share by the manufacturers. States will not be subject to a reduction in their payments if it is determined that they diligently enforced their escrow statutes. The 2003 payment has a potential adjustment of $1.2 billion nationwide that could be applied to the states that are determined not to have diligently enforced their escrow statutes during 2003. The question of whether the state was diligent was to be determined by an arbitration panel consisting of three retired Article III federal judges. Before Alabama’s arbitration hearing began, a settlement was reached in principle between 22 states including Alabama and the participating manufacturers resolving diligent enforcement determinations through 2012. This settlement provided Alabama with a “one-time” distribution on April 15, 2013 of approximately 48 million dollars in addition to its normal distribution. The final settlement agreement is still being negotiated. Six states that did not diligently enforce their escrow statutes must pay the 2003 adjustment to the participating manufacturers for all states. There are several remitter actions nationally attacking the settlement as well as the arbitration awards. If the settlement is set aside, Alabama’s potential share of the 2003 non-participating manufacturers’ adjustment could be as much as $80 million if Alabama is subsequently determined to have not diligently enforced its escrow statues during 2003. Additional arbitration proceedings are likely to continue. The State of Alabama has been involved in settling lawsuits challenging the constitutionality of the franchise tax in effect before 2000. The U. S. Supreme Court ruled that Alabama’s franchise tax scheme unconstitutionally discriminated against interstate commerce. The State is continuing to negotiate the last group of settlements with corporations for potential refunds totaling $7 million and accumulated interest of $12 million. The State Legislature enacted laws to remedy the significant loss of revenue.

STATE OF ALABAMA NOTES TO THE FINANCIAL STATEMENTS For the Fiscal Year Ended September 30, 2017
138
NOTE 14 - SUBSEQUENT EVENTS
A. Primary Government
Subsequent to the fiscal year end, the State issued Series 2017-A Alabama Public School and College Authority bonds with a face value of $18,455,000 and premiums of $1,421,000 for the purpose of providing loans to local boards of education in order to finance capital improvements. Subsequent to the fiscal year end, the State Port Authority issued a Short-Term Docks Facilities Revenue Bond, Series 2018, held by Regions Capital Advantage, Inc. in the amount of $50,000,000. These funds are being used to expand the container handling capacity of its operations at the Choctaw Point Container Terminal. The Authority plans to issue long-term revenue bonds to replace the temporary financing.
B. Component Units
Subsequent to the fiscal year end, the Alabama Housing Finance Authority called approximately $525,000 of single-family bonds. The Authority awarded Federal funds totaling $2,562,00 under the HOME Program. The Authority has called approximately $8,680,000 of multi-family bond conduit debt and has issued approximately $8,000,000 of multi-family bond conduit debt. Subsequent to the fiscal year end, Alabama State University issued two Series A 2018-1 Future Advance Refunding Bonds in the amount of $152,000,000 used to refund bonds issued in prior years. In addition, the University used a portion of the proceeds to terminate the Swap Agreement with JPMorgan. Subsequent to the fiscal year end, Jacksonville State University expects partial reimbursement from insurance as well as federal and state grants to aid in the recovery of expenses incurred for post-tornado cleanup costs and property damage resulting from the tornado that touched down on JSU’s campus March 19, 2018.
139
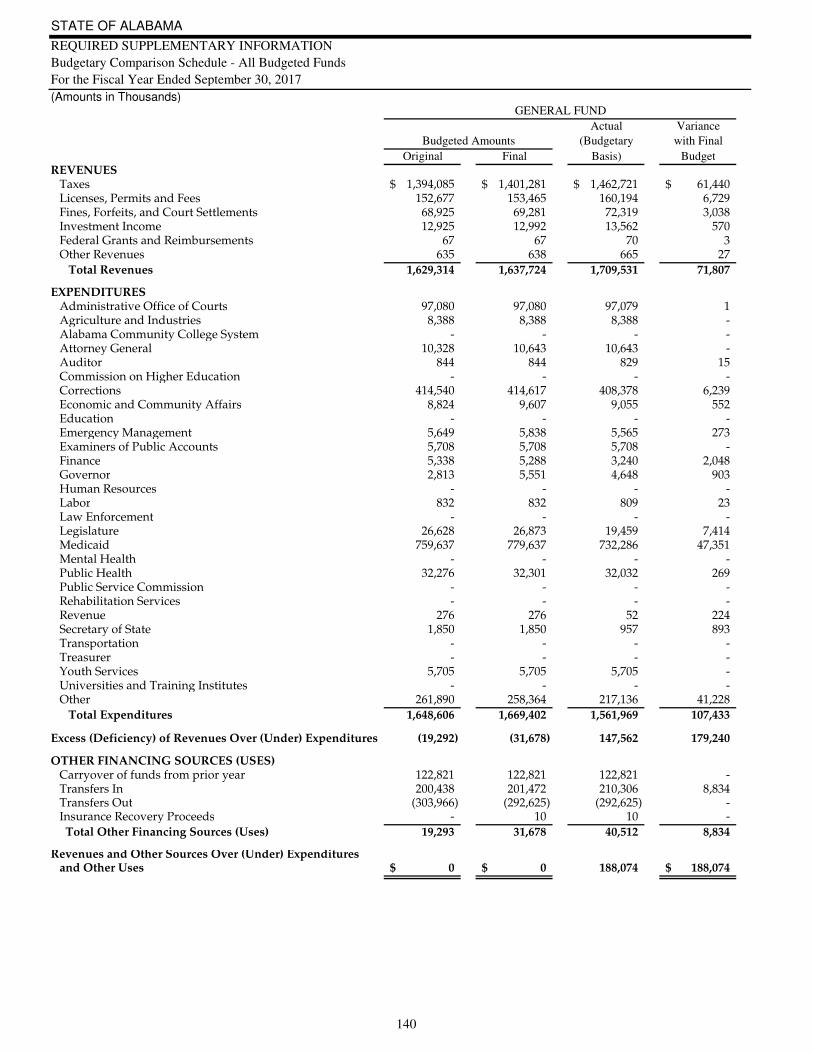
STATE OF ALABAMA
REQUIRED SUPPLEMENTARY INFORMATION
Budgetary Comparison Schedule - All Budgeted Funds
For the Fiscal Year Ended September 30, 2017
(Amounts in Thousands)
Actual Variance
(Budgetary with Final
Original Final Basis) Budget
REVENUES Taxes 1,394,085$ 1,401,281$ 1,462,721$ 61,440$ Licenses, Permits and Fees 152,677 153,465 160,194 6,729 Fines, Forfeits, and Court Settlements 68,925 69,281 72,319 3,038 Investment Income 12,925 12,992 13,562 570 Federal Grants and Reimbursements 67 67 70 3 Other Revenues 635 638 665 27
Total Revenues 1,629,314 1,637,724 1,709,531 71,807 EXPENDITURES Administrative Office of Courts 97,080 97,080 97,079 1 Agriculture and Industries 8,388 8,388 8,388 - Alabama Community College System - - - - Attorney General 10,328 10,643 10,643 - Auditor 844 844 829 15 Commission on Higher Education - - - - Corrections 414,540 414,617 408,378 6,239 Economic and Community Affairs 8,824 9,607 9,055 552 Education - - - - Emergency Management 5,649 5,838 5,565 273 Examiners of Public Accounts 5,708 5,708 5,708 - Finance 5,338 5,288 3,240 2,048 Governor 2,813 5,551 4,648 903 Human Resources - - - - Labor 832 832 809 23 Law Enforcement - - - - Legislature 26,628 26,873 19,459 7,414 Medicaid 759,637 779,637 732,286 47,351 Mental Health - - - - Public Health 32,276 32,301 32,032 269 Public Service Commission - - - - Rehabilitation Services - - - - Revenue 276 276 52 224 Secretary of State 1,850 1,850 957 893 Transportation - - - - Treasurer - - - - Youth Services 5,705 5,705 5,705 - Universities and Training Institutes - - - - Other 261,890 258,364 217,136 41,228
Total Expenditures 1,648,606 1,669,402 1,561,969 107,433
Excess (Deficiency) of Revenues Over (Under) Expenditures (19,292) (31,678) 147,562 179,240
OTHER FINANCING SOURCES (USES) Carryover of funds from prior year 122,821 122,821 122,821 - Transfers In 200,438 201,472 210,306 8,834 Transfers Out (303,966) (292,625) (292,625) - Insurance Recovery Proceeds - 10 10 -
Total Other Financing Sources (Uses) 19,293 31,678 40,512 8,834
Revenues and Other Sources Over (Under) Expenditures and Other Uses 0$ 0$ 188,074 188,074$
GENERAL FUND
Budgeted Amounts
140
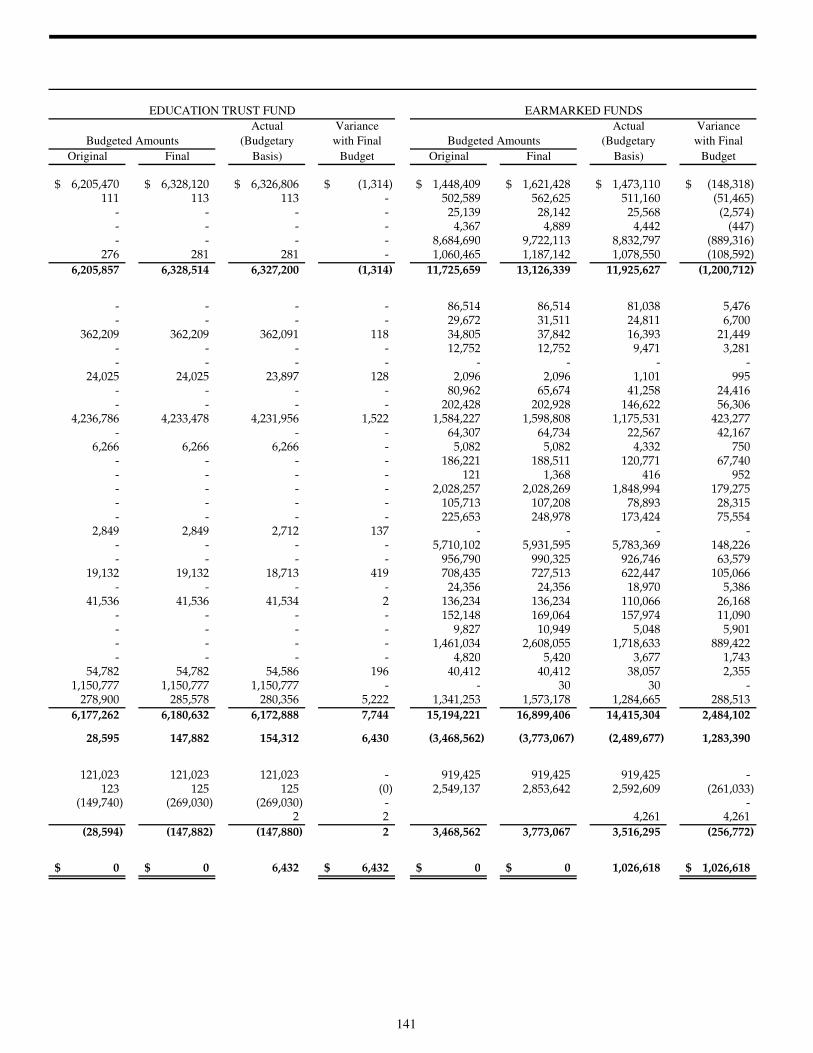
Actual Variance Actual Variance
(Budgetary with Final (Budgetary with Final
Original Final Basis) Budget Original Final Basis) Budget
6,205,470$ 6,328,120$ 6,326,806$ (1,314)$ 1,448,409$ 1,621,428$ 1,473,110$ (148,318)$ 111 113 113 - 502,589 562,625 511,160 (51,465)
- - - - 25,139 28,142 25,568 (2,574) - - - - 4,367 4,889 4,442 (447) - - - - 8,684,690 9,722,113 8,832,797 (889,316)
276 281 281 - 1,060,465 1,187,142 1,078,550 (108,592)
6,205,857 6,328,514 6,327,200 (1,314) 11,725,659 13,126,339 11,925,627 (1,200,712)
- - - - 86,514 86,514 81,038 5,476 - - - - 29,672 31,511 24,811 6,700
362,209 362,209 362,091 118 34,805 37,842 16,393 21,449 - - - - 12,752 12,752 9,471 3,281 - - - - - - - -
24,025 24,025 23,897 128 2,096 2,096 1,101 995 - - - - 80,962 65,674 41,258 24,416 - - - - 202,428 202,928 146,622 56,306
4,236,786 4,233,478 4,231,956 1,522 1,584,227 1,598,808 1,175,531 423,277 - - - 64,307 64,734 22,567 42,167
6,266 6,266 6,266 - 5,082 5,082 4,332 750 - - - - 186,221 188,511 120,771 67,740 - - - - 121 1,368 416 952 - - - - 2,028,257 2,028,269 1,848,994 179,275 - - - - 105,713 107,208 78,893 28,315 - - - - 225,653 248,978 173,424 75,554
2,849 2,849 2,712 137 - - - - - - - - 5,710,102 5,931,595 5,783,369 148,226 - - - - 956,790 990,325 926,746 63,579
19,132 19,132 18,713 419 708,435 727,513 622,447 105,066 - - - - 24,356 24,356 18,970 5,386
41,536 41,536 41,534 2 136,234 136,234 110,066 26,168 - - - - 152,148 169,064 157,974 11,090 - - - - 9,827 10,949 5,048 5,901 - - - - 1,461,034 2,608,055 1,718,633 889,422 - - - - 4,820 5,420 3,677 1,743
54,782 54,782 54,586 196 40,412 40,412 38,057 2,355 1,150,777 1,150,777 1,150,777 - - 30 30 -
278,900 285,578 280,356 5,222 1,341,253 1,573,178 1,284,665 288,513
6,177,262 6,180,632 6,172,888 7,744 15,194,221 16,899,406 14,415,304 2,484,102
28,595 147,882 154,312 6,430 (3,468,562) (3,773,067) (2,489,677) 1,283,390
121,023 121,023 121,023 - 919,425 919,425 919,425 - 123 125 125 (0) 2,549,137 2,853,642 2,592,609 (261,033)
(149,740) (269,030) (269,030) - - 2 2 4,261 4,261
(28,594) (147,882) (147,880) 2 3,468,562 3,773,067 3,516,295 (256,772)
0$ 0$ 6,432 6,432$ 0$ 0$ 1,026,618 1,026,618$
EDUCATION TRUST FUND EARMARKED FUNDS
Budgeted Amounts Budgeted Amounts
141

STATE OF ALABAMA
REQUIRED SUPPLEMENTARY INFORMATION
Budgetary Comparison Schedule - Budget-to-GAAP Reconcilation
For the Fiscal Year Ended September 30, 2017
(Amounts in Thousands)
Education Alabama
General Trust Earmarked Trust
Fund Fund Funds Fund
Revenues and Other Sources Over (Under) Expenditures
and Other Uses - Budgetary Basis 188,074$ 6,432$ 1,026,618$
Reconciliation to GAAP Basis:
Perspective Differences:
Reclassification of budgetary funds to
GAAP financial statement fund types (1,026,618) 4,764$
Basis Differences:
Accruals of revenues and
other revenue adjustments 222,785 35,644 (619)
To remove prior year funds carried over
in budget (122,821) (121,023) (403)
Accruals of expenditures and capitalization
of assets (39,861) (8,647) (20)
To remove encumbrances recognized
as expenditures 2,158 1,912 179
To recognize prior budget year
expenditures/expenses (1,790) (560) (300)
To remove budget expenditures/expenses
not accrued as liabilities 191 123 (90)
Entity Differences:
Add net operating results for
funds not budgeted 449,687
Net Change in Fund Balances/Net Position - GAAP Basis 248,736$ (86,119)$ 0$ 453,198$
BUDGETARY FUNDS
142
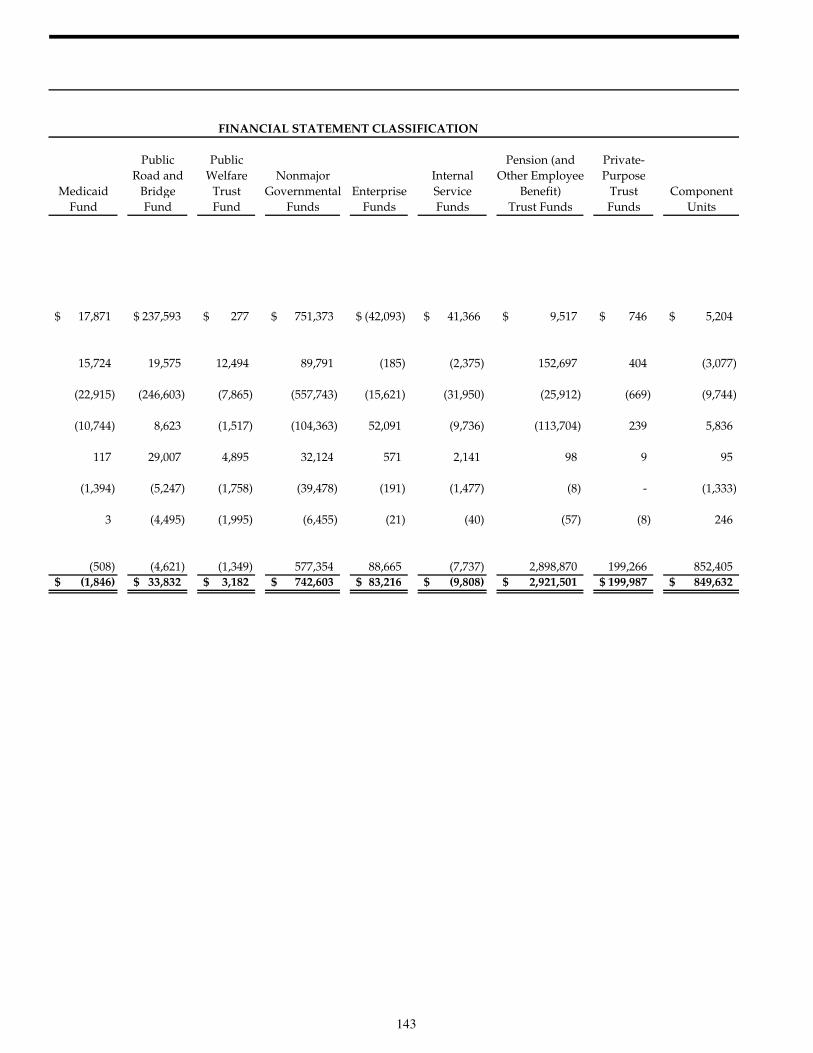
Public Public Pension (and Private-
Road and Welfare Nonmajor Internal Other Employee Purpose
Medicaid Bridge Trust Governmental Enterprise Service Benefit) Trust Component
Fund Fund Fund Funds Funds Funds Trust Funds Funds Units
17,871$ 237,593$ 277$ 751,373$ (42,093)$ 41,366$ 9,517$ 746$ 5,204$
15,724 19,575 12,494 89,791 (185) (2,375) 152,697 404 (3,077)
(22,915) (246,603) (7,865) (557,743) (15,621) (31,950) (25,912) (669) (9,744)
(10,744) 8,623 (1,517) (104,363) 52,091 (9,736) (113,704) 239 5,836
117 29,007 4,895 32,124 571 2,141 98 9 95
(1,394) (5,247) (1,758) (39,478) (191) (1,477) (8) - (1,333)
3 (4,495) (1,995) (6,455) (21) (40) (57) (8) 246
(508) (4,621) (1,349) 577,354 88,665 (7,737) 2,898,870 199,266 852,405
(1,846)$ 33,832$ 3,182$ 742,603$ 83,216$ (9,808)$ 2,921,501$ 199,987$ 849,632$
FINANCIAL STATEMENT CLASSIFICATION
143
STATE OF ALABAMA REQUIRED SUPPLEMENTARY INFORMATION Notes on Budgetary Accounting and Reporting For the Fiscal Year Ended September 30, 2017
144
Budgetary Process
Formulation of the budget begins with the preparation of estimates of expenditure requirements for the next fiscal year by the
administrative head of each budgeted agency and institution. These estimates are submitted annually to the Executive Budget Office
of the Finance Department on or before the first day of the third month preceding each regular session of the Legislature. The budget
is prepared by program elements for each agency. Requested changes in programmatic expenditures over the prior fiscal year must be
explained, and proposed capital expenditures must be justified as required by the Executive Budget Office.
The budget document, as finally developed by the Governor, is published and transmitted to the Legislature on or before the second
legislative day of each regular session. For each agency, comparative summaries of appropriations and revenues are presented for the
prior year, current year, the agency's request for the next year, and the Governor's recommendation for the next year. The
recommended appropriation bills indicate the programmatic appropriation to each agency and the source of funds from which each
appropriation is to be paid. The Legislature then legally enacts the State budget into law through the passage of a number of bills as
Appropriation Acts. Some conditional appropriations are included in the Appropriation Acts. The agencies do not include these
conditional amounts in the original budget, unless the conditions have been met before the fiscal year begins.
Approximately $9.5 million of conditional and other appropriations were distributed to various agencies from the General Fund. The
Fair Trial Tax Fund received $7.5 million in conditional appropriations. Some expenditures are required by law to be fully funded and
estimated amounts are approved in the General Fund appropriation bill. Increases to these estimated amounts do not require a new bill
and are included as other appropriations. Original appropriations to the Departmental Emergency Fund are included in the original
budget. Emergency appropriations cannot exceed two percent of the total General Fund appropriation bill.
During fiscal year 2017, approximately $5 million of supplemental appropriations were distributed from the Education Trust Fund
(ETF) to the Department of Veterans’ Affairs.
The Appropriation Acts budget by agency and program rather than by GAAP basis funds. The State funds its budgetary activities
under three budgetary fund groups. The first is the General Fund, which includes many of the general operations of the three branches
of government. The second is the Education Trust Fund, which is restricted to funding all levels of educational activity in the State.
The third budgetary group is referred to in the budget documents as Earmarked Funds. The Earmarked Funds group includes the
operations of most governmental funds of both the primary government and the component units, as well as portions of some
proprietary and fiduciary operations.
The Appropriation Acts do not include a revenue budget. At the time of their passage, estimates prepared by legislative and executive
branch professional staff assure the legislature that adequate revenues will be available to meet the level of appropriations approved.
The Appropriation Acts specify that in addition to the appropriations made, all gifts, grants, or contributions in excess of the amount
appropriated are automatically appropriated to be used for the purposes specified in the gift, grant, or contribution. This includes
federal funds which are included in the Earmarked Funds. Most of the $1.7 billion increase in the Earmarked Funds is increased
federal funds.
Numerous statutes exist which restrict the use of most state revenue sources to specific uses. The General Fund is funded by a wide
variety of taxes, licenses, and interest income. The ETF is funded primarily by income taxes and sales taxes. The Earmarked Funds
are generally funded by a combination of federal funds, local funds, and specific taxes and licenses. State law also requires that if
revenues actually received are inadequate to fund the appropriations, then the appropriations must be prorated to the level that the
revenues will support. For the Budgetary Comparison Schedule, the budgeted revenues consist of the amount of budgeted
expenditures allocated among the revenue categories in proportion to the actual amounts received.
Budgetary Control
The legal level of control is the agency and program specified in the Appropriation Acts. For example, “Lab Analysis and Disease
Control” and “Agricultural Inspection Services” are two programs within the agency of Agriculture and Industries. Below this legal
level of control, the professional management of the Finance Department, under the authority of the Governor’s policy, exercises
budgetary control at the fund and object level. Each agency must submit an operations plan detailing planned expenditures down to
the object level, and then must follow that plan or explain why a change must be made. Allotments of appropriations are made
quarterly based on the plans of operations submitted by the agencies.
The Department of Finance enforces both the legal level and the professional management level of budgetary control through
automated edits which must be complied with before making expenditures against an appropriation. A change between objects within
appropriations for programs (financial management level) must have the approval of the Budget Officer and the Finance Director.

STATE OF ALABAMA REQUIRED SUPPLEMENTARY INFORMATION Notes on Budgetary Accounting and Reporting For the Fiscal Year Ended September 30, 2017
145
The Budget Management Act legally authorizes the transfer of appropriations between programs within an agency with the approval
of the Governor. Any transfers approved by the Governor must be reported to the Legislature. Transfers between agencies, but within
the same program, may be made pursuant to interagency agreements executed for the purposes of accomplishing the objectives for
which the Legislature made the appropriation. These interagency agreements must also be approved by the Governor. Under the
Budget Management Act, the Governor cannot create new budget authority; he or she can only transfer existing authority.
Both the Constitution of Alabama of 1901 and the statutes require a balanced budget for annual financial operations. The Finance
Department monitors revenue projections during the year to ensure that adequate funds will be available to meet budgeted
expenditures. If cash collections do not meet budget projections, the Governor is required to prorate appropriations and restrict
allotments to prevent an overdraft or budget deficit in any fiscal year. Within the Alabama Trust Fund, a General Fund Rainy Day
Account and an Education Trust Fund Rainy Day Account have been created by constitutional amendment. If proration is declared
for the General Fund or the Education Trust Fund, then oil and gas capital payments in the Alabama Trust Fund will be used to fund
withdrawals from the Rainy Day Accounts. If proration is declared for the General Fund, Rainy Day withdrawals may not exceed the
lesser of (a) ten percent of the previous fiscal year’s General Fund appropriations less the total amount of any prior years’ withdrawals
from the account which have not been repaid to the account, or (b) the average of the estimated available revenue for the General Fund
certified by the Finance Director and the Legislative Fiscal Officer prior to the third legislative day of the Regular Session. If
proration is declared for the Education Trust Fund, Rainy Day withdrawals may not exceed the lesser of (a) six and one-half percent of
the previous fiscal year’s Education Trust Fund appropriations less the total amount of any prior years’ withdrawals from the account
which have not been repaid to the account, or (b) the average of the estimated available revenue for the Education Trust Fund certified
by the Finance Director and the Legislative Fiscal Officer prior to the third legislative day of the Regular Session. The Rainy Day
Accounts must be replenished within 10 years for the General Fund withdrawals and 6 years for the Education Trust Fund
withdrawals. Neither the General Fund nor the Education Trust Fund was prorated in 2017. The Education Trust Fund has paid back
all of its withdrawals. The available balance during FY17 for the Education Trust Fund Rainy Day Account was $396 million. During
FY17, The General Fund paid back the balance of $162 million which was withdrawn in 2010. The General Fund Rainy Day Account
available balance during FY17 was $191 million.
The Rolling Reserve Act (Act 2011-3, as amended by Act 2015-538) caps appropriations from the Education Trust Fund (ETF). The
cap is the sum of recurring revenues deposited into the ETF in the last completed fiscal year preceding the calculation year adjusted up
or down by: (1) the average annual percentage change in recurring revenues for the 14 highest of the 15 completed fiscal years
preceding the date on which the calculation is made; (2) if legislation is enacted that will increase recurring revenues deposited into
the ETF, an amount equal to 95 percent of the fiscal note attached to the legislative act is added to the cap; (3) if legislation is enacted
that will decrease recurring revenues deposited into the ETF, the negative impact, based on the enacted fiscal note is subtracted from
the cap; (4) any nonrecurring revenue; and (5) the amount required to be appropriated from the ETF to the Prepaid Affordable College
Tuition Trust Fund. The Finance Director and the Legislative Fiscal Officer must certify their computation of the cap at the same time
as the certification required by Amendment 803 to the Constitution of Alabama of 1901 (prior to the third day of each Regular
Session). Revenues in excess of the appropriation cap are required to be used to pay back transfers from the constitutional ETF Rainy
Day Account until the account has been repaid in full. Any remaining funds shall be transferred to the ETF Budget Stabilization Fund
and the ETF Advancement and Technology Fund. The ETF Budget Stabilization Fund will generally be used to reduce any future
proration. At the end of fiscal year 2017 the balance in the ETF Budget Stabilization Fund was $179 million.
Encumbrance Accounting
Encumbrances represent commitments related to unperformed contracts for goods and services. Encumbrance accounting is used as
purchase orders are issued to ensure that purchase orders plus expenditures do not exceed allotment balances. At fiscal year end this
control becomes stricter, as purchase orders plus any other obligations or accounts payable incurred against fiscal year appropriations
may not exceed allotment balances.
Encumbrances are reported in the year the orders are placed for budgetary purposes in the Budgetary Comparison Schedule.
Encumbrances are reported in the year the goods and services are received for GAAP basis financial statements.
Lapsing of Appropriations
All non-capital outlay appropriation balances not reserved by encumbrances or accounts payable lapse at September 30 of each fiscal
year. Furthermore, any non-capital outlay appropriation balance not reserved by encumbrances lapses at November 30 following each
fiscal year. Encumbrances remain valid for a period of one year following the end of the fiscal year. Balances of encumbrances are
reported on the Budgetary Comparison Schedule as expenditures. Capital outlay appropriations for the purchase of land, the
construction of buildings, or for the maintenance of roads and bridges of the state highway system continue until the completion of the
project.
STATE OF ALABAMA REQUIRED SUPPLEMENTARY INFORMATION Notes on Budgetary Accounting and Reporting For the Fiscal Year Ended September 30, 2017
146
Budgetary Basis of Accounting and Fund Structure
The State budgets and operates primarily on the budgetary basis which approximates the cash basis with certain material exceptions.
During the fiscal year, encumbrances, which represent obligations against current fiscal year appropriations, are accrued. At year end,
fund balances are reserved to accrue expenditures for those outstanding encumbrances and estimated accounts payable. In compliance
with Amendment 26 to the Constitution of Alabama of 1901, the total reservation may not exceed the cash on hand in the State
Treasury. Therefore, at year end, cash always equals or exceeds obligations (encumbrances and estimated accounts payable). The
Budgetary Comparison Schedule (Non-GAAP Basis) presents comparisons of the adopted budget with actual data on a budgetary
basis. The budget excludes funds for all entities operating outside the State Treasury, certain distributive accounts such as those for
making distributions to local governments, and most debt service accounts. Since the accounting principles used in the State’s
budgetary basis of accounting differ significantly from those used to present financial statements in conformity with GAAP, a
reconciliation of the differences is presented on the schedule. Governmental Accounting Standards Board (GASB) Statement No. 41
requires that budgetary comparison schedules be presented as RSI based on the fund, organization, or program structure that the
government uses for its legally adopted budget for a government with significant budgetary perspective differences that result in the
government’s not being able to present budgetary comparisons for the general fund and each major special revenue fund. The
budgetary fund structure for the General Fund group and the Education Trust Fund group is essentially the same as the GAAP fund
structure. The Earmarked Fund group does not correspond to a major GAAP fund and these perspective differences are included in the
Budget-to-GAAP Reconciliation. The budgets of some major funds are spread throughout various agencies and programs in the
Earmarked Fund group. A Detail Schedule of Budget and Actual Expenditures appears in the Governmental Funds subsection of the
Combining and Individual Fund Statements and Schedules Section of the CAFR. This schedule provides detailed information at the
legal level of control for each individual appropriation item contained in the budget for all budgetary fund groups.

STATE OF ALABAMA REQUIRED SUPPLEMENTARY INFORMATION Ten Year Loss Development Information for State Insurance Fund For the Fiscal Year Ended September 30, 2017
147
The following table illustrates how the State Insurance Fund's (Fund) earned revenue (net of reinsurance) and investment income
compare to related costs of loss (net of loss assumed by reinsurers) and other expenses assumed by the Fund as of the end of each of
the previous ten years. The rows of the table are defined as follows: (1) This line shows the total of each fiscal year's gross earned
premiums and reported investment revenue, amounts of premiums ceded, and reported premiums (net of reinsurance) and reported
investment revenue. (2) This line shows each fiscal year's other operating costs of the Fund including overhead and loss adjustment
expenses not allocable to individual claims. (3) This line shows the Fund's gross incurred losses and allocated loss adjustment
expense, losses assumed by reinsurers, and net incurred losses and loss adjustment expense (both paid and accrued) as originally
reported at the end of the year in which the event that triggered coverage occurred (called accident year). (4) This section of ten rows
shows the cumulative net amounts paid as of the end of successive years for each accident year. (5) This line shows the latest
reestimated amount of losses assumed by reinsurers for each accident year. (6) This section of ten rows shows how each accident
year's net incurred losses increased or decreased as of the end of successive years. (This annual reestimation results from new
information received on known losses, reevaluation of existing information on known losses, and emergence of new losses not
previously known.) (7) This line compares the latest reestimated net incurred losses amount to the amount originally established (line
3) and shows whether this latest estimate of losses is greater or less than originally estimated. As data for individual accident years
mature, the correlation between original estimates and reestimated amounts is commonly used to evaluate the accuracy of net incurred
losses currently recognized in less mature accident years. The columns of the table show data for successive accident years.
(Amounts in Thousands)
2008 2009 2010 2011 2012 2013 2014 2015 2016 20171. Premiums and investment revenue:
Earned 31,505 32,760 32,489 30,401 36,732 40,758 44,343 46,049 55,381 60,037
Ceded 16,582 17,022 16,803 16,625 20,834 26,115 24,153 22,469 21,171 20,273
Net Earned 14,923 15,738 15,686 13,776 15,898 14,643 20,190 23,580 34,210 39,764
2. Unallocated Expenses 3,030 3,273 3,010 2,863 2,774 3,090 3,375 3,710 3,494 3,270
3. Estimated losses and expenses, end
of accident year:
Incurred 9,843 15,975 17,531 113,642 38,861 33,467 11,500 8,300 16,450 19,792
Ceded - - 5,781 91,228 28,359 2,757 - - 4,550 6,969
Net incurred 9,843 15,975 11,750 22,414 10,502 30,710 11,500 8,300 11,900 12,823
4. Net paid (cumulative) as of:
End of Accident Year 2,840 5,135 6,493 9,192 3,842 16,000 3,823 2,857 6,316 5,240
One Year Later 6,257 11,681 10,178 16,880 22,703 26,555 8,188 6,477 9,680
Two Years Later 6,613 14,307 10,241 22,070 4,351 29,088 8,275 7,000
Three Years Later 6,710 14,310 10,859 21,604 11,370 29,611 8,446
Four Years Later 6,750 14,312 10,858 21,833 11,369 29,609
Five Years Later 6,750 14,312 10,856 21,833 11,369
Six Years Later 6,750 14,312 10,855 21,833
Seven Years Later 6,750 14,312 10,854
Eight Years Later 6,750 14,312
Nine Years Later 6,750
5. Reestimated ceded losses and
expenses - - 2,929 72,691 18,662 - - - 3,148 6,969
6. Reestimated net incurred losses
and expenses as of:
End of Accident Year 9,843 15,975 11,750 22,414 10,502 30,710 11,500 8,300 11,900 12,823
One Year Later 7,535 14,850 10,750 21,000 32,435 29,711 9,000 7,700 11,800
Two Years Later 7,240 14,606 10,883 22,900 11,045 29,688 8,643 7,700
Three Years Later 7,072 14,528 10,859 22,062 11,370 29,611 8,446
Four Years Later 6,750 14,312 10,858 21,833 11,369 29,609
Five Years Later 6,750 14,312 10,856 21,833 11,369
Six Years Later 6,750 14,312 10,855 21,833
Seven Years Later 6,750 14,312 10,854
Eight Years Later 6,750 14,312
Nine Years Later 6,750
7. Increase (decrease) in estimated net
incurred losses and expenses from
end of accident year (3,093) (1,663) (896) (581) 867 (1,101) (3,054) (600) (100) -
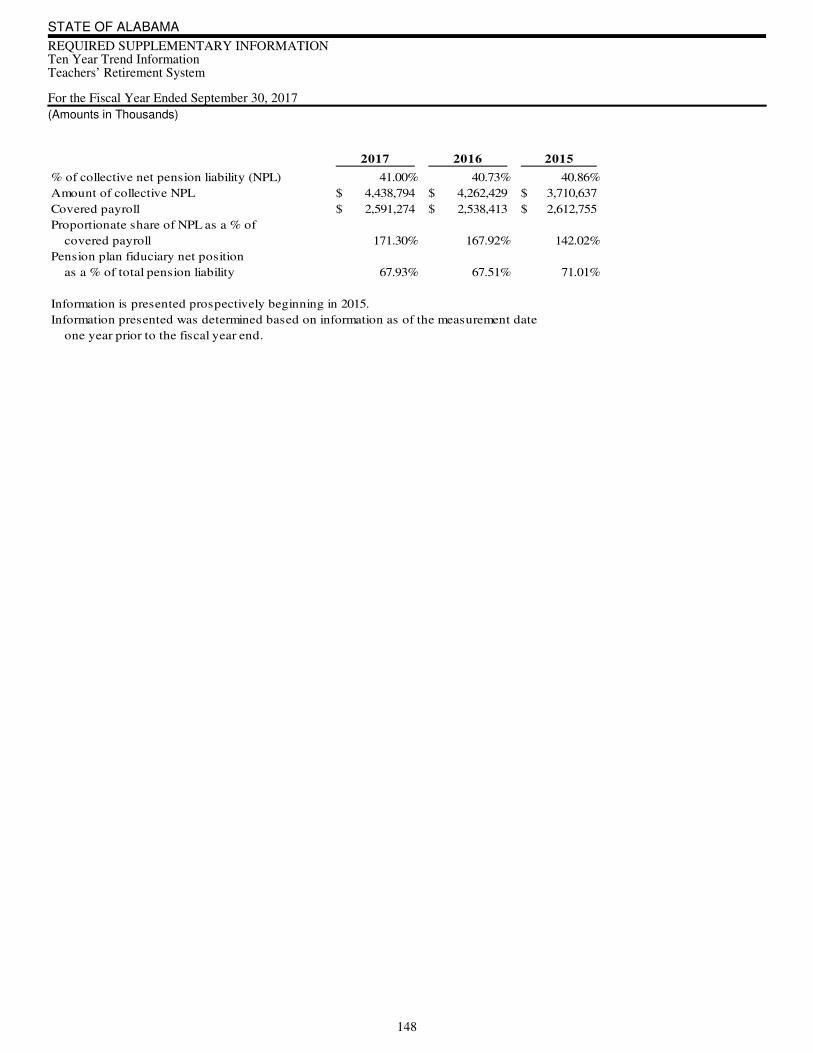
STATE OF ALABAMA REQUIRED SUPPLEMENTARY INFORMATION Ten Year Trend Information Teachers’ Retirement System For the Fiscal Year Ended September 30, 2017
(Amounts in Thousands)
148
2017 2016 2015
% of collective net pension liability (NPL) 41.00% 40.73% 40.86%
Amount of collective NPL 4,438,794$ 4,262,429$ 3,710,637$
Covered payroll 2,591,274$ 2,538,413$ 2,612,755$
Proportionate share of NPL as a % of
covered payroll 171.30% 167.92% 142.02%
Pension plan fiduciary net position
as a % of total pension liability 67.93% 67.51% 71.01%
Information is presented prospectively beginning in 2015.
Information presented was determined based on information as of the measurement date
one year prior to the fiscal year end.
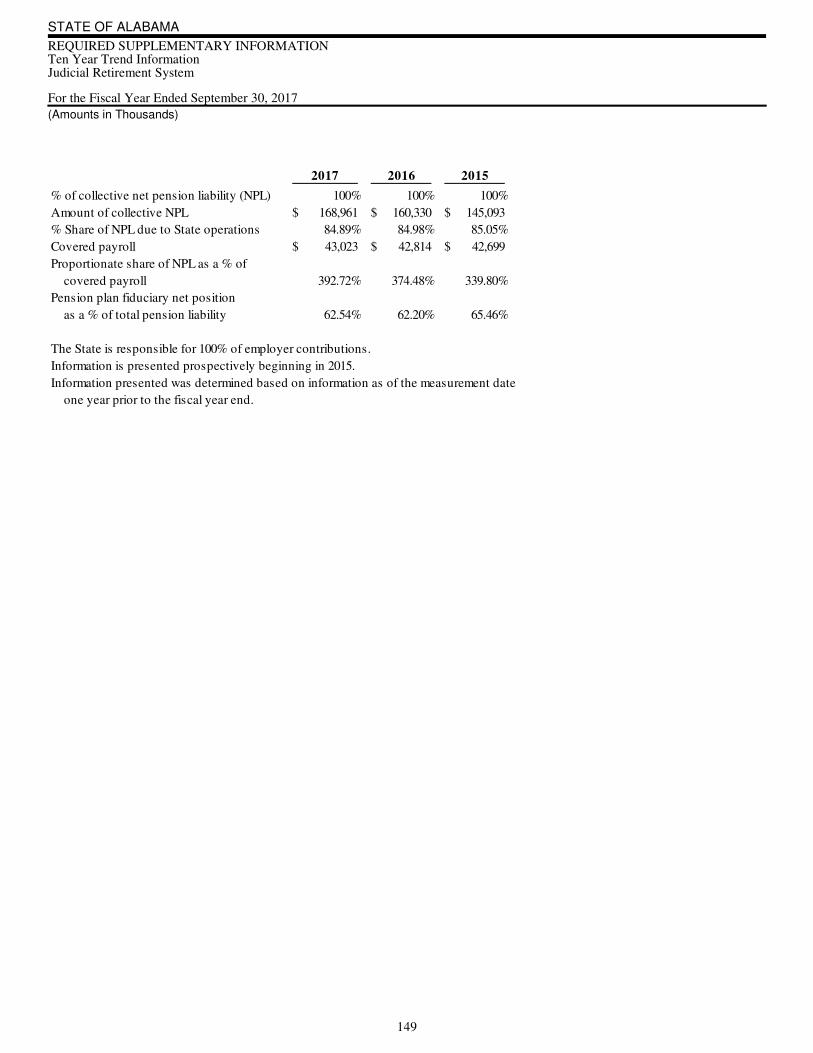
STATE OF ALABAMA REQUIRED SUPPLEMENTARY INFORMATION Ten Year Trend Information Judicial Retirement System For the Fiscal Year Ended September 30, 2017
(Amounts in Thousands)
149
2017 2016 2015
% of collective net pension liability (NPL) 100% 100% 100%
Amount of collective NPL 168,961$ 160,330$ 145,093$
% Share of NPL due to State operations 84.89% 84.98% 85.05%
Covered payroll 43,023$ 42,814$ 42,699$
Proportionate share of NPL as a % of
covered payroll 392.72% 374.48% 339.80%
Pension plan fiduciary net position
as a % of total pension liability 62.54% 62.20% 65.46%
The State is responsible for 100% of employer contributions.
Information is presented prospectively beginning in 2015.
Information presented was determined based on information as of the measurement date
one year prior to the fiscal year end.
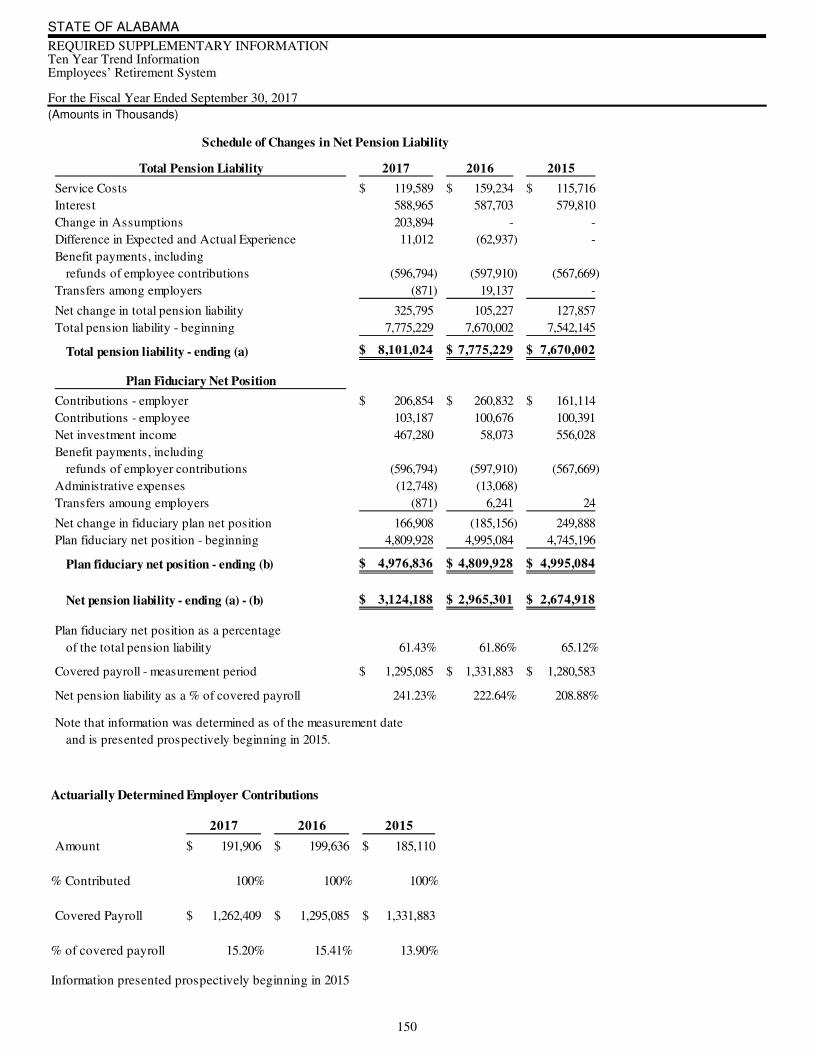
STATE OF ALABAMA REQUIRED SUPPLEMENTARY INFORMATION Ten Year Trend Information Employees’ Retirement System For the Fiscal Year Ended September 30, 2017
(Amounts in Thousands)
150
Actuarially Determined Employer Contributions
2017 2016 2015
Amount 191,906$ 199,636$ 185,110$
% Contributed 100% 100% 100%
Covered Payroll 1,262,409$ 1,295,085$ 1,331,883$
% of covered payroll 15.20% 15.41% 13.90%
Information presented prospectively beginning in 2015
2017 2016 2015
Service Costs 119,589$ 159,234$ 115,716$
Interest 588,965 587,703 579,810
Change in Assumptions 203,894 - -
Difference in Expected and Actual Experience 11,012 (62,937) -
Benefit payments, including
refunds of employee contributions (596,794) (597,910) (567,669)
Transfers among employers (871) 19,137 -
Net change in total pension liability 325,795 105,227 127,857
Total pension liability - beginning 7,775,229 7,670,002 7,542,145
Total pension liability - ending (a) 8,101,024$ 7,775,229$ 7,670,002$
Contributions - employer 206,854$ 260,832$ 161,114$
Contributions - employee 103,187 100,676 100,391
Net investment income 467,280 58,073 556,028
Benefit payments, including
refunds of employer contributions (596,794) (597,910) (567,669)
Administrative expenses (12,748) (13,068)
Transfers amoung employers (871) 6,241 24
Net change in fiduciary plan net position 166,908 (185,156) 249,888
Plan fiduciary net position - beginning 4,809,928 4,995,084 4,745,196
Plan fiduciary net position - ending (b) 4,976,836$ 4,809,928$ 4,995,084$
Net pension liability - ending (a) - (b) 3,124,188$ 2,965,301$ 2,674,918$
Plan fiduciary net position as a percentage
of the total pension liability 61.43% 61.86% 65.12%
Covered payroll - measurement period 1,295,085$ 1,331,883$ 1,280,583$
Net pension liability as a % of covered payroll 241.23% 222.64% 208.88%
Note that information was determined as of the measurement date
and is presented prospectively beginning in 2015.
Total Pension Liability
Plan Fiduciary Net Position
Schedule of Changes in Net Pension Liability
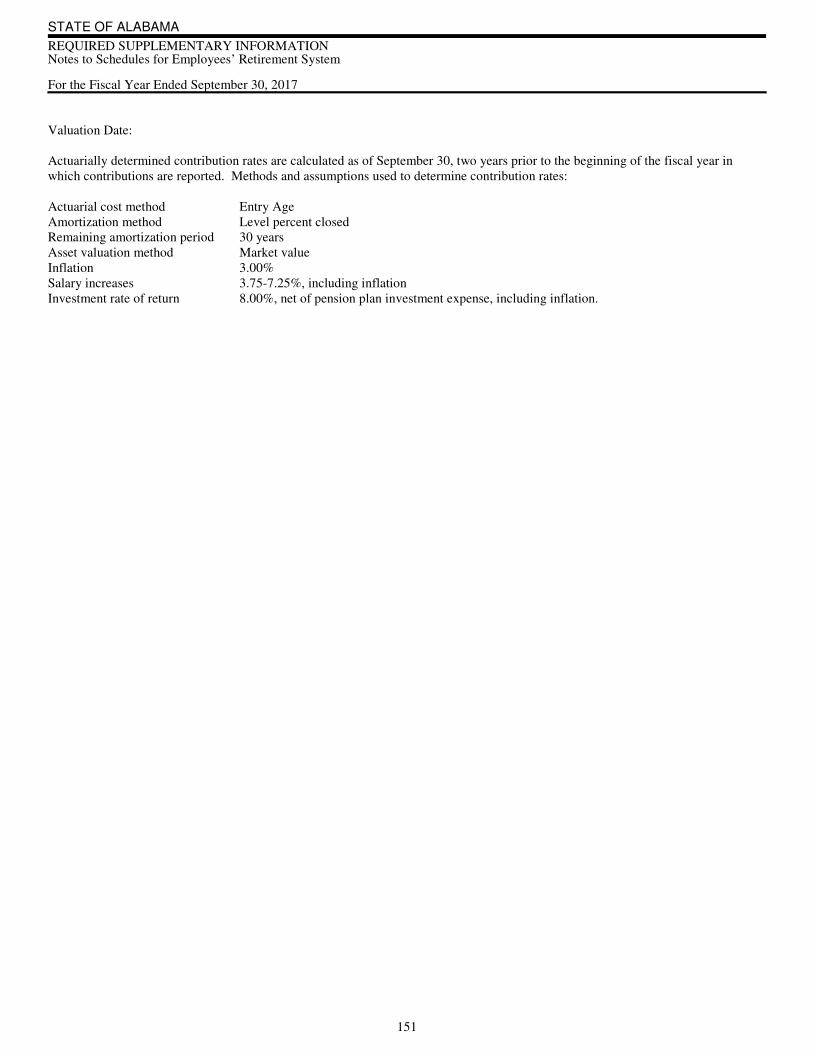
STATE OF ALABAMA REQUIRED SUPPLEMENTARY INFORMATION Notes to Schedules for Employees’ Retirement System For the Fiscal Year Ended September 30, 2017
151
Valuation Date:
Actuarially determined contribution rates are calculated as of September 30, two years prior to the beginning of the fiscal year in
which contributions are reported. Methods and assumptions used to determine contribution rates:
Actuarial cost method Entry Age
Amortization method Level percent closed
Remaining amortization period 30 years
Asset valuation method Market value
Inflation 3.00%
Salary increases 3.75-7.25%, including inflation
Investment rate of return 8.00%, net of pension plan investment expense, including inflation.
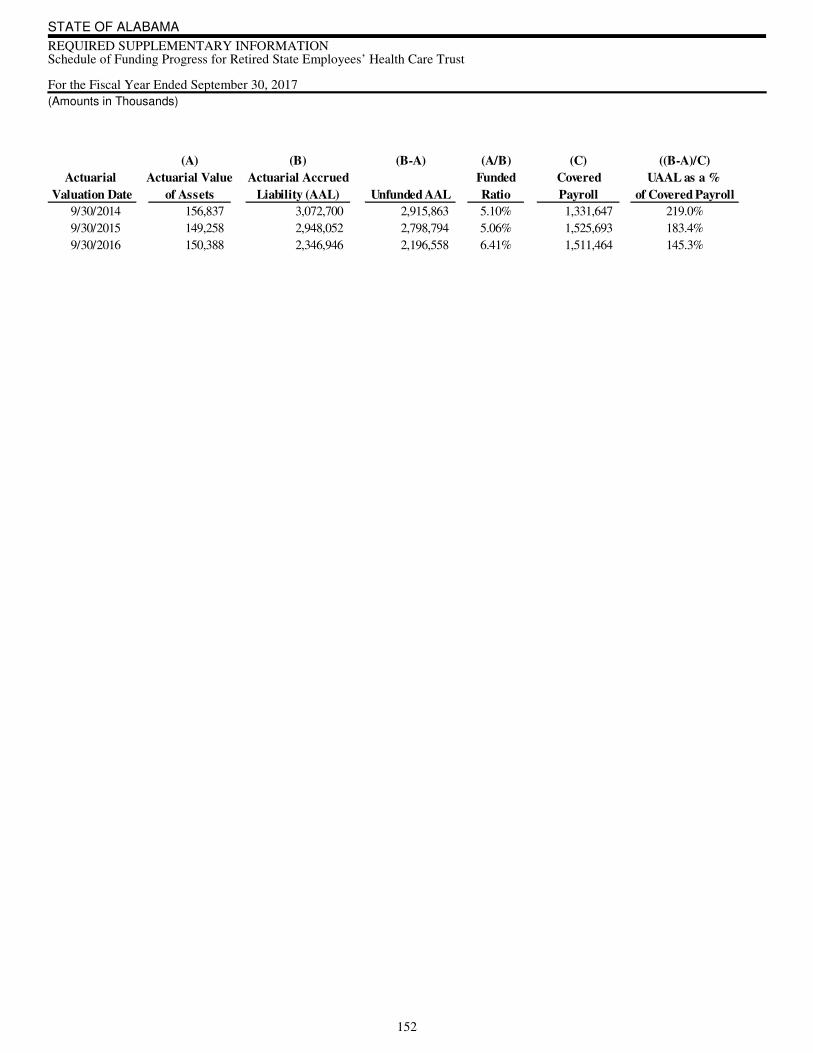
STATE OF ALABAMA REQUIRED SUPPLEMENTARY INFORMATION Schedule of Funding Progress for Retired State Employees’ Health Care Trust For the Fiscal Year Ended September 30, 2017
(Amounts in Thousands)
152
(A) (B) (B-A) (A/B) (C) ((B-A)/C)
Actuarial Actuarial Value Actuarial Accrued Funded Covered UAAL as a %
Valuation Date of Assets Liability (AAL) Unfunded AAL Ratio Payroll of Covered Payroll
9/30/2014 156,837 3,072,700 2,915,863 5.10% 1,331,647 219.0%
9/30/2015 149,258 2,948,052 2,798,794 5.06% 1,525,693 183.4%
9/30/2016 150,388 2,346,946 2,196,558 6.41% 1,511,464 145.3%
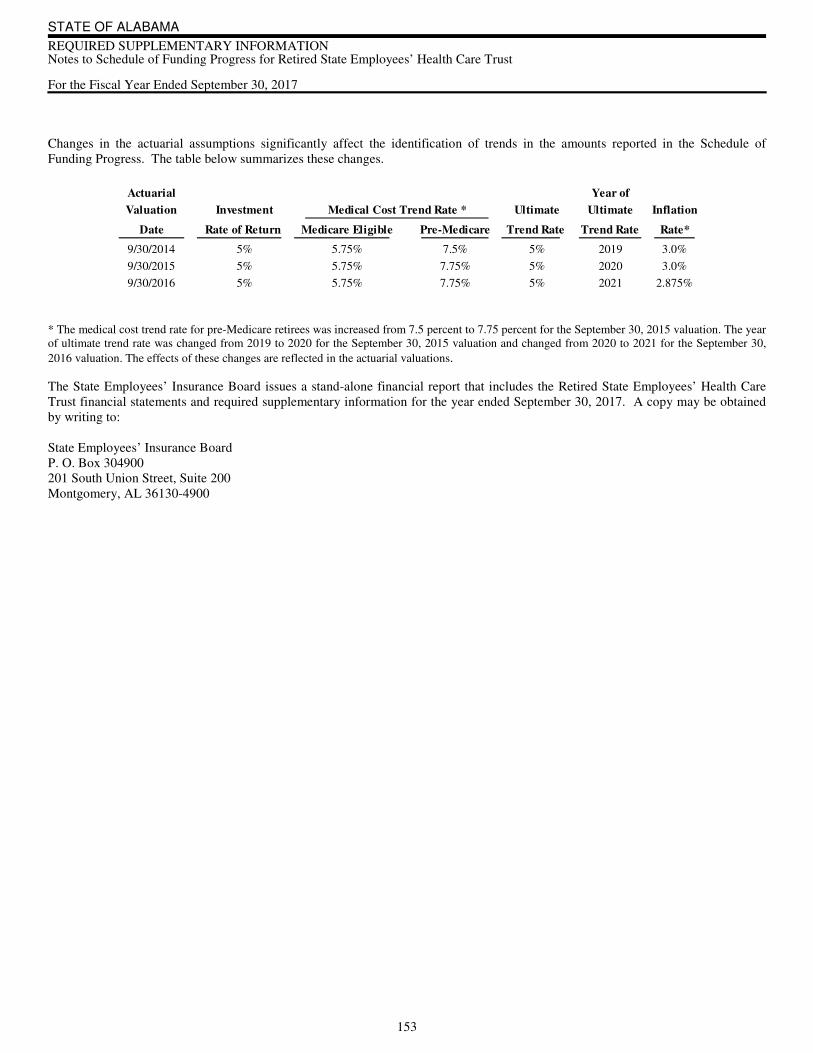
STATE OF ALABAMA REQUIRED SUPPLEMENTARY INFORMATION Notes to Schedule of Funding Progress for Retired State Employees’ Health Care Trust For the Fiscal Year Ended September 30, 2017
153
Changes in the actuarial assumptions significantly affect the identification of trends in the amounts reported in the Schedule of
Funding Progress. The table below summarizes these changes.
* The medical cost trend rate for pre-Medicare retirees was increased from 7.5 percent to 7.75 percent for the September 30, 2015 valuation. The year
of ultimate trend rate was changed from 2019 to 2020 for the September 30, 2015 valuation and changed from 2020 to 2021 for the September 30,
2016 valuation. The effects of these changes are reflected in the actuarial valuations.
The State Employees’ Insurance Board issues a stand-alone financial report that includes the Retired State Employees’ Health Care
Trust financial statements and required supplementary information for the year ended September 30, 2017. A copy may be obtained
by writing to:
State Employees’ Insurance Board
P. O. Box 304900
201 South Union Street, Suite 200
Montgomery, AL 36130-4900
Actuarial Year of
Valuation Investment Ultimate Ultimate Inflation
Date Rate of Return Medicare Eligible Pre-Medicare Trend Rate Trend Rate Rate*
9/30/2014 5% 5.75% 7.5% 5% 2019 3.0%
9/30/2015 5% 5.75% 7.75% 5% 2020 3.0%
9/30/2016 5% 5.75% 7.75% 5% 2021 2.875%
Medical Cost Trend Rate *
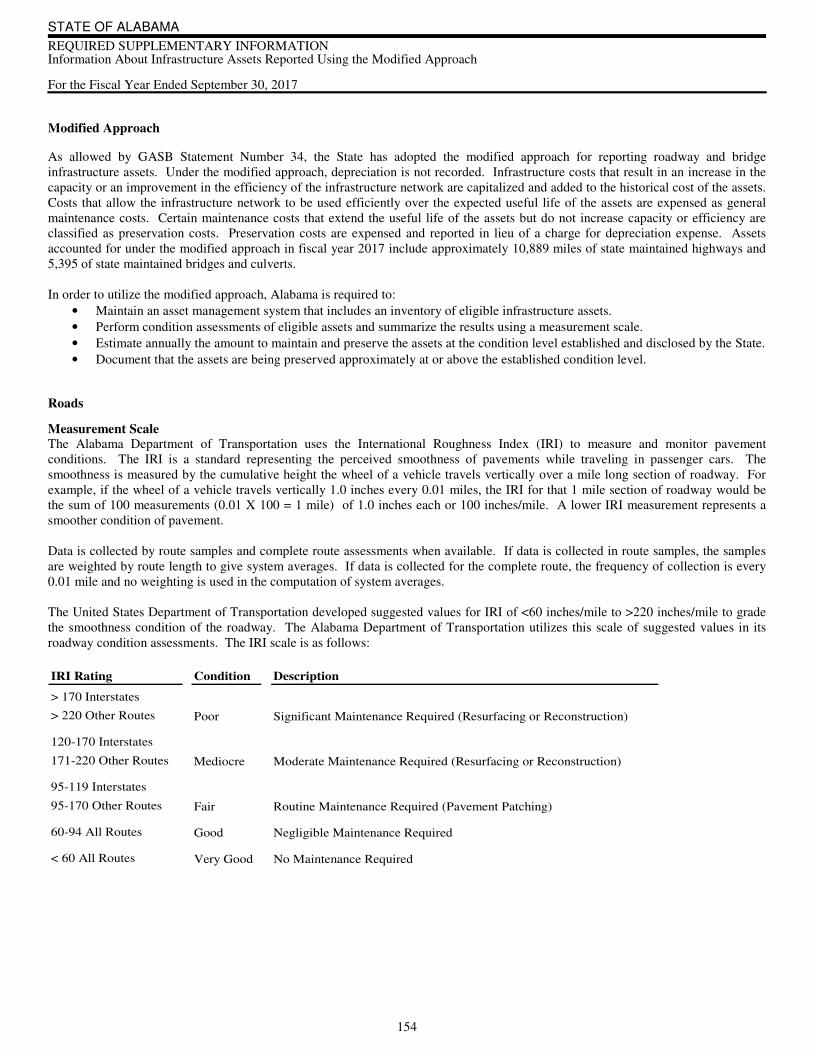
STATE OF ALABAMA REQUIRED SUPPLEMENTARY INFORMATION Information About Infrastructure Assets Reported Using the Modified Approach For the Fiscal Year Ended September 30, 2017
154
Modified Approach
As allowed by GASB Statement Number 34, the State has adopted the modified approach for reporting roadway and bridge
infrastructure assets. Under the modified approach, depreciation is not recorded. Infrastructure costs that result in an increase in the
capacity or an improvement in the efficiency of the infrastructure network are capitalized and added to the historical cost of the assets.
Costs that allow the infrastructure network to be used efficiently over the expected useful life of the assets are expensed as general
maintenance costs. Certain maintenance costs that extend the useful life of the assets but do not increase capacity or efficiency are
classified as preservation costs. Preservation costs are expensed and reported in lieu of a charge for depreciation expense. Assets
accounted for under the modified approach in fiscal year 2017 include approximately 10,889 miles of state maintained highways and
5,395 of state maintained bridges and culverts.
In order to utilize the modified approach, Alabama is required to:
• Maintain an asset management system that includes an inventory of eligible infrastructure assets.
• Perform condition assessments of eligible assets and summarize the results using a measurement scale.
• Estimate annually the amount to maintain and preserve the assets at the condition level established and disclosed by the State.
• Document that the assets are being preserved approximately at or above the established condition level.
Roads
Measurement Scale The Alabama Department of Transportation uses the International Roughness Index (IRI) to measure and monitor pavement
conditions. The IRI is a standard representing the perceived smoothness of pavements while traveling in passenger cars. The
smoothness is measured by the cumulative height the wheel of a vehicle travels vertically over a mile long section of roadway. For
example, if the wheel of a vehicle travels vertically 1.0 inches every 0.01 miles, the IRI for that 1 mile section of roadway would be
the sum of 100 measurements (0.01 X 100 = 1 mile) of 1.0 inches each or 100 inches/mile. A lower IRI measurement represents a
smoother condition of pavement.
Data is collected by route samples and complete route assessments when available. If data is collected in route samples, the samples
are weighted by route length to give system averages. If data is collected for the complete route, the frequency of collection is every
0.01 mile and no weighting is used in the computation of system averages.
The United States Department of Transportation developed suggested values for IRI of <60 inches/mile to >220 inches/mile to grade
the smoothness condition of the roadway. The Alabama Department of Transportation utilizes this scale of suggested values in its
roadway condition assessments. The IRI scale is as follows:
IRI Rating Condition Description
> 170 Interstates
> 220 Other Routes Poor Significant Maintenance Required (Resurfacing or Reconstruction)
120-170 Interstates
171-220 Other Routes Mediocre Moderate Maintenance Required (Resurfacing or Reconstruction)
95-119 Interstates
95-170 Other Routes Fair Routine Maintenance Required (Pavement Patching)
60-94 All Routes Good Negligible Maintenance Required
< 60 All Routes Very Good No Maintenance Required
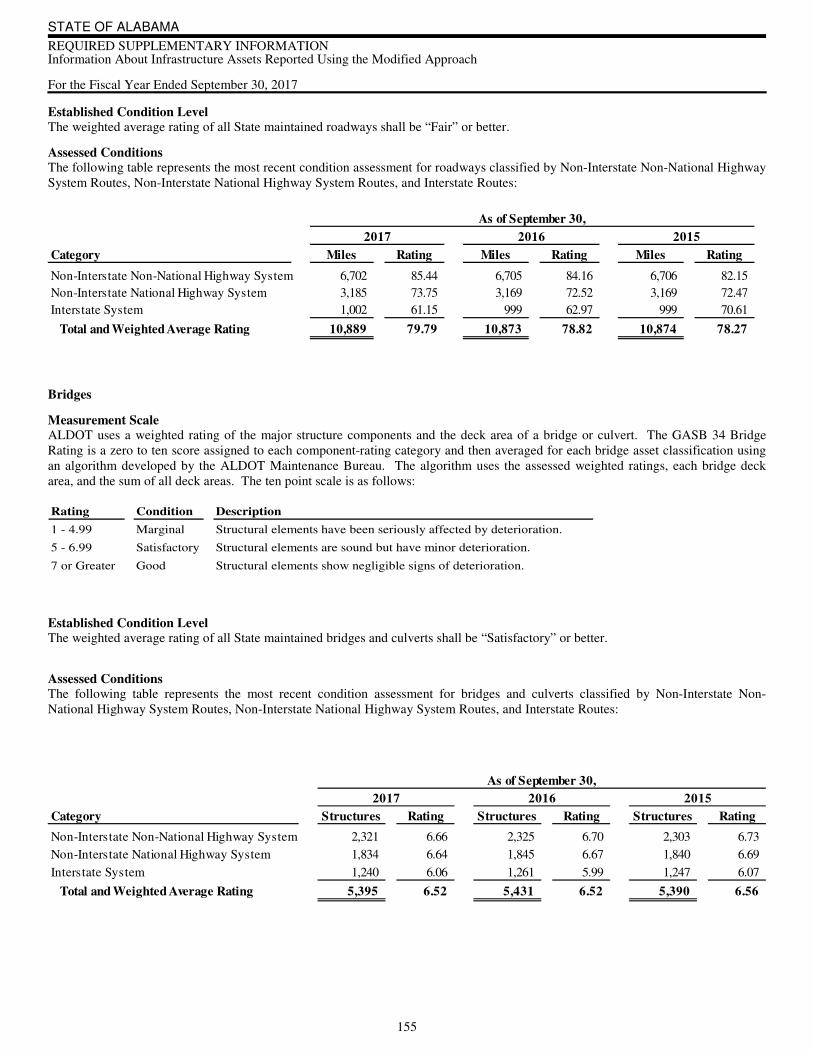
STATE OF ALABAMA REQUIRED SUPPLEMENTARY INFORMATION Information About Infrastructure Assets Reported Using the Modified Approach For the Fiscal Year Ended September 30, 2017
155
Established Condition Level The weighted average rating of all State maintained roadways shall be “Fair” or better.
Assessed Conditions The following table represents the most recent condition assessment for roadways classified by Non-Interstate Non-National Highway
System Routes, Non-Interstate National Highway System Routes, and Interstate Routes:
Bridges
Measurement Scale ALDOT uses a weighted rating of the major structure components and the deck area of a bridge or culvert. The GASB 34 Bridge
Rating is a zero to ten score assigned to each component-rating category and then averaged for each bridge asset classification using
an algorithm developed by the ALDOT Maintenance Bureau. The algorithm uses the assessed weighted ratings, each bridge deck
area, and the sum of all deck areas. The ten point scale is as follows:
Rating Condition Description
1 - 4.99 Marginal Structural elements have been seriously affected by deterioration.
5 - 6.99 Satisfactory Structural elements are sound but have minor deterioration.
7 or Greater Good Structural elements show negligible signs of deterioration.
Established Condition Level The weighted average rating of all State maintained bridges and culverts shall be “Satisfactory” or better.
Assessed Conditions The following table represents the most recent condition assessment for bridges and culverts classified by Non-Interstate Non-
National Highway System Routes, Non-Interstate National Highway System Routes, and Interstate Routes:
Category Miles Rating Miles Rating Miles Rating
Non-Interstate Non-National Highway System 6,702 85.44 6,705 84.16 6,706 82.15
Non-Interstate National Highway System 3,185 73.75 3,169 72.52 3,169 72.47
Interstate System 1,002 61.15 999 62.97 999 70.61
Total and Weighted Average Rating 10,889 79.79 10,873 78.82 10,874 78.27
2017 2016
As of September 30,
2015
Category Structures Rating Structures Rating Structures Rating
Non-Interstate Non-National Highway System 2,321 6.66 2,325 6.70 2,303 6.73
Non-Interstate National Highway System 1,834 6.64 1,845 6.67 1,840 6.69
Interstate System 1,240 6.06 1,261 5.99 1,247 6.07
Total and Weighted Average Rating 5,395 6.52 5,431 6.52 5,390 6.56
2017 2016
As of September 30,
2015
STATE OF ALABAMA REQUIRED SUPPLEMENTARY INFORMATION Information About Infrastructure Assets Reported Using the Modified Approach For the Fiscal Year Ended September 30, 2017
156
Estimated and Actual Costs For fiscal years 2017, 2016, 2015, 2014, and 2013, the State estimated it would need to spend $361.8, $323.6, $309.2, $333.1, and
$334.9, respectively, to preserve and maintain all roadway assets (amounts in millions) and $10 million in each year to preserve all
bridge assets at or above the “Established Condition Levels” presented above. The State spent $372,860,000 for roadway preservation
and $286,279,000 for bridge preservation in fiscal year 2017. The State spent $324,726,000 for roadway preservation and
$163,389,000 for bridge preservation in fiscal year 2016. The State spent $424,506,000 for roadway preservation and $116,600,000
for bridge preservation in fiscal year 2015. The State spent $468,464,000 for road preservation and $80,579,000 for bridge
preservation in fiscal year 2014. In fiscal year 2013, the State spent $496,695,000 for road preservation and $69,060,000 for bridge
preservation. In the next fiscal year, the Alabama Department of Transportation estimates that it will need to spend approximately
$357,767,881 to preserve all roadway assets and approximately $10,000,000 to preserve all bridge assets at or above the “Established
Condition Levels” presented above. Condition levels are expected to continue to meet or exceed the “Established Condition Levels”.
STATE OF ALABAMA
FINANCIAL SECTIONCombining and Individual Fund Statements and Schedules
157
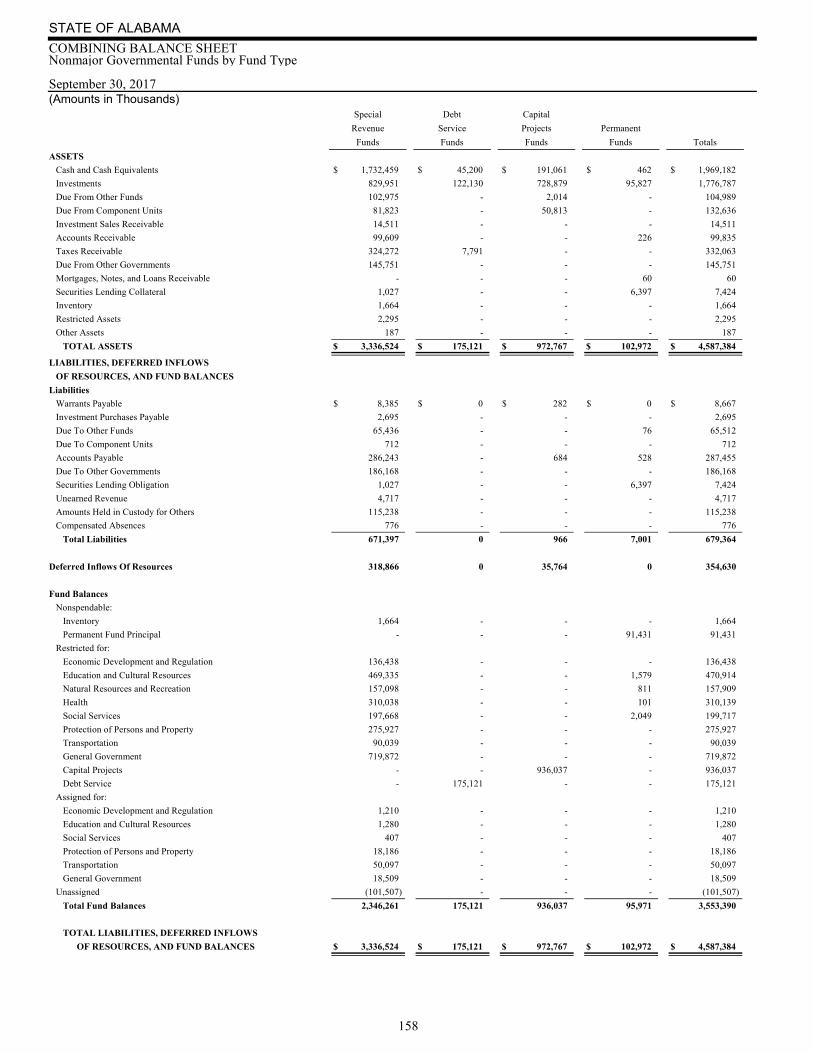
September 30, 2017(Amounts in Thousands)
STATE OF ALABAMA
COMBINING BALANCE SHEETNonmajor Governmental Funds by Fund Type
Special Debt Capital
Revenue Service Projects Permanent
Funds Funds Funds Funds Totals
ASSETS
Cash and Cash Equivalents $ 1,732,459 $ 45,200 $ 191,061 $ 462 $ 1,969,182
Investments 829,951 122,130 728,879 95,827 1,776,787
Due From Other Funds 102,975 - 2,014 - 104,989
Due From Component Units 81,823 - 50,813 - 132,636
Investment Sales Receivable 14,511 - - - 14,511
Accounts Receivable 99,609 - - 226 99,835
Taxes Receivable 324,272 7,791 - - 332,063
Due From Other Governments 145,751 - - - 145,751
Mortgages, Notes, and Loans Receivable - - - 60 60
Securities Lending Collateral 1,027 - - 6,397 7,424
Inventory 1,664 - - - 1,664
Restricted Assets 2,295 - - - 2,295
Other Assets 187 - - - 187
TOTAL ASSETS $ 3,336,524 $ 175,121 $ 972,767 $ 102,972 $ 4,587,384
LIABILITIES, DEFERRED INFLOWS
OF RESOURCES, AND FUND BALANCES
Liabilities
Warrants Payable $ 8,385 $ 0 $ 282 $ 0 $ 8,667
Investment Purchases Payable 2,695 - - - 2,695
Due To Other Funds 65,436 - - 76 65,512
Due To Component Units 712 - - - 712
Accounts Payable 286,243 - 684 528 287,455
Due To Other Governments 186,168 - - - 186,168
Securities Lending Obligation 1,027 - - 6,397 7,424
Unearned Revenue 4,717 - - - 4,717
Amounts Held in Custody for Others 115,238 - - - 115,238
Compensated Absences 776 - - - 776
Total Liabilities 671,397 0 966 7,001 679,364
Deferred Inflows Of Resources 318,866 0 35,764 0 354,630
Fund Balances
Nonspendable:
Inventory 1,664 - - - 1,664
Permanent Fund Principal - - - 91,431 91,431
Restricted for:
Economic Development and Regulation 136,438 - - - 136,438
Education and Cultural Resources 469,335 - - 1,579 470,914
Natural Resources and Recreation 157,098 - - 811 157,909
Health 310,038 - - 101 310,139
Social Services 197,668 - - 2,049 199,717
Protection of Persons and Property 275,927 - - - 275,927
Transportation 90,039 - - - 90,039
General Government 719,872 - - - 719,872
Capital Projects - - 936,037 - 936,037
Debt Service - 175,121 - - 175,121
Assigned for:
Economic Development and Regulation 1,210 - - - 1,210
Education and Cultural Resources 1,280 - - - 1,280
Social Services 407 - - - 407
Protection of Persons and Property 18,186 - - - 18,186
Transportation 50,097 - - - 50,097
General Government 18,509 - - - 18,509
Unassigned (101,507) - - - (101,507)
Total Fund Balances 2,346,261 175,121 936,037 95,971 3,553,390
TOTAL LIABILITIES, DEFERRED INFLOWS
OF RESOURCES, AND FUND BALANCES $ 3,336,524 $ 175,121 $ 972,767 $ 102,972 $ 4,587,384
158
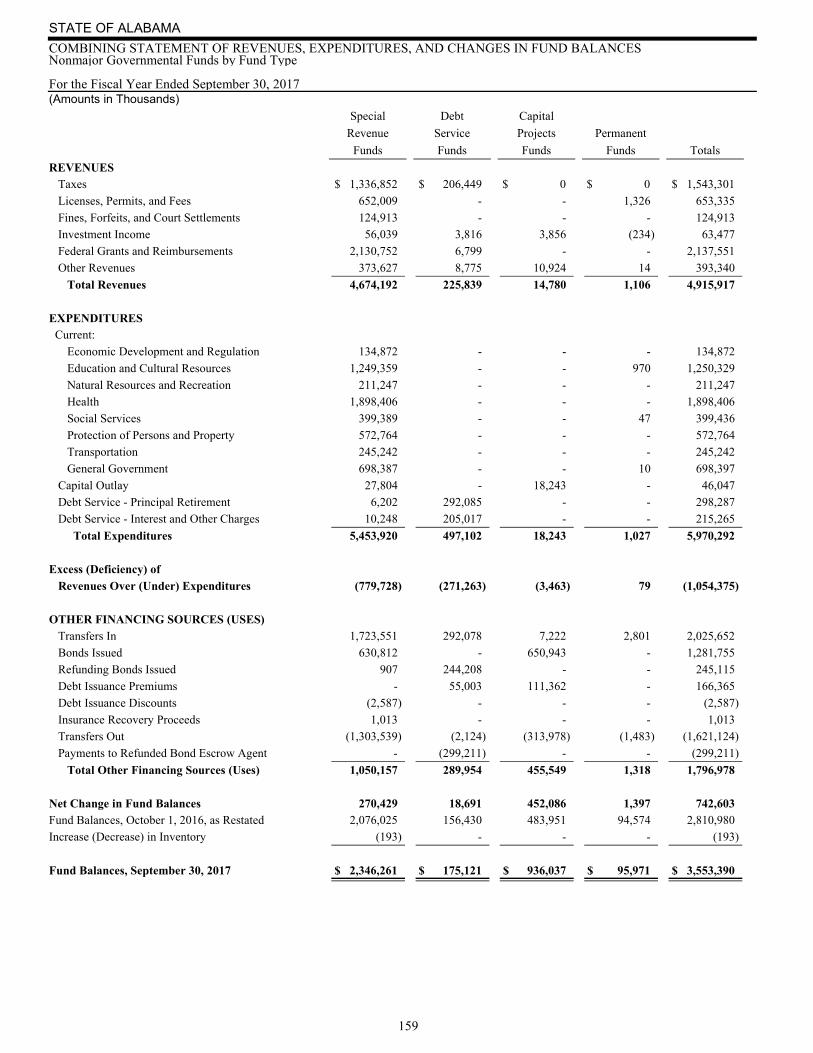
For the Fiscal Year Ended September 30, 2017(Amounts in Thousands)
STATE OF ALABAMA
COMBINING STATEMENT OF REVENUES, EXPENDITURES, AND CHANGES IN FUND BALANCESNonmajor Governmental Funds by Fund Type
Special Debt Capital
Revenue Service Projects Permanent
Funds Funds Funds Funds Totals
REVENUES Taxes $ 1,336,852 $ 206,449 $ 0 $ 0 $ 1,543,301
Licenses, Permits, and Fees 652,009 - - 1,326 653,335
Fines, Forfeits, and Court Settlements 124,913 - - - 124,913
Investment Income 56,039 3,816 3,856 (234) 63,477
Federal Grants and Reimbursements 2,130,752 6,799 - - 2,137,551
Other Revenues 373,627 8,775 10,924 14 393,340
Total Revenues 4,674,192 225,839 14,780 1,106 4,915,917
EXPENDITURES Current:
Economic Development and Regulation 134,872 - - - 134,872
Education and Cultural Resources 1,249,359 - - 970 1,250,329
Natural Resources and Recreation 211,247 - - - 211,247
Health 1,898,406 - - - 1,898,406
Social Services 399,389 - - 47 399,436
Protection of Persons and Property 572,764 - - - 572,764
Transportation 245,242 - - - 245,242
General Government 698,387 - - 10 698,397
Capital Outlay 27,804 - 18,243 - 46,047
Debt Service - Principal Retirement 6,202 292,085 - - 298,287
Debt Service - Interest and Other Charges 10,248 205,017 - - 215,265
Total Expenditures 5,453,920 497,102 18,243 1,027 5,970,292
Excess (Deficiency) of
Revenues Over (Under) Expenditures (779,728) (271,263) (3,463) 79 (1,054,375)
OTHER FINANCING SOURCES (USES) Transfers In 1,723,551 292,078 7,222 2,801 2,025,652
Bonds Issued 630,812 - 650,943 - 1,281,755
Refunding Bonds Issued 907 244,208 - - 245,115
Debt Issuance Premiums - 55,003 111,362 - 166,365
Debt Issuance Discounts (2,587) - - - (2,587)
Insurance Recovery Proceeds 1,013 - - - 1,013
Transfers Out (1,303,539) (2,124) (313,978) (1,483) (1,621,124)
Payments to Refunded Bond Escrow Agent - (299,211) - - (299,211)
Total Other Financing Sources (Uses) 1,050,157 289,954 455,549 1,318 1,796,978
Net Change in Fund Balances 270,429 18,691 452,086 1,397 742,603Fund Balances, October 1, 2016, as Restated 2,076,025 156,430 483,951 94,574 2,810,980
Increase (Decrease) in Inventory (193) - - - (193)
Fund Balances, September 30, 2017 $ 2,346,261 $ 175,121 $ 936,037 $ 95,971 $ 3,553,390
159

160
Nonmajor Special Revenue FundsNonmajor Special Revenue Funds account for specific revenue sources that are legally restricted or committed to expenditure for specific purposes other than debt service or capital projects.
Public Health
Accounts for resources used for the primary operations of the Department of Public Health, which promotes the general physical health, enforces laws relating to public health and operates programs providing preventive and treatment services to the public.
Education Department
Accounts primarily for Federal programs administered by the State Department of Education.
Economic and Community Affairs
The Department of Economic and Community Affairs oversees federal and State programs related to energy management, skills enhancement and employment opportunities, traffic control and accident prevention, and state and regional planning.
Revenues Allocated to Other Governments
Accounts for revenues from taxes and other revenue sources which are shared with local governments and component units.
Other Medicaid
Accounts for activity associated with the Medicaid program that is not reported in the Major Governmental Funds under either the General Fund or the Medicaid Fund.
Mental Health
Accounts for resources used by the Department of Mental Health to care for citizens who suffer from mental illness.
Public School Fund
Accounts for revenues and expenditures which are allocated to local boards of education for support of educational programs.
Alabama Public School and College Authority
Accounts for resources used by the Authority, primarily to make grants to local public school systems for capital expenditures.
Labor
Administers the employment security, workers compensation, and industrial safety and accident prevention programs.
Conservation
Is responsible for the management of the State's game and wildlife resources as well as operation of the State parks system.
Twenty-first Century Authority
Accounts for resources used by the Authority for the purpose of making incentive grants to major industries locating or expanding within the State.
Other Special Revenue Funds
Are aggregated for reporting purposes and account for various other resources which must be used for specific purposes.
161
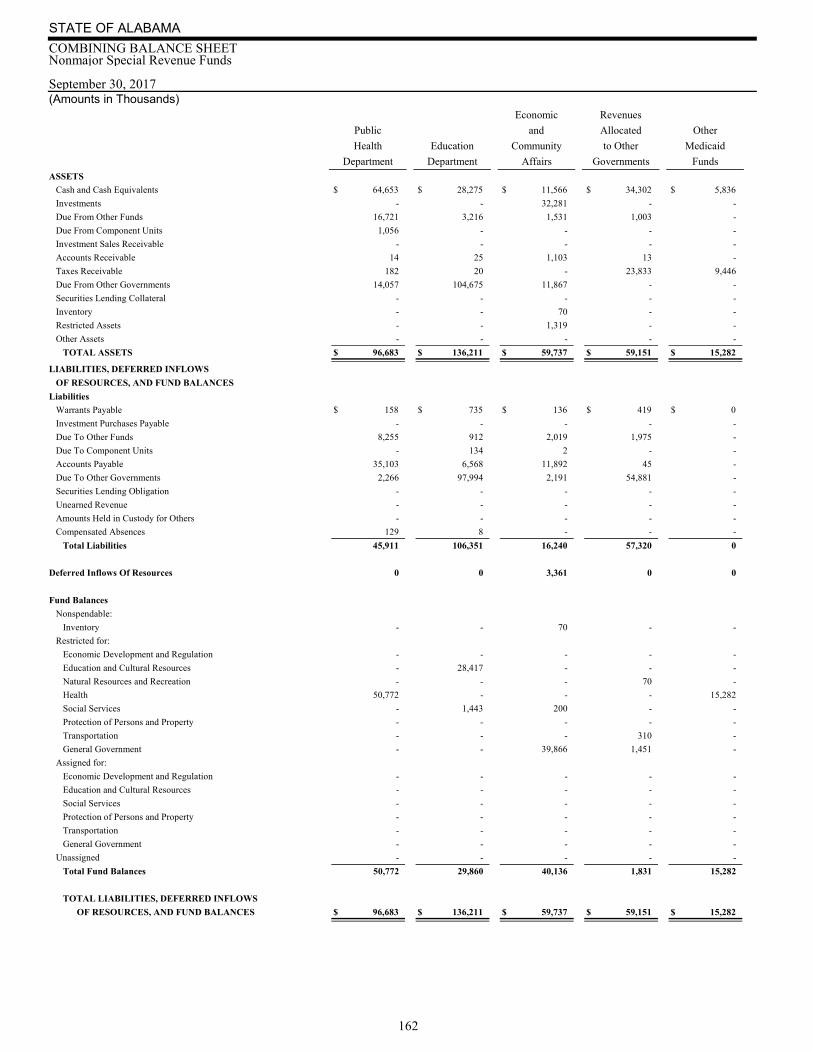
September 30, 2017 (Amounts in Thousands)
STATE OF ALABAMA
COMBINING BALANCE SHEETNonmajor Special Revenue Funds
Economic Revenues
Public and Allocated Other
Health Education Community to Other Medicaid
Department Department Affairs Governments FundsASSETS
Cash and Cash Equivalents $ 64,653 $ 28,275 $ 11,566 $ 34,302 $ 5,836
Investments - - 32,281 - -
Due From Other Funds 16,721 3,216 1,531 1,003 -
Due From Component Units 1,056 - - - -
Investment Sales Receivable - - - - -
Accounts Receivable 14 25 1,103 13 -
Taxes Receivable 182 20 - 23,833 9,446
Due From Other Governments 14,057 104,675 11,867 - -
Securities Lending Collateral - - - - -
Inventory - - 70 - -
Restricted Assets - - 1,319 - -
Other Assets - - - - -
TOTAL ASSETS $ 96,683 $ 136,211 $ 59,737 $ 59,151 $ 15,282
LIABILITIES, DEFERRED INFLOWS
OF RESOURCES, AND FUND BALANCES
Liabilities
Warrants Payable $ 158 $ 735 $ 136 $ 419 $ 0
Investment Purchases Payable - - - - -
Due To Other Funds 8,255 912 2,019 1,975 -
Due To Component Units - 134 2 - -
Accounts Payable 35,103 6,568 11,892 45 -
Due To Other Governments 2,266 97,994 2,191 54,881 -
Securities Lending Obligation - - - - -
Unearned Revenue - - - - -
Amounts Held in Custody for Others - - - - -
Compensated Absences 129 8 - - -
Total Liabilities 45,911 106,351 16,240 57,320 0
Deferred Inflows Of Resources 0 0 3,361 0 0
Fund Balances
Nonspendable:
Inventory - - 70 - -
Restricted for:
Economic Development and Regulation - - - - -
Education and Cultural Resources - 28,417 - - -
Natural Resources and Recreation - - - 70 -
Health 50,772 - - - 15,282
Social Services - 1,443 200 - -
Protection of Persons and Property - - - - -
Transportation - - - 310 -
General Government - - 39,866 1,451 -
Assigned for:
Economic Development and Regulation - - - - -
Education and Cultural Resources - - - - -
Social Services - - - - -
Protection of Persons and Property - - - - -
Transportation - - - - -
General Government - - - - -
Unassigned - - - - -
Total Fund Balances 50,772 29,860 40,136 1,831 15,282
TOTAL LIABILITIES, DEFERRED INFLOWS
OF RESOURCES, AND FUND BALANCES $ 96,683 $ 136,211 $ 59,737 $ 59,151 $ 15,282
162
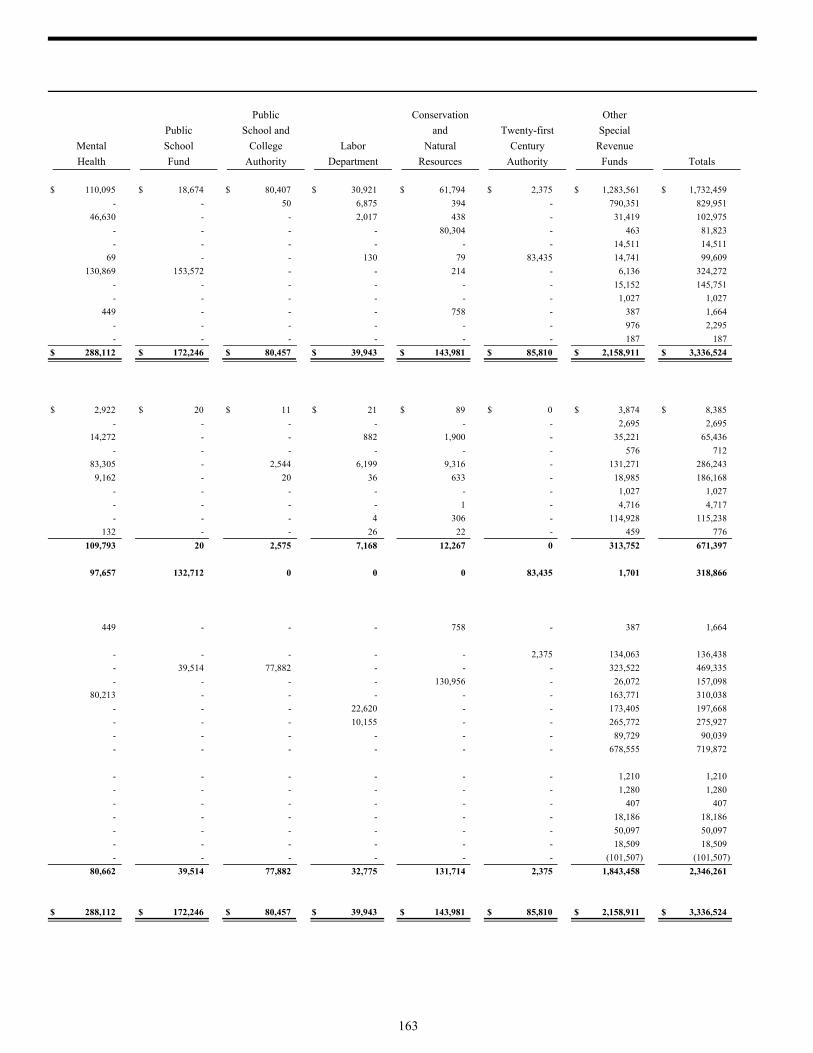
Public Conservation Other
Public School and and Twenty-first Special
Mental School College Labor Natural Century Revenue
Health Fund Authority Department Resources Authority Funds Totals
$ 110,095 $ 18,674 $ 80,407 $ 30,921 $ 61,794 $ 2,375 $ 1,283,561 $ 1,732,459
- - 50 6,875 394 - 790,351 829,951
46,630 - - 2,017 438 - 31,419 102,975
- - - - 80,304 - 463 81,823
- - - - - - 14,511 14,511
69 - - 130 79 83,435 14,741 99,609
130,869 153,572 - - 214 - 6,136 324,272
- - - - - - 15,152 145,751
- - - - - - 1,027 1,027
449 - - - 758 - 387 1,664
- - - - - - 976 2,295
- - - - - - 187 187
$ 288,112 $ 172,246 $ 80,457 $ 39,943 $ 143,981 $ 85,810 $ 2,158,911 $ 3,336,524
$ 2,922 $ 20 $ 11 $ 21 $ 89 $ 0 $ 3,874 $ 8,385
- - - - - - 2,695 2,695
14,272 - - 882 1,900 - 35,221 65,436
- - - - - - 576 712
83,305 - 2,544 6,199 9,316 - 131,271 286,243
9,162 - 20 36 633 - 18,985 186,168
- - - - - - 1,027 1,027
- - - - 1 - 4,716 4,717
- - - 4 306 - 114,928 115,238
132 - - 26 22 - 459 776
109,793 20 2,575 7,168 12,267 0 313,752 671,397
97,657 132,712 0 0 0 83,435 1,701 318,866
449 - - - 758 - 387 1,664
- - - - - 2,375 134,063 136,438
- 39,514 77,882 - - - 323,522 469,335
- - - - 130,956 - 26,072 157,098
80,213 - - - - - 163,771 310,038
- - - 22,620 - - 173,405 197,668
- - - 10,155 - - 265,772 275,927
- - - - - - 89,729 90,039
- - - - - - 678,555 719,872
- - - - - - 1,210 1,210
- - - - - - 1,280 1,280
- - - - - - 407 407
- - - - - - 18,186 18,186
- - - - - - 50,097 50,097
- - - - - - 18,509 18,509
- - - - - - (101,507) (101,507)
80,662 39,514 77,882 32,775 131,714 2,375 1,843,458 2,346,261
$ 288,112 $ 172,246 $ 80,457 $ 39,943 $ 143,981 $ 85,810 $ 2,158,911 $ 3,336,524
163
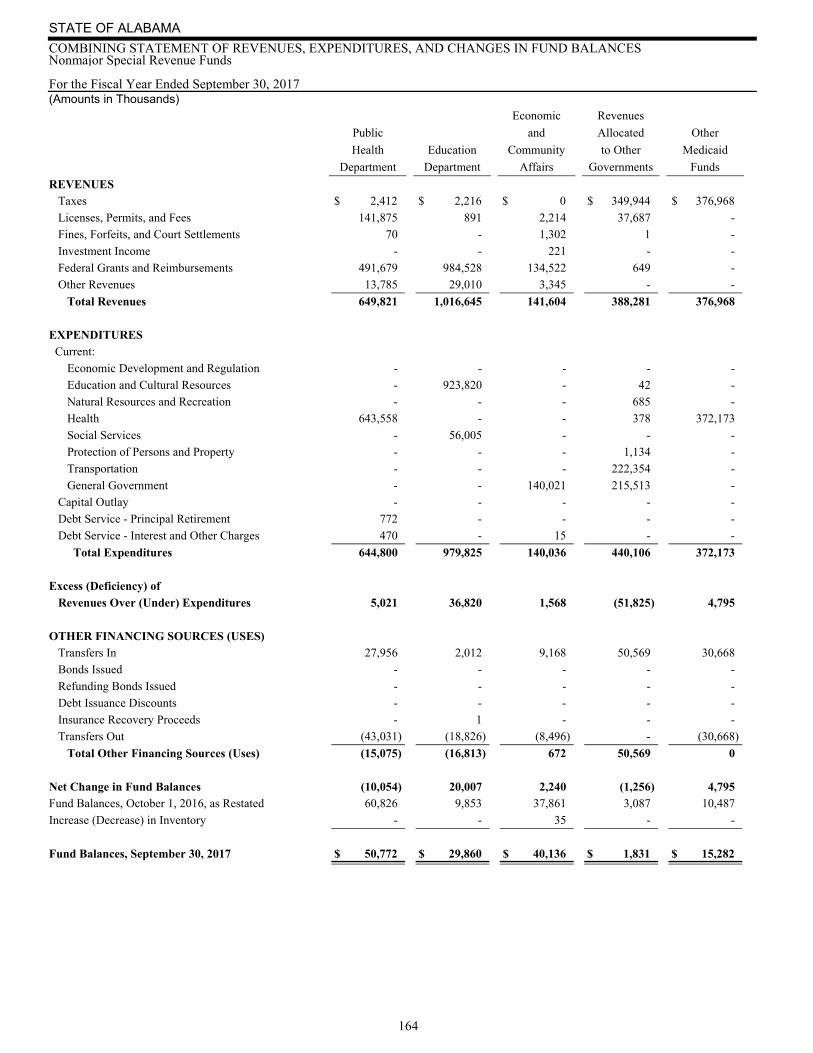
For the Fiscal Year Ended September 30, 2017 (Amounts in Thousands)
STATE OF ALABAMA
COMBINING STATEMENT OF REVENUES, EXPENDITURES, AND CHANGES IN FUND BALANCESNonmajor Special Revenue Funds
Economic Revenues
Public and Allocated Other
Health Education Community to Other Medicaid
Department Department Affairs Governments Funds
REVENUES Taxes $ 2,412 $ 2,216 $ 0 $ 349,944 $ 376,968
Licenses, Permits, and Fees 141,875 891 2,214 37,687 -
Fines, Forfeits, and Court Settlements 70 - 1,302 1 -
Investment Income - - 221 - -
Federal Grants and Reimbursements 491,679 984,528 134,522 649 -
Other Revenues 13,785 29,010 3,345 - -
Total Revenues 649,821 1,016,645 141,604 388,281 376,968
EXPENDITURES Current:
Economic Development and Regulation - - - - -
Education and Cultural Resources - 923,820 - 42 -
Natural Resources and Recreation - - - 685 -
Health 643,558 - - 378 372,173
Social Services - 56,005 - - -
Protection of Persons and Property - - - 1,134 -
Transportation - - - 222,354 -
General Government - - 140,021 215,513 -
Capital Outlay - - - - -
Debt Service - Principal Retirement 772 - - - -
Debt Service - Interest and Other Charges 470 - 15 - -
Total Expenditures 644,800 979,825 140,036 440,106 372,173
Excess (Deficiency) of
Revenues Over (Under) Expenditures 5,021 36,820 1,568 (51,825) 4,795
OTHER FINANCING SOURCES (USES) Transfers In 27,956 2,012 9,168 50,569 30,668
Bonds Issued - - - - -
Refunding Bonds Issued - - - - -
Debt Issuance Discounts - - - - -
Insurance Recovery Proceeds - 1 - - -
Transfers Out (43,031) (18,826) (8,496) - (30,668)
Total Other Financing Sources (Uses) (15,075) (16,813) 672 50,569 0
Net Change in Fund Balances (10,054) 20,007 2,240 (1,256) 4,795Fund Balances, October 1, 2016, as Restated 60,826 9,853 37,861 3,087 10,487
Increase (Decrease) in Inventory - - 35 - -
Fund Balances, September 30, 2017 $ 50,772 $ 29,860 $ 40,136 $ 1,831 $ 15,282
164
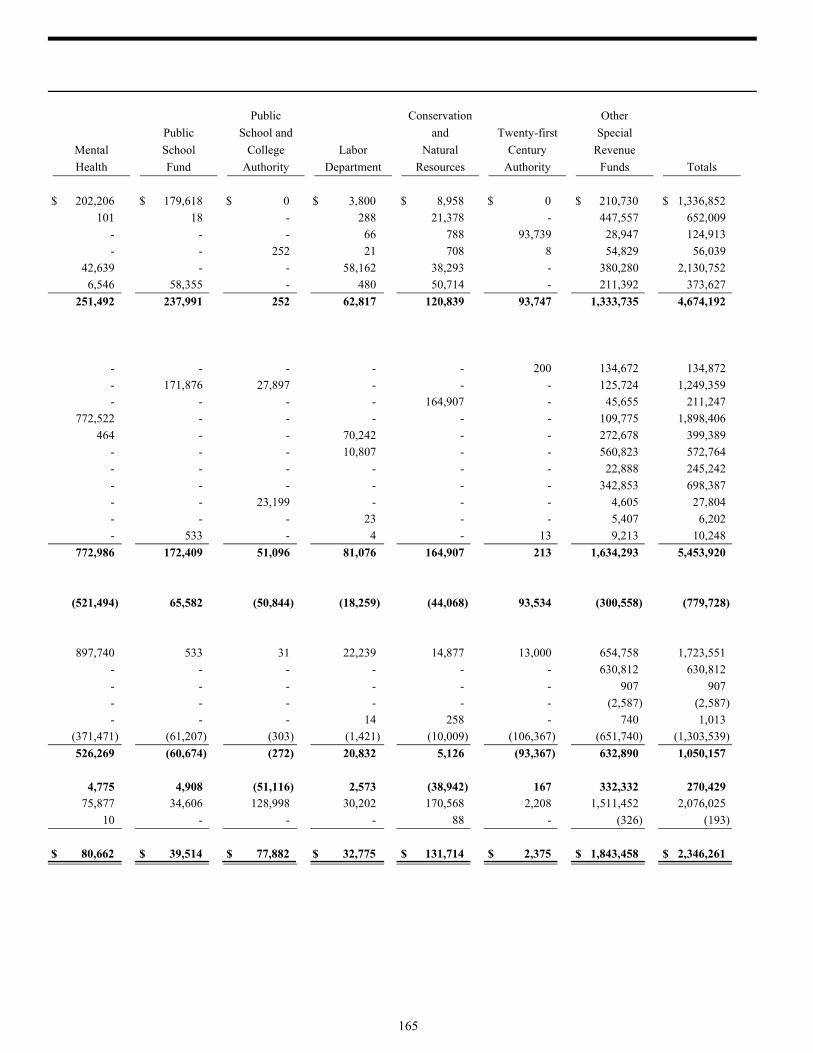
Public Conservation Other
Public School and and Twenty-first Special
Mental School College Labor Natural Century Revenue
Health Fund Authority Department Resources Authority Funds Totals
$ 202,206 $ 179,618 $ 0 $ 3,800 $ 8,958 $ 0 $ 210,730 $ 1,336,852
101 18 - 288 21,378 - 447,557 652,009
- - - 66 788 93,739 28,947 124,913
- - 252 21 708 8 54,829 56,039
42,639 - - 58,162 38,293 - 380,280 2,130,752
6,546 58,355 - 480 50,714 - 211,392 373,627
251,492 237,991 252 62,817 120,839 93,747 1,333,735 4,674,192
- - - - - 200 134,672 134,872
- 171,876 27,897 - - - 125,724 1,249,359
- - - - 164,907 - 45,655 211,247
772,522 - - - - - 109,775 1,898,406
464 - - 70,242 - - 272,678 399,389
- - - 10,807 - - 560,823 572,764
- - - - - - 22,888 245,242
- - - - - - 342,853 698,387
- - 23,199 - - - 4,605 27,804
- - - 23 - - 5,407 6,202
- 533 - 4 - 13 9,213 10,248
772,986 172,409 51,096 81,076 164,907 213 1,634,293 5,453,920
(521,494) 65,582 (50,844) (18,259) (44,068) 93,534 (300,558) (779,728)
897,740 533 31 22,239 14,877 13,000 654,758 1,723,551
- - - - - - 630,812 630,812
- - - - - - 907 907
- - - - - - (2,587) (2,587)
- - - 14 258 - 740 1,013
(371,471) (61,207) (303) (1,421) (10,009) (106,367) (651,740) (1,303,539)
526,269 (60,674) (272) 20,832 5,126 (93,367) 632,890 1,050,157
4,775 4,908 (51,116) 2,573 (38,942) 167 332,332 270,429 75,877 34,606 128,998 30,202 170,568 2,208 1,511,452 2,076,025
10 - - - 88 - (326) (193)
$ 80,662 $ 39,514 $ 77,882 $ 32,775 $ 131,714 $ 2,375 $ 1,843,458 $ 2,346,261
165
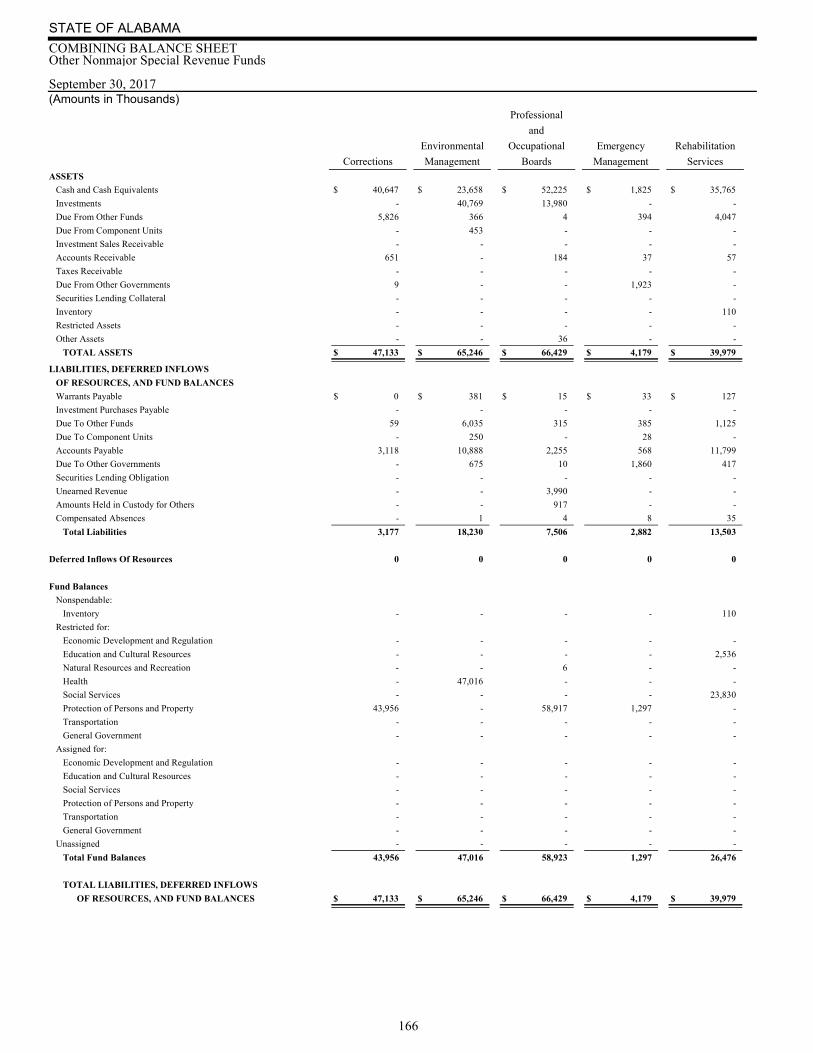
September 30, 2017(Amounts in Thousands)
STATE OF ALABAMA
COMBINING BALANCE SHEETOther Nonmajor Special Revenue Funds
Professional
and
Environmental Occupational Emergency Rehabilitation
Corrections Management Boards Management ServicesASSETS
Cash and Cash Equivalents $ 40,647 $ 23,658 $ 52,225 $ 1,825 $ 35,765
Investments - 40,769 13,980 - -
Due From Other Funds 5,826 366 4 394 4,047
Due From Component Units - 453 - - -
Investment Sales Receivable - - - - -
Accounts Receivable 651 - 184 37 57
Taxes Receivable - - - - -
Due From Other Governments 9 - - 1,923 -
Securities Lending Collateral - - - - -
Inventory - - - - 110
Restricted Assets - - - - -
Other Assets - - 36 - -
TOTAL ASSETS $ 47,133 $ 65,246 $ 66,429 $ 4,179 $ 39,979
LIABILITIES, DEFERRED INFLOWS
OF RESOURCES, AND FUND BALANCES
Warrants Payable $ 0 $ 381 $ 15 $ 33 $ 127
Investment Purchases Payable - - - - -
Due To Other Funds 59 6,035 315 385 1,125
Due To Component Units - 250 - 28 -
Accounts Payable 3,118 10,888 2,255 568 11,799
Due To Other Governments - 675 10 1,860 417
Securities Lending Obligation - - - - -
Unearned Revenue - - 3,990 - -
Amounts Held in Custody for Others - - 917 - -
Compensated Absences - 1 4 8 35
Total Liabilities 3,177 18,230 7,506 2,882 13,503
Deferred Inflows Of Resources 0 0 0 0 0
Fund Balances
Nonspendable:
Inventory - - - - 110
Restricted for:
Economic Development and Regulation - - - - -
Education and Cultural Resources - - - - 2,536
Natural Resources and Recreation - - 6 - -
Health - 47,016 - - -
Social Services - - - - 23,830
Protection of Persons and Property 43,956 - 58,917 1,297 -
Transportation - - - - -
General Government - - - - -
Assigned for:
Economic Development and Regulation - - - - -
Education and Cultural Resources - - - - -
Social Services - - - - -
Protection of Persons and Property - - - - -
Transportation - - - - -
General Government - - - - -
Unassigned - - - - -
Total Fund Balances 43,956 47,016 58,923 1,297 26,476
TOTAL LIABILITIES, DEFERRED INFLOWS
OF RESOURCES, AND FUND BALANCES $ 47,133 $ 65,246 $ 66,429 $ 4,179 $ 39,979
166

Fair Alabama County and Miscellaneous
Children Forever Trial Capital Municipal Revenue Special
First Wild Tax Improvement Capital Administrative Revenue
Trust Trust Fund Trust Improvement Fund Funds Totals
$ 8,911 $ 1,499 $ 2,684 $ 937 $ 12,470 $ 52,316 $ 1,050,624 $ 1,283,561
- 17,491 - 1,626 480,645 - 235,840 790,351
2 147 - - - 258 20,375 31,419
- - - - - - 10 463
- - - - 14,511 - - 14,511
22 - 4 5 1,248 2 12,531 14,741
- - 18 - - 5,671 447 6,136
- - - - - - 13,220 15,152
- - - - - - 1,027 1,027
- - - - - 103 174 387
- - - - - - 976 976
- - - - - - 151 187
$ 8,935 $ 19,137 $ 2,706 $ 2,568 $ 508,874 $ 58,350 $ 1,335,375 $ 2,158,911
$ 16 $ 0 $ 379 $ 0 $ 0 $ 9 $ 2,914 $ 3,874
- - - - 2,695 - - 2,695
799 - 52 - 12,470 2,391 11,590 35,221
73 - - - - - 225 576
861 19 710 - - 9,269 91,784 131,271
266 - 7 - - 42 15,708 18,985
- - - - - - 1,027 1,027
- - - - - - 726 4,716
- - - - - 141 113,870 114,928
- - - - - 51 360 459
2,015 19 1,148 0 15,165 11,903 238,204 313,752
0 0 0 2 450 0 1,249 1,701
- - - - - 103 174 387
- - - - - - 134,063 134,063
- - - - - - 320,986 323,522
- 19,118 - - - - 6,948 26,072
987 - - - - - 115,768 163,771
3,174 - - - - - 146,401 173,405
1,719 - - - - - 159,883 265,772
- - - - - - 89,729 89,729
1,040 - 1,558 2,566 493,259 46,344 133,788 678,555
- - - - - - 1,210 1,210
- - - - - - 1,280 1,280
- - - - - - 407 407
- - - - - - 18,186 18,186
- - - - - - 50,097 50,097
- - - - - - 18,509 18,509
- - - - - - (101,507) (101,507)
6,920 19,118 1,558 2,566 493,259 46,447 1,095,922 1,843,458
$ 8,935 $ 19,137 $ 2,706 $ 2,568 $ 508,874 $ 58,350 $ 1,335,375 $ 2,158,911
167
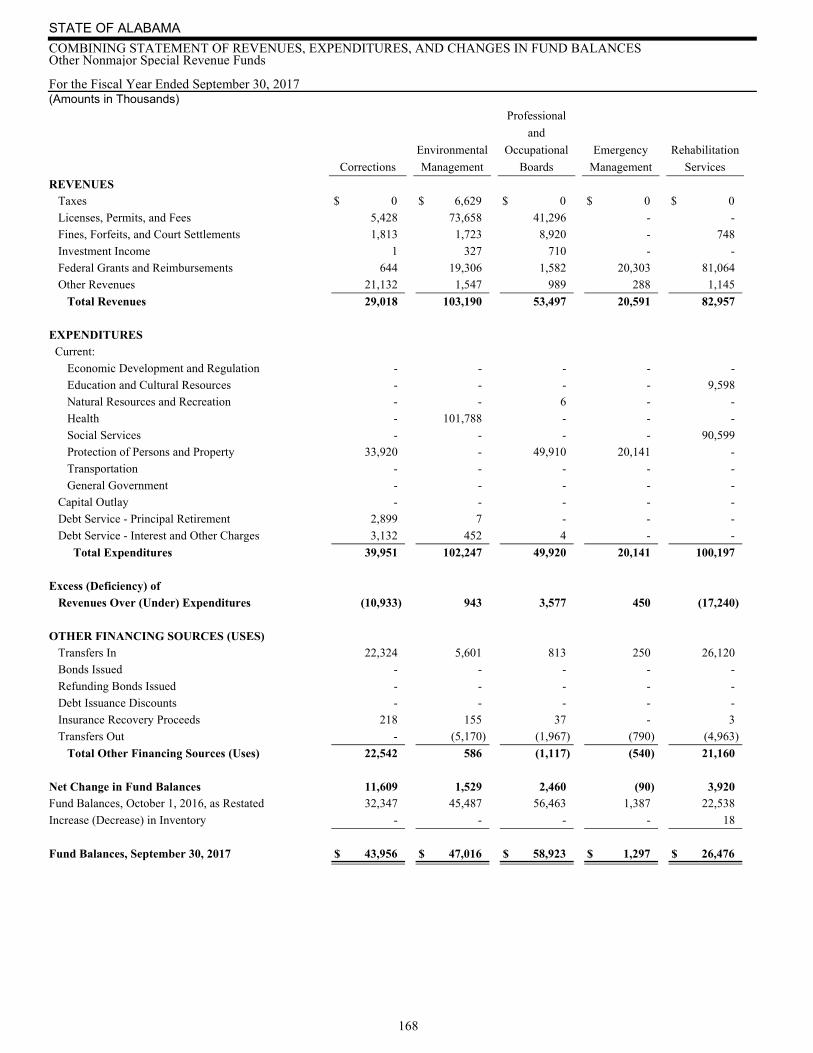
For the Fiscal Year Ended September 30, 2017(Amounts in Thousands)
STATE OF ALABAMA
COMBINING STATEMENT OF REVENUES, EXPENDITURES, AND CHANGES IN FUND BALANCESOther Nonmajor Special Revenue Funds
Professional
and
Environmental Occupational Emergency Rehabilitation
Corrections Management Boards Management Services
REVENUES Taxes $ 0 $ 6,629 $ 0 $ 0 $ 0
Licenses, Permits, and Fees 5,428 73,658 41,296 - -
Fines, Forfeits, and Court Settlements 1,813 1,723 8,920 - 748
Investment Income 1 327 710 - -
Federal Grants and Reimbursements 644 19,306 1,582 20,303 81,064
Other Revenues 21,132 1,547 989 288 1,145
Total Revenues 29,018 103,190 53,497 20,591 82,957
EXPENDITURES Current:
Economic Development and Regulation - - - - -
Education and Cultural Resources - - - - 9,598
Natural Resources and Recreation - - 6 - -
Health - 101,788 - - -
Social Services - - - - 90,599
Protection of Persons and Property 33,920 - 49,910 20,141 -
Transportation - - - - -
General Government - - - - -
Capital Outlay - - - - -
Debt Service - Principal Retirement 2,899 7 - - -
Debt Service - Interest and Other Charges 3,132 452 4 - -
Total Expenditures 39,951 102,247 49,920 20,141 100,197
Excess (Deficiency) of
Revenues Over (Under) Expenditures (10,933) 943 3,577 450 (17,240)
OTHER FINANCING SOURCES (USES) Transfers In 22,324 5,601 813 250 26,120
Bonds Issued - - - - -
Refunding Bonds Issued - - - - -
Debt Issuance Discounts - - - - -
Insurance Recovery Proceeds 218 155 37 - 3
Transfers Out - (5,170) (1,967) (790) (4,963)
Total Other Financing Sources (Uses) 22,542 586 (1,117) (540) 21,160
Net Change in Fund Balances 11,609 1,529 2,460 (90) 3,920Fund Balances, October 1, 2016, as Restated 32,347 45,487 56,463 1,387 22,538
Increase (Decrease) in Inventory - - - - 18
Fund Balances, September 30, 2017 $ 43,956 $ 47,016 $ 58,923 $ 1,297 $ 26,476
168
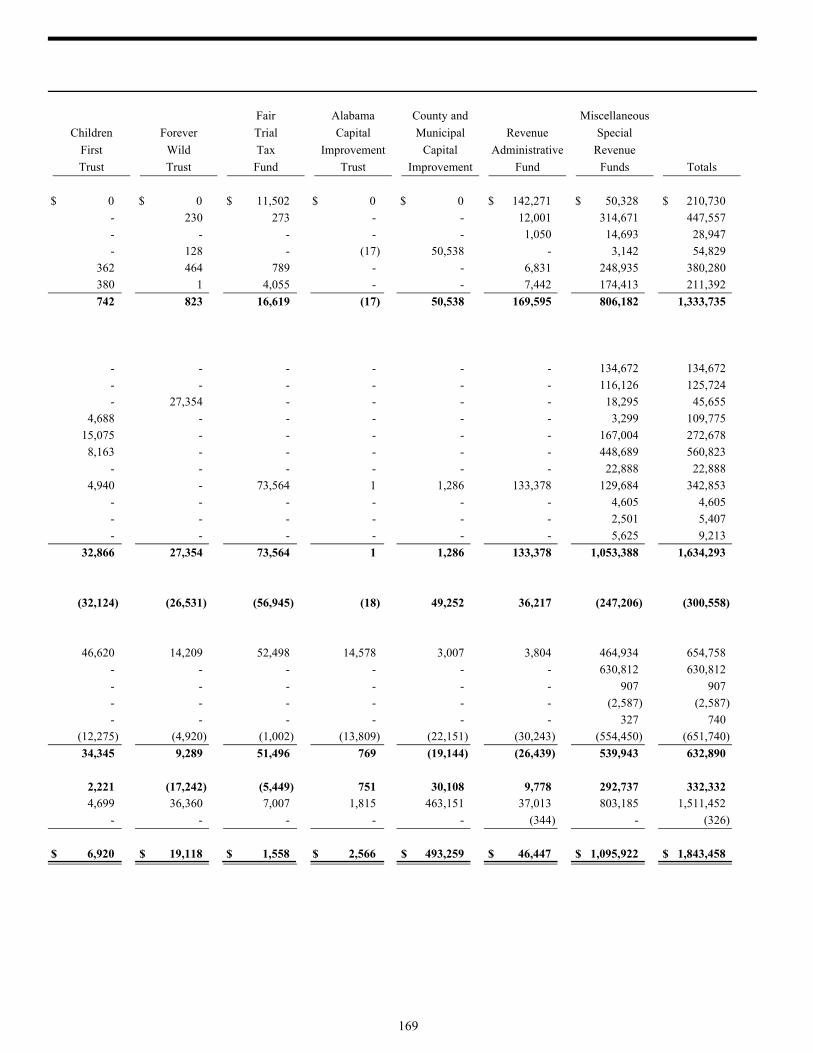
Fair Alabama County and Miscellaneous
Children Forever Trial Capital Municipal Revenue Special
First Wild Tax Improvement Capital Administrative Revenue
Trust Trust Fund Trust Improvement Fund Funds Totals
$ 0 $ 0 $ 11,502 $ 0 $ 0 $ 142,271 $ 50,328 $ 210,730
- 230 273 - - 12,001 314,671 447,557
- - - - - 1,050 14,693 28,947
- 128 - (17) 50,538 - 3,142 54,829
362 464 789 - - 6,831 248,935 380,280
380 1 4,055 - - 7,442 174,413 211,392
742 823 16,619 (17) 50,538 169,595 806,182 1,333,735
- - - - - - 134,672 134,672
- - - - - - 116,126 125,724
- 27,354 - - - - 18,295 45,655
4,688 - - - - - 3,299 109,775
15,075 - - - - - 167,004 272,678
8,163 - - - - - 448,689 560,823
- - - - - - 22,888 22,888
4,940 - 73,564 1 1,286 133,378 129,684 342,853
- - - - - - 4,605 4,605
- - - - - - 2,501 5,407
- - - - - - 5,625 9,213
32,866 27,354 73,564 1 1,286 133,378 1,053,388 1,634,293
(32,124) (26,531) (56,945) (18) 49,252 36,217 (247,206) (300,558)
46,620 14,209 52,498 14,578 3,007 3,804 464,934 654,758
- - - - - - 630,812 630,812
- - - - - - 907 907
- - - - - - (2,587) (2,587)
- - - - - - 327 740
(12,275) (4,920) (1,002) (13,809) (22,151) (30,243) (554,450) (651,740)
34,345 9,289 51,496 769 (19,144) (26,439) 539,943 632,890
2,221 (17,242) (5,449) 751 30,108 9,778 292,737 332,332 4,699 36,360 7,007 1,815 463,151 37,013 803,185 1,511,452
- - - - - (344) - (326)
$ 6,920 $ 19,118 $ 1,558 $ 2,566 $ 493,259 $ 46,447 $ 1,095,922 $ 1,843,458
169

170
Nonmajor Debt Service FundsNonmajor Debt Service Funds account for financial resources that are restricted, committed or assigned to expenditure for the payment of general governmental debt principal and interest.
Public School and College Authority
Accounts for resources used to pay the interest and principal on debt issued by the Authority for the purpose of financing the construction, renovation, and equipping of State educational facilities.
General Obligation Bond Debt Service
Accounts for resources used to pay the interest and principal on general obligation debt issued by the State.
Twenty-first Century Authority
Accounts for resources used to pay the interest and principal on debt issued by the Authority for the purpose of financing incentive grants to major industries locating or expanding within the State.
Incentives Financing Authority
Accounts for resources used to pay the interest and principal on debt issued by the Authority for the purpose of financing the construction, renovation, and equipping of State worker training facilities.
Industrial Development Authority
Accounts for resources used to pay the interest and principal on debt issued by the Authority for the purpose of making industrial development grants to local governments.
Federal Aid Highway Finance Authority
Accounts for resources used to pay interest and principal on debt issued to finance road and bridge construction.
Public Health Care Authority Debt Service
Accounts for resources used to pay interest and principal on debt issued to finance public health facilities.
Mental Health Finance Authority
Accounts for resources used to pay the interest and principal on debt issued by the Authority for the purpose of financing the construction, renovation, and equipping of State mental health facilities.
Judicial Building Authority
Accounts for resources used to pay the interest and principal on debt issued by the Authority for the purpose of financing the construction of facilities used by the unified judicial system.
Highway Finance Corporation
Accounts for resources used to pay interest and principal on debt issued by the Corporation for the purpose of financing State roads and bridge projects.
Economic Settlement Authority
Accounts for resources used to pay the interest and principal on debt issued by the Authority for the purposes of Alabama Trust Fund repayment, additonal funding of the Medicaid Agency, and transportation projects.
Other Debt Service
Accounts for resources used to pay the interest and principal on all other debt issued by State.
171

September 30, 2017 (Amounts in Thousands)
STATE OF ALABAMA
COMBINING BALANCE SHEETNonmajor Debt Service Funds
Public
School & General Twenty-first Incentives Industrial
College Obligation Century Financing Development
Authority Bonds Authority Authority Authority
ASSETS Cash and Cash Equivalents $ 238 $ 0 $ 17,091 $ 25,223 $ 87
Investments 121,362 - - - -
Taxes Receivable 7,641 - - - -
TOTAL ASSETS $ 129,241 $ 0 $ 17,091 $ 25,223 $ 87
Fund Balances Restricted for:
Debt Service 129,241 - 17,091 25,223 87
Total Fund Balances 129,241 0 17,091 25,223 87
TOTAL LIABILITIES AND FUND BALANCES $ 129,241 $ 0 $ 17,091 $ 25,223 $ 87
172
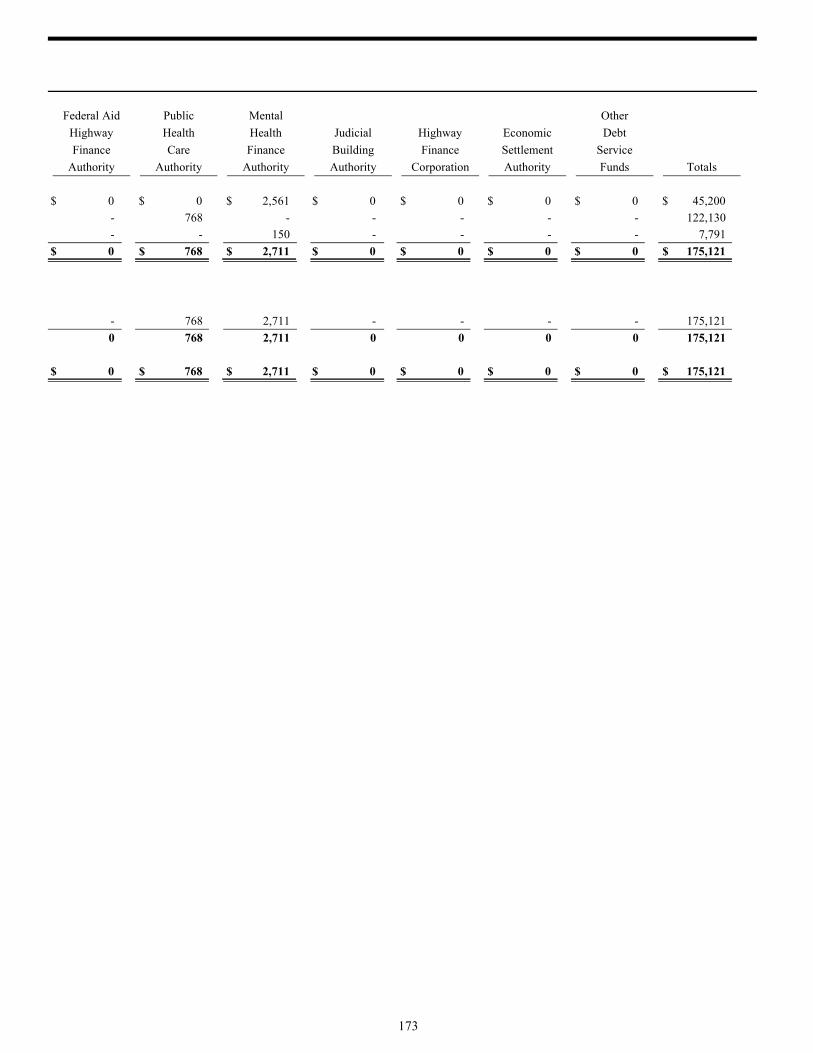
Federal Aid Public Mental Other
Highway Health Health Judicial Highway Economic Debt
Finance Care Finance Building Finance Settlement Service
Authority Authority Authority Authority Corporation Authority Funds Totals
$ 0 $ 0 $ 2,561 $ 0 $ 0 $ 0 $ 0 $ 45,200
- 768 - - - - - 122,130
- - 150 - - - - 7,791
$ 0 $ 768 $ 2,711 $ 0 $ 0 $ 0 $ 0 $ 175,121
- 768 2,711 - - - - 175,121
0 768 2,711 0 0 0 0 175,121
$ 0 $ 768 $ 2,711 $ 0 $ 0 $ 0 $ 0 $ 175,121
173

For the Fiscal Year Ended September 30, 2017 (Amounts in Thousands)
STATE OF ALABAMA
COMBINING STATEMENT OF REVENUES, EXPENDITURES, AND CHANGES IN FUND BALANCESNonmajor Debt Service Funds
Public
School & General Twenty-first Incentives Industrial
College Obligation Century Financing Development
Authority Bonds Authority Authority Authority
REVENUES Taxes $ 202,810 $ 0 $ 0 $ 0 $ 0
Investment Income 3,694 - 64 57 -
Federal Grants and Reimbursements 6,799 - - - -
Other Revenues 8,775 - - - -
Total Revenues 222,078 0 64 57 0
EXPENDITURES Debt Service - Principal Retirement 192,160 41,800 9,585 6,015 -
Debt Service - Interest and Other Charges 89,823 29,192 3,306 11,925 -
Total Expenditures 281,983 70,992 12,891 17,940 0
Excess (Deficiency) of
Revenues Over (Under) Expenditures (59,905) (70,992) (12,827) (17,883) 0
OTHER FINANCING SOURCES (USES) Transfers In 78,271 70,992 12,659 17,938 -
Refunding Bonds Issued - 104,656 - - -
Debt Issuance Premiums - 23,117 - - -
Transfers Out - - (31) - -
Payments to Refunded Bond Escrow Agent - (127,773) - - -
Total Other Financing Sources (Uses) 78,271 70,992 12,628 17,938 0
Net Change in Fund Balances 18,366 0 (199) 55 0Fund Balances, October 1, 2016, as Restated 110,875 0 17,290 25,168 87
Fund Balances, September 30, 2017 $ 129,241 $ 0 $ 17,091 $ 25,223 $ 87
174
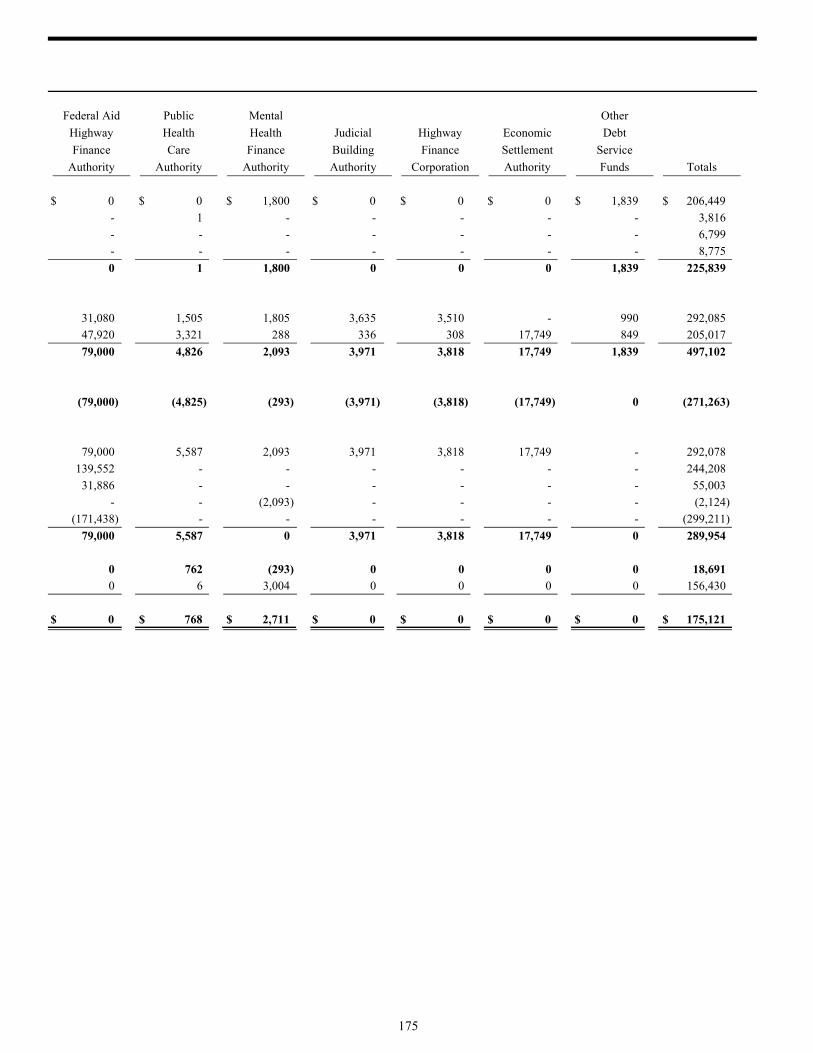
Federal Aid Public Mental Other
Highway Health Health Judicial Highway Economic Debt
Finance Care Finance Building Finance Settlement Service
Authority Authority Authority Authority Corporation Authority Funds Totals
$ 0 $ 0 $ 1,800 $ 0 $ 0 $ 0 $ 1,839 $ 206,449
- 1 - - - - - 3,816
- - - - - - - 6,799
- - - - - - - 8,775
0 1 1,800 0 0 0 1,839 225,839
31,080 1,505 1,805 3,635 3,510 - 990 292,085
47,920 3,321 288 336 308 17,749 849 205,017
79,000 4,826 2,093 3,971 3,818 17,749 1,839 497,102
(79,000) (4,825) (293) (3,971) (3,818) (17,749) 0 (271,263)
79,000 5,587 2,093 3,971 3,818 17,749 - 292,078
139,552 - - - - - - 244,208
31,886 - - - - - - 55,003
- - (2,093) - - - - (2,124)
(171,438) - - - - - - (299,211)
79,000 5,587 0 3,971 3,818 17,749 0 289,954
0 762 (293) 0 0 0 0 18,691 0 6 3,004 0 0 0 0 156,430
$ 0 $ 768 $ 2,711 $ 0 $ 0 $ 0 $ 0 $ 175,121
175

176

Nonmajor Capital Project FundsNonmajor Capital Project Funds account for financial resources restricted, committed or assigned to expenditure for the acquisition, construction, and improvement of major general governmental capital assets.
Public School and College Authority
Accounts for the proceeds of debt issued by the Authority for the purpose of financing the construction, renovation, and equipping of State educational facilities.
General Obligation Bond Projects
Accounts for the proceeds of general obligation debt issued by the State for a wide variety of construction projects involving waterways, parks, roads, prisons, mental hospitals, research labs, and other buildings.
Public Health Care Authority Capital Projects
Accounts for the proceeds of debt issued by the Authority for the purpose of financing the construction of public health facilities.
Mental Health Finance Authority
Accounts for the proceeds of debt issued by the Authority for the purpose of financing the construction, renovation, and equipping of State mental health facilities.
Judicial Building Authority
Accounts for proceeds of debt issued by the authority for the purpose of acquiring, constructing, and equipping judicial facilities.
Federal Aid Highway Finance Authority
Accounts for the proceeds of debt issued by the Authority for the purpose of financing improvements to the State's roads and bridges.
Highway Finance Corporation
Accounts for the proceeds of debt issued by the Corporation for the purpose of funding improvements to the State's roads and bridges.
Other Capital Projects
Accounts for the proceeds of all other debt issued by the State to fund capital projects.
177
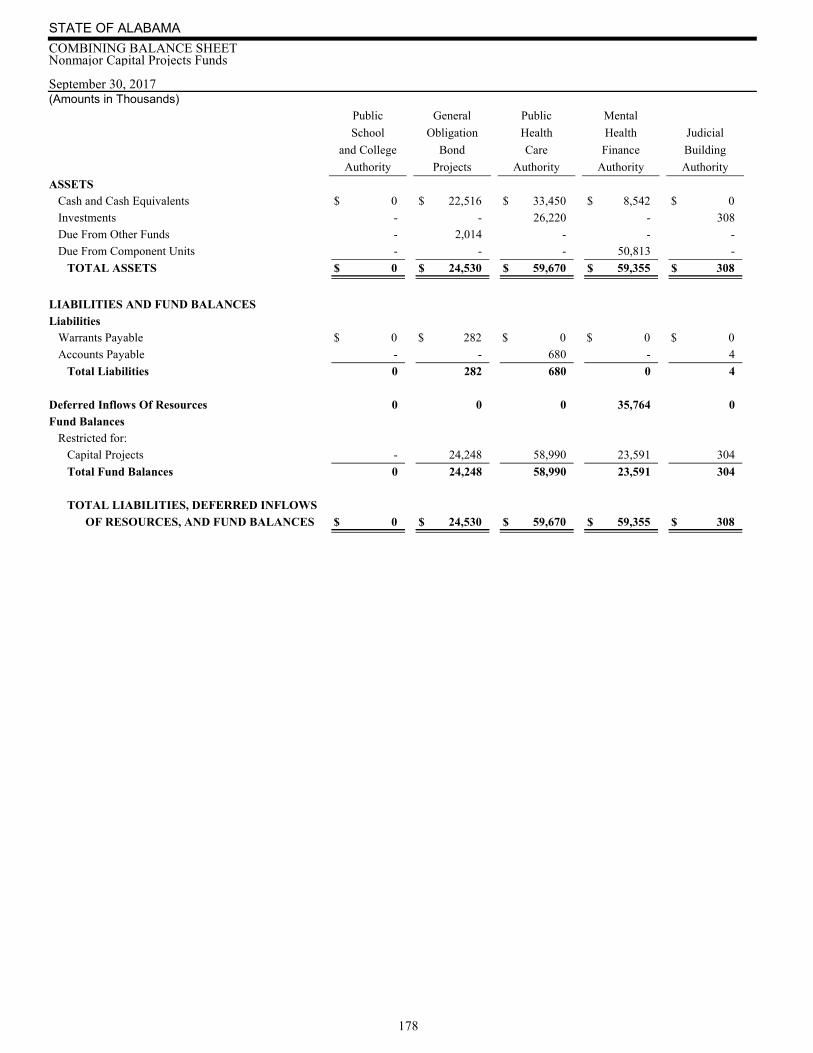
September 30, 2017 (Amounts in Thousands)
STATE OF ALABAMA
COMBINING BALANCE SHEETNonmajor Capital Projects Funds
Public General Public Mental
School Obligation Health Health Judicial
and College Bond Care Finance Building
Authority Projects Authority Authority Authority
ASSETS Cash and Cash Equivalents $ 0 $ 22,516 $ 33,450 $ 8,542 $ 0
Investments - - 26,220 - 308
Due From Other Funds - 2,014 - - -
Due From Component Units - - - 50,813 -
TOTAL ASSETS $ 0 $ 24,530 $ 59,670 $ 59,355 $ 308
LIABILITIES AND FUND BALANCES
Liabilities Warrants Payable $ 0 $ 282 $ 0 $ 0 $ 0
Accounts Payable - - 680 - 4
Total Liabilities 0 282 680 0 4
Deferred Inflows Of Resources 0 0 0 35,764 0
Fund Balances Restricted for:
Capital Projects - 24,248 58,990 23,591 304
Total Fund Balances 0 24,248 58,990 23,591 304
TOTAL LIABILITIES, DEFERRED INFLOWS
OF RESOURCES, AND FUND BALANCES $ 0 $ 24,530 $ 59,670 $ 59,355 $ 308
178
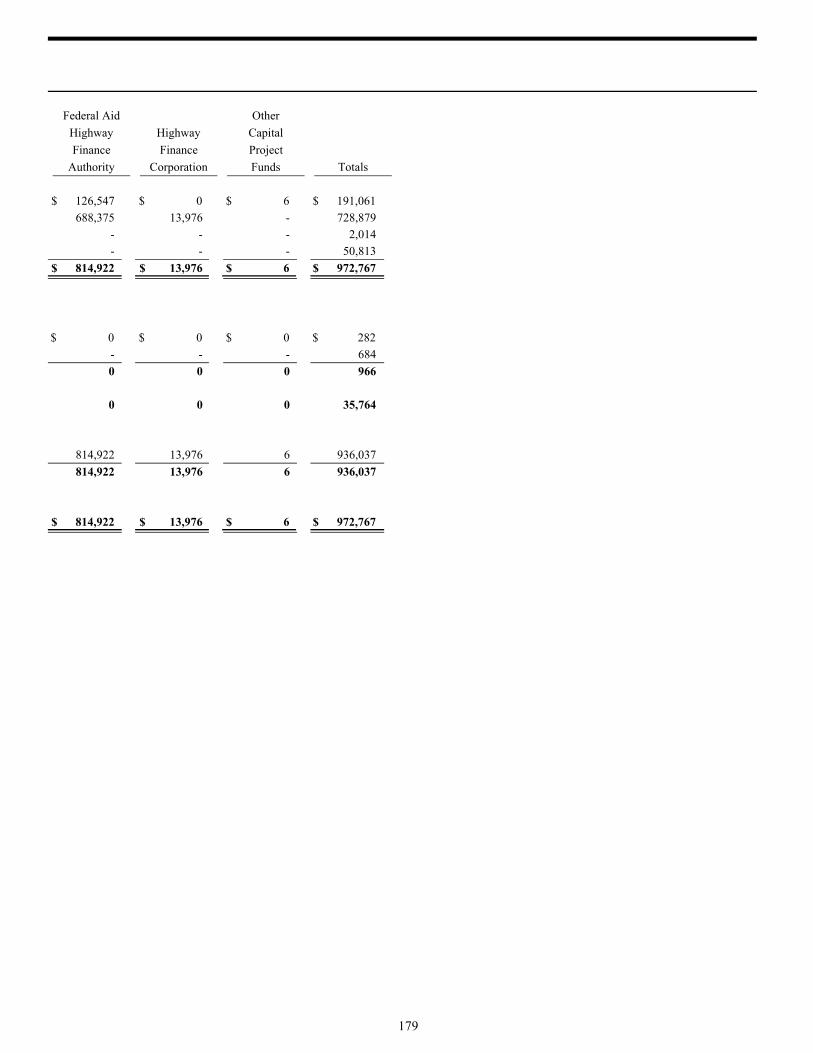
Federal Aid Other
Highway Highway Capital
Finance Finance Project
Authority Corporation Funds Totals
$ 126,547 $ 0 $ 6 $ 191,061
688,375 13,976 - 728,879
- - - 2,014
- - - 50,813
$ 814,922 $ 13,976 $ 6 $ 972,767
$ 0 $ 0 $ 0 $ 282
- - - 684
0 0 0 966
0 0 0 35,764
814,922 13,976 6 936,037
814,922 13,976 6 936,037
$ 814,922 $ 13,976 $ 6 $ 972,767
179
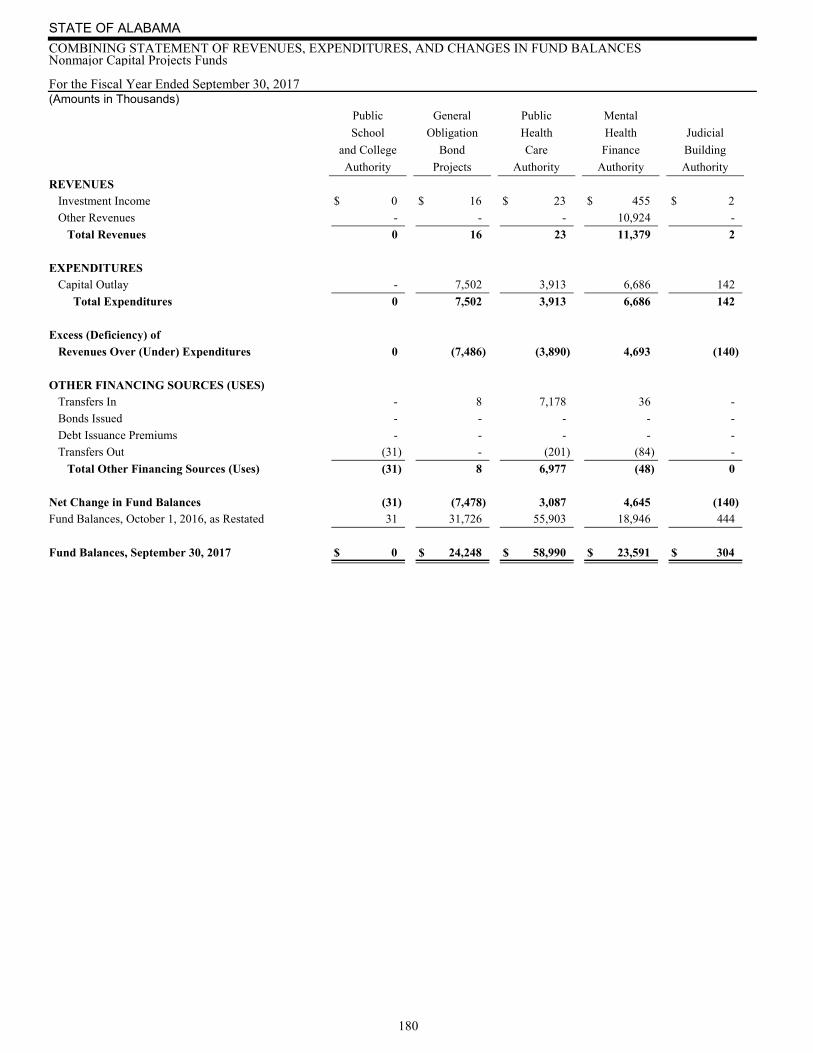
For the Fiscal Year Ended September 30, 2017 (Amounts in Thousands)
STATE OF ALABAMA
COMBINING STATEMENT OF REVENUES, EXPENDITURES, AND CHANGES IN FUND BALANCESNonmajor Capital Projects Funds
Public General Public Mental
School Obligation Health Health Judicial
and College Bond Care Finance Building
Authority Projects Authority Authority Authority
REVENUES Investment Income $ 0 $ 16 $ 23 $ 455 $ 2
Other Revenues - - - 10,924 -
Total Revenues 0 16 23 11,379 2
EXPENDITURES Capital Outlay - 7,502 3,913 6,686 142
Total Expenditures 0 7,502 3,913 6,686 142
Excess (Deficiency) of
Revenues Over (Under) Expenditures 0 (7,486) (3,890) 4,693 (140)
OTHER FINANCING SOURCES (USES) Transfers In - 8 7,178 36 -
Bonds Issued - - - - -
Debt Issuance Premiums - - - - -
Transfers Out (31) - (201) (84) -
Total Other Financing Sources (Uses) (31) 8 6,977 (48) 0
Net Change in Fund Balances (31) (7,478) 3,087 4,645 (140)Fund Balances, October 1, 2016, as Restated 31 31,726 55,903 18,946 444
Fund Balances, September 30, 2017 $ 0 $ 24,248 $ 58,990 $ 23,591 $ 304
180
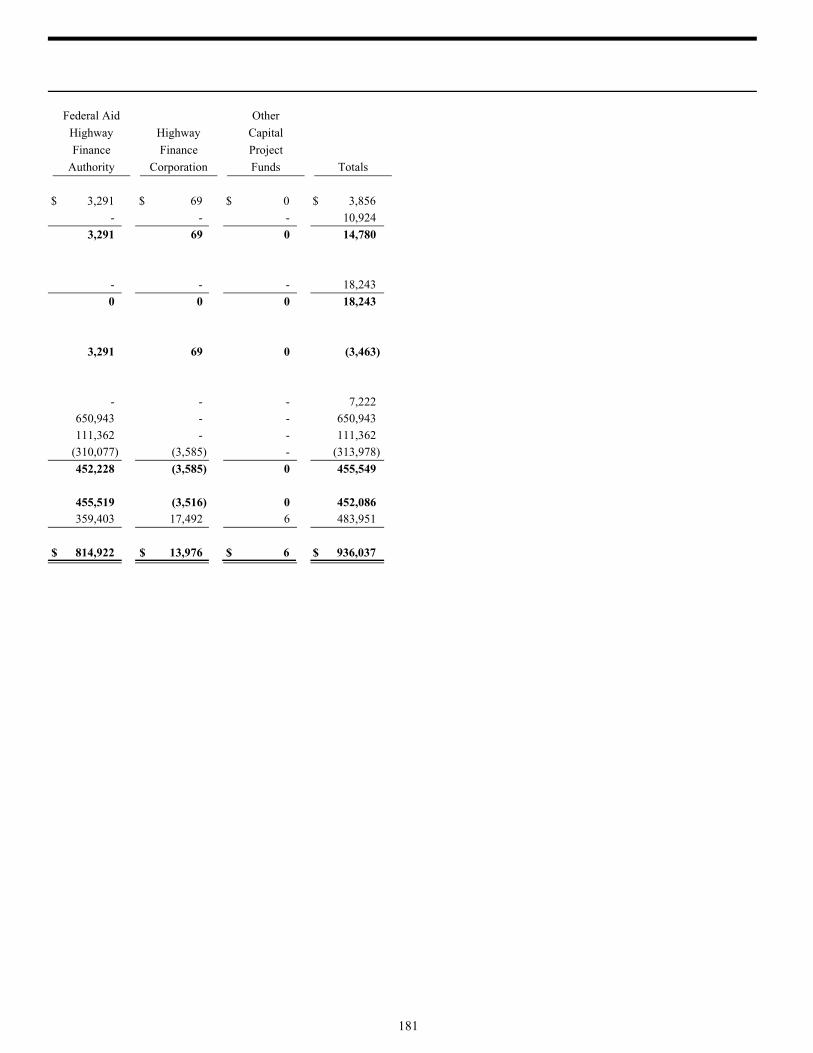
Federal Aid Other
Highway Highway Capital
Finance Finance Project
Authority Corporation Funds Totals
$ 3,291 $ 69 $ 0 $ 3,856
- - - 10,924
3,291 69 0 14,780
- - - 18,243
0 0 0 18,243
3,291 69 0 (3,463)
- - - 7,222
650,943 - - 650,943
111,362 - - 111,362
(310,077) (3,585) - (313,978)
452,228 (3,585) 0 455,549
455,519 (3,516) 0 452,086 359,403 17,492 6 483,951
$ 814,922 $ 13,976 $ 6 $ 936,037
181

182

Nonmajor Permanent FundsNonmajor Permanent Funds report resources that are legally restricted so that only earnings, not principal, may be used for purposes that support the State's governmental programs.
Marine and Game and Fish Endowments
Invests the proceeds of lifetime hunting and fishing licenses and uses the investment income to preserve, protect, propagate, and develop wildlife within the State.
Alabama Research Alliance
Is a trust fund which awards research grants to State universities to promote science and technology.
Senior Services Trust
Invests a portion of the proceeds from the tobacco settlement in order to accumulate money to expand programs benefiting elderly citizens.
Other Permanent Funds
Accounts for several small permanent funds which further educational, health, and social programs.
183
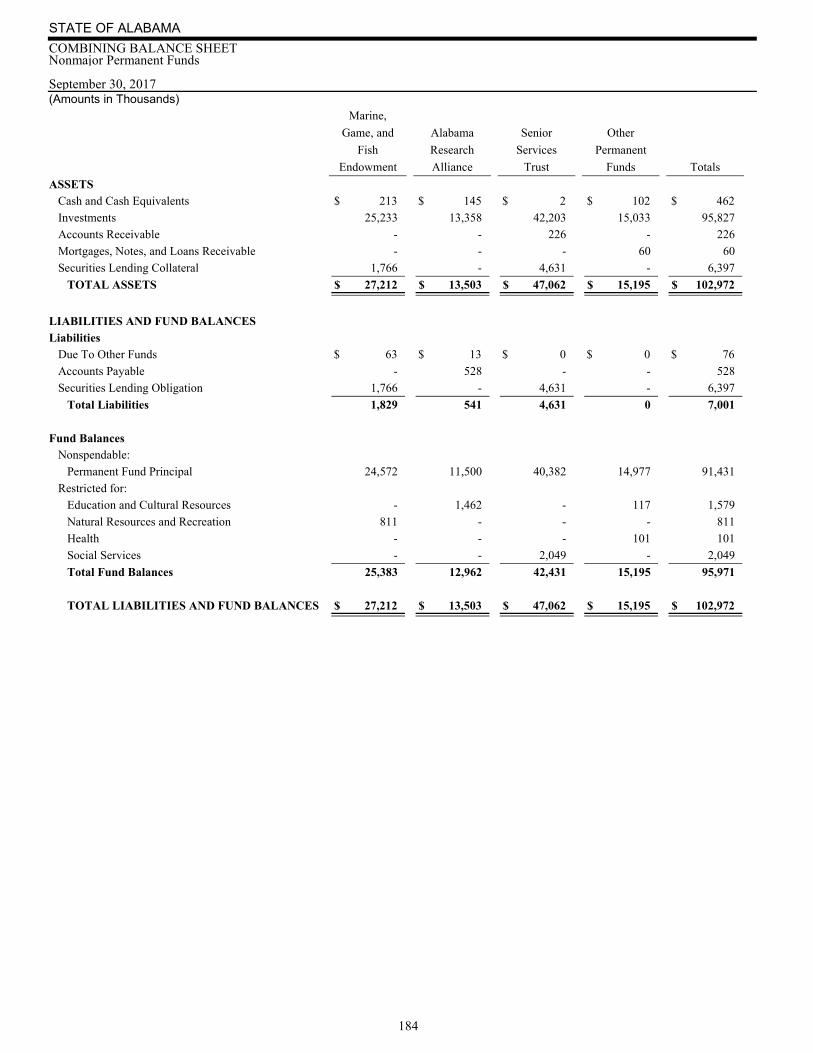
September 30, 2017(Amounts in Thousands)
STATE OF ALABAMA
COMBINING BALANCE SHEETNonmajor Permanent Funds
Marine,
Game, and Alabama Senior Other
Fish Research Services Permanent
Endowment Alliance Trust Funds Totals
ASSETS Cash and Cash Equivalents $ 213 $ 145 $ 2 $ 102 $ 462
Investments 25,233 13,358 42,203 15,033 95,827
Accounts Receivable - - 226 - 226
Mortgages, Notes, and Loans Receivable - - - 60 60
Securities Lending Collateral 1,766 - 4,631 - 6,397
TOTAL ASSETS $ 27,212 $ 13,503 $ 47,062 $ 15,195 $ 102,972
LIABILITIES AND FUND BALANCES
Liabilities Due To Other Funds $ 63 $ 13 $ 0 $ 0 $ 76
Accounts Payable - 528 - - 528
Securities Lending Obligation 1,766 - 4,631 - 6,397
Total Liabilities 1,829 541 4,631 0 7,001
Fund Balances Nonspendable:
Permanent Fund Principal 24,572 11,500 40,382 14,977 91,431
Restricted for:
Education and Cultural Resources - 1,462 - 117 1,579
Natural Resources and Recreation 811 - - - 811
Health - - - 101 101
Social Services - - 2,049 - 2,049
Total Fund Balances 25,383 12,962 42,431 15,195 95,971
TOTAL LIABILITIES AND FUND BALANCES $ 27,212 $ 13,503 $ 47,062 $ 15,195 $ 102,972
184

For the Fiscal Year Ended September 30, 2017(Amounts in Thousands)
STATE OF ALABAMA
COMBINING STATEMENT OF REVENUES, EXPENDITURES, AND CHANGES IN FUND BALANCESNonmajor Permanent Funds
Marine,
Game, and Alabama Senior Other
Fish Research Services Permanent
Endowment Alliance Trust Funds Totals
REVENUES Licenses, Permits, and Fees $ 1,241 $ 0 $ 0 $ 85 $ 1,326
Investment Income (430) (53) 323 (74) (234)
Other Revenues - - 14 - 14
Total Revenues 811 (53) 337 11 1,106
EXPENDITURES Current:
Education and Cultural Resources - 970 - - 970
Social Services - - 47 - 47
General Government - - - 10 10
Total Expenditures 0 970 47 10 1,027
Excess (Deficiency) of
Revenues Over (Under) Expenditures 811 (1,023) 290 1 79
OTHER FINANCING SOURCES (USES) Transfers In - - 2,801 - 2,801
Transfers Out - (13) (1,042) (428) (1,483)
Total Other Financing Sources (Uses) 0 (13) 1,759 (428) 1,318
Net Change in Fund Balances 811 (1,036) 2,049 (427) 1,397Fund Balances, October 1, 2016, as Restated 24,572 13,998 40,382 15,622 94,574
Fund Balances, September 30, 2017 $ 25,383 $ 12,962 $ 42,431 $ 15,195 $ 95,971
185

186

Governmental Funds Supplementary InformationGovernmental Funds Supplementary Information includes non-GAAP basis schedules demonstrating compliance with the legally adopted budget and summaries of governmental fund revenues in the State Treasury.
187
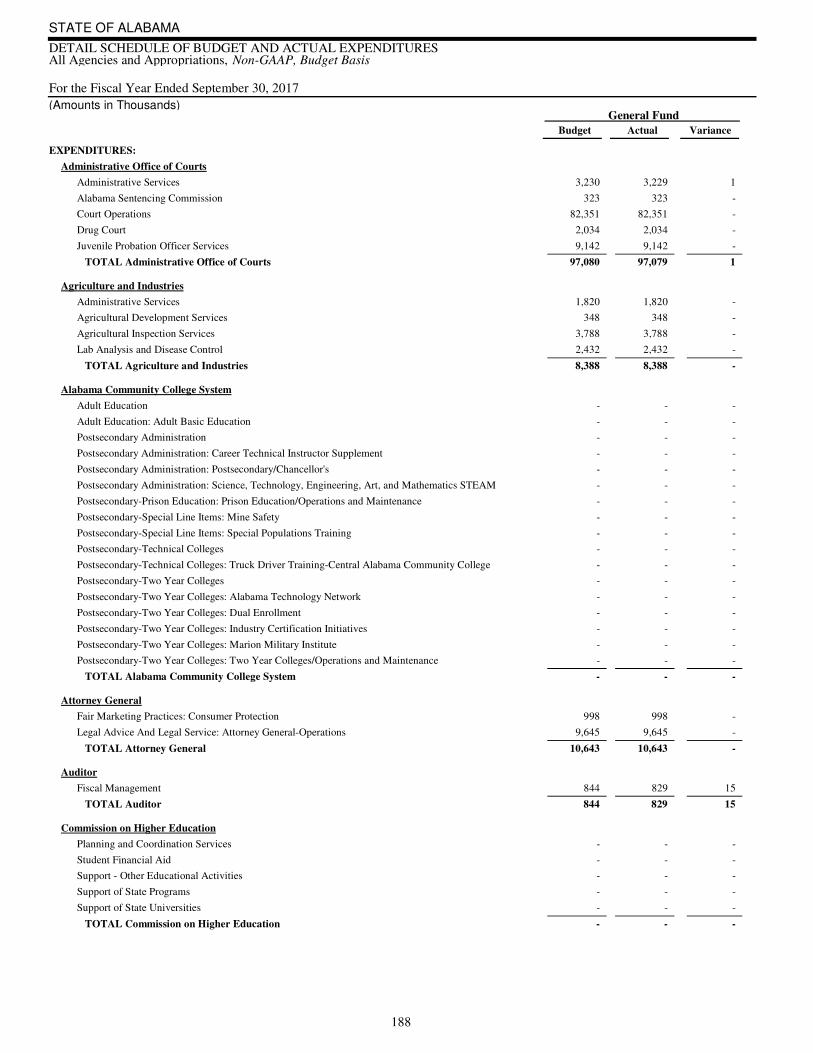
For the Fiscal Year Ended September 30, 2017
STATE OF ALABAMA
DETAIL SCHEDULE OF BUDGET AND ACTUAL EXPENDITURESAll Agencies and Appropriations, Non-GAAP, Budget Basis
(Amounts in Thousands) General Fund
Variance Actual Budget
EXPENDITURES:
Administrative Office of Courts
Administrative Services 3,230 3,229 1
Alabama Sentencing Commission 323 323 -
Court Operations 82,351 82,351 -
Drug Court 2,034 2,034 -
Juvenile Probation Officer Services 9,142 9,142 -
TOTAL Administrative Office of Courts 97,079 1 97,080
Agriculture and Industries
Administrative Services 1,820 1,820 -
Agricultural Development Services 348 348 -
Agricultural Inspection Services 3,788 3,788 -
Lab Analysis and Disease Control 2,432 2,432 -
TOTAL Agriculture and Industries 8,388 - 8,388
Alabama Community College System
Adult Education - - -
Adult Education: Adult Basic Education - - -
Postsecondary Administration - - -
Postsecondary Administration: Career Technical Instructor Supplement - - -
Postsecondary Administration: Postsecondary/Chancellor's - - -
Postsecondary Administration: Science, Technology, Engineering, Art, and Mathematics STEAM - - -
Postsecondary-Prison Education: Prison Education/Operations and Maintenance - - -
Postsecondary-Special Line Items: Mine Safety - - -
Postsecondary-Special Line Items: Special Populations Training - - -
Postsecondary-Technical Colleges - - -
Postsecondary-Technical Colleges: Truck Driver Training-Central Alabama Community College - - -
Postsecondary-Two Year Colleges - - -
Postsecondary-Two Year Colleges: Alabama Technology Network - - -
Postsecondary-Two Year Colleges: Dual Enrollment - - -
Postsecondary-Two Year Colleges: Industry Certification Initiatives - - -
Postsecondary-Two Year Colleges: Marion Military Institute - - -
Postsecondary-Two Year Colleges: Two Year Colleges/Operations and Maintenance - - -
TOTAL Alabama Community College System - - -
Attorney General
Fair Marketing Practices: Consumer Protection 998 998 -
Legal Advice And Legal Service: Attorney General-Operations 9,645 9,645 -
TOTAL Attorney General 10,643 - 10,643
Auditor
Fiscal Management 844 829 15
TOTAL Auditor 829 15 844
Commission on Higher Education
Planning and Coordination Services - - -
Student Financial Aid - - -
Support - Other Educational Activities - - -
Support of State Programs - - -
Support of State Universities - - -
TOTAL Commission on Higher Education - - -
188

Variance Actual Budget
Education Trust Fund Earmarked Funds Total
Variance Actual Budget Variance Actual Budget
3,229 13,230- - - - - -
323 - 323- - - - - -
155,744 5,314161,05873,393 5,314- - - 78,707
2,034 - 2,034- - - - - -
16,787 16216,9497,645 162- - - 7,807
178,117 5,477 183,594 86,514 81,038 5,476 - - -
6,045 5366,5814,225 536- - - 4,761
3,048 1,7174,7652,700 1,717- - - 4,417
14,969 3,74018,70911,181 3,740- - - 14,921
9,137 7079,8446,705 707- - - 7,412
33,199 6,700 39,899 31,511 24,811 6,700 - - -
9,237 8,63117,8689,237 8,631- - - 17,868
12,286 11312,399- - 12,399 12,286 113 -
5,912 2,0627,9745,912 2,062- - - 7,974
2,000 - 2,000- - 2,000 2,000 - -
10,271 310,274- - 10,274 10,271 3 -
250 - 250- - 250 250 - -
9,346 - 9,346- - 9,346 9,346 - -
350 - 350- - 350 350 - -
4,500 - 4,500- - 4,500 4,500 - -
1,244 7562,0001,244 756- - - 2,000
241 - 241- - 241 241 - -
- 10,00010,000- 10,000- - - 10,000
4,897 - 4,897- - 4,897 4,897 - -
10,298 210,300- - 10,300 10,298 2 -
3,117 - 3,117- - 3,117 3,117 - -
7,821 - 7,821- - 7,821 7,821 - -
296,714 - 296,714- - 296,714 296,714 - -
378,484 21,567 400,051 37,842 16,393 21,449 362,209 362,091 118
1,634 3571,991636 357- - - 993
18,480 2,92421,4048,835 2,924- - - 11,759
20,114 3,281 23,395 12,752 9,471 3,281 - - -
829 15844- - - - - -
829 15 844 - - - - - -
3,329 3493,678158 2673,253 3,171 82 425
8,198 468,244- - 8,244 8,198 46 -
3,387 7284,115943 7282,444 2,444 - 1,671
4,843 - 4,843- - 4,843 4,843 - -
5,241 - 5,241- - 5,241 5,241 - -
24,998 1,123 26,121 2,096 1,101 995 24,025 23,897 128
Continued on next page...
189
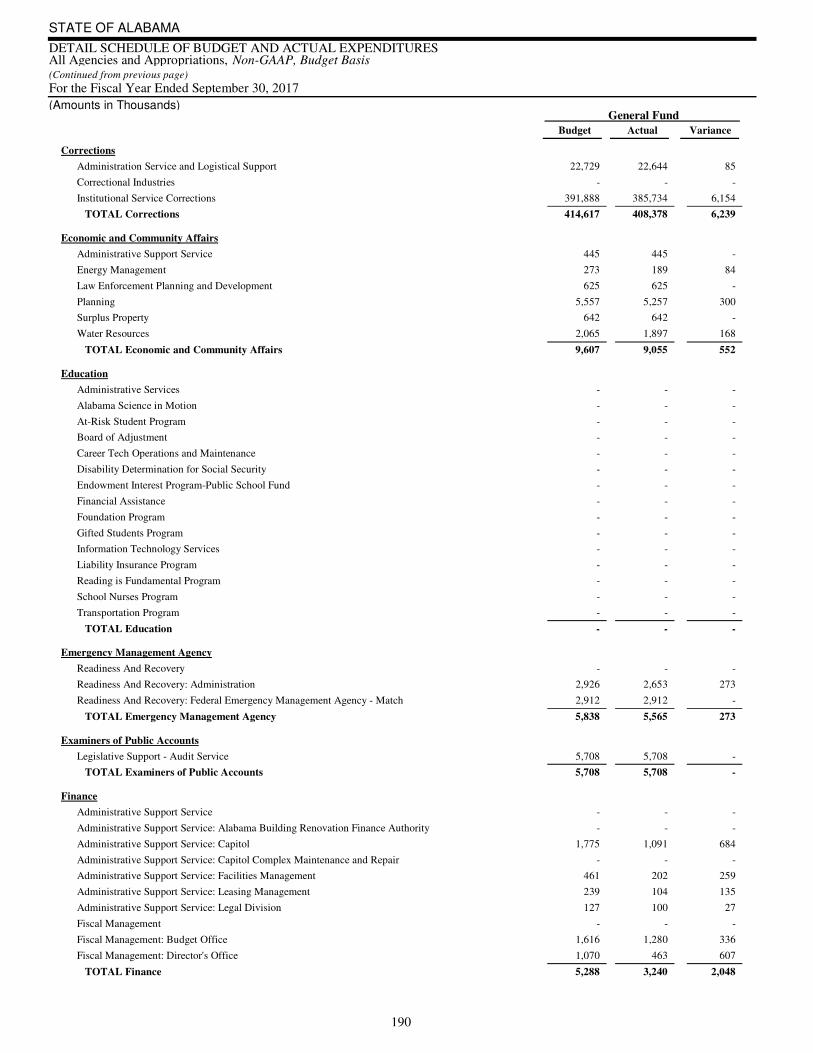
For the Fiscal Year Ended September 30, 2017(Continued from previous page)
STATE OF ALABAMA
DETAIL SCHEDULE OF BUDGET AND ACTUAL EXPENDITURESAll Agencies and Appropriations, Non-GAAP, Budget Basis
(Amounts in Thousands) General Fund
Variance Actual Budget
Corrections
Administration Service and Logistical Support 22,729 22,644 85
Correctional Industries - - -
Institutional Service Corrections 391,888 385,734 6,154
TOTAL Corrections 408,378 6,239 414,617
Economic and Community Affairs
Administrative Support Service 445 445 -
Energy Management 273 189 84
Law Enforcement Planning and Development 625 625 -
Planning 5,557 5,257 300
Surplus Property 642 642 -
Water Resources 2,065 1,897 168
TOTAL Economic and Community Affairs 9,055 552 9,607
Education
Administrative Services - - -
Alabama Science in Motion - - -
At-Risk Student Program - - -
Board of Adjustment - - -
Career Tech Operations and Maintenance - - -
Disability Determination for Social Security - - -
Endowment Interest Program-Public School Fund - - -
Financial Assistance - - -
Foundation Program - - -
Gifted Students Program - - -
Information Technology Services - - -
Liability Insurance Program - - -
Reading is Fundamental Program - - -
School Nurses Program - - -
Transportation Program - - -
TOTAL Education - - -
Emergency Management Agency
Readiness And Recovery - - -
Readiness And Recovery: Administration 2,926 2,653 273
Readiness And Recovery: Federal Emergency Management Agency - Match 2,912 2,912 -
TOTAL Emergency Management Agency 5,565 273 5,838
Examiners of Public Accounts
Legislative Support - Audit Service 5,708 5,708 -
TOTAL Examiners of Public Accounts 5,708 - 5,708
Finance
Administrative Support Service - - -
Administrative Support Service: Alabama Building Renovation Finance Authority - - -
Administrative Support Service: Capitol 1,775 1,091 684
Administrative Support Service: Capitol Complex Maintenance and Repair - - -
Administrative Support Service: Facilities Management 461 202 259
Administrative Support Service: Leasing Management 239 104 135
Administrative Support Service: Legal Division 127 100 27
Fiscal Management - - -
Fiscal Management: Budget Office 1,616 1,280 336
Fiscal Management: Director's Office 1,070 463 607
TOTAL Finance 3,240 2,048 5,288
190

Variance Actual Budget
Education Trust Fund Earmarked Funds Total
Variance Actual Budget Variance Actual Budget
22,644 8522,729- - - - - -
12,480 13,58626,06612,480 13,586- - - 26,066
414,512 16,984431,49628,778 10,830- - - 39,608
449,636 30,655 480,291 65,674 41,258 24,416 - - -
10,144 1,46911,6139,699 1,469- - - 11,168
47,870 10,51058,38047,681 10,426- - - 58,107
35,050 17,77552,82534,425 17,775- - - 52,200
54,367 22,75577,12249,110 22,455- - - 71,565
2,537 4733,0101,895 473- - - 2,368
5,709 3,8769,5853,812 3,708- - - 7,520
155,677 56,858 212,535 202,928 146,622 56,306 - - -
178,833 38,635217,46823,994 37,566155,908 154,839 1,069 61,560
1,942 1,5833,5251,942 1,583- - - 3,525
20,268 - 20,268- - 20,268 20,268 - -
584 167751- - 751 584 167 -
4,994 65,000- - 5,000 4,994 6 -
53,957 47,844101,80153,957 47,844- - - 101,801
533 - 533533 - - - - 533
959,330 336,5591,295,889920,087 336,28439,518 39,243 275 1,256,371
3,810,456 13,810,457175,018 - 3,635,439 3,635,438 1 175,018
2,496 42,500- - 2,500 2,496 4 -
4,851 - 4,851- - 4,851 4,851 - -
2,250 - 2,250- - 2,250 2,250 - -
30 - 30- - 30 30 - -
31,185 - 31,185- - 31,185 31,185 - -
335,778 - 335,778- - 335,778 335,778 - -
5,407,487 424,799 5,832,286 1,598,808 1,175,531 423,277 4,233,478 4,231,956 1,522
22,567 42,16764,73422,567 42,167- - - 64,734
2,653 2732,926- - - - - -
2,912 - 2,912- - - - - -
28,132 42,440 70,572 64,734 22,567 42,167 - - -
16,306 75017,0564,332 7506,266 6,266 - 5,082
16,306 750 17,056 5,082 4,332 750 6,266 6,266 -
94,743 44,604139,34794,743 44,604- - - 139,347
11,747 13,07724,82411,747 13,077- - - 24,824
1,091 6841,775- - - - - -
3,603 5,4119,0143,603 5,411- - - 9,014
202 259461- - - - - -
104 135239- - - - - -
100 27127- - - - - -
10,678 4,64815,32610,678 4,648- - - 15,326
1,280 3361,616- - - - - -
463 6071,070- - - - - -
124,011 69,788 193,799 188,511 120,771 67,740 - - -
Continued on next page...
191
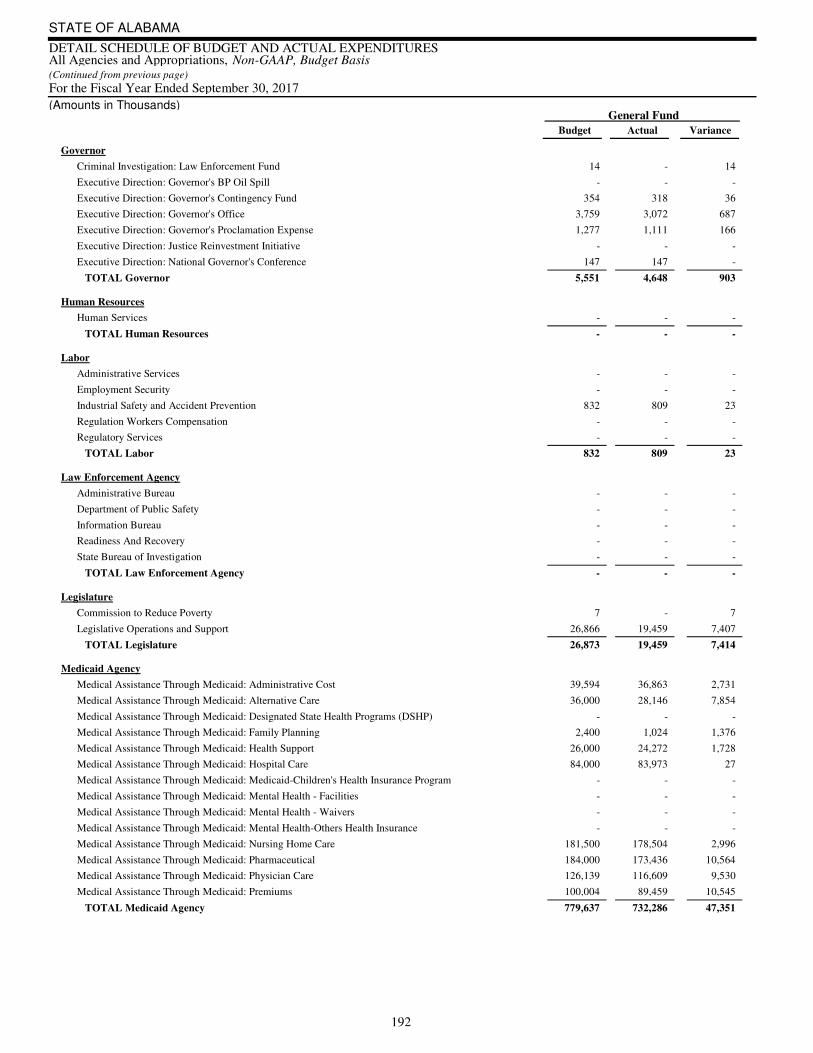
For the Fiscal Year Ended September 30, 2017(Continued from previous page)
STATE OF ALABAMA
DETAIL SCHEDULE OF BUDGET AND ACTUAL EXPENDITURESAll Agencies and Appropriations, Non-GAAP, Budget Basis
(Amounts in Thousands) General Fund
Variance Actual Budget
Governor
Criminal Investigation: Law Enforcement Fund 14 - 14
Executive Direction: Governor's BP Oil Spill - - -
Executive Direction: Governor's Contingency Fund 354 318 36
Executive Direction: Governor's Office 3,759 3,072 687
Executive Direction: Governor's Proclamation Expense 1,277 1,111 166
Executive Direction: Justice Reinvestment Initiative - - -
Executive Direction: National Governor's Conference 147 147 -
TOTAL Governor 4,648 903 5,551
Human Resources
Human Services - - -
TOTAL Human Resources - - -
Labor
Administrative Services - - -
Employment Security - - -
Industrial Safety and Accident Prevention 832 809 23
Regulation Workers Compensation - - -
Regulatory Services - - -
TOTAL Labor 809 23 832
Law Enforcement Agency
Administrative Bureau - - -
Department of Public Safety - - -
Information Bureau - - -
Readiness And Recovery - - -
State Bureau of Investigation - - -
TOTAL Law Enforcement Agency - - -
Legislature
Commission to Reduce Poverty 7 - 7
Legislative Operations and Support 26,866 19,459 7,407
TOTAL Legislature 19,459 7,414 26,873
Medicaid Agency
Medical Assistance Through Medicaid: Administrative Cost 39,594 36,863 2,731
Medical Assistance Through Medicaid: Alternative Care 36,000 28,146 7,854
Medical Assistance Through Medicaid: Designated State Health Programs (DSHP) - - -
Medical Assistance Through Medicaid: Family Planning 2,400 1,024 1,376
Medical Assistance Through Medicaid: Health Support 26,000 24,272 1,728
Medical Assistance Through Medicaid: Hospital Care 84,000 83,973 27
Medical Assistance Through Medicaid: Medicaid-Children's Health Insurance Program - - -
Medical Assistance Through Medicaid: Mental Health - Facilities - - -
Medical Assistance Through Medicaid: Mental Health - Waivers - - -
Medical Assistance Through Medicaid: Mental Health-Others Health Insurance - - -
Medical Assistance Through Medicaid: Nursing Home Care 181,500 178,504 2,996
Medical Assistance Through Medicaid: Pharmaceutical 184,000 173,436 10,564
Medical Assistance Through Medicaid: Physician Care 126,139 116,609 9,530
Medical Assistance Through Medicaid: Premiums 100,004 89,459 10,545
TOTAL Medicaid Agency 732,286 47,351 779,637
192
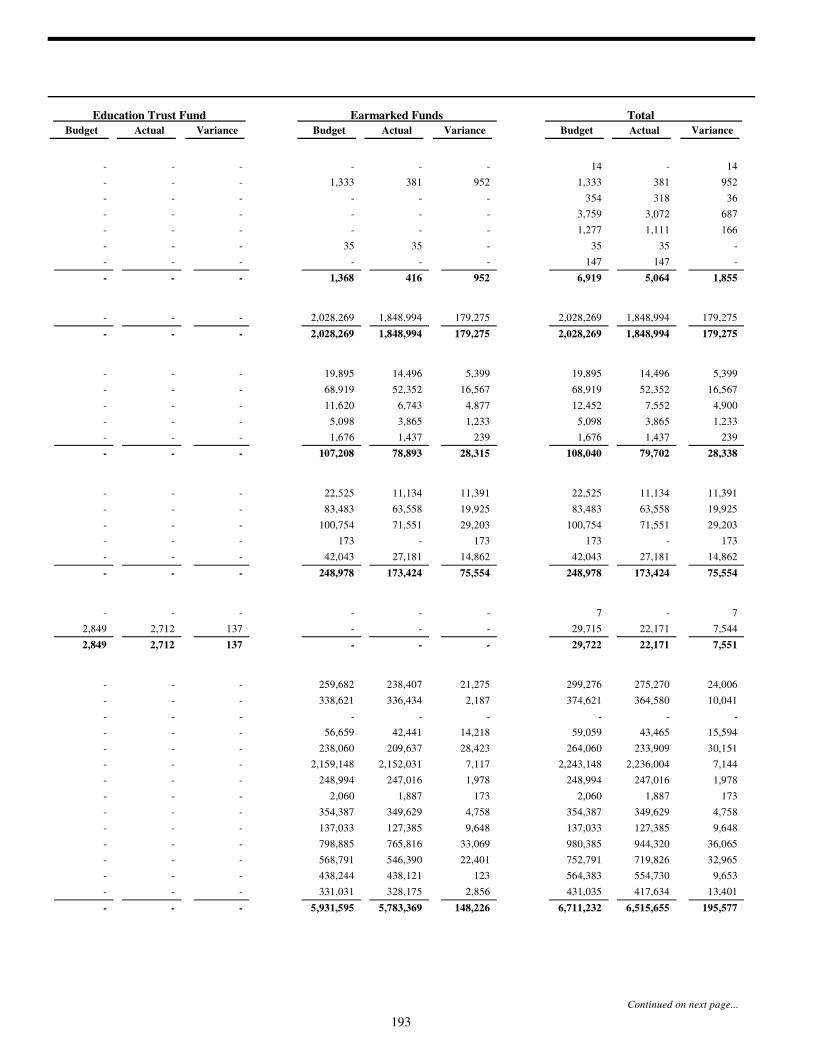
Variance Actual Budget
Education Trust Fund Earmarked Funds Total
Variance Actual Budget Variance Actual Budget
- 1414- - - - - -
381 9521,333381 952- - - 1,333
318 36354- - - - - -
3,072 6873,759- - - - - -
1,111 1661,277- - - - - -
35 - 3535 - - - - 35
147 - 147- - - - - -
5,064 1,855 6,919 1,368 416 952 - - -
1,848,994 179,2752,028,2691,848,994 179,275- - - 2,028,269
1,848,994 179,275 2,028,269 2,028,269 1,848,994 179,275 - - -
14,496 5,39919,89514,496 5,399- - - 19,895
52,352 16,56768,91952,352 16,567- - - 68,919
7,552 4,90012,4526,743 4,877- - - 11,620
3,865 1,2335,0983,865 1,233- - - 5,098
1,437 2391,6761,437 239- - - 1,676
79,702 28,338 108,040 107,208 78,893 28,315 - - -
11,134 11,39122,52511,134 11,391- - - 22,525
63,558 19,92583,48363,558 19,925- - - 83,483
71,551 29,203100,75471,551 29,203- - - 100,754
- 173173- 173- - - 173
27,181 14,86242,04327,181 14,862- - - 42,043
173,424 75,554 248,978 248,978 173,424 75,554 - - -
- 77- - - - - -
22,171 7,54429,715- - 2,849 2,712 137 -
22,171 7,551 29,722 - - - 2,849 2,712 137
275,270 24,006299,276238,407 21,275- - - 259,682
364,580 10,041374,621336,434 2,187- - - 338,621
- - - - - - - - -
43,465 15,59459,05942,441 14,218- - - 56,659
233,909 30,151264,060209,637 28,423- - - 238,060
2,236,004 7,1442,243,1482,152,031 7,117- - - 2,159,148
247,016 1,978248,994247,016 1,978- - - 248,994
1,887 1732,0601,887 173- - - 2,060
349,629 4,758354,387349,629 4,758- - - 354,387
127,385 9,648137,033127,385 9,648- - - 137,033
944,320 36,065980,385765,816 33,069- - - 798,885
719,826 32,965752,791546,390 22,401- - - 568,791
554,730 9,653564,383438,121 123- - - 438,244
417,634 13,401431,035328,175 2,856- - - 331,031
6,515,655 195,577 6,711,232 5,931,595 5,783,369 148,226 - - -
Continued on next page...
193

For the Fiscal Year Ended September 30, 2017(Continued from previous page)
STATE OF ALABAMA
DETAIL SCHEDULE OF BUDGET AND ACTUAL EXPENDITURESAll Agencies and Appropriations, Non-GAAP, Budget Basis
(Amounts in Thousands) General Fund
Variance Actual Budget
Mental Health
Administrative Services - - -
Institutional Treatment and Care of Intellectually Disabled - - -
Institutional Treatment and Care of Mentally Ill - - -
Special Services - - -
Substance Abuse Program - - -
TOTAL Mental Health - - -
Public Health
Administrative Services 8,442 8,442 -
Alabama Medical Education Consortium Program - - -
Children's Health Insurance - - -
Emergency Medical Service Education - - -
Family Practice Rural Health - - -
Public Health Services 23,859 23,590 269
TOTAL Public Health 32,032 269 32,301
Public Service Commission
Regulatory Services - - -
TOTAL Public Service Commission - - -
Rehabilitation Services
Direct Client Services-Handicap - - -
TOTAL Rehabilitation Services - - -
Revenue
State Revenue Administration 276 52 224
TOTAL Revenue 52 224 276
Secretary of State
Administrative Support Service - - -
Administrative Support Service: Administration Of Help America Vote Act - - -
Administrative Support Service: Distribution of Public Documents 207 207 -
Administrative Support Service: Printing of Acts/Journals 167 23 144
Administrative Support Service: Printing of Codes 464 87 377
Administrative Support Service: Secretary of State 17 17 -
Special Services: Photo Voter Identification 904 597 307
Special Services: Training of Elected Officials 91 26 65
TOTAL Secretary of State 957 893 1,850
Transportation
General Administration - - -
General Aviation and Aeronautics - - -
Surface Transportation Improvements - - -
TOTAL Transportation - - -
Treasurer
Fiscal Management - - -
TOTAL Treasurer - - -
Youth Services
Community Educational Programs - - -
Financial Assistance - - -
Youth Services 5,705 5,705 -
TOTAL Youth Services 5,705 - 5,705
194
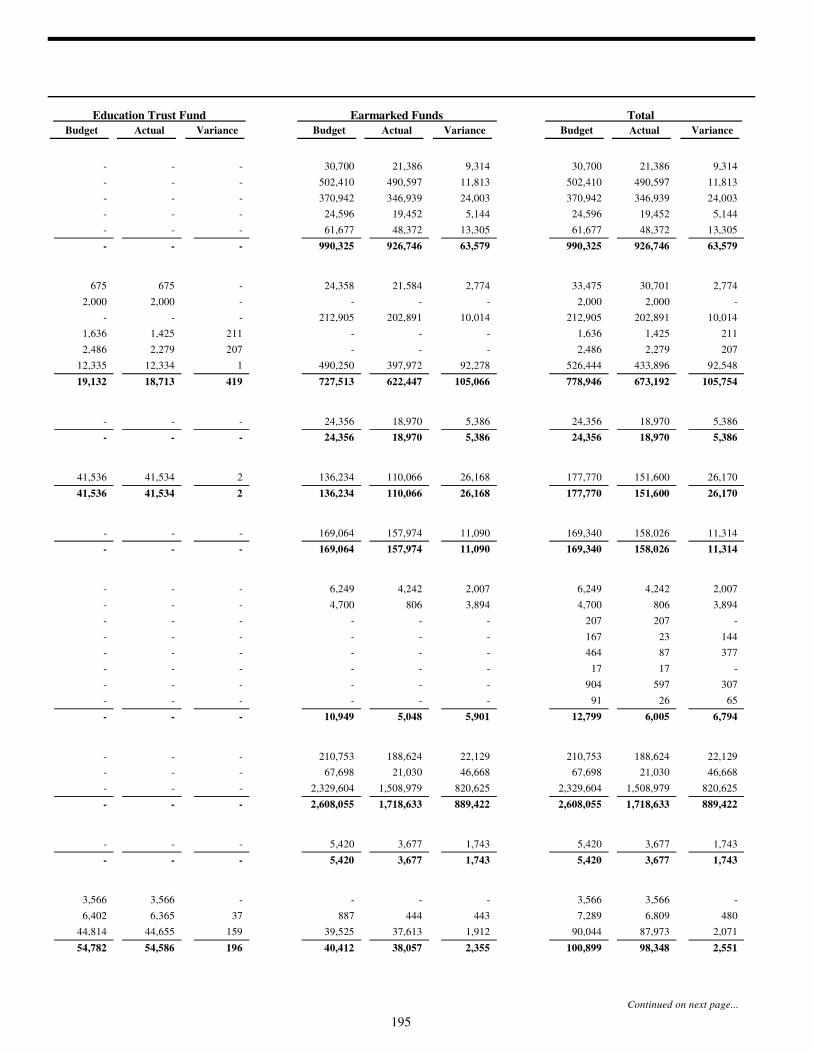
Variance Actual Budget
Education Trust Fund Earmarked Funds Total
Variance Actual Budget Variance Actual Budget
21,386 9,31430,70021,386 9,314- - - 30,700
490,597 11,813502,410490,597 11,813- - - 502,410
346,939 24,003370,942346,939 24,003- - - 370,942
19,452 5,14424,59619,452 5,144- - - 24,596
48,372 13,30561,67748,372 13,305- - - 61,677
926,746 63,579 990,325 990,325 926,746 63,579 - - -
30,701 2,77433,47521,584 2,774675 675 - 24,358
2,000 - 2,000- - 2,000 2,000 - -
202,891 10,014212,905202,891 10,014- - - 212,905
1,425 2111,636- - 1,636 1,425 211 -
2,279 2072,486- - 2,486 2,279 207 -
433,896 92,548526,444397,972 92,27812,335 12,334 1 490,250
673,192 105,754 778,946 727,513 622,447 105,066 19,132 18,713 419
18,970 5,38624,35618,970 5,386- - - 24,356
18,970 5,386 24,356 24,356 18,970 5,386 - - -
151,600 26,170177,770110,066 26,16841,536 41,534 2 136,234
151,600 26,170 177,770 136,234 110,066 26,168 41,536 41,534 2
158,026 11,314169,340157,974 11,090- - - 169,064
158,026 11,314 169,340 169,064 157,974 11,090 - - -
4,242 2,0076,2494,242 2,007- - - 6,249
806 3,8944,700806 3,894- - - 4,700
207 - 207- - - - - -
23 144167- - - - - -
87 377464- - - - - -
17 - 17- - - - - -
597 307904- - - - - -
26 6591- - - - - -
6,005 6,794 12,799 10,949 5,048 5,901 - - -
188,624 22,129210,753188,624 22,129- - - 210,753
21,030 46,66867,69821,030 46,668- - - 67,698
1,508,979 820,6252,329,6041,508,979 820,625- - - 2,329,604
1,718,633 889,422 2,608,055 2,608,055 1,718,633 889,422 - - -
3,677 1,7435,4203,677 1,743- - - 5,420
3,677 1,743 5,420 5,420 3,677 1,743 - - -
3,566 - 3,566- - 3,566 3,566 - -
6,809 4807,289444 4436,402 6,365 37 887
87,973 2,07190,04437,613 1,91244,814 44,655 159 39,525
98,348 2,551 100,899 40,412 38,057 2,355 54,782 54,586 196
Continued on next page...
195
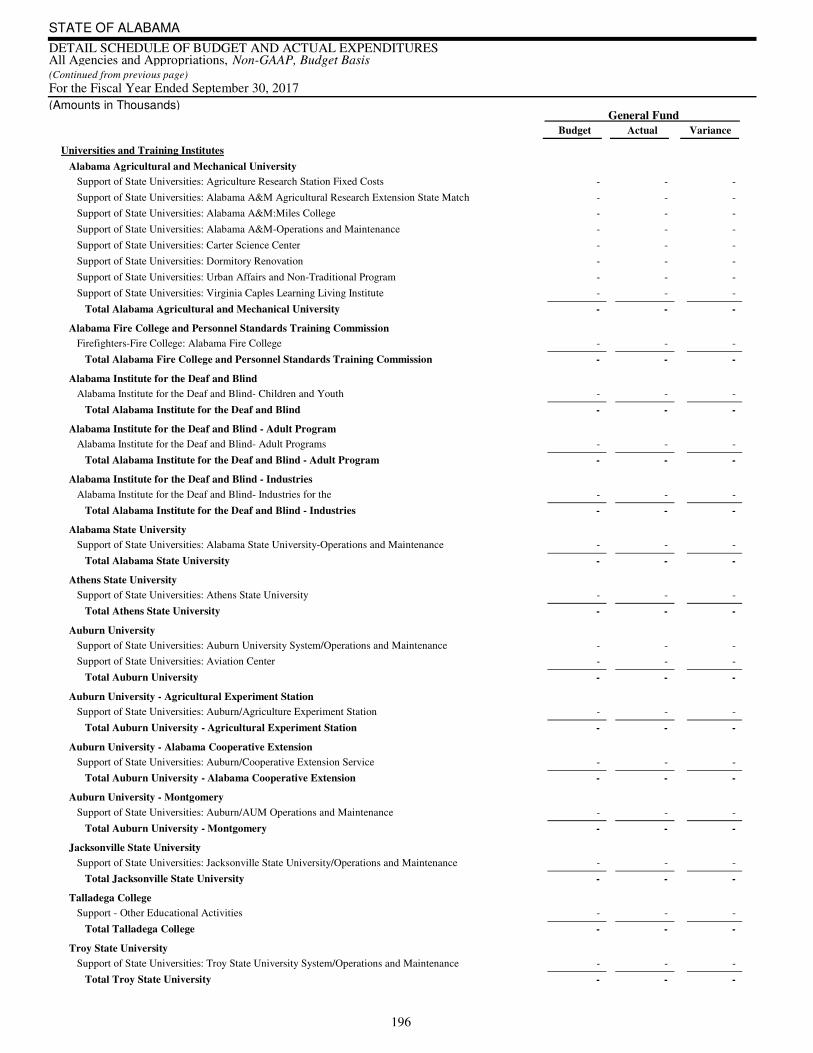
For the Fiscal Year Ended September 30, 2017(Continued from previous page)
STATE OF ALABAMA
DETAIL SCHEDULE OF BUDGET AND ACTUAL EXPENDITURESAll Agencies and Appropriations, Non-GAAP, Budget Basis
(Amounts in Thousands) General Fund
Variance Actual Budget
Universities and Training Institutes
Alabama Agricultural and Mechanical University
Support of State Universities: Agriculture Research Station Fixed Costs - - -
Support of State Universities: Alabama A&M Agricultural Research Extension State Match - - -
Support of State Universities: Alabama A&M:Miles College - - -
Support of State Universities: Alabama A&M-Operations and Maintenance - - -
Support of State Universities: Carter Science Center - - -
Support of State Universities: Dormitory Renovation - - -
Support of State Universities: Urban Affairs and Non-Traditional Program - - -
Support of State Universities: Virginia Caples Learning Living Institute - - -
Total Alabama Agricultural and Mechanical University
- - -
Alabama Fire College and Personnel Standards Training Commission
Firefighters-Fire College: Alabama Fire College - - -
Total Alabama Fire College and Personnel Standards Training Commission
- - -
Alabama Institute for the Deaf and Blind
Alabama Institute for the Deaf and Blind- Children and Youth - - -
Total Alabama Institute for the Deaf and Blind
- - -
Alabama Institute for the Deaf and Blind - Adult Program
Alabama Institute for the Deaf and Blind- Adult Programs - - -
Total Alabama Institute for the Deaf and Blind - Adult Program
- - -
Alabama Institute for the Deaf and Blind - Industries
Alabama Institute for the Deaf and Blind- Industries for the - - -
Total Alabama Institute for the Deaf and Blind - Industries
- - -
Alabama State University
Support of State Universities: Alabama State University-Operations and Maintenance - - -
Total Alabama State University
- - -
Athens State University
Support of State Universities: Athens State University - - -
Total Athens State University
- - -
Auburn University
Support of State Universities: Auburn University System/Operations and Maintenance - - -
Support of State Universities: Aviation Center - - -
Total Auburn University
- - -
Auburn University - Agricultural Experiment Station
Support of State Universities: Auburn/Agriculture Experiment Station - - -
Total Auburn University - Agricultural Experiment Station
- - -
Auburn University - Alabama Cooperative Extension
Support of State Universities: Auburn/Cooperative Extension Service - - -
Total Auburn University - Alabama Cooperative Extension
- - -
Auburn University - Montgomery
Support of State Universities: Auburn/AUM Operations and Maintenance - - -
Total Auburn University - Montgomery
- - -
Jacksonville State University
Support of State Universities: Jacksonville State University/Operations and Maintenance - - -
Total Jacksonville State University
- - -
Talladega College
Support - Other Educational Activities - - -
Total Talladega College
- - -
Troy State University
Support of State Universities: Troy State University System/Operations and Maintenance - - -
Total Troy State University
- - -
196
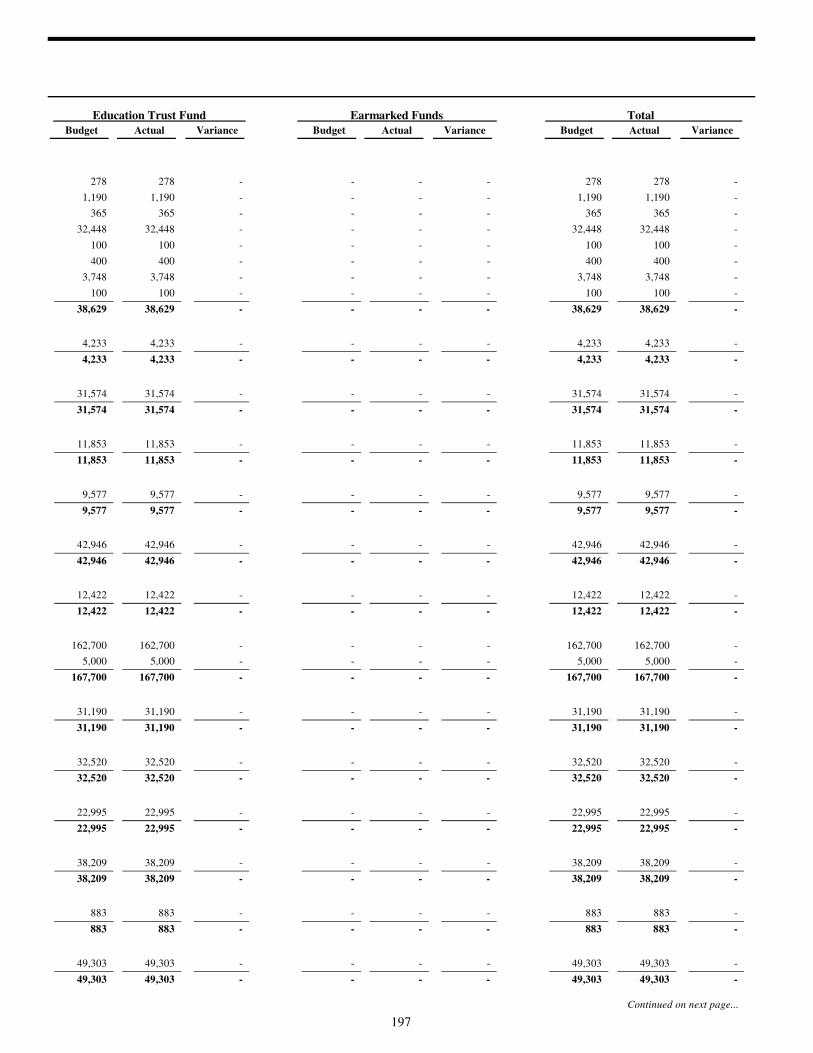
Variance Actual Budget
Education Trust Fund Earmarked Funds Total
Variance Actual Budget Variance Actual Budget
278 - 278- - 278 278 - -
1,190 - 1,190- - 1,190 1,190 - -
365 - 365- - 365 365 - -
32,448 - 32,448- - 32,448 32,448 - -
100 - 100- - 100 100 - -
400 - 400- - 400 400 - -
3,748 - 3,748- - 3,748 3,748 - -
100 - 100- - 100 100 - -
38,629 - 38,629 - - - 38,629 38,629 -
4,233 - 4,233- - 4,233 4,233 - -
4,233 - 4,233 - - - 4,233 4,233 -
31,574 - 31,574- - 31,574 31,574 - -
31,574 - 31,574 - - - 31,574 31,574 -
11,853 - 11,853- - 11,853 11,853 - -
11,853 - 11,853 - - - 11,853 11,853 -
9,577 - 9,577- - 9,577 9,577 - -
9,577 - 9,577 - - - 9,577 9,577 -
42,946 - 42,946- - 42,946 42,946 - -
42,946 - 42,946 - - - 42,946 42,946 -
12,422 - 12,422- - 12,422 12,422 - -
12,422 - 12,422 - - - 12,422 12,422 -
162,700 - 162,700- - 162,700 162,700 - -
5,000 - 5,000- - 5,000 5,000 - -
167,700 - 167,700 - - - 167,700 167,700 -
31,190 - 31,190- - 31,190 31,190 - -
31,190 - 31,190 - - - 31,190 31,190 -
32,520 - 32,520- - 32,520 32,520 - -
32,520 - 32,520 - - - 32,520 32,520 -
22,995 - 22,995- - 22,995 22,995 - -
22,995 - 22,995 - - - 22,995 22,995 -
38,209 - 38,209- - 38,209 38,209 - -
38,209 - 38,209 - - - 38,209 38,209 -
883 - 883- - 883 883 - -
883 - 883 - - - 883 883 -
49,303 - 49,303- - 49,303 49,303 - -
49,303 - 49,303 - - - 49,303 49,303 -
Continued on next page...
197
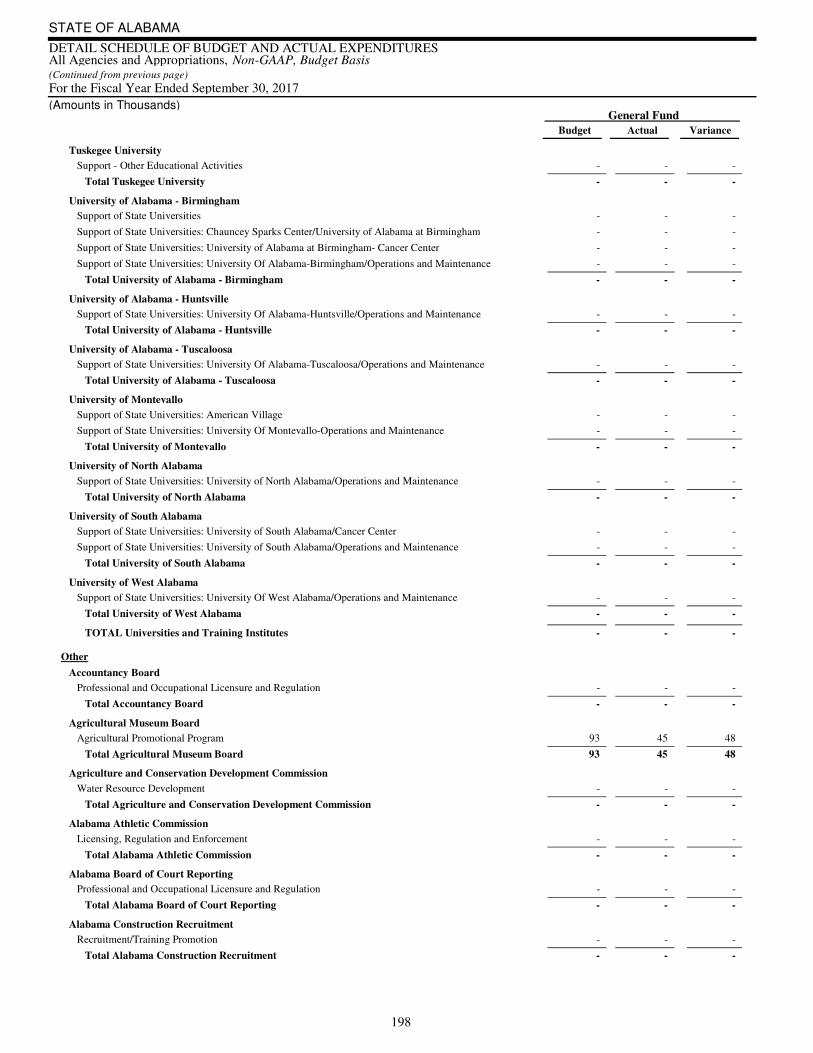
For the Fiscal Year Ended September 30, 2017(Continued from previous page)
STATE OF ALABAMA
DETAIL SCHEDULE OF BUDGET AND ACTUAL EXPENDITURESAll Agencies and Appropriations, Non-GAAP, Budget Basis
(Amounts in Thousands) General Fund
Variance Actual Budget
Tuskegee University
Support - Other Educational Activities - - -
Total Tuskegee University
- - -
University of Alabama - Birmingham
Support of State Universities - - -
Support of State Universities: Chauncey Sparks Center/University of Alabama at Birmingham - - -
Support of State Universities: University of Alabama at Birmingham- Cancer Center - - -
Support of State Universities: University Of Alabama-Birmingham/Operations and Maintenance - - -
Total University of Alabama - Birmingham
- - -
University of Alabama - Huntsville
Support of State Universities: University Of Alabama-Huntsville/Operations and Maintenance - - -
Total University of Alabama - Huntsville
- - -
University of Alabama - Tuscaloosa
Support of State Universities: University Of Alabama-Tuscaloosa/Operations and Maintenance - - -
Total University of Alabama - Tuscaloosa
- - -
University of Montevallo
Support of State Universities: American Village - - -
Support of State Universities: University Of Montevallo-Operations and Maintenance - - -
Total University of Montevallo
- - -
University of North Alabama
Support of State Universities: University of North Alabama/Operations and Maintenance - - -
Total University of North Alabama
- - -
University of South Alabama
Support of State Universities: University of South Alabama/Cancer Center - - -
Support of State Universities: University of South Alabama/Operations and Maintenance - - -
Total University of South Alabama
- - -
University of West Alabama
Support of State Universities: University Of West Alabama/Operations and Maintenance - - -
Total University of West Alabama
- - -
TOTAL Universities and Training Institutes - - -
Other
Accountancy Board
Professional and Occupational Licensure and Regulation - - -
Total Accountancy Board
- - -
Agricultural Museum Board
Agricultural Promotional Program 93 45 48
Total Agricultural Museum Board
93 45 48
Agriculture and Conservation Development Commission
Water Resource Development - - -
Total Agriculture and Conservation Development Commission
- - -
Alabama Athletic Commission
Licensing, Regulation and Enforcement - - -
Total Alabama Athletic Commission
- - -
Alabama Board of Court Reporting
Professional and Occupational Licensure and Regulation - - -
Total Alabama Board of Court Reporting
- - -
Alabama Construction Recruitment
Recruitment/Training Promotion - - -
Total Alabama Construction Recruitment
- - -
198

Variance Actual Budget
Education Trust Fund Earmarked Funds Total
Variance Actual Budget Variance Actual Budget
10,595 - 10,595- - 10,595 10,595 - -
10,595 - 10,595 - - - 10,595 10,595 -
30 - 3030 - - - - 30
3,237 - 3,237- - 3,237 3,237 - -
5,053 - 5,053- - 5,053 5,053 - -
263,793 - 263,793- - 263,793 263,793 - -
272,113 - 272,113 30 30 - 272,083 272,083 -
47,833 - 47,833- - 47,833 47,833 - -
47,833 - 47,833 - - - 47,833 47,833 -
154,836 - 154,836- - 154,836 154,836 - -
154,836 - 154,836 - - - 154,836 154,836 -
75 - 75- - 75 75 - -
19,703 - 19,703- - 19,703 19,703 - -
19,778 - 19,778 - - - 19,778 19,778 -
28,186 - 28,186- - 28,186 28,186 - -
28,186 - 28,186 - - - 28,186 28,186 -
3,000 - 3,000- - 3,000 3,000 - -
104,285 - 104,285- - 104,285 104,285 - -
107,285 - 107,285 - - - 107,285 107,285 -
16,147 - 16,147- - 16,147 16,147 - -
16,147 - 16,147 - - - 16,147 16,147 -
1,150,807 - 1,150,807 30 30 - 1,150,777 1,150,777 -
1,346 1301,4761,346 130- - - 1,476
1,346 130 1,476 1,476 1,346 130 - - -
45 4893- - - - - -
45 48 93 - - - - - -
234 259493234 259- - - 493
234 259 493 493 234 259 - - -
138 68206138 68- - - 206
138 68 206 206 138 68 - - -
119 81200119 81- - - 200
119 81 200 200 119 81 - - -
1,490 2601,7501,490 260- - - 1,750
1,490 260 1,750 1,750 1,490 260 - - -
Continued on next page...
199
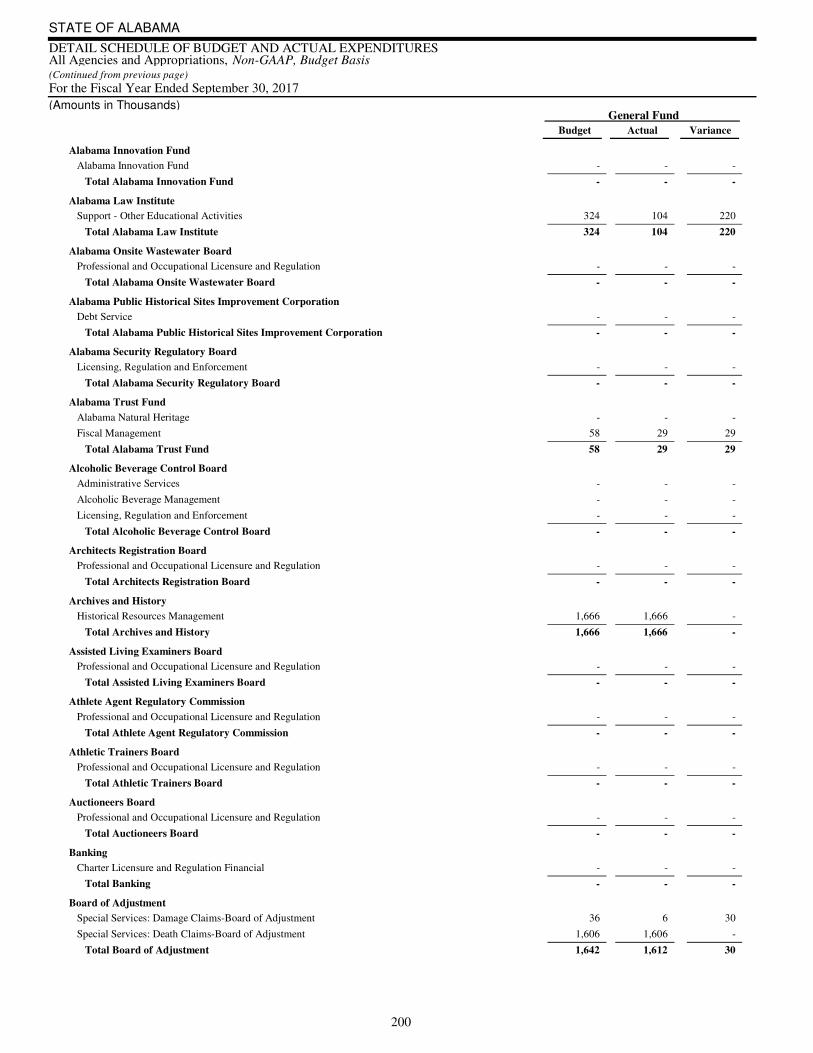
For the Fiscal Year Ended September 30, 2017(Continued from previous page)
STATE OF ALABAMA
DETAIL SCHEDULE OF BUDGET AND ACTUAL EXPENDITURESAll Agencies and Appropriations, Non-GAAP, Budget Basis
(Amounts in Thousands) General Fund
Variance Actual Budget
Alabama Innovation Fund
Alabama Innovation Fund - - -
Total Alabama Innovation Fund
- - -
Alabama Law Institute
Support - Other Educational Activities 324 104 220
Total Alabama Law Institute
324 104 220
Alabama Onsite Wastewater Board
Professional and Occupational Licensure and Regulation - - -
Total Alabama Onsite Wastewater Board
- - -
Alabama Public Historical Sites Improvement Corporation
Debt Service - - -
Total Alabama Public Historical Sites Improvement Corporation
- - -
Alabama Security Regulatory Board
Licensing, Regulation and Enforcement - - -
Total Alabama Security Regulatory Board
- - -
Alabama Trust Fund
Alabama Natural Heritage - - -
Fiscal Management 58 29 29
Total Alabama Trust Fund
58 29 29
Alcoholic Beverage Control Board
Administrative Services - - -
Alcoholic Beverage Management - - -
Licensing, Regulation and Enforcement - - -
Total Alcoholic Beverage Control Board
- - -
Architects Registration Board
Professional and Occupational Licensure and Regulation - - -
Total Architects Registration Board
- - -
Archives and History
Historical Resources Management 1,666 1,666 -
Total Archives and History
1,666 1,666 -
Assisted Living Examiners Board
Professional and Occupational Licensure and Regulation - - -
Total Assisted Living Examiners Board
- - -
Athlete Agent Regulatory Commission
Professional and Occupational Licensure and Regulation - - -
Total Athlete Agent Regulatory Commission
- - -
Athletic Trainers Board
Professional and Occupational Licensure and Regulation - - -
Total Athletic Trainers Board
- - -
Auctioneers Board
Professional and Occupational Licensure and Regulation - - -
Total Auctioneers Board
- - -
Banking
Charter Licensure and Regulation Financial - - -
Total Banking
- - -
Board of Adjustment
Special Services: Damage Claims-Board of Adjustment 36 6 30
Special Services: Death Claims-Board of Adjustment 1,606 1,606 -
Total Board of Adjustment
1,642 1,612 30
200

Variance Actual Budget
Education Trust Fund Earmarked Funds Total
Variance Actual Budget Variance Actual Budget
2,420 - 2,420- - 2,420 2,420 - -
2,420 - 2,420 - - - 2,420 2,420 -
901 3621,2632 142795 795 - 144
901 362 1,263 144 2 142 795 795 -
405 225630405 225- - - 630
405 225 630 630 405 225 - - -
270 - 270270 - - - - 270
270 - 270 270 270 - - - -
337 13350337 13- - - 350
337 13 350 350 337 13 - - -
860 6401,500860 640- - - 1,500
29 2958- - - - - -
889 669 1,558 1,500 860 640 - - -
12,575 9,41821,99312,575 9,418- - - 21,993
56,288 2,81259,10056,288 2,812- - - 59,100
3,871 2,7796,6503,871 2,779- - - 6,650
72,734 15,009 87,743 87,743 72,734 15,009 - - -
470 35505470 35- - - 505
470 35 505 505 470 35 - - -
6,503 1,2597,762402 1205,574 4,435 1,139 522
6,503 1,259 7,762 522 402 120 5,574 4,435 1,139
76 3010676 30- - - 106
76 30 106 106 76 30 - - -
45 186345 18- - - 63
45 18 63 63 45 18 - - -
64 168064 16- - - 80
64 16 80 80 64 16 - - -
182 13195182 13- - - 195
182 13 195 195 182 13 - - -
15,759 97116,73015,759 971- - - 16,730
15,759 971 16,730 16,730 15,759 971 - - -
6 3036- - - - - -
1,606 - 1,606- - - - - -
1,612 30 1,642 - - - - - -
Continued on next page...
201

For the Fiscal Year Ended September 30, 2017(Continued from previous page)
STATE OF ALABAMA
DETAIL SCHEDULE OF BUDGET AND ACTUAL EXPENDITURESAll Agencies and Appropriations, Non-GAAP, Budget Basis
(Amounts in Thousands) General Fund
Variance Actual Budget
Board of Cosmetology and Barbering
Professional and Occupational Licensure and Regulation - - -
Total Board of Cosmetology and Barbering
- - -
Board of Prosthetists and Orthotists
Professional and Occupational Licensure and Regulation - - -
Total Board of Prosthetists and Orthotists
- - -
Board of Respiratory Therapy
Professional and Occupational Licensure and Regulation - - -
Total Board of Respiratory Therapy
- - -
Child Abuse & Neglect Prevention
Social Services - - -
Total Child Abuse & Neglect Prevention
- - -
Children Services Facilitation
Human Services - - -
Total Children Services Facilitation
- - -
Chiropractic Examiners Board
Professional and Occupational Licensure and Regulation - - -
Total Chiropractic Examiners Board
- - -
Choctawhatchee, Pea and Yellow Rivers Watershed Management Authority
Water Resource Development 218 200 18
Total Choctawhatchee, Pea and Yellow Rivers Watershed Management Authority
218 200 18
Coalition Against Domestic Violence
Non-State 170 170 -
Total Coalition Against Domestic Violence
170 170 -
Conservation and Natural Resources
Administrative Services - - -
Game and Fish - - -
Marine Resources - - -
Outdoor Recreation Sites and Services - - -
State Land Management - - -
Total Conservation and Natural Resources
- - -
Council on the Arts
Fine Arts - - -
Total Council on the Arts
- - -
Counseling Examiners Board
Professional and Occupational Licensure and Regulation - - -
Total Counseling Examiners Board
- - -
Court of Civil Appeals
Court Operations 3,878 3,606 272
Total Court of Civil Appeals
3,878 3,606 272
Court of Criminal Appeals
Court Operations 4,110 3,822 288
Total Court of Criminal Appeals
4,110 3,822 288
Credit Union Administration
Charter Licensure and Regulation Financial - - -
Total Credit Union Administration
- - -
Crime Victims Compensation Commission
Special Services - - -
Total Crime Victims Compensation Commission
- - -
202
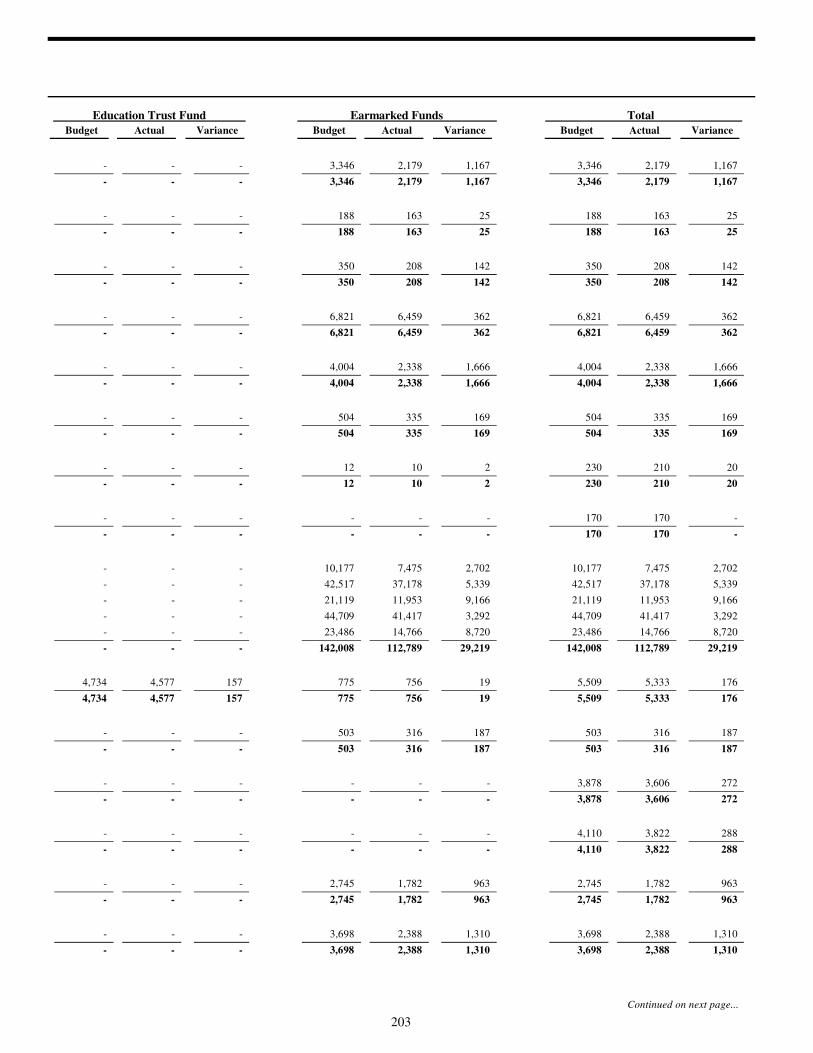
Variance Actual Budget
Education Trust Fund Earmarked Funds Total
Variance Actual Budget Variance Actual Budget
2,179 1,1673,3462,179 1,167- - - 3,346
2,179 1,167 3,346 3,346 2,179 1,167 - - -
163 25188163 25- - - 188
163 25 188 188 163 25 - - -
208 142350208 142- - - 350
208 142 350 350 208 142 - - -
6,459 3626,8216,459 362- - - 6,821
6,459 362 6,821 6,821 6,459 362 - - -
2,338 1,6664,0042,338 1,666- - - 4,004
2,338 1,666 4,004 4,004 2,338 1,666 - - -
335 169504335 169- - - 504
335 169 504 504 335 169 - - -
210 2023010 2- - - 12
210 20 230 12 10 2 - - -
170 - 170- - - - - -
170 - 170 - - - - - -
7,475 2,70210,1777,475 2,702- - - 10,177
37,178 5,33942,51737,178 5,339- - - 42,517
11,953 9,16621,11911,953 9,166- - - 21,119
41,417 3,29244,70941,417 3,292- - - 44,709
14,766 8,72023,48614,766 8,720- - - 23,486
112,789 29,219 142,008 142,008 112,789 29,219 - - -
5,333 1765,509756 194,734 4,577 157 775
5,333 176 5,509 775 756 19 4,734 4,577 157
316 187503316 187- - - 503
316 187 503 503 316 187 - - -
3,606 2723,878- - - - - -
3,606 272 3,878 - - - - - -
3,822 2884,110- - - - - -
3,822 288 4,110 - - - - - -
1,782 9632,7451,782 963- - - 2,745
1,782 963 2,745 2,745 1,782 963 - - -
2,388 1,3103,6982,388 1,310- - - 3,698
2,388 1,310 3,698 3,698 2,388 1,310 - - -
Continued on next page...
203
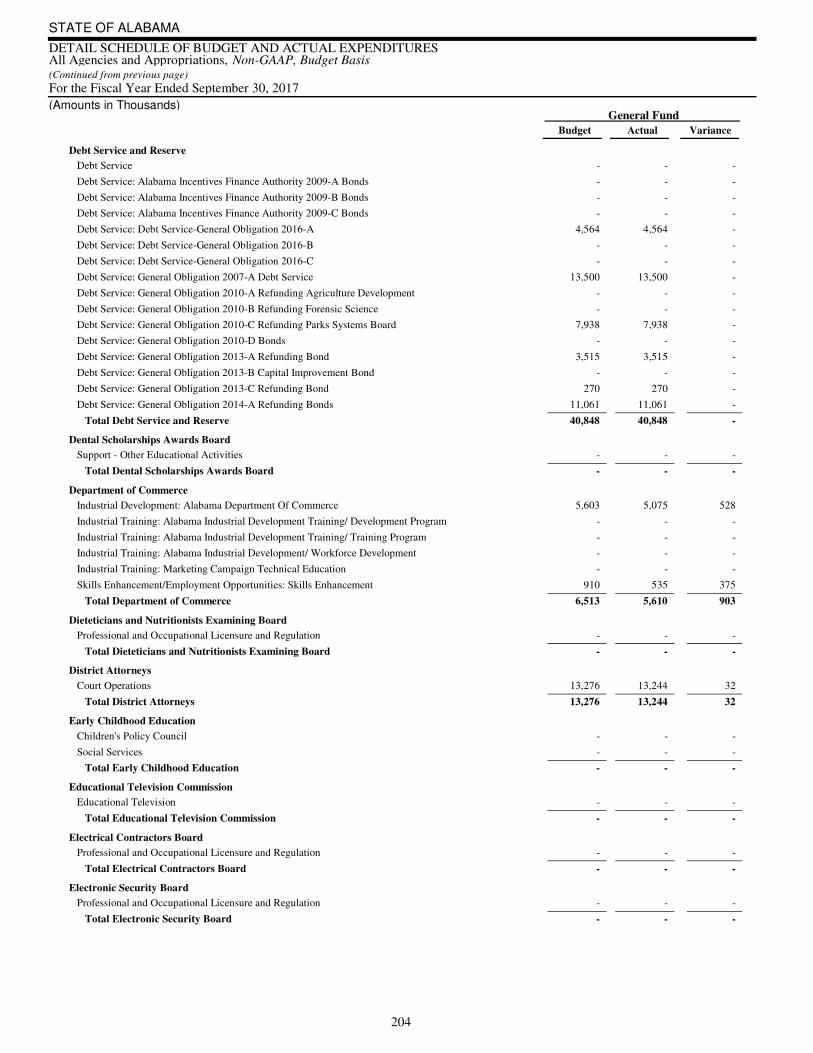
For the Fiscal Year Ended September 30, 2017(Continued from previous page)
STATE OF ALABAMA
DETAIL SCHEDULE OF BUDGET AND ACTUAL EXPENDITURESAll Agencies and Appropriations, Non-GAAP, Budget Basis
(Amounts in Thousands) General Fund
Variance Actual Budget
Debt Service and Reserve
Debt Service - - -
Debt Service: Alabama Incentives Finance Authority 2009-A Bonds - - -
Debt Service: Alabama Incentives Finance Authority 2009-B Bonds - - -
Debt Service: Alabama Incentives Finance Authority 2009-C Bonds - - -
Debt Service: Debt Service-General Obligation 2016-A 4,564 4,564 -
Debt Service: Debt Service-General Obligation 2016-B - - -
Debt Service: Debt Service-General Obligation 2016-C - - -
Debt Service: General Obligation 2007-A Debt Service 13,500 13,500 -
Debt Service: General Obligation 2010-A Refunding Agriculture Development - - -
Debt Service: General Obligation 2010-B Refunding Forensic Science - - -
Debt Service: General Obligation 2010-C Refunding Parks Systems Board 7,938 7,938 -
Debt Service: General Obligation 2010-D Bonds - - -
Debt Service: General Obligation 2013-A Refunding Bond 3,515 3,515 -
Debt Service: General Obligation 2013-B Capital Improvement Bond - - -
Debt Service: General Obligation 2013-C Refunding Bond 270 270 -
Debt Service: General Obligation 2014-A Refunding Bonds 11,061 11,061 -
Total Debt Service and Reserve
40,848 40,848 -
Dental Scholarships Awards Board
Support - Other Educational Activities - - -
Total Dental Scholarships Awards Board
- - -
Department of Commerce
Industrial Development: Alabama Department Of Commerce 5,603 5,075 528
Industrial Training: Alabama Industrial Development Training/ Development Program - - -
Industrial Training: Alabama Industrial Development Training/ Training Program - - -
Industrial Training: Alabama Industrial Development/ Workforce Development - - -
Industrial Training: Marketing Campaign Technical Education - - -
Skills Enhancement/Employment Opportunities: Skills Enhancement 910 535 375
Total Department of Commerce
6,513 5,610 903
Dieteticians and Nutritionists Examining Board
Professional and Occupational Licensure and Regulation - - -
Total Dieteticians and Nutritionists Examining Board
- - -
District Attorneys
Court Operations 13,276 13,244 32
Total District Attorneys
13,276 13,244 32
Early Childhood Education
Children's Policy Council - - -
Social Services - - -
Total Early Childhood Education
- - -
Educational Television Commission
Educational Television - - -
Total Educational Television Commission
- - -
Electrical Contractors Board
Professional and Occupational Licensure and Regulation - - -
Total Electrical Contractors Board
- - -
Electronic Security Board
Professional and Occupational Licensure and Regulation - - -
Total Electronic Security Board
- - -
204
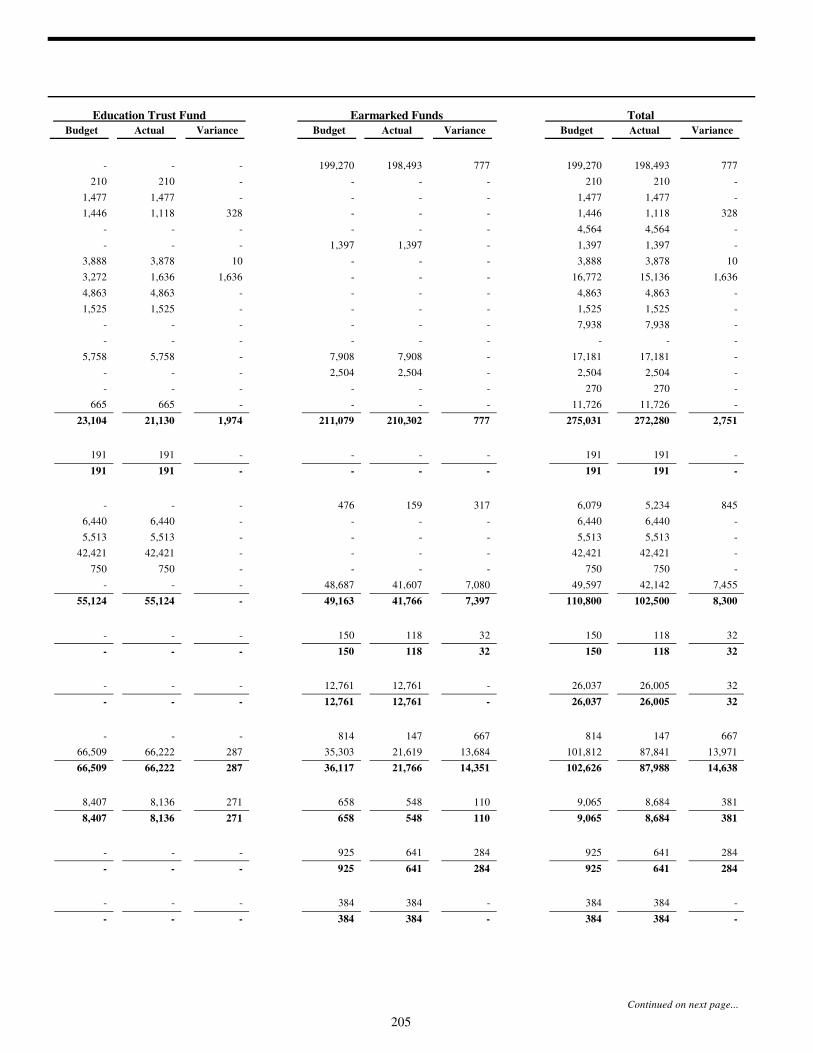
Variance Actual Budget
Education Trust Fund Earmarked Funds Total
Variance Actual Budget Variance Actual Budget
198,493 777199,270198,493 777- - - 199,270
210 - 210- - 210 210 - -
1,477 - 1,477- - 1,477 1,477 - -
1,118 3281,446- - 1,446 1,118 328 -
4,564 - 4,564- - - - - -
1,397 - 1,3971,397 - - - - 1,397
3,878 103,888- - 3,888 3,878 10 -
15,136 1,63616,772- - 3,272 1,636 1,636 -
4,863 - 4,863- - 4,863 4,863 - -
1,525 - 1,525- - 1,525 1,525 - -
7,938 - 7,938- - - - - -
- - - - - - - - -
17,181 - 17,1817,908 - 5,758 5,758 - 7,908
2,504 - 2,5042,504 - - - - 2,504
270 - 270- - - - - -
11,726 - 11,726- - 665 665 - -
272,280 2,751 275,031 211,079 210,302 777 23,104 21,130 1,974
191 - 191- - 191 191 - -
191 - 191 - - - 191 191 -
5,234 8456,079159 317- - - 476
6,440 - 6,440- - 6,440 6,440 - -
5,513 - 5,513- - 5,513 5,513 - -
42,421 - 42,421- - 42,421 42,421 - -
750 - 750- - 750 750 - -
42,142 7,45549,59741,607 7,080- - - 48,687
102,500 8,300 110,800 49,163 41,766 7,397 55,124 55,124 -
118 32150118 32- - - 150
118 32 150 150 118 32 - - -
26,005 3226,03712,761 - - - - 12,761
26,005 32 26,037 12,761 12,761 - - - -
147 667814147 667- - - 814
87,841 13,971101,81221,619 13,68466,509 66,222 287 35,303
87,988 14,638 102,626 36,117 21,766 14,351 66,509 66,222 287
8,684 3819,065548 1108,407 8,136 271 658
8,684 381 9,065 658 548 110 8,407 8,136 271
641 284925641 284- - - 925
641 284 925 925 641 284 - - -
384 - 384384 - - - - 384
384 - 384 384 384 - - - -
Continued on next page...
205

For the Fiscal Year Ended September 30, 2017(Continued from previous page)
STATE OF ALABAMA
DETAIL SCHEDULE OF BUDGET AND ACTUAL EXPENDITURESAll Agencies and Appropriations, Non-GAAP, Budget Basis
(Amounts in Thousands) General Fund
Variance Actual Budget
Endowments
Debt Service: Auburn University Endowment - - -
Debt Service: Grove Hill Endowment - - -
Debt Service: University Of Alabama Endowment - - -
Total Endowments
- - -
Environmental Management
Environmental Management - - -
Total Environmental Management
- - -
ETF Direct Disbursements
Financial Assistance: American Legion Scholarships - - -
Total ETF Direct Disbursements
- - -
Ethics Commission
Regulation of Public Officials and Employees 2,580 1,830 750
Total Ethics Commission
2,580 1,830 750
Finance - Teacher Unused Sick Leave
Employee Benefits - - -
Total Finance - Teacher Unused Sick Leave
- - -
Finance Special Appropriations
Administration Service and Logistical Support: Removal of Prisoners 794 790 4
Criminal Investigation: Arrest of Absconding Felons 25 - 25
Executive Direction: Governors' Widow Retirement 6 - 6
Fiscal Management: Cash Management Improvement Act (CMIA) 95 14 81
Fiscal Management: Employee Suggestion Awards Program 38 1 37
Institutional Service Corrections: Feeding of Prisoners 8,978 8,141 837
Legal Advice And Legal Service: Automatic Appeal Expense 16 - 16
Legal Advice And Legal Service: Court Assessed Cost Not Otherwise Provided 228 180 48
Legal Advice And Legal Service: Law Enforcement Legal Defense 1 - 1
Special Services: Court Assessed Cost Not Otherwise Provided 5,209 5,101 108
Special Services: Election Expenses 6,385 6,384 1
Special Services: Emergency Fund, Departmental 5,627 820 4,807
Special Services: Littleton, Joseph Michael 25 25 -
Special Services: Registration of Voters 4,363 3,561 802
Special Services: Williams, Antonio Shawn 25 25 -
Total Finance Special Appropriations
31,815 25,042 6,773
Finance Special Funds
Appropriation Transfers - - -
Special Services - - -
Total Finance Special Funds
- - -
Forensic Sciences
Forensic Science Services 9,184 9,184 -
Total Forensic Sciences
9,184 9,184 -
Foresters Registration Board
Professional and Occupational Licensure and Regulation - - -
Total Foresters Registration Board
- - -
Forestry Commission
Forest Resources Protection and Development - - -
Total Forestry Commission
- - -
Forever Wild Land Trust
Administrative Services - - -
Total Forever Wild Land Trust
- - -
206
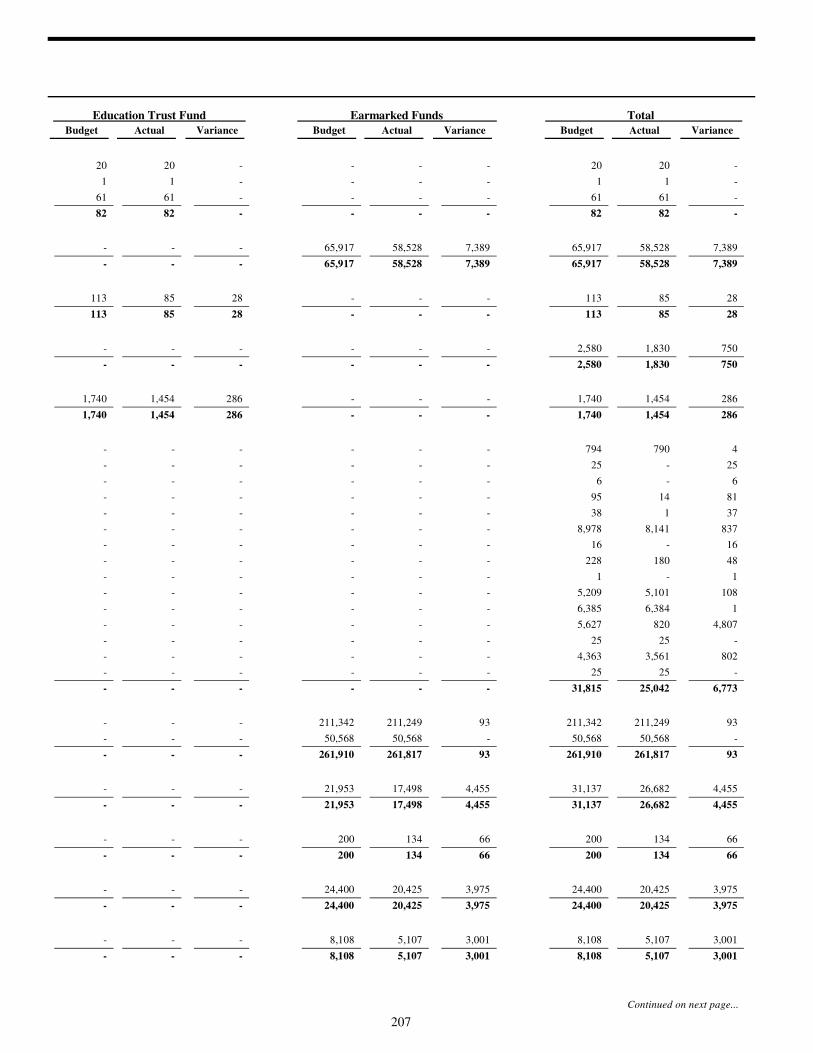
Variance Actual Budget
Education Trust Fund Earmarked Funds Total
Variance Actual Budget Variance Actual Budget
20 - 20- - 20 20 - -
1 - 1- - 1 1 - -
61 - 61- - 61 61 - -
82 - 82 - - - 82 82 -
58,528 7,38965,91758,528 7,389- - - 65,917
58,528 7,389 65,917 65,917 58,528 7,389 - - -
85 28113- - 113 85 28 -
85 28 113 - - - 113 85 28
1,830 7502,580- - - - - -
1,830 750 2,580 - - - - - -
1,454 2861,740- - 1,740 1,454 286 -
1,454 286 1,740 - - - 1,740 1,454 286
790 4794- - - - - -
- 2525- - - - - -
- 66- - - - - -
14 8195- - - - - -
1 3738- - - - - -
8,141 8378,978- - - - - -
- 1616- - - - - -
180 48228- - - - - -
- 11- - - - - -
5,101 1085,209- - - - - -
6,384 16,385- - - - - -
820 4,8075,627- - - - - -
25 - 25- - - - - -
3,561 8024,363- - - - - -
25 - 25- - - - - -
25,042 6,773 31,815 - - - - - -
211,249 93211,342211,249 93- - - 211,342
50,568 - 50,56850,568 - - - - 50,568
261,817 93 261,910 261,910 261,817 93 - - -
26,682 4,45531,13717,498 4,455- - - 21,953
26,682 4,455 31,137 21,953 17,498 4,455 - - -
134 66200134 66- - - 200
134 66 200 200 134 66 - - -
20,425 3,97524,40020,425 3,975- - - 24,400
20,425 3,975 24,400 24,400 20,425 3,975 - - -
5,107 3,0018,1085,107 3,001- - - 8,108
5,107 3,001 8,108 8,108 5,107 3,001 - - -
Continued on next page...
207
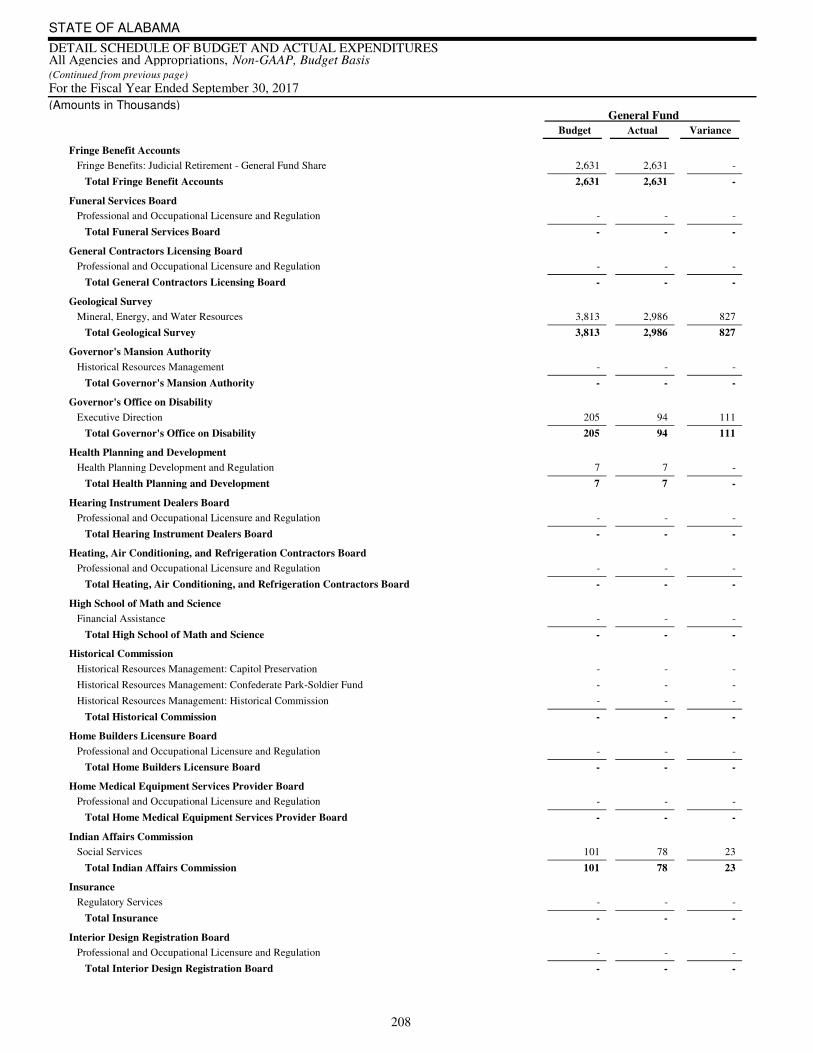
For the Fiscal Year Ended September 30, 2017(Continued from previous page)
STATE OF ALABAMA
DETAIL SCHEDULE OF BUDGET AND ACTUAL EXPENDITURESAll Agencies and Appropriations, Non-GAAP, Budget Basis
(Amounts in Thousands) General Fund
Variance Actual Budget
Fringe Benefit Accounts
Fringe Benefits: Judicial Retirement - General Fund Share 2,631 2,631 -
Total Fringe Benefit Accounts
2,631 2,631 -
Funeral Services Board
Professional and Occupational Licensure and Regulation - - -
Total Funeral Services Board
- - -
General Contractors Licensing Board
Professional and Occupational Licensure and Regulation - - -
Total General Contractors Licensing Board
- - -
Geological Survey
Mineral, Energy, and Water Resources 3,813 2,986 827
Total Geological Survey
3,813 2,986 827
Governor's Mansion Authority
Historical Resources Management - - -
Total Governor's Mansion Authority
- - -
Governor's Office on Disability
Executive Direction 205 94 111
Total Governor's Office on Disability
205 94 111
Health Planning and Development
Health Planning Development and Regulation 7 7 -
Total Health Planning and Development
7 7 -
Hearing Instrument Dealers Board
Professional and Occupational Licensure and Regulation - - -
Total Hearing Instrument Dealers Board
- - -
Heating, Air Conditioning, and Refrigeration Contractors Board
Professional and Occupational Licensure and Regulation - - -
Total Heating, Air Conditioning, and Refrigeration Contractors Board
- - -
High School of Math and Science
Financial Assistance - - -
Total High School of Math and Science
- - -
Historical Commission
Historical Resources Management: Capitol Preservation - - -
Historical Resources Management: Confederate Park-Soldier Fund - - -
Historical Resources Management: Historical Commission - - -
Total Historical Commission
- - -
Home Builders Licensure Board
Professional and Occupational Licensure and Regulation - - -
Total Home Builders Licensure Board
- - -
Home Medical Equipment Services Provider Board
Professional and Occupational Licensure and Regulation - - -
Total Home Medical Equipment Services Provider Board
- - -
Indian Affairs Commission
Social Services 101 78 23
Total Indian Affairs Commission
101 78 23
Insurance
Regulatory Services - - -
Total Insurance
- - -
Interior Design Registration Board
Professional and Occupational Licensure and Regulation - - -
Total Interior Design Registration Board
- - -
208
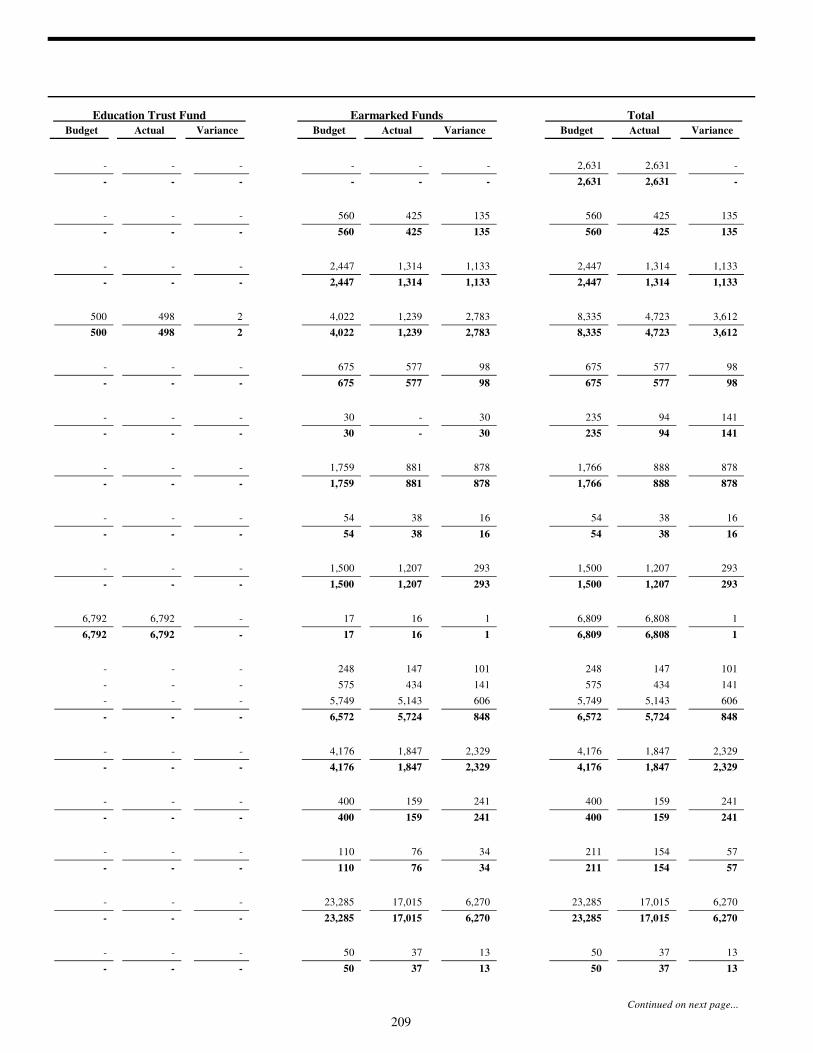
Variance Actual Budget
Education Trust Fund Earmarked Funds Total
Variance Actual Budget Variance Actual Budget
2,631 - 2,631- - - - - -
2,631 - 2,631 - - - - - -
425 135560425 135- - - 560
425 135 560 560 425 135 - - -
1,314 1,1332,4471,314 1,133- - - 2,447
1,314 1,133 2,447 2,447 1,314 1,133 - - -
4,723 3,6128,3351,239 2,783500 498 2 4,022
4,723 3,612 8,335 4,022 1,239 2,783 500 498 2
577 98675577 98- - - 675
577 98 675 675 577 98 - - -
94 141235- 30- - - 30
94 141 235 30 - 30 - - -
888 8781,766881 878- - - 1,759
888 878 1,766 1,759 881 878 - - -
38 165438 16- - - 54
38 16 54 54 38 16 - - -
1,207 2931,5001,207 293- - - 1,500
1,207 293 1,500 1,500 1,207 293 - - -
6,808 16,80916 16,792 6,792 - 17
6,808 1 6,809 17 16 1 6,792 6,792 -
147 101248147 101- - - 248
434 141575434 141- - - 575
5,143 6065,7495,143 606- - - 5,749
5,724 848 6,572 6,572 5,724 848 - - -
1,847 2,3294,1761,847 2,329- - - 4,176
1,847 2,329 4,176 4,176 1,847 2,329 - - -
159 241400159 241- - - 400
159 241 400 400 159 241 - - -
154 5721176 34- - - 110
154 57 211 110 76 34 - - -
17,015 6,27023,28517,015 6,270- - - 23,285
17,015 6,270 23,285 23,285 17,015 6,270 - - -
37 135037 13- - - 50
37 13 50 50 37 13 - - -
Continued on next page...
209

For the Fiscal Year Ended September 30, 2017(Continued from previous page)
STATE OF ALABAMA
DETAIL SCHEDULE OF BUDGET AND ACTUAL EXPENDITURESAll Agencies and Appropriations, Non-GAAP, Budget Basis
(Amounts in Thousands) General Fund
Variance Actual Budget
Interpreters and Transliterators
Professional and Occupational Licensure and Regulation - - -
Total Interpreters and Transliterators
- - -
Judicial Inquiry Commission
Administrative Services 767 621 146
Total Judicial Inquiry Commission
767 621 146
Landscape Architect Examining Board
Professional and Occupational Licensure and Regulation - - -
Total Landscape Architect Examining Board
- - -
Legislative Council
Legislative Operations and Support 1,105 1,023 82
Total Legislative Council
1,105 1,023 82
Legislative Fiscal Office
Legislative Operations and Support 3,474 1,569 1,905
Total Legislative Fiscal Office
3,474 1,569 1,905
Legislative Reference Service
Legislative Operations and Support - - -
Legislative Operations and Support: Legislative Reference Service 1,572 1,328 244
Total Legislative Reference Service
1,572 1,328 244
Lieutenant Governor
Legislative Operations and Support 381 381 -
Total Lieutenant Governor
381 381 -
Liquefied Petroleum Gas Board
Regulatory Services - - -
Total Liquefied Petroleum Gas Board
- - -
Lyman Ward Military Academy
Support - Other Educational Activities - - -
Total Lyman Ward Military Academy
- - -
Manufactured Housing Commission
Regulatory Services - - -
Total Manufactured Housing Commission
- - -
Marine Environmental Sciences Consortium
Support - Other Educational Activities - - -
Total Marine Environmental Sciences Consortium
- - -
Marriage and Family Therapy Board
Professional and Occupational Licensure and Regulation - - -
Total Marriage and Family Therapy Board
- - -
Massage Therapy Board
Professional and Occupational Licensure and Regulation - - -
Total Massage Therapy Board
- - -
Medical Scholarships Awards Board
Support - Other Educational Activities - - -
Total Medical Scholarships Awards Board
- - -
210
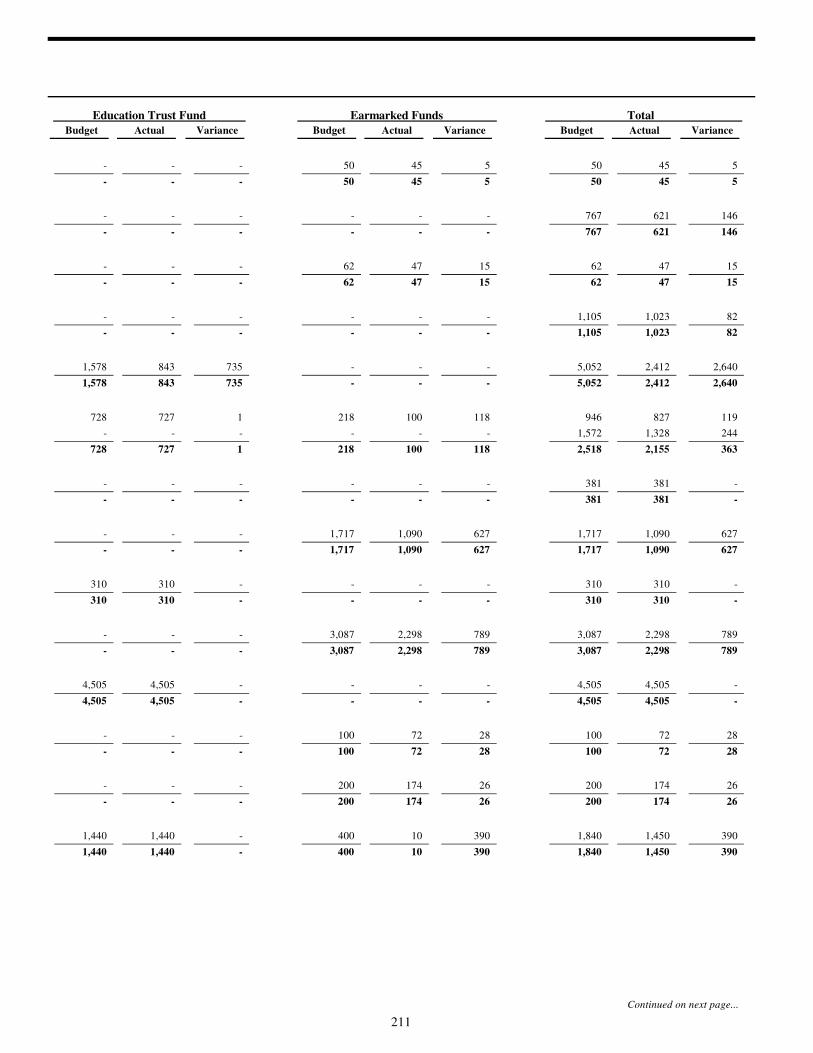
Variance Actual Budget
Education Trust Fund Earmarked Funds Total
Variance Actual Budget Variance Actual Budget
45 55045 5- - - 50
45 5 50 50 45 5 - - -
621 146767- - - - - -
621 146 767 - - - - - -
47 156247 15- - - 62
47 15 62 62 47 15 - - -
1,023 821,105- - - - - -
1,023 82 1,105 - - - - - -
2,412 2,6405,052- - 1,578 843 735 -
2,412 2,640 5,052 - - - 1,578 843 735
827 119946100 118728 727 1 218
1,328 2441,572- - - - - -
2,155 363 2,518 218 100 118 728 727 1
381 - 381- - - - - -
381 - 381 - - - - - -
1,090 6271,7171,090 627- - - 1,717
1,090 627 1,717 1,717 1,090 627 - - -
310 - 310- - 310 310 - -
310 - 310 - - - 310 310 -
2,298 7893,0872,298 789- - - 3,087
2,298 789 3,087 3,087 2,298 789 - - -
4,505 - 4,505- - 4,505 4,505 - -
4,505 - 4,505 - - - 4,505 4,505 -
72 2810072 28- - - 100
72 28 100 100 72 28 - - -
174 26200174 26- - - 200
174 26 200 200 174 26 - - -
1,450 3901,84010 3901,440 1,440 - 400
1,450 390 1,840 400 10 390 1,440 1,440 -
Continued on next page...
211
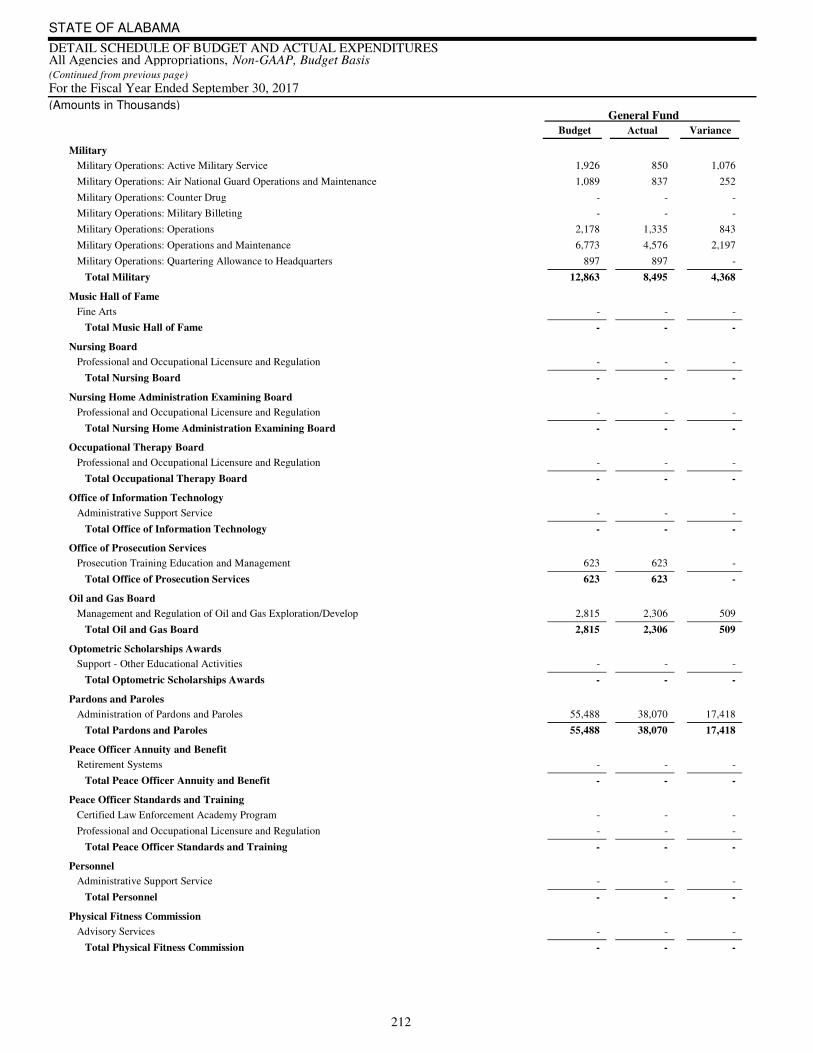
For the Fiscal Year Ended September 30, 2017(Continued from previous page)
STATE OF ALABAMA
DETAIL SCHEDULE OF BUDGET AND ACTUAL EXPENDITURESAll Agencies and Appropriations, Non-GAAP, Budget Basis
(Amounts in Thousands) General Fund
Variance Actual Budget
Military
Military Operations: Active Military Service 1,926 850 1,076
Military Operations: Air National Guard Operations and Maintenance 1,089 837 252
Military Operations: Counter Drug - - -
Military Operations: Military Billeting - - -
Military Operations: Operations 2,178 1,335 843
Military Operations: Operations and Maintenance 6,773 4,576 2,197
Military Operations: Quartering Allowance to Headquarters 897 897 -
Total Military
12,863 8,495 4,368
Music Hall of Fame
Fine Arts - - -
Total Music Hall of Fame
- - -
Nursing Board
Professional and Occupational Licensure and Regulation - - -
Total Nursing Board
- - -
Nursing Home Administration Examining Board
Professional and Occupational Licensure and Regulation - - -
Total Nursing Home Administration Examining Board
- - -
Occupational Therapy Board
Professional and Occupational Licensure and Regulation - - -
Total Occupational Therapy Board
- - -
Office of Information Technology
Administrative Support Service - - -
Total Office of Information Technology
- - -
Office of Prosecution Services
Prosecution Training Education and Management 623 623 -
Total Office of Prosecution Services
623 623 -
Oil and Gas Board
Management and Regulation of Oil and Gas Exploration/Develop 2,815 2,306 509
Total Oil and Gas Board
2,815 2,306 509
Optometric Scholarships Awards
Support - Other Educational Activities - - -
Total Optometric Scholarships Awards
- - -
Pardons and Paroles
Administration of Pardons and Paroles 55,488 38,070 17,418
Total Pardons and Paroles
55,488 38,070 17,418
Peace Officer Annuity and Benefit
Retirement Systems - - -
Total Peace Officer Annuity and Benefit
- - -
Peace Officer Standards and Training
Certified Law Enforcement Academy Program - - -
Professional and Occupational Licensure and Regulation - - -
Total Peace Officer Standards and Training
- - -
Personnel
Administrative Support Service - - -
Total Personnel
- - -
Physical Fitness Commission
Advisory Services - - -
Total Physical Fitness Commission
- - -
212
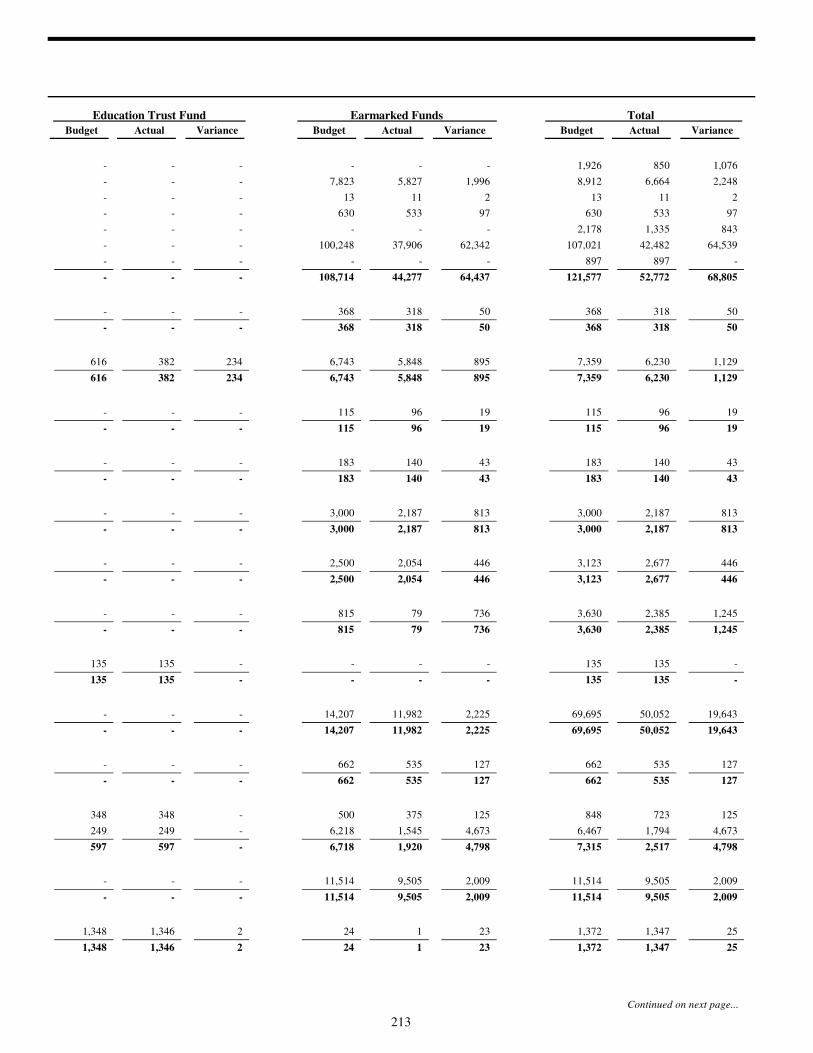
Variance Actual Budget
Education Trust Fund Earmarked Funds Total
Variance Actual Budget Variance Actual Budget
850 1,0761,926- - - - - -
6,664 2,2488,9125,827 1,996- - - 7,823
11 21311 2- - - 13
533 97630533 97- - - 630
1,335 8432,178- - - - - -
42,482 64,539107,02137,906 62,342- - - 100,248
897 - 897- - - - - -
52,772 68,805 121,577 108,714 44,277 64,437 - - -
318 50368318 50- - - 368
318 50 368 368 318 50 - - -
6,230 1,1297,3595,848 895616 382 234 6,743
6,230 1,129 7,359 6,743 5,848 895 616 382 234
96 1911596 19- - - 115
96 19 115 115 96 19 - - -
140 43183140 43- - - 183
140 43 183 183 140 43 - - -
2,187 8133,0002,187 813- - - 3,000
2,187 813 3,000 3,000 2,187 813 - - -
2,677 4463,1232,054 446- - - 2,500
2,677 446 3,123 2,500 2,054 446 - - -
2,385 1,2453,63079 736- - - 815
2,385 1,245 3,630 815 79 736 - - -
135 - 135- - 135 135 - -
135 - 135 - - - 135 135 -
50,052 19,64369,69511,982 2,225- - - 14,207
50,052 19,643 69,695 14,207 11,982 2,225 - - -
535 127662535 127- - - 662
535 127 662 662 535 127 - - -
723 125848375 125348 348 - 500
1,794 4,6736,4671,545 4,673249 249 - 6,218
2,517 4,798 7,315 6,718 1,920 4,798 597 597 -
9,505 2,00911,5149,505 2,009- - - 11,514
9,505 2,009 11,514 11,514 9,505 2,009 - - -
1,347 251,3721 231,348 1,346 2 24
1,347 25 1,372 24 1 23 1,348 1,346 2
Continued on next page...
213
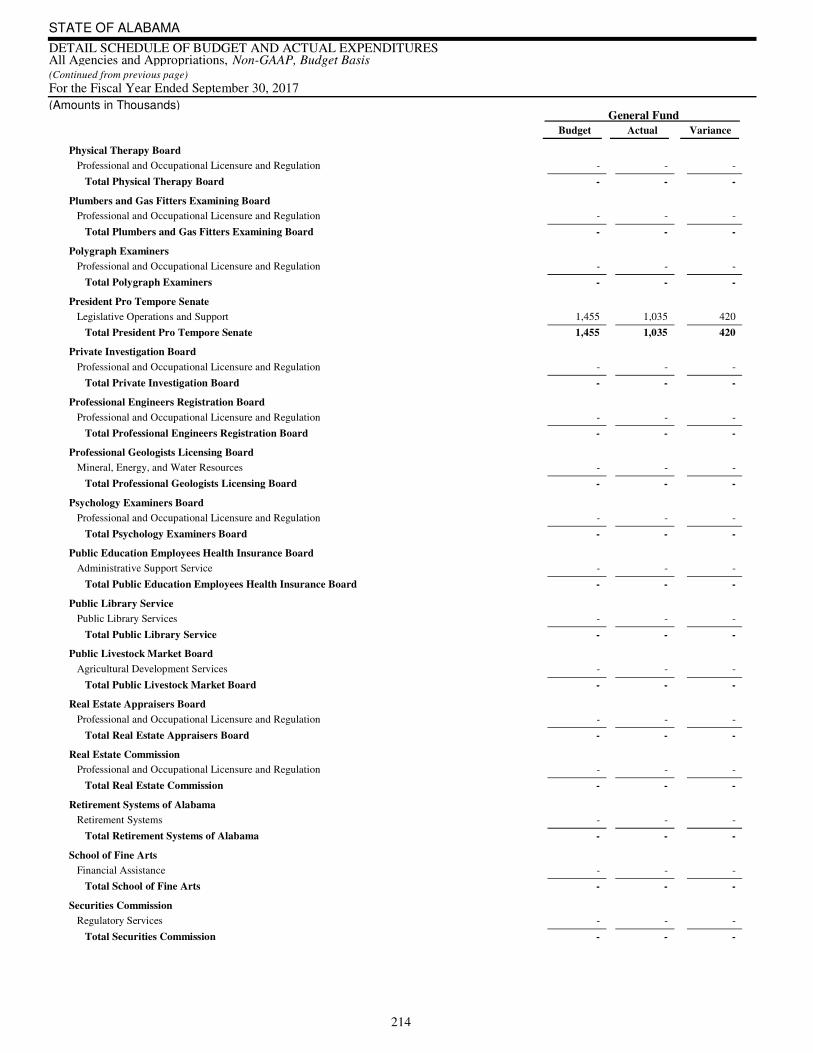
For the Fiscal Year Ended September 30, 2017(Continued from previous page)
STATE OF ALABAMA
DETAIL SCHEDULE OF BUDGET AND ACTUAL EXPENDITURESAll Agencies and Appropriations, Non-GAAP, Budget Basis
(Amounts in Thousands) General Fund
Variance Actual Budget
Physical Therapy Board
Professional and Occupational Licensure and Regulation - - -
Total Physical Therapy Board
- - -
Plumbers and Gas Fitters Examining Board
Professional and Occupational Licensure and Regulation - - -
Total Plumbers and Gas Fitters Examining Board
- - -
Polygraph Examiners
Professional and Occupational Licensure and Regulation - - -
Total Polygraph Examiners
- - -
President Pro Tempore Senate
Legislative Operations and Support 1,455 1,035 420
Total President Pro Tempore Senate
1,455 1,035 420
Private Investigation Board
Professional and Occupational Licensure and Regulation - - -
Total Private Investigation Board
- - -
Professional Engineers Registration Board
Professional and Occupational Licensure and Regulation - - -
Total Professional Engineers Registration Board
- - -
Professional Geologists Licensing Board
Mineral, Energy, and Water Resources - - -
Total Professional Geologists Licensing Board
- - -
Psychology Examiners Board
Professional and Occupational Licensure and Regulation - - -
Total Psychology Examiners Board
- - -
Public Education Employees Health Insurance Board
Administrative Support Service - - -
Total Public Education Employees Health Insurance Board
- - -
Public Library Service
Public Library Services - - -
Total Public Library Service
- - -
Public Livestock Market Board
Agricultural Development Services - - -
Total Public Livestock Market Board
- - -
Real Estate Appraisers Board
Professional and Occupational Licensure and Regulation - - -
Total Real Estate Appraisers Board
- - -
Real Estate Commission
Professional and Occupational Licensure and Regulation - - -
Total Real Estate Commission
- - -
Retirement Systems of Alabama
Retirement Systems - - -
Total Retirement Systems of Alabama
- - -
School of Fine Arts
Financial Assistance - - -
Total School of Fine Arts
- - -
Securities Commission
Regulatory Services - - -
Total Securities Commission
- - -
214
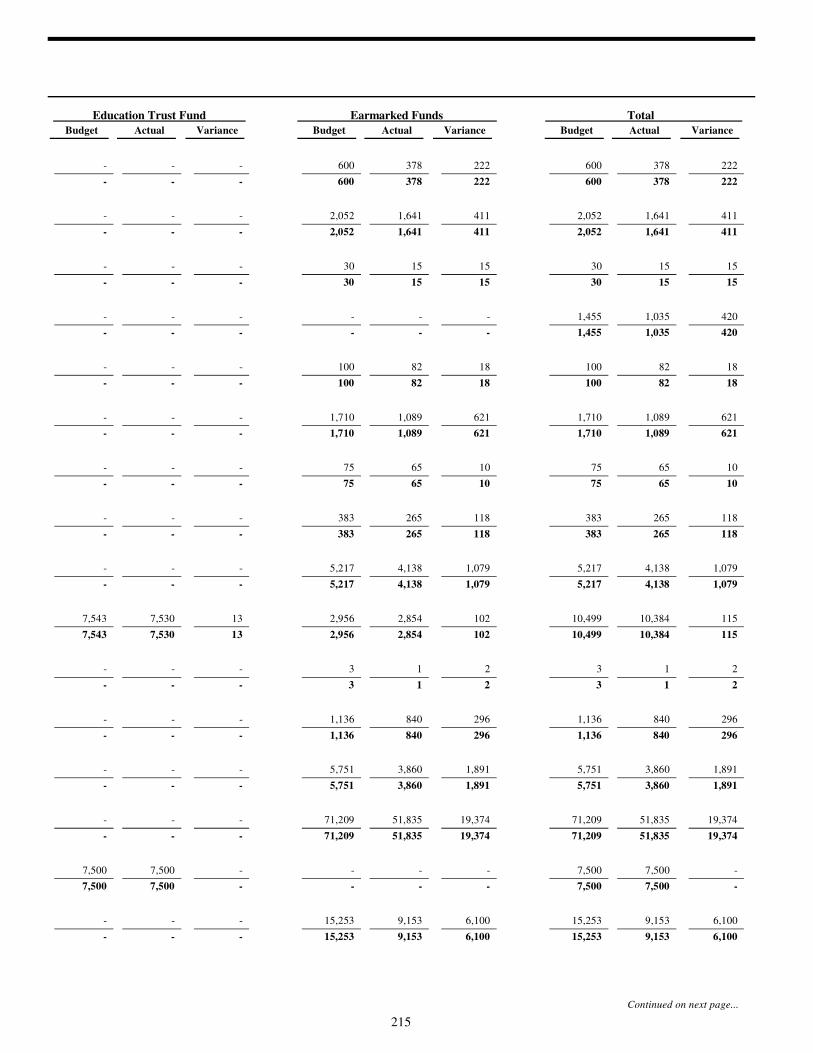
Variance Actual Budget
Education Trust Fund Earmarked Funds Total
Variance Actual Budget Variance Actual Budget
378 222600378 222- - - 600
378 222 600 600 378 222 - - -
1,641 4112,0521,641 411- - - 2,052
1,641 411 2,052 2,052 1,641 411 - - -
15 153015 15- - - 30
15 15 30 30 15 15 - - -
1,035 4201,455- - - - - -
1,035 420 1,455 - - - - - -
82 1810082 18- - - 100
82 18 100 100 82 18 - - -
1,089 6211,7101,089 621- - - 1,710
1,089 621 1,710 1,710 1,089 621 - - -
65 107565 10- - - 75
65 10 75 75 65 10 - - -
265 118383265 118- - - 383
265 118 383 383 265 118 - - -
4,138 1,0795,2174,138 1,079- - - 5,217
4,138 1,079 5,217 5,217 4,138 1,079 - - -
10,384 11510,4992,854 1027,543 7,530 13 2,956
10,384 115 10,499 2,956 2,854 102 7,543 7,530 13
1 231 2- - - 3
1 2 3 3 1 2 - - -
840 2961,136840 296- - - 1,136
840 296 1,136 1,136 840 296 - - -
3,860 1,8915,7513,860 1,891- - - 5,751
3,860 1,891 5,751 5,751 3,860 1,891 - - -
51,835 19,37471,20951,835 19,374- - - 71,209
51,835 19,374 71,209 71,209 51,835 19,374 - - -
7,500 - 7,500- - 7,500 7,500 - -
7,500 - 7,500 - - - 7,500 7,500 -
9,153 6,10015,2539,153 6,100- - - 15,253
9,153 6,100 15,253 15,253 9,153 6,100 - - -
Continued on next page...
215
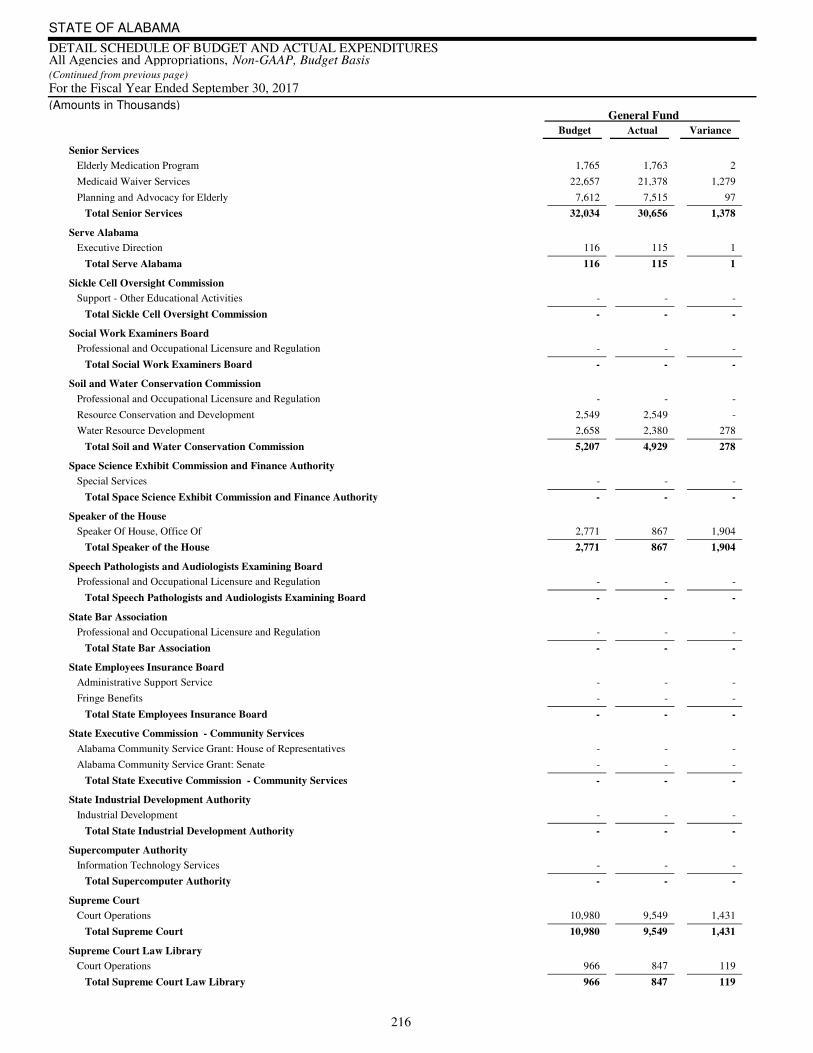
For the Fiscal Year Ended September 30, 2017(Continued from previous page)
STATE OF ALABAMA
DETAIL SCHEDULE OF BUDGET AND ACTUAL EXPENDITURESAll Agencies and Appropriations, Non-GAAP, Budget Basis
(Amounts in Thousands) General Fund
Variance Actual Budget
Senior Services
Elderly Medication Program 1,765 1,763 2
Medicaid Waiver Services 22,657 21,378 1,279
Planning and Advocacy for Elderly 7,612 7,515 97
Total Senior Services
32,034 30,656 1,378
Serve Alabama
Executive Direction 116 115 1
Total Serve Alabama
116 115 1
Sickle Cell Oversight Commission
Support - Other Educational Activities - - -
Total Sickle Cell Oversight Commission
- - -
Social Work Examiners Board
Professional and Occupational Licensure and Regulation - - -
Total Social Work Examiners Board
- - -
Soil and Water Conservation Commission
Professional and Occupational Licensure and Regulation - - -
Resource Conservation and Development 2,549 2,549 -
Water Resource Development 2,658 2,380 278
Total Soil and Water Conservation Commission
5,207 4,929 278
Space Science Exhibit Commission and Finance Authority
Special Services - - -
Total Space Science Exhibit Commission and Finance Authority
- - -
Speaker of the House
Speaker Of House, Office Of 2,771 867 1,904
Total Speaker of the House
2,771 867 1,904
Speech Pathologists and Audiologists Examining Board
Professional and Occupational Licensure and Regulation - - -
Total Speech Pathologists and Audiologists Examining Board
- - -
State Bar Association
Professional and Occupational Licensure and Regulation - - -
Total State Bar Association
- - -
State Employees Insurance Board
Administrative Support Service - - -
Fringe Benefits - - -
Total State Employees Insurance Board
- - -
State Executive Commission - Community Services
Alabama Community Service Grant: House of Representatives - - -
Alabama Community Service Grant: Senate - - -
Total State Executive Commission - Community Services
- - -
State Industrial Development Authority
Industrial Development - - -
Total State Industrial Development Authority
- - -
Supercomputer Authority
Information Technology Services - - -
Total Supercomputer Authority
- - -
Supreme Court
Court Operations 10,980 9,549 1,431
Total Supreme Court
10,980 9,549 1,431
Supreme Court Law Library
Court Operations 966 847 119
Total Supreme Court Law Library
966 847 119
216
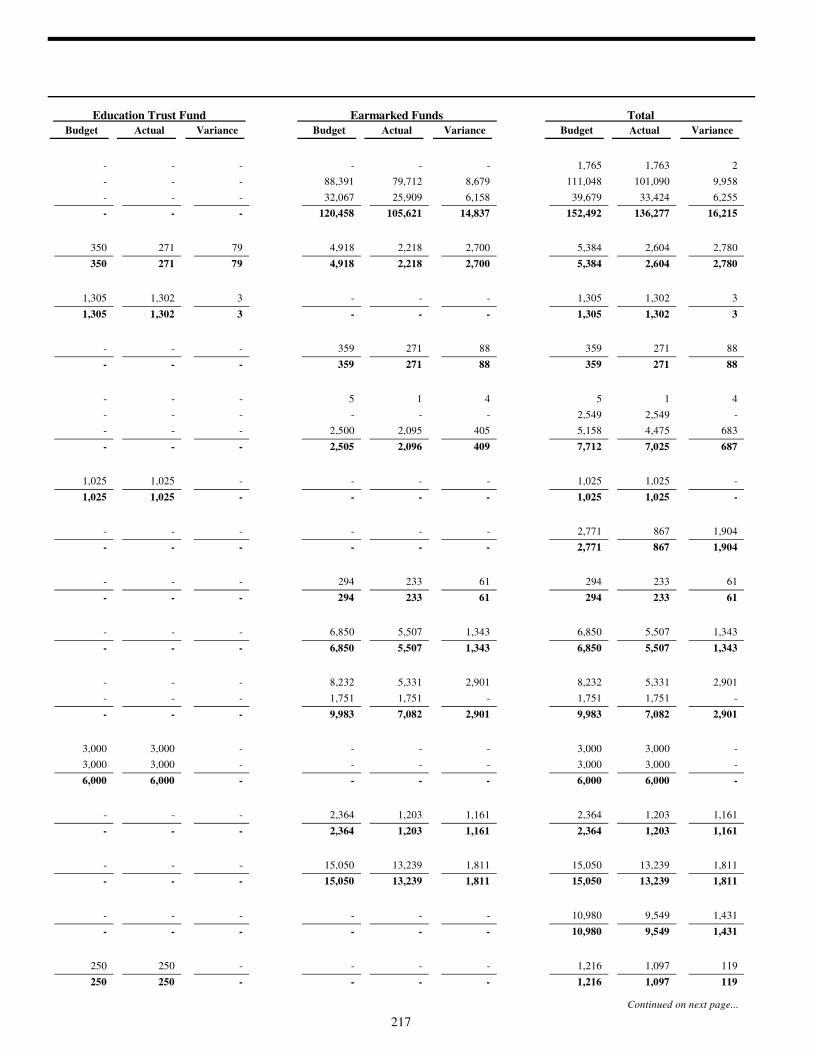
Variance Actual Budget
Education Trust Fund Earmarked Funds Total
Variance Actual Budget Variance Actual Budget
1,763 21,765- - - - - -
101,090 9,958111,04879,712 8,679- - - 88,391
33,424 6,25539,67925,909 6,158- - - 32,067
136,277 16,215 152,492 120,458 105,621 14,837 - - -
2,604 2,7805,3842,218 2,700350 271 79 4,918
2,604 2,780 5,384 4,918 2,218 2,700 350 271 79
1,302 31,305- - 1,305 1,302 3 -
1,302 3 1,305 - - - 1,305 1,302 3
271 88359271 88- - - 359
271 88 359 359 271 88 - - -
1 451 4- - - 5
2,549 - 2,549- - - - - -
4,475 6835,1582,095 405- - - 2,500
7,025 687 7,712 2,505 2,096 409 - - -
1,025 - 1,025- - 1,025 1,025 - -
1,025 - 1,025 - - - 1,025 1,025 -
867 1,9042,771- - - - - -
867 1,904 2,771 - - - - - -
233 61294233 61- - - 294
233 61 294 294 233 61 - - -
5,507 1,3436,8505,507 1,343- - - 6,850
5,507 1,343 6,850 6,850 5,507 1,343 - - -
5,331 2,9018,2325,331 2,901- - - 8,232
1,751 - 1,7511,751 - - - - 1,751
7,082 2,901 9,983 9,983 7,082 2,901 - - -
3,000 - 3,000- - 3,000 3,000 - -
3,000 - 3,000- - 3,000 3,000 - -
6,000 - 6,000 - - - 6,000 6,000 -
1,203 1,1612,3641,203 1,161- - - 2,364
1,203 1,161 2,364 2,364 1,203 1,161 - - -
13,239 1,81115,05013,239 1,811- - - 15,050
13,239 1,811 15,050 15,050 13,239 1,811 - - -
9,549 1,43110,980- - - - - -
9,549 1,431 10,980 - - - - - -
1,097 1191,216- - 250 250 - -
1,097 119 1,216 - - - 250 250 -
Continued on next page...
217

For the Fiscal Year Ended September 30, 2017(Continued from previous page)
STATE OF ALABAMA
DETAIL SCHEDULE OF BUDGET AND ACTUAL EXPENDITURESAll Agencies and Appropriations, Non-GAAP, Budget Basis
(Amounts in Thousands) General Fund
Variance Actual Budget
Surface Mining Commission
Industrial Safety and Accident Prevention - - -
Total Surface Mining Commission
- - -
Tax Tribunal
Administrative Services - - -
Total Tax Tribunal
- - -
Tennessee - Tombigbee Waterway Authority
Water Resource Development 90 90 -
Total Tennessee - Tombigbee Waterway Authority
90 90 -
Tourism
Tourism and Travel Promotion 665 575 90
Total Tourism
665 575 90
Veterans Affairs
Administration of Veterans Affairs 1,842 1,236 606
Student Financial Aid - - -
Veterans Cemetery - - -
Veterans Homes - - -
Total Veterans Affairs
1,842 1,236 606
Veterinarian Medical Examiners Board
Professional and Occupational Licensure and Regulation - - -
Total Veterinarian Medical Examiners Board
- - -
Women's Commission
Employment and Social Opportunities 18 13 5
Total Women's Commission
18 13 5
TOTAL Other 217,136 41,228 258,364
TOTAL EXPENDITURES $ 1,561,969 $ 107,433$ 1,669,402
TRANSFERS OUT:
Education Trust Fund Transfers
Advancement in Tech Fund Transfer - - -
Budget Stabilization Transfer - - -
Child Abuse Board - - -
Historical Commission - - -
Human Resources - - -
Mental Health - - -
PACT Program - - -
Public School Fund Endowment - - -
State Department of Education- Science in Motion - - -
State Law Enforcement - - -
Supercomputer Authority - - -
TOTAL Education Trust Fund Transfers - - -
218

Variance Actual Budget
Education Trust Fund Earmarked Funds Total
Variance Actual Budget Variance Actual Budget
2,546 1,6254,1712,546 1,625- - - 4,171
2,546 1,625 4,171 4,171 2,546 1,625 - - -
731 205936731 205- - - 936
731 205 936 936 731 205 - - -
90 - 90- - - - - -
90 - 90 - - - - - -
18,644 58619,23018,069 496- - - 18,565
18,644 586 19,230 18,565 18,069 496 - - -
6,294 5,44011,7342,565 4,8302,497 2,493 4 7,395
71,759 771,766- - 71,766 71,759 7 -
375 316691375 316- - - 691
56,393 36,41492,80756,393 36,414- - - 92,807
134,821 42,177 176,998 100,893 59,333 41,560 74,263 74,252 11
516 127643516 127- - - 643
516 127 643 643 516 127 - - -
13 2336- 18- - - 18
13 23 36 18 - 18 - - -
1,782,157 334,963 2,117,120 1,573,178 1,284,665 288,513 285,578 280,356 5,222
$22,150,161 $ 2,599,279$24,749,440$16,899,406 $14,415,304 $ 2,484,102$ 6,180,632 $ 6,172,888 $ 7,744
56,387 - 56,387- - 56,387 56,387 - -
59,595 - 59,595- - 59,595 59,595 - -
927 - 927- - 927 927 - -
900 - 900- - 900 900 - -
31,285 - 31,285- - 31,285 31,285 - -
44,946 - 44,946- - 44,946 44,946 - -
63,622 - 63,622- - 63,622 63,622 - -
533 - 533- - 533 533 - -
1,584 - 1,584- - 1,584 1,584 - -
430 - 430- - 430 430 - -
8,821 - 8,821- - 8,821 8,821 - -
269,030 - 269,030 - - - 269,030 269,030 -
Continued on next page...
219
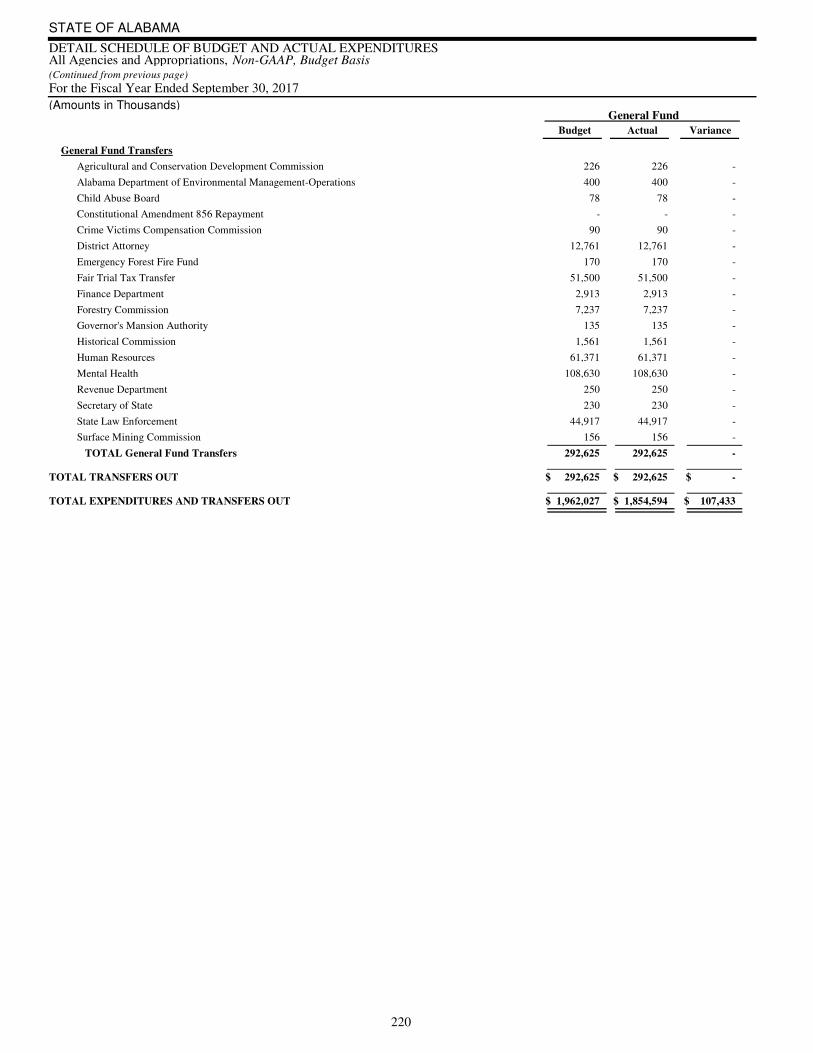
For the Fiscal Year Ended September 30, 2017(Continued from previous page)
STATE OF ALABAMA
DETAIL SCHEDULE OF BUDGET AND ACTUAL EXPENDITURESAll Agencies and Appropriations, Non-GAAP, Budget Basis
(Amounts in Thousands) General Fund
Variance Actual Budget
General Fund Transfers
Agricultural and Conservation Development Commission 226 226 -
Alabama Department of Environmental Management-Operations 400 400 -
Child Abuse Board 78 78 -
Constitutional Amendment 856 Repayment - - -
Crime Victims Compensation Commission 90 90 -
District Attorney 12,761 12,761 -
Emergency Forest Fire Fund 170 170 -
Fair Trial Tax Transfer 51,500 51,500 -
Finance Department 2,913 2,913 -
Forestry Commission 7,237 7,237 -
Governor's Mansion Authority 135 135 -
Historical Commission 1,561 1,561 -
Human Resources 61,371 61,371 -
Mental Health 108,630 108,630 -
Revenue Department 250 250 -
Secretary of State 230 230 -
State Law Enforcement 44,917 44,917 -
Surface Mining Commission 156 156 -
TOTAL General Fund Transfers 292,625 - 292,625
TOTAL TRANSFERS OUT $ 292,625 $ - $ 292,625
TOTAL EXPENDITURES AND TRANSFERS OUT $ 1,854,594 $ 107,433$ 1,962,027
220

Variance Actual Budget
Education Trust Fund Earmarked Funds Total
Variance Actual Budget Variance Actual Budget
226 - 226- - - - - -
400 - 400- - - - - -
78 - 78- - - - - -
- - - - - - - - -
90 - 90- - - - - -
12,761 - 12,761- - - - - -
170 - 170- - - - - -
51,500 - 51,500- - - - - -
2,913 - 2,913- - - - - -
7,237 - 7,237- - - - - -
135 - 135- - - - - -
1,561 - 1,561- - - - - -
61,371 - 61,371- - - - - -
108,630 - 108,630- - - - - -
250 - 250- - - - - -
230 - 230- - - - - -
44,917 - 44,917- - - - - -
156 - 156- - - - - -
292,625 - 292,625 - - - - - -
$ 561,655 $ - $ 561,655$ - $ - $ - $ 269,030 $ 269,030 $ -
$22,711,816 $ 2,599,279$25,311,095$ 6,441,918 $ 7,744$ 6,449,662 $14,415,304 $ 2,484,102$16,899,406
221

STATE OF ALABAMA
SCHEDULE OF REVENUES BY PRINCIPAL SOURCES
Governmental Funds in State Treasury - Cash Basis, Transfers Excluded
For the Fiscal Year Ended September 30, 2017
(Amounts in Thousands)
TAXES
General Sales Tax (4% on gross retail sale of merchandise) 2,277,526$ 11.0%
General Use Tax 399,035 1.9%
Income Tax (2% to 5% personal income, 6.5% net corporate income) 3,941,573 19.0%
Property Tax Relief (represents portion of Income Tax used to offset
property taxes lost in certain funds due to homestead exemptions) 51,707 0.2%
General Property Tax (6 1/2 mills for state on varying
rates not over 30%) 349,686 1.7%
Gasoline Taxes (16¢ per gallon; 3¢ aviation; 1¢ jet) 432,214 2.1%
Utilities Tax (6% telephone, 4% other) 402,879 1.9%
Insurance Premium Tax (1% to 6%) 341,082 1.6%
Liquor & Wine Tax (totals 56%, collected by ABC stores) 132,629 0.6%
Tobacco & Cigarette Taxes (21.25 mills per cigarette; varying
amounts on cigars, smoking tobacco, snuff, etc.) 187,374 0.9%
Corporation Taxes (privilege, 25¢ to $1.75 per $1,000 net worth;
permit, entrance fees for filing) 108,913 0.5%
State Beer Tax (5¢ per 12 oz.) 55,580 0.3%
Public Utilities (2.2%) 151,165 0.7%
Motor Fuel Tax (diesel 17¢ per gallon) 148,237 0.7%
Tennessee Valley Authority (payments in-lieu of all state taxes) 87,706 0.4%
Leasing / Renting Tangible Personal Property - (4% most items,
1.5% vehicles, 2% garments) 77,298 0.4%
Production Privilege Tax (Oil & Gas Severance at amounts varying 2-8%) 44,131 0.2%
Financial Institutions Excise Tax (6.5% of net income of
banks and other financial institutions) 50,781 0.2%
Documentary Filing Taxes (auto title, deed, mortgage, securities, etc) 72,716 0.3%
Coal Severance Tax (33.5¢ per ton) 4,050 0.0%
Forestry Severance Tax 6,323 0.0%
Contractors Gross Receipts Tax (5% of gross receipts) 41,049 0.2%
Lodgings Tax (4% or 5% of charge) 68,973 0.3%
Hydroelectric Companies (tax on 2/5 mill per
kilowatt hour and 2.2% per dollar gross receipts) 1,128 0.0%
Lubricating Oil Tax (6¢ per gallon) 1,756 0.0%
Pari-mutuel Betting (1 or 2% on pari-mutuel pools) 1,226 0.0%
Court Cost Taxes 22,887 0.1%
Medicaid Taxes 377,704 1.8%
Cellular Telephones (6%) 45,051 0.2%Ground Materials Severance Tax 0 0.0%
Vapor Products 1,362 0.0%Hazardous Waste 0 0.0%Miscellaneous Taxes 18,643 0.1%
TOTAL TAXES 9,902,384 47.5%
222
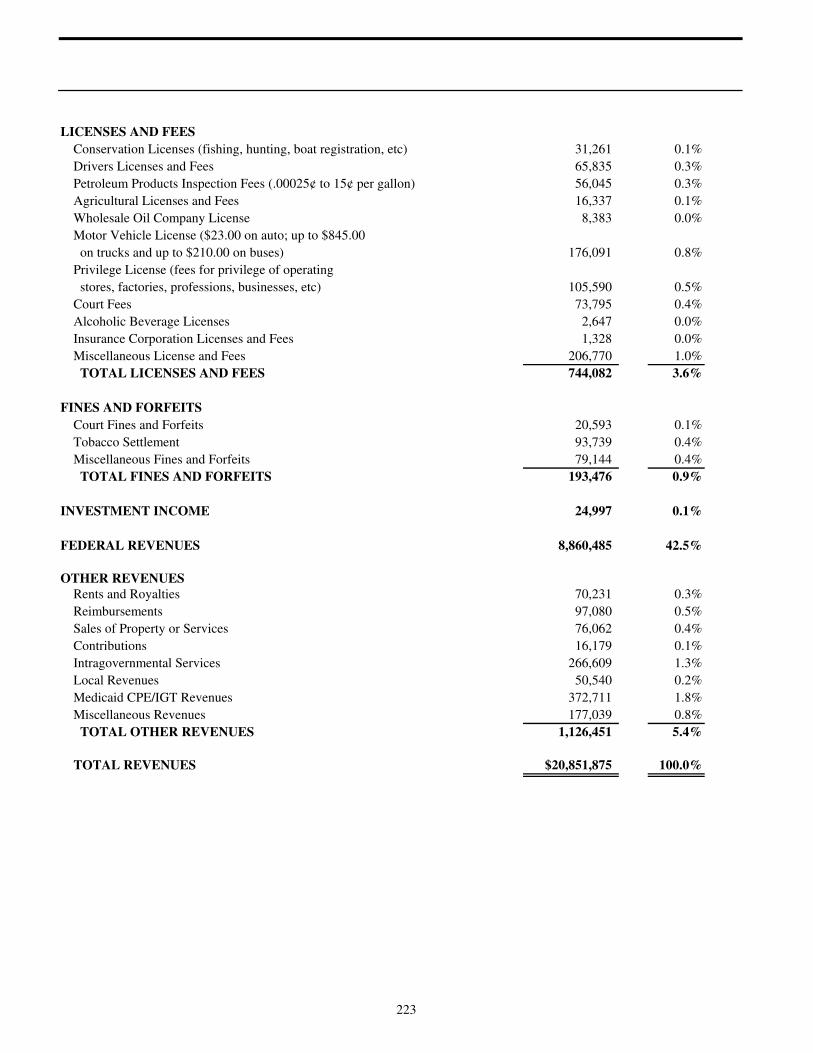
LICENSES AND FEES
Conservation Licenses (fishing, hunting, boat registration, etc) 31,261 0.1%
Drivers Licenses and Fees 65,835 0.3%
Petroleum Products Inspection Fees (.00025¢ to 15¢ per gallon) 56,045 0.3%
Agricultural Licenses and Fees 16,337 0.1%
Wholesale Oil Company License 8,383 0.0%
Motor Vehicle License ($23.00 on auto; up to $845.00
on trucks and up to $210.00 on buses) 176,091 0.8%
Privilege License (fees for privilege of operating
stores, factories, professions, businesses, etc) 105,590 0.5%
Court Fees 73,795 0.4%
Alcoholic Beverage Licenses 2,647 0.0%
Insurance Corporation Licenses and Fees 1,328 0.0%
Miscellaneous License and Fees 206,770 1.0%
TOTAL LICENSES AND FEES 744,082 3.6%
FINES AND FORFEITS
Court Fines and Forfeits 20,593 0.1%
Tobacco Settlement 93,739 0.4%
Miscellaneous Fines and Forfeits 79,144 0.4%
TOTAL FINES AND FORFEITS 193,476 0.9%
INVESTMENT INCOME 24,997 0.1%
FEDERAL REVENUES 8,860,485 42.5%
OTHER REVENUES
Rents and Royalties 70,231 0.3%
Reimbursements 97,080 0.5%
Sales of Property or Services 76,062 0.4%
Contributions 16,179 0.1%
Intragovernmental Services 266,609 1.3%
Local Revenues 50,540 0.2%
Medicaid CPE/IGT Revenues 372,711 1.8%
Miscellaneous Revenues 177,039 0.8%
TOTAL OTHER REVENUES 1,126,451 5.4%
TOTAL REVENUES $20,851,875 100.0%
223

STATE OF ALABAMA
SCHEDULE OF REVENUES BY PRINCIPAL SOURCES AND DISTRIBUTIONS OF REVENUESGovernmental Funds in State Treasury - Cash Basis, Transfers Excluded
For the Fiscal Year Ended September 30, 2017
(Amounts in Thousands)Admin- Human Public
Total istrative Net Resources General School Education AlabamaRevenues Expense Revenues Funds Fund Fund Trust Fund Trust Fund
TAXESGeneral Sales Tax 2,277,526$ 67,732$ 2,209,794$ 60,229$ 122,469$ 0$ 1,811,654$ 0$
General Use Tax 399,035 3,986 395,049 500 228,384 - 165,058 -
Income Tax 3,941,573 49,047 3,892,526 - - - 3,892,526 -
Property Tax Relief 51,707 - 51,707 7,637 21,160 22,910 - -
General Property Tax 349,686 5,463 344,223 52,037 133,270 158,916 - -
Gasoline Taxes 432,214 12,672 419,542 - - - - -
Utilities Tax 402,879 313 402,566 - - - 387,966 -
Insurance Premium Tax 341,082 - 341,082 - 304,909 - 30,993 -
Liquor & Wine Tax 132,629 - 132,629 47,568 66,322 - - -
Tobacco & Cigarette Taxes 187,374 441 186,933 2,644 172,534 - - -
Corporation Taxes 108,913 - 108,913 - 70,000 - - -
State Beer Tax 55,580 - 55,580 11,116 16,674 - 22,232 -
Public Utilities 151,165 - 151,165 - 23,199 - - -
Motor Fuel Tax 148,237 1,360 146,877 - - - - -
Tennessee Valley Authority 87,706 - 87,706 - - - - -
Leasing/Renting Personal Property 77,298 - 77,298 - 77,298 - - -
Production Privilege Tax 44,131 - 44,131 - 33,943 - - -
Financial Institutions Excise Tax 50,781 131 50,650 - 27,634 - - -
Documentary Filing Taxes 72,716 264 72,452 - 72,452 - - -
Coal Severance Tax 4,050 - 4,050 - - - - -
Forestry Severance Tax 6,323 291 6,032 - - - - -
Contractors Gross Receipts Tax 41,049 37 41,012 6,142 - - - -
Lodgings Tax 68,973 37 68,936 - 49,851 - - -
Hydroelectric Companies 1,128 - 1,128 - - - 474 -
Lubricating Oil Tax 1,756 13 1,743 - 585 - - -
Pari-mutuel Betting 1,226 - 1,226 - 1,226 - - -
Court Cost Taxes 22,887 - 22,887 - 7,161 - - -
Medicaid Provider Taxes 377,704 224 377,480 - - - - -
Cellular Telephone Tax 45,051 - 45,051 - 27,308 - 15,904 -
Vapor Products 1,362 - 1,362 - 1,362 - - -
Miscellaneous Taxes 18,643 318 18,325 - 4,980 - - -
TOTAL TAXES 9,902,384 142,329 9,760,055 187,873 1,462,721 181,826 6,326,807 0
LICENSES AND FEESConservation Licenses 31,261 - 31,261 - - - - -
Drivers Licenses and Fees 65,835 - 65,835 - 33,264 - - -
Petroleum Products Inspection Fee 56,045 - 56,045 - - - - -
Agricultural License and Fees 16,337 - 16,337 - - 18 - -
Wholesale Oil Company License 8,383 - 8,383 - 8,383 - - -
Motor Vehicle License 176,091 9,429 166,662 - 45,144 - - -
Privilege License 105,590 1,905 103,685 - 19,057 - 87 -
Court Fees 73,795 - 73,795 - 41,846 - - -
Alcoholic Beverage Licenses 2,647 - 2,647 - 2,647 - - -
Insurance Corp Licenses and Fees 1,328 - 1,328 - 606 - - -
Miscellaneous License and Fees 206,770 630 206,140 465 9,248 - 26 -
TOTAL LICENSES AND FEES 744,082 11,964 732,118 465 160,195 18 113 0
FINES AND FORFEITSCourt Fines and Forfeits 20,593 - 20,593 - 13,154 - - -
Tobacco Settlement 93,739 - 93,739 - 1 - - -
Miscellaneous Fines and Forfeits 79,144 1,050 78,094 3 59,164 - - 31
TOTAL FINES AND FORFEITS 193,476 1,050 192,426 3 72,319 - 0 31
INVESTMENT INCOME 24,997 - 24,997 - 13,562 - - 777
FEDERAL REVENUES 8,860,485 - 8,860,485 1,541,781 70 - - - Medicaid CPE/IGT Revenues 372,711 - 372,711 - - - - -
Miscellaneous Revenues 753,740 7,498 746,242 1,617 665 290 281 47,222
TOTAL REVENUES 20,851,875$ 162,841$ 20,689,034$ 1,731,739$ 1,709,532$ 182,134$ 6,327,201$ 48,030$
224
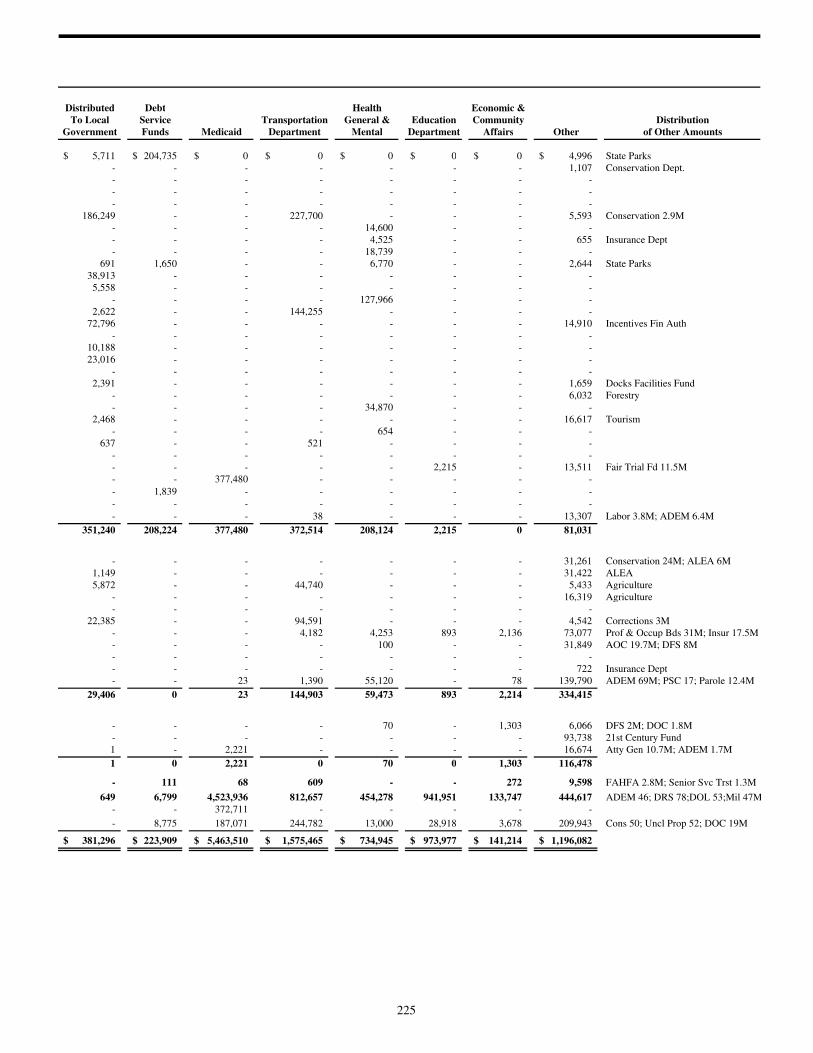
Distributed Debt Health Economic &To Local Service Transportation General & Education Community Distribution
Government Funds Medicaid Department Mental Department Affairs Other of Other Amounts
5,711$ 204,735$ 0$ 0$ 0$ 0$ 0$ 4,996$ State Parks
- - - - - - - 1,107 Conservation Dept.
- - - - - - - -
- - - - - - - -
- - - - - - - -
186,249 - - 227,700 - - - 5,593 Conservation 2.9M
- - - - 14,600 - - -
- - - - 4,525 - - 655 Insurance Dept
- - - - 18,739 - - -
691 1,650 - - 6,770 - - 2,644 State Parks
38,913 - - - - - - -
5,558 - - - - - - -
- - - - 127,966 - - -
2,622 - - 144,255 - - - -
72,796 - - - - - - 14,910 Incentives Fin Auth
- - - - - - - -
10,188 - - - - - - -
23,016 - - - - - - -
- - - - - - - -
2,391 - - - - - - 1,659 Docks Facilities Fund
- - - - - - - 6,032 Forestry
- - - - 34,870 - - -
2,468 - - - - - - 16,617 Tourism
- - - - 654 - - -
637 - - 521 - - - -
- - - - - - - -
- - - - - 2,215 - 13,511 Fair Trial Fd 11.5M
- - 377,480 - - - - -
- 1,839 - - - - - -
- - - - - - - -
- - - 38 - - - 13,307 Labor 3.8M; ADEM 6.4M
351,240 208,224 377,480 372,514 208,124 2,215 0 81,031
- - - - - - - 31,261 Conservation 24M; ALEA 6M
1,149 - - - - - - 31,422 ALEA
5,872 - - 44,740 - - - 5,433 Agriculture
- - - - - - - 16,319 Agriculture
- - - - - - - -
22,385 - - 94,591 - - - 4,542 Corrections 3M
- - - 4,182 4,253 893 2,136 73,077 Prof & Occup Bds 31M; Insur 17.5M
- - - - 100 - - 31,849 AOC 19.7M; DFS 8M
- - - - - - - -
- - - - - - - 722 Insurance Dept
- - 23 1,390 55,120 - 78 139,790 ADEM 69M; PSC 17; Parole 12.4M
29,406 0 23 144,903 59,473 893 2,214 334,415
- - - - 70 - 1,303 6,066 DFS 2M; DOC 1.8M
- - - - - - - 93,738 21st Century Fund
1 - 2,221 - - - - 16,674 Atty Gen 10.7M; ADEM 1.7M
1 0 2,221 0 70 0 1,303 116,478
- 111 68 609 - - 272 9,598 FAHFA 2.8M; Senior Svc Trst 1.3M
649 6,799 4,523,936 812,657 454,278 941,951 133,747 444,617 ADEM 46; DRS 78;DOL 53;Mil 47M
- - 372,711 - - - - -
- 8,775 187,071 244,782 13,000 28,918 3,678 209,943 Cons 50; Uncl Prop 52; DOC 19M
381,296$ 223,909$ 5,463,510$ 1,575,465$ 734,945$ 973,977$ 141,214$ 1,196,082$
225

226
Nonmajor Enterprise FundsNonmajor Enterprise Funds are used to account for the operations of State funds that provide goods and services to external users in a manner similar to private business enterprises. The cost of providing the goods or services are recovered primarily through user charges.
State Insurance Fund
Accounts for resources used to provide insurance coverage for State buildings, school buildings, and their contents.
Fire College and Personnel Standards Commission
Develops and delivers training courses and administers the process of fire service certification in the state.
Alabama Health Insurance Plan
Provides health insurance coverage for citizens who have lost their group health insurance.
Motor Sports Hall Of Fame
Operates a public exhibit displaying the history of automotive racing and other motor sports.
Corrections Canteen
Accounts for the activity of the canteen funds of the Department of Corrections.
Military Department
Accounts for the Military Department's billeting activity and the canteen funds for the National Guard.
227
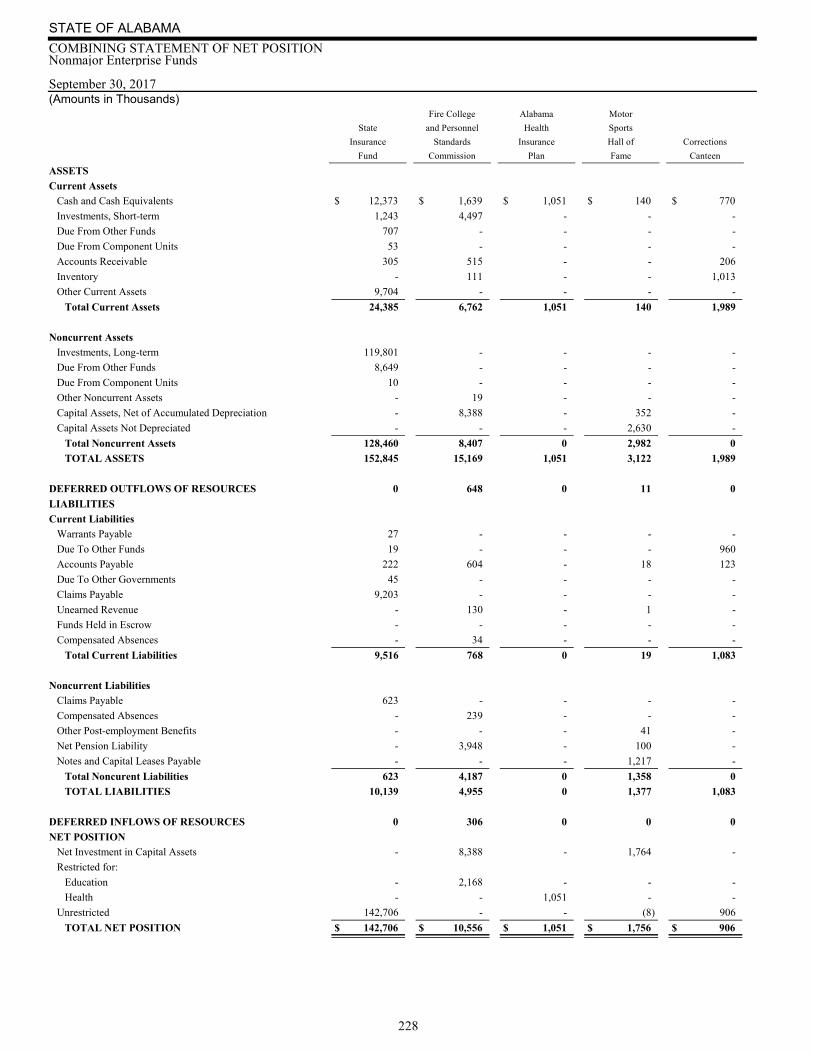
September 30, 2017 (Amounts in Thousands)
STATE OF ALABAMA
COMBINING STATEMENT OF NET POSITIONNonmajor Enterprise Funds
Fire College Alabama Motor
State and Personnel Health Sports
Insurance Standards Insurance Hall of Corrections
Fund Commission Plan Fame Canteen
ASSETS
Current Assets
Cash and Cash Equivalents $ 12,373 $ 1,639 $ 1,051 $ 140 $ 770
Investments, Short-term 1,243 4,497 - - -
Due From Other Funds 707 - - - -
Due From Component Units 53 - - - -
Accounts Receivable 305 515 - - 206
Inventory - 111 - - 1,013
Other Current Assets 9,704 - - - -
Total Current Assets 24,385 6,762 1,051 140 1,989
Noncurrent Assets
Investments, Long-term 119,801 - - - -
Due From Other Funds 8,649 - - - -
Due From Component Units 10 - - - -
Other Noncurrent Assets - 19 - - -
Capital Assets, Net of Accumulated Depreciation - 8,388 - 352 -
Capital Assets Not Depreciated - - - 2,630 -
Total Noncurrent Assets 128,460 8,407 0 2,982 0
TOTAL ASSETS 152,845 15,169 1,051 3,122 1,989
DEFERRED OUTFLOWS OF RESOURCES 0 648 0 11 0
LIABILITIES
Current Liabilities
Warrants Payable 27 - - - -
Due To Other Funds 19 - - - 960
Accounts Payable 222 604 - 18 123
Due To Other Governments 45 - - - -
Claims Payable 9,203 - - - -
Unearned Revenue - 130 - 1 -
Funds Held in Escrow - - - - -
Compensated Absences - 34 - - -
Total Current Liabilities 9,516 768 0 19 1,083
Noncurrent Liabilities
Claims Payable 623 - - - -
Compensated Absences - 239 - - -
Other Post-employment Benefits - - - 41 -
Net Pension Liability - 3,948 - 100 -
Notes and Capital Leases Payable - - - 1,217 -
Total Noncurent Liabilities 623 4,187 0 1,358 0
TOTAL LIABILITIES 10,139 4,955 0 1,377 1,083
DEFERRED INFLOWS OF RESOURCES 0 306 0 0 0
NET POSITION
Net Investment in Capital Assets - 8,388 - 1,764 -
Restricted for:
Education - 2,168 - - -
Health - - 1,051 - -
Unrestricted 142,706 - - (8) 906
TOTAL NET POSITION $ 142,706 $ 10,556 $ 1,051 $ 1,756 $ 906
228

Military
Department Totals
$ 4,073 $ 20,046
- 5,740
- 707
- 53
4 1,030
186 1,310
- 9,704
4,263 38,590
- 119,801
- 8,649
- 10
- 19
979 9,719
- 2,630
979 140,828
5,242 179,418
31 690
- 27
2 981
78 1,045
2 47
- 9,203
- 131
1,639 1,639
1 35
1,722 13,108
- 623
15 254
257 298
253 4,301
- 1,217
525 6,693
2,247 19,801
2 308
979 11,131
- 2,168
- 1,051
2,045 145,649
$ 3,024 $ 159,999
229

For the Fiscal Year Ended September 30, 2017 (Amounts in Thousands)
STATE OF ALABAMA
COMBINING STATEMENT OF REVENUES, EXPENSES, AND CHANGES IN NET POSITIONNonmajor Enterprise Funds
Fire College Alabama Motor
State and Personnel Health Sports
Insurance Standards Insurance Hall of Corrections
Fund Commission Plan Fame Canteen
OPERATING REVENUES Charges for Goods and Services $ 0 $ 2,748 $ 0 $ 0 $ 27,594
Premiums and Contributions 51,150 - - - -
Rents and Leases - - - 158 -
Total Operating Revenues 51,150 2,748 0 158 27,594
OPERATING EXPENSES Salaries, Wages, and Benefits - 5,118 - 131 -
Utilities and Communications - 103 - - -
Professional Services 3,354 - - 4 -
Supplies, Materials, and Operating Expense 20,273 2,612 - 1 15,954
Depreciation - 590 - 57 -
Claims and Benefits 12,208 - - - -
Other - - - 68 -
Total Operating Expenses 35,835 8,423 0 261 15,954
Operating Income (Loss) 15,315 (5,675) 0 (103) 11,640
NONOPERATING REVENUES (EXPENSES) Grants - 961 - 6 -
Investment Income 9,565 53 - - -
Other Nonoperating Revenues - 39 - 229 -
Interest Expense - - - (66) -
Other Nonoperating Expenses (521) - - - -
Total Nonoperating Revenues (Expenses) 9,044 1,053 0 169 0
Income (Loss) Before Contributions and Transfers 24,359 (4,622) 0 66 11,640
Capital Contributions - 125 - - -
Transfers In - 4,233 - - -
Transfers Out - - - - (11,744)
Increase (Decrease) in Net Position 24,359 (264) 0 66 (104)Total Net Position, October 1, 2016, as Restated 118,347 10,820 1,051 1,690 1,010
Total Net Position, September 30, 2017 $ 142,706 $ 10,556 $ 1,051 $ 1,756 $ 906
230
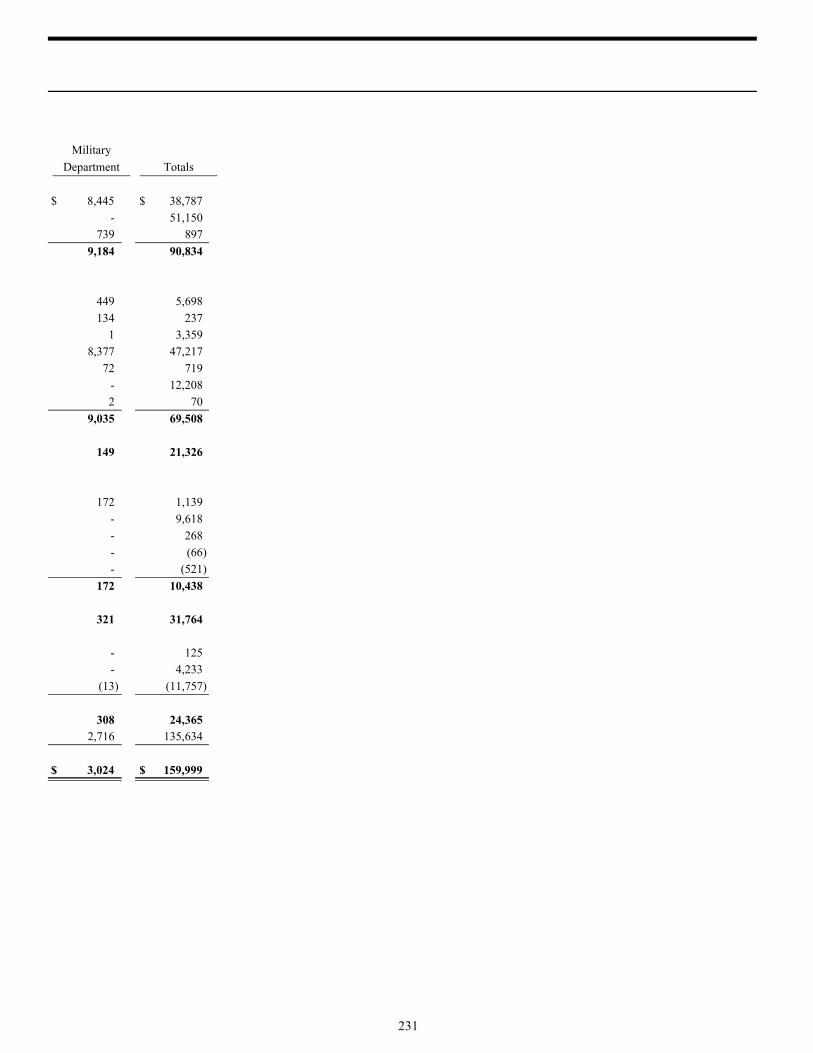
Military
Department Totals
$ 8,445 $ 38,787
- 51,150
739 897
9,184 90,834
449 5,698
134 237
1 3,359
8,377 47,217
72 719
- 12,208
2 70
9,035 69,508
149 21,326
172 1,139
- 9,618
- 268
- (66)
- (521)
172 10,438
321 31,764
- 125
- 4,233
(13) (11,757)
308 24,365 2,716 135,634
$ 3,024 $ 159,999
231
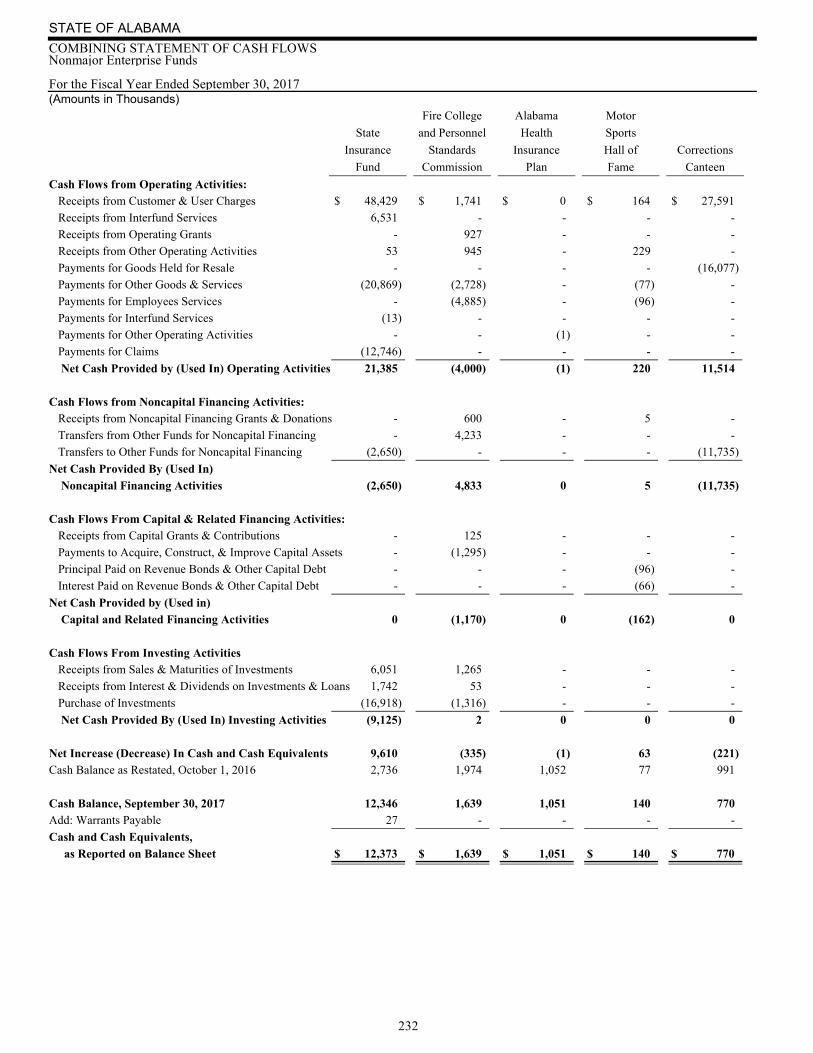
For the Fiscal Year Ended September 30, 2017 (Amounts in Thousands)
STATE OF ALABAMA
COMBINING STATEMENT OF CASH FLOWSNonmajor Enterprise Funds
Fire College Alabama Motor
State and Personnel Health Sports
Insurance Standards Insurance Hall of Corrections
Fund Commission Plan Fame Canteen
Cash Flows from Operating Activities: Receipts from Customer & User Charges $ 48,429 $ 1,741 $ 0 $ 164 $ 27,591
Receipts from Interfund Services 6,531 - - - -
Receipts from Operating Grants - 927 - - -
Receipts from Other Operating Activities 53 945 - 229 -
Payments for Goods Held for Resale - - - - (16,077)
Payments for Other Goods & Services (20,869) (2,728) - (77) -
Payments for Employees Services - (4,885) - (96) -
Payments for Interfund Services (13) - - - -
Payments for Other Operating Activities - - (1) - -
Payments for Claims (12,746) - - - -
Net Cash Provided by (Used In) Operating Activities 21,385 (4,000) (1) 220 11,514
Cash Flows from Noncapital Financing Activities: Receipts from Noncapital Financing Grants & Donations - 600 - 5 -
Transfers from Other Funds for Noncapital Financing - 4,233 - - -
Transfers to Other Funds for Noncapital Financing (2,650) - - - (11,735)
Net Cash Provided By (Used In)
Noncapital Financing Activities (2,650) 4,833 0 5 (11,735)
Cash Flows From Capital & Related Financing Activities: Receipts from Capital Grants & Contributions - 125 - - -
Payments to Acquire, Construct, & Improve Capital Assets - (1,295) - - -
Principal Paid on Revenue Bonds & Other Capital Debt - - - (96) -
Interest Paid on Revenue Bonds & Other Capital Debt - - - (66) -
Net Cash Provided by (Used in)
Capital and Related Financing Activities 0 (1,170) 0 (162) 0
Cash Flows From Investing Activities Receipts from Sales & Maturities of Investments 6,051 1,265 - - -
Receipts from Interest & Dividends on Investments & Loans 1,742 53 - - -
Purchase of Investments (16,918) (1,316) - - -
Net Cash Provided By (Used In) Investing Activities (9,125) 2 0 0 0
Net Increase (Decrease) In Cash and Cash Equivalents 9,610 (335) (1) 63 (221)Cash Balance as Restated, October 1, 2016 2,736 1,974 1,052 77 991
Cash Balance, September 30, 2017 12,346 1,639 1,051 140 770Add: Warrants Payable 27 - - - -
Cash and Cash Equivalents,
as Reported on Balance Sheet $ 12,373 $ 1,639 $ 1,051 $ 140 $ 770
232
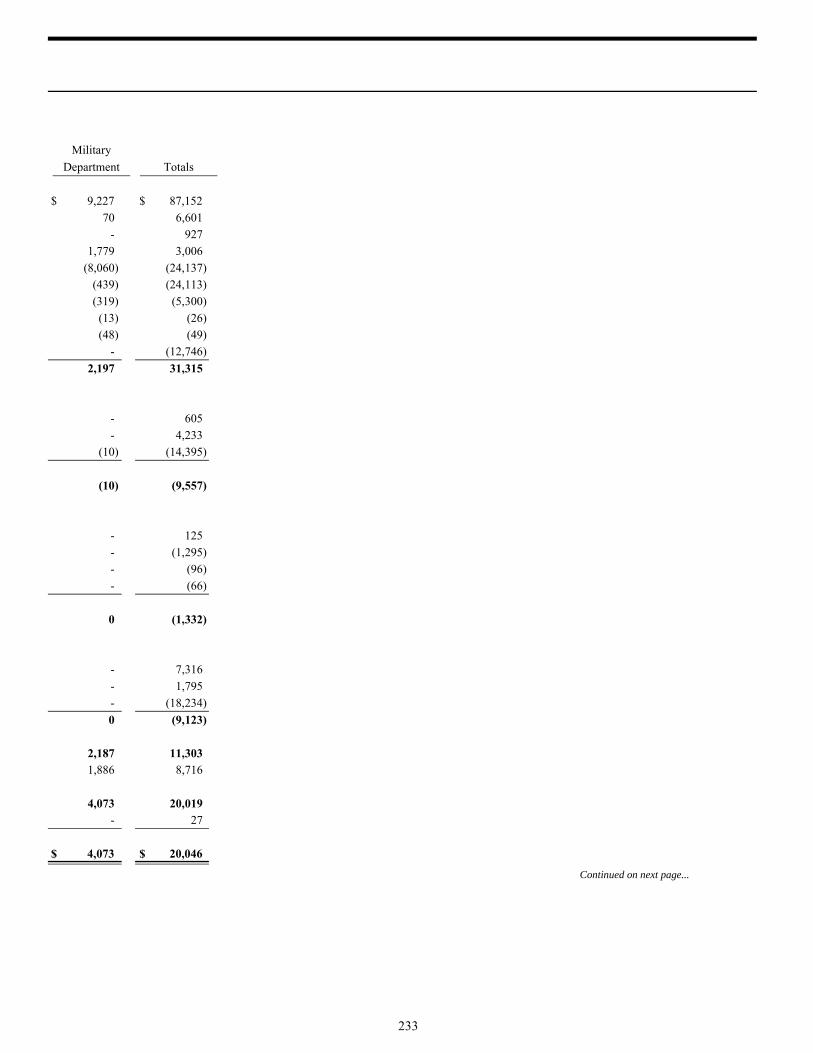
Military
Department Totals
Continued on next page...
$ 9,227 $ 87,152
70 6,601
- 927
1,779 3,006
(8,060) (24,137)
(439) (24,113)
(319) (5,300)
(13) (26)
(48) (49)
- (12,746)
2,197 31,315
- 605
- 4,233
(10) (14,395)
(10) (9,557)
- 125
- (1,295)
- (96)
- (66)
0 (1,332)
- 7,316
- 1,795
- (18,234)
0 (9,123)
2,187 11,303 1,886 8,716
4,073 20,019 - 27
$ 4,073 $ 20,046
233

For the Fiscal Year Ended September 30, 2017 (Amounts in Thousands)
STATE OF ALABAMA
COMBINING STATEMENT OF CASH FLOWS (Continued from Previous Page)Nonmajor Enterprise Funds
Fire College Alabama Motor
State and Personnel Health Sports
Insurance Standards Insurance Hall of Corrections
Fund Commission Plan Fame Canteen
Reconciliation of Operating Income (Loss) to Net Cash
Provided (Used) by Operating Activities:
Operating Income (Loss) $ 15,315 $ (5,675) $ 0 $ (103) $ 11,640Adjustments to Reconcile Operating Income (Loss)
to Net Cash Provided by Operating Activities:
Due from Other Funds 570 - - - -
Accounts Receivable 56 (89) - - (43)
Inventory - 14 - - (68)
Other Assets (92) 2 - - -
Deferred Outflows of Resources - (115) - 3 -
Due to Other Funds 2,666 - - - -
Accounts Payable 528 179 - (1) (15)
Due to Other Governments - - - - -
Claims Payable 2,587 - (1) - -
Unearned Revenue - (5) - - -
Compensated Absences - - - - -
Other Post-employment Benefits - - - 5 -
Net Pension Liability - (2) - 21 -
Deferred Inflows of Resources - 140 - - -
Depreciation - 590 - 57 -
Nonoperating Revenues 53 961 - 238 -
Nonoperating Expenses (298) - - - -
Total Adjustments 6,070 1,675 (1) 323 (126)
Net Cash Provided (Used) by Operating Activities $ 21,385 $ (4,000) $ (1) $ 220 $ 11,514
Noncash Investing, Capital, and Financing ActivitiesIncrease (Decrease):
Disposals of Capital Assets - (540) - - -
Assumption of Debt Obligations - 152 - - -
Interest Accruals and Other Adjustments 1,846 - - - -
Unrealized Gains (Losses) in Investment Fair Value 4,175 - - - -
Transfers In (Out) 2,650 - - - -
234

Military
Department Totals
$ 149 $ 21,326
70 640
3 (73)
41 (13)
- (90)
(11) (123)
- 2,666
(45) 646
1,639 1,639
- 2,586
- (5)
2 2
19 24
86 105
- 140
72 719
172 1,424
- (298)
2,048 9,989
$ 2,197 $ 31,315
- (540)
- 152
- 1,846
- 4,175
(2) 2,648
235

236
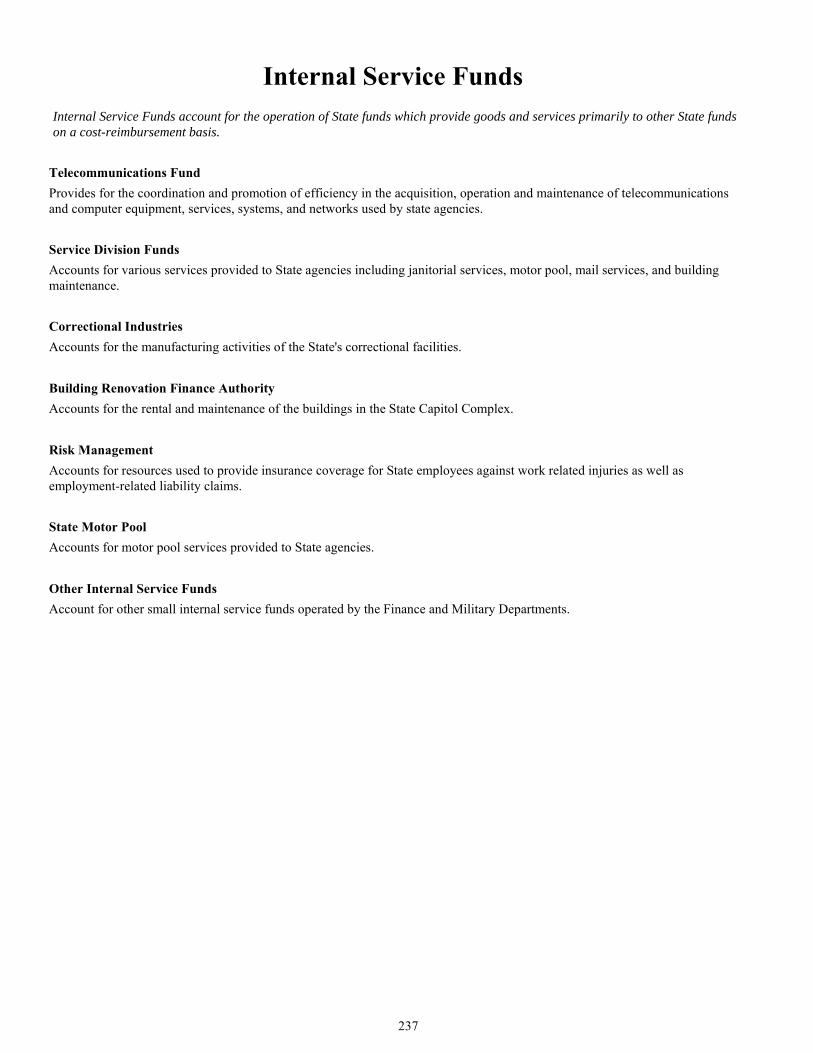
Internal Service FundsInternal Service Funds account for the operation of State funds which provide goods and services primarily to other State funds on a cost-reimbursement basis.
Telecommunications Fund
Provides for the coordination and promotion of efficiency in the acquisition, operation and maintenance of telecommunications and computer equipment, services, systems, and networks used by state agencies.
Service Division Funds
Accounts for various services provided to State agencies including janitorial services, motor pool, mail services, and building maintenance.
Correctional Industries
Accounts for the manufacturing activities of the State's correctional facilities.
Building Renovation Finance Authority
Accounts for the rental and maintenance of the buildings in the State Capitol Complex.
Risk Management
Accounts for resources used to provide insurance coverage for State employees against work related injuries as well as employment-related liability claims.
State Motor Pool
Accounts for motor pool services provided to State agencies.
Other Internal Service Funds
Account for other small internal service funds operated by the Finance and Military Departments.
237

September 30, 2017 (Amounts in Thousands)
STATE OF ALABAMA
COMBINING STATEMENT OF NET POSITIONInternal Service Funds
Building
Telecom- Renovation
munications Service Correctional Finance Risk
Fund Division Industries Authority Management
ASSETS
Current Assets
Cash and Cash Equivalents $ 10,289 $ 987 $ 7,096 $ 27,061 $ 7,711
Investments, Short-term - - - - 3,113
Due From Other Funds 9,629 1,975 1,161 3,233 304
Due From Component Units 26 34 1 16 -
Accounts Receivable 222 102 1 4 278
Due From Other Governments - - - - 23
Inventory - 288 4,658 - -
Total Current Assets 20,166 3,386 12,917 30,314 11,429
Noncurrent Assets
Investments, Long-term - - - - 107,302
Capital Assets, Net of Accumulated Depreciation 15,800 1,290 1,459 71,538 194
Capital Assets Not Depreciated - - 544 3,810 -
Total Noncurrent Assets 15,800 1,290 2,003 75,348 107,496
TOTAL ASSETS 35,966 4,676 14,920 105,662 118,925
DEFERRED OUTFLOWS OF RESOURCES 2,112 168 589 1,168 943
LIABILITIES
Current Liabilities
Warrants Payable 586 - - 1 127
Due To Other Funds 216 38 45 31 295
Due To Component Units - - - - 512
Accounts Payable 12,800 814 931 1,771 977
Due To Other Governments - - 3 38 -
Claims Payable - - - - 4,900
Compensated Absences 136 5 39 26 34
Notes and Capital Leases Payable 2,203 - - - -
Revenue Bonds Payable - - - 1,950 -
Total Current Liabilities 15,941 857 1,018 3,817 6,845
Noncurrent Liabilities
Claims Payable - - - - 63,405
Due To Other Funds - - - - -
Compensated Absences 1,466 52 417 275 363
Other Post-employment Benefits 6,168 733 3,022 2,364 2,296
Net Pension Liability 17,370 1,381 4,843 4,617 7,759
Notes and Capital Leases Payable 9,120 - - - -
Revenue Bonds Payable - - - 14,567 -
Total Noncurent Liabilities 34,124 2,166 8,282 21,823 73,823
TOTAL LIABILITIES 50,065 3,023 9,300 25,640 80,668
DEFERRED INFLOWS OF RESOURCES 161 13 45 43 72
NET POSITION
Net Investment in Capital Assets 4,480 1,290 2,003 59,462 194
Unrestricted (16,628) 518 4,161 21,685 38,934
TOTAL NET POSITION $ (12,148) $ 1,808 $ 6,164 $ 81,147 $ 39,128
238

Other
State Internal
Motor Service
Pool Funds Totals
$ 1,639 $ 18,388 $ 73,171
- - 3,113
432 2,461 19,195
7 19 103
41 156 804
- - 23
- - 4,946
2,119 21,024 101,355
- - 107,302
418 378 91,077
- 742 5,096
418 1,120 203,475
2,537 22,144 304,830
142 2,311 7,433
1 1 716
22 491 1,138
- - 512
179 1,267 18,739
7 3 51
- - 4,900
- 167 407
- - 2,203
- - 1,950
209 1,929 30,616
- - 63,405
- 801 801
- 1,802 4,375
379 2,790 17,752
1,166 19,007 56,143
- - 9,120
- - 14,567
1,545 24,400 166,163
1,754 26,329 196,779
11 176 521
418 1,120 68,967
496 (3,170) 45,996
$ 914 $ (2,050) $ 114,963
239

For the Fiscal Year Ended September 30, 2017 (Amounts in Thousands)
STATE OF ALABAMA
COMBINING STATEMENT OF REVENUES, EXPENSES, AND CHANGES IN NET POSITIONInternal Service Funds
Building
Telecom- Renovation
munications Service Correctional Finance Risk
Fund Division Industries Authority Management
OPERATING REVENUES Charges for Goods and Services $ 57,374 $ 9,913 $ 10,969 $ 1,097 $ 2,926
Premiums and Contributions - - - - 17,306
Rents and Leases - - 8 18,175 -
Total Operating Revenues 57,374 9,913 10,977 19,272 20,232
OPERATING EXPENSES Salaries, Wages, and Benefits 11,862 1,243 3,737 3,768 5,638
Utilities and Communications 18,067 110 397 3,491 55
Professional Services 16,655 142 125 1,751 4,393
Supplies, Materials, and Operating Expense 9,266 7,665 8,711 695 502
Depreciation 2,289 224 176 3,294 36
Claims and Benefits - - - - 19,977
Other 3,174 205 500 3,229 478
Total Operating Expenses 61,313 9,589 13,646 16,228 31,079
Operating Income (Loss) (3,939) 324 (2,669) 3,044 (10,847)
NONOPERATING REVENUES (EXPENSES) Grants 669 134 319 358 374
Investment Income - - - 1 2,383
Other Nonoperating Revenues 3 1 8 328 273
Interest Expense (41) - - (618) -
Other Nonoperating Expenses (152) (2) - (6) (239)
Total Nonoperating Revenues (Expenses) 479 133 327 63 2,791
Income (Loss) Before Contributions and Transfers (3,460) 457 (2,342) 3,107 (8,056)
Capital Contributions 6 - - - 2
Transfers In 576 - 4,128 4,628 3,157
Transfers Out (2,501) (8) (28) (2,594) (3,177)
Increase (Decrease) in Net Position (5,379) 449 1,758 5,141 (8,074)Total Net Position, October 1, 2016, as Restated (6,769) 1,359 4,406 76,006 47,202
Total Net Position, September 30, 2017 $ (12,148) $ 1,808 $ 6,164 $ 81,147 $ 39,128
240
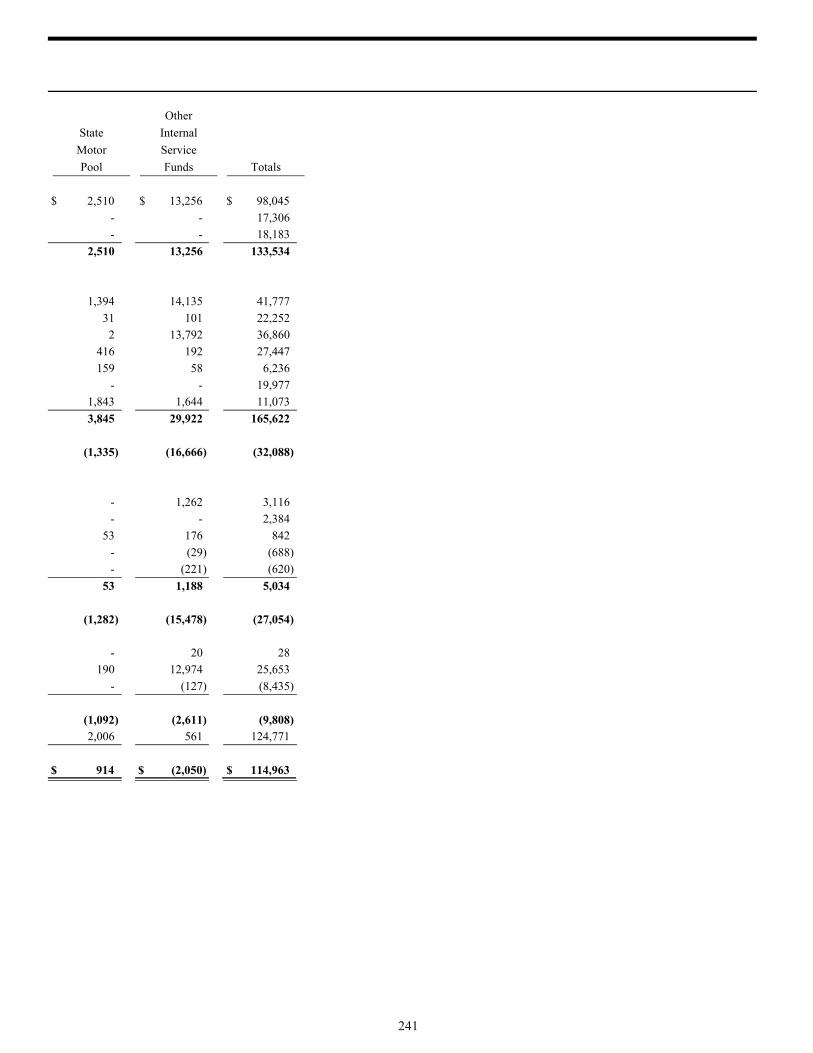
Other
State Internal
Motor Service
Pool Funds Totals
$ 2,510 $ 13,256 $ 98,045
- - 17,306
- - 18,183
2,510 13,256 133,534
1,394 14,135 41,777
31 101 22,252
2 13,792 36,860
416 192 27,447
159 58 6,236
- - 19,977
1,843 1,644 11,073
3,845 29,922 165,622
(1,335) (16,666) (32,088)
- 1,262 3,116
- - 2,384
53 176 842
- (29) (688)
- (221) (620)
53 1,188 5,034
(1,282) (15,478) (27,054)
- 20 28
190 12,974 25,653
- (127) (8,435)
(1,092) (2,611) (9,808) 2,006 561 124,771
$ 914 $ (2,050) $ 114,963
241

For the Fiscal Year Ended September 30, 2017 (Amounts in Thousands)
STATE OF ALABAMA
COMBINING STATEMENT OF CASH FLOWSInternal Service Funds
Building
Telecom- Renovation
munications Service Correctional Finance Risk
Fund Division Industries Authority Management
Cash Flows from Operating Activities: Receipts from Customer & User Charges $ 1,321 $ 2 $ 1,174 $ 16 $ 376
Receipts from Interfund Services 56,331 9,383 9,862 19,676 17,208
Receipts from Other Operating Activities 25 1 29 34 88
Payments for Goods Held for Resale (25) (7,693) (7,411) - -
Payments for Other Goods & Services (37,014) (350) (1,790) (7,819) (3,619)
Payments for Employees Services (10,569) (982) (3,468) (3,160) (4,748)
Payments for Interfund Services (2,643) (301) (326) (736) (1,143)
Payments for Other Operating Activities (89) (7) (36) - (537)
Payments for Claims - - - - (5,592)
Net Cash Provided by (Used In) Operating Activities 7,337 53 (1,966) 8,011 2,033
Cash Flows from Noncapital Financing Activities: Transfers from Other Funds for Noncapital Financing 576 - 4,130 4,628 5,807
Transfers to Other Funds for Noncapital Financing (2,501) (8) (28) (2,594) (3,177)
Net Cash Provided By (Used In)
Noncapital Financing Activities (1,925) (8) 4,102 2,034 2,630
Cash Flows From Capital & Related Financing Activities: Transfers from Other Funds for Capital Financing - - - - -
Receipts from Sale of Capital Assets & Insurance Proceeds - - 6 77 -
Payments to Acquire, Construct, & Improve Capital Assets (320) (18) (76) (554) (25)
Principal Paid on Revenue Bonds & Other Capital Debt (1,586) - - (1,875) -
Interest Paid on Revenue Bonds & Other Capital Debt (45) - - (691) -
Net Cash Provided by (Used in)
Capital and Related Financing Activities (1,951) (18) (70) (3,043) (25)
Cash Flows From Investing Activities Receipts from Sales & Maturities of Investments - - - 2 -
Receipts from Interest & Dividends on Investments & Loans - - - 1 -
Purchase of Investments - - - (2) (11,221)
Net Cash Provided By (Used In) Investing Activities 0 0 0 1 (11,221)
Net Increase (Decrease) In Cash and Cash Equivalents 3,461 27 2,066 7,003 (6,583)Cash Balance as Restated, October 1, 2016 6,242 960 5,030 20,057 14,167
Cash Balance, September 30, 2017 9,703 987 7,096 27,060 7,584Add: Warrants Payable 586 - - 1 127
Cash and Cash Equivalents,
as Reported on Balance Sheet $ 10,289 $ 987 $ 7,096 $ 27,061 $ 7,711
242

Other
State Internal
Motor Service
Pool Funds Totals
Continued on next page...
$ 463 $ 3,631 $ 6,983
2,342 9,836 124,638
- 183 360
- (9) (15,138)
(1,903) (14,414) (66,909)
(715) (11,605) (35,247)
(591) (5,470) (11,210)
- (113) (782)
- - (5,592)
(404) (17,961) (2,897)
190 974 16,305
- (127) (8,435)
190 847 7,870
- 14,183 14,183
55 - 138
(49) (59) (1,101)
- - (3,461)
- - (736)
6 14,124 9,023
- - 2
- - 1
- - (11,223)
0 0 (11,220)
(208) (2,990) 2,776 1,846 21,377 69,679
1,638 18,387 72,455 1 1 716
$ 1,639 $ 18,388 $ 73,171
243

For the Fiscal Year Ended September 30, 2017 (Amounts in Thousands)
STATE OF ALABAMA
COMBINING STATEMENT OF CASH FLOWS (Continued from Previous Page)Internal Service Funds
Building
Telecom- Renovation
munications Service Correctional Finance Risk
Fund Division Industries Authority Management
Reconciliation of Operating Income (Loss) to Net Cash
Provided (Used) by Operating Activities:
Operating Income (Loss) $ (3,939) $ 324 $ (2,669) $ 3,044 $ (10,847)Adjustments to Reconcile Operating Income (Loss)
to Net Cash Provided by Operating Activities:
Due from Other Funds 268 (506) 151 591 (2,494)
Accounts Receivable (46) (6) (1) (1) (373)
Due From Other Governments - - - - (23)
Inventory - 633 344 - -
Other Assets 22 - - - -
Deferred Outflows of Resources (76) (11) 16 (17) (67)
Due to Other Funds 50 5 (95) (167) 511
Accounts Payable 7,412 (890) (176) 607 736
Claims Payable - - - - 13,577
Funds Held in Escrow (1) - - - -
Compensated Absences (17) (3) (32) (12) (49)
Other Post-employment Benefits 403 81 193 216 225
Net Pension Liability 444 76 (184) 95 475
Deferred Inflows of Resources (115) (8) (37) (31) (47)
Depreciation 2,289 224 176 3,294 36
Nonoperating Revenues 669 135 348 392 415
Nonoperating Expenses (26) (1) - - (42)
Total Adjustments 11,276 (271) 703 4,967 12,880
Net Cash Provided (Used) by Operating Activities $ 7,337 $ 53 $ (1,966) $ 8,011 $ 2,033
Noncash Investing, Capital, and Financing ActivitiesIncrease (Decrease):
Capital Assets Acquired by Capital Contribution 6 - 74 - -
Capital Assets Acquired by Capital Lease or Other Debt 10,098 - - - -
Disposals of Capital Assets (1,458) (22) (388) (98) (31)
Revenue Bond Amortizations and Other Debt Adjustments - - - 160 -
Interest Accruals and Other Adjustments - - - - 1,602
Unrealized Gains (Losses) in Investment Fair Value - - - - 781
Transfers In (Out) - - 11 - (2,650)
244
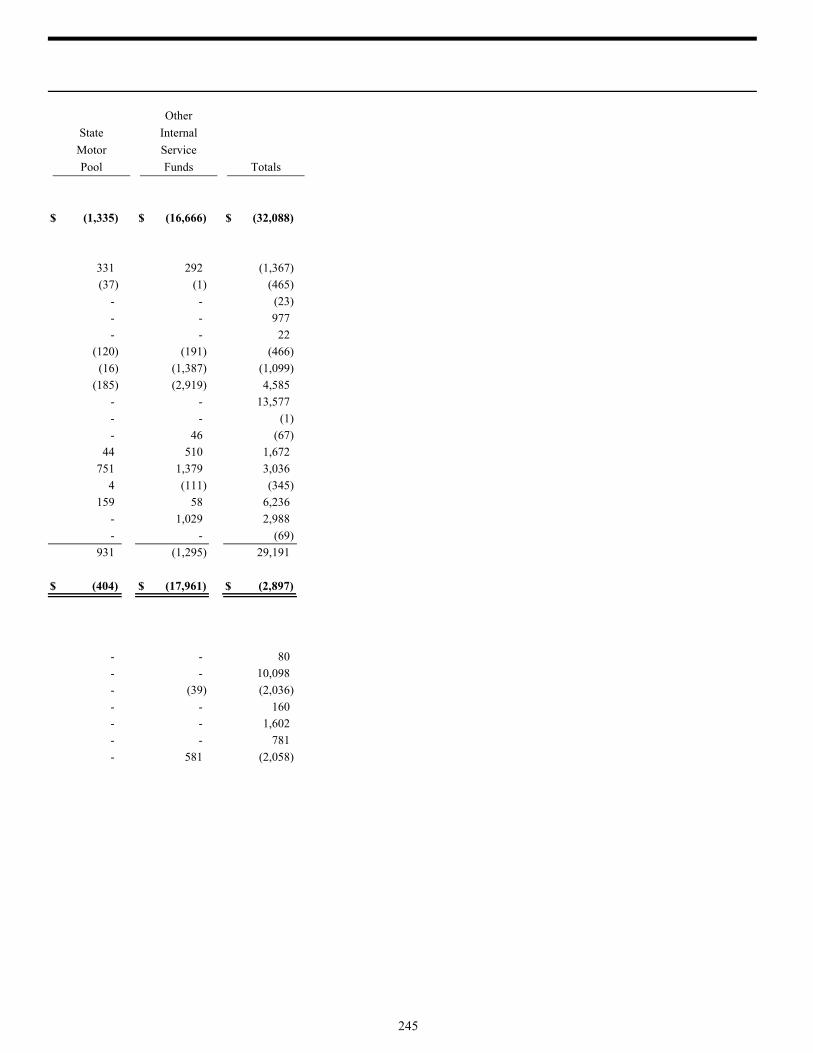
Other
State Internal
Motor Service
Pool Funds Totals
$ (1,335) $ (16,666) $ (32,088)
331 292 (1,367)
(37) (1) (465)
- - (23)
- - 977
- - 22
(120) (191) (466)
(16) (1,387) (1,099)
(185) (2,919) 4,585
- - 13,577
- - (1)
- 46 (67)
44 510 1,672
751 1,379 3,036
4 (111) (345)
159 58 6,236
- 1,029 2,988
- - (69)
931 (1,295) 29,191
$ (404) $ (17,961) $ (2,897)
- - 80
- - 10,098
- (39) (2,036)
- - 160
- - 1,602
- - 781
- 581 (2,058)
245

246
Pension and Other Employee Benefit Trust FundsPension and Other Employee Benefit Trust Funds account for the resources held in trust for members and beneficiaries of retirement plans and other employee benefit plans administered by the State.
Employees' Retirement System
Accounts for a pension plan for the benefit of State employees, State police, and employees of other eligible governmental organizations such as cities and counties within the State.
Teachers' Retirement System
Accounts for a pension plan for the benefit of employees of State supported educational institutions.
Judicial Retirement Fund
Accounts for a pension plan for the benefit of judges of the State's Supreme Court, Court of Civil Appeals, Court of Criminal Appeals, and Circuit Court.
Peace Officers Annuity and Benefit
Provides pension benefits to State and local peace officers.
State Port Authority Hourly Plan
Is a retirement fund for certain hourly employees of the Alabama State Port Authority who are not members of the State Employees' Retirement System.
State Port Authority Railway Plan
Is a retirement fund for certain employees of the Alabama State Port Authority who are not members of the State Employees' Retirement System.
State Port Authority Hourly Defined Contribution
Is a defined contribution retirement plan for certain hourly employees of the Alabama State Port Authority who are not members of the State Employees' Retirement System.
Alabama Deferred Compensation Fund
Accounts for resources contributed by State employees for a deferred compensation plan sponsored by the Personnel Board.
RSA Employee Savings Plans
Accounts for resources contributed by public employees for deferred compensation plans and individual retirement accounts sponsored by the Retirement Systems of Alabama.
Retired Education Employees' Health Care Trust
Provides post-employment health insurance benefits for retired employees of State supported educational institutions.
Retired State Employees' Health Care Trust
Provides post-employment health insurance benefits for retired State employees.
Other
Accounts for a flexible employees' benefits plan and a small pension plan for Firefighters.
247
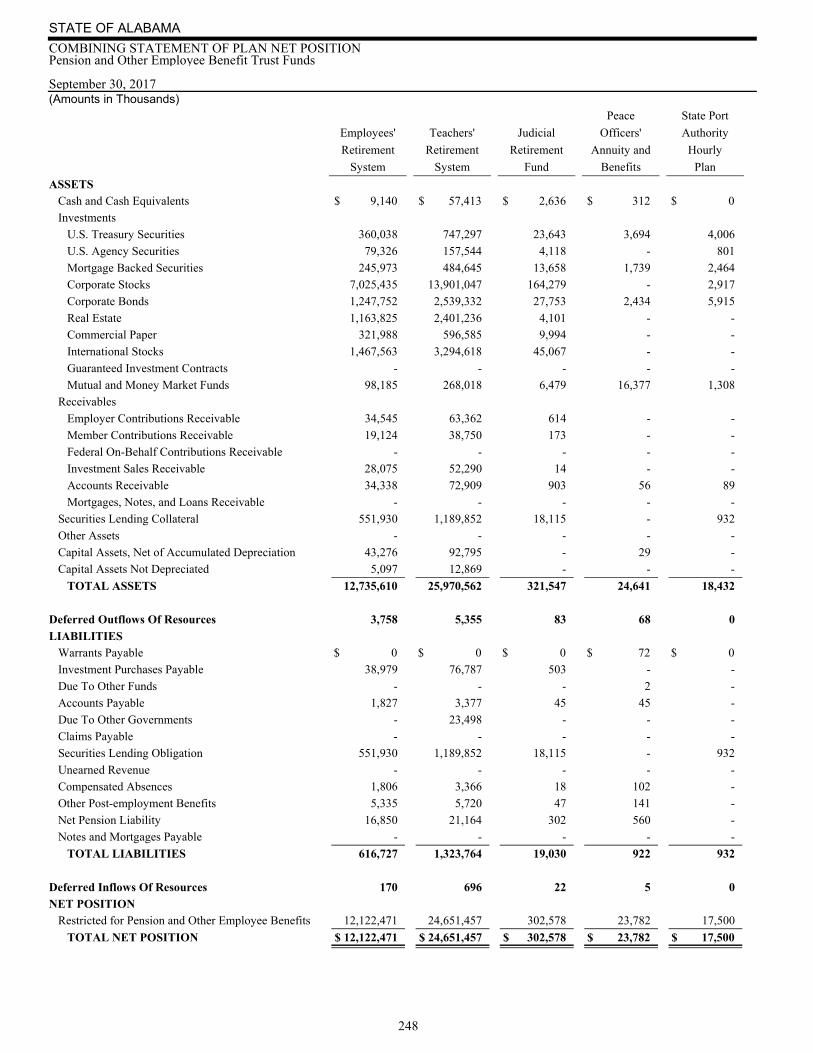
September 30, 2017 (Amounts in Thousands)
STATE OF ALABAMA
COMBINING STATEMENT OF PLAN NET POSITIONPension and Other Employee Benefit Trust Funds
Peace State Port
Employees' Teachers' Judicial Officers' Authority
Retirement Retirement Retirement Annuity and Hourly
System System Fund Benefits Plan
ASSETS Cash and Cash Equivalents $ 9,140 $ 57,413 $ 2,636 $ 312 $ 0
Investments
U.S. Treasury Securities 360,038 747,297 23,643 3,694 4,006
U.S. Agency Securities 79,326 157,544 4,118 - 801
Mortgage Backed Securities 245,973 484,645 13,658 1,739 2,464
Corporate Stocks 7,025,435 13,901,047 164,279 - 2,917
Corporate Bonds 1,247,752 2,539,332 27,753 2,434 5,915
Real Estate 1,163,825 2,401,236 4,101 - -
Commercial Paper 321,988 596,585 9,994 - -
International Stocks 1,467,563 3,294,618 45,067 - -
Guaranteed Investment Contracts - - - - -
Mutual and Money Market Funds 98,185 268,018 6,479 16,377 1,308
Receivables
Employer Contributions Receivable 34,545 63,362 614 - -
Member Contributions Receivable 19,124 38,750 173 - -
Federal On-Behalf Contributions Receivable - - - - -
Investment Sales Receivable 28,075 52,290 14 - -
Accounts Receivable 34,338 72,909 903 56 89
Mortgages, Notes, and Loans Receivable - - - - -
Securities Lending Collateral 551,930 1,189,852 18,115 - 932
Other Assets - - - - -
Capital Assets, Net of Accumulated Depreciation 43,276 92,795 - 29 -
Capital Assets Not Depreciated 5,097 12,869 - - -
TOTAL ASSETS 12,735,610 25,970,562 321,547 24,641 18,432
Deferred Outflows Of Resources 3,758 5,355 83 68 0
LIABILITIES Warrants Payable $ 0 $ 0 $ 0 $ 72 $ 0
Investment Purchases Payable 38,979 76,787 503 - -
Due To Other Funds - - - 2 -
Accounts Payable 1,827 3,377 45 45 -
Due To Other Governments - 23,498 - - -
Claims Payable - - - - -
Securities Lending Obligation 551,930 1,189,852 18,115 - 932
Unearned Revenue - - - - -
Compensated Absences 1,806 3,366 18 102 -
Other Post-employment Benefits 5,335 5,720 47 141 -
Net Pension Liability 16,850 21,164 302 560 -
Notes and Mortgages Payable - - - - -
TOTAL LIABILITIES 616,727 1,323,764 19,030 922 932
Deferred Inflows Of Resources 170 696 22 5 0
NET POSITION Restricted for Pension and Other Employee Benefits 12,122,471 24,651,457 302,578 23,782 17,500
TOTAL NET POSITION $ 12,122,471 $ 24,651,457 $ 302,578 $ 23,782 $ 17,500
248
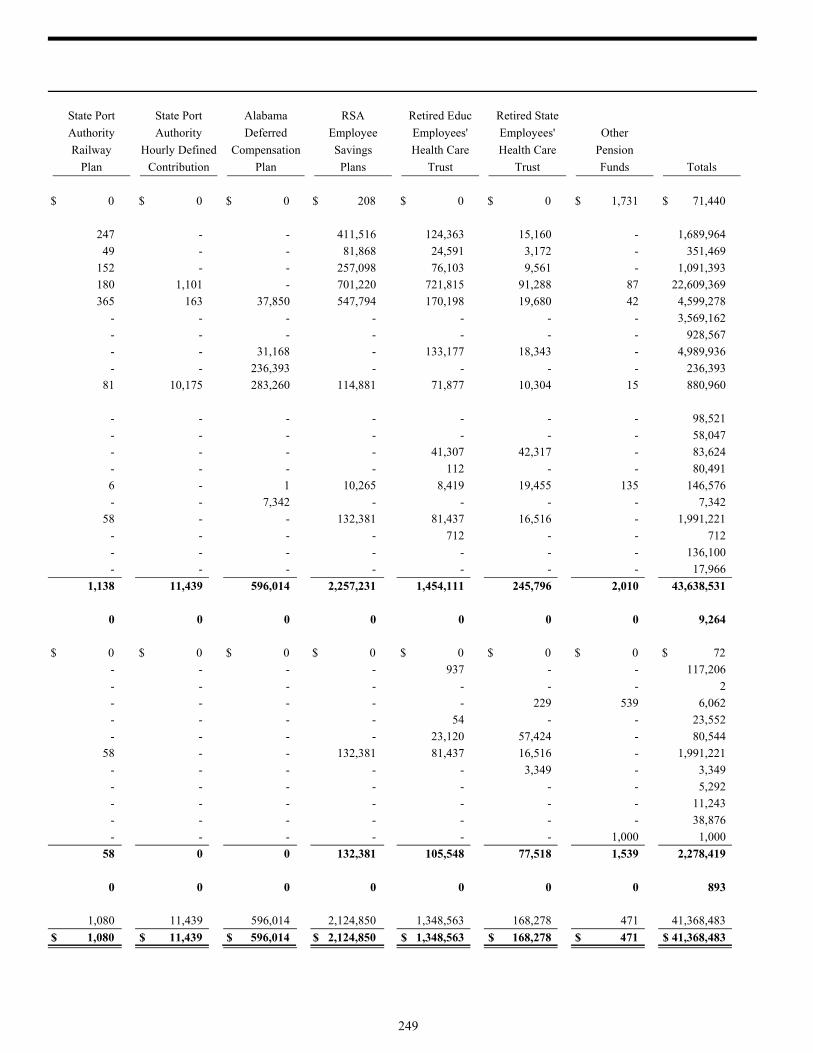
State Port State Port Alabama RSA Retired Educ Retired State
Authority Authority Deferred Employee Employees' Employees' Other
Railway Hourly Defined Compensation Savings Health Care Health Care Pension
Plan Contribution Plan Plans Trust Trust Funds Totals
$ 0 $ 0 $ 0 $ 208 $ 0 $ 0 $ 1,731 $ 71,440
247 - - 411,516 124,363 15,160 - 1,689,964
49 - - 81,868 24,591 3,172 - 351,469
152 - - 257,098 76,103 9,561 - 1,091,393
180 1,101 - 701,220 721,815 91,288 87 22,609,369
365 163 37,850 547,794 170,198 19,680 42 4,599,278
- - - - - - - 3,569,162
- - - - - - - 928,567
- - 31,168 - 133,177 18,343 - 4,989,936
- - 236,393 - - - - 236,393
81 10,175 283,260 114,881 71,877 10,304 15 880,960
- - - - - - - 98,521
- - - - - - - 58,047
- - - - 41,307 42,317 - 83,624
- - - - 112 - - 80,491
6 - 1 10,265 8,419 19,455 135 146,576
- - 7,342 - - - - 7,342
58 - - 132,381 81,437 16,516 - 1,991,221
- - - - 712 - - 712
- - - - - - - 136,100
- - - - - - - 17,966
1,138 11,439 596,014 2,257,231 1,454,111 245,796 2,010 43,638,531
0 0 0 0 0 0 0 9,264
$ 0 $ 0 $ 0 $ 0 $ 0 $ 0 $ 0 $ 72
- - - - 937 - - 117,206
- - - - - - - 2
- - - - - 229 539 6,062
- - - - 54 - - 23,552
- - - - 23,120 57,424 - 80,544
58 - - 132,381 81,437 16,516 - 1,991,221
- - - - - 3,349 - 3,349
- - - - - - - 5,292
- - - - - - - 11,243
- - - - - - - 38,876
- - - - - - 1,000 1,000
58 0 0 132,381 105,548 77,518 1,539 2,278,419
0 0 0 0 0 0 0 893
1,080 11,439 596,014 2,124,850 1,348,563 168,278 471 41,368,483
$ 1,080 $ 11,439 $ 596,014 $ 2,124,850 $ 1,348,563 $ 168,278 $ 471 $ 41,368,483
249

For the Fiscal Year Ended September 30, 2017 (Amounts in Thousands)
STATE OF ALABAMA
COMBINING STATEMENT OF CHANGES IN PLAN NET POSITIONPension and Other Employee Benefit Trust Funds
Peace State Port
Employees' Teachers' Judicial Officers' Authority
Retirement Retirement Retirement Annuity and Hourly
System System Fund Benefits Plan
ADDITIONS Contributions:
Plan members $ 233,901 $ 489,638 $ 3,972 $ 728 $ 0
Employer 426,215 782,695 17,373 4,318 1,354
Other Contributions - - - 19 -
Federal On-Behalf - - - - -
Total Contributions 660,116 1,272,333 21,345 5,065 1,354
Investment Earnings
Investment Interest and Dividends 302,295 613,353 6,911 490 509
Net Increase (Decrease) in Fair Value of Investments 1,098,859 2,021,774 25,639 1,898 80
Securities Lending Income 9,127 20,125 270 - 18
Total Investment Earnings 1,410,281 2,655,252 32,820 2,388 607
Less:
Investment Expense 3,460 8,693 - 70 -
Securities Lending Interest and Fees 4,813 10,462 134 - 9
Net Investment Income 1,402,008 2,636,097 32,686 2,318 598
Other Additions
Interest from Mortgages and Loans Receivable - - - - -
Miscellaneous 155 7 - 20 -
Total Other Additions 155 7 0 20 0
Total Additions 2,062,279 3,908,437 54,031 7,403 1,952
DEDUCTIONS Benefit Payments and Refunds 1,102,380 2,170,876 33,161 5,057 1,354
Administrative Expense 14,502 22,402 334 505 -
Total Deductions 1,116,882 2,193,278 33,495 5,562 1,354
Change in Net Position 945,397 1,715,159 20,536 1,841 598Net Position Restricted or Held in Trust
for Beneficiaries, October 1, 2016, as Restated 11,177,074 22,936,298 282,042 21,941 16,902
Net Position Restricted or Held in Trust
for Beneficiaries, September 30, 2017 $ 12,122,471 $ 24,651,457 $ 302,578 $ 23,782 $ 17,500
250

State Port State Port Alabama RSA Retired Educ Retired State
Authority Authority Deferred Employee Employees' Employees' Other
Railway Hourly Defined Compensation Savings Health Care Health Care Pension
Plan Contribution Plan Plans Trust Trust Funds Totals
$ 0 $ 614 $ 33,734 $ 91,175 $ 143,091 $ 42,445 $ 11,343 $ 1,050,641
172 947 - - 243,146 92,790 - 1,569,010
- - - - - - 3,906 3,925
- - - - 23,195 - - 23,195
172 1,561 33,734 91,175 409,432 135,235 15,249 2,646,771
31 951 16,889 61,074 30,645 3,789 2 1,036,939
6 - 35,888 54,351 106,997 13,906 9 3,359,407
1 - - 2,476 1,226 536 - 33,779
38 951 52,777 117,901 138,868 18,231 11 4,430,125
- - 438 - - - - 12,661
1 - - 1,439 607 341 - 17,806
37 951 52,339 116,462 138,261 17,890 11 4,399,658
- - 345 - - - - 345
- - - - - - - 182
0 0 345 0 0 0 0 527
209 2,512 86,418 207,637 547,693 153,125 15,260 7,046,956
156 1,076 39,988 142,703 437,113 134,524 13,007 4,081,395
- 4 1,147 - 2,216 711 2,239 44,060
156 1,080 41,135 142,703 439,329 135,235 15,246 4,125,455
53 1,432 45,283 64,934 108,364 17,890 14 2,921,501
1,027 10,007 550,731 2,059,916 1,240,199 150,388 457 38,446,982
$ 1,080 $ 11,439 $ 596,014 $ 2,124,850 $ 1,348,563 $ 168,278 $ 471 $ 41,368,483
251

252
Private-Purpose Trust FundsPrivate-Purpose Trust Funds report trust arrangements where the principal and income benefit individuals, private organizations or other governments.
Prepaid Affordable College Tuition
Accounts for the operation of a prepaid college tuition plan for the benefit of individual citizens of Alabama.
Alabama College Education Savings Plan
Accounts for the operation of an individual college tuition savings plan.
Local Education Endowments
Accounts for the proceeds of several endowments donated by private citizens for the benefit of specific local school systems.
ABLE Trust Fund
Accounts for private funds to support individuals with disabilities.
253

September 30, 2017 (Amounts in Thousands)
STATE OF ALABAMA
COMBINING STATEMENT OF FIDUCIARY NET POSITIONPrivate-Purpose Trust Funds
Prepaid Alabama
Affordable College Local ABLE
College Education Education Trust
Tuition Savings Plan Endowments Fund Totals
ASSETS Cash and Cash Equivalents $ 12,088 $ 1,419 $ 0 $ 64 $ 13,571
Investments
U.S. Treasury Securities 12,104 - 1,062 - 13,166
U.S. Agency Securities 11,238 - 173 - 11,411
Mortgage Backed Securities 2,034 - 664 - 2,698
Corporate Stocks - - 6,174 - 6,174
Corporate Bonds 36,556 - 1,580 - 38,136
Real Estate - - 20 - 20
Mutual and Money Market Funds 17,206 1,577,535 528 129 1,595,398
Receivables
Accounts Receivable 295 3,592 1 - 3,888
Securities Lending Collateral - - 585 - 585
TOTAL ASSETS 91,521 1,582,546 10,787 193 1,685,047
LIABILITIES Warrants Payable 594 - - - 594
Due To Other Funds 4 - - - 4
Accounts Payable 20,784 2,034 1 - 22,819
Securities Lending Obligation - - 585 - 585
Amounts Held in Custody for Others - 2,191 - - 2,191
Compensated Absences 8 4 - - 12
TOTAL LIABILITIES 21,390 4,229 586 0 26,205
NET POSITION Restricted or Held in Trust for Beneficiaries 70,131 1,578,317 10,201 193 1,658,842
TOTAL NET POSITION $ 70,131 $ 1,578,317 $ 10,201 $ 193 $ 1,658,842
254

For the Fiscal Year Ended September 30, 2017 (Amounts in Thousands)
STATE OF ALABAMA
COMBINING STATEMENT OF CHANGES IN FIDUCIARY NET POSITIONPrivate-Purpose Trust Funds
Prepaid Alabama
Affordable College Local ABLE
College Education Education Trust
Tuition Savings Plan Endowments Fund Totals
ADDITIONS Contributions:
Plan members $ 1,124 $ 167,868 $ 0 $ 215 $ 169,207
Total Contributions 1,124 167,868 0 215 169,207
Investment Earnings
Investment Interest and Dividends 1,371 45,165 350 4 46,890
Net Increase (Decrease) in Fair Value of Investments (551) 112,465 714 3 112,631
Securities Lending Income - - 37 - 37
Total Investment Earnings 820 157,630 1,101 7 159,558
Less:
Securities Lending Interest and Fees - - 23 - 23
Net Investment Income 820 157,630 1,078 7 159,535
Other Additions
Miscellaneous 580 - - - 580
Transfers In 63,622 - - - 63,622
Total Other Additions 64,202 0 0 0 64,202
Total Additions 66,146 325,498 1,078 222 392,944
DEDUCTIONS Benefit Payments and Refunds 63,571 119,644 437 29 183,681
Administrative Expense 540 8,545 - - 9,085
Transfers Out - 191 - - 191
Total Deductions 64,111 128,380 437 29 192,957
Change in Net Position 2,035 197,118 641 193 199,987Net Position Restricted or Held in Trust
for Beneficiaries, October 1, 2016, as Restated 68,096 1,381,199 9,560 0 1,458,855
Net Position Restricted or Held in Trust
for Beneficiaries, September 30, 2017 $ 70,131 $ 1,578,317 $ 10,201 $ 193 $ 1,658,842
255

256
Agency FundsAgency Funds report assets held by the State in a purely custodial capacity (assets equal liabilities). Agency funds typically involve the receipt, temporary investment, and remittance of resources to individuals, organizations or other governments.
State Clearing Accounts
Accounts for the collection and distribution of State taxes and licenses as well as amounts collected and held by courts for individuals.
Taxes Collected for Local Governments
Accounts for local taxes which are collected by the State as a service for local governments. These taxes do not represent future revenues of the State.
Payroll
Accounts for amounts withheld from employees that are not yet distributed to outside organizations or governments.
Other Agency Funds
Are aggregated for financial reporting purposes and represent amounts held for child support payments, cash bonds, and numerous other amounts held for individuals and organizations outside of State government.
257
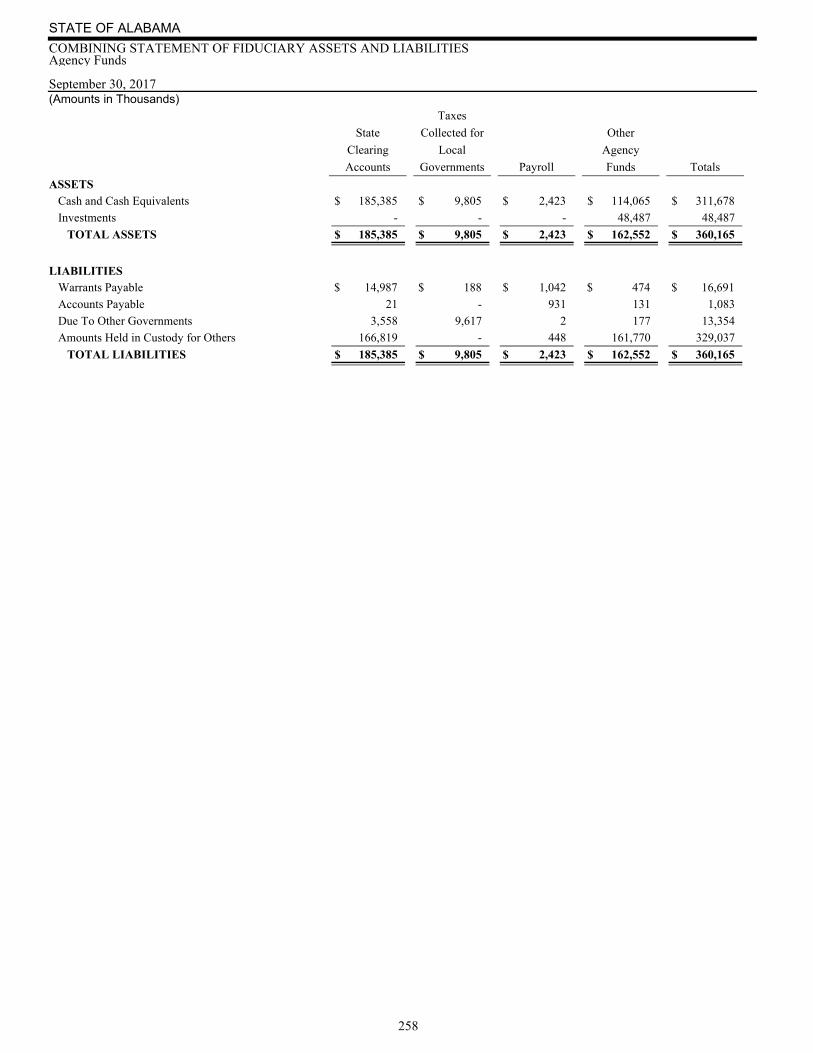
September 30, 2017 (Amounts in Thousands)
STATE OF ALABAMA
COMBINING STATEMENT OF FIDUCIARY ASSETS AND LIABILITIESAgency Funds
Taxes
State Collected for Other
Clearing Local Agency
Accounts Governments Payroll Funds Totals
ASSETS Cash and Cash Equivalents $ 185,385 $ 9,805 $ 2,423 $ 114,065 $ 311,678
Investments - - - 48,487 48,487
TOTAL ASSETS $ 185,385 $ 9,805 $ 2,423 $ 162,552 $ 360,165
LIABILITIES Warrants Payable $ 14,987 $ 188 $ 1,042 $ 474 $ 16,691
Accounts Payable 21 - 931 131 1,083
Due To Other Governments 3,558 9,617 2 177 13,354
Amounts Held in Custody for Others 166,819 - 448 161,770 329,037
TOTAL LIABILITIES $ 185,385 $ 9,805 $ 2,423 $ 162,552 $ 360,165
258

259
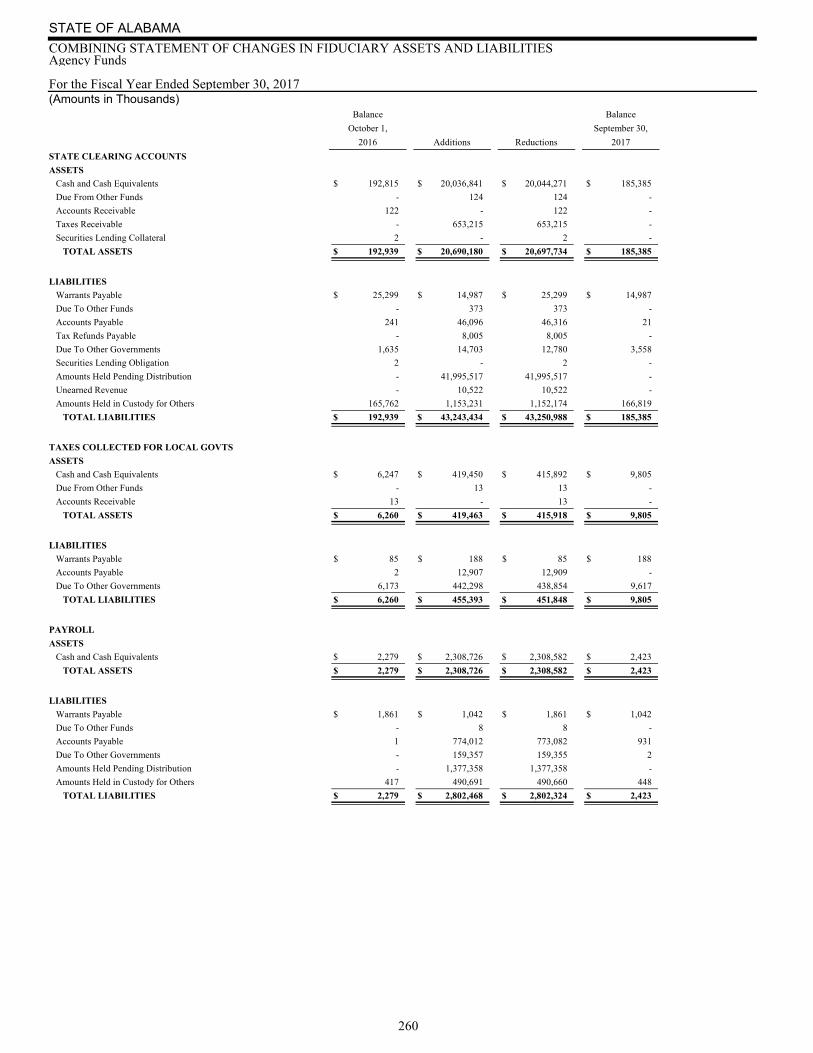
For the Fiscal Year Ended September 30, 2017 (Amounts in Thousands)
STATE OF ALABAMA
COMBINING STATEMENT OF CHANGES IN FIDUCIARY ASSETS AND LIABILITIESAgency Funds
Balance Balance
October 1, September 30,
2016 Additions Reductions 2017
STATE CLEARING ACCOUNTS
ASSETS
Cash and Cash Equivalents $ 192,815 $ 20,036,841 $ 20,044,271 $ 185,385
Due From Other Funds - 124 124 -
Accounts Receivable 122 - 122 -
Taxes Receivable - 653,215 653,215 -
Securities Lending Collateral 2 - 2 -
TOTAL ASSETS $ 192,939 $ 20,690,180 $ 20,697,734 $ 185,385
LIABILITIES
Warrants Payable $ 25,299 $ 14,987 $ 25,299 $ 14,987
Due To Other Funds - 373 373 -
Accounts Payable 241 46,096 46,316 21
Tax Refunds Payable - 8,005 8,005 -
Due To Other Governments 1,635 14,703 12,780 3,558
Securities Lending Obligation 2 - 2 -
Amounts Held Pending Distribution - 41,995,517 41,995,517 -
Unearned Revenue - 10,522 10,522 -
Amounts Held in Custody for Others 165,762 1,153,231 1,152,174 166,819
TOTAL LIABILITIES $ 192,939 $ 43,243,434 $ 43,250,988 $ 185,385
TAXES COLLECTED FOR LOCAL GOVTS
ASSETS
Cash and Cash Equivalents $ 6,247 $ 419,450 $ 415,892 $ 9,805
Due From Other Funds - 13 13 -
Accounts Receivable 13 - 13 -
TOTAL ASSETS $ 6,260 $ 419,463 $ 415,918 $ 9,805
LIABILITIES
Warrants Payable $ 85 $ 188 $ 85 $ 188
Accounts Payable 2 12,907 12,909 -
Due To Other Governments 6,173 442,298 438,854 9,617
TOTAL LIABILITIES $ 6,260 $ 455,393 $ 451,848 $ 9,805
PAYROLL
ASSETS
Cash and Cash Equivalents $ 2,279 $ 2,308,726 $ 2,308,582 $ 2,423
TOTAL ASSETS $ 2,279 $ 2,308,726 $ 2,308,582 $ 2,423
LIABILITIES
Warrants Payable $ 1,861 $ 1,042 $ 1,861 $ 1,042
Due To Other Funds - 8 8 -
Accounts Payable 1 774,012 773,082 931
Due To Other Governments - 159,357 159,355 2
Amounts Held Pending Distribution - 1,377,358 1,377,358 -
Amounts Held in Custody for Others 417 490,691 490,660 448
TOTAL LIABILITIES $ 2,279 $ 2,802,468 $ 2,802,324 $ 2,423
260
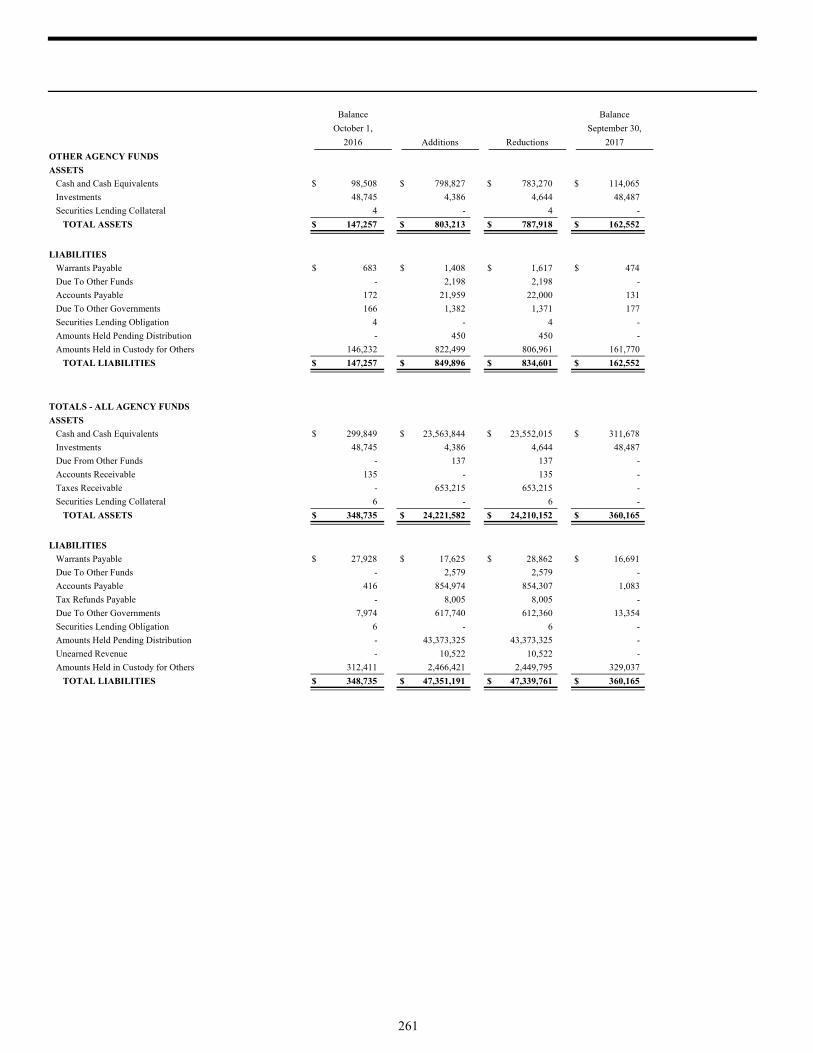
Balance Balance
October 1, September 30,
2016 Additions Reductions 2017
OTHER AGENCY FUNDS
ASSETS
Cash and Cash Equivalents $ 98,508 $ 798,827 $ 783,270 $ 114,065
Investments 48,745 4,386 4,644 48,487
Securities Lending Collateral 4 - 4 -
TOTAL ASSETS $ 147,257 $ 803,213 $ 787,918 $ 162,552
LIABILITIES
Warrants Payable $ 683 $ 1,408 $ 1,617 $ 474
Due To Other Funds - 2,198 2,198 -
Accounts Payable 172 21,959 22,000 131
Due To Other Governments 166 1,382 1,371 177
Securities Lending Obligation 4 - 4 -
Amounts Held Pending Distribution - 450 450 -
Amounts Held in Custody for Others 146,232 822,499 806,961 161,770
TOTAL LIABILITIES $ 147,257 $ 849,896 $ 834,601 $ 162,552
TOTALS - ALL AGENCY FUNDS
ASSETS
Cash and Cash Equivalents $ 299,849 $ 23,563,844 $ 23,552,015 $ 311,678
Investments 48,745 4,386 4,644 48,487
Due From Other Funds - 137 137 -
Accounts Receivable 135 - 135 -
Taxes Receivable - 653,215 653,215 -
Securities Lending Collateral 6 - 6 -
TOTAL ASSETS $ 348,735 $ 24,221,582 $ 24,210,152 $ 360,165
LIABILITIES
Warrants Payable $ 27,928 $ 17,625 $ 28,862 $ 16,691
Due To Other Funds - 2,579 2,579 -
Accounts Payable 416 854,974 854,307 1,083
Tax Refunds Payable - 8,005 8,005 -
Due To Other Governments 7,974 617,740 612,360 13,354
Securities Lending Obligation 6 - 6 -
Amounts Held Pending Distribution - 43,373,325 43,373,325 -
Unearned Revenue - 10,522 10,522 -
Amounts Held in Custody for Others 312,411 2,466,421 2,449,795 329,037
TOTAL LIABILITIES $ 348,735 $ 47,351,191 $ 47,339,761 $ 360,165
261
262
Nonmajor Component Units Water Pollution Control Authority Issues revolving loan bonds and lends the proceeds to eligible municipalities at below market interest rates for the construction of wastewater treatment and collection facilities. Drinking Water Finance Authority Issues revolving loan bonds and lends the bond proceeds to local governments at below market rates for the construction of drinking water treatment and distribution facilities. Troy University Reports the operations and balances of the University. Alabama State University Reports the operations and balances of the University. Alabama Agricultural and Mechanical University Reports the operations and balances of the University. Jacksonville State University Reports the operations and balances of the University. University of North Alabama Reports the operations and balances of the University. University of Montevallo Reports the operations and balances of the University. University of West Alabama Reports the operations and balances of the University. Historical Commission Preserves and maintains buildings, objects, and sites of historical significance. State Employees Health Insurance Manages a health insurance plan for State employees. Other Nonmajor Component Units Combined totals of other nonmajor component units, which are reported in more detail later in this report.
263
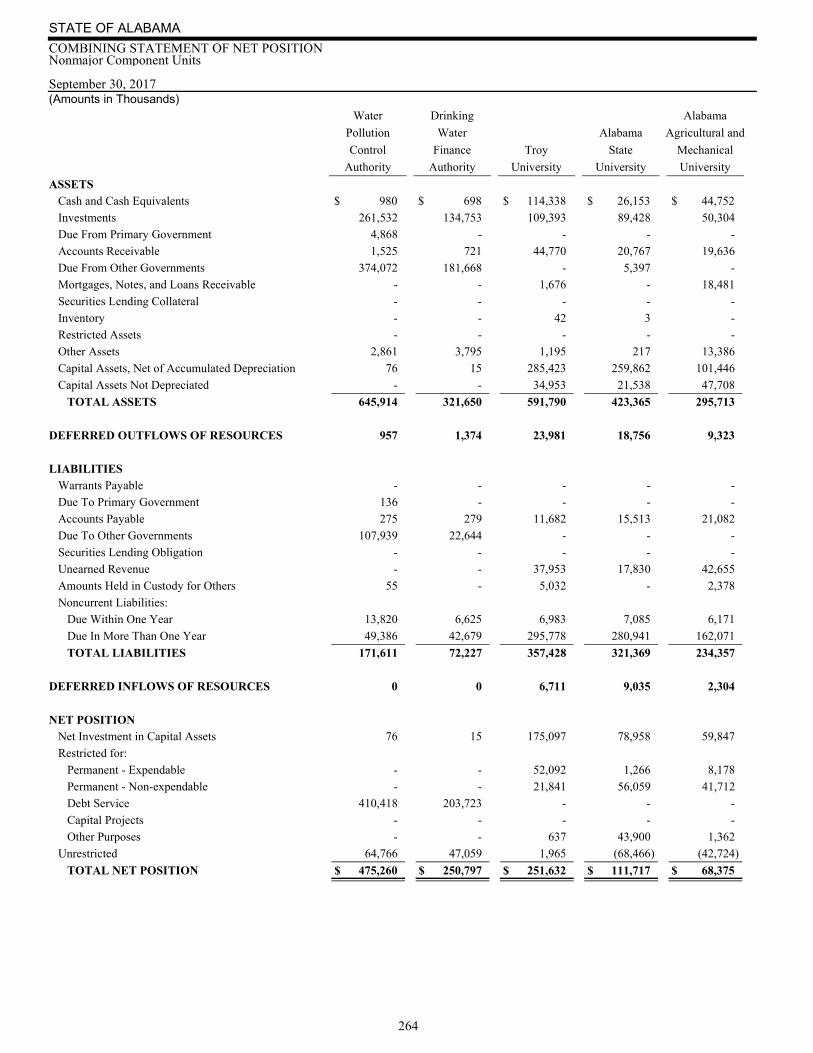
September 30, 2017(Amounts in Thousands)
STATE OF ALABAMA
COMBINING STATEMENT OF NET POSITIONNonmajor Component Units
Water Drinking Alabama
Pollution Water Alabama Agricultural and
Control Finance Troy State Mechanical
Authority Authority University University University
ASSETS Cash and Cash Equivalents $ 980 $ 698 $ 114,338 $ 26,153 $ 44,752
Investments 261,532 134,753 109,393 89,428 50,304
Due From Primary Government 4,868 - - - -
Accounts Receivable 1,525 721 44,770 20,767 19,636
Due From Other Governments 374,072 181,668 - 5,397 -
Mortgages, Notes, and Loans Receivable - - 1,676 - 18,481
Securities Lending Collateral - - - - -
Inventory - - 42 3 -
Restricted Assets - - - - -
Other Assets 2,861 3,795 1,195 217 13,386
Capital Assets, Net of Accumulated Depreciation 76 15 285,423 259,862 101,446
Capital Assets Not Depreciated - - 34,953 21,538 47,708
TOTAL ASSETS 645,914 321,650 591,790 423,365 295,713
DEFERRED OUTFLOWS OF RESOURCES 957 1,374 23,981 18,756 9,323
LIABILITIES Warrants Payable - - - - -
Due To Primary Government 136 - - - -
Accounts Payable 275 279 11,682 15,513 21,082
Due To Other Governments 107,939 22,644 - - -
Securities Lending Obligation - - - - -
Unearned Revenue - - 37,953 17,830 42,655
Amounts Held in Custody for Others 55 - 5,032 - 2,378
Noncurrent Liabilities:
Due Within One Year 13,820 6,625 6,983 7,085 6,171
Due In More Than One Year 49,386 42,679 295,778 280,941 162,071
TOTAL LIABILITIES 171,611 72,227 357,428 321,369 234,357
DEFERRED INFLOWS OF RESOURCES 0 0 6,711 9,035 2,304
NET POSITION Net Investment in Capital Assets 76 15 175,097 78,958 59,847
Restricted for:
Permanent - Expendable - - 52,092 1,266 8,178
Permanent - Non-expendable - - 21,841 56,059 41,712
Debt Service 410,418 203,723 - - -
Capital Projects - - - - -
Other Purposes - - 637 43,900 1,362
Unrestricted 64,766 47,059 1,965 (68,466) (42,724)
TOTAL NET POSITION $ 475,260 $ 250,797 $ 251,632 $ 111,717 $ 68,375
264
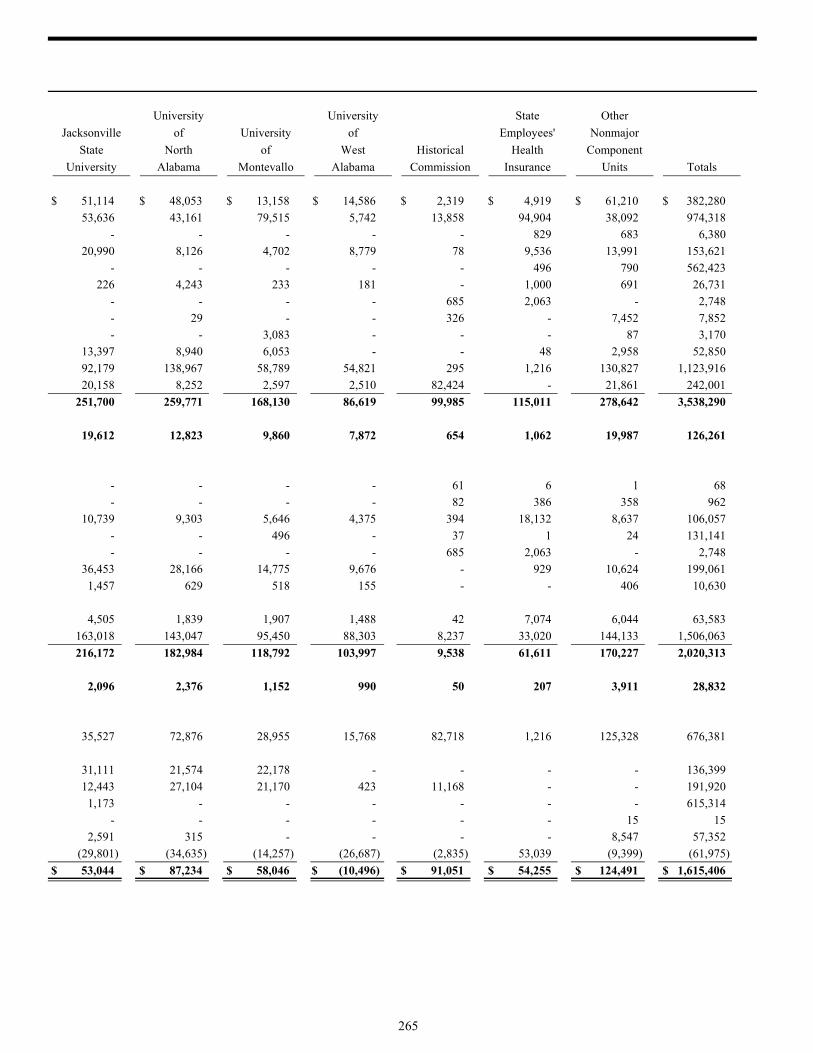
University University State Other
Jacksonville of University of Employees' Nonmajor
State North of West Historical Health Component
University Alabama Montevallo Alabama Commission Insurance Units Totals
$ 51,114 $ 48,053 $ 13,158 $ 14,586 $ 2,319 $ 4,919 $ 61,210 $ 382,280
53,636 43,161 79,515 5,742 13,858 94,904 38,092 974,318
- - - - - 829 683 6,380
20,990 8,126 4,702 8,779 78 9,536 13,991 153,621
- - - - - 496 790 562,423
226 4,243 233 181 - 1,000 691 26,731
- - - - 685 2,063 - 2,748
- 29 - - 326 - 7,452 7,852
- - 3,083 - - - 87 3,170
13,397 8,940 6,053 - - 48 2,958 52,850
92,179 138,967 58,789 54,821 295 1,216 130,827 1,123,916
20,158 8,252 2,597 2,510 82,424 - 21,861 242,001
251,700 259,771 168,130 86,619 99,985 115,011 278,642 3,538,290
19,612 12,823 9,860 7,872 654 1,062 19,987 126,261
- - - - 61 6 1 68
- - - - 82 386 358 962
10,739 9,303 5,646 4,375 394 18,132 8,637 106,057
- - 496 - 37 1 24 131,141
- - - - 685 2,063 - 2,748
36,453 28,166 14,775 9,676 - 929 10,624 199,061
1,457 629 518 155 - - 406 10,630
4,505 1,839 1,907 1,488 42 7,074 6,044 63,583
163,018 143,047 95,450 88,303 8,237 33,020 144,133 1,506,063
216,172 182,984 118,792 103,997 9,538 61,611 170,227 2,020,313
2,096 2,376 1,152 990 50 207 3,911 28,832
35,527 72,876 28,955 15,768 82,718 1,216 125,328 676,381
31,111 21,574 22,178 - - - - 136,399
12,443 27,104 21,170 423 11,168 - - 191,920
1,173 - - - - - - 615,314
- - - - - - 15 15
2,591 315 - - - - 8,547 57,352
(29,801) (34,635) (14,257) (26,687) (2,835) 53,039 (9,399) (61,975)
$ 53,044 $ 87,234 $ 58,046 $ (10,496) $ 91,051 $ 54,255 $ 124,491 $ 1,615,406
265
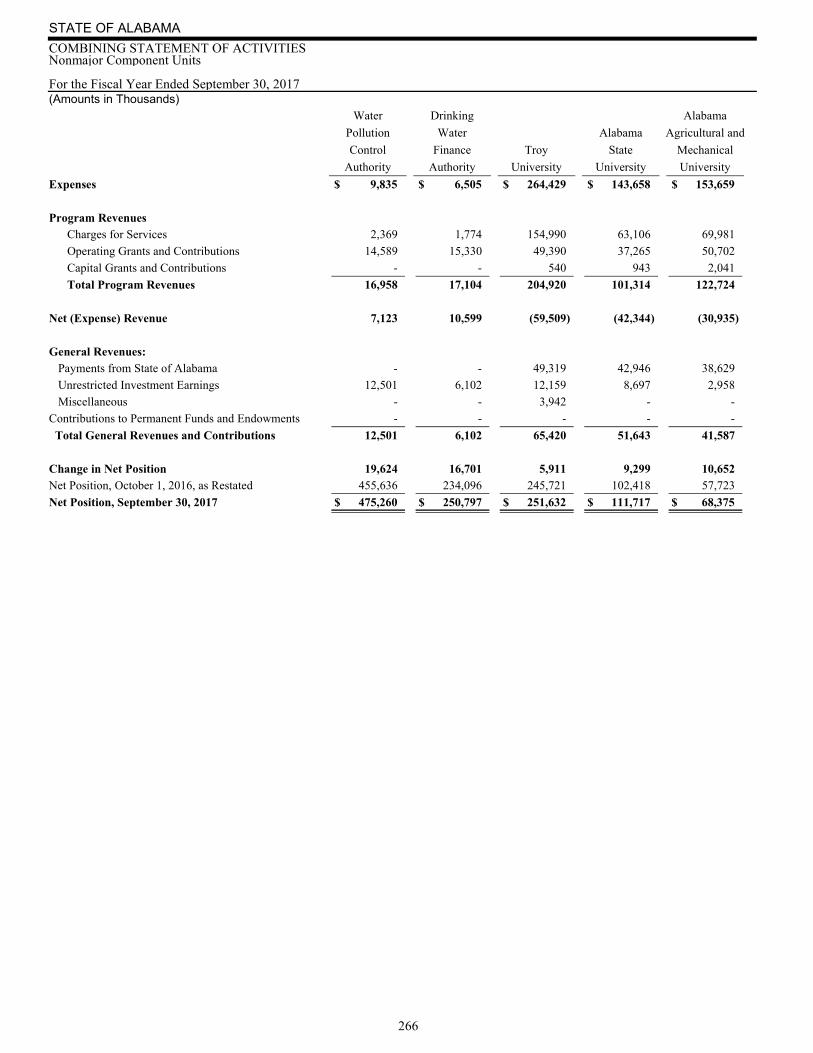
For the Fiscal Year Ended September 30, 2017(Amounts in Thousands)
STATE OF ALABAMA
COMBINING STATEMENT OF ACTIVITIESNonmajor Component Units
Water Drinking Alabama
Pollution Water Alabama Agricultural and
Control Finance Troy State Mechanical
Authority Authority University University University
Expenses $ 9,835 $ 6,505 $ 264,429 $ 143,658 $ 153,659
Program Revenues Charges for Services 2,369 1,774 154,990 63,106 69,981
Operating Grants and Contributions 14,589 15,330 49,390 37,265 50,702
Capital Grants and Contributions - - 540 943 2,041
Total Program Revenues 16,958 17,104 204,920 101,314 122,724
Net (Expense) Revenue 7,123 10,599 (59,509) (42,344) (30,935)
General Revenues: Payments from State of Alabama - - 49,319 42,946 38,629
Unrestricted Investment Earnings 12,501 6,102 12,159 8,697 2,958
Miscellaneous - - 3,942 - -
Contributions to Permanent Funds and Endowments - - - - -
Total General Revenues and Contributions 12,501 6,102 65,420 51,643 41,587
Change in Net Position 19,624 16,701 5,911 9,299 10,652Net Position, October 1, 2016, as Restated 455,636 234,096 245,721 102,418 57,723
Net Position, September 30, 2017 $ 475,260 $ 250,797 $ 251,632 $ 111,717 $ 68,375
266
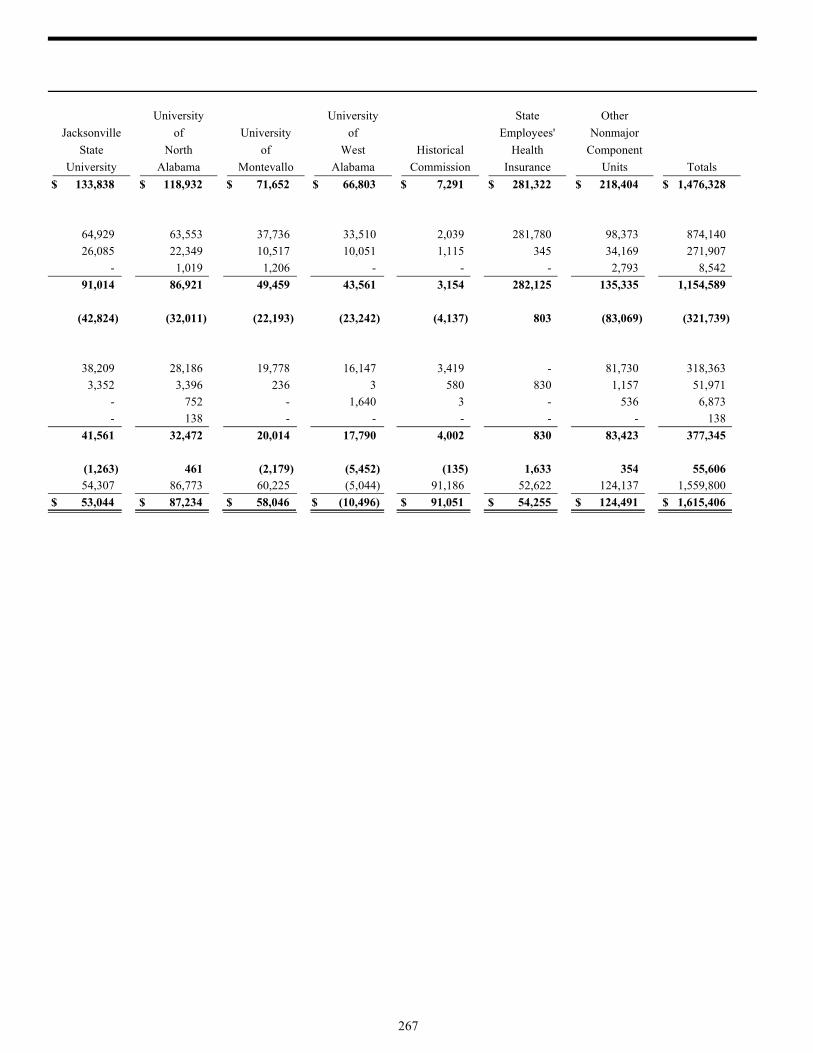
University University State Other
Jacksonville of University of Employees' Nonmajor
State North of West Historical Health Component
University Alabama Montevallo Alabama Commission Insurance Units Totals
$ 133,838 $ 118,932 $ 71,652 $ 66,803 $ 7,291 $ 281,322 $ 218,404 $ 1,476,328
64,929 63,553 37,736 33,510 2,039 281,780 98,373 874,140
26,085 22,349 10,517 10,051 1,115 345 34,169 271,907
- 1,019 1,206 - - - 2,793 8,542
91,014 86,921 49,459 43,561 3,154 282,125 135,335 1,154,589
(42,824) (32,011) (22,193) (23,242) (4,137) 803 (83,069) (321,739)
38,209 28,186 19,778 16,147 3,419 - 81,730 318,363
3,352 3,396 236 3 580 830 1,157 51,971
- 752 - 1,640 3 - 536 6,873
- 138 - - - - - 138
41,561 32,472 20,014 17,790 4,002 830 83,423 377,345
(1,263) 461 (2,179) (5,452) (135) 1,633 354 55,606 54,307 86,773 60,225 (5,044) 91,186 52,622 124,137 1,559,800
$ 53,044 $ 87,234 $ 58,046 $ (10,496) $ 91,051 $ 54,255 $ 124,491 $ 1,615,406
267
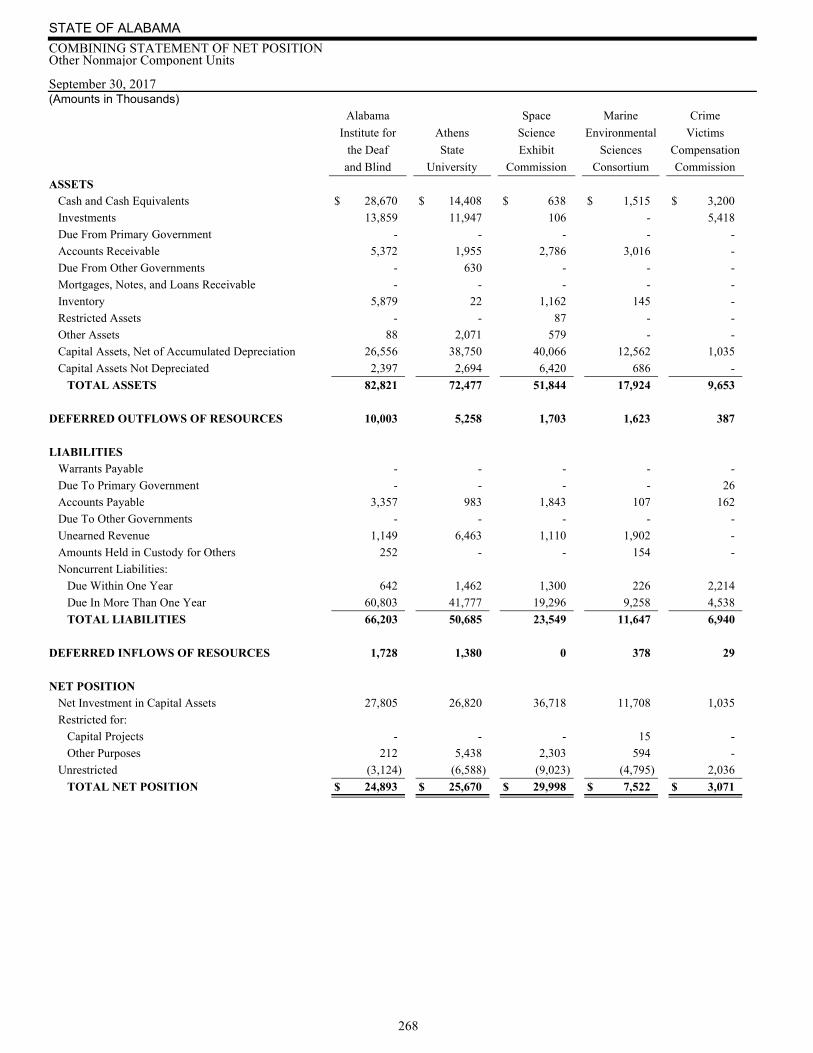
September 30, 2017(Amounts in Thousands)
STATE OF ALABAMA
COMBINING STATEMENT OF NET POSITIONOther Nonmajor Component Units
Alabama Space Marine Crime
Institute for Athens Science Environmental Victims
the Deaf State Exhibit Sciences Compensation
and Blind University Commission Consortium Commission
ASSETS Cash and Cash Equivalents $ 28,670 $ 14,408 $ 638 $ 1,515 $ 3,200
Investments 13,859 11,947 106 - 5,418
Due From Primary Government - - - - -
Accounts Receivable 5,372 1,955 2,786 3,016 -
Due From Other Governments - 630 - - -
Mortgages, Notes, and Loans Receivable - - - - -
Inventory 5,879 22 1,162 145 -
Restricted Assets - - 87 - -
Other Assets 88 2,071 579 - -
Capital Assets, Net of Accumulated Depreciation 26,556 38,750 40,066 12,562 1,035
Capital Assets Not Depreciated 2,397 2,694 6,420 686 -
TOTAL ASSETS 82,821 72,477 51,844 17,924 9,653
DEFERRED OUTFLOWS OF RESOURCES 10,003 5,258 1,703 1,623 387
LIABILITIES Warrants Payable - - - - -
Due To Primary Government - - - - 26
Accounts Payable 3,357 983 1,843 107 162
Due To Other Governments - - - - -
Unearned Revenue 1,149 6,463 1,110 1,902 -
Amounts Held in Custody for Others 252 - - 154 -
Noncurrent Liabilities:
Due Within One Year 642 1,462 1,300 226 2,214
Due In More Than One Year 60,803 41,777 19,296 9,258 4,538
TOTAL LIABILITIES 66,203 50,685 23,549 11,647 6,940
DEFERRED INFLOWS OF RESOURCES 1,728 1,380 0 378 29
NET POSITION Net Investment in Capital Assets 27,805 26,820 36,718 11,708 1,035
Restricted for:
Capital Projects - - - 15 -
Other Purposes 212 5,438 2,303 594 -
Unrestricted (3,124) (6,588) (9,023) (4,795) 2,036
TOTAL NET POSITION $ 24,893 $ 25,670 $ 29,998 $ 7,522 $ 3,071
268

U.S.S. Red
Alabama Historic Mountain Miscellaneous
Supercomputer Battleship Ironworks Recreation Component
Authority Commission Commission Commission Units Totals
$ 7,086 $ 2,595 $ 172 $ 523 $ 2,403 $ 61,210
- 5,606 - - 1,156 38,092
433 - - - 250 683
- 14 - 848 - 13,991
- - - - 160 790
- - - - 691 691
- 215 29 - - 7,452
- - - - - 87
- 71 10 90 49 2,958
1,815 6,295 1,733 1,706 309 130,827
- 794 1,054 7,655 161 21,861
9,334 15,590 2,998 10,822 5,179 278,642
253 305 199 181 75 19,987
- - - - 1 1
16 - - - 316 358
1,721 260 88 96 20 8,637
16 - - - 8 24
- - - - - 10,624
- - - - - 406
17 - 67 114 2 6,044
2,717 1,987 1,737 1,274 746 144,133
4,487 2,247 1,892 1,484 1,093 170,227
19 196 5 24 152 3,911
1,815 7,090 2,518 9,361 458 125,328
- - - - - 15
- - - - - 8,547
3,266 6,362 (1,218) 134 3,551 (9,399)
$ 5,081 $ 13,452 $ 1,300 $ 9,495 $ 4,009 $ 124,491
269

For the Fiscal Year Ended September 30, 2017(Amounts in Thousands)
STATE OF ALABAMA
COMBINING STATEMENT OF ACTIVITIESOther Nonmajor Component Units
Alabama Space Marine Crime
Institute for Athens Science Environmental Victims
the Deaf State Exhibit Sciences Compensation
and Blind University Commission Consortium Commission
Expenses $ 94,890 $ 36,083 $ 36,939 $ 18,494 $ 5,784
Program Revenues Charges for Services 28,551 15,796 34,236 2,855 3,569
Operating Grants and Contributions 12,322 8,502 570 9,972 1,078
Capital Grants and Contributions 257 - 2,030 - -
Total Program Revenues 41,130 24,298 36,836 12,827 4,647
Net (Expense) Revenue (53,760) (11,785) (103) (5,667) (1,137)
General Revenues: Payments from State of Alabama 53,004 13,608 1,496 4,438 90
Unrestricted Investment Earnings 647 485 5 2 -
Miscellaneous 525 - - - -
Total General Revenues 54,176 14,093 1,501 4,440 90
Change in Net Position 416 2,308 1,398 (1,227) (1,047)Net Position, October 1, 2016, as Restated 24,477 23,362 28,600 8,749 4,118
Net Position, September 30, 2017 $ 24,893 $ 25,670 $ 29,998 $ 7,522 $ 3,071
270
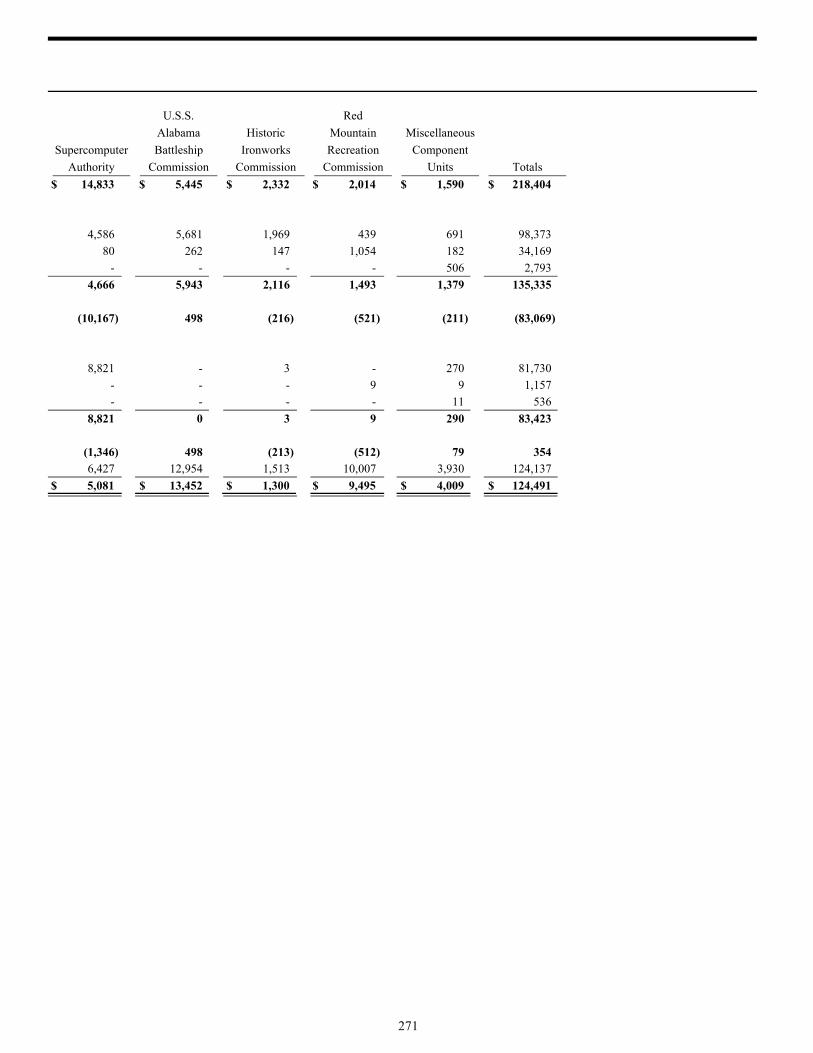
U.S.S. Red
Alabama Historic Mountain Miscellaneous
Supercomputer Battleship Ironworks Recreation Component
Authority Commission Commission Commission Units Totals
$ 14,833 $ 5,445 $ 2,332 $ 2,014 $ 1,590 $ 218,404
4,586 5,681 1,969 439 691 98,373
80 262 147 1,054 182 34,169
- - - - 506 2,793
4,666 5,943 2,116 1,493 1,379 135,335
(10,167) 498 (216) (521) (211) (83,069)
8,821 - 3 - 270 81,730
- - - 9 9 1,157
- - - - 11 536
8,821 0 3 9 290 83,423
(1,346) 498 (213) (512) 79 354 6,427 12,954 1,513 10,007 3,930 124,137
$ 5,081 $ 13,452 $ 1,300 $ 9,495 $ 4,009 $ 124,491
271

272
Supplemental Statements and SchedulesSupplemental Statements and Schedules presents schedules and statements which bring together information spread throughout the statements, presents information in greater detail, or presents information that demonstrates legal compliance.
273
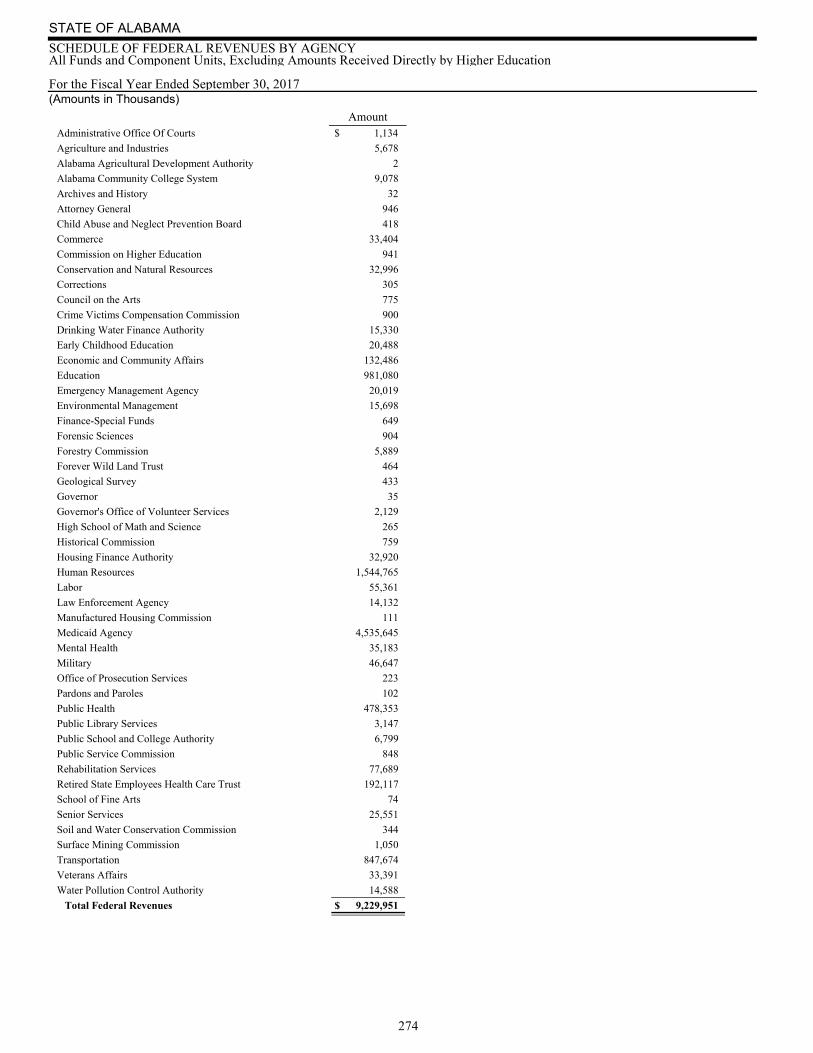
For the Fiscal Year Ended September 30, 2017(Amounts in Thousands)
STATE OF ALABAMA
SCHEDULE OF FEDERAL REVENUES BY AGENCYAll Funds and Component Units, Excluding Amounts Received Directly by Higher Education
Amount Administrative Office Of Courts $ 1,134
Agriculture and Industries 5,678
Alabama Agricultural Development Authority 2
Alabama Community College System 9,078
Archives and History 32
Attorney General 946
Child Abuse and Neglect Prevention Board 418
Commerce 33,404
Commission on Higher Education 941
Conservation and Natural Resources 32,996
Corrections 305
Council on the Arts 775
Crime Victims Compensation Commission 900
Drinking Water Finance Authority 15,330
Early Childhood Education 20,488
Economic and Community Affairs 132,486
Education 981,080
Emergency Management Agency 20,019
Environmental Management 15,698
Finance-Special Funds 649
Forensic Sciences 904
Forestry Commission 5,889
Forever Wild Land Trust 464
Geological Survey 433
Governor 35
Governor's Office of Volunteer Services 2,129
High School of Math and Science 265
Historical Commission 759
Housing Finance Authority 32,920
Human Resources 1,544,765
Labor 55,361
Law Enforcement Agency 14,132
Manufactured Housing Commission 111
Medicaid Agency 4,535,645
Mental Health 35,183
Military 46,647
Office of Prosecution Services 223
Pardons and Paroles 102
Public Health 478,353
Public Library Services 3,147
Public School and College Authority 6,799
Public Service Commission 848
Rehabilitation Services 77,689
Retired State Employees Health Care Trust 192,117
School of Fine Arts 74
Senior Services 25,551
Soil and Water Conservation Commission 344
Surface Mining Commission 1,050
Transportation 847,674
Veterans Affairs 33,391
Water Pollution Control Authority 14,588
Total Federal Revenues $ 9,229,951
274
STATE OF ALABAMA STATISTICAL SECTION
275
This part of the State of Alabama's Comprehensive Annual Financial Report presents detailed information as a context for understanding what the information in the financial statements, note disclosures, and required supplementary information says about the State's overall financial health.
Financial Trends Page 276
These schedules contain trend information to help the reader understand how the State's financial performance has changed over time.
Net Position by Component Changes in Net Position Fund Balances of Governmental Funds Changes in Fund Balances of Governmental Funds
Revenue Capacity Page 286
These schedules contain information to help the reader assess the factors affecting the State's ability to generate its individual income tax and corporate income tax.
Major Revenue Base Revenue Rates Principal Revenue Payers
Debt Capacity Page 294
These schedules present information that helps the reader assess the affordability of the State's current levels of outstanding debt and the State's ability to issue additional debt in the future.
Ratios of Outstanding Debt Ratios of General Bonded Debt Outstanding Debt Limitations Pledged Revenue Coverage
Demographic and Economic Information Page 302
These schedules offer demographic and economic indicators to help the reader understand the environment within which the State's financial activities take place.
Labor Force Statistics Population/Per Capita Personal Income Statistics Top Ten Employers in Alabama
Operating Information Page 306
These schedules contain service and infrastructure data to help the reader understand how the information in the State's financial report relates to the services the State provides and the activities it performs.
State Government Employment by Function Indicators of Demand or Level of Service Indicators of Volume, Usage and Nature of Capital Assets
Sources: Unless otherwise noted, the information in these schedules is derived from the comprehensive annual financial reports for the relevant year. Note: The number of years presented on each schedule varies according to available data.
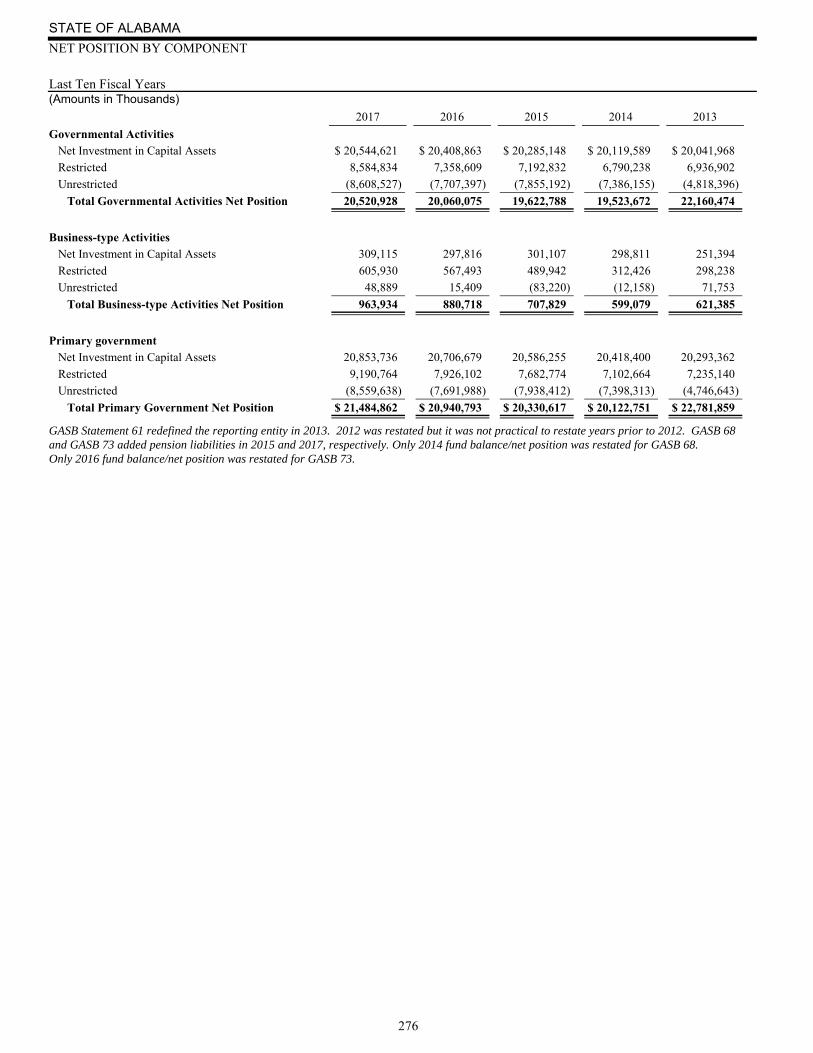
Last Ten Fiscal Years(Amounts in Thousands)
STATE OF ALABAMA
NET POSITION BY COMPONENT
2017 2016 2015 2014 2013
GASB Statement 61 redefined the reporting entity in 2013. 2012 was restated but it was not practical to restate years prior to 2012. GASB 68 and GASB 73 added pension liabilities in 2015 and 2017, respectively. Only 2014 fund balance/net position was restated for GASB 68.Only 2016 fund balance/net position was restated for GASB 73.
Governmental Activities Net Investment in Capital Assets $ 20,544,621 $ 20,408,863 $ 20,285,148 $ 20,119,589 $ 20,041,968
Restricted 8,584,834 7,358,609 7,192,832 6,790,238 6,936,902
Unrestricted (8,608,527) (7,707,397) (7,855,192) (7,386,155) (4,818,396)
Total Governmental Activities Net Position 20,520,928 20,060,075 19,622,788 19,523,672 22,160,474
Business-type Activities Net Investment in Capital Assets 309,115 297,816 301,107 298,811 251,394
Restricted 605,930 567,493 489,942 312,426 298,238
Unrestricted 48,889 15,409 (83,220) (12,158) 71,753
Total Business-type Activities Net Position 963,934 880,718 707,829 599,079 621,385
Primary government Net Investment in Capital Assets 20,853,736 20,706,679 20,586,255 20,418,400 20,293,362
Restricted 9,190,764 7,926,102 7,682,774 7,102,664 7,235,140
Unrestricted (8,559,638) (7,691,988) (7,938,412) (7,398,313) (4,746,643)
Total Primary Government Net Position $ 21,484,862 $ 20,940,793 $ 20,330,617 $ 20,122,751 $ 22,781,859
276

2012 2011 2010 2009 2008
$ 19,633,646 $ 19,091,325 $ 18,552,943 $ 18,176,534 $ 17,603,340
6,046,381 5,387,811 4,801,716 4,454,757 4,633,017
(4,473,936) (1,513,001) (764,963) (649,340) (315,495)
21,206,091 22,966,135 22,589,696 21,981,950 21,920,862
235,360 175,650 249,695 290,477 257,911
163,285 415,535 46,739 40,040 429,274
72,020 (305,674) (71,628) 53,507 138,909
470,665 285,511 224,806 384,025 826,094
19,869,006 19,266,975 18,802,638 18,467,011 17,861,251
6,209,666 5,803,346 4,848,455 4,494,797 5,062,291
(4,401,916) (1,818,675) (836,591) (595,833) (176,586)
$ 21,676,756 $ 23,251,646 $ 22,814,502 $ 22,365,975 $ 22,746,956
277
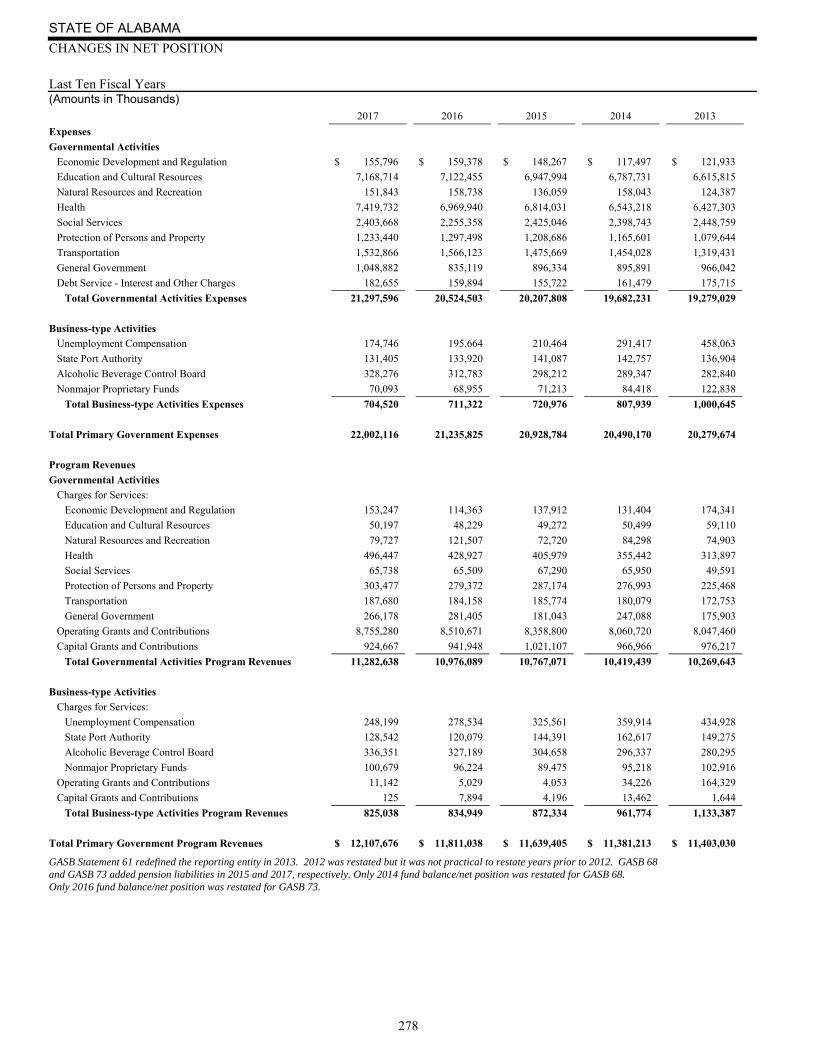
Last Ten Fiscal Years(Amounts in Thousands)
STATE OF ALABAMA
CHANGES IN NET POSITION
2017 2016 2015 2014 2013
GASB Statement 61 redefined the reporting entity in 2013. 2012 was restated but it was not practical to restate years prior to 2012. GASB 68 and GASB 73 added pension liabilities in 2015 and 2017, respectively. Only 2014 fund balance/net position was restated for GASB 68.Only 2016 fund balance/net position was restated for GASB 73.
Expenses
Governmental Activities
Economic Development and Regulation $ 155,796 $ 159,378 $ 148,267 $ 117,497 $ 121,933
Education and Cultural Resources 7,168,714 7,122,455 6,947,994 6,787,731 6,615,815
Natural Resources and Recreation 151,843 158,738 136,059 158,043 124,387
Health 7,419,732 6,969,940 6,814,031 6,543,218 6,427,303
Social Services 2,403,668 2,255,358 2,425,046 2,398,743 2,448,759
Protection of Persons and Property 1,233,440 1,297,498 1,208,686 1,165,601 1,079,644
Transportation 1,532,866 1,566,123 1,475,669 1,454,028 1,319,431
General Government 1,048,882 835,119 896,334 895,891 966,042
Debt Service - Interest and Other Charges 182,655 159,894 155,722 161,479 175,715
Total Governmental Activities Expenses 21,297,596 20,524,503 20,207,808 19,682,231 19,279,029
Business-type Activities
Unemployment Compensation 174,746 195,664 210,464 291,417 458,063
State Port Authority 131,405 133,920 141,087 142,757 136,904
Alcoholic Beverage Control Board 328,276 312,783 298,212 289,347 282,840
Nonmajor Proprietary Funds 70,093 68,955 71,213 84,418 122,838
Total Business-type Activities Expenses 704,520 711,322 720,976 807,939 1,000,645
Total Primary Government Expenses 22,002,116 21,235,825 20,928,784 20,490,170 20,279,674
Program Revenues
Governmental Activities
Charges for Services:
Economic Development and Regulation 153,247 114,363 137,912 131,404 174,341
Education and Cultural Resources 50,197 48,229 49,272 50,499 59,110
Natural Resources and Recreation 79,727 121,507 72,720 84,298 74,903
Health 496,447 428,927 405,979 355,442 313,897
Social Services 65,738 65,509 67,290 65,950 49,591
Protection of Persons and Property 303,477 279,372 287,174 276,993 225,468
Transportation 187,680 184,158 185,774 180,079 172,753
General Government 266,178 281,405 181,043 247,088 175,903
Operating Grants and Contributions 8,755,280 8,510,671 8,358,800 8,060,720 8,047,460
Capital Grants and Contributions 924,667 941,948 1,021,107 966,966 976,217
Total Governmental Activities Program Revenues 11,282,638 10,976,089 10,767,071 10,419,439 10,269,643
Business-type Activities
Charges for Services:
Unemployment Compensation 248,199 278,534 325,561 359,914 434,928
State Port Authority 128,542 120,079 144,391 162,617 149,275
Alcoholic Beverage Control Board 336,351 327,189 304,658 296,337 280,295
Nonmajor Proprietary Funds 100,679 96,224 89,475 95,218 102,916
Operating Grants and Contributions 11,142 5,029 4,053 34,226 164,329
Capital Grants and Contributions 125 7,894 4,196 13,462 1,644
Total Business-type Activities Program Revenues 825,038 834,949 872,334 961,774 1,133,387
Total Primary Government Program Revenues $ 12,107,676 $ 11,811,038 $ 11,639,405 $ 11,381,213 $ 11,403,030
278
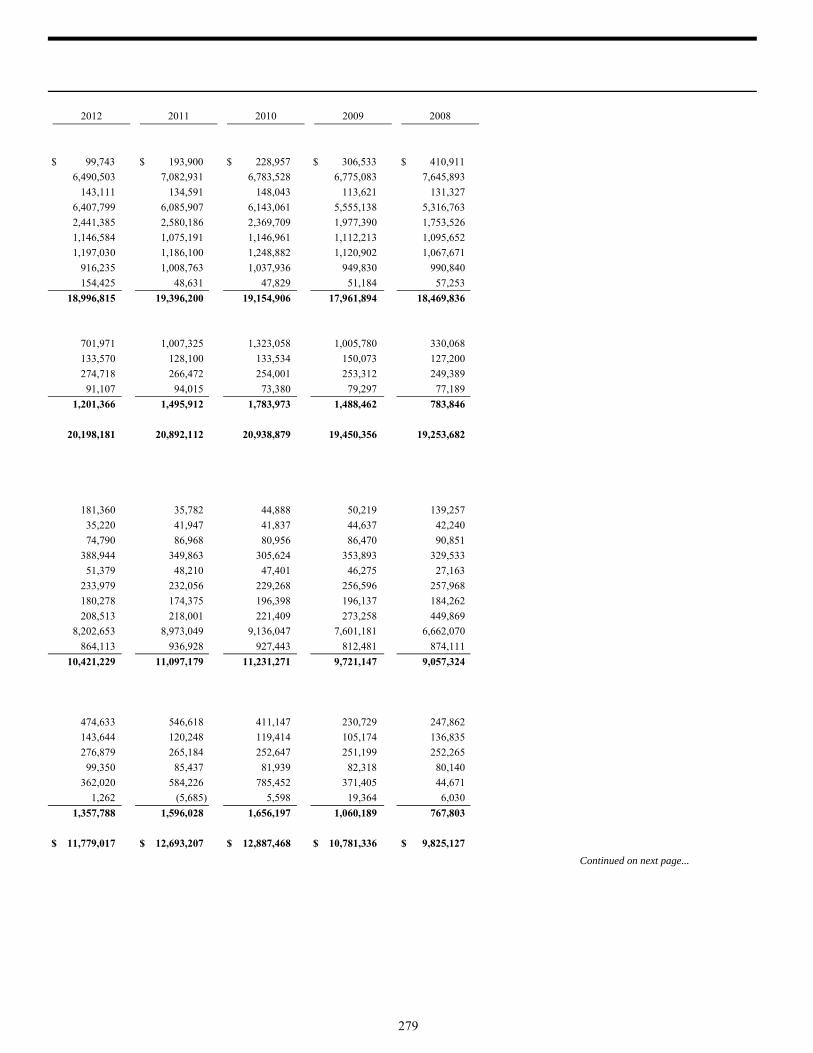
2012 2011 2010 2009 2008
Continued on next page...
$ 99,743 $ 193,900 $ 228,957 $ 306,533 $ 410,911
6,490,503 7,082,931 6,783,528 6,775,083 7,645,893
143,111 134,591 148,043 113,621 131,327
6,407,799 6,085,907 6,143,061 5,555,138 5,316,763
2,441,385 2,580,186 2,369,709 1,977,390 1,753,526
1,146,584 1,075,191 1,146,961 1,112,213 1,095,652
1,197,030 1,186,100 1,248,882 1,120,902 1,067,671
916,235 1,008,763 1,037,936 949,830 990,840
154,425 48,631 47,829 51,184 57,253
18,996,815 19,396,200 19,154,906 17,961,894 18,469,836
701,971 1,007,325 1,323,058 1,005,780 330,068
133,570 128,100 133,534 150,073 127,200
274,718 266,472 254,001 253,312 249,389
91,107 94,015 73,380 79,297 77,189
1,201,366 1,495,912 1,783,973 1,488,462 783,846
20,198,181 20,892,112 20,938,879 19,450,356 19,253,682
181,360 35,782 44,888 50,219 139,257
35,220 41,947 41,837 44,637 42,240
74,790 86,968 80,956 86,470 90,851
388,944 349,863 305,624 353,893 329,533
51,379 48,210 47,401 46,275 27,163
233,979 232,056 229,268 256,596 257,968
180,278 174,375 196,398 196,137 184,262
208,513 218,001 221,409 273,258 449,869
8,202,653 8,973,049 9,136,047 7,601,181 6,662,070
864,113 936,928 927,443 812,481 874,111
10,421,229 11,097,179 11,231,271 9,721,147 9,057,324
474,633 546,618 411,147 230,729 247,862
143,644 120,248 119,414 105,174 136,835
276,879 265,184 252,647 251,199 252,265
99,350 85,437 81,939 82,318 80,140
362,020 584,226 785,452 371,405 44,671
1,262 (5,685) 5,598 19,364 6,030
1,357,788 1,596,028 1,656,197 1,060,189 767,803
$ 11,779,017 $ 12,693,207 $ 12,887,468 $ 10,781,336 $ 9,825,127
279
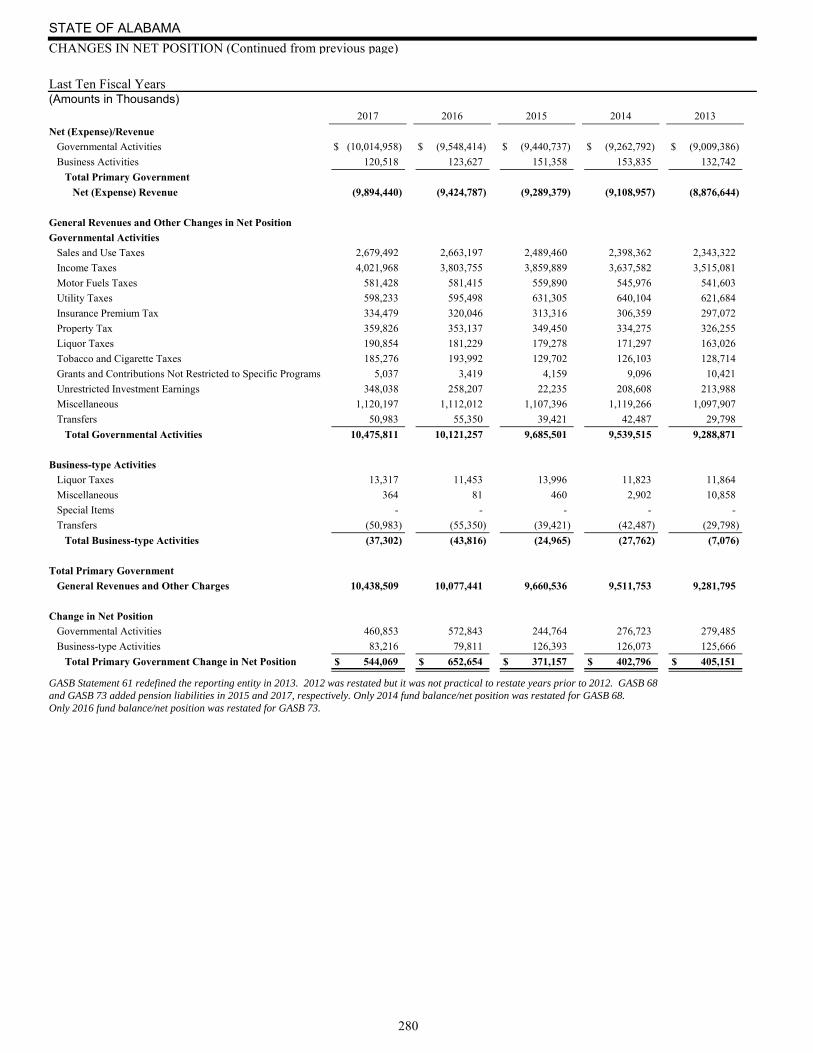
Last Ten Fiscal Years(Amounts in Thousands)
STATE OF ALABAMA
CHANGES IN NET POSITION (Continued from previous page)
2017 2016 2015 2014 2013
GASB Statement 61 redefined the reporting entity in 2013. 2012 was restated but it was not practical to restate years prior to 2012. GASB 68 and GASB 73 added pension liabilities in 2015 and 2017, respectively. Only 2014 fund balance/net position was restated for GASB 68.Only 2016 fund balance/net position was restated for GASB 73.
Net (Expense)/Revenue
Governmental Activities $ (10,014,958) $ (9,548,414) $ (9,440,737) $ (9,262,792) $ (9,009,386)
Business Activities 120,518 123,627 151,358 153,835 132,742
Total Primary Government
Net (Expense) Revenue (9,894,440) (9,424,787) (9,289,379) (9,108,957) (8,876,644)
General Revenues and Other Changes in Net Position
Governmental Activities
Sales and Use Taxes 2,679,492 2,663,197 2,489,460 2,398,362 2,343,322
Income Taxes 4,021,968 3,803,755 3,859,889 3,637,582 3,515,081
Motor Fuels Taxes 581,428 581,415 559,890 545,976 541,603
Utility Taxes 598,233 595,498 631,305 640,104 621,684
Insurance Premium Tax 334,479 320,046 313,316 306,359 297,072
Property Tax 359,826 353,137 349,450 334,275 326,255
Liquor Taxes 190,854 181,229 179,278 171,297 163,026
Tobacco and Cigarette Taxes 185,276 193,992 129,702 126,103 128,714
Grants and Contributions Not Restricted to Specific Programs 5,037 3,419 4,159 9,096 10,421
Unrestricted Investment Earnings 348,038 258,207 22,235 208,608 213,988
Miscellaneous 1,120,197 1,112,012 1,107,396 1,119,266 1,097,907
Transfers 50,983 55,350 39,421 42,487 29,798
Total Governmental Activities 10,475,811 10,121,257 9,685,501 9,539,515 9,288,871
Business-type Activities
Liquor Taxes 13,317 11,453 13,996 11,823 11,864
Miscellaneous 364 81 460 2,902 10,858
Special Items - - - - -
Transfers (50,983) (55,350) (39,421) (42,487) (29,798)
Total Business-type Activities (37,302) (43,816) (24,965) (27,762) (7,076)
Total Primary Government
General Revenues and Other Charges 10,438,509 10,077,441 9,660,536 9,511,753 9,281,795
Change in Net Position
Governmental Activities 460,853 572,843 244,764 276,723 279,485
Business-type Activities 83,216 79,811 126,393 126,073 125,666
Total Primary Government Change in Net Position $ 544,069 $ 652,654 $ 371,157 $ 402,796 $ 405,151
280
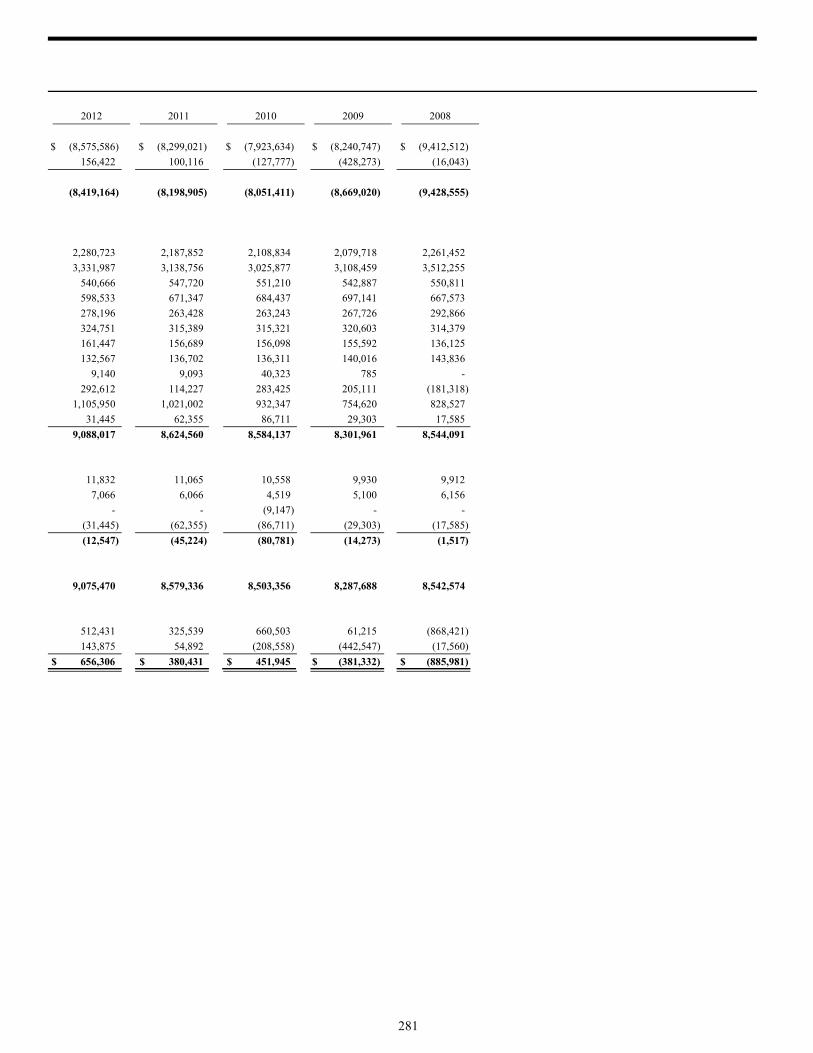
2012 2011 2010 2009 2008
$ (8,575,586) $ (8,299,021) $ (7,923,634) $ (8,240,747) $ (9,412,512)
156,422 100,116 (127,777) (428,273) (16,043)
(8,419,164) (8,198,905) (8,051,411) (8,669,020) (9,428,555)
2,280,723 2,187,852 2,108,834 2,079,718 2,261,452
3,331,987 3,138,756 3,025,877 3,108,459 3,512,255
540,666 547,720 551,210 542,887 550,811
598,533 671,347 684,437 697,141 667,573
278,196 263,428 263,243 267,726 292,866
324,751 315,389 315,321 320,603 314,379
161,447 156,689 156,098 155,592 136,125
132,567 136,702 136,311 140,016 143,836
9,140 9,093 40,323 785 -
292,612 114,227 283,425 205,111 (181,318)
1,105,950 1,021,002 932,347 754,620 828,527
31,445 62,355 86,711 29,303 17,585
9,088,017 8,624,560 8,584,137 8,301,961 8,544,091
11,832 11,065 10,558 9,930 9,912
7,066 6,066 4,519 5,100 6,156
- - (9,147) - -
(31,445) (62,355) (86,711) (29,303) (17,585)
(12,547) (45,224) (80,781) (14,273) (1,517)
9,075,470 8,579,336 8,503,356 8,287,688 8,542,574
512,431 325,539 660,503 61,215 (868,421)
143,875 54,892 (208,558) (442,547) (17,560)
$ 656,306 $ 380,431 $ 451,945 $ (381,332) $ (885,981)
281
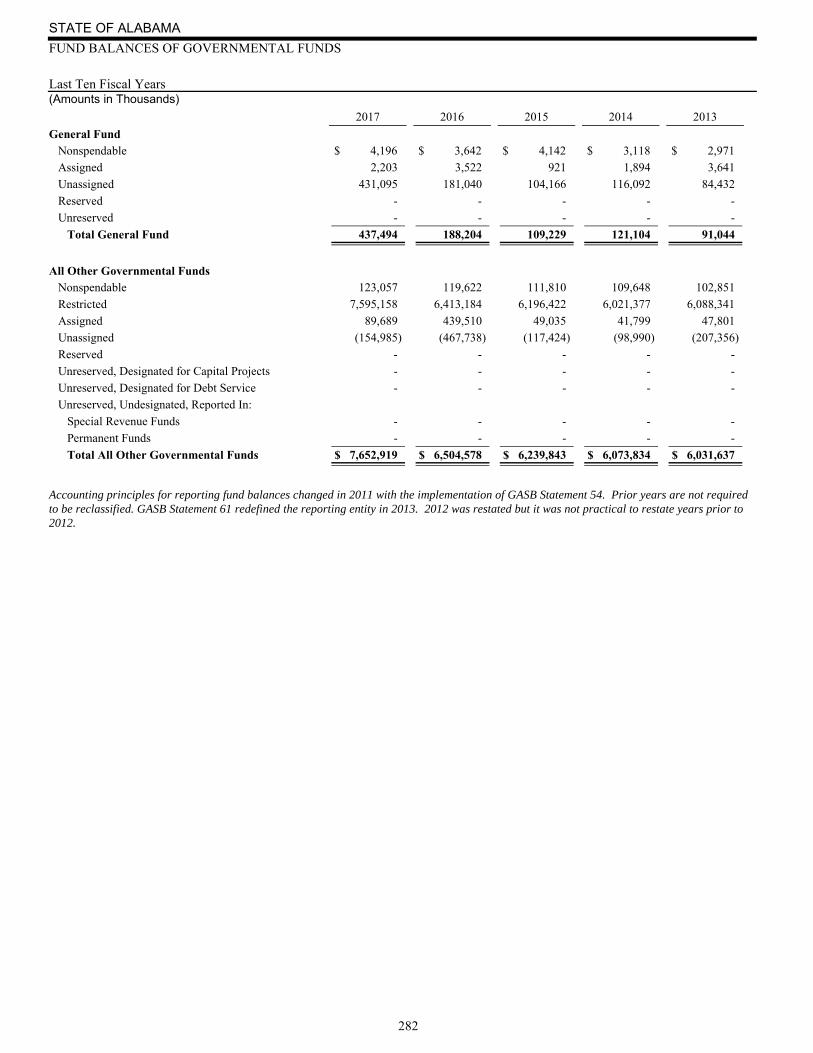
Last Ten Fiscal Years(Amounts in Thousands)
STATE OF ALABAMA
FUND BALANCES OF GOVERNMENTAL FUNDS
2017 2016 2015 2014 2013
Accounting principles for reporting fund balances changed in 2011 with the implementation of GASB Statement 54. Prior years are not required to be reclassified. GASB Statement 61 redefined the reporting entity in 2013. 2012 was restated but it was not practical to restate years prior to 2012.
General Fund Nonspendable $ 4,196 $ 3,642 $ 4,142 $ 3,118 $ 2,971
Assigned 2,203 3,522 921 1,894 3,641
Unassigned 431,095 181,040 104,166 116,092 84,432
Reserved - - - - -
Unreserved - - - - -
Total General Fund 437,494 188,204 109,229 121,104 91,044
All Other Governmental Funds Nonspendable 123,057 119,622 111,810 109,648 102,851
Restricted 7,595,158 6,413,184 6,196,422 6,021,377 6,088,341
Assigned 89,689 439,510 49,035 41,799 47,801
Unassigned (154,985) (467,738) (117,424) (98,990) (207,356)
Reserved - - - - -
Unreserved, Designated for Capital Projects - - - - -
Unreserved, Designated for Debt Service - - - - -
Unreserved, Undesignated, Reported In:
Special Revenue Funds - - - - -
Permanent Funds - - - - -
Total All Other Governmental Funds $ 7,652,919 $ 6,504,578 $ 6,239,843 $ 6,073,834 $ 6,031,637
282
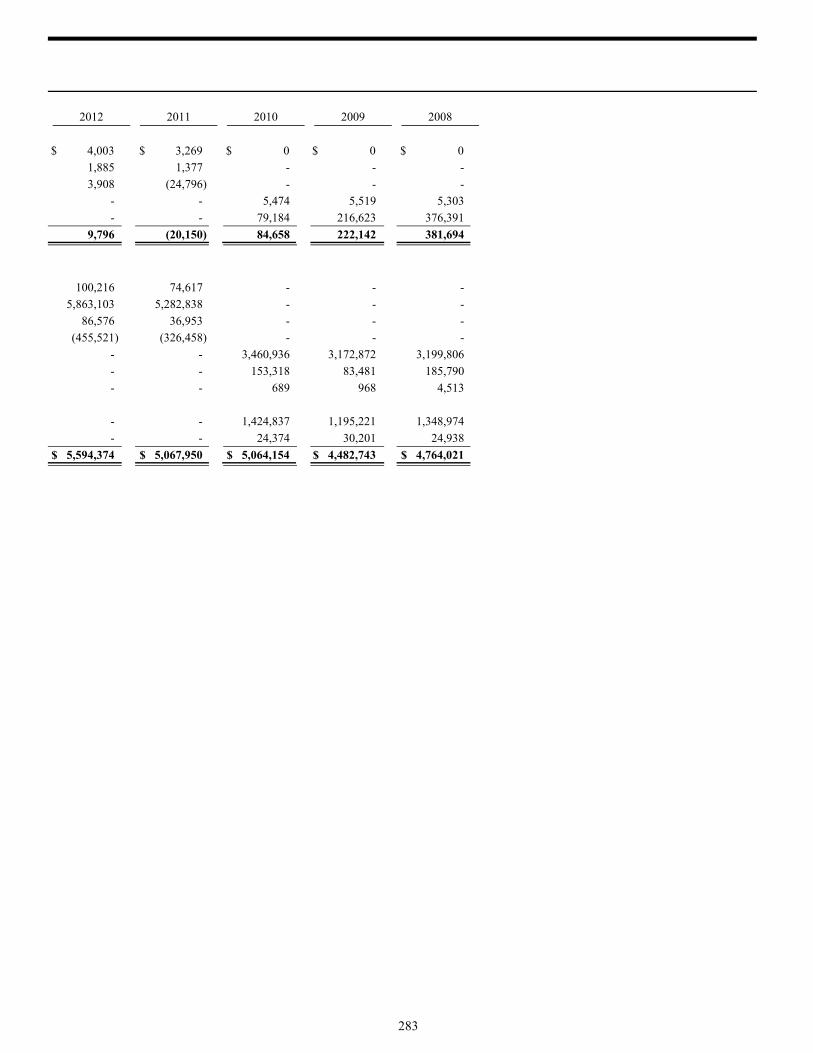
2012 2011 2010 2009 2008
$ 4,003 $ 3,269 $ 0 $ 0 $ 0
1,885 1,377 - - -
3,908 (24,796) - - -
- - 5,474 5,519 5,303
- - 79,184 216,623 376,391
9,796 (20,150) 84,658 222,142 381,694
100,216 74,617 - - -
5,863,103 5,282,838 - - -
86,576 36,953 - - -
(455,521) (326,458) - - -
- - 3,460,936 3,172,872 3,199,806
- - 153,318 83,481 185,790
- - 689 968 4,513
- - 1,424,837 1,195,221 1,348,974
- - 24,374 30,201 24,938
$ 5,594,374 $ 5,067,950 $ 5,064,154 $ 4,482,743 $ 4,764,021
283
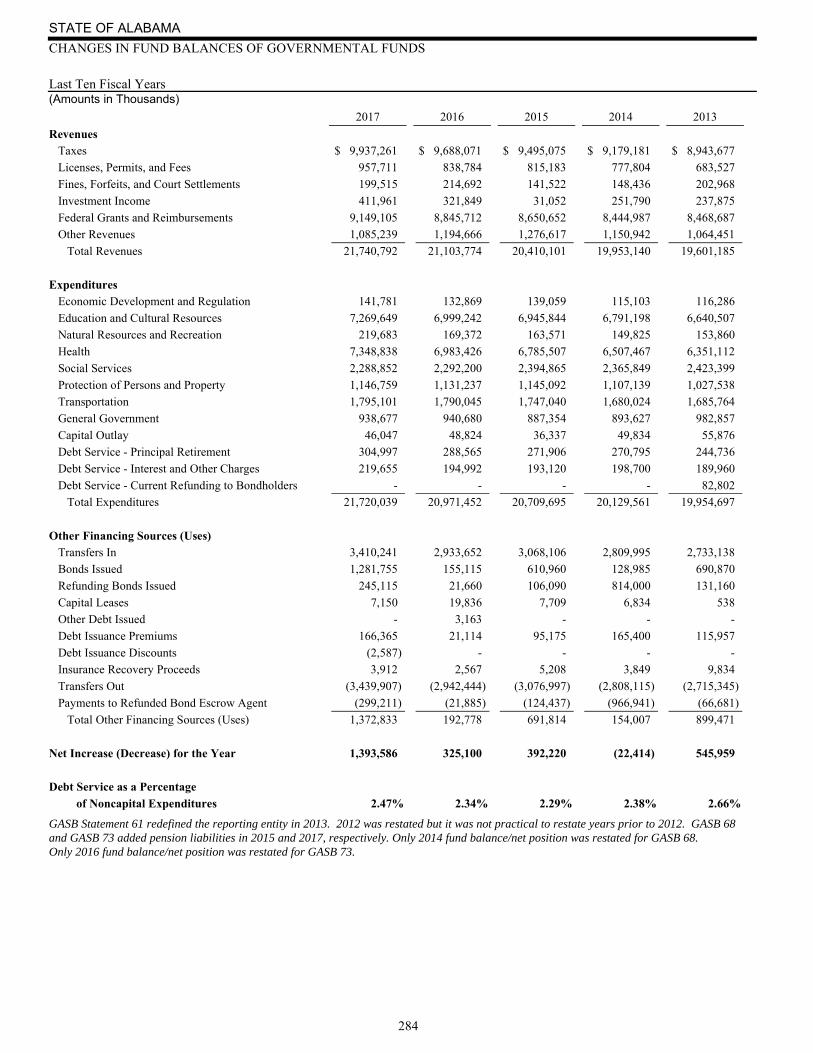
Last Ten Fiscal Years(Amounts in Thousands)
STATE OF ALABAMA
CHANGES IN FUND BALANCES OF GOVERNMENTAL FUNDS
2017 2016 2015 2014 2013
GASB Statement 61 redefined the reporting entity in 2013. 2012 was restated but it was not practical to restate years prior to 2012. GASB 68 and GASB 73 added pension liabilities in 2015 and 2017, respectively. Only 2014 fund balance/net position was restated for GASB 68.Only 2016 fund balance/net position was restated for GASB 73.
Revenues Taxes $ 9,937,261 $ 9,688,071 $ 9,495,075 $ 9,179,181 $ 8,943,677
Licenses, Permits, and Fees 957,711 838,784 815,183 777,804 683,527
Fines, Forfeits, and Court Settlements 199,515 214,692 141,522 148,436 202,968
Investment Income 411,961 321,849 31,052 251,790 237,875
Federal Grants and Reimbursements 9,149,105 8,845,712 8,650,652 8,444,987 8,468,687
Other Revenues 1,085,239 1,194,666 1,276,617 1,150,942 1,064,451
Total Revenues 21,740,792 21,103,774 20,410,101 19,953,140 19,601,185
Expenditures Economic Development and Regulation 141,781 132,869 139,059 115,103 116,286
Education and Cultural Resources 7,269,649 6,999,242 6,945,844 6,791,198 6,640,507
Natural Resources and Recreation 219,683 169,372 163,571 149,825 153,860
Health 7,348,838 6,983,426 6,785,507 6,507,467 6,351,112
Social Services 2,288,852 2,292,200 2,394,865 2,365,849 2,423,399
Protection of Persons and Property 1,146,759 1,131,237 1,145,092 1,107,139 1,027,538
Transportation 1,795,101 1,790,045 1,747,040 1,680,024 1,685,764
General Government 938,677 940,680 887,354 893,627 982,857
Capital Outlay 46,047 48,824 36,337 49,834 55,876
Debt Service - Principal Retirement 304,997 288,565 271,906 270,795 244,736
Debt Service - Interest and Other Charges 219,655 194,992 193,120 198,700 189,960
Debt Service - Current Refunding to Bondholders - - - - 82,802
Total Expenditures 21,720,039 20,971,452 20,709,695 20,129,561 19,954,697
Other Financing Sources (Uses) Transfers In 3,410,241 2,933,652 3,068,106 2,809,995 2,733,138
Bonds Issued 1,281,755 155,115 610,960 128,985 690,870
Refunding Bonds Issued 245,115 21,660 106,090 814,000 131,160
Capital Leases 7,150 19,836 7,709 6,834 538
Other Debt Issued - 3,163 - - -
Debt Issuance Premiums 166,365 21,114 95,175 165,400 115,957
Debt Issuance Discounts (2,587) - - - -
Insurance Recovery Proceeds 3,912 2,567 5,208 3,849 9,834
Transfers Out (3,439,907) (2,942,444) (3,076,997) (2,808,115) (2,715,345)
Payments to Refunded Bond Escrow Agent (299,211) (21,885) (124,437) (966,941) (66,681)
Total Other Financing Sources (Uses) 1,372,833 192,778 691,814 154,007 899,471
Net Increase (Decrease) for the Year 1,393,586 325,100 392,220 (22,414) 545,959
Debt Service as a Percentage
of Noncapital Expenditures 2.47% 2.34% 2.29% 2.38% 2.66%
284
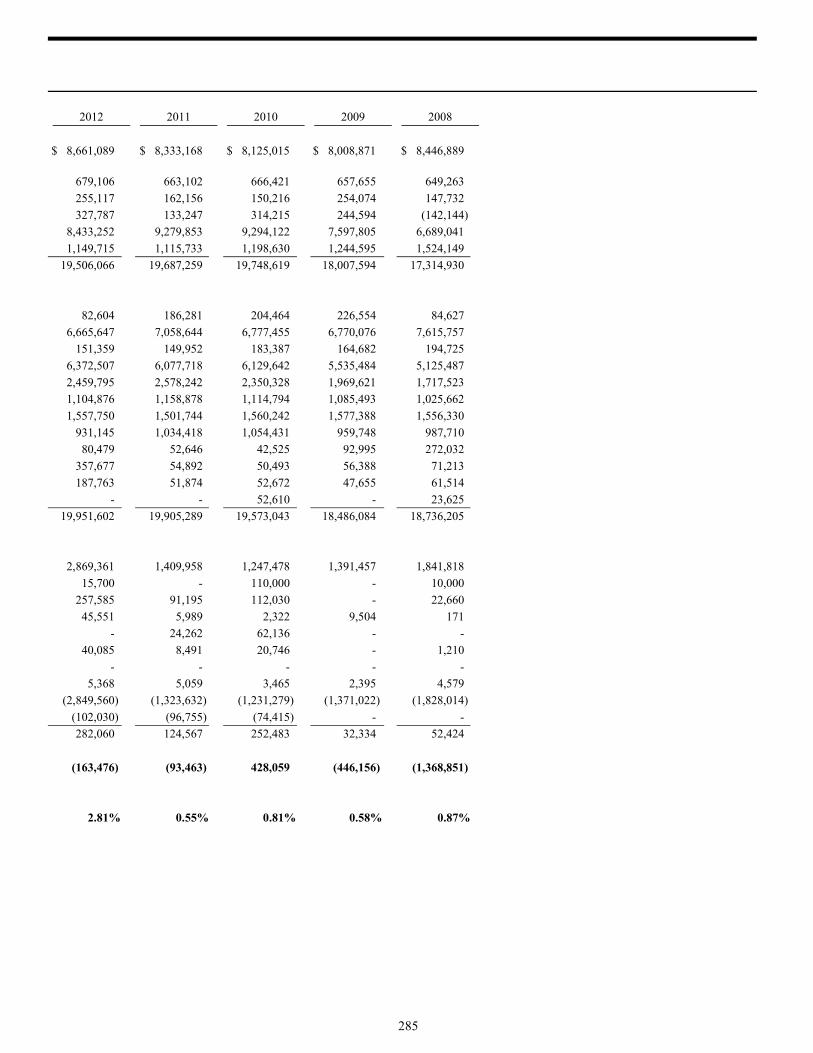
2012 2011 2010 2009 2008
$ 8,661,089 $ 8,333,168 $ 8,125,015 $ 8,008,871 $ 8,446,889
679,106 663,102 666,421 657,655 649,263
255,117 162,156 150,216 254,074 147,732
327,787 133,247 314,215 244,594 (142,144)
8,433,252 9,279,853 9,294,122 7,597,805 6,689,041
1,149,715 1,115,733 1,198,630 1,244,595 1,524,149
19,506,066 19,687,259 19,748,619 18,007,594 17,314,930
82,604 186,281 204,464 226,554 84,627
6,665,647 7,058,644 6,777,455 6,770,076 7,615,757
151,359 149,952 183,387 164,682 194,725
6,372,507 6,077,718 6,129,642 5,535,484 5,125,487
2,459,795 2,578,242 2,350,328 1,969,621 1,717,523
1,104,876 1,158,878 1,114,794 1,085,493 1,025,662
1,557,750 1,501,744 1,560,242 1,577,388 1,556,330
931,145 1,034,418 1,054,431 959,748 987,710
80,479 52,646 42,525 92,995 272,032
357,677 54,892 50,493 56,388 71,213
187,763 51,874 52,672 47,655 61,514
- - 52,610 - 23,625
19,951,602 19,905,289 19,573,043 18,486,084 18,736,205
2,869,361 1,409,958 1,247,478 1,391,457 1,841,818
15,700 - 110,000 - 10,000
257,585 91,195 112,030 - 22,660
45,551 5,989 2,322 9,504 171
- 24,262 62,136 - -
40,085 8,491 20,746 - 1,210
- - - - -
5,368 5,059 3,465 2,395 4,579
(2,849,560) (1,323,632) (1,231,279) (1,371,022) (1,828,014)
(102,030) (96,755) (74,415) - -
282,060 124,567 252,483 32,334 52,424
(163,476) (93,463) 428,059 (446,156) (1,368,851)
2.81% 0.55% 0.81% 0.58% 0.87%
285

STATE OF ALABAMA REVENUE CAPACITY Major Revenue Base: Personal Income by Industry Last Ten Years (Amounts in Thousands)
286
Industry 2017 2016 2015 2014 2013
Mining 535,440$ 518,899$ 712,929$ 836,749$ 840,915$ Utilities 1,945,042 2,039,722 1,856,345 1,765,859 1,728,519 Construction 7,685,109 7,577,708 7,079,691 7,623,717 7,119,022 Manufacturing 18,270,835 18,300,971 17,526,602 17,431,297 16,351,293 Wholesale Trade 5,992,007 5,888,990 5,779,052 5,663,330 5,403,492 Retail Trade 8,413,777 8,278,332 7,982,234 8,303,459 8,017,218 Transportation and warehousing 4,070,788 3,931,663 3,834,795 4,535,965 4,239,256 Finance and insurance 6,668,703 6,616,655 6,506,117 6,459,942 6,015,057 Professional and technical services 10,749,865 10,433,125 9,925,369 9,569,802 9,334,439 Government and government enterprises 26,871,446 25,955,072 25,345,573 24,716,794 24,216,729 All other 103,668,214 99,620,837 98,236,210 95,001,853 91,610,634
Total Personal Income 194,871,226$ 189,161,974$ 184,784,917$ 181,908,767$ 174,876,574$ State Income Taxes 3,624,543 3,570,598 3,378,720 3,310,531 3,206,838
Average Effective Rate* 1.86% 1.89% 1.83% 1.82% 1.83%
Source: Bureau of Economic Analysis, U.S. Department of Commerce, Department of Revenue *Note: The average rate for personal income equals state income taxes divided by total personal income.
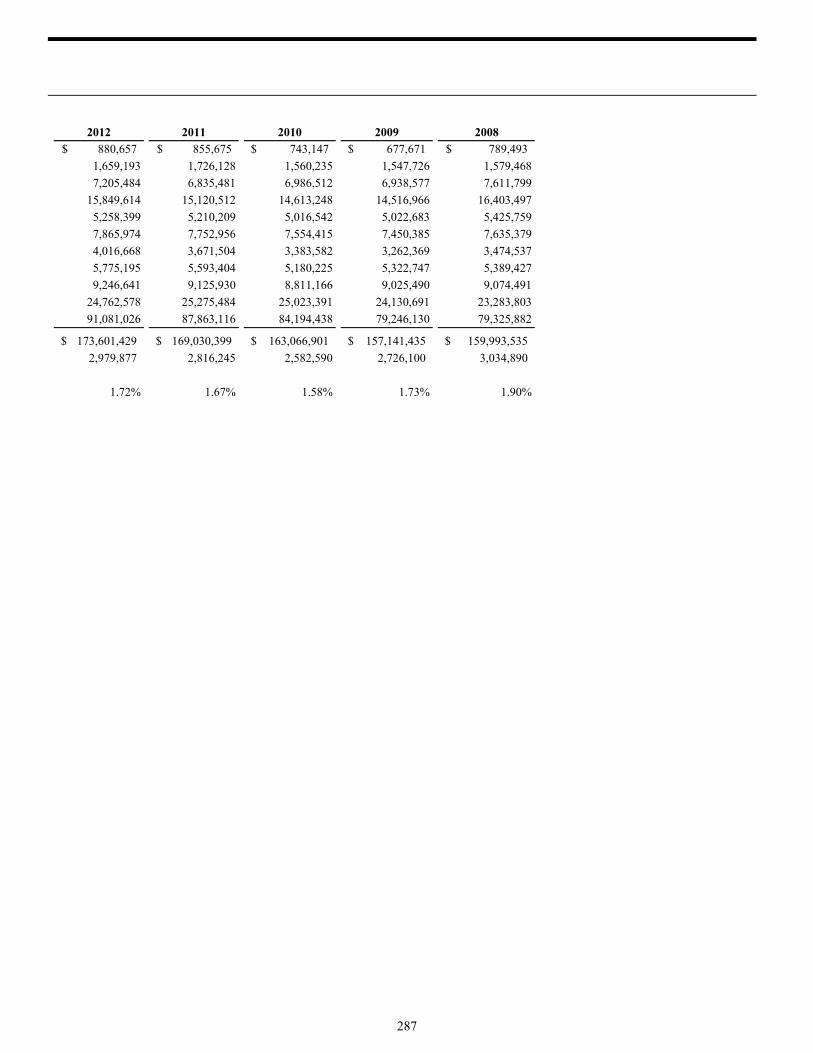
287
2012 2011 2010 2009 2008
880,657$ 855,675$ 743,147$ 677,671$ 789,493$
1,659,193 1,726,128 1,560,235 1,547,726 1,579,468
7,205,484 6,835,481 6,986,512 6,938,577 7,611,799
15,849,614 15,120,512 14,613,248 14,516,966 16,403,497
5,258,399 5,210,209 5,016,542 5,022,683 5,425,759
7,865,974 7,752,956 7,554,415 7,450,385 7,635,379
4,016,668 3,671,504 3,383,582 3,262,369 3,474,537
5,775,195 5,593,404 5,180,225 5,322,747 5,389,427
9,246,641 9,125,930 8,811,166 9,025,490 9,074,491
24,762,578 25,275,484 25,023,391 24,130,691 23,283,803
91,081,026 87,863,116 84,194,438 79,246,130 79,325,882
173,601,429$ 169,030,399$ 163,066,901$ 157,141,435$ 159,993,535$
2,979,877 2,816,245 2,582,590 2,726,100 3,034,890
1.72% 1.67% 1.58% 1.73% 1.90%

STATE OF ALABAMA REVENUE CAPACITY Revenue Rates: Individual and Corporate Income Tax Rates Last Ten Calendar Years
288
Filing Status 2007-2017
Taxable Net Income Level Rate Single Gross Income of $4,000 or more
Not Over $500 2% Over $500 But Not Over $3,000 4% Over $3,000 5%
Head of Family Gross Income of $7,700 or more
Not Over $500 2% Over $500 But Not Over $3,000 4% Over $3,000 5%
Married Filing Separate Gross Income of $5,250 or more
Not Over $500 2% Over $500 But Not Over $3,000 4% Over $3,000 5%
Married Filing Jointly Gross Income of $10,500 or more
Not Over $1,000 2% Over $1,000 But Not Over $6,000 4% Over $6,000 5%
2007-2017 Corporate Income Tax Rates 6.5% Source: Alabama Department of Revenue

289
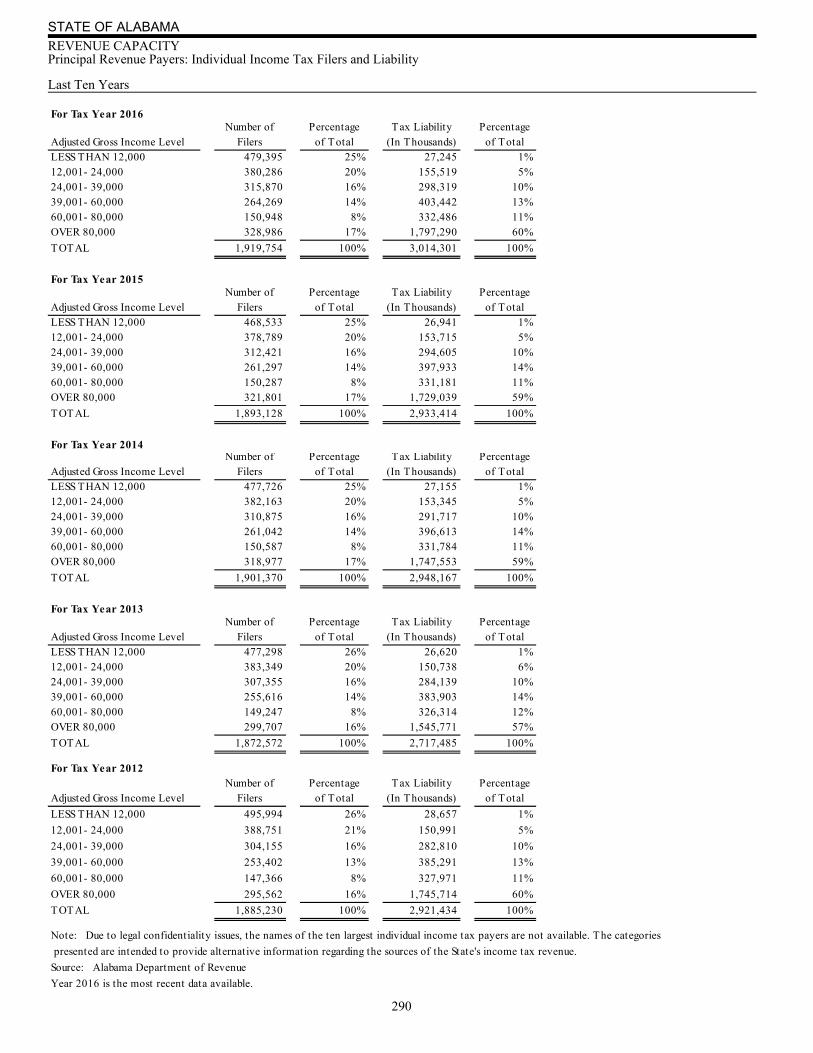
STATE OF ALABAMA REVENUE CAPACITY Principal Revenue Payers: Individual Income Tax Filers and Liability Last Ten Years
290
For Tax Year 2016
Adjusted Gross Income LevelNumber of
FilersPercentage
of TotalTax Liability
(In Thousands)Percentage
of TotalLESS THAN 12,000 479,395 25% 27,245 1%12,001- 24,000 380,286 20% 155,519 5%24,001- 39,000 315,870 16% 298,319 10%39,001- 60,000 264,269 14% 403,442 13%60,001- 80,000 150,948 8% 332,486 11%OVER 80,000 328,986 17% 1,797,290 60%
TOTAL 1,919,754 100% 3,014,301 100%
For Tax Year 2015
Adjusted Gross Income LevelNumber of
FilersPercentage
of TotalTax Liability
(In Thousands)Percentage
of TotalLESS THAN 12,000 468,533 25% 26,941 1%12,001- 24,000 378,789 20% 153,715 5%24,001- 39,000 312,421 16% 294,605 10%39,001- 60,000 261,297 14% 397,933 14%60,001- 80,000 150,287 8% 331,181 11%OVER 80,000 321,801 17% 1,729,039 59%
TOTAL 1,893,128 100% 2,933,414 100%
For Tax Year 2014
Adjusted Gross Income LevelNumber of
FilersPercentage
of TotalTax Liability
(In Thousands)Percentage
of TotalLESS THAN 12,000 477,726 25% 27,155 1%12,001- 24,000 382,163 20% 153,345 5%24,001- 39,000 310,875 16% 291,717 10%39,001- 60,000 261,042 14% 396,613 14%60,001- 80,000 150,587 8% 331,784 11%OVER 80,000 318,977 17% 1,747,553 59%
TOTAL 1,901,370 100% 2,948,167 100%
For Tax Year 2013
Adjusted Gross Income LevelNumber of
FilersPercentage
of TotalTax Liability
(In Thousands)Percentage
of TotalLESS THAN 12,000 477,298 26% 26,620 1%12,001- 24,000 383,349 20% 150,738 6%24,001- 39,000 307,355 16% 284,139 10%39,001- 60,000 255,616 14% 383,903 14%60,001- 80,000 149,247 8% 326,314 12%OVER 80,000 299,707 16% 1,545,771 57%
TOTAL 1,872,572 100% 2,717,485 100%
For Tax Year 2012
Adjusted Gross Income LevelNumber of
FilersPercentage
of TotalTax Liability
(In Thousands)Percentage
of Total
LESS THAN 12,000 495,994 26% 28,657 1%
12,001- 24,000 388,751 21% 150,991 5%
24,001- 39,000 304,155 16% 282,810 10%
39,001- 60,000 253,402 13% 385,291 13%
60,001- 80,000 147,366 8% 327,971 11%
OVER 80,000 295,562 16% 1,745,714 60%
TOTAL 1,885,230 100% 2,921,434 100%
Note: Due to legal confidentiality issues, the names of the ten largest individual income tax payers are not available. The categories
presented are intended to provide alternative information regarding the sources of the State's income tax revenue.
Source: Alabama Department of Revenue
Year 2016 is the most recent data available.
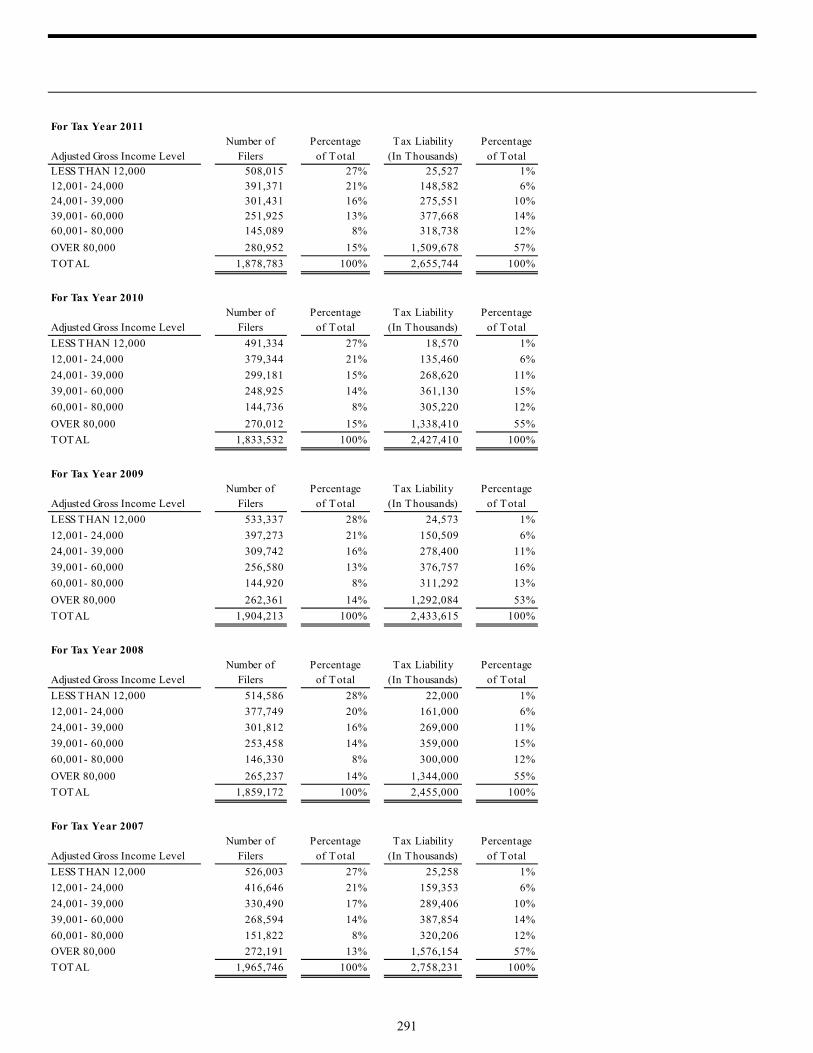
291
For Tax Year 2011
Adjusted Gross Income LevelNumber of
FilersPercentage
of TotalTax Liability
(In Thousands)Percentage
of TotalLESS THAN 12,000 508,015 27% 25,527 1%12,001- 24,000 391,371 21% 148,582 6%24,001- 39,000 301,431 16% 275,551 10%39,001- 60,000 251,925 13% 377,668 14%60,001- 80,000 145,089 8% 318,738 12%
OVER 80,000 280,952 15% 1,509,678 57%
TOTAL 1,878,783 100% 2,655,744 100%
For Tax Year 2010
Adjusted Gross Income LevelNumber of
FilersPercentage
of TotalTax Liability
(In Thousands)Percentage
of Total
LESS THAN 12,000 491,334 27% 18,570 1%
12,001- 24,000 379,344 21% 135,460 6%
24,001- 39,000 299,181 15% 268,620 11%
39,001- 60,000 248,925 14% 361,130 15%
60,001- 80,000 144,736 8% 305,220 12%
OVER 80,000 270,012 15% 1,338,410 55%
TOTAL 1,833,532 100% 2,427,410 100%
For Tax Year 2009
Adjusted Gross Income LevelNumber of
FilersPercentage
of TotalTax Liability
(In Thousands)Percentage
of Total
LESS THAN 12,000 533,337 28% 24,573 1%
12,001- 24,000 397,273 21% 150,509 6%
24,001- 39,000 309,742 16% 278,400 11%
39,001- 60,000 256,580 13% 376,757 16%
60,001- 80,000 144,920 8% 311,292 13%
OVER 80,000 262,361 14% 1,292,084 53%
TOTAL 1,904,213 100% 2,433,615 100%
For Tax Year 2008
Adjusted Gross Income LevelNumber of
FilersPercentage
of TotalTax Liability
(In Thousands)Percentage
of Total
LESS THAN 12,000 514,586 28% 22,000 1%
12,001- 24,000 377,749 20% 161,000 6%
24,001- 39,000 301,812 16% 269,000 11%
39,001- 60,000 253,458 14% 359,000 15%
60,001- 80,000 146,330 8% 300,000 12%
OVER 80,000 265,237 14% 1,344,000 55%
TOTAL 1,859,172 100% 2,455,000 100%
For Tax Year 2007
Adjusted Gross Income LevelNumber of
FilersPercentage
of TotalTax Liability
(In Thousands)Percentage
of Total
LESS THAN 12,000 526,003 27% 25,258 1%
12,001- 24,000 416,646 21% 159,353 6%
24,001- 39,000 330,490 17% 289,406 10%
39,001- 60,000 268,594 14% 387,854 14%
60,001- 80,000 151,822 8% 320,206 12%
OVER 80,000 272,191 13% 1,576,154 57%
TOTAL 1,965,746 100% 2,758,231 100%

STATE OF ALABAMA REVENUE CAPACITY Principal Revenue Payers: Corporate Income Tax Filers and Liability Last Nine Years
292
For Tax Year 2015
Alabama Taxable IncomeNumber of
FilersPercentage
of TotalTax Liability
(In Thousands)Percentage
of Total50,000 and lower 7,986 64% 6,143 1%50,001- 100,000 1,265 10% 5,851 1%100,001- 500,000 1,836 15% 27,060 6%500,001- 1,000,000 497 4% 22,880 5%1,000,001- and higher 907 7% 420,765 87%TOTAL 12,491 100% 482,699 100%
For Tax Year 2014
Alabama Taxable IncomeNumber of
FilersPercentage
of TotalTax Liability
(In Thousands)Percentage
of Total50,000 and lower 7,734 65% 5,884 1%50,001- 100,000 1,200 10% 5,347 1%100,001- 500,000 1,684 14% 23,184 5%500,001- 1,000,000 474 4% 19,948 5%1,000,001- and higher 839 7% 369,388 88%TOTAL 11,931 100% 423,751 100%
For Tax Year 2013
Alabama Taxable IncomeNumber of
FilersPercentage
of TotalTax Liability
(In Thousands)Percentage
of Total50,000 and lower 18,897 82% 5,655 1%50,001- 100,000 1,152 5% 5,234 1%100,001- 500,000 1,660 7% 23,928 5%500,001- 1,000,000 437 2% 18,766 4%1,000,001- and higher 810 4% 400,521 89%TOTAL 22,956 100% 454,104 100%
For Tax Year 2012
Alabama Taxable IncomeNumber of
FilersPercentage
of TotalTax Liability
(In Thousands)Percentage
of Total50,000 and lower 19,466 82% 5,635 1%50,001- 100,000 1,137 5% 5,277 1%100,001- 500,000 1,726 7% 25,689 6%500,001- 1,000,000 432 2% 19,911 5%1,000,001- and higher 835 4% 385,641 87%TOTAL 23,596 100% 442,153 100%
For Tax Year 2011
Alabama Taxable IncomeNumber of
FilersPercentage
of TotalTax Liability
(In Thousands)Percentage
of Total50,000 and lower 18,652 83% 5,579 1%50,001- 100,000 1,112 5% 5,140 1%100,001- 500,000 1,594 7% 23,728 6%500,001- 1,000,000 434 2% 20,141 5%1,000,001- and higher 729 3% 371,488 87%TOTAL 22,521 100% 426,076 100%

293
For Tax Year 2009
Alabama Taxable IncomeNumber of
FilersPercentage
of TotalTax Liability
(In Thousands)Percentage
of Total50,000 and lower 18,232 84% 5,295 2%50,001- 100,000 989 5% 4,498 1%100,001- 500,000 1,392 6% 19,764 6%500,001- 1,000,000 377 2% 16,337 5%1,000,001- and higher 653 3% 279,096 86%
TOTAL 21,643 100% 324,990 100%
For Tax Year 2008
Alabama Taxable IncomeNumber of
FilersPercentage
of TotalTax Liability
(In Thousands)Percentage
of Total50,000 and lower 19,535 83% 6,316 1%50,001- 100,000 1,217 5% 5,570 1%100,001- 500,000 1,624 7% 23,328 5%500,001- 1,000,000 423 2% 17,709 4%1,000,001- and higher 783 3% 419,016 89%
TOTAL 23,582 100% 471,939 100%
For Tax Year 2007
Alabama Taxable IncomeNumber of
FilersPercentage
of TotalTax Liability
(In Thousands)Percentage
of Total50,000 and lower 20,384 82% 6,815 1%50,001- 100,000 1,400 6% 6,378 1%100,001- 500,000 1,805 7% 26,855 5%500,001- 1,000,000 467 2% 21,468 4%1,000,001- and higher 784 3% 491,206 89%TOTAL 24,840 100% 552,722 100%
Note: Due to legal confidentiality issues, the names of the ten largest individual income tax payers are not available. The categoriespresented are intended to provide alternative information regarding the sources of the State's income tax revenue.Source: Alabama Department of RevenueYear 2015 is the most recent data available.
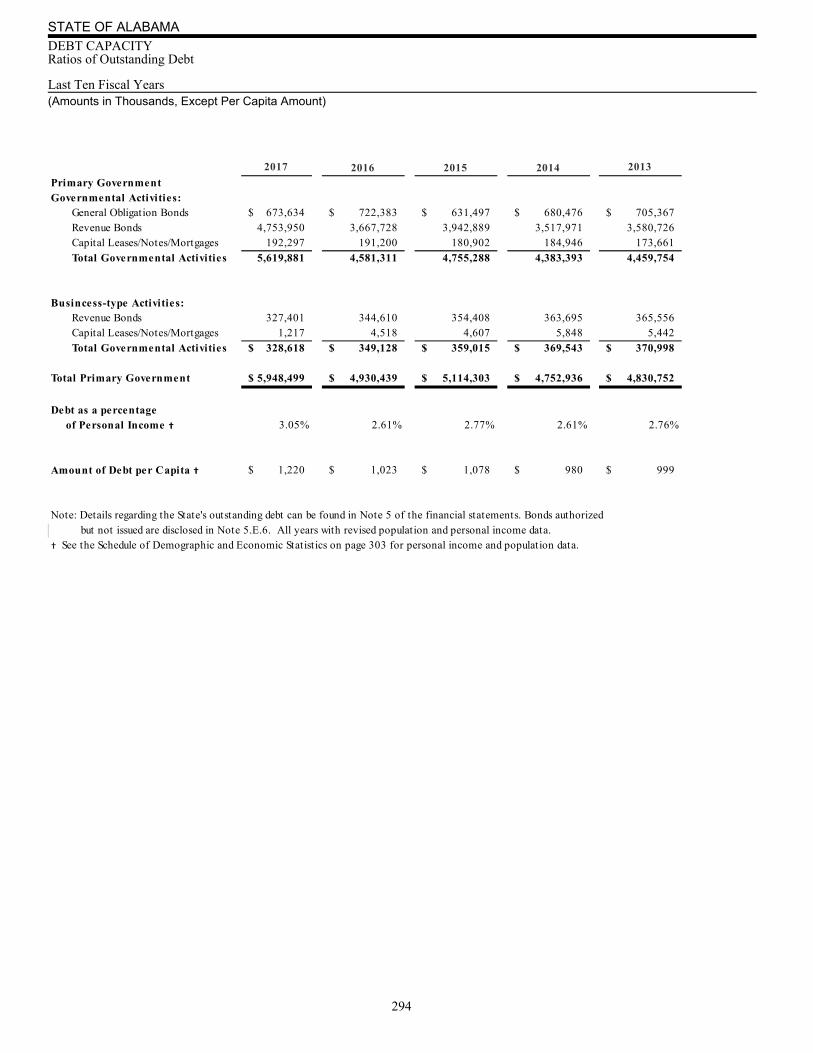
STATE OF ALABAMA DEBT CAPACITY Ratios of Outstanding Debt Last Ten Fiscal Years (Amounts in Thousands, Except Per Capita Amount)
294
2017 2014 2013
Primary GovernmentGovernmental Activities: General Obligation Bonds 673,634$ 722,383$ 631,497$ 680,476$ 705,367$ Revenue Bonds 4,753,950 3,667,728 3,942,889 3,517,971 3,580,726 Capital Leases/Notes/Mortgages 192,297 191,200 180,902 184,946 173,661
Total Governmental Activities 5,619,881 4,581,311 4,755,288 4,383,393 4,459,754
Busincess-type Activities: Revenue Bonds 327,401 344,610 354,408 363,695 365,556 Capital Leases/Notes/Mortgages 1,217 4,518 4,607 5,848 5,442
Total Governmental Activities 328,618$ 349,128$ 359,015$ 369,543$ 370,998$
Total Primary Government 5,948,499$ 4,930,439$ 5,114,303$ 4,752,936$ 4,830,752$
Debt as a percentage of Personal Income † 3.05% 2.61% 2.77% 2.61% 2.76%
Amount of Debt per Capita † 1,220$ 1,023$ 1,078$ 980$ 999$
Note: Details regarding the State's outstanding debt can be found in Note 5 of the financial statements. Bonds authorized but not issued are disclosed in Note 5.E.6. All years with revised population and personal income data.
† See the Schedule of Demographic and Economic Statistics on page 303 for personal income and population data.
2016 2015
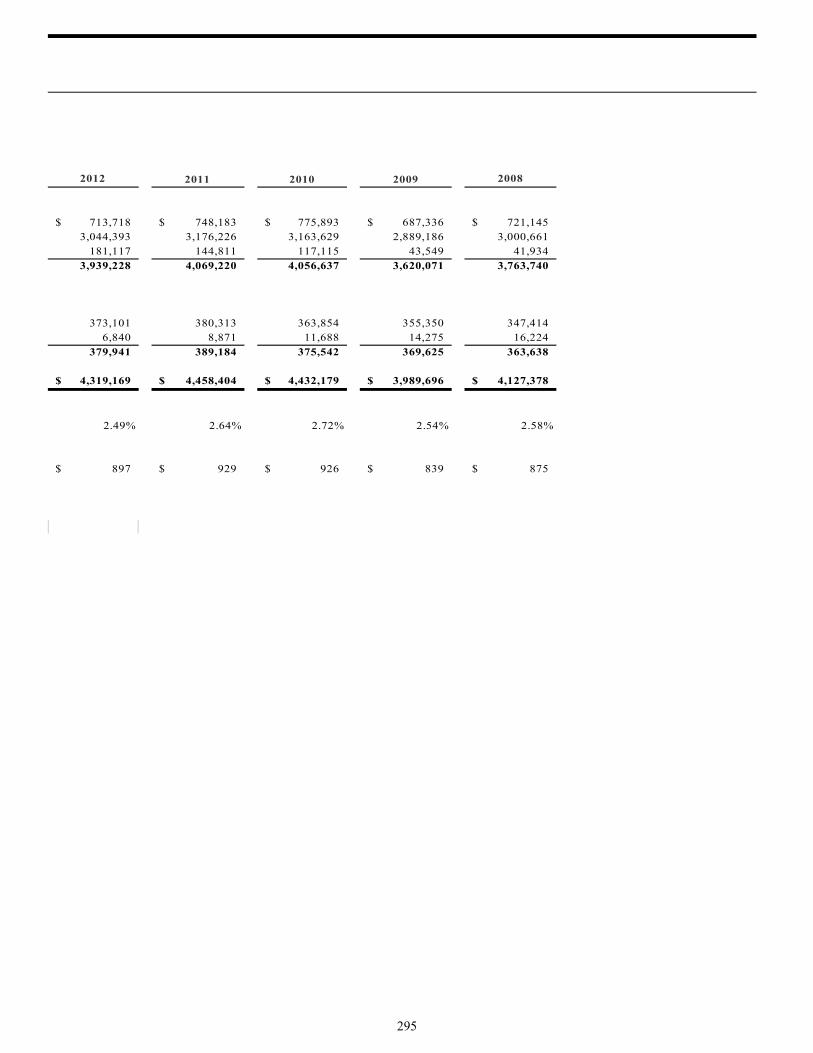
295
2012 2009 2008
713,718$ 748,183$ 775,893$ 687,336$ 721,145$ 3,044,393 3,176,226 3,163,629 2,889,186 3,000,661
181,117 144,811 117,115 43,549 41,934 3,939,228 4,069,220 4,056,637 3,620,071 3,763,740
373,101 380,313 363,854 355,350 347,414 6,840 8,871 11,688 14,275 16,224
379,941 389,184 375,542 369,625 363,638
4,319,169$ 4,458,404$ 4,432,179$ 3,989,696$ 4,127,378$
2.49% 2.64% 2.72% 2.54% 2.58%
897$ 929$ 926$ 839$ 875$
2011 2010

STATE OF ALABAMA DEBT CAPACITY Ratios of General Bonded Debt Outstanding Last Ten Fiscal Years (Amounts in Thousands, Except Per Capita Amount)
296
General Amounts Net Percentage ofObligation Available in Debt Bonded Personal Per
Bonds Payable Service Funds Debt Income † Capita †2017 673,634$ 4,753,950$ 5,427,584$ 175,120$ 5,252,464$ 2.70% 1,077 2016 722,383 3,667,728 4,390,111 156,430 4,233,681 2.24% 878 2015 631,497 3,942,889 4,574,386 138,428 4,435,958 2.40% 935 2014 680,476 3,517,971 4,198,447 136,111 4,062,336 2.23% 838 2013 705,367 3,580,726 4,286,093 120,716 4,165,377 2.38% 862 2012 713,718 3,044,393 3,758,111 172,030 3,586,081 2.07% 744 2011 748,183 3,176,226 3,924,409 152,556 3,771,853 2.23% 786 2010 775,893 3,163,629 3,939,522 156,883 3,782,639 2.32% 790 2009 687,336 2,889,186 3,576,522 87,100 3,489,422 2.22% 733 2008 721,145 3,000,661 3,721,806 141,953 3,579,853 2.24% 759
Note: Details regarding the State's outstanding debt can be found in Note 5 of the financial statements.† See the Schedule of Demographic and Economic Statistics on page 303 for personal income and population data. All years presented with revised population and personal income data.
Fiscal Year Revenue Bonds
Total Debt Outstanding

STATE OF ALABAMA DEBT CAPACITY Debt Limitations
297
The Constitution of Alabama of 1901 prohibits the issuance of debt by the State. The State does issue revenue bonds which are limited obligations of public corporations governed by State officials. General Obligation bonds are issued only by voter ratified amendments to the Constitution of Alabama of 1901.
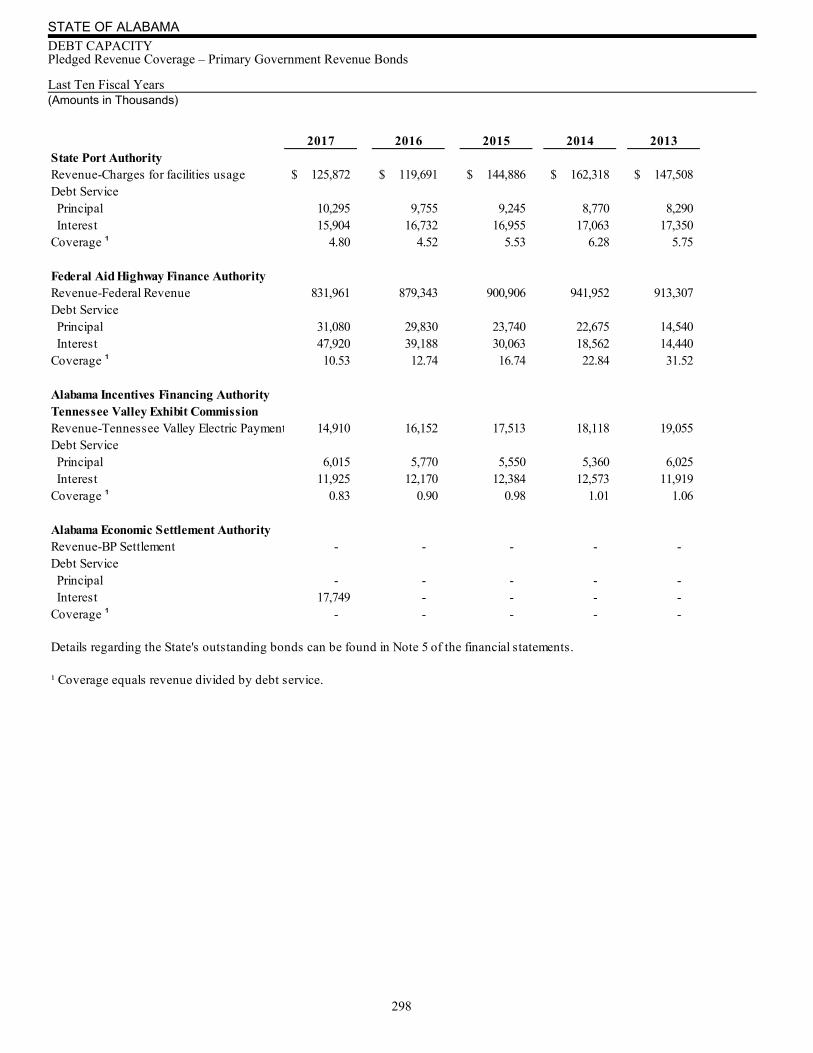
STATE OF ALABAMA DEBT CAPACITY Pledged Revenue Coverage – Primary Government Revenue Bonds Last Ten Fiscal Years (Amounts in Thousands)
298
2017 2016 2015 2014 2013State Port AuthorityRevenue-Charges for facilities usage 125,872$ 119,691$ 144,886$ 162,318$ 147,508$ Debt Service Principal 10,295 9,755 9,245 8,770 8,290 Interest 15,904 16,732 16,955 17,063 17,350 Coverage ¹ 4.80 4.52 5.53 6.28 5.75
Federal Aid Highway Finance AuthorityRevenue-Federal Revenue 831,961 879,343 900,906 941,952 913,307 Debt Service Principal 31,080 29,830 23,740 22,675 14,540 Interest 47,920 39,188 30,063 18,562 14,440 Coverage ¹ 10.53 12.74 16.74 22.84 31.52
Alabama Incentives Financing AuthorityTennessee Valley Exhibit CommissionRevenue-Tennessee Valley Electric Payment 14,910 16,152 17,513 18,118 19,055 Debt Service Principal 6,015 5,770 5,550 5,360 6,025 Interest 11,925 12,170 12,384 12,573 11,919 Coverage ¹ 0.83 0.90 0.98 1.01 1.06
Alabama Economic Settlement AuthorityRevenue-BP Settlement - - - - - Debt Service Principal - - - - - Interest 17,749 - - - - Coverage ¹ - - - - -
Details regarding the State's outstanding bonds can be found in Note 5 of the financial statements.
¹ Coverage equals revenue divided by debt service.
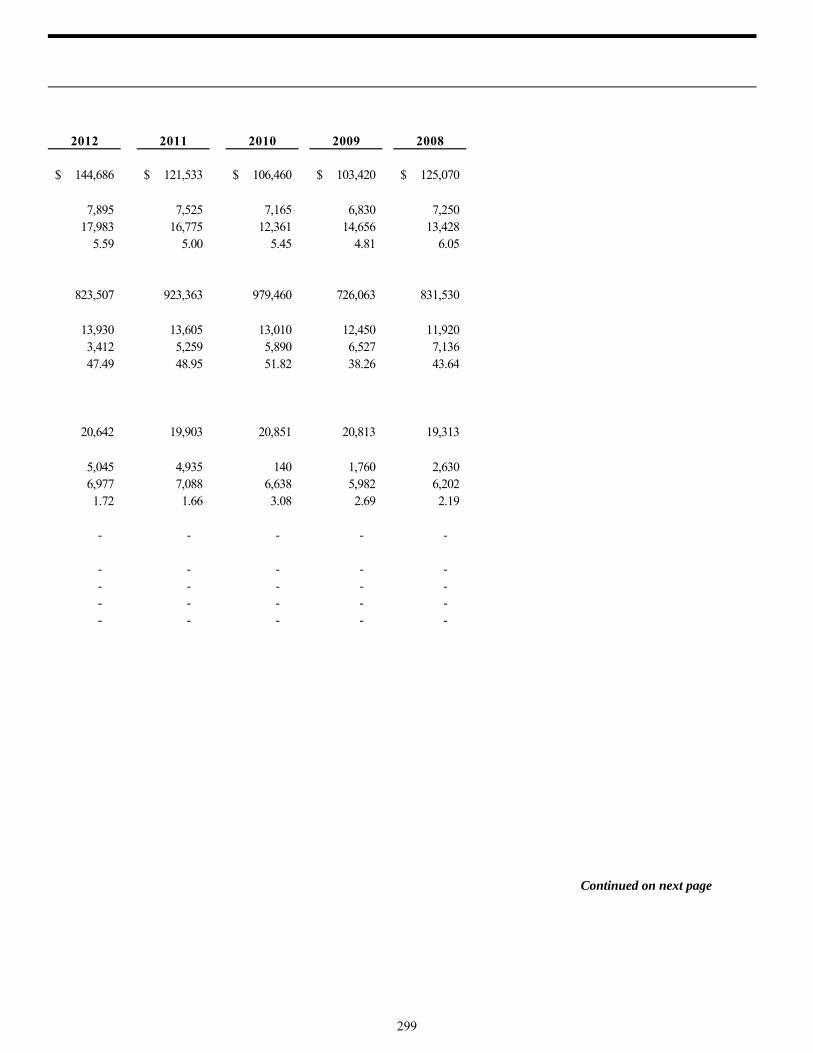
299
Continued on next page
2012 2011 2010 2009 2008
144,686$ 121,533$ 106,460$ 103,420$ 125,070$
7,895 7,525 7,165 6,830 7,250 17,983 16,775 12,361 14,656 13,428
5.59 5.00 5.45 4.81 6.05
823,507 923,363 979,460 726,063 831,530
13,930 13,605 13,010 12,450 11,920 3,412 5,259 5,890 6,527 7,136 47.49 48.95 51.82 38.26 43.64
20,642 19,903 20,851 20,813 19,313
5,045 4,935 140 1,760 2,630 6,977 7,088 6,638 5,982 6,202 1.72 1.66 3.08 2.69 2.19
- - - - -
- - - - - - - - - - - - - - - - - - - -
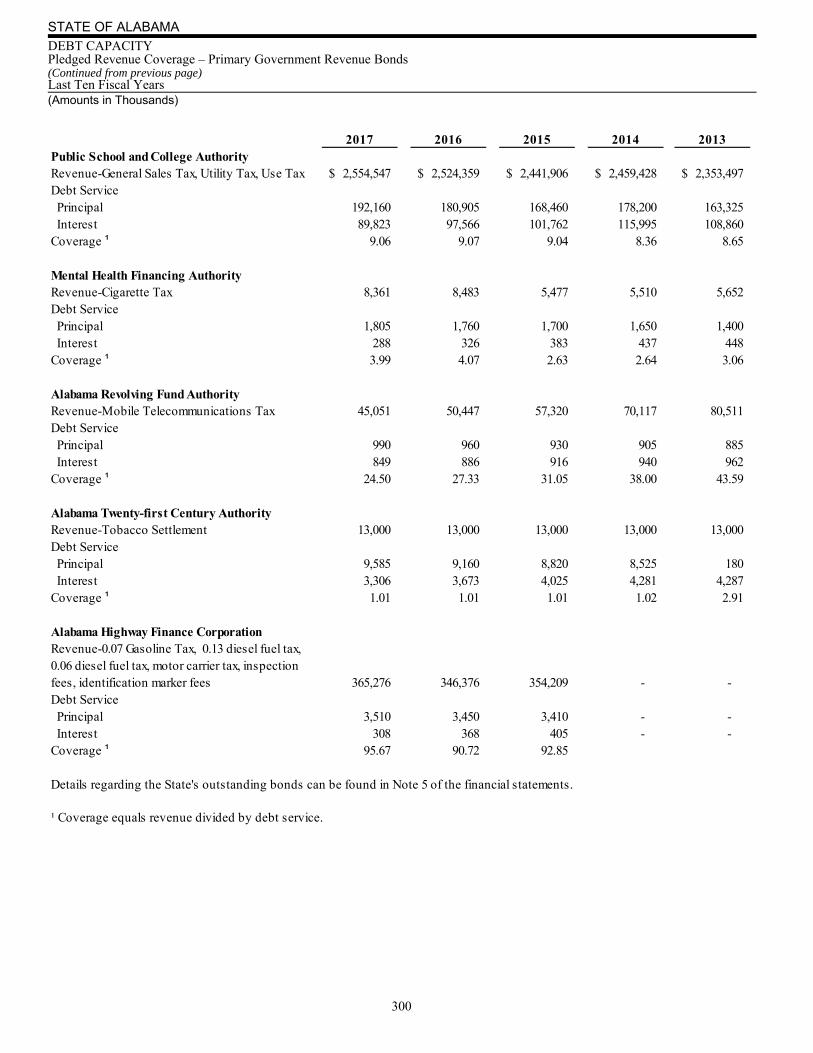
STATE OF ALABAMA DEBT CAPACITY Pledged Revenue Coverage – Primary Government Revenue Bonds (Continued from previous page) Last Ten Fiscal Years (Amounts in Thousands)
300
2017 2016 2015 2014 2013Public School and College AuthorityRevenue-General Sales Tax, Utility Tax, Use Tax 2,554,547$ 2,524,359$ 2,441,906$ 2,459,428$ 2,353,497$ Debt Service Principal 192,160 180,905 168,460 178,200 163,325 Interest 89,823 97,566 101,762 115,995 108,860 Coverage ¹ 9.06 9.07 9.04 8.36 8.65
Mental Health Financing AuthorityRevenue-Cigarette Tax 8,361 8,483 5,477 5,510 5,652 Debt Service Principal 1,805 1,760 1,700 1,650 1,400 Interest 288 326 383 437 448 Coverage ¹ 3.99 4.07 2.63 2.64 3.06
Alabama Revolving Fund AuthorityRevenue-Mobile Telecommunications Tax 45,051 50,447 57,320 70,117 80,511 Debt Service Principal 990 960 930 905 885 Interest 849 886 916 940 962 Coverage ¹ 24.50 27.33 31.05 38.00 43.59
Alabama Twenty-first Century AuthorityRevenue-Tobacco Settlement 13,000 13,000 13,000 13,000 13,000 Debt Service Principal 9,585 9,160 8,820 8,525 180 Interest 3,306 3,673 4,025 4,281 4,287 Coverage ¹ 1.01 1.01 1.01 1.02 2.91
Alabama Highway Finance CorporationRevenue-0.07 Gasoline Tax, 0.13 diesel fuel tax, 0.06 diesel fuel tax, motor carrier tax, inspection fees, identification marker fees 365,276 346,376 354,209 - - Debt Service Principal 3,510 3,450 3,410 - - Interest 308 368 405 - - Coverage ¹ 95.67 90.72 92.85
Details regarding the State's outstanding bonds can be found in Note 5 of the financial statements.
¹ Coverage equals revenue divided by debt service.

301
2012 2011 2010 2009 2008
2,441,387$ 2,370,684$ 2,328,626$ 2,307,959$ 2,514,550$
101,770 69,180 71,235 130,720 91,215 123,123 114,892 132,698 116,126 93,359
10.86 12.88 11.42 9.35 13.62
5,930 6,121 6,205 6,364 6,562
1,325 1,255 1,190 4,710 4,775 195 234 270 505 745 3.90 4.11 4.25 1.22 1.19
82,404 94,790 105,919 108,781 101,287
865 - 515 475 440 984 746 702 743 780
44.57 127.06 87.03 89.31 83.02
13,000 13,000 13,000 13,000 13,000
6,530 6,205 5,910 5,625 5,360 7,110 6,339 6,659 6,958 7,241 0.95 1.04 1.03 1.03 1.03
- - - - -
- - - - - - - -
- - - - -

STATE OF ALABAMA DEMOGRAPHIC AND ECONOMIC INFORMATION Labor Force Statistics Last Ten Years
302
Year Labor Force Employment Unemployment Unemployment Rate
2008 2,176,489 2,053,477 123,012 5.7%
2009 2,162,999 1,924,747 238,252 11.0%
2010 2,196,042 1,964,559 231,483 10.5%
2011 2,202,670 1,990,413 212,257 9.6%
2012 2,174,972 2,001,849 173,123 8.0%
2013 2,167,238 2,010,431 156,807 7.2%
2014 2,161,313 2,014,284 147,029 6.8%
2015 2,146,157 2,015,189 130,968 6.1%
2016 2,168,608 2,038,775 129,833 6.0%
2017 2,168,444 2,073,106 95,338 4.4%
Note: Averages for calendar year and not seasonally adjusted. 2010-2017 data reflects revised population controls and model reestimation with the Bureau of Labor Statistics. Sources: Local Area Unemployment Statistics, Bureau of Labor Statistics, U. S. Department of Labor
0.0%
2.0%
4.0%
6.0%
8.0%
10.0%
0
500,000
1,000,000
1,500,000
2,000,000
2,500,000
2008 2009 2010 2011 2012 2013 2014 2015 2016 2017
Unemployment RateLabor Force
Civilian Labor Force Trend with Unemployment Rates
Labor Force Unemployment Unemployment Rate

STATE OF ALABAMA DEMOGRAPHIC AND ECONOMIC INFORMATION Population/Per Capita Personal Income Statistics Last Ten Years
303
Population Per Capita Personal Income Personal income (in Thousands)
Year United States Alabama United States Alabama United States Alabama
2008 304,093,966 4,718,206 41,082 33,910 12,492,705,000 159,993,535
2009 306,771,529 4,757,938 39,376 33,027 12,079,444,000 157,141,435
2010 309,346,863 4,785,822 40,277 34,073 12,459,613,000 163,066,901
2011 311,718,857 4,801,695 42,453 35,202 13,233,436,000 169,030,399
2012 314,102,623 4,817,484 44,267 36,036 13,904,485,000 173,601,429
2013 316,427,395 4,833,996 44,462 36,176 14,068,960,000 174,876,574
2014 318,907,401 4,849,377 46,414 37,512 14,801,624,000 181,908,767
2015 321,418,820 4,859,672 48,112 38,965 15,463,981,000 184,784,917
2016 323,127,513 4,863,300 49,571 39,231 16,017,781,445 189,161,974
2017 325,719,178 4,874,747 50,392 39,976 16,413,550,863 194,871,226
Note: Year 2017 is the most recent year for which data are available. Each year’s data is updated by the U.S. Department of Commerce. Sources: Regional Economic Information System, Bureau of Economic Analysis, U.S. Department of Commerce
0
5,000
10,000
15,000
20,000
25,000
30,000
35,000
40,000
45,000
50,000
55,000
2008 2009 2010 2011 2012 2013 2014 2015 2016 2017
Per Capita IncomeAlabama Compared to United States
United States Alabama
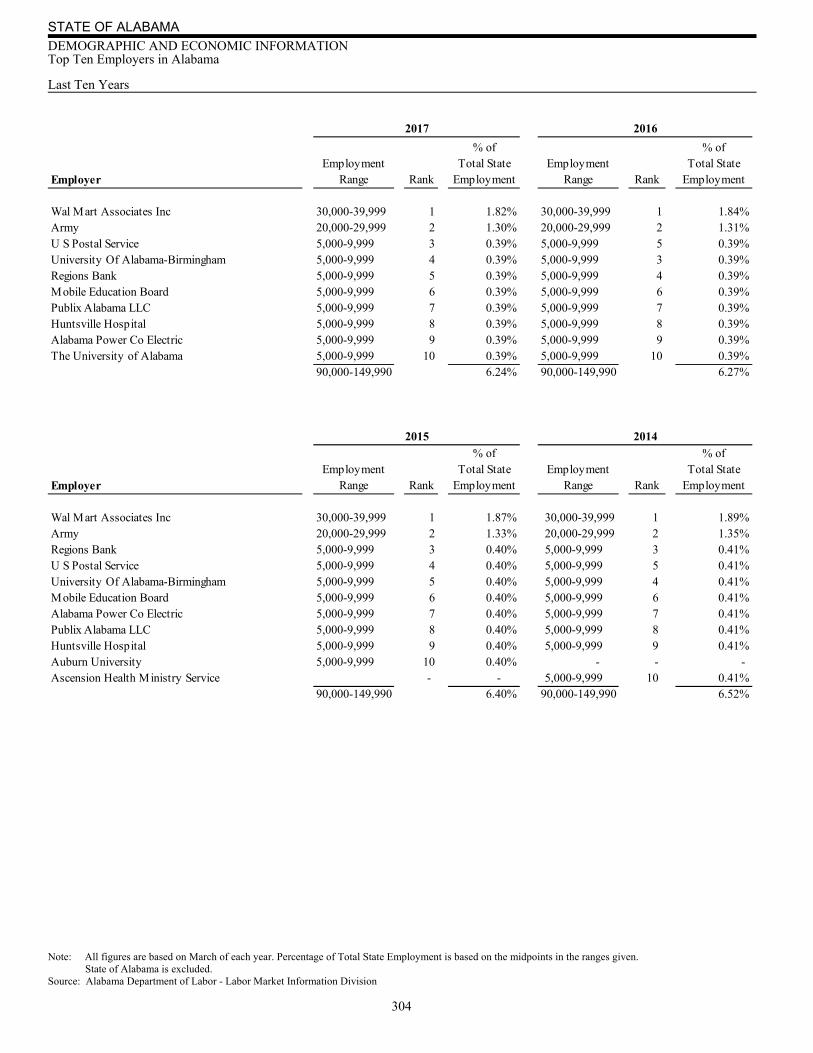
STATE OF ALABAMA DEMOGRAPHIC AND ECONOMIC INFORMATION Top Ten Employers in Alabama Last Ten Years
304
Note: All figures are based on March of each year. Percentage of Total State Employment is based on the midpoints in the ranges given. State of Alabama is excluded. Source: Alabama Department of Labor - Labor Market Information Division
% of % ofEmployment Total State Employment Total State
Employer Range Rank Employment Range Rank Employment
Wal Mart Associates Inc 30,000-39,999 1 1.82% 30,000-39,999 1 1.84%Army 20,000-29,999 2 1.30% 20,000-29,999 2 1.31%U S Postal Service 5,000-9,999 3 0.39% 5,000-9,999 5 0.39%University Of Alabama-Birmingham 5,000-9,999 4 0.39% 5,000-9,999 3 0.39%Regions Bank 5,000-9,999 5 0.39% 5,000-9,999 4 0.39%Mobile Education Board 5,000-9,999 6 0.39% 5,000-9,999 6 0.39%Publix Alabama LLC 5,000-9,999 7 0.39% 5,000-9,999 7 0.39%Huntsville Hospital 5,000-9,999 8 0.39% 5,000-9,999 8 0.39%Alabama Power Co Electric 5,000-9,999 9 0.39% 5,000-9,999 9 0.39%The University of Alabama 5,000-9,999 10 0.39% 5,000-9,999 10 0.39%
90,000-149,990 6.24% 90,000-149,990 6.27%
% of % ofEmployment Total State Employment Total State
Employer Range Rank Employment Range Rank Employment
Wal Mart Associates Inc 30,000-39,999 1 1.87% 30,000-39,999 1 1.89%Army 20,000-29,999 2 1.33% 20,000-29,999 2 1.35%Regions Bank 5,000-9,999 3 0.40% 5,000-9,999 3 0.41%U S Postal Service 5,000-9,999 4 0.40% 5,000-9,999 5 0.41%University Of Alabama-Birmingham 5,000-9,999 5 0.40% 5,000-9,999 4 0.41%Mobile Education Board 5,000-9,999 6 0.40% 5,000-9,999 6 0.41%Alabama Power Co Electric 5,000-9,999 7 0.40% 5,000-9,999 7 0.41%Publix Alabama LLC 5,000-9,999 8 0.40% 5,000-9,999 8 0.41%Huntsville Hospital 5,000-9,999 9 0.40% 5,000-9,999 9 0.41%Auburn University 5,000-9,999 10 0.40% - - - Ascension Health Ministry Service - - 5,000-9,999 10 0.41%
90,000-149,990 6.40% 90,000-149,990 6.52%
2017
20142015
2016
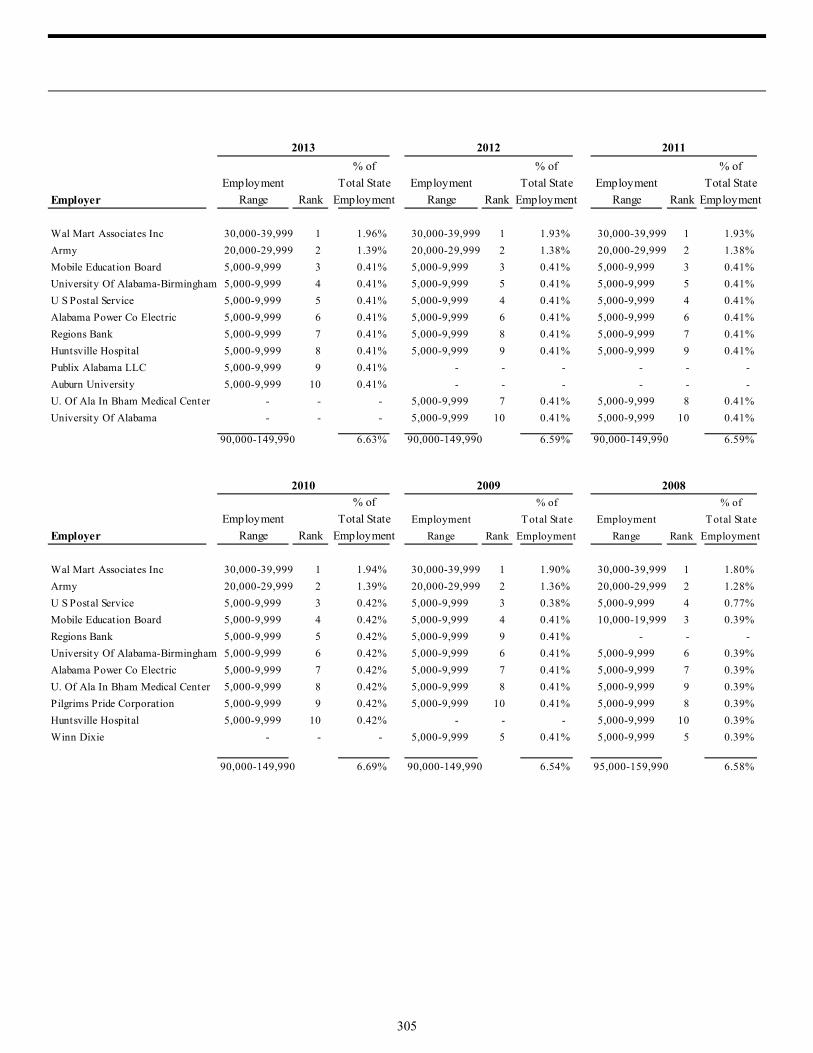
305
% of % of % of
Employment Total State Employment Total State Employment Total State
Employer Range Rank Employment Range Rank Employment Range Rank Employment
Wal Mart Associates Inc 30,000-39,999 1 1.96% 30,000-39,999 1 1.93% 30,000-39,999 1 1.93%
Army 20,000-29,999 2 1.39% 20,000-29,999 2 1.38% 20,000-29,999 2 1.38%
Mobile Education Board 5,000-9,999 3 0.41% 5,000-9,999 3 0.41% 5,000-9,999 3 0.41%
University Of Alabama-Birmingham 5,000-9,999 4 0.41% 5,000-9,999 5 0.41% 5,000-9,999 5 0.41%
U S Postal Service 5,000-9,999 5 0.41% 5,000-9,999 4 0.41% 5,000-9,999 4 0.41%
Alabama Power Co Electric 5,000-9,999 6 0.41% 5,000-9,999 6 0.41% 5,000-9,999 6 0.41%
Regions Bank 5,000-9,999 7 0.41% 5,000-9,999 8 0.41% 5,000-9,999 7 0.41%
Huntsville Hospital 5,000-9,999 8 0.41% 5,000-9,999 9 0.41% 5,000-9,999 9 0.41%
Publix Alabama LLC 5,000-9,999 9 0.41% - - - - - -
Auburn University 5,000-9,999 10 0.41% - - - - - -
U. Of Ala In Bham Medical Center - - - 5,000-9,999 7 0.41% 5,000-9,999 8 0.41%
University Of Alabama - - - 5,000-9,999 10 0.41% 5,000-9,999 10 0.41%
90,000-149,990 6.63% 90,000-149,990 6.59% 90,000-149,990 6.59%
% of % of % of
Employment Total State Employment Total State Employment Total State
Employer Range Rank Employment Range Rank Employment Range Rank Employment
Wal Mart Associates Inc 30,000-39,999 1 1.94% 30,000-39,999 1 1.90% 30,000-39,999 1 1.80%
Army 20,000-29,999 2 1.39% 20,000-29,999 2 1.36% 20,000-29,999 2 1.28%
U S Postal Service 5,000-9,999 3 0.42% 5,000-9,999 3 0.38% 5,000-9,999 4 0.77%
Mobile Education Board 5,000-9,999 4 0.42% 5,000-9,999 4 0.41% 10,000-19,999 3 0.39%
Regions Bank 5,000-9,999 5 0.42% 5,000-9,999 9 0.41% - - -
University Of Alabama-Birmingham 5,000-9,999 6 0.42% 5,000-9,999 6 0.41% 5,000-9,999 6 0.39%
Alabama Power Co Electric 5,000-9,999 7 0.42% 5,000-9,999 7 0.41% 5,000-9,999 7 0.39%
U. Of Ala In Bham Medical Center 5,000-9,999 8 0.42% 5,000-9,999 8 0.41% 5,000-9,999 9 0.39%
Pilgrims Pride Corporation 5,000-9,999 9 0.42% 5,000-9,999 10 0.41% 5,000-9,999 8 0.39%
Huntsville Hospital 5,000-9,999 10 0.42% - - - 5,000-9,999 10 0.39%
Winn Dixie - - - 5,000-9,999 5 0.41% 5,000-9,999 5 0.39%
90,000-149,990 6.69% 90,000-149,990 6.54% 95,000-159,990 6.58%
20082010 2009
2012 20112013

STATE OF ALABAMA OPERATING INFORMATION State Government Employment by Function Last Ten Years
306
2017 2016 2015 2014 2013
Primary Government
Governmental Activities:
Economic Development and Regulation 698 696 673 664 684
Education and Cultural Resources 1,010 1,027 998 973 856
Natural Resources and Recreation 1,340 1,325 1,410 1,460 1,448
Health 5,225 5,312 5,231 5,441 5,077
Social Services 5,989 6,050 6,133 6,162 5,997
Protection of Person and Property 7,461 7,531 7,883 7,750 8,255
Transportation 4,320 4,310 4,375 4,320 4,271
General Government 3,868 3,802 5,312 4,469 4,048
Total Governmental Activities 29,911 30,053 32,015 31,239 30,636
Business-type Activities:
Alcoholic Beverage Control Board 840 818 794 879 896
State Port Authority 167 176 188 187 187
Total Business-Type Activities 1,007 994 982 1,066 1,083
Total Primary Government 30,918 31,047 32,997 32,305 31,719
Note: Includes State Merit System, House, Senate, and Administrative Office of the Courts.
Sources: Alabama Personnel Department
Alabama Commission on Higher Education
Alabama Administrative Office of the Courts
Alabama House of Representatives
Alabama Senate

307
2012 2011 2010 2009 2008
704 731 734 844 852
832 851 888 977 982
1,461 1,471 1,471 1,457 1,586
6,017 5,406 5,406 5,519 5,658
6,089 6,267 6,217 6,269 6,279
8,394 8,220 8,233 8,467 8,470
4,355 4,613 4,613 4,746 4,781
4,031 4,464 4,587 4,686 4,731
31,883 32,023 32,149 32,965 33,339
899 906 902 901 898
188 181 185 193 200
1,087 1,087 1,087 1,094 1,098
32,970 33,110 33,236 34,059 34,437
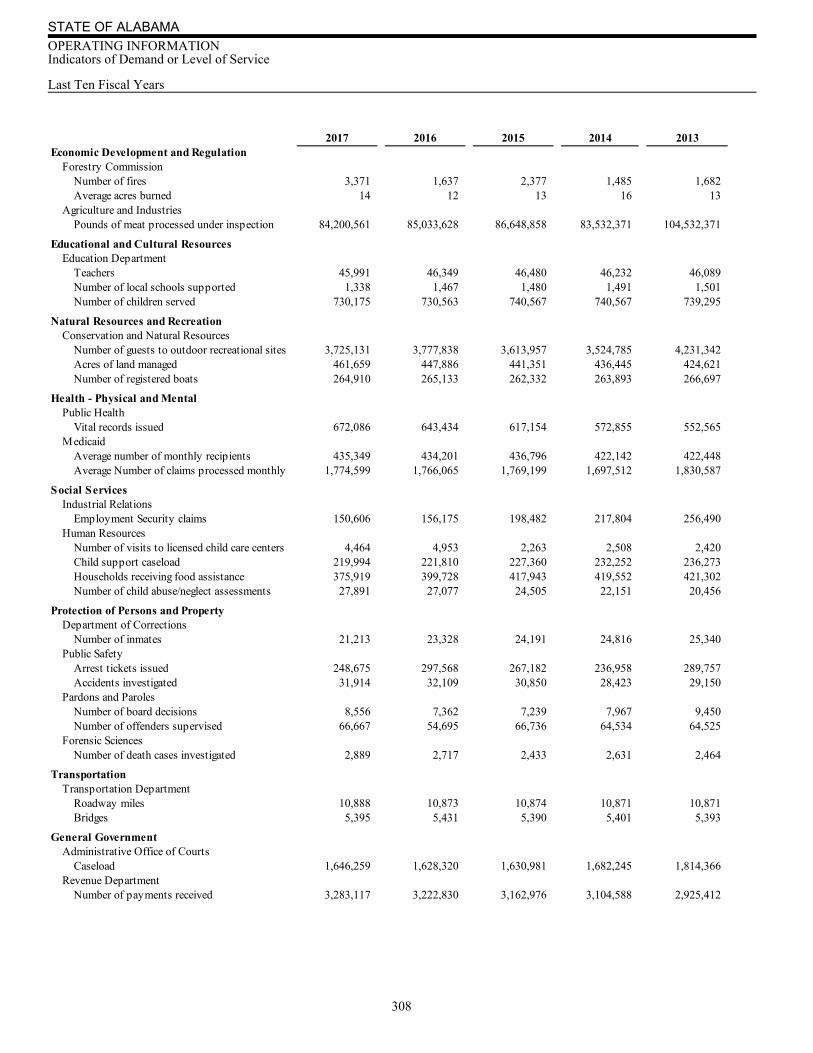
STATE OF ALABAMA OPERATING INFORMATION Indicators of Demand or Level of Service Last Ten Fiscal Years
308
2017 2016 2015 2014 2013Economic Development and Regulation
Forestry CommissionNumber of fires 3,371 1,637 2,377 1,485 1,682 Average acres burned 14 12 13 16 13
Agriculture and IndustriesPounds of meat processed under inspection 84,200,561 85,033,628 86,648,858 83,532,371 104,532,371
Educational and Cultural ResourcesEducation Department
Teachers 45,991 46,349 46,480 46,232 46,089 Number of local schools supported 1,338 1,467 1,480 1,491 1,501 Number of children served 730,175 730,563 740,567 740,567 739,295
Natural Resources and RecreationConservation and Natural Resources
Number of guests to outdoor recreational sites 3,725,131 3,777,838 3,613,957 3,524,785 4,231,342 Acres of land managed 461,659 447,886 441,351 436,445 424,621 Number of registered boats 264,910 265,133 262,332 263,893 266,697
Health - Physical and MentalPublic Health
Vital records issued 672,086 643,434 617,154 572,855 552,565 Medicaid
Average number of monthly recipients 435,349 434,201 436,796 422,142 422,448 Average Number of claims processed monthly 1,774,599 1,766,065 1,769,199 1,697,512 1,830,587
Social ServicesIndustrial Relations
Employment Security claims 150,606 156,175 198,482 217,804 256,490 Human Resources
Number of visits to licensed child care centers 4,464 4,953 2,263 2,508 2,420 Child support caseload 219,994 221,810 227,360 232,252 236,273 Households receiving food assistance 375,919 399,728 417,943 419,552 421,302 Number of child abuse/neglect assessments 27,891 27,077 24,505 22,151 20,456
Protection of Persons and PropertyDepartment of Corrections
Number of inmates 21,213 23,328 24,191 24,816 25,340 Public Safety
Arrest tickets issued 248,675 297,568 267,182 236,958 289,757 Accidents investigated 31,914 32,109 30,850 28,423 29,150
Pardons and ParolesNumber of board decisions 8,556 7,362 7,239 7,967 9,450 Number of offenders supervised 66,667 54,695 66,736 64,534 64,525
Forensic SciencesNumber of death cases investigated 2,889 2,717 2,433 2,631 2,464
TransportationTransportation Department
Roadway miles 10,888 10,873 10,874 10,871 10,871 Bridges 5,395 5,431 5,390 5,401 5,393
General GovernmentAdministrative Office of Courts
Caseload 1,646,259 1,628,320 1,630,981 1,682,245 1,814,366 Revenue Department
Number of payments received 3,283,117 3,222,830 3,162,976 3,104,588 2,925,412
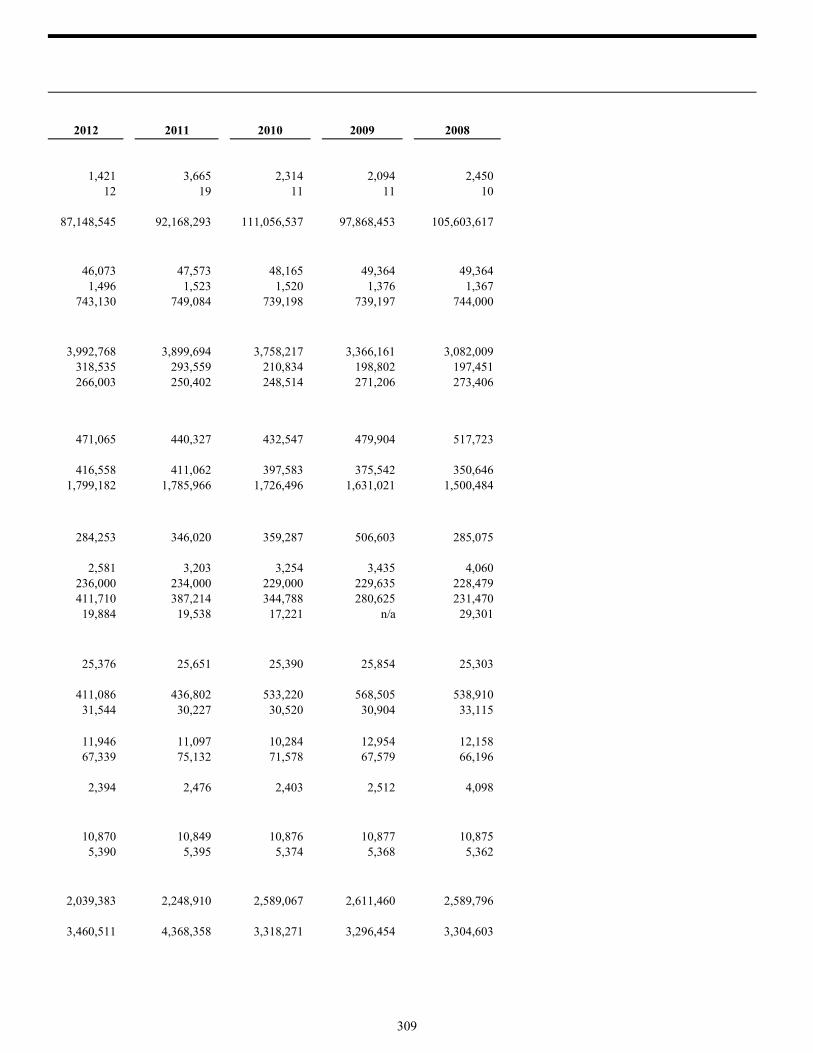
309
2012 2011 2010 2009 2008
1,421 3,665 2,314 2,094 2,450 12 19 11 11 10
87,148,545 92,168,293 111,056,537 97,868,453 105,603,617
46,073 47,573 48,165 49,364 49,364 1,496 1,523 1,520 1,376 1,367
743,130 749,084 739,198 739,197 744,000
3,992,768 3,899,694 3,758,217 3,366,161 3,082,009 318,535 293,559 210,834 198,802 197,451 266,003 250,402 248,514 271,206 273,406
471,065 440,327 432,547 479,904 517,723
416,558 411,062 397,583 375,542 350,646 1,799,182 1,785,966 1,726,496 1,631,021 1,500,484
284,253 346,020 359,287 506,603 285,075
2,581 3,203 3,254 3,435 4,060 236,000 234,000 229,000 229,635 228,479 411,710 387,214 344,788 280,625 231,470
19,884 19,538 17,221 n/a 29,301
25,376 25,651 25,390 25,854 25,303
411,086 436,802 533,220 568,505 538,910 31,544 30,227 30,520 30,904 33,115
11,946 11,097 10,284 12,954 12,158 67,339 75,132 71,578 67,579 66,196
2,394 2,476 2,403 2,512 4,098
10,870 10,849 10,876 10,877 10,875 5,390 5,395 5,374 5,368 5,362
2,039,383 2,248,910 2,589,067 2,611,460 2,589,796
3,460,511 4,368,358 3,318,271 3,296,454 3,304,603

STATE OF ALABAMA OPERATING INFORMATION Indicators of Volume, Usage, and Nature of Capital Assets Last Ten Fiscal Years
310
2017 2016 2015* 2014 2013
Economic Development and Regulation
Forestry Commission
Buildings 3 3 3 159 159
Vehicles 360 362 431 400 307
Heavy Equipment 345 358 362 613 569
Educational and Cultural Resources
Education Television
Buildings 1 1 1 25 25
Natural Resources and Recreation
Conservation and Natural Resources
Buildings 87 85 85 680 678
Vehicles 696 633 637 743 761
Heavy Equipment 197 169 164 219 223
Health
Environmental Management
Vehicles 174 168 176 161 185
Mental Health
Buildings 20 20 20 85 189
Vehicles 37 37 65 79 80
Social Services
Human Resources
Buildings 39 39 37 37 36
Protection of Persons and Property
Agriculture and Industries
Vehicles 131 121 102 158 163
Corrections
Buildings 148 141 137 405 399
Vehicles 552 487 491 560 535
Military
Buildings 187 185 185 646 641
Alabama Law Enforecement Agency
Vehicles 1,223 1,189 1,136 1,131 1,184
Youth Services
Buildings 31 32 32 112 112
Vehicles 44 40 35 89 86
Pardons and Paroles
Vehicles 303 188 197 324 319
Transportation
Transportation
Buildings 101 87 87 583 583
Vehicles 2,237 2,277 2,150 2,062 2,193
Heavy Equipment 1,172 1,136 1,193 1,047 1,096
General Government
Administrative Office of Courts
Vehicles 10 9 9 14 14
Revenue Department
Vehicles 33 12 15 21 28
* Capitalization thresholds for capital assets were revised upward in 2015 resulting in a decrease in the number of items
It was not practical to restate years prior to 2015.
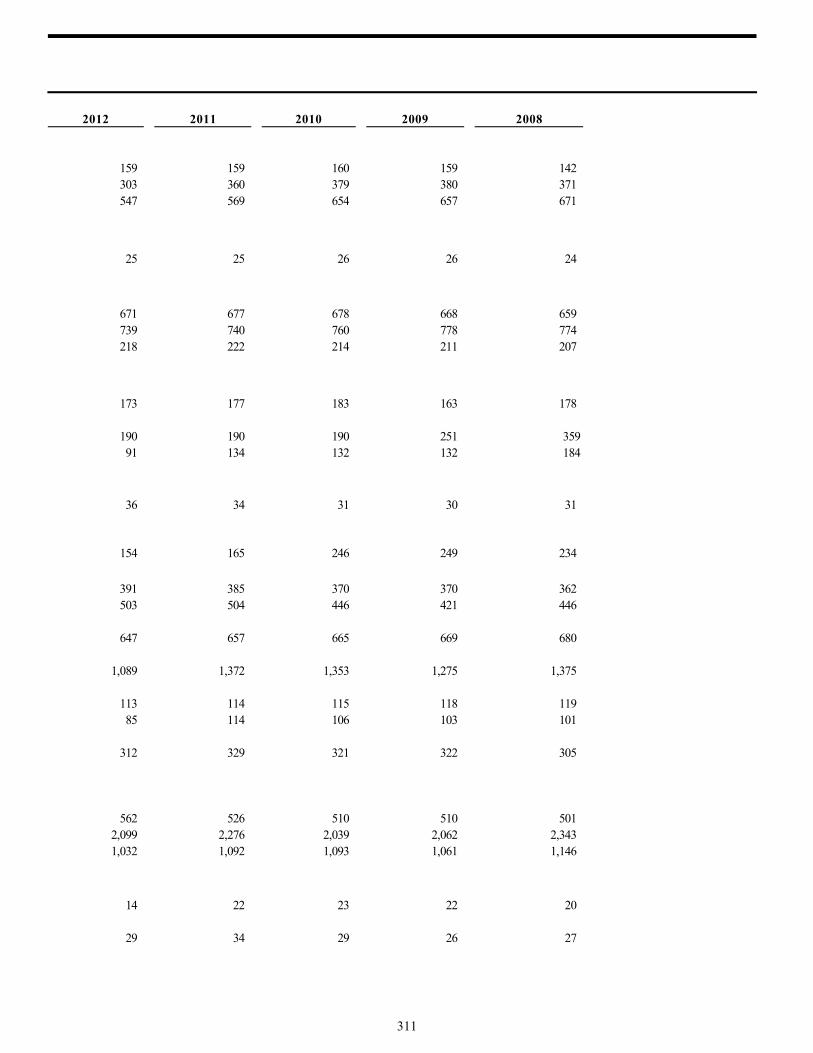
311
2012 2011 2010 2009 2008
159 159 160 159 142 303 360 379 380 371 547 569 654 657 671
25 25 26 26 24
671 677 678 668 659 739 740 760 778 774 218 222 214 211 207
173 177 183 163 178
190 190 190 251 35991 134 132 132 184
36 34 31 30 31
154 165 246 249 234
391 385 370 370 362 503 504 446 421 446
647 657 665 669 680
1,089 1,372 1,353 1,275 1,375
113 114 115 118 119 85 114 106 103 101
312 329 321 322 305
562 526 510 510 501 2,099 2,276 2,039 2,062 2,343 1,032 1,092 1,093 1,061 1,146
14 22 23 22 20
29 34 29 26 27