comprehensive annual financial report · 2019-05-02 · budget and actual - non-gaap ... supporting...
TRANSCRIPT

COMPREHENSIVE ANNUAL FINANCIAL REPORT
Fiscal Year Ended June 30, 1996
Nancy Wyman State Comptroller


STATE OF CONNECTICUT
COMPREHENSIVE ANNUAL
FINANCIAL REPORT
For Fiscal Year Ended June 30, 1996
Prepared by the Office of the State Comptroller
NANCY WYMAN STATE COMPTROLLER
This publication will be made available, upon request, in large print, braille or audio cassette pursuant to the requestor's requirements.

STATE OF CONNECTICUT Office of the State Comptroller
The State Comptroller is one of the six State officers elected to hold office for a term of four years. The office of the State Comptroller was established in 1786 by an act of the General Assembly. The Constitutional Amendment of 1836 provided that the Comptroller be elected by the people in a manner similar to that of other State officers. Since 1838 this method has been in effect.
The Comptroller prescribes the mode of keeping and rendering all public accounts. She is required to adjust and settle all public accounts and demands, excepting grants and orders of the General Assembly. The Comptroller also renders a monthly accounting of the State's fi-nancial condition.
In addition, the Comptroller approves and records all obligations against the State. She main-tains all official accounting records and is responsible for the employee payrolls for all State agencies, departments, and institutions. Her office administers all Retirement Systems other than Teachers' retirement. Additonally, the Comptroller administers numerous miscellaneous appropriations of the State.
11

STATE OF CONNECTICUT Contents
INTRODUCTORY SECTION State Comptroller Letter of Transmittal 3 Certificate of Achievement 22 Connecticut State Organization Chart 23 Selected State Officials 24
FINANCIAL SECTION Independent Auditors' Report 26
GENERAL PURPOSE FINANCIAL STATEMENTS Combined Balance Sheet - All Fund Types, Account Groups, and Discretely Presented Component Units 30 Combined Statement of Revenues, Expenditures, and Changes in Fund Balances -
All Governmental Fund Types and Expendable Trust Funds 32 Combined Statement of Revenues, Expenditures, and Changes in Fund Balances -
Budget and Actual - Non-GAAP Budgetary Basis - General Fund and Budgeted Special Revenue Funds 34 Combined Statement of Revenues, Expenses, and Changes in Retained Earnings/Fund Balances -
All Proprietary Fund Types, Similar Trust Funds, and Discreteley Presented Component Units 36 Combined Statement of Cash Flows - All Proprietary Fund Types, Nonexpendable Trust Funds, and
Discreteley Presented Component Units 38 Combined Statement of Changes in Fund Balances - Higher Education and University Hospital Funds 40 Combined Statement of Revenues, Expenditures, and Other Changes - Higher Education and
University Hospital Funds 42 Notes to the Financial Statements
Summary of Significant Accounting Policies 43 Budgetary Basis vs. GAAP 50 Fund Deficits 51 Cash Deposits and Investments 51 Loans Receivable 55 Taxes Receivable 55 Restricted Assets 56 Property, Plant, and Equipment 56 Retirement Systems 57 Other Retirement Systems Administered by the State 62 Deferred Compensation Plan 64 Postemployment Benefits 64 Capital and Operating Leases 64 Changes in General Long-Term Debt 65 Debt 65 Risk Management 71 Interfund Receivables and Payables 72 Restatement of Fund Balances 72 Reserved Retained Earnings, Reserved Fund Balances, and Contributed Capital 73 Segment Information - Enterprise Funds 73 Condensed Financial Statements - Component Units 74 Related Organizations 75 Commitments and Contingencies 75 Subsequent Events 76
Required PERS Supplementary Information 77
Ill

STATE OF CONNECTICUT Contents COMBINING STATEMENTS AND ACCOUNT GROUP SCHEDULES Special Revenue Funds
Narrative 85 Combining Balance Sheet 86 Combining Statement of Revenues, Expenditures, and Changes in Fund Balances 88 Combining Schedule of Revenues, Expenditures, and Changes in Fund Balances -
Budget and Actual - Non-GAAP Budgetary Basis - Budgeted Special Revenue Funds 90 Capital Projects Funds
Narrative 95 Combining Balance Sheet 96 Combining Statement of Revenues, Expenditures, and Changes in Fund Balances 97
Enterprise Funds Narrative 99 Combining Balance Sheet 100 Combining Statement of Revenues, Expenses, and Changes in Retained Earnings 101 Combining Statement of Cash Flows 102
Internal Service Funds Narrative 103 Combining Balance Sheet 104 Combining Statement of Revenues, Expenses, and Changes in Retained Earnings 105 Combining Statement of Cash Flows 106
Fiduciary Funds Narrative 107 Combining Balance Sheet - Fiduciary Funds 108 Combining Balance Sheet - Pension Trust Funds 110 Combining Balance Sheet - Agency Funds 112 Combining Statement of Revenues, Expenditures, and Changes in Fund Balances - Expendable Trust Funds 114 Combining Statement of Revenues, Expenses, and Changes in Fund Balances - Nonexpendable and Pension Trust Funds 116 Combining Statement of Cash Flows - Nonexpendable Trust Funds 118 Combining Statement of Changes in Assets & Liabilities - All Agency Funds 119
General Fixed Assets Account Group Narrative 123 Schedule of General Fixed Assets by Source 124 Schedule of General Fixed Assets by Function 125 Schedule of Changes in General Fixed Assets by Function 125
Higher Education and University Hospital Funds Narrative 127 Combining Balance Sheet 128
Component Units Narrative 131 Combining Balance Sheet 132 Combining Statement of Revenues, Expenses, and Changes in Retained Earnings 134 Combining Statement of Cash Flows 136
STATISTICAL SECTION Schedule of General Governmental Expenditures by Function - for the Last Ten Fiscal Years 140 Schedule of Revenues by Source - for the Last Ten Fiscal Years 140 Schedule of Computation of Legal Debt Margin 142 Schedule of Net General Long-Term Bonded Debt Per Capita - for the Last Ten Fiscal Years 142
iv

STATE OF CONNECTICUT Contents
Schedule of Ratio of Annual Debt Service for General Bonded Debt to Total General Expenditures - for the Last Ten Fiscal Years 143
Schedule of Revenue Bond Coverage - for the Last Ten Fiscal Years 144 Schedule of Bank Deposits - for the Last Ten Fiscal Years 147 Schedule of Resident Employment, Unemployment, and Unemployment Rate - for the Last Ten Years 148 Schedule of Non-Farm Employment by Industry Seasonally Adjusted-For the Last Ten Years 148 Schedule of Personal Income and Per Capita Personal Income - Connecticut Compared to the United States
and New England - for the Last Ten Years 149 Schedule of Top Twenty Private Sector Employers 150 Schedule of Economic Indicators - for the Last Ten Years 151 Schedule of Demographic Statistics - for the Last Ten Years 151 Schedule of Major Revenue Sources - General Fund - for the Last Ten Fiscal Years 152 Schedule of Sales and Use Tax - Major Industrial Categories 152 Schedule of Miscellaneous Statistics 153 Office of the State Comptroller Organization Chart 154

STATE OF CONNECTICUT
THIS PAGE LEFT INTENTIONALLY BLANK
vi

Intro uctory Section

STATE OF CONNECTICUT
THIS PAGE LEFT INTENTIONALLY BLANK

NANCY WYMAN COMPTROLLER
STATE OF CONNECTICUT OFFICE OF THE STATE COMPTROLLER
55 ELM STREET HARTFORD, CONNECTICUT 06106-1775
MARK E OJAKIAN DEPUTY COMPTROLLER
December 31, 1996
To the Citizens of the State of Connecticut:
I am pleased to present this Comprehensive Annual Financial Report (CAFR) of the State of Connecti-cut for the fiscal year ended June 30, 1996.
This report was prepared in its entirety by this office and we take full responsibility for the accuracy of the data and the completeness and fairness of the presentation of the financial statements, supporting schedules, and statistical tables in it.
The CAFR is designed to be in conformance with generally accepted accounting principles (GAAP) for governmental units as promulgated by the Governmental Accounting Standards Board (GASB) as well as the reporting requirements prescribed by the Government Finance Officers Association and the American Institute of Certified Public Accountants. We believe that this report presents fairly the financial position of the State and the results of its operations as measured by the financial activity of its various funds. The report is consistent with full disclosure so that the reader may gain maximum understanding of the State's financial affairs. The report is presented in three sections:
The Introductory Section contains this transmittal letter, a list of the State's principal elected, appointed and administrative officials, an organizational chart of the State government, and a table of contents.
The Financial Section contains the Auditors of Public Accounts' report, the general purpose fi-nancial statements which include the notes to the financial statements, and the combining and individual fund and account group financial statements.
The Statistical Section contains comprehensive statistical data and selected financial and demo-graphic information on a multi-year basis.
3 An Equal Opportunity Employer

THE REPORTING ENTITY
Connecticut, a state of approximately 3.3 million people in an area of 5,009 square miles, has a devel-oped infrastructure, technologically advanced industrial base and a strong insurance and financial ser-vices industry. The State of Connecticut ratified the Constitution of the United States on January 9, 1788. It has a legislative - executive - judicial form of government with a bicameral legislature (36 Senators, 151 Representatives). The Governor, Lieutenant Governor, Secretary of State, Treasurer, Comptroller, and Attorney General are independently elected for four-year terms. Senators and Repre-sentatives are elected for two-year terms.
The State provides a broad range of services including public safety, state highways and other-transpor-tation services, state parks, social services, higher education, health services, economic development, and regulatory responsibilities.
This report includes all the funds and account groups of the State plus related public authorities, the Teachers' Retirement System and Bradley International Airport.
STATE INITIATIVES
HEALTH CARE REFORM
Medicaid Managed Care (Connecticut Access). In July 1995, Connecticut's Department of So-cial Services implemented Connecticut Access, a plan to move a majority of the State's Medicaid population from a fee-for-service health care delivery system to managed care. The plan required a 1915 (b) waiver from the federal Health Care Financing Administration and called for the staggered enrollment of certain Medicaid beneficiaries - primarily recipients of Aid to Families with Dependent Children - into managed care plans. When fully implemented in January 1997, approximately 235,000 Medicaid eligible individuals will have been transitioned from fee-for-service into one of eleven managed care organizations. Connecticut Access was designed to achieve two main objectives: (1) improve the health status of Medicaid recipients through en-hanced access to and coordination of health care; and (2) reduce Medicaid expenditures over the long term. At present, the State is developing the capability to evaluate the success of this initia-tive.
Municipal Health Insurance. The Comptroller administers a health insurance program that cov-ers approximately 166,000 Connecticut state employees, retirees and dependents. In recent years, the State plan has been successful in controlling health costs, while preserving benefit levels. In 1996, the Connecticut General Assembly approved a plan to allow the Comptroller to open the State health plan to Connecticut municipalities as a means of reducing their health insurance costs. The Comptroller's office is currently in the process of implementing the program. The target date for municipal enrollment is July 1997. Participation by municipalities will be strictly voluntary and there will be no cost increases to the State.
The Work Group for Health Care Access for the Uninsured. In recent years, Connecticut's unin-sured population has grown dramatically. In order to address this problem, the Work Group for Health Care Access was formed in May of 1996. The Work Group's diverse membership in-cludes the Comptroller and State legislators, representatives of private sector businesses, labor, hospitals and physicians, insurance companies, HMOs and advocates for the uninsured. Work
4

Group members have identified two promising reform concepts. The first involves expanding Medicaid to cover most or all of Connecticut's uninsured children. The second includes a pack-age of tax incentives to encourage small businesses to provide coverage for their employees. The Work Group will recommend that the Connecticut General Assembly give priority consideration to these two reform concepts in the upcoming legislative session.
Long-Term Health Care Insurance. In 1997, the State of Connecticut will begin offering long-term health care insurance to its employees through payroll deduction. The insurance plan will be available at group rates and employees will be responsible for the full cost. The insurance will cover a full range of long-term care services, including both nursing home and in-home care. The policies are designed to protect the subscriber's assets and therefore insure the family against the impoverishment that can result from a long-term illness. An additional objective of the plan is to reduce State Medicaid expenditures for long-term care.
WELFARE REFORM
Connecticut's Jobs First Program. In January 1996, Connecticut's Department of Social Ser-vices implemented a welfare reform program known as Jobs First. The program includes a 21 month cash benefit limit for employable recipients and has earning incentives to encourage indi-viduals to seek employment while on welfare. Jobs First also includes some job training and placement services and an allowance for child care costs. In addition, Medicaid eligibility can be extended up to two years for those leaving welfare for work. The first group of individuals is scheduled to reach the 21 month limit and lose benefits in November 1997. During the 1996 fiscal year, the Department of Social Services reported a 5.7 percent reduction in its Aid to Fami-lies with Dependent Children (AFDC) caseload. At present, it is unclear whether the caseload reduction can be attributed to the Jobs First program, a generally improving state economy or a combination of both factors.
Federal Reform and Reimbursement Changes. Due to the passage of federal welfare reform legislation, Connecticut has the option of continuing to operate under the provisions of its Jobs First program or converting to the provisions of the new federal Temporary Assistance to Needy Families (TANF) program. This issue will be addressed by the 1997 General Assembly. For program funding purposes, the State converted from a 50 percent federal reimbursement to a federal block grant on October 1, 1996. Over the next several years, the block grant will yield higher federal payments to the State. Afterwards, however, it appears that block grant payments will not keep pace with what federal reimbursements would have been under the old formula.
MI FINANCIAL REPORTING
Conversion to Generally Accepted Accounting Principles. In 1993, the Connecticut General Assembly enacted Public Act 93-402, which authorized the use of generally accepted accounting principles (GAAP) for the preparation and maintenance of the State's annual financial statements and the preparation of the State's biennial budget. Originally, conversion to GAAP from the modified cash basis of accounting was scheduled for the 1995-96 fiscal year. However, imple-mentation was postponed for two years - largely due to the cost of amortizing the accumulated GAAP deficit, which was approximately $33 million a year for 15 years. Since then the accumu-lated GAAP deficit has grown. The conversion to GAAP is currently scheduled for the 1997-98 fiscal year and the Comptroller is recommending that implementation proceed on schedule.
5

OPERATING RESULTS
The fiscal year 1995-96 saw the deterioration of the State's financial condition slowed substantially, but we have not yet reached the point of turnaround.
While the operating deficit is the lowest in both absolute terms and as a percent of tax revenue in the last five years at $191 million, this is the ninth year in a row of operating deficits highlighting the State's continual reliance on debt-financing.
Long-term obligations increased $827 million, which will have to be financed by future genera-tions.
Debt service, excluding the debt service on the State's Economic Recovery Notes, was 8% of governmental operating expenditures, a decrease from 8.4% in the prior year. In absolute terms, such expenditures decreased 3%.
Net debt per capita, also exclusive of the Economic Recovery Notes, rose to $2,670, double that of fiscal 1990.
Government expenditures showed a slight decrease from 11.5% to 11.3% of total personal in-come in the State when compared to the prior fiscal year, however, in absolute terms, expendi-tures increased 2.5%.
GOVERNMENTAL OPERATING RESULTS* (millions)
FY 96 FY 95 FY 94 FY 93 FY 92
General Fund Surplus (Deficit) $ 198 $ (242) $ 51 $ 93 $ (77)
Special Revenue Funds: Transportation 14 17 (10) (36) 3 Grant and Loan Programs (301) (307) (306) (283) (232) Housing Programs (36) (32) (54) (39) (37) Other, net (66) (59) (46) 5 (20)
Total (389) (381) (416) (353) (286)
Total Government Operating Deficits $(191) $(623) $(365) $(260) $(363)
*Surplus (Deficit) includes transfers and excludes proceeds from debt financing.
6

TOTAL GOVERNMENTAL REVENUE (millions)
FY 96 FY 95 FY 94 FY 93 FY 92 Taxes $ 7,339 $ 6,822 $ 6,437 $ 6,141 $5,596 Intergovernmental 2,830 2,734 2,641 2,617 2,135 All Other 1,640 1,632 1,514 1,447 1,410 Total $11,809 $11,188 $10,592 $10,205 $9,141
Deficits as a Percent: Total Revenue 1.6% 5.6% 3.4% 2.5% 4.0% Total Tax Revenue 2.6% 9.1% 5.7% 4.2% 6.5%
Fiscal year 1996 saw governmental expenditures grow at less than a 3% rate while the growth in personal income was 4%. In the ten years since 1987, governmental expenditures have increased 108% while personal income increased only 55%.
GOVERNMENTAL OPERATING EXPENDITURES AS A PERCENT OF PERSONAL INCOME
(millions)
Fiscal Year Governmental Expenditures
Connecticut Personal Income Ratio
1987 $ 5,882 $ 70,110 8.4 1988 6,372 77,419 8.2 1989 7,779 83,320 9.3 1990 8,534 86,749 9.8 1991 8,930 87,944 10.1 1992 9,541 92,945 10.3 1993 10,494 95,220 11.0 1994 10,934 98,434 11.1 1995 11,924 104,056 11.5 1996 12,221 108,549 11.3
Uncontrollable and fixed costs continued to consume a large share of the State's spending. Debt service, exclusive of the Economic Recovery Notes, decreased to 8% of total governmental expendi-tures. Total debt service, including the Economic Recovery Notes, increased to 10.7% of governmen-tal expenditures, two times the ratio of fiscal year 1990. Medicaid spending leveled off in fiscal year 1996 at $1.9 billion, however, it still remains at almost one-fifth of total General Fund spending. The net State share of Medicaid, after adjusting for the 50% share of federal reimbursements, was $291 for every man, woman, and child in Connecticut.

Deficit financing for operating purposes continued in fiscal year 1996. Deficits of $337 million were incurred in the Grant and Loan Programs and the Housing Programs special revenue funds in fiscal year 1996. This represents 19% of total special revenue funds spending. Debt financing for these and other special revenue programs was $405 million, which is almost three-fifths of our spending on legitimate capital needs for State facilities and infrastructure.
As a result, debt per capita, exclusive of the Economic Recovery Notes, increased to $2,670 — over twice what it was in fiscal year 1990. The remaining Economic Recovery Notes constitute an addi-tional $72 of debt per capita.
General Fund
Fiscal year 1996 saw the State end the year with a general fund operating surplus for the first time since the 1994 fiscal year; with revenues growing faster than expenditures.
GENERAL FUND OPERATING SURPLUS (DEFICIT) (millions)
FY 96 FY 95 FY 94 Surplus (Deficit) in Prior Fiscal Year $(242) $ 51 $ 93
Expenditure (Increase) Decreases: General Government (40) (15) 5 Health and Hospital (38) (28) (6) Human Services (61) (479) (276) Education, Libraries, and Museums (95) 22 (102) Corrections (50) (62) (110) Higher Education 8 (86) (23) Debt Service 116 (79) (54) Other, net 25 I_ —5_1_
(135) (726) (515)
Revenue Increases (Decreases): Taxes 481 355 270 Intergovernmental 82 82 50 Other, net 12 (4) 153
575 433 473
Surplus (Deficit) $198 $ (242) $ 51
Tax revenues increased almost 8% while intergovernmental revenues (grants, etc.) increased 3%. The increases in the intergovernmental revenues are largely offset and in some cases more than offset by the increase in the related expenditures in the programs funded by those intergovernmental revenues. All expenditure categories increased except for higher education, debt service and other. The main reason for the decrease in debt service expenditures was the refinancing of $241 million of Economic Recov-ery Notes which were due to be paid in the 1996 fiscal year from General Fund revenues.
8

GENERAL FUND REVENUES (millions)
FY 96 FY 95 Change FY 94 Taxes , $ 6,831 $6,350 $481 $5,995 Licenses, Permits, and Fees 112 107 5 118 Intergovernmental • 2,644 2,562 82 2,480 Charges for Services 188 175 13 154 Fines, Forfeits, and Rents 24 35 (11) 31 Investment Earnings 26 28 (2) 25 Miscellaneous 129 116 13 188
Subtotal 9,954 9,373 581 8,991
Transfers In: Lottery 262 250 12 218 Other 3 21 (18) 2
265 271 (6) 220
Total $10,219 $9,644 $575 $9,211
As shown above, except for taxes, the net increase of other sources of revenues is relatively minor. A further analysis of the tax revenues shows that with the exception of the personal income tax and the sales and use tax, tax revenues have been fairly stagnant, increasing marginally or even decreasing. Revenue from the personal income tax increased by $300 million, an increase of approximately 13% while the sales and use tax increased $89 million or an increase of 3.8%.
GENERAL FUND TAX REVENUES (millions)
FY 96 FY 95 Change FlC24_ Personal Income $2,606 $2,306 $300 $2,270 Sales and Use 2,444 2,355 89 2,167 Corporation 629 604 25 609 Public Service Corporations 192 185 7 187 Inheritance and Estate 231 183 48 - 197 Insurance Companies 167 171 169 Cigarettes and Tobacco 125 130 120 Real Estate Conveyance 65 63 2 61 Alcoholic Beverages 40 40 42
Oil Companies 68 49 19 75 Hospital Gross Receipts 214 222 (8) 54 Admissions, Dues, and Cabaret 23 21 2 20 Miscellaneous 27 21 6 24
Total $6,831 $6,350 $481 $5,995
9

The largest increases in General Fund expenditures were Education, Human Services and Corrections, two of which are being driven by outside factors such as mandated Medicaid expenditures and rising prison populations.
MEDICAID EXPENDITURES (millions)
1996 1995 1994 1993 1992
$1,908 $1,910 $1,637 $1,521 $1,322
As previously discussed, Corrections and Judicial expenditures have continued to expand in step with crime and the increasing correction facility population.
TOTAL CORRECTION FACILITY POPULATION
1996 1995 1994 1993 1992
15,135 14,246 14,045 10,838 10,101
GENERAL FUND EXPENDITURES (millions)
FY 96 FY 95 Change FY 94 Legislative $ 48 $ 47 $ 1 $ 46 General Government 550 510 40 495 Regulation and Protection 105 103 2 105 Conservation and Development 65 64 1 57 Health and Hospitals 819 781 38 753 Human Services* 3,439 3,378 61 2,899 Education, Libraries, and Museums 1,820 1,725 95 1,747 Corrections 839 789 50 727 Judicial 265 234 31 224 Federal and Other Grants 808 871 (63) 971 Debt Service 637 581 56 502
Subtotal 9,395 9,083 312 -8,526
Transfers Out: Higher Education 442 450 (8) 364 Debt Service 92 264 (172) 180 Other 92 89 3 90
626 803 (177) 634 Total $10,021 $9,886 $ 135 $9,160
*Include§ Medicaid expenditures.
10

Special Revenue Funds
Special revenue funds continue to be heavily debt-financed, suggesting that we are burdening future generations of taxpayers with the cost of current programs. Grant and loan programs and housing programs have shown operating deficits for the last five years. To the extent that loan programs result in receivables that can be counted on to mature in time to service the related debt, a case may be made that the economic benefits accrue to current and future taxpayers. Financing grants with debt, how-ever, should be undertaken sparingly and in unusual circumstances.
SPECIAL REVENUE FUND OPERATING RESULTS (millions)
Fiscal year deficits: FY 96 FY 95 FY 94 FY 93 FY 92
Transportation $ 14 $ 17 $ (10) $ (36) $ 3
Grant and Loan Programs (301) (307) (306) (283) (232)
Housing Programs (36) (32) (54) (39) (37)
Other, net (66) (59) (46) 5 (20)
Deficits before proceeds from debt financing (389) (381) (416) (353) (286)
Proceeds from debt financing 405 481 480 427 536
Surplus $ 16 $ 100 $ 64 $ 74 $ 250
The deficits primarily arose in the Grant and Loan Programs Fund and the Housing Programs Fund. The Grant and Loan Fund expended $311 million in fiscal year 1996 supported by revenues of only $9 million. Bond proceeds of $289 million and fund balance resources financed the balance. The Hous-ing Programs Fund expended $45 million in fiscal year 1996. Like the Grant and Loan Programs Fund, the balance was financed by $31 million of bond proceeds, and $8 million of revenues and additional fund balance resources.
Other major special revenue funds include the Transportation Fund, which is generally self-supporting. Expenditures and transfers of $879 million were supported by revenues and transfers of $893 million in fiscal year 1996. The fund balance of the Transportation Fund was $92 million or 10% of expenditures and transfers.
The Lottery Fund continued to provide substantial support to the General Fund. Revenues of $707 million provided $262 million to the General Fund after prizes and expenses of $436 million.
The Employment Security Administration Fund expended $118 million on administration of the un-employment compensation program, supported by a like amount of federal financial assistance.
The Environmental Programs Fund also required debt financing. Expenditures and transfers of $77 million were supported by $27 million of revenues and transfers, along with bond proceeds of $64 million.
11

Capital Projects Funds
Capital spending has shown a decrease from the almost $1 billion annual rate of past years with most of that spending directed toward infrastructure projects. Approximately 60% of infrastructure expen-ditures were financed by federal aid and the balance by State debt. Unlike the deficit financing of certain special revenue funds, the debt used to finance capital construction will provide a tangible benefit to the future generation of taxpayers who will use the asset for which they will pay the debt service. In addition, these infrastructure investments improve the economic climate of the State both immediately and for many years to come.
TREND IN CAPITAL PROJECTS EXPENDITURES (millions)
Fiscal Year State
Facilities Infrastructure Transportation Total 1996 $143 $533 $14 $690 1995 286 668 3 957 1994 170 699 1 870 1993 247 612 3 862 1992 228 702 8 938
Expendable Trust Funds
The Employment Security Fund showed a small surplus with expenditures (unemployment compensa-tion claims) the lowest in five years.
EMPLOYMENT SECURITY FUND (millions)
Fiscal Year Revenues Expenditures Surplus (Deficit)
Fund Balance
1996 $590 $478 $112 $239 1995 559 484 75 127 1994 1,400 619 781 52 1993 711 928 (217) (730) 1992 517 879 (362) (512)
12

Pension Trust Funds
The operations of the pension trust funds showed slow growth for 1996. The State Employees' Retire-ment System (SERS), by far the largest pension fund for state employees (the Teachers' Retirement System primarily serves municipal employees), funded status remains fairly flat at 52.5% as of fiscal year 1996 as compared to 52.3% as of fiscal year 1992. The Teachers' Retirement System (TRS) funded status increased from 62.4% to 79.2%, and the Judicial Retirement System (JRS) from 37% to 43.2%, respectively.
PENSION FUNDED STATUS
FY 96 = FY 94 FY 93 FY 92 SERS 52.5% 54.8% 51.4% 51.4% 52.3%
TRS 79.2 77.5 70.7 69.8 62.4 JRS 43.2 37.5 36.5 36.6 37.0
Enterprise Funds
The State enterprise funds collectively incurred a gain from operations of $3 million in fiscal year 1996 with the largest fund, Bradley International Airport, earning all of this amount in fiscal year 1996 compared to a gain of $7 million in fiscal year 1995.
ENTERPRISE FUNDS (millions)
Fiscal Year
Operations Net
Non- Operating
Net
Net Income (Loss)
Retained Earnings Revenue Expenses
1996 $37 $40 $(3) $ 6 $ 3 $ 40 1995 40 39 1 97 98 37 1994 46 42 4 (2) 2 (61) 1993 45 37 8 (13) (5) (63) 1992 38 34 4 (9) (5) (58)
Higher Education
Expenditures showed a modest growth of less than 2% in fiscal year 1996, while State support de-creased slightly. Total revenues increased just 1% over fiscal year 1995.
13

TRENDS IN HIGHER EDUCATION CURRENT AND HOSPITAL FUNDS FINANCES
(millions)
Revenues: FY 96 FY 95 FY 94 FY 93 FY 92
Tuition and Fees $ 233 $ 260 $ 215 $ 205 $ 188 Federal Grants 115 93 96 93 61 Private Gifts 21 31 29 34 14 Patient Services 180 174 173 176 184 Sales and Service 130 104 143 119 111 Other 46 55 39 40 28
Total 725 717 695 667 586
Expenditures and Transfers: Education and General 903 889 777 759 708 Hospital 170 170 165 157 146 Auxiliary Enterprises 98 79 104 94 79 Other 4 20 15 13 20
Total 1,175 1,158 1,061 1,023 953
Net before State support (450) (441) (366) (356) (367) State support 442 450 364 341 382 Net $ (8) $ 9 $ (2) $ (15) $ 15
Tuition and fees as a percent of total expen-ditures and transfers 19.8% 22.5% 20.3% 20.0% 19.7%
State support as a -percent of total expen-ditures and transfers 37.6% 38.9% 34.3% 33.3% 40.1%
Debt Administration
State general obligation bonds are rated Aa, AA-, and AA by Moody's, Standard and Poor's, and Fitch Investors Service, respectively, while transportation-related special tax obligation bonds are currently rated Al, AA-, and AA-, respectively.
The State issued over $1 billion of bonds in fiscal year 1996, more than equal to fiscal year 1995. To the extent this bonding is for infrastructure or other assets benefiting future taxpayers, the debt is fully justifiable. The continued increase in the debt burden, however, particularly that portion that is used to finance current programs, bodes ill for the future. It means that future generations will pay for the sins of the past. And it means that the State will have reduced flexibility in future budgets, which will now be burdened by higher fixed costs for debt service.
14

DEBT ISSUANCES (millions)
F)7 96 FY 94 Special Revenue Funds:
Grant and Loan Programs $ 289 25.6% $ 370 34.3% $ 312 29.3% Environmental Programs 64 5.7 60 5.6 50 4.7 Housing Programs 31 2.7 23 2.1 105 9.9 Other 21 1.9 28 2.6 5 .5
405 35.9 481 44.6 472 44.4
Capital Project/Debt Service Funds: State Facilities 398 35.3 273 25.3 267 25.1 Infrastructure/Debt Service 325 28.8 325 30.1 324 30.5
723 64.1 598 55.4 591 55.6 Subtotal 1,128 100.0% 1,079 100.0% 1,063 100.0%
General Fund (Economic Recovery Notes) 236
Total Governmental $1,364 $1,079 $1,063
Debt service as a percent of government operations, excluding debt service on the Economic Recov-ery Notes, has decreased slightly to 8% from a high of 8.4% a year ago although it is still up from 7.2% only five years ago.
DEBT SERVICE AS A PERCENT OF GOVERNMENTAL OPERATING EXPENDITURES
(millions)
Debt Service (Bonded): FY 96 FY 95 FY 94 FY 93 FY 92
Principal $ 523 $ 561 $ 405 $ 362 $ 313 Interest 449 438 388 399 378
$ 972 $ 999 $ 793 $ 761 $ 691 Debt Service (Economic Recovery Notes):
Principal $ 316 $ 240 $ 150 $ 235 $ 50 Interest 17 24 30 37 35
$ 333 $ 264 $ 180 $ 272 $ 85
Governmental Operating Expenditures $12,221 $11,924 $10,934 $10,494 $ 9 541
Debt Service as a Percent of Governmental Operating Expenditures:
Bonded 8.0% 8.4% 7.3% 7.3% 7.2% Including Economic
Recovery Notes 10.7% 10.6% 8.9% 9.8°4: 8.1%
15

Net State debt increased almost 7% to $9 billion from $8.4 billion in fiscal year 1995. Net State debt has more than doubled since fiscal year 1990.
NET STATE DEBT (millions)
Debt Outstanding (June 30): FY 96 E_.( FY 94 FY 93 FY 92
General Obligation Bonds $6,000 $5,525 $5,063 $4,794 $4,014 Transportation Bonds 3,201 2,991 2,865 2,592 2,489 Notes 236 316 556 706 916
9,437 8,832 8,484 8,092 7,419 Debt Service Fund (456) (420) (490) (433) (388)
Net Debt, End of Year $8,981 $8,412 $7,994 $7,659 $7,031
Changes in Net Debt: Net Debt, Beginning of Year $8,412 $7,994 $7,659 $7,031 $5,301 Redemptions -Bonds (523) (561) (405) (362) (313) Redemptions - Notes (316) (240) (150) (235) (50) Issuances - Bonds 1,128 1,079 1,063 1,046 1,074 Issuances - Notes 236 25 966 Refundings - Issued 221 53 506 1,313 500 Refundings - Defeased (209) (49) (438) (1,175) (464) Accretion and Other 68 66 (184) 60 56 Debt Service Fund Decrease (Increase) (36) 70 (57) (44) (30)
Net Debt, End of Year $8,981 $8,412 $7,994 $7,659 $7,031
Debt per capita has more than doubled to $2,670 from $1,204 in fiscal year 1990. Bonded debt is the• primary focus of most analyses but it is only half the amount of incurred long-term obligations that will need to be paid by future generations of taxpayers. Long-term obligations also include capital leases; compensated absences that were earned by employees in past periods but which will be paid by future generations; workers' compensation claims, which arose from past events but will be settled in future periods; and the unfunded pension benefit obligation, which represents the value of pension benefits earned by employees but which is not funded currently. The total of these obligations increased $827 million in fiscal year 1996.
NET DEBT PER CAPITA*
FY 96_ FY 95 FY. 24 FY 93 FL_Y92 $2,670 $2,472 $2,271 $2,122 $1,865
*Exclusive of Economic Recovery Notes.
16

TRENDS IN SELECTED LONG TERM DEBT (millions)
EL26_ FY 95 FY 94 FY 93 FY 92
Net Bonded Debt $ 8,981 $ 8,412 $ 7,994 $ 7,659 $ 7,031 Capital Leases 54 56 55 50 50 Compensated Absences 262 257 267 175 174 Workers Compensation 268 287 295 304 298
Subtotal 9,565 9,012 8,611 8,188 7,553
Actuarial Unfunded Pension Benefit Obligation 5,366 5,092 5,455 5,165 5,731
Total $14,931 $14,104 $14,066 $13,353 $13,284
Internal Controls
Elected officials, agency commissioners, directors of public benefit corporations and agency manag-ers are responsible for establishing internal control structures. Good internal controls are essential to achieving the proper conduct of government business with full accountability. This means that:
resource use is consistent with laws, regulations and policies;
resources are safeguarded against waste, loss and misuse; and
reliable data are obtained, maintained and fairly disclosed in reports.
Good internal controls also facilitate the achievement of management objectives. In achieving these goals, good internal controls must strike a balance, providing reasonable, not absolute assurance. This recognizes that costs should not exceed benefits, nor should controls negatively impact operations.
Good internal control is comprised of the following elements:
Control Environment - which reflects the overall attitude, awareness, and actions of elected offi-cials or agency managers concerning the importance of control and its emphasis in state govern-ment (i.e. What is the tone at the top?)
Accounting System - which consists of the methods and records established to identify, assemble, analyze, classify, record, and report transactions and to maintain accountability over state re-sources.
Control Procedures - which includes those policies and procedures that elected officials and man-agement have established to provide reasonable assurance that specific objectives are being achieved.
17

This office has been making consistent efforts to improve the overall internal control in state govern-ment and simultaneously to give managers authority commensurate with their responsibilities.
Budgetary Controls
The key control mechanism of government finance is the budget. The Government Accounting Stan-dards Board (GASB) has concluded that, "The budgetary process, including comparison of the ap-proved budget with actual experience, is...a major aspect of accountability." The budget is more than just an aspect of accountability, however, it is also:
An expression of public policy that identifies the activity or program to be carried out, the amount that may be expended for these purposes, and the time period in which these are to occur.
A financial plan, or expression of financial intent. For example, what are the expected sources of financing for these programs - who bears the burden of paying for them?
A form of control usually having the force of law.
Budget control is maintained at the individual appropriation account level by agency as established in authorized bills. Control over the obligation is exercised by the allotment process. Funds, both for budgeted and non-budgeted funds, are allotted by the Governor through the Office of Policy and Man-agement. The Governor is further allowed to modify the allotments up to 3% of the fund or 5% of the appropriation amount. Modifications beyond those limits, but not in excess of 5% of the total funds, require the approval of the Finance Advisory Committee, which is comprised of the Governor, the Lieutenant Governor, the Treasurer, the Comptroller, two senate members, not of the same party, and three house members, not more than two of the same political party.
Cash and Investments Management
The State Treasurer continually monitors cash flow to maximize the utilization of cash resources. During the year, temporary balances are invested in short-term investment funds, combined investment pools consisting of various certificates of deposit, bankers' acceptances, commercial paper, repurchase agreements, and student loans with various ranges of maturities. The investment income and average yield rate for the fiscal year 1995-96 for these funds were approximately $116 million and 5.89%, respectively. By comparison, 90-day Treasury Bills and 90-day Certificates of Deposit earned 5.29% and 5.55%, respectively, during the same time period.
Bank balances at June 30, 1996, were $37 million of which about four-fifths was not insured or pro-tected by collateral.
Risk Management
The State retains risk for certain property and liability claims, including workers' compensation claims. The State Insurance Purchasing Board serves as the focal point of risk management and insurance matters, maintaining a balance of commercially placed coverage and risk retention to provide optimal coverage at minimal cost.
18

ECONOMIC CONDITION AND OUTLOOK
Employment
Connecticut's economy has been slow to emerge from a recession that began in early 1989 and ended in late 1992. The recession cost Connecticut 158,000 jobs. The State's manufacturing industry lost about 20 percent of its employment base during this period and job losses in this sector persist to date. The only other industrial sector that continues to lose jobs during the recovery is Finance, Insurance and Real Estate (FIRE); however, the FIRE losses have slowed dramatically in 1996. Most of the losses in the FIRE sector are the result of downsizing and mergers. The largest share of the manufacturing job losses is attributable to cuts in federal defense spending.
Between 1985 and 1995, Connecticut's defense procurement receipts dropped from $7.1 billion to $2.5 billion (in 1992 dollars) - a65 percent reduction. The loss of these relatively high paying defense jobs had a secondary impact on the State's overall economic performance. According to the U.S. Depart-ment of Commerce, the transportation component of the State's manufacturing industry, which is largely defense-related, has a 2.5 employment multiplier. This means each transportation job supports an addi-tional 1.5 jobs in the general economy. With the loss of defense dollars and the related jobs, Connecti-cut has increasingly relied on other business sectors for employment growth.
At present, Connecticut has recovered almost 40 percent of its recessionary employment loss. The fastest growing private industries are services, and wholesale and retail trade. Small business is fueling much of the growth in these industries. Businesses with 100 or fewer employees accounted for about 65 percent of all net new jobs created in the State between 1975 and 1993 - compared with about 50 percent nationally. Establishments employing 20 or fewer workers accounted for about one-third of these new jobs.
During the first ten months of 1996, Connecticut added a net total of 20,500 non-farm jobs. This is the strongest job growth performance since the end of the recession. The Connecticut Labor Department projects that the State will add a total of 181,500 jobs between the years 1994 and 2005, representing a 10.8 percent increase in total employment. Most of these jobs will be in health care services, business services, general services and retail trade. The State Occupational Information Coordinating Council estimates that some of the fastest growing occupations in Connecticut will be: computer engineers and systems analysts (growing 74 and 52 percent respectively); blackjack dealers and recreation workers (increasing 74 percent); and, physical therapists, medical assistants, and home health aides (up 44, 42 and 40 percent respectively).
Income
It is estimated that the jobs being created in Connecticut pay 30 to 50 percent less than the jobs that have been lost. The State's nominal median household income fell by 2.1 percent between 1994 and 1995. The results suggest that despite the employment gains of the recovery, many Connecticut fami-lies have not experienced improved economic well-being. Further evidence of wage erosion can be seen in hourly manufacturing pay, which has advanced just under 2 percent on average over the last three years. This rate of increase has not kept pace with inflation, resulting in a wage decline in real terms.
19

Despite the poor showing of median income and hourly wages, per capita income in Connecticut in-creased 5.7 percent between 1994 and 1995, the strongest gain since 1992. The contradictory move-ment in these income indicators may point to increasing income stratification in Connecticut with the largest gains being realized by those at upper income levels. This type of income distribution pattern is consistent with national results that point to increasing income inequality. It should be noted that Connecticut's per capita income is the highest in the nation - 33 percent above the national average for 1995.
Examining the changing sources of personal income in Connecticut between 1969 and 1994 shows less income being derived from wages and salaries and more income coming from dividends, interest and rent, and government transfer payments. Between 1969 and 1994, wages and salaries fell from 62.7 to 56.7 percent of total personal income. At the same time, dividends, interest and rent increased from 16.7 to 17.1 percent of total personal income. The transfer payment share of personal income increased from 7.2 to 14.1 percent over the period.
Other Economic Indicators
Although all societal sectors are not benefiting equally, Connecticut is in the midst of a solid, sustained economic recovery. In addition to general employment and personal income growth, new business starts are up roughly 10 percent over last year. New auto registrations posted a 15 percent gain in the third quarter of 1996, and major state tax receipts are running well ahead of budget expectations for the current fiscal year.
Most forecasts show Connecticut posting moderate but consistent economic gains into the next cen-tury.
Certificate of Achievement
The Government Finance Officers Association of the United States and Canada (GFOA) awarded a Certificate of Achievement for Excellence in Financial Reporting to the State of Connecticut for its comprehensive annual financial report for the fiscal year ended June, 30, 1995. The Certificate of Achievement is a prestigious national award recognizing conformance with the highest standards for preparation of state and local government financial reports.
In order to be awarded a Certificate of Achievement, a government unit must publish an easily readable and efficiently organized comprehensive annual financial report, whose contents conform to program standards. This report must satisfy both generally accepted accounting principles and applicable legal requirements.
A Certificate of Achievement is valid for a period of one year only. The State of Connecticut has received a Certificate of Achievement for the last seven consecutive years (fiscal years ended 1989-1995.) We believe our current report continues to conform to the Certificate of Achievement program requirements, and we are submitting it to GFOA.
20

Independent Audit
The Auditors of Public Accounts, who report to the legislature and are independent of the Executive Branch, have audited the accompanying financial statements in accordance with generally accepted auditing standards and their opinion has been included in this report.
ACKNOWLEDGMENTS
I wish to express my appreciation to the many individuals in all agencies whose cooperation and assistance has made this report possible. In addition, the efforts of the GAAP Reporting Unit and others in our Budget and Financial Analysis Division deserve special acknowledg-ment.
Sincerely,
Nancy Wyman State Comptroller
21

Preside
Certificate of Achievement for Excellence
in Financial Reporting
Presented to
State of Connecticut
For its Comprehensive Annual Financial Report
for the Fiscal Year Ended June 30, 1995
A Certificate of Achievement for Excellence in Financial Reporting is presented by the Government Finance Officers
Association of the United States and Canada to government units and public employee retirement
systems whose comprehensive annual financial reports (CAFRs) achieve the highest standards in government accounting
and financial reporting.
Ylit A, Executive Director
22

Legislative Agencies General Government Agencies
Regulatory Agencies
Health Agencies
Judicial Agencies
Correctional Agencies
Natural Resource and Recreation Agencies
Transportation Agency
Educational Agencies
Human Services Agencies
STATE OF CONNECTICUT Organization Chart
ELECTORATE
JUDICIAL BRANCH
EXECUTIVE BRANCH
LEGISLATIVE BRANCH
Governor Lieutenant Governor
Secretary of State Treasurer
Comptroller Attorney General
Senate House of Representatives
Auditors of Public Accounts Legislative Management
Supreme Court Appellate Court Superior Court
23

STATE OF CONNECTICUT Selected State Officials
EXECUTIVE
John G. Rowland Governor
M. Jodi Re11 Lieutenant Governor
Miles Rapoport Secretary of State
Christopher B. Burnham Treasurer
Nancy Wyman Comptroller
Richard Blumenthal Attorney General
JUDICIAL
Ellen A. Peters Chief Justice
LEGISLATIVE
M. Adela Eads President Pro Terilpore of the State Senate
(36 Senators)
Thomas D. Ritter Speaker of the House of Representatives
(151 Representatives)
24

25

STATE OF CONNECTICUT
KEVIN P. JOHNSTON
AUDITORS OF PUBLIC ACCOUNTS STATE CAPITOL
210 CAPITOL AVENUE
HARTFORD. CONNECTICUT 06106-1559
ROBERT G. JAEKLE
INDEPENDENT AUDITORS' REPORT
Governor John G. Rowland Members of the General Assembly
We have audited the accompanying general purpose financial statements of the State of Connecticut as of and for the year ended June 30, 1996, as listed in the table of contents. These general purpose financial statements are the responsibility of the State's management. Our responsibility is to express an opinion on these general purpose financial statements based on our audit. We did not audit the financial statements of the Special Transportation Fund accounts within the Transportation Fund, which represent 13 percent and 46 percent, respectively, of the assets and revenues of the Special Revenue Funds; we did not audit the financial statements of the Transportation Special Tax Obligations Fund, which represent 100 percent of the assets and revenues of the Debt Service Funds; we did not audit the financial statements of the Bradley International Airport, which represent 56 percent and 91 percent, respectively, of the assets and revenues of the Enterprise Funds; we did not audit the financial statements of the Clean Water Fund, which represent four percent and one percent, respectively, of the assets and revenues of the Trust and Agency Funds; we did not audit the financial statements of the Connecticut Housing Finance Authority, the Connecticut Resources Recovery Authority, the Connecticut Development Authority, the Connecticut Health and Educational Facilities Authority, the Connecticut Higher Education Supplemental Loan Authority, and Connecticut Innovations Incorporated, which represent 100 percent of the assets and revenues of the Component Unit Funds; and, we did not audit the financial statements of the Connecticut State University, the University of Connecticut Foundation or that portion of the financial statements of the University Health Center Hospital and Current Unrestricted Funds involving patient receivables arising from clinical operations, which represent 33 percent and 40 percent, respectively, of the assets and revenues of the Higher Education and University Hospital Funds. Those financial statements were audited by other auditors whose reports thereon have been furnished to us, and our opinion, insofar as it relates to the amounts included for the aforementioned fluids and accounts, is based solely on the reports of other auditors. All of the aforementioned audits were conducted in accordance with generally accepted auditing standards. In addition, the audits of the Connecticut Resources Recovery Authority, Connecticut Housing Finance Authority, Connecticut Development Authority, Connecticut Innovations Incorporated, and Clean Water Fund, were conducted in accordance with Government Auditing Standards, issued by the Comptroller General of the United States.
26

We conducted our audit in accordance with generally accepted auditing standards and Government Auditing Standards, issued by the Comptroller General of the United States, except that the audits of certain component units of the State, as described above, were not conducted in accordance with Government Auditing Standards. Those standards require that we plan and perform the audit to obtain reasonable assurance about whether the general purpose financial statements are free of material misstatement. An audit includes examining, on a test basis, evidence supporting the amounts and disclosures in the general purpose financial statements. An audit also includes assessing the accounting principles used and significant estimates made by management, as well as evaluating the overall general purpose financial statement presentation. We believe that our audit and the reports of other auditors provide a reasonable basis for our opinion.
In our opinion, based on our audit and the reports of other auditors, the general purpose financial statements referred to above present fairly, in all material respects, the financial position of the State of Connecticut as of June 30, 1996, and the results of its operations, and cash flows of its proprietary fund types and non-expendable trust funds, for the year then ended in conformity with generally accepted accounting principles.
In accordance with Government Auditing Standards, we have also issued a report dated December 31, 1996, on our consideration of the State of Connecticut's internal control structure and a report dated December 31, 1996, on its compliance with laws and regulations. These reports will be included in the State's Single Audit Report for the fiscal year ended June 30, 1996.
As discussed in Note 18 to the financial statements, during the audited period, the State of Connecticut changed its method for reporting the value of combined investment fund holdings from cost to market.
As discussed in Note 23 to the financial statements, the State of Connecticut is a defendant in certain legal proceedings. The ultimate outcome of the litigation cannot presently be determined. Accordingly, no provision for any liability that may result upon adjudication has been made in the accompanying financial statements.
Our audit was made for the purpose of forming an opinion on the general purpose financial statements taken as a whole. The combining and individual fund and account group financial statements and schedules listed in the table of contents are presented for purposes of additional analysis and are not a required part of the general purpose financial statements of the State of Connecticut. Such information has been subjected to the auditing procedures applied in the audit of the general purpose financial statements and, in our opinion, is fairly presented in all material respects in relation to the general purpose financial statements taken as a whole.
27

We did not audit the data included in the introductory and statistical sections of this report, and accordingly, express no opinion thereon.
444t, ,•14.0. Kevin P. Johnston Auditor of Public Accounts
Robert G. Jaelde Auditor of Public Accounts
December 31, 1996 State Capitol Hartford, Connecticut
28

General Purpose Financial Statements
29

STATE OF CONNECTICUT Combined Balance Sheet All Fund Types, Account Groups, and Discretely Presented Component Units June 30, 1996 (Expressed in Thousands)
Assets and Other Debits:
Governmental Fund Types Proprietary Fund Types
General Special
Revenue Debt
Service Capital Projects
Internal Enterprise Service
Cash and Cash Equivalents $ $ 356,909 $ - $ 200,167 $ 16,618 $ 1,912 Investments:
Equity in Combined Investment Funds Other 27,035 52,920
Receivables: Taxes 551,300 44,624
- Accounts, Net of Allowances Tuition
298,442 -
23,787 -
- 2,047 -
3,549
-
1,853
Loans, Net of Allowances - 391,199 - 90,606 Interest 1,352 7,527 7,087 492 11,227 Federal Grants Receivable 63,363 8,074 13,139 Non-Federal Grants Receivable 1,415 314 -
Deposits with U.S. Treasury - Due From Other Funds 13,840 23,499 279,415 4,149 Due From Component Units - - - Due From Primary Government - , Advances to Other Funds - 4,532 - -
From Other Governments ,Receivable 386,638 6,771 46,705 3,588 - Inventories and Prepaid Items 48,553 12,988 - - 363 2,971 Restricted Assets - - 455,740 48,872 - Property, Plant & Equipment - 137,551 47,193 Other Assets 102,428 - 1,740 1,215 Other Debits: Amount Available in Debt Service Fund Amount to be Provided For Debt Retirement - -
Total Assets and Other Debits $ 1,467,331 $ 907,259 $ 462,827 $ 541,965 $ 367,034 $ 59,293 Liabilities, Equity and Other Credits: Liabilities: Accounts Payable and Accrued Liabilities $ 721,756 $ 73,249 $ - $ 95,985 $ 8,744 $ 3,537 Due to Other Funds 330,999 3,151 7,087 8,791 2,459 10,993 Due to Primary Government - - - - - Due to Component Units 224 11,176 Payable to Other Governments 70,752 158 - - Advances Due Other Funds 4,532 - - Deferred Revenue 487,490 28,687 21,137 31 2,748 Escrow Deposits - - - Notes and Loans Payable .- Deferred Compensation Liability Agency Deposit Liabilities General Obligation Bonds Transportation Related Bonds Special Assessment Unemployment Compensation Bonds - Revenue Bonds - 214,170 Capital Leases - - - Compensated Absences 69 2,843 Unfunded Pension Costs - - - Workers Compensation Liability - Liability for Landfill Closure Costs - Amount Held for Institutions _ Liability for Escheat Property 28,850 Claims and Judgements - Malpractice Liability - Total Liabilities 1,644,603 116,421 7,087 125,913 225,473 20,121
Equity and Other Credits: Investment in Fixed Assets Contributed Capital 101,409 7,930 Retained Earnings:
Reserved 22,329 - Unreserved - 17,823 31,242
Fund Balances: Reserved 462,645 423,108 455,740 - Unreserved, undesignated (639,917) 367,730 - . 416,052
Total Equity and Other Credits (177,272) 790,838 455,740 416,052 141,561 39,172 Total Liabilities, Equity and Other Credits $ 1,467,331 $ 907,259 $ 462,827 $ 541,965 $ 367,034 $ 59,293
The accompanying notes are an integral part of the financial statements.
30

Fiduciary Fund Types
Account Groups Higher Education & University Hospital
Total Primary
Government (Memorandum
only) Component
Units
Total Reporting
Entity (Memorandum
only)
General Fixed Assets
General Long-Term
Debt Trust and
Agency
865,521 $ $ 265,530 $ 1,706,657 $ 127,894 $ 1,834,551
13,676,961 383 13,677,344 13,677,344 541,915 79,737 701,607 607,728 1,309,335
595,924 595,924 40,841 74,854 445,373 12,866 458,239
447 447 447 347,066 29,305 858,176 2,517,590 3,375,766
24,283 182 52,150 41,353 93,503 84,576 84,576
108 1,837 1,837 238,951 238,951 238,951
10,793 65,380 397,076 397,076 45,237 45,237 45,237
55,980 55,980 - 4,532 4,532
6,569 - 450,271 450,271 464 9,233 74,572 2,014 76,586
307,978 812,590 3,008,993 3,821,583 3,502,771 1,693,549 5,381,064 261,244 5,642,308
577,173 - 3,977 686,533 86,675 773,208
455,740 455,740 455,740 15,982,718 15,982,718 15,982,718
16,638,623 $ 3,502,771 $ 16,438,458 $ 2,267,814 $ 42,653,375 $ 6,722,337 $ 49,375,712
25,032 $ 111,162 $ 1,039,465 $ 126,607 $ 1,166,072 24,603 8,993 397,076 397,076
45,237 45,237 44,580 55,980 55,980
371 71,281 71,281 4,532 4,532
9,935 28,708 578,736 7,068 585,804 93,726 93,726
236,055 5,676 241,731 241,731 411,870 411,870 411,870
1,361,232 8,012 1,369,244 1,369,244 5,999,596 5,999,596 5,999,596 3,201,076 3,201,076 3,201,076
911,505 911,505 911,505 393,026 98,654 705,850 5,492,926 6,198,776
54,397 54,397 54,397 261,616 48,899 313,427 313,427
5,484,100 5,484,100 5,484,100 268,150 268,150 268,150
15,513 15,513 359,441 359,441
28,850 28,850 21,963 21,963 21,963
8,633 8,633 8,633
2,226,069 16,438,458 363,317 21,167,462 6,140,518 27,307,980
3,502,771 1,589,606 5,092,377 5,092,377 109,339 223,507 332,846
22,329 366,371 388,700 49,065 (8,059) 41,006
13,786,666 150,487 15,278,646 15,278,646 625,888 164,404 934,157 934,157
14,412,554 3,502,771 1,904,497 21,485,913 581,819 22,067,732
16,638,623 $ 3,502,771 $ 16,438,458 $ 2,267,814 $ 42,653,375 $ 6,722,337 $ 49,375,712
31

STATE OF CONNECTICUT Combined Statement of Revenues, Expenditures, and Changes in Fund Balances All Governmental Fund Types and Expendable Trust Funds For The Fiscal Year Ended June 30, 1996 (Expressed in Thousands)
Governmental Fund Types
General
Special
Revenue
Debt
Service
Capital
Projects
Revenues:
Taxes $ 6,831,209 $ 508,054 $ $
Licenses, Permits and Fees 111,986 317,817 -
Intergovernmental 2,643,670 186,811 324,609
Charges for Services 188,443 23,386
Fines, Forfeits and Rents 23,929 1,430
Investment Earnings 25,691 17,958 29,586 119
Lottery 706,860
Assessments Miscellaneous 128,965 63,393 192
Total Revenues 9,953,893 1,825,709 29,586 324,920
Expenditures: Current:
Legislative 47,422
General Government 550,369 632,304
Regulation and Protection 104,577 310,731
Conservation and Development 65,257 156,126
Health and Hospitals 819,068 7,433
Transportation 358,144
Human Services 3,439,377 10,705
Education, Libraries and Museums ,1,819,843 159,068
Corrections 839,003 7,302
Judicial 264,492 7,079
Federal and Other Grants 808,233 67,197
Capital Projects 689,532
Debt Service:
Principal Retirement 366,670 41,010 431,120
Interest and Fiscal Charges 270,308 15,479 180,430
Total Expenditures 9,394,619 1,772,578 611,550 689,532
Excess (Deficiency) of Revenues Over Expenditures 559,274 53,131 (581,964) (364,612)
Other Financing Sources (Uses):
Proceeds from Sale of Bonds and Notes - 404,702 265,596 694,026
Operating Transfers In 264,781 126,339 382,428 -
Operating Transfers Out (625,972) (569,047) (30,483) (107,128)
Capital Lease Obligations 4,316 636 -
Proceeds of Refunding Bonds - 225,891
Payment to Refunded Bond Escrow Agent (225,891)
Payment for Current Refunding of Debt -
Total Other Financing Sources (Uses) (356,875) (37,370) 617,541 586,898
Excess (Deficiency) of Revenues and Other Sources Over Expenditures and Other Uses 202,399 15,761 35,577 222,286
Fund Balances (deficit) - July 1 (380,696) 780,051 420,163 193,766
Equity Transfer to Component Units Contributed Capital (4,752) - - Changes in Reserves for Inventories 1,025 (222)
Fund Balances (deficit) - June 30 $ (177,272) $ 790,838 $ 455,740 $ 416,052
The accompanying notes are an integral part of the financial statements.
32

Fiduciary
Fund Type Total
Expendable (Memorandum
Trust only)
580,150 7,919,413
73 429,876
3,155,090
211,829
25,359
19,006 92,360 706,860
253,750 253,750
10,355 202,905
863,334 12,997,442
47,422
9,428 1,192,101
587,569 1,002,877 221,383 826,501 358,144
3,450,082 1,978,911
846,305 271,571 875,430
689,532
74,481 913,281
41,799 508,016
713,277 13,181,556
150,057 (184,114)
(4,073)
1,364,324
773,548
(1,336,703)
4,952
453,360
(225,891)
(227,469)
227,469
(227,469)
(4,073) 806,121
145,984 622,007
253,296 1,266,580 (4,752)
803
399,280 1,884,638
33

STATE OF CONNECTICUT Combined Statement of Revenues, Expenditures, and Changes in Fund Balances Budget and Actual - Non-GAAP Budgetary Basis General Fund and Budgeted Special Revenue Funds For the Fiscal Year Ended June 30, 1996 (Expressed in Thousands)
General Fund Variance Budget Actual
Revenues:
Budgeted Taxes, Net of Refunds $ 6,735,200 Operating Transfers In 272,600 Indian Gaming Payments 148,700 Licenses, Permits, and Fees 113,000 Other 221,000 Federal Grants 1,684,000 Operating Transfers Out (85,000)
$ 6,758,185 272,690 148,703 112,037 220,491
1,684,030 (85,000)
$ 22,985 90
3 (963) (509)
30
Total Budgeted 9,089,500 9,111,136 21,636 Federal and Other Restricted 799,950 799,950
Total Revenues 9,089,500 9,911,086 821,586
Expenditures: Budgeted Legislative 39,708 37,759 1,949 General Government 429,540 387,683 41,857 Regulation and Protection 88,989 82,268 6,721 Conservation and Development 52,735 49,938 2,797 Health and Hospitals 733,568 710,516 23,052 Transportation - - - Human Services 3,270,863 3,234,159 36,704 Education, Libraries, and Museums 2,085,201 2,075,705 9,496 Corrections 742,874 693,414 49,460 Judicial 199,811 198,594 1,217 Non Functional 1,444,293 1,376,113 68,180 Appropriations Lapsed (158,809) (158,809)
Total Budgeted 8,928,773 8,846,149 82,624 Federal and Other Restricted 799,950 (799,950)
Total Expenditures 8,928,773 9,646,099 (717,326) Excess (Deficiency) of Revenues Over Expenditures 160,727 264,987 104,260
Other Financing Sources (Uses): Prior Year Appropriations Carried Forward 67,150 67,150 Appropriations Continued to Fiscal Year 1996-97 (82,624) (82,624) Transfers Between Funds Miscellaneous Adjustments 454 454 Total Other Financing Sources (Uses) 67,150 (15,020) (82,170)
Excess (Deficiency) of Revenues and Other Sources Over Expenditures and Other Uses S 227,877 249,967 $ 22,090
Budgetary Fund Balances (deficit) - July 1 509,565 Changes in Reserves (80,334) Budgetary Fund Balances - June 30 679,198 The accompanying notes are an integral part of the financial statements.
34

35
Budgeted Special Revenue Funds (Total Memorandum Only) Variance Budget Actual Variance Budget Actual
500,600 $ 498,370 $ (2,230) $ 7,235,800 $ 7,256,555 $ 20,755 85,000 85,000 357,600 357,690 90
- - 148,700 148,703 3 273,000 272,817 (183) 386,000 384,854 (1,146)
92,180 89,102 (3,078) 313,180 309,593 (3,587) 4,000 4,045 45 1,688,000 1,688,075 75 (200) (250) (50) (85,200) (85,250) (50)
954,580 949,084 (5,496) 10,044,080 10,060,220 16,140 69,098 69,098 869,048 869,048
954,580 1,018,182 63,602 10,044,080 10,929,268 885,188
39,708 37,759 1,949 2,666 2,280 386 432,206 389,963 42,243
154,712 140,003 14,709 243,701 222,271 , 21,430 737 633 104 53,472 50,571 2,901 - - 733,568 710,516 23,052
314,612 295,213 19,399 314,612 295,213 19,399 3,436 3,054 382 3,274,299 3,237,213 37,086
- - 2,085,201 2,075,705 9,496 - - 742,874 693,414 49,460 - - 199,811 198,594 1,217
511,016 495,120 15,896 1,955,309 1,871,233 84,076 (24,851) - (24,851) (183,660) (183,660)
962,328 936,303 26,025 9,891,101 9,782,452 108,649 69,098 (69,098) 869,048 (869,048)
962,328 1,005,401 (43,073) 9,891,101 10,651,500 (760,399)
(7,748) 12,781 20,529 152,979 277,768 124,789
18,774 18,774 85,924 85,924 (18,921) (18,921) (101,545) (101,545)
1,423 1,423 1,423 1,423 586 586 1,040 1,040
18,774 1,862 (16,912) 85,924 (13,158) (99,082)
11,026 14,643 $ 3,617 $ 238,903 264,610 $ 25,707
246,723 756,288
38,679 (41,655) 300,045 979,243
$

STATE OF CONNECTICUT Combined Statement of Revenues, Expenses, and Changes in Retained Earnings/Fund Balances All Proprietary Fund Types, Similar Trust Funds, and Discretely Presented Component Units For The Fiscal Year Ended June 30, 1996 (Expressed in Thousands)
Proprietary Fund Types Fiduciary Fund Types
Enterprise Internal Service
Nonexpendable Trust
Pension Trust
Operating Revenues: Charges for Services 33,959 $ 103,006 $ Participants' Contributions 232,100 State Contribution 403,577 Interest on Financing Activities 3,350 Investment Earnings 26,219 1,714,864 Intergovernmental 9,165 Civic Center Lease Operations Miscellaneous 245 83,497
Total Operating Revenues 37,309 103,006 35,629 2,434,038
Operating Expenses: Cost of Sales and Services 69,542 Administrative 24,722 13,514 1,008 120 Depreciation and Amortization 7,755 16,010 Interest on Financing Activities 7,856 - 18,909 - Benefit Payments and Refunds - 910,370 Other Program Expenses 980 26,009 Civic Center Lease Operations - - Arbitrage Rebate
Total Operating Expenses 40,333 99,066 20,897 936,499
Operating Income (Loss) (3,024) 3,940 14,732 1,497,539
Nonoperating Revenues (Expenses): Interest and Investment Income 8,140 Interest and Fiscal Charges (6,919) Other 539 Sale of Foreclosed Real Estate
Total Nonoperating Income (Expense) 1,760
Income (Loss) Before Operating Transfers (1,264) 3,940 14,732 1,497,539 Operating Transfers In (Out)
Operating TranSfers In 4,892 13,546 703 Operating Transfers Out (822) (3,648) (44)
Net Income (Loss) 2,806 3,940 24,630 1,498,198 Add Items Affecting Contributed Capital: Depreciation on Equipment Acquired through
Capital Grants
Total Add Back Items Retained Earnings/Fund Balances - July 1 37,346 27,303 310,673 12,179,773
Retained Earnings/Fund Balances - June 30 40,152 $ 31,243 $ 335,303 $ 13,677,971
The accompanying notes are an integral part of the financial statements.
36

Total Primary
Government (Memorandum only)
Proprietary Fund Type
Total Reporting
Entity (Memorandum only)
Component Units
136,965 $ 138,819 $ 275,784 232,100 - 232,100 403,577 - 403,577
3,350 308,510 311,860 1,741,083 - 1,741,083
9,165 - 9,165 6,424 6,424
83,742 23,378 107,120
2,609,982 477,131 3,087,113
69,542 69,542 39,364 128,215 167,579 23,765 23,467 47,232 26,765 305,044 331,809
910,370 910,370 26,989 24,691 51,680
7,806 7,806 1,194 1,194
1,096,795 490,417 1,587,212
1,513,187 (13,286) 1 1,499,901
' 8,140 62,119 70,259 (6,919) (24,531) (31,450)
539 732 1,271
- 4,847 4,847
1,760 43,167 44,927
1,514,947 29,881 1,544,828
19,141 19,141 (4,514) (4,514)
1,529,574 29,881 1,559,455
168 168
168 168 12,555,095 328,263 12,883,358
14,084,669 358,312 14,442,981
.
37

STATE OF CONNECTICUT Combined Statement of Cash Flows All Proprietary Fund Types, Nonexpendable Trust Funds, and Discretely Presented Component Units For The Fiscal Year Ended June 30, 1996 (Expressed in Thousands)
Proprietary Fund Fiduciary Fund Total
Types Type Primary
Internal Nonexpendable Government
Enterprise Service Trust (Memorandum only)
Cash Flows From Operating Activities: Operating Income (Loss) - $ (3,024) $ 3,940 $ 14,732 $ 15,648
Adjustments to reconcile operating income (loss) to net cash provided by (used in) operating activities: , Amortization and Depreciation 7,755 16,010 - 23,765
Provision for loan losses 417 417
Investment income. - (26,219) (26,219)
Interest expense 7,856 - 18,909 26,765
Changes in assets and liabilities: (Increase) decrease in receivables (598) 676 (1,963) (1,885)
(Increase) decrease in due from other funds 2,549 4,054 6,603
(Increase) decrease in receivable from other govemments 21 - - 21 (Increase) decrease in inventories and prepaid expenses (80) 2,153 2,073
Increase (decrease) in accounts payable and accrued liabilities 1,273 (3,169) 1,289 (607)
Increase (decrease) in due to other funds (860) 1,485 (1,667) (1,042)
Increase (decrease) in payable to other govemments - - , . - Miscellaneous operating activities 4,183 196 1,925 6,304
Issuance of loans, notes 8c installment contracts receivable - (33,712) (33,712) Collection of loans, notes & installment contracts receivable 2,248 2,248
Net cash provided by (used in) operating activities 19,191 23,840 (22,652) 20,379
Cash Flows From Noncapital Financing Acitivites: Contributed capital - - Proceeds from sale of bonds and notes - - 129,656 129,656 Retirement of bonds and notes payable (2,305) (55,615) (57,920) Interest on bonds and notes payable (8,039) - (18,721) (26,760) Transfers from other funds 4,892 13,546 18,438 Transfers to other funds (822) ' (3,649) (4,471) Bond issuance and/or redemption costs - Miscellaneous noncapital financing activities-Additions - - Miscellaneous noncapital financing activities-Deletions -
Net cash provided by (used in) noncapital financing activities (6,274) 65,217 58,943
Cash Flows From Capital And Related Finanicing Activities: Purchase of fixed assets (6,410) (21,928) (28,338) Proceeds from sale of bonds and notes Retirement of bonds and notes payable (2,630) (2,630) Interest on bonds and notes payable (6,967) (6,967)
- Capital contributions or grants 1,871 1,871 Miscellaneous capital and related financing activities-Additions Miscellaneous capital and related financing activities-Deletions
Net cash provided by (used in) capital and related financing activities (14,136) (21,928) (36,064)
Cash Flows From Investing Activities: Proceeds from sales of investment securities Purchases of investment securities (627) (58,701) (59,328) Interest and income on investments 7,533 16,712 24,245 Reduction in loan receivable
Net cash provided by (used in) investing activities 6,906 (41,989) (35,083)
Increase (decrease) in cash 5,687 1,912 576 8,175 Cash and cash equivalents - July 1 49,782 3,728 53,510 Cash and cash equivalents - June 30 $ 55,469 $ 1,912 $ 4,304 - $ 61,685
Reconciliation of cash and cash equivalents to balance sheet: Cash and cash equivalents - June 30 (balance sheet) $ 16,618 $ 865,521 Plus-cash and cash equivalents in restricted assets 38,851 - Less-cash and cash equivalents in other fiduciary fund types 861,217 Cash and cash equivalents -June 30 'S 55,469 $ 4,304
The accompanying notes are an integral part of the financial statements.
38
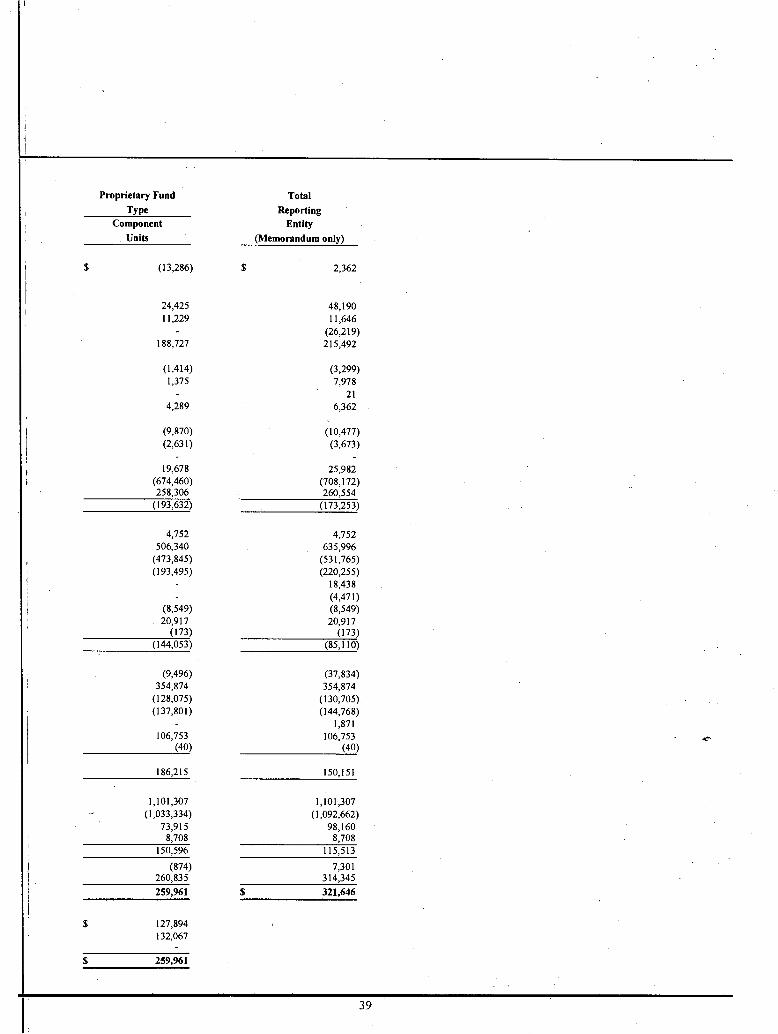
Proprietary Fund Total Type Reporting
Component Entity Units (Memorandum only)
(13,286) 2,362
24,425 48,190
11,229 11,646 (26,219)
188,727 215,492
(1,414) (3,299)
1,375 7,978 21
4,289 6,362
(9,870) (10,477)
(2,631) (3,673)
19,678 25,982
(674,460) (708,172)
258,306 260,554 (193,632) (173,253)
4,752 4,752
506,340 635,996
(473,845) (531,765)
(193,495) (220,255) 18,438 (4,471)
(8,549) (8,549)
20,917 20,917
(173) (173) (144,053) (85,110)
(9,496) (37,834)
354,874 354,874
(128,075) (130,705)
(137,801) (144,768) 1,871
106,753 106,753
(40) (40)
186,215 150,151
1,101,307 1,101,307
(1,033,334) (1,092,662)
73,915 98,160
8,708 8,708 150,596 115,513
(874) 7,301
260,835 314,345
259,961
321,646
127,894 132,067
259,961
39

STATE OF CONNECTICUT Combined Statement of Changes in Fund Balances Higher Education and University Hospital Funds For The Fiscal Year Ended June 30, 1996
(Expressed in Thousands)
Revenues and Other Additions:
Current Funds Hospital Funds
Endowment and
Similar Funds Unrestricted Restricted
Current and Hospital Funds Revenues 457,867 $ 155,965 $ 124,957 $
Federal Grants and Contracts Private Gifts, Grants, and Contracts 19
Investment Earnings 276
Interest on Loans Receivable Expended for Plant Facilities Retirement of Indebtedness
Foundation Revenues Miscellaneous 636
Total Revenues and Other Additions 457,867 155,965 124,957 931
Expenditures and Other Deductions: Education and General 761,370 141,582
Auxiliary Enterprises 98,269 98
Hospital 48,233 140 121,608
Indirect Costs Recovered 14,248 Loan Cancellations and Write-offs Interest on Indebtedness Capital Expenditures Disposal of Plant Facilities Administrative Costs Retirement of Indebtedness Foundation Expenditures Other 109 118
Total Expenditures and Other Deductions 907,981 156,186 121,608
Transfers Among Funds - Additions (Deductions) Mandatory:
Retirement of Indebtedness (4,113) (212) Nonmandatory:
Other (6,498) 2,283 828 167 Total Transfers Among Funds (10,611) 2,283 616 167
Operating transfers from the State's Governmental Funds 442,071 - Net Increase (Decrease) in Fund Balances (18,654) 2,062 3,965 1,098
Fund Balances (deficit) - July 1 (as restated) 92,774 25,032 29,844 4,056 Fund Balances (deficit) - June 30 74,120 $ 27,094 $ 33,809 $ 5,154
The accompanying notes are an integral part of the financial statements.
40

Loan Funds
Plant Funds
Affiliated Organization Total
- $ - $ 738,789 12 3,427 3,439
169 188 164 4,874 5,314 452 452
142,906 142,906 2,165 2,165
29,739 29,739 349 11,230 12,215
1,146 164,602 29,739 935,207
902,952 98,367
169,981 14,248
54 54 7,172 7,172
112,522 112,522 17,143 17,143
115 115 2,430 2,430
10,346 10,346 190 69,025 69,442 359 208,292 10,346 1,404,772
4,325
(119) 3,339 (119) 7,664
106,457 548,528 668 70,431 19,393 78,963
31,393 1,579,167 63,268 1,825,534 32,061 $ 1,649,598 $ 82,661 $ 1,904,497
41

STATE OF CONNECTICUT Combined Statement of Revenues, Expenditures, and Other Changes Higher Education and University Hospital Funds For The Fiscal Year Ended June 30, 1996 (Expressed in Thousands)
Revenues:
Current Funds Hospital Funds Total Unrestricted Restricted
Student Tuition and Fees $ ' 233,334 $ $ $ 233,334
Federal Grants and Contracts 11,335 104,161 115,496
Private Gifts and Grants 3,967 16,576 20,543
Patient Service 55,653 - 124,677 180,330
Sales and Services 130,412 130,412
Investment Earnings 8,247 1,241 9,488
Endowment Income - 76 - 76 Miscellaneous 14,919 19,766 280 34,965
Total Revenues 457,867 141,820 124,957 724,644
Expenditures and Mandatory Transfers: Education and General:
Instruction 321,533 19,869 341,402
Research 22,443 69,809 92,252
Public Service 18,449 11,464 29,913
Academic Support 87,353 3,481 - 90,834
Student Services 44,773 3,788 48,561
Institutional Support 152,128 3,807 155,935
Scholarship and Fellowships 37,675 28,634 - 66,309 Plant Operations and Maintenance 77,016 730 77,746
Total Educational and General Expenditures 761,370 141,582 902,952
Hospital 48,233 140 121,608 169,981 Auxiliary Enterprises 98,269 98 98,367
Mandatory Transfers: Retirement of Indebtedness 4,113 212 4,325
Total Expenditures and Mandatory Transfers 911,985 141,820 121,820 1,175,625
Other Transfers - Additions (Deductions): Operating Transfers from the State's
Governmental Funds 442,071 442,071 Subsidy Transfers (1,128) - 1,128 Other Non-mandatory Transfers (5,370) 2,283 (300) (3,387) Excess of Restricted Receipts over Transfers
to Revenues (103) (103) Refunded to Grantors (109) (118) (227)
Total Other Transfers and Additions (Deductions) 435,464 2,062 828 438,354
Net Increase (Decrease) in Fund Balances $ (18,654) $ 2,062 $ 3,965 $ (12,627)
The accompanying notes are an integral part of the financial statements.
42

STATE OF CONNECTICUT Notes to the Financial Statements
June 30, 1996 (Amounts in thousands unless otherwise stated)
Note 1 SUMMARY OF SIGNIFICANT ACCOUNTING POLICIES
Basis of Presentation The accompanying financial statements of the State of Connecticut have been prepared in conformity with generally accepted accounting principles as prescribed in pronouncements of the Governmental Accounting Standards Board (GASB). The financial statements of the higher education and university hospital funds have been prepared in conformity with generally accepted accounting principles as prescribed by the American Institute of Certified Public Accountants Industry Au-dit Guide, Audits of Colleges and Universities.
Financial Reporting Entity As required by generally accepted accounting prin-ciples, the accompanying financial statements include (1) all funds, agencies, boards, commissions, and ac-count groups that comprise the State's legal entity, (2) legally separate organizations that are financially ac-countable to the State (component units), and (3) other organizations for which the nature and significance of their relationship with the State are such that exclu-sions would cause the State's financial statements to be misleading (affiliated organizations). Financial ac-countability exists if (1) the State appoints a voting majority of the organization's governing board and (2) the State is able to impose its will on the organization, or there is a potential for the organization to provide specific financial benefits to, or impose specific finan-cial burdens on the State.
Component Units Component units are reported in the combined finan-cial statements in a separate column (discrete presen-tation). In this column, the State has included legally separate organizations for which the State appoints a voting majority of the organization's governing board and is contingently liable for the organization's debt or provides significant funding for the organization's pro-
grams (applies only to the Connecticut Innovations, Incorporated). The financial data of the following organizations is included in this column.
Connecticut Development Authority The Authority is a public instrumentality and political subdivision of the State. It was created to stimulate industrial and commercial development within the State through its Self-Sustaining Bond, Umbrella and Insurance Programs as well as other programs.
Connecticut Housing Finance Authority The Authority is a public instrumentality and political subdivision of the State. It was created for the purpose of increasing the housing supply and encouraging and assisting in the purchase, development and construc-tion of housing for low and moderate families and persons throughout the State. The Authority's fiscal year is for the period ending on December 31, 1995.
Connecticut Resources Recovery Authority The Authority is a public instrumentality and political subdivision of the State. It is responsible for imple-menting the State Solid Waste Management Plan by determining the location of and constructing solid waste management projects, owning, operating, and maintaining waste management projects, or making provisions for operation and maintenance by contract-ing with private industry.
Connecticut Higher Education Supplemental Loan Authority The Authority is a public instrumentality and political subdivision of the State. It was created to assist students, their parents and institutions of higher educa-tion to finance the cost of higher education through its Bond funds.
43

STATE OF CONNECTICUT Notes to the Financial Statements
Connecticut Health and Educational Facilities Authority The Authority is a public instrumentality and political subdivision of the State. The purpose of the Authority is to assist certain health care institutions, institutions of higher education, and qualified for-profit and not-for-profit institutions in the financing and refinancing of projects to be undertaken in relation to programs for these institutions.
Connecticut Innovations, Incorporated The Corporation is a public instrumentality and politi-cal subdivision of the State. It was established to stimulate and promote technological innovation and application of technology within Connecticut and en-courage the development of new products, innova-tions, and inventions or markets in Connecticut by providing financial technical assistance.
Condensed financial information for the major compo-nent units is disclosed in Note 21. Complete financial statements of the individual component units can be obtained from their respective administrative offices.
Affiliated Organizations The University of Connecticut Foundation, Inc. is a nonprofit corporation created exclusively to solicit, receive, and administer gifts and financial resources from private sources for the benefit of all campuses and programs of the University of Connecticut. The Uni-versity is not financially accountable for the Founda-tion; however, because the nature and significance of the Foundation's relationship with the University are such that exclusion of the Foundation would cause the University's financial statements to be misleading, the Foundation is included as a component unit in the University's financial statements, which are included in the Higher Education and University Hospital funds group.
c. Fund Accounting The financial activities of the State are accounted for in individual funds and account groups.
A fund is a fiscal and accounting entity with a self-balancing set of accounts recording cash and other
financial resources, together with all related liabilities and residual equities or balances, and changes therein, which are segregated for the purpose of carrying on specific activities or attaining certain objectives in accordance with special regulations, restrictions or limitations. In the financial statements, individual funds are classified in four fund categories and compo-nent units. The four fund categories are: governmental funds, proprietary funds, fiduciary funds, and higher education and university hospital funds.
Account groups are accounting entities used to account for the State's general fixed assets and long-term debt. These account groups are not funds because they do not reflect available financial resources and related liabili-ties. In the financial statements, the account groups are the general fixed asset account group and the general long-term debt account group.
Because the State of Connecticut has a significant number of legal funds, a functional basis combining presentation was chosen to facilitate the preparation and readability of the Comprehensive Annual Finan-cial Report (CAFR). More detailed information on the legal funds can be found in the Annual Report of the Comptroller - a "modified cash" basis document also produced by the Office of the Comptroller.
Following is a description of the fund categories, account groups, and component units used in the ac-companying financial statements:
Governmental Funds General Fund - The General Fund is the general
operating fund of the State. It is used to account for all financial resources obtained and spent for those serv-ices normally provided by the State (e.g. health, social assistance, education, etc.), which are not accounted for in other funds.
Special Revenue Funds - These funds are used to account for the proceeds of specific revenue sources (other than expendable trusts, major capital projects, and higher education and university hospital sources) that are legally restricted to expenditures for specified purposes. For example, motor fuel taxes levied to fund
44

STATE OF CONNECTICUT Notes to the Financial Statements
Department of Transportation costs.
Debt Service Fund - This fund is used to account for the accumulation of resources for, and the payment of, principal and interest on general long-term bonds and notes.
Capital Projects Funds - These funds are used to account for financial resources to be used for the acquisition or construction of major capital facilities and infrastructure projects (other than those financed by proprietary funds and higher education and univer-sity hospital funds).
Proprietary Funds Enterprise Funds - These funds are used to account
for operations that (a) are financed and operated in a manner similar to private business enterprises - where the intent of the governing body is that the costs (expenses, including depreciation) of providing goods or services to the general public on a continuing basis be financed or recovered primarily through user charges; or (b) where the governing body has decided that periodic determination of revenues earned, expenses incurred, and/or net income is appropriate for capital maintenance, public policy, management control, ac-countability or other purposes.
Internal Service Funds - These funds are used to account for the financing of goods or services provided by one department or agency to other departments or agencies of the State, or to other governments, on a cost-reimbursement basis.
Fiduciary Funds Trust and Agency Funds - These funds are used to account for assets held by the State in a trustee capacity or as an agent for individuals, private organizations, other governmental units, and other funds. These funds include expendable trust funds, nonexpendable trust funds, pension trust funds, and agency funds.
Account Groups 1. General Fixed Asset Account Group - This account group includes all the fixed assets (excluding infra-
structure) that are not accounted for in the proprietary funds and higher education and university hospital funds.
2. General Long-Term Debt Account Group - This account group includes all long-term obligations which are to be financed from governmental funds. These long-term obligations include the following:
Unmatured principal on general obligation and transportation related bonds and notes.
Other non-current liabilities for capital leases, compensated absences, unfunded pension costs, and workers' compensation claims.
Higher Education and University Hospital Funds The financial activities of the State's higher education institutions (University of Connecticut, state universi-ties, and community-technical colleges), the univer-sity hospital, and affiliated organizations are accounted for in these funds, which are presented in a separate column within the combined financial statements.
The following fund categories and affiliated organiza-tions are included:
I. Current Funds - These funds are used to account for resources that will be expended in the near future for operating purposes. Included in the current fund cat-egory are unrestricted funds that the governing boards retain full control of, in achieving the institutions' purposes and restricted funds that may be utilized only in accordance with external restrictions.
Hospital Funds - These funds account for the revenues and expenditures relating to the operations of the University hospital and dental clinics.
Endowment Funds - These funds account for gifts that are restricted as to principal by the donor.
Loan Funds - These funds are used to account for loans to students and for resources available for such purposes.
45

Fund Type
FASB Statements
Issued on or Prior to 11/30/89
FASB Statements
Issued to Date
Proprietary Funds
Nonexpendable Trust Funds
Pension Trust Funds
Component Units: Conn. Development Authority Conn. Housing Finance
Authority Conn. Resources Recovery
Authority Conn. Higher Education
Supplemental Loan Authority
Conn. Health & Educational Facilities Authority
Conn. Innovations, Inc.
STATE OF CONNECTICUT Notes to the Financial Statements
Plant Funds - These funds account for resources that have been or will be used for institutional property acquisition, renewal and replacement, and resources accumulated for the retirement of debt associated with institutional properties.
Agency Funds - These funds account for funds held by an institution as custodian or fiscal agent for others such as student organizations, individual students, or faculty members.
Affiliated Organization - This column accounts for the financial activities of the University of Connecticut Foundation, Inc., a component unit of the University of Connecticut.
Component Units The component units include proprietary type organi-zations that are legally separate from the State but are considered part of the reporting entity.
d. Basis of Accounting The accounting and financial reporting treatment ap-plied to a fund is determined by its measurement focus and basis of accounting, which are described as fol lows:
Governmental Funds and Expendable Trust Funds These funds are accounted for using a current financial resources measurement focus and a modified accrual basis of accounting. Under the current financial re-sources measurement focus, only current assets and liabilities are normally included on the balance sheet. Fund balance represents a measure of "available spend-able resources". Under the modified accrual basis of accounting, revenues are recorded when they are sus-ceptible to accrual (i.e. both measurable and available). The word "available" means that the revenue is collect-ible within the current period or soon enough thereafter to pay current period liabilities. Expenditures are recorded when the related fund liability is incurred except for principal and interest on general long-term debt which are recorded as expenditures when due. Major revenue sources that are treated as susceptible to accrual include sales and use taxes, personal income taxes, public service corporation taxes, petroleum corn-
pany taxes, and gasoline and special fuel taxes. Rev-enues from federal grants are recorded when the related expenditure has been incurred.
Proprietary Funds, Nonexpendable Trust Funds, Pension Trust Funds, and Component Units These funds are accounted for using a flow of eco-nomic resources measurement focus and an accrual basis of accounting. Under the flow of economic resources measurement focus all assets and liabilities are included on the balance sheet. Fund equity (pro-prietary funds and component units) is segregated into contributed capital and retained earnings components. Under the accrual basis of accounting, revenues are recorded when earned and expenses are recorded when incurred.
For accounting and financial reporting purposes, these funds comply with all applicable GASB pronounce-ments and all applicable pronouncements issued by the Financial Accounting Standards Board (FASB) and its predecessors as follows (provided those pronounce-ments do not conflict with or contradict GASB pro-nouncements).
46

STATE OF CONNECTICUT Notes to the Financial Statements
Agency Funds These funds are accounted for using a modified accrual basis of accounting. Agency funds are custodial in nature (assets equal liabilities) and do not measure nor report results of operations.
Higher Education and University Hospital Funds These funds are accounted for using a current financial resources measurement focus and an accrual basis of accounting with the following exceptions:
All assets and liabilities are included on the balance sheet.
Depreciation expense related to plant fund assets is not recorded.
Revenues and expenditures of an academic term covering more than one fiscal year are reported in the fiscal year in which the program is predomi-nately conducted.
e. Budgeting Process By statute, the Governor must submit the state budget to the General Assembly in February of each year. Prior to June 30, the General Assembly enacts the budget through the passage of appropriation acts for the next fiscal year and sets forth revenue estimates for the same period for the following funds: the General Fund, the Transportation Fund, the Mashantucket Pequot Fund, the Workers' Compensation Administra-tion Fund, the Banking Fund, the Consumer Counsel and Public Utility Control Fund, the Insurance Fund, the Criminal Injuries Fund, the Soldiers, Sailors, and Marines Fund and the Regional Market Operations Fund. Under the State Constitution, the Governor has the power to veto any part of the itemized appropria-tions bill and to accept the remainder of the bill. However, the General Assembly may separately re-consider and repass the disapproved items by a two-thirds majority vote of both the Senate and the House.
Budgetary control is maintained at the individual ap-propriation account level by agency as established in authorized appropriation bills and is reported in the Annual Report of the State Comptroller. A separate
document is necessary because the level of legal con-trol is more detailed than reflected in the CAFR. Before an agency can utilize funds appropriated for a particular purpose, such funds must be allotted for the specific purposes by the Governor and encumbered by the Comptroller upon request by the agency. Such funds can then be expended by the Treasurer only upon a warrant, draft or order of the Comptroller drawn at the request of the responsible agency. Expenditure control over special revenue, enterprise, and internal service funds that are not budgeted as part of the annual appropriation act is maintained by the allotment pro-cess.
The Governor has the power under Connecticut statute to modify budgetary allotment requests for the admini-stration, operation and maintenance of a budgeted agency. However, the modification cannot exceed 3% of the fund or 5% of the appropriation amount. Modi-fications beyond those limits, but not in excess of 5% of the total funds, require the approval of the Finance Advisory Committee. The Finance Advisory Commit-tee is comprised of the Governor, the Lieutenant Gov-ernor, the Treasurer, the Comptroller, two senate mem-bers, not of the same political party, and three house members, not more than two of the same political party. Additional reductions of appropriations of more than 5% of the total appropriated fund can be made only with the approval of the General Assembly.
All funds except fiduciary funds use encumbrance accounting. Using this method of accounting, pur-chase orders, contracts, and other commitments for the expenditures of the fund are recorded in order to reserve that portion of the applicable appropriation. All encumbrances lapse at year-end and, generally, all appropriations lapse at year-end except for certain continuing appropriations (continuing appropriations are defined as carry forwards of spending authority from one fiscal budget into a subsequent budget). The continuing appropriations include: appropriations con-tinued for a one-month period after year-end which are part of a program that was not renewed the succeeding year; appropriations continued the entire succeeding year, as in the case of highway and other capital construction projects; and appropriations continued
47

STATE OF CONNECTICUT Notes to the Financial Statements
for specified amounts for certain special programs. Carried-forward appropriations are reported as reser-vations of the fund balance in the financial statements.
The budget is prepared on a "modified cash" basis of accounting under which revenues are recognized when received except, in the General and Transportation Funds, for certain taxes and Federal and other re-stricted grant revenues which are recognized when earned. Tax revenues recognized when earned include the following: sales and use, personal income, corpo-ration, public service corporations, petroleum compa-nies, cigarettes, alcoholic beverages, gasoline, special motor fuel, and motor carrier road. Under the modified cash basis, expenditures are recognized when paid. A comparison of actual results of operations recorded on this basis and the adopted budget is presented in the financial statements for all governmental funds for which a budget is legally adopted. During the 1996 fiscal year, the original adopted budget was adjusted by several supplementary appropriations authorized by the General Assembly and the Finance Advisory Com-mittee.
f. Budgetary vs GAAP Basis of Accounting The major differences between the budgetary (legal) and the GAAP (generally accepted accounting prin-ciples) basis of accounting are as follows:
Revenues are recorded when received in cash except for certain year-end tax accruals (budgetary basis) as opposed to revenues being recorded when they are susceptible to accrual (GAAP basis) (see Note 1d).
Expenditures are recorded when paid in cash (bud-getary basis) as opposed to expenditures being re-corded when the related fund liability is incurred (GAAP basis) (see Note 1d).
For budgetary reporting purposes, continuing ap-propriations are included with expenditures to deter-mine the budgetary surplus or deficit because they are considered uses of spending authority for the fiscal year. But under the GAAP basis, continuing appro-priations are not included as expenditures.
Certain special revenue funds are not subject to legal budgets.
Because of the above differences, a reconciliation be-tween the budgetary and GAAP basis is presented in Note 2.
g. Assets and Liabilities Cash and Cash Equivalents In addition to petty cash and bank accounts, this ac-count includes cash equivalents - short-term, highly liquid investments with original maturities of three months or less when purchased. Cash equivalents include investments in the short-term investment fund (see Note 4), the tax exempt proceeds fund (a money market fund) and repurchase agreements. Cash equiva-lents are carried at cost.
Investments Equity in combined investment funds is carried at market value (see Notes 4 and 18).
Other investments are carried at cost or amortized cost, except for investments in the following funds which are carried at market value: Deferred Compensation Fund, an agency fund; the University of Connecticut Foundation, Incorporated, an affiliated organization of the higher education and university hospital funds; and the Connecticut Innovations, Inc., the Connecticut Development Authority, and the Connecticut Health and Educational Facilities Authority (restricted invest-ments only), component units.
The State invests in derivatives. These investments are held by the short-term investment fund and the com-bined investment funds (see Note 4).
Inventories Inventories are valued at cost. Cost is determined by the first-in first-out (FIFO) method. Inventories in the governmental funds consist of expendable supplies held for consumption whose cost was recorded as an expenditure at the time the individual inventory items were purchased. Reported inventories in these funds are offset by a fund balance reserve to indicate that they are unavailable for appropriation.
48

STATE OF CONNECTICUT Notes to the Financial Statements
Fixed Assets and Depreciation General fixed assets are recorded at historical or esti-mated historical cost. Donated fixed assets are valued at estimated fair value on the date donated. Interest costs incurred during construction and infrastructure fixed assets (highways, bridges, etc.) are not capital-ized. No depreciation is provided for general fixed assets.
Fixed assets in the enterprise and internal service funds are carried at cost. Interest costs incurred during construction at Bradley International Airport are capi-talized as part of the assets. Depreciation of the fixed assets is determined using the straight-line method and is based upon the assets' estimated useful lives.
Fixed assets in the higher education and university hospital funds are carried at cost. No depreciation is recorded in these funds.
Fixed assets of the component units are carried at cost. Depreciation of the fixed assets is determined using the straight-line method and is based upon the assets' estimated useful lives.
Other Assets In the General Fund, this account represents the cash value of undistributed food stamps at year end.
Deferred Revenues This liability account represents the following:
Cash received by the State before the State has a legal claim to it (e.g. grant monies received before the incurring of qualifying expenditures).
Revenues considered measurable but not available during the current period.
In subsequent periods, when the State has a legal claim to the cash received, or when the revenues become available, the liability for deferred revenues is removed from the balance sheet and revenue is recognized.
Capital Appreciation Bonds Capital appreciation (deep-discount) bonds issued by the State, unlike most bonds which pay interest semi-annually, do not pay interest until the maturity of the
bonds. An investor who purchases a capital apprecia-tion bond at its discounted price and holds it until maturity will receive an amount which equals the initial purchase price plus an amount which has ac-crued over the life of the bond on a semiannual com-pounding basis. The net value of the bonds are accreted (the discount reduced), based on this semiannual com-pounding, over the life of the bonds. This deep-discount debt is reported in the general long-term debt account group at its net or accreted value rather than at face value.
Other Long-term Obligations The portion of unfunded pension costs, workers' com-pensation claims, and accumulated compensated ab-sences that is expected to be liquidated with available expendable financial resources is reported as an expen-diture and a fund liability of the governmental and expendable trust funds that will pay it. The remaining portion that is not expected to be liquidated with available expendable financial resources is reported in the general long-term debt account group. In the proprietary funds, non-expendable and pension trust funds, higher education and university hospital funds, and component units such obligations are recorded as fund liabilities.
Vacation and sick policy is as follows. Employees hired on or before June 30, 1977, can accumulate up to a maximum of 120 vacation days. Employees hired after that date can accumulate up to a maximum of 60 days. Upon termination or death, the employee is entitled to be paid for the full amount of vacation days owed. No limit is placed on the number of sick days that an employee can accumulate. However, the em-ployee is entitled to payment for accumulated sick time only upon retirement, or after ten years of service upon death, for an amount equal to one-fourth of his accrued sick leave up to a maximum payment equivalent to sixty days.
h. Fund Equity Contributed Capital The amount of permanent fund capital in the enterprise funds, internal service funds, and component units which is contributed by governments and others.
49

Financial Statements Fund Types
Excess (deficiency) of revenues and other sources over expenditures and other uses (Budgetary basis)
Adjustments: Increases (decreases) in revenue accruals:
Governmental Receivables Other Receivables
(Increases) decreases in expenditure accruals:
Accounts Payable and Other Liabilities Salaries and Fringe Benefits Payable
Increase (decrease) in Continuing Appropriations
Excess (deficiency) of revenues and other sources over expenditures and other uses (GAAP basis) - budgeted funds
To record excess of revenues and other sources over expenditures and other uses for nonbudgeted funds
Excess (deficiency) of revenues and other sources over expenditures and other uses (GAAP basis)
General Special Revenue
$ 249,967 $14,643
(22,412) (1,901) (27,030) 1,331
4,197 5,074 (17,797) (2,173)
15,474 147
202,399 17,121
(1,360)
$202,399 $15,761
STATE OF CONNECTICUT Notes to the Financial Statements
Reserved Retained Earnings The portion of retained earnings in the enterprise funds and component units which is legally restricted for specific future use.
Reserved Fund Balances The portion of fund balances in the governmental, fiduciary, and higher education and university hospital fund types which is legally reserved for a specific future use or which is not available for appropriation or expenditure.
I. Revenues, Expenditures, and Interfund Transactions
Taxes Certain tax revenues that accrue to the State are consid-ered "available" if the payer incurs the obligation to the State before year-end and payment is received within sixty days after year-end (see Note 6).
Licenses, Permits, and Fees These items are not susceptible to accrual and are recognized as revenues when the cash is collected.
Food Stamps Food stamps distributed to recipients during the year are recognized as revenue and expenditures in the General fund.
Interest Rate Swap Agreements The State has entered into interest rate swap agree-ments to modify interest rates on outstanding debt. Other than the net interest expenditures resulting from these agreements, no amounts are recorded in the financial statements (see Note 15).
Interfund Transactions Interfund transactions are recorded as follows:
Transfers which are from funds that are receiving revenues to funds in which the resources are to be expended are classified as operating transfers.
Transactions that would be treated as revenues, expenditures or expenses if they involved organi-zations external to the State are treated similarly by the funds of the State.
Reimbursements from one fund to another are treated as expenditures or expenses of the reim-
bursing fund and as a reduction of the expenditures or expenses of the reimbursed fund.
Non-recurring or non-routine transfers of equity between funds and contributions to the capital or proprietary funds are classified as equity transfers.
j. Total Columns on Combined Statements Total columns on the combined statements are captioned "Memorandum Only" to indicate that they are presented only to facilitate financial analysis. Data in these columns do not present the financial position, the results of operations or cash flow in conformity with generally accepted accounting principles nor is such data comparable to a consolidation.
Note 2 BUDGETARY BASIS VS. GAAP
The following is a reconciliation of the excess (defi-ciency) of revenues and other sources over expendi-tures and other uses as accounted between the budget-ary and GAAP basis of accounting:
50

STATE OF CONNECTICUT Notes to the Financial Statements
Note 3 FUND DEFICITS
The following funds have deficit balances at June 30, 1996, in either unreserved fund balances or unreserved retained earnings, none of which constitutes a viola-tion of statutory provisions.
General Fund $639,917
Special Revenue Consumer Counsel and
Public Utility Control
Enterprise Funds Bradley International Airport
Internal Service Funds Correction Industries
Component Units Connecticut Development
Authority (CDA) Connecticut Innovations,
Incorporated (CII)
$1,716
$14,456
$1,210
$10,441
$20,063
The General Fund and Consumer Counsel & Public Utility Control Fund deficits have been addressed by Public Act 93-402, subsequently modified by Public Act 95-178, which among other things, requires any GAAP deficits for budgeted funds existing as of June 30, 1997 to be amortized in fifteen equal increments beginning with the annual budget for fiscal year 1998-99.
While the unreserved retained earnings of Correction Industries, Bradley, CII, and CDA have a deficit bal-ance, the total fund equity of each fund is still positive.
Note 4 CASH DEPOSITS AND INVESTMENTS
In this note, the State's deposits and investments are classified in categories of "custodial credit risk". This is the risk that the State will not be able (a) to recover deposits if the depository bank fails or (b) to recover the value of investments or collateral securities that are in the custody of an outside party if the counterparty to the investment or deposit transaction fails. Classification in category 1 means that the exposure of deposits or investments to potential custodial credit risk is low. The level of potential custodial credit risk is higher for those deposits or investments classified in category 2, and highest for those in category 3.
Cash Deposits At June 30, 1996, the carrying amount of the State's deposits was $(151,376) for the Primary Government and $92,076 for the Component Units. The corre-sponding bank balance for such deposits was $36,537 for the Primary Government and $93,058 for the Com-ponent Units. Of the bank balance for the Primary Government, $3,956 was insured by the Federal De-posit Insurance Corporation (Category 1), $3,421was collateralized (Category 3), and $29,160 was unin-sured and uncollateralized (Category 3). Of the bank balance for the Component Units, $4,386 was insured by the Federal Deposit Insurance Corporation (Cat-egory 1), $2,041 was collateralized (Category 3), and $86,631 was uninsured and uncollateralized (Category 3).
Collateralized deposits are deposits protected by State statute. Under this statute, any bank holding public deposits must at all times maintain, segregated from its other assets, eligible collateral in an amount equal at least to a certain percentage (that is, 10,25, 100, or 120) of its public deposits. The applicable percentage is determined based on the bank's risk-based capital ratio -a measure of the bank's financial condition. The collateral is kept in the custody of the trust department of either the pledging bank or another bank in the name of the pledging bank.
51

STATE OF CONNECTICUT Notes to the Financial Statements
Investments According to State statutes, the State Treasurer is responsible for investing monies of State funds and agencies as well as monies of pension and other trust funds. All investments made by the State Treasurer adhere to strict guidelines on prudence, corporate gov-ernance, social responsibility and affirmative action. Investment guidelines are established by the State Treasurer with the advice of the Investment Advisory Council. Over the past years, the State Treasurer has created one short-term investment fund and eight com-bined investment funds (including one international investment fund).
The short-term investment fund is a money market investment pool which is available for investment to the State, municipal entities, and political subdivi-sions of the State. The State Treasurer is authorized to invest monies of the short-term investment fund in United States government and agency obligations, United States postal service obligations, certificates of deposit, commercial paper, corporate bonds, saving accounts, bankers' acceptances, repurchase agreements, reverse repurchase agreements, asset-backed securi-ties, and student loans. Investments in this fund are carried at amortized cost and are included in the investments schedule (primary government).
The combined investment funds are open-end, unit-ized portfolios which are available for investment to the State pension and other trust funds. The State Treasurer is also authorized to invest monies of the combined investment funds in common stock, com-mercial equity real estate, foreign companies stocks and bonds, commercial and residential mortgages, foreign governments obligations, mortgage-backed se- curities, and venture capital partnerships. There is a restriction that not more than 55% of the investments held by the pension and other trust funds can consist of common stock. Investments in these funds are carried at market value and are included in the investments schedule (primary government).
For financial reporting purposes, the short-term invest-ment fund and the combined investment funds are not
included in the combined financial statements. In-stead, each fund type's investment in these funds is reported as "cash equivalents" or as "equity in com-bined investment funds" in the combined balance sheet. Complete financial information about the short-term investment fund and the combined investment funds can be obtained from financial statements issued by the State Treasurer.
Certain State agencies and component units are also authorized to invest in investment contracts and state and municipal bonds.
The combined investment funds account for the pur-chase and sale of investments using "trade date" ac-counting. This means that investments are increased or decreased on the date the purchase or sales order is made although the investments are not received or delivered until a later date (settlement date). As of year end, investments under unsettled purchases are dis-closed as State investments but are not categorized under categories of custodial credit risk because the investments are still in the hands of the dealers. Invest-ments held by the State under unsettled sales are not disclosed as State investments. However, these invest-ments are disclosed separately because they are still subject to custodial credit risk that could result in losses prior to settlement.
The schedules on the following page disclose the carrying amount and market value of the State's invest-ments in total and by investment type as of June 30, 1996. Further, the carrying amount of these invest-ments is classified in three categories of custodial credit risk. Category 1 includes investments that are insured or registered or for which the securities are held by the State or its agent in the State's name. Category 2 includes uninsured and unregistered investments for which the securities are held by the counterparty' s trust department or agent in the State's name. Category 3 includes uninsured and unregistered investments for which the securities are held by the counterparty, or by its trust department or agent but not in the State's name.
52

STATE OF CONNECTICUT Notes to the Financial Statements
INVESTMENTS - PRIMARY GOVERNMENT Carrying Amount Market
Investment Type Category 1 Category 2 Total Value Common Stock $ 7,712,380 $ 29,084 $ 7,741,464 $ 7,742,286 U.S. Government & Agency Securities 1,438,142 1,438,142 1,441,052 Corporate Debt 2,365,113 2,365,113 2,364,971 Banker's Acceptances 190,544 190,544 192,058 Commercial Paper 362,346 28,163 390,509 390,378 Convertible Securities 196,908 196,908 196,908 Mortgage-Backed Securities 145,960 145,960 145,960 Preferred Stock 76,513 76,513 76,513 Repurchase Agreements 659,780 45,000 704,780 707,277 Bank Notes 183,896 183,896 183,616 Certificates of Deposit - Negotiables 388,848 388,848 388,751 Collateralized Investment Agreements 137,919 55,845 193,764 194,238 State and Municipal Obligations 308,074 308,074 281,829 Asset-Backed Securities 284,964 284,964 284,979 Cash Equivalents 60,706 60,706 60,706 Other 10,794 10,794 10,792
$14,522,887 $158,092 14,680,979 14,662,314
Investments not categorized because they are not evidenced by securities that exist in physical or book entry form:
Real Estate (Trusts, Limited Partnerships and Annuities) 768,122 768,122 Commercial Mortgages Trust Funds 124,943 124,943 Deferred Compensation Plan Mutual Investments 411,870 411,870 Limited Partnerships 441,888 441,888 Tax Exempt Proceeds Fund 138,544 138,544 Guaranteed Investment Contracts 267,488 267,488 Other 3,181 5,143
Investments held by broker-dealers under unsettled purchases (various securities) 514,934 514,934 Total Investments $17,351,949 $17,335,246
The pension trust funds own approximately 82 percent of the investments that are in category 1.
As of year-end, the State held securities with a market 1 of custodial credit risk if they were included in the value of $226,174 under unsettled sales. These investments schedule. securities would have been classified under Category
INVESTMENTS - COMPONENT UNITS Market Carrying Amount
Investment Type Category 1 Category 2 Category 3 Total Value U.S. Government & Agency Securities $ - $ 747,072 $ 23,284 $ 770,356 $ 764,084 Common Stock 11,821 11,821 11,821 Repurchase Agreements 243,419 243,419 243,419 Collateralized Investment Agreements 14,270 14,270 14,270 Product Development and Marketing Investments 12,633 12,633 12,633 Other 1.626 14,365 660 16,651 16,651
26,080 1,004,856 38,214 1,069,150 1,062,878
Investments not categorized because they are not evidenced by securities that exist in physical or book entry form:
Guaranteed Investment Contracts 266,023 266,055 Fidelity Funds 48,903 48,903 Open Mutual Funds 57,257 57,257 Other 4.077 4.077
Total Investments $1,445,410 $1,439,170
CHFA owns 84% of the investments that are in Category 2.
53

STATE OF CONNECTICUT Notes to the Financial Statements
Derivatives GASB Technical Bulletin Number 94-1 defines de-rivatives as contracts whose value depends on, or derives from, the value of an underlying asset, refer-ence rate, or index. According to this definition, the following State's investments or contracts are consid-ered to be derivatives:
Short-term investment fund - Adjustable rate as-set-backed, corporate, Federal agency, and for-eign government securities whose interest rates vary directly with short-term money market indi-ces and are reset daily, monthly, quarterly, and semi-annually.
Combined investment funds - Collateralized mort-gage obligations (CMOs), interest-only strips, common stock, and foreign exchange contracts (collateralized mortgage obligations are disclosed as mortgage-backed securities on the investments schedule).
The State invests in derivatives in order to increase earnings on investments or to hedge against fluctua-tions in the value of foreign currencies (as in the case of foreign exchange contracts).
CMO's are bonds which are issued by a special pur-pose trust and which are collateralized by an underly-ing pool of mortgage loans. The bonds pay interest at fixed or variable rates and have stated maturity dates. Interest payments on the bonds are made in accor-dance with the trust indentures and amounts received from borrowers in excess of interest payments and expenses are used to amortize the principal on the bonds in order of their stated maturity. Because mortgage prepayments are largely dependent on mar-ket interest rates, the ultimate maturity of the bonds is unpredictable and is sensitive to changes in interest rates, but is generally prior to the stated maturity date. As of June 30, 1996 the State held CMOs valued at $114.7 million.
Interest-only strips are a specialized type of CMOs. The cash flow on these investments is derived from the interest payments on the underlying mortgages. There-fore, these investments are very sensitive to changes in interest rates, which may encourage or discourage the prepayment of the underlying mortgages. For example, if interest rates decline, the underlying mortgages will be prepaid, thereby, reducing the cash flows from inter-est payments, and the value of these investments will decline. Because of the volatility of these investments, the State sold its remaining holding of these invest-ments during the year.
The common stock represents an investment in an underlying derivative consisting of a subordinated "residual interest" in a securitized portfolio of commer-cial mortgage loans (the CM0 residual). These loans were sold by the State to the corporate issuer who, in turn, issued bonds collateralized by the loans. The residual interest represents the difference between the principal of the underlying mortgage loans and the outstanding principal of the bonds. The underlying loans pay a fixed interest rate while the bonds pay a variable interest rate. The State is subject to the market risk that if the interest rate on the bonds increases, more of the cash flows generated by the loans will go to the bondholders, thereby, reducing the amount available to the State, and the value of the investment will decline. At June 30, 1996, the CM0 residual had an estimated fair value value of $86.6 million, and the weighted average yield on the underlying loans was 10.75% while the variable rate on the bonds was 5.47%.
Foreign exchange contracts are used to facilitate trans-actions in foreign securities and to manage the funds' currency exposure. Contracts to buy are used to ac-quire exposure to foreign currencies, while contracts to sell are used to hedge the funds' investments against currency fluctuations. Losses may arise from changes in the value of foreign currencies or failure of the counterparties to perform under the contracts' terms.
54

by assets acquired from the proceeds of the related loans. These receivables have original terms of 1 to 25 years and earn interest at rates ranging from 1% to 12.00%. As of June 30, 1996, loans in the amount of $67,761 (including loans of $9,999 made by other lending institutions) were insured by an insurance fund created by the Authority and by the faith and credit pledged by the State. This insurance fund had net assets of $7,936 at year end. Thus, the State is contingently liable in the event of any de-faulted loans that could not be paid out of the assets of the insurance fund.
Note 6 TAXES RECEIVABLE
Taxes receivable consisted of the following as of June 30, 1996:
Funds Special
Revenue General
Sales and use $369,034 Income Taxes 57,138 Public Service Corporations 36,700 Hospital Gross Receipts 52,401 Gasoline and Special Fuel 44,624 Various Other 36,027
Taxes Receivable $551,300 $44,624
STATE OF CONNECTICUT Notes to the Financial Statements
'Note 5 LOANS RECEIVABLE
Loans receivable for the primary government and its component units, as of June 30, 1996, consisted of the following:
Primary Government
Special Revenue Enterprise
Trust and Agency
Higher Education and
University Hospital Total Component
Units
Mortgage $ $ $ $ - $2,261,776 Industrial - 183,337 Housing 211,596 92,992 - 304,588 Clean Water - - 346,968 346,968 Student - 24,278 24,278 Other 179,603 98 6,147 185,848 81,428 Less:
Allowance for Losses - 2,386 1,120 3,506 8,951
Loans Receivable Net $391,199 $90,606 $347,066 $29,305 $858,176 $2,517,590
The mortgage loan program consists of home, multi-family and construction loan mortgages made by the Connecticut Housing Finance Authority. Most loans are insured by the Federal Housing Administration or by private mortgage insurance companies. In addi-tion, home mortgage loans are guaranteed up to certain amounts by the Veterans Administration. Permanent loans earn interest at rates ranging from 0% to 13.5% and have initial terms of 10 to 40 years. Construction loans earn interest at rates ranging from 0% to 10.75%. Upon completion of each develop-ment, the related permanent mortgage loan, which will generally be provided by the Authority, will be payable over 30 to 40 years at annual interest rates ranging from 0% to 10.25%.
The Clean Water fund loans funds to qualified municipalities for planning, design, and construction of water quality projects. These loans are payable over a 20 year period at an annual interest rate of 2% and are secured by the full faith and credit or revenue pledges of the municipalities, or both.
The industrial loan program consists of loans made by the Connecticut Development Authority to fi-nance the purchase of land, buildings, and equipment by qualified applicants and to finance other economic development programs of the Authority. These loans and installment contracts receivable are collateralized
55

Primary Government
Enterprise Internal Service
Higher Education
and University Hospital
Component Total
Land $ 2,657 $ $ 39,059 $ 41,716 $ 21,937 Buildings 70,562 1,015,145 1,085,707 169,425 Improvements Other Than Buildings 114,246 107 81,689 196,042 85
Machinery and Equipment 8,270 119,477 522,702 650,449 179,199
Construction in Progress 1,439 34,954 36,393 527
Subtotal 197,174 119,584 1,693,549 2,010,307 371,173 Less: Accumulated Depreciation 59.623 72,391 132.014 109,929
Total $137,551 $ 47,193 $1,693,549 $1,878,293 $261,244
STATE OF CONNECTICUT Notes to the Financial Statements
!Note 7 RESTRICTED ASSETS
Restricted assets are defined as resources which are restricted by legal or contractual requirements. As of June 30, 1996, restricted assets for the primary government and its component units were comprised of the following:
Primary Government Component Units Trust and Connecticut Connecticut Connecticut
Enterprise Agency Housing Connecticut Higher Health & Bradley Clean Finance Resources Education Educational
Debt Int'l Water Authority Recovery Supplemental Facilities Service Airport Fund Total (12-31-95) Authority Loan Authority Authority Total
Cash and Cash Equivalents $ 63,996 $38,851 $ - $ 102,847 $ $ 79,122 $ - $ 52,945 $ 132,067
Investments 391,744 9,682 307,978 709,404 309,516 23,354 6,061 437,454 776,385 Interest
Receivable 336 336 3,857 1,096 3,476 8,429 Mortgage & Lease
Receivable 2,092,112 2,092,112 Other 3 3
Total $455,740 $48,872 $307,978 $812,590 $313,373 $103,572 $6,061 $2,585,987 $3,008,993
Note 8 PROPERTY, PLANT, AND EQUIPMENT
(1) A summary of changes in general fixed assets is as follows:
Balance Additions Retirements
Balance 6/30/96
Land $ 326,707 $ 6,910 $ 9,170 $ 324,447 Buildings 1,753,888 170,254 74,668 1,849,474 Improvements
Other Than Buildings 179,512 22,488 164 201,836
Machinery and Equipment 924,827 76,109 60,078 940,858
Construction in Progress 397,048 118,139 329,031 186,156
Total $3,581,982 $393,900 $473,111 $3,502,771
(2) Property, plant, and equipment for the primary government and its component units consisted of the following as of June 30, 1996:
56

STATE OF CONNECTICUT Notes to the Financial Statements In proprietary and component units funds, the fol-lowing estimated useful lives are used to compute depreciation: Buildings 10-40 years; Land Im-provements 20-50 years; Machinery and Equip-ment 2-21 years.
Note 9 RETIREMENT SYSTEMS
The State of Connecticut sponsors five defined ben-efit public employee retirement systems (PERS) and one defined contribution pension plan. In addition, the State is the administrator and custodian of the assets for the Connecticut Municipal Employees' Retirement System and the Connecticut Probate Judges' and Employees' Retirement System as de-scribed in Note 10. The State's responsibility with respect to these systems is purely administrative and custodial in nature and no financial liability lies with the State. Therefore, limited GAAP pension disclo-sures have been disclosed for these two systems. The defined benefit pension plans are included in the State's financial statements as pension trust funds while the defined contribution pension plan is not included in the financial statements as it is not considered to be part of the State's reporting entity.
Plan Descriptions State Employees' Retirement System (SERS) is the administrator of a single-employer defined benefit PERS established in 1939 and governed by Sections 5-152 to 5-192 of the General Stat-utes. Substantially all of the State's full time employees who are not eligible for another State sponsored plan are covered by the SERS. Em-ployees are covered under two tiers: a) Tier I covers participants hired prior to January 1, 1984; b) Tier II covers employees hired on or after January 1, 1984, plus employees hired between July 1, 1982 and January 1, 1984, who elected Tier II. The SERS provides retirement benefits as well as death and disability benefits. Tier I participants who retire at or after age 55 with 25 years of credited service or who retire at
or after age 60 with 10 years of credited service or who retire at age 70 are entitled to an annual retirement benefit equal to 2% of their final average earnings for each year of credited service, reduced for retirement prior to age 65 with less than 25 years of credited service. Final average earnings represent average annual salary received during three years of highest salary. Participants may choose early retirement at or after age 55 and the completion of 10 years of credited service and receive a reduced retirement benefit. Retirement benefits vest 100% at 10 years of credited service. Tier II participants who retire at or after age 62 with 10 years of credited service or who retire at age 60 with 25 years of service or at age 70 with 5 years of credited service or hazardous duty members who retire after 20 years of credited service are entitled to an annual retirement benefit equal to 1 and 1/3% of their final average earnings plus 1/2% of final average earnings in excess of the year's breakpoint, for each year of credited service. Haz-ardous duty members are entitled to an annual retirement benefit equal to 2 and 1/2% of their final average earnings up to 20 years of service plus 2% of final average earnings times years of service in excess of 20 years, for each year of credited service. Participants may choose early retirement at or after age 55 and the completion of 10 years of credited service and receive a reduced benefit. Retirement benefits vest 100% at 10 years of credited service or at 5 years of credited service if age 70. Tier I participants are required to contribute (depending on plan) either 2% of earn-ings up to the social security taxable wage base and 5% above that level or 5% of earnings to the SERS. Tier II participants are not required to make contri-butions to the SERS. The State funds the balance of the liability for benefits with annual contribu-tions determined in accordance with statutes. The payroll for employees covered by the SERS for the year ended June 30, 1996, was $2,272.5 million while the State's total payroll was $2,524.3 mil-lion.
57

STATE OF CONNECTICUT Notes to the Financial Statements
Teachers' Retirement System (TRS) is the ad-ministrator of a single-employer defined benefit PERS, with the State acting as a nonemployer contributor, established in 1917 and governed by Sections 10-183b to 10-183mm of the General Statutes. Any teacher, principal, superintendent or supervisor engaged in service of public schools in Connecticut is covered by the TRS, as are professional employees of State schools of higher education if they choose to be covered. The TRS provides retirement benefits as well as death and disability benefits. Participants who retire on or after age 60 with 20 years of credited service in Connecticut or who retire before age 60 with 35 years of credited service (including at least 25 years of service in Connecticut) are entitled to an annual retirement benefit equal to 2% of their average annual salary, for each year of credited service (maximum percent is 75%) plus any additional amounts derived from 6% and voluntary contributions by the teacher. Average annual salary represents average annual salary received during three years of highest salary.
Participants may choose early retirement at any age after the completion of 25 years of credited service (including 20 years of service in Con-necticut) or at or after age 55 and the completion of20 years of credited service (including 15 years of service in Connecticut with the last 5 years in Connecticut) and receive a reduced retirement benefit. Retirement benefits vest 100% at 10 years of credited service. Participants are re-quired to contribute 7% of their annual salary to the TRS. Contributions are refunded to partici-pants who leave the TRS based on years of credited service as follows: a) with less than 5 years of credited service, 5% contributions with interest and b) with 5 or more years of credited service, 5% contributions with interest and 1% contributions without interest. The State funds the balance of the liability for benefits with an-nual contributions determined in accordance with
statutes. The payroll for employees covered by the TRS for the year ended June 30, 1996, was $2,152.2 million. The total employer's current-year payroll would represent the total payroll of all 169 towns and cities plus 19 regional school districts in Con-necticut and this information is not available.
Judicial Retirement System (JRS) is the adminis-trator of a single-employer defined benefit PERS established in 1981 and governed by Sections 51-49 to 51-51 of the General Statutes. Any appointed judge or compensation commissioner in the State is covered by the JRS. The JRS provides retirement benefits as well as death and disability benefits. Participants who retire at or after age 65 with 10 years of credited service or who retire before age 65 with 20 years of credited service are entitled to an annual retirement benefit equal to 66.67% of final compensation. Final compensation is the participant's basic salary plus longevity payments based on years of service. Participants who retire at or after age 65 with less than 10 years of credited service receive a reduced retirement benefit. Man-datory retirement is at age 70. Retirement benefits vest at 10 years of credited service as follows: a) participants hired before 1981 - 50% of the retire-ment benefit at 10 years increasing to 100% after 15 years; b) participants hired after 1980- 100% of the retirement benefit multiplied by a ratio of service at termination to service at the earliest retirement age. Participants are required to contribute 5% of their annual compensation to the JRS. If a participant withdraws from the JRS prior to reaching benefit eligibility, contributions without interest are refunded. The State funds the balance of the liability for benefits with annual contributions determined in accordance with statutes. The payroll for employees covered by the JRS for the year ended June 30, 1996, was $19.0 million, while the State's total payroll was $2,524.3 million.
58

STATE OF CONNECTICUT Notes to the Financial Statements
The following table summarizes membership by plans:
SERS 7/1/95
TRS 7/1/95
JRS 10/1/95 Total
Retirees and beneficiaries currently receiving benefits and terminated employees entitled to benefits but not yet receiving them 28,236 19,759 177 48,172
Active plan participants: Vested 26,139 29,102 73 55,314 Nonvested 29,834 11,586 119 41,539
Total 55,973 40,688 192 96,853
Funding Status and Progress The amounts shown as "pension benefit obligation" is a standardized disclosure measure of the present value of pension benefits, adjusted for the effects of proj ected salary increases and step-rate benefits, estimated to be payable in the future as a result of employees service to date. This measure is the actuarial present value of credited projected benefits and is intended to help users assess the State's PERS funding status on a going-concern basis, assess progress made in accumulating sufficient assets to pay benefits when due, and make comparisons among PERS. The measure is independ-ent of the actuarial cost methods used to determine contributions to the PERS.
The pension benefit obligations were computed as part of the actuarial valuations performed as of July 1, 1995 for SERS and TRS, and as of October 1, 1995, for JRS. Significant actuarial assumptions used in the valua-tion include (a) rates of return on investment of present and future assets of 8.5% per year, (b) projected salary increases of 5.5% per year to 8.0% per year, (c) cost of living increases of 3% per year to 5.5% per year.
59

STATE OF CONNECTICUT Notes to the Financial Statements
The total unfunded pension benefit obligation (PBO) applicable to each retirement system is as follows: (amounts expressed in millions)
SERS ''
TRS 7/1/95
JRS 10/1/95 Total
Pension benefit obligation: Retirees and beneficiaries currently receiving benefits and terminated employees not yet receiving benefits $4,299.6 $3,817.5 $ 96.2 $ 8 ,213.3
Current employees - Accumulated employee contributions including allocated investment income 363.7 1,900.1 6.5 2,270.3
Employer - financed Vested 2,701.1 1,772.3 37.2 4,510.6 Non-vested 473.8 - 14.8 488.6
Total pension benefit obligation 7,838.2 7,489.9 154.7 15,482.8
Net assets available for benefits, at cost 4,118.7 5,931.6 66.9 10,117.2
Unfunded pension benefit obligation $3,719.5 $1,558.3 $ 87.8 $ 5,365.6
Net assets available for benefits, at market $4,624.7 $6,645.1 $ 73.3 $11,343.1
Public Act 92-205 significantly changed certain provi-sions of TRS. Teachers who retire on or after Septem-ber 1, 1992 will no longer be guaranteed a cost of living adjustment of between 3% and 5%. Cost of living adjustments for such teachers will be paid from an excess earnings account and will depend on the rate of investment return for the TRS and on the balance available in the account. Secondly, effective July 1, 1992, the rate of teacher's contributions increased from 6% to 7% of annual salary. These provisions had the effect of reducing the unfunded actuarial accrued li-ability by almost $1.4 billion dollars. No other changes in actuarial assumptions or benefit pensions that would significantly effect the valuation of the PBO occurred during 1992, 1993, 1994, and 1995.
Contributions Required and Contributions Made The PERS funding policies have been established by statutes. These statutes require that annual contribu-tions, determined on an actuarial basis, be made into the PERS in order to fund the normal cost and the amortization of the unfunded actuarial accrued liabil-ity. They also require employee contributions based
on fixed percentages ranging from 2% to 7% applied to an employee's annual compensation. The required annual contributions are determined by using the fol-lowing actuarial funding methods: a) projected unit credit - used by the SERS and the JRS and b) entry age - used by the TRS. The unfunded actuarial accrued liability is being amortized over a 40 year period by all three PERS.
The actuarial computation of the pension contribution requirements for the JRS for 1996 was the same as the actual contribution. The actuarial computation of the pension contribution requirements for the SERS, in-cluding Federal reimbursements, was $501.1 million, however, a collectively negotiated agreement (SEBAC III) reduced the actual contributions by $166 million. The actuarial computation of the full pension contribu-tion requirement for the TRS for 1996 was $164.7 million; however, only $140 million was actually contributed reflecting a reduction of $24.7 million by the legislature to the State's TRS appropriation.
60

SERS n JRS
1996 52.5% 79.2% 43.2% 1995 54.8% 77.5% 37.5% 1994 51.4% 70.7% 36.5%
1996 163.7% 72.4% 462.1% 1995 153.7% 83.0% 500.0% 1994 162.8% 109.3% 495.6%
1996 11.2% 6.5% 48.4% 1995 9.6% 6.5% 48.6% 1994 11.6% 6.4% 45.9%
Net assets available for benefits as a percentage of the pension benefit ob-ligation applicable to the State's employees
Unfunded pension benefit obligation as a percentage of annual covered payroll
State's contributions to the pension plan as a percentage of annual covered payroll
STATE OF CONNECTICUT Notes to the Financial Statements
Contributions actually made and actuarial contribution requirements applicable to each PERS were as follows:
Contributions Made:
SERS IRS JRS Total (in millions)
By Employees $35.9 $162.7 $1.0 $199.6 % of Covered Payroll 1.6% 7.6% 5.3% By State $254.4 $140.0 $9.2 $403.6 % of Covered Payroll 11.2% 6.5% 48.4% Federal and Other Re-imbursements $80.7 $80.7
% of Covered Payroll 3.6%
Contributions Required: Normal Cost $196.7 $53.5 $ 5.2 $255.4 % of Covered Payroll 8.7% 2.5% 27.4% Amortization of Unfunded Liability $304.4 $111.2 $4.0 $419.6
% of Covered Payroll 13.4% 5.2% 21.0%
Significant actuarial assumptions used to compute contribution requirements were the same as those used to compute the pension benefit obligation.
Trend Information Historical trend information is presented in order for a reader to assess the progress made in accumulating sufficient assets to pay pension benefits as they be-come payable.
percentages of annual covered payroll. Showing unfunded pension benefit obligation as a percent-age of annual covered payroll approximately ad-justs for the effects of inflation for analytical pur-poses.
Employer contributions expressed as percentages of annual covered payroll (contributions were made in accordance with actuarial requirements only for the JRS during the years 1994, 1995, and 1996).
The following table presents the required three-year trend information:
' Analysis of fund progress and ten-year historical trend information is disclosed on pages 78-82 of the State's comprehensive annual financial report.
In accordance with GAAP, employers contributing to public employee retirement systems must present three-year historical trend information. This information consists of:
Net assets available for benefits, expressed as per-centages of the pension obligation applicable to the entity's erhployees. Analysis of this percentage over time indicates whether the retirement system is becoming financially stronger or weaker.
Unfunded pension benefit obligation, expressed as
Other The Connecticut Alternate Retirement Program (CARP) is a defined contribution plan for unclas-sified employees and is governed by Section 5-156 of the General Statutes. Unclassified employees at any of the units of the Connecticut State System of higher education are eligible under state law to participate. The State is the only nonemployee contributor to the pension plan. As of June 30, 1996, the pension plan's current membership con-sisted of 4,600 employees.
A defined contribution pension plan provides pen-sion benefits in return for services rendered, pro-vides an individual account for each participant, and specifies how contributions to the individual's
61

STATE OF CONNECTICUT Notes to the Financial Statements
account are to be determined instead of specifying the amount of benefits the individual is to receive. Under a defined contribution pension plan, the benefits a participant will receive depend solely on the amount contributed to the participant's ac-count, the returns earned on investments of those contributions, and forfeitures of other participants' benefits that may be allocated to such participant's account. Members' rights in the pension benefits provided under this program vest immediately. An employee that leaves State service is entitled to his or her contributions and the State's contributions. Each employee must contribute 5% of his or her gross earnings to the pension plan. The State is required to contribute an amount equal to 8% of the employees' gross earnings. The covered payroll for employees covered by CARP was $232.8 mil-lion while the State's total payroll was $2,524.3 million.
During the year the State's required and actual contributions amounted to $18.6 million, which was 8% of the current-year CARP covered payroll. Employees' required and actual contributions amounted to $11.6 million which was 5% of the current-year CARP covered payroll.
No pension provision changes occurred dur-ing the year that affected the required contri-butions to be made by the State or its employees.
CARP held no securities of the State or other related parties during the year or as of the close of the fiscal year.
State's Attorney and Public Defenders' Retirement Systems are single employer defined benefit PERS governed by Sections 51-287 and 51-295 respec-tively, of the General Statutes. The system covers certain state's attorneys and public defenders who contribute 5% of their salaries toward their retire-ment. Members of this system have a vested right to receive retirement benefits on a reduced actuar-ial basis after 10 years of service credit. Any state's attorney or public defender who has attained the
age of 65 and who has 10 or more years shall receive a retirement salary annually. Retirement salaries are based on (1) 1 and 1/2% of their annual salary, for those who have completed 10 or more but less than 15 years of service, (2) 3% of their annual salary for those who have completed 15 or more but less than 20 years of service, (3) 4 and 1/ 2% of their annual salary, for those who have completed 20 or more but less than 25 years of service, (4) 6% of their annual salary for those who have completed 25 or more years of service.
As of June 30, 1996, the State's Attorney Retire-ment System's membership stood at six active members, with thirteen retirees and five widow(ers) receiving benefits, while the Public Defenders' System had one active member, four retirees, and one widow(er) receiving benefits. Total combined assets of both plans stood at $590 thousand with $34 thousand being contributed by active employ-ees.
'Note 10 OTHER RETIREMENT SYSTEMS ADMINISTERED BY THE STATE
The State acts solely as the administrator and custodian of the assets of the following retirement systems. Although these retirement systems are included as pension trust funds, the State makes no contribution and has no financial liability other than a fiduciary responsibility.
Connecticut Municipal Employees' Retirement System (CMERS) The system, a cost-sharing multiple-employer PERS, provides a retirement system for fire and police person-nel as well as general government employees (except teachers) for any local government authority in the State of Connecticut, including towns, cities, bor-oughs, regional school districts, housing authorities or other special districts, which may elect to participate
62

STATE OF CONNECTICUT Notes to the Financial Statements
and is governed by Sections 7-425 to 7-451 of the Connecticut General Statutes. As of July 1,1995, there were 7,468 active members and 3,798 retired mem-bers. Municipalities may designate which depart-ments are to be covered under the CMERS and mem-bership is then mandatory for all regular full time employees of participating departments except for fire and police hired after age 55. The pension plan provides pension, death, and disability benefits. A member may retire after reaching the age of 55 and having 10 years of continuous service, 15 years of active aggregate service, or 25 years of aggregate service. The pension benefit for members not covered by Social Security is 2% of the employee's average final compensation times years of service, while for members covered by Social Security, it is 1 and 1/6% of the average of compensation not in excess of the Social Security taxable wage base for the ten highest paid years of service plus 2% of that portion of average final compensation in excess of that used previously, times years of service. Average final compensation is the average of the three highest paid years of service. The current-year covered payroll for all participants amounts to $237 million while the total payroll is unknown.
The entire cost is borne by the participating munici-palities and their employees through employee contri-butions of 2.25% to 5.0% of salary and contribution assessments on participating municipalities ranging from 7.0% to 10.75% of a participant's payroll.
Municipal contributions are redetermined based on annual actuarial studies in order to maintain the fund on a sound actuarial basis. Total contributions made during 1996 amounted to $32.3 million of which $23.9 million was made by the municipalities and $8.4 million by the employees.
The amounts shown as "pension benefit obligations" are standardized measurements that, with some excep-tions, must be used by a PERS. The standardized measurement is the actuarial present value of credited projected benefits. This pension valuation method reflects the present value of estimated pension benefits
that will be paid in future years as a result of employee services performed to date and is adjusted for the effects of projected salary increases and any step-rate benefits. The measure is independent of the actuarial funding method used to determine contributions to the systems.
Total unfunded pension benefit obligations of the CMERS as of July 1, 1995, is as follows: (amounts expressed in millions)
Total pension benefit obligation Net assets available for benefits, at cost
(market value $733.4) Unfunded pension benefit obligation
$644.4 564.3
$ 80.1
Historical trend information is presented on pages 78 and 82 in order for a reader to assess the progress made in accumulating sufficient assets to pay pension ben-efits as they become payable.
Connecticut Probate Judges and Employees' Retirement System This system provides retirement benefits to Probate Court Judges and employees. As of June 30, 1996, there were 357 active members with 176 retirees and fifteen widows(ers) receiving benefits.
The entire cost is borne by the Probate Courts and their employees through employee contributions of 1.0 to 3.75 percent of earnings and assessments on the vari-ous Probate Courts of the State which assessments are to be actuarially determined. Total contributions made by the members amounted to $229 thousand while the Probate Court system contributed its actuarially deter-mined amount of $349 thousand.
As of the latest actuarial valuation, December 31, 1995, the unfunded pension benefit obligation is zero using the Frozen Entry Age Cost Method.
63

STATE OF CONNECTICUT Notes to the Financial Statements
INote 11 DEFERRED COMPENSATION PLAN
The State of Connecticut offers its employees a deferred compensation plan created in accor-dance with Internal Revenue Code Section 457. The plan, available to all State employees in a permanent position, including elected and ap-pointed officials and members of the General Assem-bly, permits them to defer a portion of their salary until future years. The deferred compensation is not avail-able to employees until retirement, termination of employment, disability, unforeseeable emergency or death.
All amounts of compensation deferred under the plan, all property and rights purchased with those amounts and all income attributable to those amounts, property or rights are (until paid or made available to the employee or other beneficiary) solely the property and rights of the State (without being restricted to the provisions of benefits under the plan), subject only to the claims of the State's general creditors. Participants' rights under the plan are equal to those of general creditors of the State in an amount equal to the fair market value of the deferred account for each participant. At this time, the State believes that it is unlikely that it will use the assets of the plan to satisfy the claims of general creditors in the future.
Based on Article V of the State of Connecticut Deferred Compensation Plan, the State has no liability for losses under any employee selected plan. The State does have the duty of due care that would be required of an ordinary prudent investor.
!Note 12 POSTEMPLOYMENT BENEFITS
In addition to the pension benefits described in Note 9, the State provides postretirement health care and life insurance benefits, in accordance with State statutes, Sections 5-257(d) and 5-259(a), to all employees who retire from the State.
Currently 26,961 retirees meet those eligibility re-quirements. When employees retire, the State pays 100% of their health care insurance premium cost (including dependent's coverage). In addition, the State pays 100% of the premium cost for a portion of the employees' life insurance continued after retire-ment. The amount of life insurance, continued at no cost to the retiree, is determined based on the number of years of service that the retiree had with the State at time of retirement as follows: a) if the retiree had 25 years or more of service, the amount of insurance will be one-half of the amount of insurance for which the retiree was insured immediately prior to retirement, but the reduced amount cannot be less than $7,500; b) if the retiree had less than 25 years of service, the amount of insurance will be the proportionate amount that such years of service is to 25, rounded to the nearest $100. The State finances the cost of postretirement health care and life insurance benefits on a pay-as-you-go basis through an appropriation in the General Fund. During the year ended June 30, 1996, $85.9 million was paid in postretirement bene-fits.
'Note 13 CAPITAL AND OPERATING LEASES
State as Lessor The State leases building space, land, and equip-ment to private individuals. The minimum future lease revenues for the next five years and there-after are as follows:
1997 $ 16,826 1998 17,001 1999 17,122 2000 17,221 2001 17,321 Thereafter 31,039
Total $116,530
Contingent revenues for the year ended June 30, 1996, were $1,145.
State as Lessee Obligations under capital leases and operating leases as of June 30, 1996, were $84,845 for capital leases and
64

STATE OF CONNECTICUT Notes to the Financial Statements
$61,571 for noncancelable operating leases in excess of one year. The following is a schedule of annual future minimum payments under these obligations along with the present value of the related net mini-mum capital lease payments discounted at approxi-mately 6% as of June 30, 1996:
Operating Leases
Capital Leases General
Long-term 1997 $13,932 $10,208 1998 13,208 6,745 1999 11,044 5,723 2000 7,116 4,940 2001 4,420 4,186 Thereafter 11,851 53,043
Total future minimum payments $61,571 84,845 Less: Imputed interest 30,448 Present value of net minimum lease payments $54,397
Rental and lease payments for equipment charged to expenditures during the year ended June 30, 1996, totaled $40,318.
Note 14 CHANGES IN GENERAL LONG-TERM DEBT
The following is a summary of changes in long-term debt for the year ended June 30, 1996:
General Obliga- Jul,
Balance 1. 1995
Issuances and Other
Increases
Retirements and Other pes_rez_i_ses
Increase (Decrease) Accreted
Value Balance
June 30. 1996
tion Notes $ 315,710$ 236,055$ 315,710 $ - $ 236,055 General Obliga-
tion Bonds 5,524,747 873,380 455,056 56,525 5,999,596 Transportation
Related Bonds 2,991,319 485,630 277,280 1,407 3,201,076 Unemployment
Compensation Bonds 990,700 222,755 301,950 911,505
Unfunded Pen-sion Costs 5,206,748 761,625 484,273 - 5,484,100
Compensated Absences 257,184 15,480 11,048 261,616
Worker's Compensation 286,954 29,178 47,982 268,150
Capital Leases 55,551 4,950 6,104 54,397 Claims and
Judgements 25,115 21,963 25,115 21,963
Interfund Payables 22,687 - 22,687
Total General Long-Term Debt Account Group $15.676.715 $2.651.016 $L947.205 $57.932 $16.438.458
The Combined Statement of Revenues, Expenditures and Changes in Fund Balances - All Governmental Fund Types reflects the net proceeds from the sale of bonds and notes in the amount of $1,817.7 million. This amount includes discounts on the sale of certain bonds and accrued interest received at the time of sale in the amount of $9.9 million. Additionally, the $873.4 million of issuances and other increases for general obligation bonds includes $9.9 million of bonds issued by the Connecticut Development Au-thority (CDA) for which the State of Connecticut has agreed to pay the principal and interest.
Note 15 DEBT
Short-Term Debt Up to $739.4 million of general obligation temporary notes may be issued by the State with these notes having the full faith and credit of the state pledged for payment of principal and interest. As of June 30, 1996, no notes were outstanding. Additionally, revolving lines of credit have been secured from Dai-Ichi Kangyo Bank, Limited and The Industrial Bank of Japan, Limited in the amounts of $550.0 million and $203.9 million respectively. Of these amounts $539.4 million and $200.0 million may be advanced with respect to the payment of the above notes and $10.6 million and $3.9 million may be advanced with respect to the payment of up to 60 days interest on the notes. As of June 30, 1996, no amount was outstanding on the lines of credit.
Long-Term Debt Economic Recovery Notes In November 1995, $236.1 million of General Obliga-tion Economic Recovery notes were issued to refi-nance $240.7 million in notes which were due in 1995-1996.
The economic recovery notes outstanding at June 30 were $236.1 million. These notes mature on various dates through 1999 and bear interest rates from 4.25% to 5%.
65

Final Maturity
Purpose of Bonds Dates Interest Amount Authorized Rates Outstanding But Unissued
Public Transportation 1997-1999 5.0-6.7% $ 15,053 $ 668 Specific Highways 1997 4.90-5.25% 1,110 19,900 Infrastructure
Improvements 1996-2015 2.65-10.0% 3,112,032 422,437 General Obligation
Refunding 2004 5.15-9.75% 45,400 Other Transportation 1996-2010 4.218-9.25% 18,889 317
3,192,484 $443,322 Accretion-Various Capital Appreciation Bonds 8,592
Total $3 201 076
STATE OF CONNECTICUT Notes to the Financial Statements
The following is a description of the future amounts needed to pay principal and interest on economic recovery notes outstanding at June 30, 1996.
Year Ending June 30 Principal Interest Total
1997 $ 79,000 $ 10,471 $ 89,471 1998 79,000 6,768 85,768 1999 78,055 2,829 80,884
Total $236,055 $20,068 $256,123
General Obligation Bonds General obligation bonds are those bonds that are paid out of the revenues of the General fund and that are supported by the full faith and credit of the State. General obligation bonds outstanding and bonds au-thorized but unissued at June 30 were as follows:
Purpose of Bonds
Final Maturity Interest
Dates Rates Amount
Outstanding Authorized
But Unissued Capital Improvements 1997-2016 4.218-9.875% $1,808,393 $193,970 School Construction 1997-2012 4-9.75% 721,699 30,265 Municipal Redevelop-
ment 1996-2015 3.25-9.5% 1,486,713 479,516 Elderly Housing 1996-2011 7-7.4% 31,514 151 Elimination of Water
Pollution 1998-2018 4.40-7.525% 289,418 3,269 General Obligation
Refunding 1997-2012 2.40-7.35% 1,245,139 Miscellaneous 1997-2024 3.75-8.95% 49,909 48,746
5,632,785 $755,917 Accretion-Various Capital Appreciation Bonds 366,811
Total $5 999 596
Future amounts needed to pay principal and interest on general obligation bonds outstanding at June 30, 1996, were as follows:
Year Ending June 30 Principal Interest Total
1997 $ 455,651 $ 291,399 $ 747,050 1998 452,468 272,030 724,498 1999 442,509 265,899 708,408 2000 437,353 271,532 708,885 2001 422,870 236,581 659,451 Thereafter 3,421,934 1,876,325 5,298,259
Total $5,632,785 $3,213,766 $8,846,551
Transportation Related Bonds Transportation related bonds include special tax obli-gation bonds and general obligation bonds that are paid out of revenues pledged or earned in the Transporta-tion Fund. The revenue pledged or earned in the
Transportation Fund to pay special tax obligation bonds is transferred to the debt service fund for retirement of principal and interest.
Transportation related bonds outstanding and bonds authorized but unissued at June 30 were as follows:
Future amounts required to pay principal and interest on transportation related bonds outstanding at June 30 were as follows:
Year Ending June 30 Principal Interest Total
1997 $ 140,358 $ 173,430 $ 313,788 1998 160,045 165,496 325,541 1999 166,849 156,092 322,941 2000 175,754 150,654 326,408 2001 186,840 137,265 324,105 Thereafter 2,362,638 845,162 3,207,800
$3,192,484 $1,628,099 $4,820,583
Special Assessment Unemployment Compensation Advance Fund In July, August, and September of 1993, the State issued $1,020.7 million of Spcial Assessment Unem-ployment Compensation Advance Fund revenue bonds. The issuance of these special obligation revenue bonds was for the purpose of repaying loans made by the United States to Connecticut for payment of unem-ployment compensation benefits and assisting the State in meeting a portion of its unemployment compensa-tion benefit obligations until increased employer as-sessments are levied. These bonds mature on various dates through 2001 and bear interest rates from 3.1% to 4.6% and shall be payable solely from the Unemploy-
66

Type Face Interest Maturity
Value Rate Date
Transportation - STO's $219,600 variable 2010
Interest Rate Assumed by
age. 5.75%
$87,800 5.71%
Interest Rate Assumed by Counterparty
65% of! - month LIBOR* rate
65% of 1 - month LIBOR* rate
Sumitomo Bank
Counterparty Face Value AIG Corp. $131,800
STATE OF CONNECTICUT ' Notes to the Financial Statements
ment Compensation Advance Fund and revenues and requisitional funds specifically pledged for their payment.
The State has no contingent obligation either directly or indirectly with the payment of these bonds.
Future amounts needed to pay principal and interest on special assessment unemployment compensation bonds were as follows:
Year Ending June 30 Principal Interest Total
1997 $ 75,000 $ 39,461 $ 114,461 1998 95,000 36,183 131,183 1999 115,000 31,967 146,967 2000 143,270 26,846 170,116 2001 150,265 18,916 169,181 Thereafter 332,970 6,550 339,520
$911,505 $159,923 $1 071 428
Interest Rate Swap Agreements The State has entered into interest rate swap agreements for the following outstanding debt:
Based on these agreements, the State pays a fixed interest rate to the counterparty to the swap, and the counterparty pays the State a variable interest rate that is determined by the agreement. The State continues to make payments to the bondholders, and only the net difference in interest payments is exchanged with the counterparty. By entering into these agreements, the State has in effect exchanged its variable rate liability for a fixed rate obligation.
The agreements call for the following exchange of interest rates:
*The primary fixed income index reference rates used in the Euromarkets. Most international floating rates are quoted as LIBOR plus or minus spread.
Regarding these agreements, the State is exposed to the market risk relating to the relationship between the variable interest rate on the bonds (which is reset weekly) and the rate that it receives under the swap agreements (which is 65% of 1 - month LIBOR).
Both agreements are guaranteed by the counterparties, and the agreeement with AIG Corp. has a collateral agreement which goes into effect if the credit rating of AIG falls below a defined level.
Revenue Bonds Revenue bonds are those bonds that are paid out of resources pledged in the enterprise funds, nonexpend-able trust funds, higher education and university hos-pital funds, and component units. Revenue bonds outstanding at June 30 were as follows:
Maturity Interest Amounts Fund Type Dates Rates Outstanding
Primary Government: Enterprise:
Bradley International Airport 1996-2012 7.1-9.125% $ 90,540 Rental Housing 2000-2002 5.25-9.15% 123,630
Nonexpendable: Clean Water Fund 2009-2013 4.05-11.0% 388,420
Higher Education & University Hospitals: Investment in Plant 1997-2015 4.30-7.25% 98,654 Premium on Clean Water Fund
bonds sold 4,606 Total $ 705,850
Component Units: Conn. Development Authority 2002-2008 2.6-9.8% 142,260 Conn. Housing Finance
Authority (as of 12-31-94) 2027 2.0-11.0% 2,772,385 Conn. Resources Recovery
Authority 1996-2016 4.20-8.80% 367,634 Conn. Higher Education Supple-
mental Loan Authority 1996-2013 4.4-7.5% 74,100 Conn. Health & Educational
Facilities Authority 1996-2024 4.32-14.94% 2,163,450 Discount on CHFA bonds sold (26,903)
Total $5,492,926
Revenue bonds issued by the component units do not constitute a liability or debt of the State, and the State is only contingently liable for these bonds as discussed in this section.
67

STATE OF CONNECTICUT Notes to the Financial Statements The following is a description of revenue bonds with restrictive covenants:
Primary Government: Bradley International Airport's revenue bonds were issued in 1982 in the amount of $100,000 to finance costs of improvements to the airport. As of June 30, 1996, the following bonds were outstanding:
Airport revenue refunding bonds in the amount of $86,930. These bonds were issued in October, 1992, to redeem the 1982 revenue bonds, and are secured by and payable solely from the gross operating revenues generated by the State from the operations of the airport and other receipts, funds or monies pledged in the bond indenture. In accor-dance with this indenture, certain assets of this fund have been restricted for the payment of bond prin-cipal and interest, construction projects and other uses.
Airport subordinated refunding bonds in the amount of $3,610. These bonds were issued in 1989 to help pay for certain expenses (e.g. issuance costs, re-demption premium) incurred in the issuance of the 1992 refunding bonds.
In 1994, the State of Connecticut issued Clean Water Fund revenue bonds in the amount of $325,245. The proceeds of these bonds are to be used to provide funds to make loans to Connecticut municipalities for use in connection with the financing or refinancing of waste water treatment projects.
Component Units Connecticut Development Authority's revenue bonds are issued to finance such projects as the acquisition of land or the construction of buildings, and purchase and installation of machinery, equipment, and pollution control facilities. The Authority finances these projects through its Self-Sustaining Bond Program and Um-brella Program. Under the Umbrella Program, bonds outstanding at June 30, 1996, were $78,755. Also, assets totaling $82,693 are pledged under the terms of the bond resolution for the payment of principal and interest on these bonds until such time as it is deter-
mined that there are surplus funds as defined in the bond resolution. Bonds issued under the Self-Sustain-ing Bond Program are discussed in the no-commitment debt section. In addition, the Authority had $63,505 in general obligation bonds outstanding at year end. These bonds were issued to finance the lease of an entertain-ment/sports facility, the purchase of a hockey team, and the construction of a music amphitheatre.
Connecticut Housing Finance Authority's revenue bonds are issued to finance the purchase, devel-opment and construction of housing for low and moderate income families and persons through-out the State. According to the bond resolution, the following assets of the Authority are pledged for the payment of the bond principal and interest (1) the proceeds from the sale of bonds, (2) all mortgage repayments with respect to long-term mortgage and construction loans financed from the Authority's gen-eral fund, and (3) all monies and securities of the Authority's general and capital reserve funds. In addi-tion, all assets of the Authority's general and capital reserve funds ($3,013,488) are restricted until such time as they are determined to be "surplus funds". The bond resolution describes "surplus funds" as being the excess of pledged receipts over funds required for the payment of operating expenses, principal and interest and requirements of the capital reserve fund during the most recent twelve months as determined annually between November 12 and December 1 and designated as such by the Authority.
Connecticut Resources Recovery Authority's revenue bonds are issued to finance the design, development and construction of resources recovery and recycling facilities and landfills throughout the State. These bonds are paid solely from the revenues generated from the operations of the projects and other receipts, ac-counts and monies pledged in the bond indentures.
Connecticut Higher Education Supplemental Loan Authority's revenue bonds are issued to provide loans to students, their parents, and institutions of higher education to assist in the financing of the cost of higher education. These loans are issued through the Authority's Bond fund. According to the bond resolu-
68

STATE OF CONNECTICUT Notes to the Financial Statements
tions, the Authority internally accounts for each bond issue in separate funds, and additionally, the Bond fund includes individual funds and accounts as defined by each bond resolution.
Connecticut Health and Educational Facilities Authority's revenue bonds are issued to assist certain health care institutions, institutions of higher educa-tion and qualified for-profit and not-for-profit institu-tions in the financing and refinancing of projects to be undertaken in relation to programs for these institu-tions. The Authority generally holds title to, or has first mortgages on, the buildings and related facilities fi-nanced by the bonds. The terms of the lease, mortgage and loan payments receivable from the institutions correspond to the amortization requirements of related bonds payable. On final payment of a bond issue, the title to or security interest in the building and related facilities reverts to the institution. Prior to July 1, 1979, the Authority issued general obligation bonds for which the Authority is ultimately responsible for the payment
of principal and interest when due. After July 1, 1979, the Authority has issued only special obligation bonds for which the principal and interest is payable solely from the revenues of the institutions. At year end, the Authority had $28,010 and $2,135,440 in outstanding general obligation and special obligation bonds, re-spectively.
Each Authority has established special capital reserve funds which secure all the outstanding bonds of the Authority at year end (except as discussed below). These funds are usually maintained at an amount equal to next year's bond debt service requirements. The State may be contingently liable to restore any defi-ciencies that may exist in the funds in any one year in the event that the Authority is unable to do so. For the Connecticut Resources Recovery Authority and the Connecticut Health and Educational Facilities Author-ity, bonds outstanding at year end in the amount of $336,429 and $257,770, respectively, were secured by the special capital reserve funds.
Future amounts required to pay principal and interest on revenue bonds outstanding at June 30, 1996, were as follows:
Year Ending June 30,
Enterprise Funds
Primary Government
Funds Component Units
Higher Education and University
Nonexpendable Trust Hospital Principal Interest Principal Interest Principal Interest Principal Interest
1997 $ 4,995 $14,611 $ 15,395 $ 18,947 $ 6,415 $5,582 $ 187,483 $ 326,395 1998 8,130 14,113 18,725 17,958 6,242 5,235 211,250 317,393
1999 14,960 13,169 19,705 16,910 6,238 4,897 193,977 304,548 2000 14,337 11,936 20,130 15,850 6,221 4,552 201,737 294,143
2001 16,256 10,642 20,090 14,748 5,158 4,200 222,187 281,933
Thereafter 155,492 50,344 294,375 96,634 68,380 23,910 4,503,195 3,054,518
$214,170 $114,815 $388,420 $181,047 $98,654 $48,376 $5,519,829 $4,578,930
No-commitment Debt Under the Self-Sustaining Bond Program, the Con-necticut Development Authority issues revenue bonds to finance such projects as described previously in the component units section. These bonds are paid solely from payments received from participating companies (or from proceeds of sale of the specific projects in the
event of default) and do not constitute a debt or liability of the Authority or the State. Thus, the balances and activity of the Self-Sustaining Bond Program are not included in the Authority's financial statements. Total bonds outstanding at June 30, 1996 were $1,219.1 million bearing rates ranging from 3.4% to 14%.
69

Average Refunded Interest Bonds Rate Bond Type
Average Refunding Interest
Bonds Rate
$58.9 6.79% General Obligation $61.3 5.43% $150.2 6.84% Special Tax Obligation $160.6 4.98%
$43.1 6.93% Revenue-Clean Water Fd. $48.4 5.14%
STATE OF CONNECTICUT Notes to the Financial Statements
The Connecticut Resources Recovery Authority has issued several bonds to fund the construction of waste processing facilities by independent con-tractors/operators. These bonds are payable from a pledge of revenues derived primarily under lease or loan agreements between the Authority and the operators. Certain of these bonds are secured by letters of credit. The Authority does not become involved in the construction activities or the repayment of the debt (other than the portion allocable to Authority purposes). In the event of default, payment of the debt is not guar-anteed by the Authority or the State except for the State's contingent liability discussed below. Thus, the assets and liabilities related to these bond issues are not included in the Authority's financial statements. Total bonds outstanding at June 30, 1996 were $344.6 million bearing interest rates ranging from 3.85% to 8.625%. Of this amount, $170.5 million was secured by a special capital reserve fund. The State may be contingently liable for any deficiencies in the fund as explained previously in the component units section.
Debt Refundings During the year, the State advance refunded the following bonds (amounts in million).
The State advance refunded these bonds to reduce its total debt service payments over the next ten years by $8.1 million and to obtain an economic gain (difference between the present values of the debt service payments of the old and new bonds) of $8.8 million. As of June 30, 1996, $1,818.8 million of outstanding general obligation, special tax obligation, and revenue bonds (including prior year's refundings) are considered defeased.
Regarding the Clean Water Fund revenue bonds refunded, the difference between the book value of the refunded bonds and the amount deposited in the irrevocable trust resulted in an accounting loss of $4.7 million which has been deferred and which will be recognized as an adjustment of interest expense over the life of the refunding bonds, using the outstanding bond method.
Note Payable An installment note for $12.3 million to acquire a telecommunication system was established between the University of Connecticut and Connecticut Bank and Trust Co. in 1988 with an interest rate of 7.55% and final maturity in April 1999. Future amounts required to pay principal and interest on the note outstanding were as follows:
Year Ending June 30 Principal Interest Total
1997 1,395 631 2,026 1998 1,502 524 2,026 1999 1,618 408 2,026
$4,515 $1,563 $6,078
The proceeds of the refunding bonds were used to purchase U.S. Government securities, which were deposited in an irrevocable trust with an escrow agent to provide for all future payments on the refunded bonds. Thus, the refunded bonds are considered to be defeased and the liability for those bonds has been removed from the general long-term debt account group and the nonexpendable trust fund.
70

Risk of Loss Liability (Torts):
General (State buildings, parks, or grounds)
Other
Risk Financed by Purchase of Self-
Commercial Insurance Insurance
Theft of, damage to, or destruction of assets
Business interruptions
Errors or omissions: Professional liability Medical malpractice
(University Hospital)
Injuries to employees
Natural disasters X
Regarding liability risk, the State is generally immune from liability due to having sovereign immunity. This means that the State cannot be sued for liability without its permission. For this reason, the State is self-insured for general liability risk. For other liability risks, the State purchases commercial insurance only if the State can be held liable under a particular statute (e.g. per statute the State can be held liable for injuries suffered by a person on a defective State highway), or if it is required by a contract. When purchasing commercial insurance, the State may retain some of the risk by assuming a deductible or self-insured retention amount in the insurance policy. This amount varies greatly because the State carries a large number of insurance policies covering various liability risks. The highest amount is a $25 million self-insured retention carried in a railroad liability policy.
Regarding risk of, theft of, or damage to assets (particularly in the automobile fleet), the State insures only leased cars and vehicles valued at more than $100 thousand.
STATE OF CONNECTICUT Notes to the Financial Statements
Note 16 RISK MANAGEMENT
The risk financing and insurance program of the State is managed by the State Insurance Purchasing Board. The Board is responsible mainly for determining the method by which the State shall insure itself against losses by the purchase of insurance to obtain the broadest coverage at the most reasonable cost, deter-mining whether deductible provisions should be in-cluded in the insurance contract, and whenever appro-priate determining whether the State shall act as self-insurer. The schedule below lists the risks of loss to which the State is exposed and the ways in which the State finances those risks.
Most State employees and retirees participate in four health plans. For one of these plans, the State is self-insured. This plan is administered by a vendor that is responsible for the processing and payment of claims. The State is responsible for making monthly contribu-tions to the plan administrator to pay for claims pro-cessed in the following month. At the end of the fiscal year, the State determines whether total incurred claims (including incurred but not reported claims) paid by the plan administrator meet a contractual target. If total incurred claims are more than 103% of the target, the State would share the risk equally with the plan admin-istrator. If total incurred claims are less than 97% of the target, the State would share the savings equally with the plan administrator. If total incurred claims fall between 97% and 103% of the target, the State would assume the risk or retain the savings entirely. As of June 30, 1996, total incurred claims paid by the plan administrator met the contractual target (i.e., the State entirely assumed the risk or retained the savings pro-vided by the plans). Also, total incurred claims paid by the plan exceeded contributions made to the plan by $26.3 million.
The State records its risk management activities in the General fund, except for activities related to the medi-cal malpractice risk which are recorded in the Univer-sity Hospital fund. At year end, a liability for unpaid claims is recorded in each fund when it is probable that a loss has occurred and the amount of the loss can be reasonably estimated. The liability includes an amount for claims that have been incurred but not reported. The portion of the General fund liability considered to be long-term is recorded in the General Long-Term Debt account group. Changes in the claims liability accounts during the last two fiscal years were as follows:
General Liability
Medical Malpractice
Workers' Compensation
Health Plan
Balance 6-30-94 $ 1,940 $10,725 $294,799 $ - Incurred claims 780 857 51,875 270,476 Paid claims (1,940) (1,018) (59,720) (262,161)
Balance 6-30-95 780 10,564 286,954 8,315 Incurred claims 683 (1,620) 29,178 253,111 Paid claims (780) (311) (47,982) (235,093)
Balance 6-30-96 $ 683 $ 8,633 $268,150 $ 26.333
71

STATE OF CONNECTICUT Notes to the Financial Statements
Note 17 INTERFUND RECEIVABLES AND PAYABLES
Interfund receivable and payable balances at June 30, 1996, were as follows:
Interfund Interfund Fund Receivables Payables
General $ 13,840 $ 335,755
Special Revenue: Transportation 13,312 730 Workers Compensation 335 129 Banking 180 Consumer Counsel & Public
Utility Control 148 Insurance 146 Criminial Injuries 340 Regional Market 9 Soldiers, Sailors, & Marines 400 342 Employment Security 1,851 979 Lottery & OTB 46 Grant and Loan Programs 11,188 Environmental Programs 7,261 223 Housing Programs 76 Other 4,532 131
28,031 14,327
Debt Service 7,087
Capital Projects: State Faci I itieS 253,523 7,919 Infrastructure 25,892 828 Transportation 44
279,415 8,791
Enterprise: Rental Housing 671 Bradley 1,777 Other 11
2,459
Internal Service: Correction Industries 231 7 Administrative Services 3,918 10,986
4,149 10,993
Expendable Trust: Employment Security 1,082 8,365
Nonexpendable Trust: Clean Water Soldiers, Sailors, & Marines 399 Other 3 62
3 461
Pension Trust: State Employees 4,350 2,466 Probate Judges 1,022
4,350 3,488
Agency: • Payroll & Fringe Benefit 2,247 Receipts Pending Distribution 12,289 Other 3,111
5,358 12,289
Higher Education & University Hospital: Current Unrestricted 57,062 3,813 Current Restricted 24 1,576 Hospital Funds 1,402 3,562 Endowment & Similar Funds 1 Plant Funds 52,119 44,621 Agency Funds 10
110,617 53,573
Component Units: Ct. Development Authority 10,540 Ct. Innovations 860 Ct. Health & Educational
Facilities Authority 44,580 45,237 55,980 45,237
Totals $502,825 $502,825
INTote 18 RESTATEMENT OF FUND BALANCES
As of June 30, 1996, the beginning fund balances for the following funds were restated as follows:
Ft_j_t_dt
Balance 6-30-95
Previously Reported
Change in Accounting Principle
Correction of Reported Balance Assets/ 6-30-95
Liabilities As Restated
Nonexpendable Trust Funds: Soldiers, Sailors & Marines $ 53,255 $ (2,464) $ - $ 50,791 Other 18,078 1,137 19,215
Pension Trust Funds: State Employees 4,134,861 508,672 4,643,533 State Teachers 5,955,905 732,636 6,688,541 Judicial 67,063 5,769 72,832 Connecticut Municipal
Employees 652,388 81,575 733,963 Probate Judges 35,236 5,162 40,398
Higher Education and University Hospital:
Unrestricted Funds 115,035 - (22,261) 92,774 Restricted Funds 23,489 - 1,543 25,032 Plant Funds 1,561,323 - 17,844 1,579,167
72

Primary Government Component Units
Connecticut Bradley Resources Connecticut
International Recovery Innovations, Airport Authority Incorporated
Balance July 1, 1995 $ 99,188 $2,443 $65,830 Contributions 1,871 5,062
Items added back to retained earnings (168)
Balance June 30, 1996 $101,059 $2,275 $70,892
Special Reserved For General Revenue
Petty Cash $ 997 $ Budget
Reserve 240,971 Inventories 48,553 12,988 Continuing
Appropriations Debt Service Loans Pension
Obligations Trust Activities Restricted
Fund Type
Debt Trust and Higher Service Agency Education
13,677,971 108,695
- 150,487
82,624 18,921
89,500 - 455,740 - 391,199
$462,645 $423,108 $455,740 $13,786,666 $150,487
STATE OF CONNECTICUT Notes to the Financial Statements
For the year ended June 30, 1996, the State changed its method of accounting for investments in the combined investment funds. Previously, the State reported those investments at cost, but now they are being reported at market value, as determined by each combined investment fund. This change was made to more accurately reflect the financial position and results of operation of the pension and other trust funds. For financial reporting purposes, this change is considered to be a change in accounting principle and its cumulative effect is reported as an adjustment to the beginning fund balance of the pension and other trust funds.
Note 19 RESERVED RETAINED EARNINGS, RESERVED FUND BALANCES, AND CONTRIBUTED CAPITAL
Reserved Retained Earnings Bradley International Airport, an enterprise fund, has $22,329 restricted for debt service requirements and other programs of the airport. The Connecticut Hous-ing Finance Authority, a component unit, has $350,106 restricted for debt service requirements and other pro-grams of the Authority. The Connecticut Resources Recovery Authority, a component unit, has $16,265 restricted for specific purposes.
Contributed Capital The following is a summary of changes in the contrib-uted capital accounts for the year ended June 30, 1996:
Reserved Fund Balances These balances are comprised as follows:
Reserved for continuing appropriations represents amounts of unexpended appropriations legally carried forward and available for encumbrances and expenditures in the succeeding year.
Reserved amounts in Higher Education represent amounts restricted for specific educational programs by federal grants, private gifts and endowments, and amounts reserved for student loans and debt service.
Note 20 SEGMENT INFORMATION - ENTERPRISE FUNDS
The State maintains three enterprise funds which pro-vide financing for State housing programs, airport services, and vocational education. Segment informa-tion for the year ended June 30, 1996, is as follows:
Rental Housing
Bradley International
Airport Other Operating Revenue $ 3,350 $ 31,819 $2,140 Depreciation and
Amortization Expense 4 7,751 Operating Income (Loss) (6,256) 3,493 (261) Operating Transfers In 4,892 Operating Transfers Out (822) Net Non-operating Revenues
(Expenses) 2,185 (425) Net Income (Loss) (1) 3,068 (261) Contributed Capital 101,059 350 Property, Plant & Equipment:
Additions (Deletions) (4) 1,065 (20) Net Working Capital 11,582 11,283 914 Total Assets 159,405 206,238 1,391 Bond and Other Long-Term
Liabilities Payable from Operating Revenues 123,630 90,540
Total Equity 31,493 108,932 1,136
73

STATE OF CONNECTICUT Notes to the Financial Statements
Note 21 CONDENSED FINANCIAL STATEMENTS - COMPONENT UNITS
Balance Sheets
Assets:
Connecticut Development
Authority
Connecticut Housing Finance
Authority (12-31-95)
Connecticut Resources Recovery Authority
Connecticut Health &
Educational Facilities Authority Other Total
Current assets $ 94,460 $ 586,861 $ 53,015 $ 56,066 $ 57,433 $ 847,835 Property, plant, and equipment 16,655 2,628 241,569 177 215 261,244 Restricted assets - 313,373 103,572 2,585,987 6,061 3,008,993 Other Assets 185,977 2,320,519 32,562 65,207 2,604,265
Total Assets $297,092 $3,223,381 $430,718 $2,642,230 $128,916 $6,722,337
Liabilities and Equity: Liabilities:
Current liabilities $ 14,888 $ 34,112 $ 18,466 107,997 $ 3,449 $ 178,912
Revenue bonds 142,260 2,745,482 367,634 2,163,450 74,100 5,492,926
Other liabilities 45 93,681 15,513 359,441 - 468,680 Total Liabilities 157,193 2,873,275 401,613 2,630,888 77,549 6,140,518
Equity: Contributed capital 150,340 2,275 - 70,892 223,507 Retained earnings (10,441) 350,106 26,830 11,342 (19,525) 358,312
Total Equity 139,899 350,106 29,105 11,342 51,367 581,819 Total Liabilities and Equity $297,092 $3,223,381 $430,718 $2,642,230 $128,916 $6,722,337
Statements of Revenues. Expenditures, and Changes in Equity
Connecticut Development
Authority
Connecticut Housing Finance
Authority (12-31-95)
Connecticut Resources Recovery Authority
Connecticut Health &
Educational Facilities Authority Other Total
Operating Revenues $ 20,997 $ 179,424 $145,450 $120,033 $ 11,227 $477,131 Operating Expenses:
Depreciation and amortization 508 5,397 17,287 45 230 23,467 Other 20,377 213,125 101,592 119,817 12,039 466,950
Operating Income (Loss) 112 (39,098) 26,571 171 (1,042) (13,286) Nonoperating Revenues (Expenses) 113 53,464 (13,786) 618 2,758 43,167
Net Income (Loss) for the Year 225 14,366 12,785 789 1,716 29,881 Equity - beginning 139,674 335,740. 16,320 10,553 44,589 546,876 Capital contributions 5,062 5,062
Equity - ending $139,899 $ 350,106 $ 29,105 $ 11,342 $51,367 $581,819
74

STATE OF CONNECTICUT Notes to the Financial Statements
Note 22 RELATED ORGANIZATIONS
Related organizations are legally separate organiza-tions which are not financially accountable to the State. However, these organizations are still related to the State as discussed next.
The State appoints a voting majority of the following organizations' governing boards: the University of Connecticut Educational Properties, Inc. (UCEPI), the Community Economic Development Fund, and the Connecticut Student Loan Foundation. The State's accountability for these organizations does not extend beyond making the appointments. During the fiscal year, UCEPI received a $0.2 million operating grant from the State, and as of June 30, 1996, the Connecticut Student Loan Foundation owed the State $21.8 million under a revolving loan agreement.
1Note 23 COMMITMENTS AND CONTINGENCIES
A. Commitments At June 30, 1996, the State, including its component units, had the following outstanding commitments:
Infrastructure (highways, roads, etc.) and other construction contracts and miscellaneous con-tracts with various vendors totaling approximately
,326 million of which $878 million is expected to be reimbursed by Federal grants.
School construction and alteration grants with various towns for $805 million and interest costs of $337 million for a total of $1,142 million. Funding for these projects is expected to come from bond sales.
Loan commitments, mortgage and grant programs, and loan guarantees totaling approximately $212 million. Funding for these programs is expected to come from bond sales.
Contingent Liabilities The Division of Special Revenue, the agency respon-sible for the Lottery Fund, has entered into agreements with insurance companies under which the Lottery Fund purchases annuities under group contracts which provide payments corresponding to the State's obliga-tion to prize winners. Notwithstanding these annuity contracts, the State of Connecticut is contingently liable for the prize payments due lottery winners. At June 30, 1996, amounts due lottery winners totaled $962 million.
The Legislature has enacted legislation to assist the City of West Haven by authorizing the State to guar-antee debt issued by the City in an amount up to $35 million. At year end, the debt outstanding guaranteed by the State was $23 million.
The State has entered into a contractual agreement with H.N.S. Management Company, Inc. and ATE Management and Service Company, Inc. to manage and operate the bus transportation system for the State. The State shall pay all expenses of the system includ-ing all past, present and future pension plan liabilities of the personnel employed by the system and any other fees as agreed upon. When the agreement is termi-nated the State shall assume or make arrangements for the assumption of all the existing obligations of the management companies including but not limited to all past, present and future pension plan liabilities and obligations.
Litigation The State, its units and employees are parties to numerous legal proceedings many of which normally occur in governmental operations. Most of these legal proceedings are not, in the opinion of the Attorney General, likely to have a material adverse impact on the State's financial position.
There are, however, several legal proceedings which, if decided adversely against the State, may require the State to make material future expenditures for ex-panded services or capital facilities or may impair future revenue sources. It is neither possible to deter-
75

STATE OF CONNECTICUT Notes to the Financial Statements
mine the outcome of these proceedings nor to estimate In December, $77.5 million of general obligation bonds the possible effects adverse decisions may have on the were issued, maturing at various dates through 2006 future expenditures or revenue sources of the State. and having interest rates of 3.75% to 5%.
Note 24 SUBSEQUENT EVENTS
In August, $120 million of general obligation bonds were issued, maturing at various dates through 2016 and having interest rates of 4.5% to 6.5%.
In October, $229.8 million of special tax obligation bonds for transportation infrastructure programs were issued. These consisted of $150 million of serial bonds and $79.8 million of refunding serial bonds maturing on various dates through 2016 and bearing interest rates of 4% to 6%. The refunding bonds were used to advance refund $79.7 million of bonds bearing interest rates of 6.25% to 6.5%.
Also in October, the State issued $100 million of Special Assessment Second Injury Fund Revenue Bonds. The issuance of these special obligation bonds was for the purpose of settling claims on a one-time, lump-sum basis in the Second Injury Trust Fund. The bonds are to be paid by assessments already being levied on insured employers and self-insured employ-ers and will mature on various dates through 2012 and bear interest rates of 4.25% to 6%.
In November, $159.1 million of general obligation bonds were issued. These bonds will mature at various dates through 2016 and have interest rates of 3.6% to 6.5%. $81.6 million of the total bonds issued were used to advance refund $77.4 million of bonds bearing interest rates of 6.2% to 7.125%.
Also in November, $80 million of taxable general obligation bonds were issued, maturing in 2005 and 2006 and which will bear interest at the Periodic Auction Reset Securities rate. The rate used initially will be 5.35%.
76

Required PERS Supplementary Information
77

STATE OF CONNECTICUT Required Supplementary Information Analysis of Fund Progress (Expressed in Millions)
(1) (2)
Net Assets Pension Fiscal Available Benefit Year for Benefits* Obligation
(3)
Funded (1)/(2)
(4)
Unfunded Pension Benefit
Obligation (2)-(11
(5)
Annual Covered Payroll
as
Unfunded Benefit
of Covered
(6) Pension
Obligation a Percentage
Payroll (4)1(5)
State Employees' Retirement System 1988 $1,844.6 $4,089.3 45.1% $2,244.7 $1,429.1 157.1% 1989 $2,166.5 $4,550.7 47.6% $2,384.2 $1,583.0 150.6% 1990 $2,552.1 $5,071.5 50.3% $2,519.4 $1,759.5 143.2% 1991 $2,932.6 $5,624.7 52.1% $2,692.1 $1,802.8 149.3% 1992 $3,140.2 $6,009.7 (1) .52.3% (1) $2,869.5 (1) $1,983.6 (1) 144.7% (1) 1993 $3,425.8 $6,668.7 51.4% $3,242.9 $1,931.4 167.9% 1994 $3,695.6 $7,189.8 51.4% $3,494.2 $2,144.8 162.8% 1995 $4,015.2 $7,329.2 54.8% $3,314.0 $2,155.9 153.7% 1996 $4,118.7 $7,838.2 52.5% $3,719.5 $2,272.5 163.7%
Teachers' Retirement System 1988 $2,880.3 $6,293.7 45.8% $3,413.4 $1,193.5 286.0% 1989 $3,275.2 $6,856.7 47.8% $3,581.5 $1,370.0 261.4% 1990 $3,744.8 $7,090.2 52.8% $3,345.4 $1,540.8 217.1% 1991 $4,308.5 $7,425.2 58.0% $3,116.7 $1,663.8 187.3% 1992 $4,623.1 $7,408.4 62.4% $2,785.3 $1,792.5 155.4% 1993 $4,811.4 $6,896.7 69.8% $2,085.3 $1,841.9 113.2% 1994 $5,144.5 $7,278.2 70.7% $2,133.7 $1,952.4 109.3% 1995 $5,804.3 $7,489.9 77.5% $1,685.6 $2,030.4 83.0% 1996 $5,931.6 $7,489.9 79.2% $1,558.3 $2,152.2 72.4%
Judicial Retirement System 1988 $15.3 $93.5 16.4% $78.2 $9.7 806.2% 1989 $21.9 $103.6 21.1% $81.7 $10.5 778.1% 1990 $30.0 $120.8 24.8% $90.8 $12.8 709.4% 1991 $37.6 $110.0 34.2% $72.4 $14.4 502.8% 1992 $44.5 $120.4 37.0% $75.9 $15.3 496.1% 1993 $47.8 $130.6 36.6% $82.8 $16.2 511.1% 1994 $51.6 $141.3 36.5% $89.7 $18.1 495.6% 1995 $55.5 $148.0 37.5% $92.5 $18.5 500.0% 1996 $66.9 $154.7 43.2% $87.8 $19.0 462.1%
Municipal Employees' Retirement System 1988 $279.0 $346.0 80.6% $67.0 $144.0 46.5% 1989 $348.0 $388.0 89.7% $40.0 $160.0 25.0% 1990 $378.0 $438.0 86.3% $60.0 $185.0 32.4% 1991 $411.9 $469.6 87.7% $57.7 $186.3 31.0% 1992 $441.0 $533.0 82.7% $92.0 $195.0 47.2% 1993 $475.0 $526.3 90.3% $51.3 $203.0 25.3% 1994 $508.6 $573.1 88.7% $64.5 $214.6 30.1% 1995 $536.0 $620.1 86.4% $84.1 $226.0 37.2% 1996 $564.3 $644.4 87.6% $80.1 $237.0 33.8%
Isolated anlysis of the dollar amounts of net assets available for benefits, pension benefit obligation, and unfunded pension benefit obligation can be misleading.
Expressing the net assets available for benefits as a percentage of the pension benefit obligation provides one indication of the State of Connecticut PERS funding
status on a going-concern basis. Analysis of this percentage, over time indicates whether the system is becoming financially stronger or weaker. Generally, the
greater this percentage, the stronger the PERS. Trends in unfunded pension benefit obligation as a percentage of annual covered payroll approximately adjusts for
the effects of inflation and aids analysis of the progress made in accumulating sufficient assets to pay benefits when due. Generally, the smaller this percentage,
the stronger the PERS. Prior to 1988, statements were not prepared on a GAAP basis, therefore, required supplementary information is only presented since then.
* Net assets are presented at cost
(1) Amount /percentage changed to reflect corrections made by actuary.
78

STATE OF CONNECTICUT State Employees' Retirement System Required Supplementary Information Revenues by Source and Expenses by Type (Expressed in Millions)
Revenues by Source
Fiscal Year
Employee Contributions
State Contributions Investment
Income Other Total Dollar
Amount % of Annual
Covered Payroll
1987 $27.8 $275.8 21.2% $102.8 $43.0 $449.4 1988 $28.0 $272.3 19.1% $144.6 $50.6 $495.5 1989 $28.7 $324.3 20.5% $180.8 $49.0 $582.8 1990 $29.2 $288.4 16.4% $260.6 $53.6 $631.8 1991 $33.8 $208.8 11.6% $179.7 $60.0 $482.3 1992 $33.2 $195.3 10.0% $312.7 $5J.4_.$592.6 1993 $32.9 $250.8 13.0% $297.8 $42.6 $624.1------„, 1994 $35.8 $248.4 11.6% $356.3 $61.8 $702.3 1995 $35.5 $206.7 9.6% $185.2 $85.5 $512.9 1996 $35.9 $254.4 11.2% $658.4 $80.7 $1,029.4
Expenses by Type
Fiscal Year Benefits Administrative Refunds Other Total
1987 $154.9 $0.1 $2.8 $- $157.8 1988 $171.7 $0.2 $2.7 $0.6 $175.2 1989 $192.6 $1.9 $2.2 $0.6 $197.3 1990 $248A $0.5 $1.8 $0.7 $251.4 1991 $272.1 $0.2 $1.8 $- $274.1 1992 $303.9 $0.1 $3.0 $- $307.0 1993 $351.9 $0.2 $2.2 $- $354.3 1994 $367.6 $0.2 $2.3 $- $370.1 1995 $388.9 $0.2 $2.3 $14.4 $405.8 1996 $418.5 $0.1 $4.8 $- $423.4
Contributions were made in accordance with actuarially determined contribution requirements for fiscal years 1987 through 1989. From 1990 through 1996 the actuarially determined contribution requirements were $354.4 million, $398 million, $431.2 million, $447.8 million, $480.4 million, $535.3 million, and $501.1 million, while the actual contributions were $341.4 million, $263.8 million, $246.7 million, $293.4 million, $310.2 million, $292.2 million, and $335.1 million, respectively.
79

STATE OF CONNECTICUT State Teachers' Retirement System Required Supplementary Information Revenues by Source and Expenses by Type (Expressed in Millions)
Revenues by Source
Fiscal Year
Employee Contributions
State Contributions Dollar % of Annual
Amount Covered Payroll Investment
Income Other Total
1987 $75.5 $204.7 19.2% $187.5 $- $467.7
1988 $89.6 $242.5 20.3% $237.2 $- $569.3
1989 $100.1 $282.9 20.6% $269.8 $- $652.8 1990 $106.9 $321.6 20.9% $351.2 $1.4 $781.1
1991 $115.0 $158.4 9.5% $292.3 $0.2 $565.9 1992 $124.9 $133.0 7.4% $469.2 $2.6 $729.7 1993 $149.5 $111.6 6.1% $450.6 $2.8 $714.5 1994 $150.9 $124.3 6.4% $518.6 $2.1 $795.9 1995 $160.0 $132.5 6.5% $251.5 $17.4 $561.4 1996 $162.7 $140.0 6.5% $937.3 $2.7 $1,242.7
Expenses by Type
Fiscal Year Benefits Refunds Other Total
1987 $154.8 $6.5 $- $161.3 1988 $168.9 $5.6 $- $174.5 1989 $183.7 $5.8 $- $189.5 1990 $210.7 $6.8 $- $217.5 1991 $243.9 $6.8 $13.2 $263.9 1992 $278.1 $8.3 $8.8 $295.2 1993 $333.6 $11.4 $25.8 $370.8 1994 $354.2 $6.4 $28.0 $388.6 1995 $392.6 $8.1 $19.7 $420.4 1996 $429.9 $9.3 $25.7 $464.9
Contributions were made in accordance with actuarially determined contribution requirements for fiscal years 1987 through 1989. From 1990 through 1996 the actuarially determined contribution requirements were $302.9 million, $348.6 million, $304.3 million, $325 million, $299.6 million, and $145.8 million, $154.0 million, and $164.7 million, respectively, while the actual contributions made were $282.9 million, $321.6 million, $158.3 million, $133.0 million, $111.6 million, $124.3 million, $132.5 million, and $140.0 million, respectively.
80

STATE OF CONNECTICUT Judicial Retirement System Required Supplementary Information Revenues by Source and Expenses by Type (Expressed in Millions)
Revenues by Source
Fiscal
Year
Employee
Contributions
State Contributions Investment
Income Other Total Dollar
Amount
°A of Annual
Covered Payroll
1987 $0.5 $8.6 97.8% $0.6 $- $9.7
1988 $0.6 $9.9 102.1% $1.1 $- $11.6
1989 $0.6 $10.4 99.0% $1.7 $- $12.7
1990 $0.7 $10.8 91.5% $3.0 $- $14.5
1991 $0.7 $11.4 79.2% $2.6 $0.2 $14.9
1992 $0.8 $7.0 46.0% $4.2 $- $12.0
1993 $0.9 $7.8 48.1% $4.7 $- $13.4
1994 $1.0 $8.3 45.9% $5.4 $- $14.7
1995 $1.0 $9.0 48.6% $2.3 $- $12.3
1996 $1.0 $9.2 48.4% $10.1 $- $20.3
Expenses by Type
Fiscal Year Benefits
Administrative & Other Total
1987 $4.6 $- $4.6
1988 $4.9 $- $4.9
1989 $5.4 $0.2 $5.6
1990 $5.9 $- $5.9
1991 $6.3 $- $6.3
1992 $7.0 $- $7.0
1993 $7.7 $- $7.7
1994 $8.2 $- $8.2
1995 $8.7 $- $8.7
1996 $9.5 $- $9.5
Contributions were made in accordance with actuarially determined contribution requirements for fiscal years
1987-1996, except 1992. In 1992, the actrarially determined contribution requirement was $10.6 million,
while the actual contribution was $7 million. L
81

STATE OF CONNECTICUT Municipal Employees' Retirement System Required Supplementary Information-Revenues by Source and Expenses by Type (Expressed in Millions)
Revenues by Source
State Contributions Fiscal Year
Employee Contributions
Dollar Amount
% of Annual Covered Payroll
Investment Income Total
1987, $7.3 $13.3 N/A $22.1 $42.7 1988 $6.1 $16.4 11.4% $60.6 $83.1 1989 $7.6 $19.5 12.2% $20.2 $47.3 1990 $6.6 $18.7 10.1% $24.7 $50.0 1991 $6.9 $22.0 11.8% $26.3 $55.2 1992 $7.0 $22.4 11.5% $29.9 $59.3 1993 $7.3 $24.1 11.9% $29.6 $61.0 1994 $7.8 $23.1 10.8% $27.4 $58.3 1995 $7.6 $22.2 9.8% $26.9 $56.7 1996 $8.4 $23.9 10.1% $103.2 $135.5
Expenses by Type
Fiscal Year Benefits Refunds Total
1987 $11.6 $0.7 $12.3 1988 $13.0 $0.8 $13.8 1989 $15.0 $1.1 $16.1 1990 $17.4 $1.2 $18.6 1991 $21.1 $2.4 $23.5 1992 $24.2 $1.0 $25.2 1993 $26.5 $0.8 $27.3 1994 $29.2 $0.9 $30.1 1995 $32.6 $0.0 $32.6 1996 $34.8 $2.0 $36.8
Contributions were made in accordance with actuarially determined contribution requirements.
82

83

STATE OF CONNECTICUT
•
•
THIS PAGE LEFT INTENTIONALLY BLANK
84

STATE OF CONNECTICUT Special Revenue Funds
Special Revenue funds account for the proceeds of specific revenue sources (other than expendable trusts, major capital projects, and higher education and university hospital sources) that are legally restricted for specified purposes. Significant Special Revenue Funds include the following:
Transportation Fund: to account for motor vehicle related taxes, receipts and transportation related federal revenues collected for the purposes of payment of debt service requirements and budgeted appropriations made to the Department of Transportation. The Department of Transportation is responsible for all aspects of the planning, develop-ment, maintenance, and improvement of transporta-tion in the state.
Workers' Compensation Administration: to account for assessments collected for the purpose of covering the administrative costs of the Workers' Com-pensation Commission.
Banking: to account for monies collected from various banking institutions throughout the state.
Consumer Counsel and Public Utility Control: to account for monies collected from various public utility companies.
Insurance: to account for monies collected from authorized insur-ers within the state.
Criminal Injuries Compensation: to account for monies collected from the criminal injuries board.
Regional Market Fund: to account for rents and other monies collected for the purpose of providing for the payment of expenses relating to the operation and maintenance of the re-gional market.
Mashantucket Pequot Fund: to account for casino gambling monies collected from the Mashantucket Pequot Tribe in Ledyard to be used for the purpose of distribution to towns.
Soldiers, Sailors, and Marines Fund: to account for interest earned for the purpose of fur-nishing food, wearing apparel, medical or surgical care, or funeral expenses of soldiers, sailors, and ma-rines who served in any branch of military service.
Employment Security Administration: to account for monies collected from various sources for the purpose of defraying the cost of the administra-tion of unemployment compensation.
Lottery: to account for lottery proceeds collected for the pur-poses of paying prizes and certain compensation to agents or claim centers. Balances in excess of the needs of the fund are transferred to the General Fund from time to time as determined by the executive director.
Grants and Loan Programs: to account for monies collected for the purpose of giving various grants to local governments, organiza-tions, and individuals.
Environmental Programs: to account for monies collected for the purpose of providing funds for various environmental programs throughout the state.
Housing Programs: to account for monies collected for the purpose of providing funds for various housing programs through-out the state.
85

STATE OF CONNECTICUT Combining Balance Sheet Special Revenue Funds June 30, 1996 (Expressed in Thousands)
Assets:
Transportation Workers
Compensation Banking
Consumer
Counsel and
Public Utility Control Insurance
Criminial Injuries
Mashantucket
Pequot Fund
Cash and Cash Equivalents $ 46,919 $ 23,085 $ 10,477 $ 1,937 $ 4,974 $ 1,084 $ 9
Investments: Other
Receivables: Taxes 44,624 -
/ Accounts, Net of Allowances 4,183 256
Loans, Net of Allowances - -
Interest 689 Federal Grants Receivable 7,912 Non Federal Grants Receivable 314 - -
Due From Other Funds 13,312 335 - 340
Advances to Other Funds - - -
Receivable From Other Governments 2,750 Inventories and Prepaid Items 12,988
Total Assets $ 133,691 $ 23,420 $ 10,477 $ 1,937 $ 5,230 $ 1,424 $ 9
Liabilities and Fund Balances: Liabilities: Accounts Payable and Accrued Liabilities $ 23,983 $ 1,116 $ 431 $ 1,637 $ 447 $ 319 $ Due to Other Funds 730 129 180 148 146
Due to Component Units - - - -
Payable to Other Governments - - - Deferred Revenue 16,785 1,868 2,847
Total Liabilities 41,498 1,245 611 3,653 3,440 319
Fund Balances: Reserved for Inventories 12,988 Reserved for Loans -
Reserved for Continuing Appropriations 16,905 1,266 750 Unreserved, undesignated 62,300 20,909 9,116 (1,716) 1,790 1,105 9
Total Fund Balances 92,193 22,175 9,866 (1,716) 1,790 1,105 9
Total Liabilities and Fund Balances $ 133,691 $ 23,420 $ 10,477 $ 1,937 $ 5,230 $ 1,424 $ 9
86

5
Soldiers, Employment Grant
Regional Sailors, & Security & Loan Environmental Housing
Market Marines Administration Lottery Programs Programs Programs Other Total
169 $ 7,642 $ 18,046 $ 144,973 $ 57,263 $ 10,436 $ 29,895 $ 356,909
27,035 27,035
- - - 44,624
15,984 - 1,449 1,915 23,787
- 113,485 66,118 211,596 391,199
1 1 14 4 276 6,334 111 97 7,527
- - 162 - - 8,074
-- 314
400 1,851 7,261 - 23,499
- - - 4,532 4,532
1,526 217 2,278 - 6,771
- _ - 12,988
170 $ 401 $ 11,033 5 34,034 $ 258,951 5 164,173 $ 225,870 $ 36,439 $ 907,259
28 5 59 $ 5,222 5 30,463 $ 716 $ 2,347 $ 213 $ 6,268 $ 73,249
9 342 979 46 12 223 76 131 3,151 _ - - 11,176 - 11,176
- 158 - - 158
883 590 83 3,192 524 1,915 28,687
37 401 7,084 31,257 11,987 5,762 813 8,314 116,421
_ 12,988
113,485 66,118 211,596 - 391,199 _ _ _ 18,921
133 3,949 2,777 133,479 92,293 13,461 28,125 367,730
133 3,949 2,777 246,964 158,411 225,057 28,125 790,838
170 $ 401 $ 11,033 $ 34,034 5 258,951 $ 164,173 $ 225,870 $ 36,439 5 907,259
87

STATE OF CONNECTICUT Combining Statement of Revenues, Expenditures and Changes in Fund Balances Special Revenue Funds For The Fiscal Year Ended June 30, 1996 (Expressed in Thousands)
Revenues: Taxes
Transportation Workers'
Compensation Banking
Consumer Counsel and Public Utility
Control Insurance Criminial
Injuries
Mashantucket Pequot Fund
$ 498,370 $ $ - $ - $ - $ - $ Licenses, Permits and Fees 261,649 13,195 9 323 1,904 Intergovernmental 71,242 - Charges for Services 20,656 7 - Fines, Forfeits and Rents 295 23 Investment Earnings 10,250 - - Lottery - - - - Miscellaneous 17,744 24 12,263 10,978 63
Total Revenues 862,167 17,744 13,521 12,295 11,301 1,967
Expenditures: Current:
General Government 1,906 8 5 2 2 85,000 Regulation and Protection 111,240 18,398 12,284 12,360 11,100 Conservation and Development Health and Hospitals Transportation 352,839 Human Services Education, Libraries, and Museums Corrections Judicial 1,404 Federal and Other Grants 67,197
Debt Service: Principal Retirement 40,910 Interest and Fiscal Charges 15,006
Total Expenditures 589,098 18,406 12,289 12,362 11,102 1,404 85,000
Excess (Deficiency) of Revenues Over Expenditures 273,069 (662) 1,232 (67) 199 563 (85,000)
Other Financing Sources (Uses): Proceeds from Sale of Bonds - - - Operating Transfers In 31,067 1,372 57 85,000 Operating Transfers Out (289,836) - - Capital Lease Obligations - 221
Total Other Financing Sources (Uses) (258,769) 1,372 - 221 57 85,000
Excess (Deficiency) of Revenues and Other Sources Over Expenditures and Other Uses 14,300 710 1,232 154 199 620
Fund Balances (deficit) - July 1 78,115 21,465 8,634 (1,870) 1,591 485 9
Equity Trans. to Component Units Contrib. Capital Changes in Reserves for Inventories (222)
Fund Balances (deficit) - June 30 S 92,193 $ 22,175 $ 9,866 $ (1,716) $ 1,790 $ 1,105 $ 9
88

Soldiers, Employment Grant Regional Sailors, & Security & Loan Environmental Housing Market Marines Administration Lottery Programs Programs Programs Other Total
$ - $ $ - $ $ $ 9,646 $ 38 $ 508,054
23 3 10,846 29,865 317,817
109,756 5,813 186,811
5 2,233 485 23,386
829 - - 59 _ 224 1,430
8 4 108 3 3,885 1,281 1,536 883 17,958
- 706,860 - - - 706,860
5 5,437 1,865 6,795 8,219 63,393
865 4 109,872 706,863 9,322 25,930 8,331 45,527 1,825,709
205 67 435,552 34,008 2,414 43,817 29,318 632,304
8 117,680 2,118 - 25,543 310,731
630 96,239 57,736 280 1,241 156,126
4,587 41 - 2,805 7,433
5,263 - 42 358,144
3,054 6,675 826 150" 10,705
156,733 - 2,335 159,068
5,153 2,149 7,302
- 5,675 7,079
- 67,197
100 41,010
114 359 15,479
844 3,267 117,747 435,552 310,776 60,550 44,923 69,258 1,772,578
21 (3,263) (7,875) 271,311 (301,454) (34,620) (36,592) (23,731) 53,131
- 288,770 64,434 30,621 20,877 404,702
3,257 4,232 - 1,263 16 75 126,339
- (94) (262,050) (16,351) (716) (569,047)
- - - - 372 43 636
3,163 4,232 (262,050) 288,770 49,718 30,637 20,279 (37,370)
21 (100) (3,643) 9,261 (12,684) 15,098 (5,955) (3,452) 15,761
112 100 7,592 (6,484) 264,400 143,313 231,012 31,577 780,051
(4,752) (4,752)
(222)
133 $ 3,949 $ 2,777 $ 246,964 $ 158,411 $ 225,057 $ 28,125 $ 790,838
89

STATE OF CONNECTICUT Combining Schedule of Revenues, Expenditures, and Changes in Fund Balances Budget and Actual - Non-GAAP Budgetary Basis Budgeted Special Revenue Funds For the Fiscal Year Ended June 30, 1996 (Expressed in Thousands)
Revenues:
Budgeted
Budget Transportation Workers' Compensation
Actual Variance Budget Actual Variance
Taxes, Net of Refunds $ 500,600 $ 498,370 $ (2,230) $ $ $ Operating Transfers In Licenses, Permits, and Fees 258,400 259,296 896 - Other 40,600 40,733 133 20,700 17,744 (2,956) Federal Grants 4,000 4,045 45 - Operating Transfers Out (200) (250) (50)
Total Budgeted 803,400 802,194 (1,206) 20,700 17,744 (2,956) Federal and Other Restricted 69,098 69,098
Total Revenues 803,400 871,292 67,892 20,700 17,744 (2,956)
Expenditures:
Budgeted General Government 2,426 2,050 376 - Regulation and Protection 90,898 84,813 6,085 22,519 18,318 4,201 Conservation and Development - Transportation 314,612 295,213 19,399 Human Services Non Functional 425,802 409,906 15,896 Appropriations Lapsed (24,851) - (24,851)
Total Budgeted 808,887 791,982 16,905 22,519 18,318 4,201 Federal and Other Restricted 69,098 (69,098)
Total Expenditures 808,887 861,080 (52,193) 22,519 18,318 4,201
Excess (Deficiency) of Revenues Over Expenditures (5,487) 10,212 15,699 (1,819) (574) 1,245
Other Financing Sources (Uses): Prior Year Appropriations Carried Forward 17,260 17,260 1,514 1,514 Appropriations Continued to Fiscal Year 1996-97 - (16,905) (16,905) (1,266) (1,266) Transfers Between Funds 1,372 1,372 Miscellaneous Adjustments 586 586 -
Total Other Financing Sources (Uses) 17,260 941 (16,319) 1,514 1,620 106
Excess (Deficiency) of Revenues and Other Sources Over Expenditures and Other Uses $ 11,773 11,153 $ (620) $ (305) 1,046 $ 1,351
Budgetary Fund Balances - July 1 208,578 22,622 Changes in Reserves 38,177 (248)
Budgetary Fund Balances - June 30 $ 257,908 $ 23,420
90

Banking Consumer Counsel & Public Utility Control Jnsurance Budget Actual Variance Budget Actual Variance Budget Actual Variance
14,600
$ -
13,521
$
(1,079)
$ $ $ $ $ $
-
- 13,200 13,095 (105) 11,600 11,776 176
14,600 13,521 (1,079) 13,200 13,095 (105) 11,600 11,776 176
14,600 13,521 (1,079) 13,200 13,095 (105) 11,600 11,776 176
- - - - - -
14,584 12,286 2,298 13,263 11,974 1,289 11,948 11,112 836
- - - - - -
14,584 12,286 2,298 13,263 11,974 1,289 11,948 11,112 836
14,584 12,286 2,298 13,263 11,974 1,289 11,948 11,112 836
16 1,235 1,219 (63) 1,121 1,184 (348) 664 1,012
(750) (750)
(750) (750)
16 485 $ 469 $ (63) 1,121 $ 1,184 $ (348) 664 $ 1,012
9,240 816 4,309 750
$ 10,475 1,937 4,973
Continued on next page
91

,
STATE OF CONNECTICUT Combining Schedule of Revenues, Expenditures, and Changes in Fund Balances Budget and Actual - Non-GAAP Budgetary Basis Budgeted Special Revenue Funds (Continued) For the Fiscal Year Ended June 30, 1996 (Expressed in Thousands)
Revenues:
Budgeted Taxes, Net of Refunds
Criminal Injuries Compensation Mashantucket Pequot Fund Budget Actual Variance Budget Actual Variance
$ $ $ $ - $ - $ Operating Transfers In 85,000 85,000 Licenses, Permits, and Fees - - Other 1,500 1,968 468 Federal Grants - Operating Transfers Out
Total Budgeted 1,500 1,968 468 85,000 85,000 Federal and Other Restricted
Total Revenues 1,500 1,968 468 85,000 85,000
Expenditures:
Budgeted General Government Regulation and Protection 1,500 1,500 Conservation and Development Transportation Human Services Non Functional 85,000 85,000 Appropriations Lapsed
Total Budgeted 1,500 1,500 85,000 85,000 Federal and Other Restricted
Total Expenditures 1,500 1,500 85,000 85,000
Excess (Deficiency) of Revenues Over Expenditures 468 468
Other Financing Sources (Uses): Prior Year Appropriations Carried Forward Appropriations Continued to Fiscal Year 1996-97 Transfers Between Funds 57 57 Miscellaneous Adjustments
Total Other Financing Sources (Uses) 57 57
Excess (Deficiency) of Revenues and Other Sources Over Expenditures and Other Uses 525 $ 525 $
Budgetary Fund Balances - July 1
••:••••
899 9 Changes in Reserves
Budgetary Fund Balances - June 30 $ 1,424 9
92

$
Budget Regional Market Soldiers. Sailors. and Marines
Budget Total
Variance Actual Variance Budget Actual Variance Actual
_
$ $ $
-
$
-
$ $ 500,600
85,000
273,000
$ 498,370
85,000
272,817
$ (2,230)
(183) 930 866 (64) 3,650 2,920 (730) 92,180 89,102 (3,078) _ 4,000 4,045 45
(200) (250) (50)
930 866 (64) 3,650 2,920 (730) 954,580 949,084 (5,496) 69,098 69,098
930 866 (64) 3,650 2,920 (730) 954,580 1,018,182 63,602
240 230 10 2,666 2,280 386 - - 154,712 140,003 14,709
737 633 104 737 633 104
- - 314,612 295,213 19,399 - 3,436 3,054 382 3,436 3,054 382
214 214 - 511,016 495,120 15,896 - (24,851) - (24,851)
951 847 104 3,676 3,284 392 962,328 936,303 26,025 69,098 (69,098)
951 847 104 3,676 3,284 392 962,328 1,005,401 (43,073)
(21) 19 40 (26) (364) (338) (7,748) 12,781 20,529
18,774 18,774
(18,921) (18,921)
(6) (6) 1,423 1,423
586 586
(6) (6) 18,774 1,862 (16,912)
(21) 19 $ 40 $ (26) (370) $ (344) $ 11,026 14,643 $ 3,617
150 100 246,723 38,679
169 $ (270) $ 300,045
93

STATE OF CONNECTICUT
THIS PAGE LEFT INTENTIONALLY BLANK
94

STATE OF CONNECTICUT Capital Projects Funds
Capital Projects Funds are used to account for financial resources to be used for the acquisition or construction of major capital facilities and infrastructure (other than those financed by proprietary funds, trust funds, and higher education and university hospital funds). Significant Capital Projects Funds are described as follows:
State Facilities: to account for proceeds of bond issues and other sources and the subsequent expenditures for the con-struction of various state buildings and structures.
Infrastructure: to account for the proceeds of bond issues and related capital project grants to finance the state's transporta-tion infrastructure program over a ten-year period. This program encompasses the planning, acquisition, removal, construction, equipping, reconstruction, re-pair, rehabilitation and improvement of, and acquisi-tion of easements and rights-of-way with respect to, State highways and bridges, projects on the interstate
highway system, alternate highway projects in the interstate substitution program (the "interstate trade-in program"), waterway facilities, mass transportation and transit facilities, aeronautic facilities (excluding Bradley International Airport), the highway safety program, maintenance garages and administrative fa-cilities of the Department, payment of the State's share of the costs of the local bridge program and payment of State contributions to the local bridge revolving fund.
Other Transportation: to account for the proceeds of bond issues and related grants to be used for other transportation related capital projects.
95

STATE OF CONNECTICUT Balance Sheet Capital Projects Funds June 30, 1996 (Expressed in Thousands)
Assets:
State Facilities
Infra- Structure Transportation Total
Cash and Cash Equivalents $ $ 155,324 $ 44,843 $ 200,167 Receivables:
Accounts, Net of Allowances 5 1,823 219 2,047 Investment Income Receivable 492 - 492 Federal Grants Receivable - 12,932 207 13,139
Due From Other Funds 253,523 25,892 - 279,415 Receivable From Other Governments 69 46,489 147 46,705
Total Assets $ 253,597 $ 242,952 $ 45,416 $ 541,965
Liabilities and Fund Balances: Liabilities: - Accounts Payable and Accrued Liabilities $ 27,923 $ 65,574 $ 2,488 $ 95,985 Due to Other Funds 7,919 828 44 8,791 Deferred Revenue 8 20,981 148 21,137
Total Liabilities 35,850 87,383 2,680 125,913
Fund Balances: Unreserved, undesignated 217,747 155,569 42,736 416,052
Total Fund Balances 217,747 155,569 42,736 416,052
Total Liabilities and Fund Balances $ 253,597 $ 242,952 $ 45,416 $ 541,965
96

STATE OF CONNECTICUT Combining Statement of Revenues, Expenditures and Changes in Fund Balances Capital Projects Funds For The Fiscal Year Ended June 30, 1996 (Expressed in Thousands)
Revenues: Intergovenunental Investment Earnings Miscellaneous
State Facilities
Infra- Structure Transportation Total
$ 721 $ 323,762 119 192
$ 126 $ 324,609 119 192
Total Revenues 721 324,073 126 324,920
Expenditures: Capital Projects 142,839 532,817 13,876 689,532
Total Expenditures 142,839 532,817 13,876 689,532
Excess (Deficiency) of Revenues Over Expenditures (142,118) (208,744) (13,750) (364,612)
Other Financing Sources (Uses): Proceeds from Sale of Bonds 397,838 296,188 694,026 Operating Transfers Out (107,128) - (107,128)
Total Other Financing Sources (Uses) 290,710 296,188 - 586,898
Excess (Deficiency) of Revenues and Other Sources Over Expenditures and Other Uses 148,592 87,444 (13,750) 222,286
Fund Balances (deficit) - July 1 69,155 68,125 56,486 193,766
Fund Balances (deficit) - June 30 $ 217,747 $ 155,569 $ 42,736 $ 416,052
97

STATE OF CONNECTICUT
THIS PAGE LEFT INTENTIONALLY BLANK
98

STATE OF CONNECTICUT Enterprise Funds
Enterprise Funds are used to account for operations (a) that are financed and operated in a manner similar to private business enterprises - where the intent of the governing body is that the costs of providing goods or services to the general public on a continuing basis be financed or recovered primarily through user charges; or (b) where the governing body has decided that periodic determination of revenues earned, expenses incurred, and/or net income is appropriate for capital maintenance, public policy, management control, accountability, or other purposes. Significant Enterprise Funds of the State of Connecticut are described as follows:
Rental Housing Fund: The Rental Housing Fund is used to account for the financing of various housing programs offered by the State from bond proceeds and the retirement of such obligations. Revenue is received from interest earned on program loans and investment income.
Bradley International Airport: The airport is owned by the State of Connecticut and is operated by the Bureau of Aeronautics of the State of
Connecticut, Department of Transportation. In 1982, the State issued the Airport, 1982 series, Revenue Bonds in the aggregate principal amount of $100,000,000. The bonds were refunded in 1992 with the issuance of $94,065,000 in refunding bonds. The refunding bonds are secured by and payable solely from the gross operating revenues generated by the State from the operations of the Airport and other receipts, funds or monies pledged in the Indenture.
99

STATE OF CONNECTICUT Combining Balance Sheet Enterprise Funds June 30, 1996 (Expressed in Thousands)
Assets:
Rental Housing
Bradley International
Airport Other Total
Cash and Cash Equivalents $ 4,636 $ 11,313 $ 669 $ 16,618 Investments:
Other 52,920 52,920 Receivables:
Accounts, Net of Allowances 3,148 401 3,549 Loans, Net of Allowances 90,606 - 90,606 Interest 11,227 11,227
Receivable From Other Governments 3,588 3,588 Inventories and Prepaid Items - 91 272 363 Restricted Assets 48,872 - 48,872 Property, Plant & Equipment 16 137,486 49 137,551 Other Assets 1,740 1,740
Total Assets $ 159,405 $ 206,238 $ 1,391 $ 367,034
Liabilities and Equity: Liabilities: Accounts Payable and Accrued Liabilities $ 3,610 $ 4,989 $ 145 $ 8,744 Due to Other Funds 671 1,777 11 2,459 Deferred Revenue - 31 31 Revenue Bonds 123,630 90,540 214,170 Compensated Absences 1 68 69
Total Liabilities 127,912 97,306 255 225,473
Equity: Contributed Capital 101,059 350 101,409 Retained Earnings:
Reserved for Airport Operations - 22,329 22,329 Unreserved 31,493 (14,456) 786 17,823
Total Retained Earnings 31,493 7,873 786 40,152 Total Equity 31,493 108,932 1,136 141,561 Total Liabilities and Equity $ 159,405 $ 206,238 $ 1,391 $ 367,034
100

STATE OF CONNECTICUT Combining Statement of Revenues, Expenses and CI
hanges in Retained Earnings Enterprise Funds For The Fiscal Year Ended June 30, 1996 (Expressed in Thousands)
Bradley Rental International
Housing Airport Other Total
Operating Revenues: Charges for Services $ - $ 31,819 $ 2,140 $ 33,959 Interest on Financing Activities 3,350 3,350
Total Operating Revenues 3,350 31,819 2,140 37,309
Operating Expenses: Administrative 1,746 20,575 2,401 24,722 Depreciation and Amortization 4 7,751 7,755 Interest on Financing Activities 7,856 7,856
Total Operating Expenses 9,606 28,326 2,401 40,333
Operating Income (Loss) (6,256) 3,493 (261) (3,024)
Nonoperating Revenues (Expenses): Interest and Investment Income 4,627 3,513 8,140 Interest and Fiscal Charges (6,919) (6,919) Other (2,442) 2,981 539
Total Nonoperating Income (Expense) 2,185 (425) 1,760
Income (Loss) Before Operating Transfers (4,071) 3,068 (261) (1,264)
Operating Transfers In (Out): Operating Transfers In 4,892 Operating Transfers Out (822)
Net Income (Loss) (1 ) 3,068 Retained Earnings - July 1 31,494 4,805
Retained Earnings - June 30 $ 31,493 $ 7,873 $
4,892 (822)
(261) 2,806 1,047 37,346
786 $ 40,152
101

STATE OF CONNECTICUT Combining Statement of Cash Flows Enterprise Funds For The Fiscal Year Ended June 30, 1996 (Expressed in Thousands)
Cash Flows From Operating Activities:
Rental Housing
Bradley
International Airport Other Total
Operating Income (Loss) $ (6,256) $ 3,493 $ (261) $ (3,024)
Adjustments to reconcile operating income (loss) to net cash
provided by (used in) operating activities:
Amortization and Depreciation - 4 7,751 7,755
Provision for loan losses 417 417
Interest expense 7,856 7,856
Changes in assets and liabilities:
(Increase) decrease in receivables (235) (571) 208 (598)
(Increase) decrease in receivable from other governments 21 21
(Increase) decrease in inventories and prepaid items 18 (98) (80)
(Increase) decrease in accounts payable & accrued liabilities. 1,054 191 28 1,273
Increase (decrease) in due to other funds (1,198) 328 10 (860)
Miscellaneous operating activities 3 4,094 86 4,183 Collection of loans, notes & installment contracts receivable 2,248 - - 2,248
Net cash provided by (used in) operating activities 3,893 15,325 (27) 19,191
Cash Flows From Noncapital Financing Activities:
Retirement of bonds and notes payable (2,305) (2,305)
Interest on bonds and notes payable (8,039) (8,039)
Transfers from other funds 4,892 4,892 Transfers to other funds (822) (822)
Net cash provided by (used in) noncapital financing activities (6,274) (6,274)
Cash Flows From Capital And Related Financing Activities: Purchase of fixed assets (6,410) (6,410) Retirement of bonds payable (2,630) (2,630) Interest on bonds and notes payable (6,967) (6,967) Capital contributions or grants 1,871 1,871
Net cash provided by (used in) capital and related
financing activities (14,136) (14,136)
Cash Flows From Investing Activities: Proceeds from sale of investment securities
Purchase of investment securities (627) (627) Interest and income on investments 4,006 3,527 7,533
Net cash provided by (used in) investing activities 3,379 3,527 6,906
Increase (decrease) in cash 998 4,716 (27) 5,687 Cash and cash equivalents, July 1 3,638 45,448 696 49,782
Cash and cash equivalents, June 30 4,636 $ 50,164 $ 669 $ 55,469
102

STATE OF CONNECTICUT Internal Service Funds
Internal Service Funds are used to account for the financing of goods or services provided by one department or agency to other departments or agencies of the State, or to other governments, on a cost-reimbursement basis. The following operations are included in these funds:
Correction Industries: Administrative Services: to account for the revenues and expenses associated to account for the various activities of the Department with the sale of goods resulting from the industrial of Administrative Services including the purchasing of activities of the inmates at correctional institutions, supplies and data processing equipment for the State,
the operations of the motor pool, the operations of data processing services and certain other activities. Rev-enues consist of user charges to agencies.
103

STATE OF CONNECTICUT Combining Balance Sheet Internal Service Funds June 30, 1996
(Expressed in Thousands)
Assets:
Correction
Industries
Administrative
Services Total
Cash and Cash Equivalents $ 1,912 $ $ 1,912 Receivables:
Accounts, Net of Allowances 90 1,763 1,853 Due From Other Funds 231 3,918 4,149 Inventories and Prepaid Items 1,939 1,032 2,971 Property, Plant, and Equipment 733 46,460 47,193 Other Assets 1,215 1,215
Total Assets 4,905 $ 54,388 $ 59,293
Liabilities and Equity: Liabilities:
Accounts Payable and Accrued Liabilities $ 165 $ 3,372 $ 3,537 Due to Other Funds 7 10,986 10,993 Deferred Revenue 2,748 2,748 Compensated Absences 213 2,630 2,843
Total Liabilities 385 19,736 20,121
Equity: Contributed Capital 5,730 2,200 7,930 Retained Earnings: Unreserved (1,210) 32,452 31,242
Total Equity 4,520 34,652 39,172
Total Liabilities and Equity S 4,905 $ 54,388 $ 59,293
104

STATE OF CONNECTICUT Combining Statement of Revenues, Expenses, and Changes in Retained Earnings Internal Service Funds
For The Fiscal Year Ended June 30, 1996 (Expressed in Thousands)
Operating Revenues:
Correction Industries
Administrative Services Total
Charges for Services $ 3,990 $ 99,016 $ 103,006
Total Operating Revenues 3,990 99,016 103,006
Operating Expenses: Cost of Sales and Services 3,405 66,137 69,542 Administrative 616 12,898 13,514 Depreciation and Amortization - 16,010 16,010
Total Operating Expenses 4,021 95,045 99,066
Operating Income (Loss) (31) 3,971 3,940
Net Income (Loss) (31) 3,971 3,940 Retained Earnings - July 1 (1,179) 28,482 27,303
Retained Earnings - June 30 (1,210) $ 32,453 $ 31,243
105

STATE OF CONNECTICUT Combining Statement of Cash Flows Internal Service Funds For The Fiscal Year Ended June 30, 1996 (Expressed in Thousands)
Correction Industries
Administrative Services Total
Cash Flows From Operating Activities: Operating Income (Loss) (31) $ 3,971 $ 3,940 Adjustments to reconcile operating income to net cash
provided by (used in) operating activities: Amortization and Depreciation - 16,010 16,010 Changes in assets and liabilities:
(Increase) decrease in receivables 655 21 676 (Increase) decrease in due from other funds 1,370 1,179 2,549 (Increase) decrease in inventories and prepaid items 373 1,780 2,153 Increase (decrease) in accounts payable and accrued liabilities (191) (2,978) (3,169) Increase (decrease) in due to other funds 3 1,482 1,485
Miscellaneous operating activities (28) 224 196
Net cash provided by (used in) operating activities 2,151 21,689 23,840
Cash Flows From Capital And Related Financing Activities: Purchase of fixed assets (239) (21,689)- (21,928)
Net cash provided by (used in) capital and related financing activities (239) (21,689) (21,928)
Increase (decrease) in cash 1,912 1,912 Cash and cash equivalents, July 1
Cash and cash equivalents, June 30 1,912 $ S 1,912
106

STATE OF CONNECTICUT Fiduciary Funds
Trust and Agency Funds are maintained to account for assets held by the State in a trustee capacity or as an agent for individuals, private organizations or other funds. These Fiduciary Funds include expendable trust, non-expendable trust, pension trust, and agency funds. Significant Trust and Agency Funds of the State are described as follows:
Trust Funds Agency Funds Employment Security: Investment Pool/Non-State Portion: to account for the collection of unemployment insur- to account for the portion of Short Term Investment ance premiums from employers and the payment of Fund (STIF) that is made up of non-state monies. STIF unemployment benefits to eligible claimants, is made up of excess cash balances which can be added
or withdrawn on a daily basis. The fund's investments Second Injury and Compensation Assurance: consist primarily of short-term investments. an extension of the Worker's Compensation Act, the fund is currently used to pay claimants whose injuries Insurance Companies Securities: are made more severe because of a pre-existing condi- to account for securities that are deposited with the tion, and in cases where an injured worker receiving Treasurer to be held for policyholders of insurance worker's compensation subsequently undergoes an in- companies as a prerequisite to such companies trans- capacitating relapse. acting business in the State.
Soldiers, Sailors, and Marines: Deferred Compensation: to account for the principal and interest earned on to account for the investments accumulated in the investments of this fund. Interest earned has been State's IRC Section 457 deferred compensation plan. earmarked by the General Assembly for the benefit of resident veterans to provide such things as food, wear-ing apparel, medical or surgical aid, care and relief or funeral benefits.
Pension: See notes 9 and 10 for a description of the Pension Funds.
107
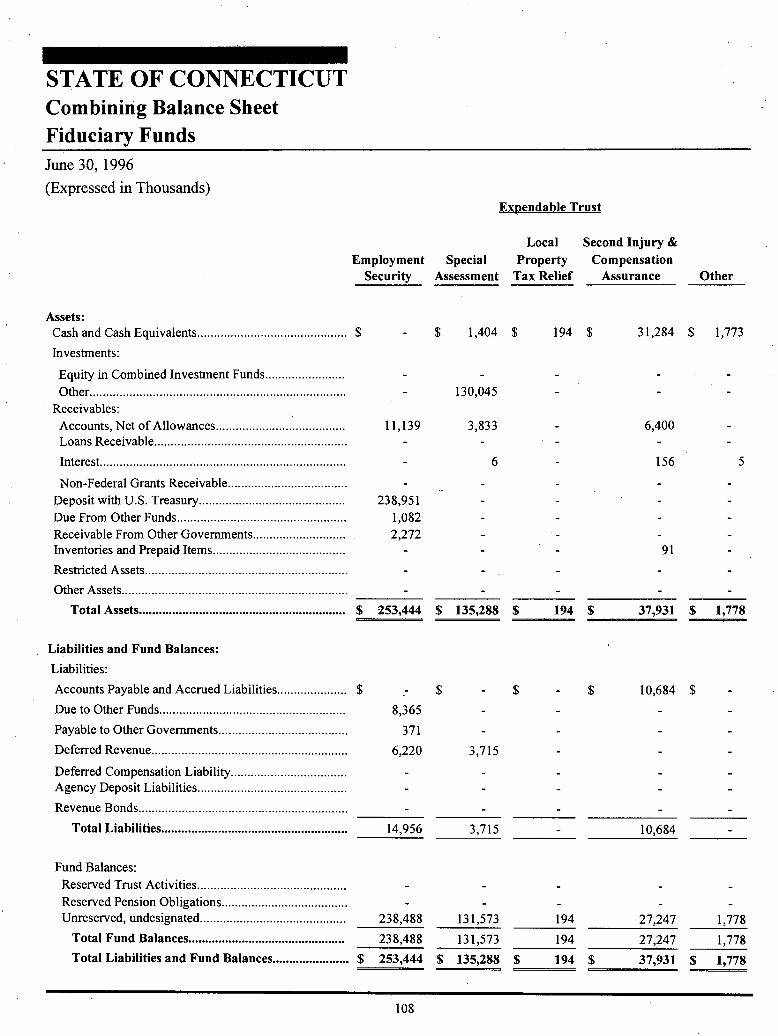
STATE OF CONNECTICUT Combining Balance Sheet Fiduciary Funds June 30, 1996
(Expressed in Thousands) Expendable Trust
Assets:
Employment Special Security Assessment
Local Property
Tax Relief
Second Injury & Compensation
Assurance Other
Cash and Cash Equivalents $ 1,404 $ 194 $ 31,284 $ 1,773
Investments:
Equity in Combined Investment Funds Other 130,045
Receivables: Accounts, Net of Allowances 11,139 3,833 6,400 Loans Receivable
Interest 6 156 5
Non-Federal Grants Receivable Deposit with U.S. Treasury 238,951 Due From Other Funds 1,082 Receivable From Other Governments 2,272 Inventories and Prepaid Items 91
Restricted Assets
Other Assets
Total Assets $ 253,444 $ 135,288 $ 194 $ 37,931 $ 1,778
Liabilities and Fund Balances:
Liabilities:
Accounts Payable and Accrued Liabilities - $ 10,684 $
Due to Other Funds 8,365
Payable to Other Governments 371
Deferred Revenue 6,220 3,715
Deferred Compensation Liability Agency Deposit Liabilities
Revenue Bonds
Total Liabilities 14,956 3,715 10,684
Fund Balances: Reserved Trust Activities Reserved Pension Obligations Unreserved, undesignated 238,488 131,573 194 27,247 1,778
Total Fund Balances 238,488 131,573 194 27,247 1,778 Total Liabilities and Fund Balances $ 253,444 $ 135,288 $ 194 $ 37,931 $ 1,778
108

Nonexpendable Trust
Clean Soldiers Water Sailors & Fund Marines Other Pension Agency Total
985 $ 3,319 $ 29,904 $ 796,658 $ 865,521
51,928 15,933 13,609,100 13,676,961 411,870 541,915
18,249 1,220 40,841 346,968 - 98 347,066
4,822 - 19 15,670 3,605 24,283
108 - 108 - 238,951
3 4,350 5,358 10,793 - - 4,280 17 6,569 _ 373 464
307,978 - 307,978
4,609 - 572,564 577,173
$ 665,470 $ 51,928 $ 19,274 $ 13,681,553 $ 1,791,763 $ 16,638,623
$ 7,816 $ - $ 66 $ 94 $ 6,372 $ 25,032
399 62 3,488 12,289 24,603
- - 371
- - - 9,935 _ 411,870 411,870
- - 1,361,232 1,361,232
393,026 - - 393,026
400,842 399 128 3,582 1,791,763 2,226,069
38,020 51,529 19,146 108,695
- - - 13,677,971 13,677,971 226,608 625,888
264,628 51,529 19,146 13,677,971 _ 1 14,412,554
$ 665,470 $ 51,928 $ 19,274 $ 13,681,553 $ 1,791,763 $ 16,638,623
109

STATE OF CONNECTICUT Combining Balance Sheet Pension Trust Funds June 30, 1996
(Expressed in Thousands)
Assets:
State Employees
State Teachers Judicial
Cash and Cash Equivalents $ $ 29,730 $ 14 Investments: - Equity in Combined Investment Funds 5,232,813 7,419,256 83,423 Receivables: Accounts, Net of Allowances 1,997 12,668 10 Interest 12,891 418 205
Due From Other Funds 4,350 - - Receivable From Other Governments - 4,280 -
Total Assets 5,252,051 $ 7,466,352 83,652
Liabilities and Equity: Liabilities: Accounts Payable and Accrued Liabilities 88 Due to Other Funds 2,466
Total Liabilities 2,554
Fund Balances: Reserved for Pension Obligations 5,249,497 7,466,352 83,652
Total Fund Balances 5,249,497 7,466,352 83,652
Total Liabilities and Fund Balances $ 5,252,051 $ 7,466,352 $ 83,652
110

Connecticut Municipal Employees Probate Judges Other Total
80 80 $ 29,904
826,941 46,104 563 13,609,100
3,572 2 18,249 2,034 120 2 15,670
- 4,350
- - 4,280
832,627 $ 46,226 $ 645 $ 13,681,553
6 94 1,022 3,488
1,028 3,582
832,627 45,198 645 13,677,971
832,627 45,198 645 13,677,971
832,627 46,226 645 $ 13,681,553
111

STATE OF CONNECTICUT Combining Balance Sheet Agency Funds June 30, 1996 (Expressed in Thousands)
Assets:
Payroll & Fringe Benefit
Clearing
Receipts Pending
Distribution
Investment Pool
Non-State Portion
Cash and Cash Equivalents 970 24,866 $ 678,285 Investments: Other
Receivables: Accounts, Net of Allowances 830 Loans Receivable Interest 3,270
Due From Other Funds 2,247 Receivable From Other Governments 17 Inventories and Prepaid Items Other Assets
Total Assets 3,217 25,713 $ 681,555
Liabilities: Accounts Payable and Accrued Liabilities $ $ 2,693 $ Due to Other Funds - 12,289 Deferred Compensation Liability -
Agency Deposit Liabilities 3,217 10,731 681,555
Total Liabilities $ 3,217 $ 25,713 $ 681,555
112

Insurance Companies' Securities
State Institution
Activity Deferred
Compensation Other Total
$ 18,783 $ 73,754 $ 796,658
411,870 411,870
378 12 1,220 98 98 47 288 3,605
3,111 5,358 17
373 373 570,879 1,685 572,564
570,879 21,364 411,870 $ 77,165 $ 1,791,763
$ 3,631 $ $ 48 $ 6,372 - 12,289
411,870 411,870
570,879 17,733 77,117 1,361,232
570,879 $ 21,364 411,870 $ 77,165 $ 1,791,763
$
113

STATE OF CONNECTICUT Combining Statement of Revenues, Expenditures and Changes in Fund Balances Expendable Trust Funds For The Fiscal Year Ended June 30, 1996 (Expressed in Thousands)
Revenues:
Employment Security
Special Assessment
Local Property Tax Relief
Unemployment Taxes 580,150 Licenses, Permits and Fees Investment Earnings 9,207 7,821 Assessments 107,260 Miscellaneous 418 4,964
Total Revenues 589,775 120,045
Expenditures: Current:
General Government Regulation and Protection 474,661
Debt Service: Principal Retirement 74,481 Interest and Fiscal Charges 41,799
Total Expenditures 474,661 116,280
Excess (Deficiency) of Revenues Over Expenditures 115,114 3,765
Other Financing Sources (Uses): Proceeds of Refunding Bonds 227,469 Payment for Current Refunding of Debt (227,469) Operating Transfers Out (3,193) (871)
Total Other Financing Sources (Uses) (3,193) (871)
Excess (Deficiency) of Revenues and Other Sources Over Expenditures and Other Uses 111,921 2,894
Fund Balances (deficit) - July 1 126,567 128,679 194
Fund Balances (deficit) - June 30 238,488 131,573 194
114

Second Injury & Compensation
Assurance Other Total
$ 580,150
73 73
1,365 613 19,006
146,490 253,750
4,948 25 10,355
152,803 711 863,334
9,428 9,428
112,290 618 587,569
74,481
41,799
121,718 618 713,277
31,085 93 150,057
227,469
(227,469)
(9) (4,073)
(9) (4,073)
31,085 84 145,984
(3,838) 1,694 253,296
27,247 1,778 $ 399,280
115

STATE OF CONNECTICUT Combining Statement of Revenues, Expenses, and Changes in Fund Balances Nonexpendable and Pension Trust Funds For The Fiscal Year Ended June 30, 1996 (Expressed in Thousands)
Operating Revenues: Participants' Contributions State Contribution
Clean Water Fund
Nonexpendable Trust
Total Nonexpendable
Soldiers, Sailors, & Marines Other
$ $ $ $
Investment Earnings 21,049 3,901 1,269 26,219 Intergovernmental 9,165 - 9,165 Miscellaneous 223 22 245
Total Operating Revenues 30,437 3,901 1,291 35,629
Operating Expenses: Administrative 1,008 1,008 Benefit Payments and Refunds - Other Program Expenses 980 980 Interest on financing activities 18,909 18,909
Total Operating Expenses 19,917 980 20,897
Operating Income (Loss) 10,520 3,901 311 14,732
Operating Transfers In (Out): Operating Transfers In 13,441 94 11 13,546 Operating Transfers Out (3,257) (391) (3,648)
Net Income (Loss) 23,961 738 (69) 24,630 Fund Balances - July 1 (as restated) 240,667 50,791 19,215 310,673
Fund Balances - June 30 $ 264,628 $ 51,529 $ 19,146 $ 335,303
116

Pension Trust
Connecticut State State Municipal Total
Employees Teachers Judicial Employees Probate Judges Other Pension
35,920 $ 162,688 $ 950 $ 32,279 $ 229 $ 34 $ 232,100 254,416 139,953 9,208 403,577 658,384 937,319 10,147 103,184 5,755 75 1,714,864
- - - - - 80,696 2,718 10 73 83,497
1,029,416 1,242,678 20,315 135,463 5,984 182 2,434,038
114 6 - - 120 423,299 439,212 9,489 36,794 1,533 43 910,370 , _ 25,655 354 26,009
423,413 464,867 9,495 36,794 1,887 43 936,499
606,003 777,811 10,820 98,669 4,097 139 1,497,539
703 703 (39) (5) (44)
605,964 777,811 10,820 98,664 4,800 139 1,498,198 4,643,533 6,688,541 72,832 733,963 40,398 506 12,179,773
5,249,497 $ 7,466,352 $ 83,652 $ 832,627 $ 45,198 $ 645 $ 13,677,971
117

STATE OF CONNECTICUT Combining Statement of Cash Flows Nonexpendable Trust Funds For The Fiscal Year Ended June 30, 1996 (Expressed in Thousands)
Cash Flows From Operating Activites:
Clean Water Fund
Soldiers, Sailors, & Marines Other Total
Operating Income (Loss) $ 10,520 $ 3,901 $ 311 $ 14,732
Adjustments to reconcile operating income to net cash provided by (used in) operating activities:
Investment Income (21,049) (3,901) (1,269) (26,219)
Interest Expense 18,909 - 18,909
Changes in assets and liabilities: (Increase) decrease in receivables (1,963) (1,963) (Increase) decrease in due from other funds - 4,054 4,054 Increase (decrease) in accounts payable and
accrued liabilities 1,223 - 66 1,289 Increase (decrease) in due to other funds (1,729) 62 (1,667)
Miscellaneous operating activities 2,526 (601) 1,925 Issuance of loans (33,712) - (33,712)
Net cash provided by (used in) operating activities (25,275) - 2,623 (22,652)
Cash Flows From Noncapital Financing Activities: Proceeds from sale of bonds 129,656 - 129,656 Retirement of bonds (55,615) (55,615) Interest on bonds (18,721) - (18,721) Transfer from other funds 13,441 94 11 13,546 Transfer to other funds (3,257) (392) (3,649)
Net cash provided by (used in) noncapital financing
activities 68,761 (3,163) (381) 65,217
Cash Flows From Investing Activities: Purchase of investment securties (57,131) (1,570) (58,701) Interest and income on investments 13,503 1,096 2,113 16,712
Net cash provided by (used in) investment activities (43,628) 1,096 543 (41,989)
Increase (decrease) in cash (142) (2,067) 2,785 576 Cash and cash equivalents, July 1 1,127 2,067 534 3,728
Cash and cash equivalents, June 30 985 $ $ 3,319 $ 4,304
118

STATE OF CONNECTICUT Combining Statement of Changes in Assets & Liabilities All Agency Fund June 30, 1996 (Expressed in Thousands)
Payroll and Fringe Benefit Clearing
Balance July 1, 1995 Additions Deletions
Balance June 30, 1996
ASSETS Cash and Cash Equivalents $ 895 $ 75 $ $ 970 Due From Other Funds $ 2,130 117 2,247
Total Assets $ 3,025 $ 192 $ $ 3,217
LIABILITIES Agency Deposit Liability 3,025 $ 192 $ 3,217
Total Liabilities 3,025 $ 192 $ 3,217
Receipts Pending Distribution ASSETS
Cash and Cash Equivalents $ 27,291 $ $ 2,425 $ 24,866 Accounts, Net of Allowances 829 1 830 Receivable From Other Governments 13 4 - 17
Total Assets $ 28,133 $ 5 $ 2,425 $ 25,713
LIABILITIES Accounts Payable and Accrued Liabilities $ 4,782 $ 256 $ 2,345 $ 2,693 Due to Other Funds 13,637 1,348 12,289 Agency Deposit Liability 9,714 2,959 1,942 10,731
Total Liabilities 28,133 $ 3,215 $ 5,635 $ 25,713
Investment Pool Non-State Portion ASSETS
Cash and Cash Equivalents $ 565,620 $ 132,439 $ 19,774 $ 678,285 Interest 3,091 3,270 3,091 3,270
Total Assets $ 568,711 $ 135,709 $ 22,865 $ 681,555
LIABILITIES Agency Deposit Liability 568,711 135,709 22,865 681,555
Total Liabilities $ 568,711 $ 135,709 $ 22,865 $ 681,555
continued on next page
119

STATE OF CONNECTICUT Combining Statement of Changes in Assets & Liabilities All Agency Funds (Continued) June 30, 1996 (Expressed in Thousands)
Insurance Companies' Securities
Balance July 1, 1995 Additions Deletions
Balance June 30, 1996
ASSETS Other Assets $ 632,137 $ 61,258 $ 570,879
Total Assets $ 632,137 $ 61,258 $ 570,879
LIABILITIES Agency Deposit Liability $ 632,137 $ 61,258 $ 570,879
Total Liabilities 632,137 $ 61,258 $ 570,879
State Institution Activity ASSETS
Cash and Cash Equivalents $ 14,506 $ 4,956 $ 679 $ 18,783 Accounts, Net of Allowances 655 277 378 Loans, Net of Allowances 78 20 _ 98 Interest 28 46 27 47 Inventories and Prepaid Items 713 340 373 Other Assets 1,602 83 - 1,685
Total Assets $ 17,582 $ 5,105 $ 1,323 $ 21,364
LIABILITIES Accounts Payable and Accrued Liabilities $ 850 $ 5,665 $ 2,884 $ 3,631 Agency Deposit Liability 16,732 3,063 2,062 17,733
Total Liabilities $ 17,582 $ 8,728 $ 4,946 $ 21,364
Deferred Compensation ASSETS
Investments $ 342,694 $ 69,176 $ 411,870
Total Assets $ 342,694 $ 69,176 $ 411,870
LIABILITIES Deferred Compensation Liability $ 342,694 $ 69,176 $ 411,870
Total Liabilities $ 342,694 $ 69,176 $ 411,870
120

STATE OF CONNECTICUT Combining Statement of Changes in Assets & Liabilities All Agency Funds (Continued) June 30, 1996 (Expressed in Thousands)
Other
Balance July 1, 1995 Additions Deletions
Balance June 30, 1996
ASSETS Cash and Cash Equivalents $ 80,433 $ 15,338 $ 22,017 $ 73,754 Accounts, Net of Allowances 12 - - 12 Interest 928 640 288 Due From Other Funds 4,062 3,111 4,062 3,111
Total Assets $ 85,435 $ 18,449 $ 26,714 $ 77,165
LIABILITIES Accounts Payable and Accrued Liabilities $ 2,697 $ - $ 2,649 $ 48 Agency Deposit Liability 82,738 18,087 23,708 77,117
Total Liabilities $ 85,435 $ 18,087 $ 26,357 $ 77,165
Totals - All Agency Funds ASSETS
Cash and Cash Equivalents $ 688,745 $ 152,808 $ 44,895 $ 796,658 Investments 342,694 69,176 - 411,870 Accounts, Net of Allowances 1,496 1 277 1,220 Loans, Net of Allowances 78 20 98 Interest 4,047 3,316 3,758 3,605 Due From Other Funds 6,192 3,228 4,062 5,358 Receivable From Other Governments 13 4 - 17 Inventories and Prepaid Items 713 340 373 Other Assets 633,739 83 61,258 572,564
Total Assets $ 1,677,717 $ 228,636 $ 114,590 $ 1,791,763
LIABILITIES Accounts Payable and Accrued Liabilities $ 8,329 $ 5,921 $ 7,878 $ 6,372
Due To Other Funds 13,637 1,348 12,289
Deferred Compensation Liability 342,694 69,176 - 411,870 Agency Deposit Liability 1,313,057 160,010 111,835 1,361,232
Total Liabilities $ 1,677,717 $ 235,107 $ 121,061 $ 1,791,763
121

STATE OF CONNECTICUT
THIS PAGE LEFT INTENTIONALLY BLANK
122

STATE OF CONNECTICUT General Fixed Assets Account Group
The General Fixed Assets Account Group is maintained to account for land, buildings, improvements, and equipment which are accounted for in the governmental type funds. Fixed Assets of the proprietary fund types and similar trusts and the Higher Education Funds are accounted for within those funds. Infrastructures, including highways, bridges, and rights-of-way are not capitalized.
The General Fixed Assets Account Group is stated at historical cost or estimated historical cost, with no provision made for depreciation.
123

STATE OF CONNECTICUT General Fixed Assets Account Group June 30, 1996 (Expressed in Thousands)
SCHEDULE OF GENERAL FIXED ASSETS BY SOURCE
General Fixed Assets: Land $ 324,447 Buildings 1,849,474 Improvements Other Than Buildings 201,836 Machinery and Equipment 940,858 Construction in Progress 186,156
Total General Fixed Assets 3,502,771
Investment in General Fixed Assets: Investment in Property Acquired Prior to jime 30, 1988-Source Unidentified $ 934,778 General Fund 153,771 Special Revenue Funds 315,430 Capital Project Funds 2,079,124 Other 19,668
Total Investment in General Fixed Assets $ 3,502,771
124

STATE OF CONNECTICUT peneral Fixed Assets Account Group lune 30, 1996 (Expressed in Thousands)
SCHEDULE OF GENERAL FIXED ASSETS BY FUNCTION
Function Land Buildings
Legislative $ - $ 154,364 General Government 15,376 184,476 Regulation and Protection 9,672 118,602 Conservation and Development 205,630 39,509 #ealth and Hospitals 8,091 155,994 Transportation 67,193 236,281 Human Services Education, Libraries and Museums 1,213 159,643 Corrections 10,842 683,933 Judicial 6,430 116,672
Total General Fixed Assets
Allocated to Functions $ 324,447 $ 1,849,474
Construction in Progress
Total General Fixed Assets
Improvements Equipment Totals
$ 17,726 $ 172,090 3,808 58,778 262,438 8,440 96,797 233,511
13,412 30,144 288,695 25,701 27,306 217,092 87,217 450,052 840,743
6,035 6,035 21,146 176,583 358,585 41,016 34,181 769,972
1,096 43,256 167,454
$ 201,836 $ 940,858 $ 3,316,615
186,156
$ 3,502,771
SCHEDULE OF CHANGES IN GENERAL FIXED ASSETS BY FUNCTION
Function
Legislative General Government Regulation and Protection
onservation and Development ealth and Hospitals
Transportation uman Services ducation, Libraries and Museums
Corrections Judicial Construction in Progress
Total General Fixed Assets
$ 3,581,982
Additions Deletions
General Fixed Assets 6/30/96
615 110 $ 172,090 49,489 25,910 262,438 34,461 11,167 233,511
5,106 2,269 288,695 32,596 46,277 217,092 39,143 27,712 840,743
588 2,875 6,035 13,715 14,196 358,585 87,149 10,669 769,972 12,899 2,895 167,454
118,139 329,031 186,156
$ 393,900 $ 473,111 $ 3,502,771
General Fixed Assets 7/1/95
$ 171,585 238,859 210,217 285,858 230,773 829,312
8,322 359,066 693,492 157,450 397,048
125

STATE OF CONNECTICUT
THIS PAGE LEFT INTENTIONALLY BLANK
126

STATE OF CONNECTICUT Higher Education and University Hospital Funds
Higher Education and University Hospital Funds are used to account for all transactions relating to public institutions of higher education including a teaching hospital and affiliated organization. Higher Education institutions include five universities and twelve community-technical colleges. The following university and college funds and affiliated organization are used:
Current Unrestricted Fund: accounts for currently expendable resources which may be either designated or not designated by the colleges and universities for specific purposes.
Current Restricted Fund: accounts for resources restricted by the donor or exter-nal agency for a specific use or program.
Hospital Funds: accounts for revenues and expenditures relating to the operation of the John Dempsey Hospital and the Dental Clinics.
Loan Funds: accounts for loans made to assist students in the financ-ing of their education.
Endowment Funds: accounts for resources which are restricted by the gift instruments requiring that the principal be invested and only the income be expended.
Agency Funds: accounts for amounts held in custody for students, university-related organizations, and others.
Plant Funds: accounts for activities relating to institutional proper-ties. These activities include funds used for the acqui-sition, renewal, and replacement of institutional prop-erties, funds set aside for debt service requirements of institutional properties, and funds invested in institu-tional properties.
Affiliated Organization: accounts for the financial activities of the University of Connecticut Foundation, Inc., a component unit of the University of Connecticut.
127

STATE OF CONNECTICUT Combining Balance Sheet Higher Education and University Hospital Fund June 30, 1996 (Expressed in Thousands)
Current Funds Hospital
Funds
Endowment
and
Similar Funds Unrestricted Restricted
Assets: Cash and Cash Equivalents 139,248 $ 13,109 $ 38,705 $ 2,329 Investments: Equity in Combined Investment Funds 383 Other 387 1,433 2,435
Receivables: Accounts, Net of Allowances 19,614 21,121 26,259 8 Tuition 447 Loans, Net of Allowances Interest
Due From Other Funds 57,062 24 1,402 Due From Component Units Inventories and Prepaid Items 7,292 1,941 Property, Plant & Equipment Other Assets 2,245
Total Assets 226,295 $ 34,254 $ 69,740 $ 5,155
Liabilities and Equity: Liabilities: Accounts Payable and Accrued Liabilities 76,163 $ 5,434 $ 18,516 $ Due to Other Funds 3,813 1,576 3,562 1
Due to Component Units Deferred Revenue 28,428 150 92 Notes and Loans Payable Agency Deposit Liabilities Revenue Bonds Compensated Absences 43,771 5,128 Malpractice Liability 8,633
Total Liabilities 152,175 7,160 35,931 1
Equity: Investment in Fixed Assets
Fund Balances: Reserved:
Retirement of Indebtedness Other 27,094 5,154
Unreserved, undesignated: Unexpended Plant Other 74,120 33,809
Total Equity 74,120 27,094 33,809 5,154 Total Liabilities and Equity 226,295 $ 34,254 $ 69,740 $ 5,155
128

Loan
Funds
Agency
Funds Plant Funds
Affiliated
Organization Total
2,656 $ 7,184 $ 61,982 $ 317 $ 265,530
383 75,482 79,737
98 27 7,727 74,854 447
29,264 41 29,305 170 12 182
10 6,882 65,380 45,237 45,237
9,233 410 1,692,763 376 1,693,549
6 458 453 815 3,977
32,096 $ 8,213 $ 1,807,344 $ 84,717 $ 2,267,814
35 $ 163 $ 8,845 $ 2,006 $ 111,162
41 8,993
44,580 44,580 38 28,708
5,626 50 5,676 8,012 - 8,012
98,654 98,654 _ - _ 48,899
8,633
35 8,213 157,746 2,056 363,317
1,589,606 1,589,606
7,072 7,072 32,061 79,106 143,415
52,920 52,920 3,555 111,484
32,061 1,649,598 82,661 1,904,497
32,096 $ 8,213 $ 1,807,344 $ 84,717 $ 2,267,814
$
129

STATE OF CONNECTICUT
THIS PAGE LEFT INTENTIONALLY BLANK
130

STATE OF CONNECTICUT Component Units
The Component Units are organizations which are legally separate from the State of Connecticut for which the State is financially accountable. The Component Units of the State of Connecticut are described as follows:
Connecticut Development Authority: the Connecticut Development Authority is a public instrumentality and political subdivision of the State. The Authority was created to stimulate industrial and commercial development within the State through its Self-Sustaining Bond Program, its Umbrella Program and its Insurance Program.
Connecticut Housing Finance Authority: the Connecticut Housing Finance Authority is a public instrumentality and political subdivision of the State created for the purpose of increasing the housing sup-ply and encouraging and assisting in the purchase, development and construction of housing for low and moderate income families throughout the State.
Connecticut Resources Recovery Authority: the Connecticut Resources Recovery Authority is a public instrumentality and political subdivision of the State. The Authority is responsible for implementing the State's solid waste management plan, which in-cludes design, construction and operation of resources recovery facilities and the marketing of recovered products.
Connecticut Higher Education Supplemental Loan Authority: the Connecticut Higher Education Supplemental Loan Authority is a public instrumentality and political subdivision of the State. The Authority was created to assist students, their parents and institutions of higher education to finance the cost ofhigher education through its bond funds.
Connecticut Health and Educational Facilities Authority: the Connecticut Health and Educational Facilities Au-thority is a public instrumentality and political subdi-vision of the State. The Authority was created to assist certain health care institutions, institutions of higher education, and qualified for-profit and not-for-profit institutions in the financing and refinancing of projects to be undertaken in relation to programs for these institutions.
Connecticut Innovations, Incorporated: Connecticut Innovations is a public instrumentality and political subdivision of the State. It was estab-lished to stimulate and promote technological innova-tion and application of technology within Connecticut by providing financial technical assistance.
131

STATE OF CONNECTICUT Combining Balance Sheet Component Units June 30, 1996 (Expressed in Thousands)
Connecticut Development
Authority
Connecticut Housing Finance
Authority (12-31-95)
Connecticut Resources Recovery Authority
Assets: Cash and Cash Equivalents 51,154 $ 16,455 $ 27,873 Investments: Other 27,882 545,294
Receivables: Accounts, Net of Allowances 12,492 Loans, Net of Allowances 175,988 2,261,776 15,667 Interest 2,962 25,112 12,650
Due From Primary Government 10,540 Inventories and Prepaid Items 1,922 Restricted Assets 313,373 103,572 Property, Plant, & Equipment 16,655 2,628 241,569 Other Assets 9,989 58,743 16,895
Total Assets 297,092 $ 3,223,381 $ 430,718
Lialibilities and Equity: Liabilities: Accounts Payable and Accrued Liabilities 10,095 $ 34,112 $ 18,466 Due to Primary Government Deferred Revenue 4,793 Escrow Deposits 45 93,681 Revenue Bonds 142,260 2,745,482 367,634 Liability for Landfill Closure Costs 15,513 Amount Held for Institutions
Total Liabilities 157,193 2,873,275 401,613
Equity: Contributed Capital 150,340 2,275 Retained Earnings: Reserved for Housing Financing 350,106 Reserved for Resources Recovery 16,265 Unreserved (10,441) 10,565
Total Retained Earnings (10,441) 350,106 26,830
Total Equity 139,899 350,106 29,105 Total Liabilities and Equity 297,092 $ 3,223,381 $ 430,718
132

Connecticut
Higher Connecticut Education Health
Supplemental & Educational Connecticut
Loan Facilities Innovations, Authority Authority Incorporated
Total
3,641 3 28,768 $ 127,894
8,320 11,207 15,025 607,728
105 269 12,866 57,783 6,376 2,517,590
523 106 - 41,353 44,580 860 55,980
65 27 2,014 6,061 2,585,987 3,008,993
177 215 261,244 1,048 86,675
77,376 $ 2,642,230 51,540 $ 6,722,337
726 $ 62,760 $ 448 $ 126,607 - 45,237 - 45,237
2,012 263 7,068 93,726
74,100 2,163,450 5,492,926 - 15,513 - 359,441 - 359,441
76,838 2,630,888 711 6,140,518
70,892 223,507
350,106 16,265
538 11,342 (20,063) (8,059)
538 11,342 (20,063) 358,312
538 11,342 50,829 581,819
77,376 $ 2,642,230 51,540 6,722,337
$
133

STATE OF CONNECTICUT Combining Statement of Revenues, Expenses, and Changes in Retained Earnings Component Units June 30, 1996 (Expressed in Thousands)
Connecticut Housing Connecticut
Connecticut Finance Resources Development Authority Recovery
Authority (12-31-95) Authority
Operating Revenues: Charges for Services $ 1,941 $ - $ 136,839 Interest on Financing Activities 12,231 170,636 -
Civic Center Lease Operations 6,424 - Miscellaneous 401 8,788 8,611
Total Operating Revenues 20,997 179,424 145,450
Operating Expenses: Administrative 4,531 19,950 98,502 Depreciation and Amoritization 508 5,397 17,287
Other Program Expenses 430 17,229 3,090 'Interest on Financing Activities 7,610 174,752 - Civic Center Lease Operations 7,806 - Arbitrage Rebate 1,194
Total Operating Expenses 20,885 218,522 118,879
Operating Income (Loss) 112 (39,098) 26,571
Nonoperating Revenues (Expenses): Interest and Investment Income 3,362 48,996 6,018 Interest and Fiscal Charges (24,531) Other (3,249) (379) 4,727 Sale of Foreclosed Real Estate 4,847
Total Nonoperating Income (Expense) 113 53,464 (13,786)
Net Income (Loss) 225 14,366 12,785
Add Items Affecting Contributed Capital:
Depreciation on Equipment Acquired through Capital Grants 168
Total Add Back Items 168
Retained Earnings-July 1 (10,666) 335,740 13,877
Retained Earnings-June 30 (10,441) $ 350,106 $ 26,830
134

Connecticut
Higher Connecticut Education Health &
Supplemental Educational Connecticut
Loan Facilities Innovations, Authority Authority Incorporated
Total
$ $ 39 $ 138,819
5,392 117,743 2,508 308,510
- - 6,424 583 2,290 2,705 23,378
5,975 120,033 5,252 477,131
1,059 1,393 2,780 128,215
148 45 82 23,467
736 681 2,525 24,691
4,939 117,743 - 305,044
- - 7,806 1,194
6,882 119,862 5,387 490,417
(907) 171 (135) (13,286)
1,292 609 1,842 62,119
(24,531)
9 (376) 732 4,847
1,292 618 1,466 43,167
385 789 1,331 29,881
168
168
153 10,553 (21,394) 328,263
538 11,342 (20,063) $ 358,312
135

STATE OF CONNECTICUT Combining Statement of Cash Flows Component Units For The Fiscal Year Ended June 30, 1996 (Expressed in Thousands)
Connecticut Development
Authority
Connecticut Housing Finance
Authority (12-31-95)
Connecticut Resources Recovery Authority
Cash Flows From Operating Activities: Operating Income (Loss) $ 112 $ (39,098) S 26,571
Adjustments to reconcile operating income (loss) to net cash provided by (used in) operating activities:
Amortization and Depreciation 1,466 5,397 17,287
Provision for loan losses 48 10,565 50
Interest expense 9,036 174,752 Changes in assets and liabilities:
.(Increase) decrease in receivables 318 (2,310) 743 (Increase) decrease in due from other funds (1,074) 2,628
(Increase) decrease in inventories and prepaid expenses - 1,631 2,641 Increase (decrease) in accounts payable & accrued liabilities (1,109) (1,713) (7,242)
Increase (decrease) in due to other funds - (2,628) Miscellaneous operating activities (338) 11,385 8,013 Issuance of loans, notes & installment contracts receivable (27,149) (437,869) - Collection of loans, notes & installment contracts receivable 28,100 188,439
Net cash provided by (used in) operating activities 9,410 (88,821) 48,063
Cash Flows From Noncapital Financing Activities: Contributed capital Proceeds from sale of bonds and notes 6,890 499,450 Retirement of bonds and notes payable (17,665) (452,210) Interest on bonds and notes payable (8,920) (179,605) Bond issuance and/or redemption costs (8,549) Miscellaneous noncapital financing activities-Additions 20,917 Miscellaneous noncapital financing activities-Deletions (173)
Net cash provided by (used in) noncapital financing activities . (19,695) (119,997) (173)
Cash Flows From Capital And Related Financing Activities: Purchase of fixed assets (3,348) (6,104) Proceeds from sale of bonds and notes Retirement of bonds and notes payable (23,473) Interest on bonds and notes payable (24,782) Miscellaneous capital and related financing activities-Additions 653 Miscellaneous capital and related financing activities-Deletions
Net cash provided by (used in) capital and related
financing activities (3,348) (53,706)
Cash Flows From Investing Activities: Proceeds from sales of investment securities 12,090 447,915 3,945 Purchases of investment securities (10,556) (285,582) (68) Interest and income on investments 4,152 42,191 6,169 Reduction in loan receivable - 8,708
Net cash provided by (used in) investing activities 5,686 204,524 18,754 Increase (decrease) in cash (7,947) (4,294) 12,938 Cash and cash equivalents, July 1 59,101 20,749 94,057 Cash and cash equivalents, June 30 $ 51,154 $ 16,455 $ 106,995
136

Connecticut Connecticut
Higher Health &
Education Educational Connecticut
Supplemental Facilities Innovations, Loan Authority Authority Incorporated
Total
(907) 171 (135) S (13,286)
148 45 82 24,425 566 11,229
4,939 188,727
20 (82) (103) (1,414) 3 (182) 1,375
- 11 6 4,289 (21) 179 36 (9,870)
(3) (2,631) - 617 1 19,678
(10,586) (195,536) (3,320) (674,460) 4,258 34,330 3,179 258,306
(1,583) (160,265) (436) (193,632)
4,752 4,752 506,340
(3,970) (473,845) (4,970) (193,495)
(8,549) 20,917
(173)
(8,940) 4,752 (144,053)
(18) (26) (9,496) 354,874 354,874
(104,602) (128,075) (113,019) (137,801) 106,100 106,753
(40) (40)
243,335 (66) 186,215
9,713 620,820 6,824 1,101,307
(735,386) (1,742) (1,033,334)
1,319 18,469 1,615 73,915 _ - 8,708
11,032 (96,097) 6,697 150,596
509 (13,027) 10,947 (874) 3,132 65,975 17,821 260,835
3,641 52,948 S 28,768 S 259,961
137

STATE OF CONNECTICUT
THIS PAGE LEFT INTENTIONALLY BLANK
138

139

STATE OF CONNECTICUT General Governmental Expenditures By Function Last Ten Fiscal Years
(Expressed in Thousands)
SOURCE (1) 1987 1988 (3)
1990 Legislative $ 22,912 $ 27,419 $ 38,453 $ 40,748 General Government 442,150 466,452 1,056,167 1,143,948 Regulation and Protection 236,409 251,099 312,359 313,466 Conservation and Development 89,409 83,282 133,746 163,589 Health and Hospitals 511,863 587,700 802,655 845,026 Transportation 304,110 322,876 421,240 432,350 Human Services 1,177,226 1,262,257 1,488,276 1,780,134
Education, Libraries, and Museum 1,414,218 (2) 1,635,888 (2) 2,061,221 (2) 2,220,106 (2)
Corrections 219,901 250,366 358,188 423,239 Judicial 102,709 110,184 160,821 173,594 Nonfunctional 562,541 613,773 Federal and Other Grants 463,386 (2) 420,533 (2) 561,107 (2) 533,033 (2) Debt Service 335,095 340,518 384,730 464,586
Total Expenditures $ 5,881,929 $ 6,372,347 $ 7,778,963 8,533,819
Includes General, Special Revenue, and Debt Service Funds. Includes Higher Education Expenditures Treated as Operating Transfers from the State's General Fund. Beginning in 1989, Nonfunctional Expenditures were Reclassified to the Proper Function of Government.
Revenues by Source Last Ten Fiscal Years (Expressed in Thousands)
'SOURCE (1) 1987 1988 1989 1990 Taxes $ 4,024,113 $ 4,079,663 $ 4,565,136 $ 4,961,739 Licenses, Permits, and Fees 289,912 320,441 330,802 380,011 Intergovernmental 1,080,103 1,159,223 1,331,263 1,479,412 Charges for Services 375,863 382,915 65,051 59,863 Fines, Forfeits, and Rents 20,881 12,866 25,177 44,178 Investment Earnings 38,763 38,824 44,727 45,579 Lottery 697,672 718,473 Miscellaneous 108,709 125,591 115,543 145,004
Total Revenues $ 5,938,344 $ 6,119,523 $ 7,175,371 $ 7,834,259
(I) Includes General, Special Revenue, and Debt Service Funds. NOTE: Beginning in 1989 Lottery revenues have been split from Charges for Services and are
reported at gross proceeds.
SOURCE: Combined Statement of Revenues, Expenditures, and Changes in Fund Balances
140

1991 1992 1993 1994 1925 1996 $ 41,798 38,057 44,040 45,820 46,618 47,422
1,020,494 996,980 1,055,645 1,033,897 1,109,507 1,182,673 322,473 316,333 348,787 395,662 397,131 415,308 191,727 203,926 232,130 227,024 263,748 221,383 907,938 862,534 749,402 757,731 793,447 826,501 396,077 337,467 381,135 350,413 352,160 358,144
2,130,706 2,278,812 2,639,093 2,916,838 3,395,130 3,450,082 2,144,504 (2) 2,216,166 (2) 2,113,031 (2) 2,258,516 (2) 2,339,278 (2) 2,420,982
499,079 509,268 620,821 737,946 800,822 846,305 189,774 213,602 207,803 229,108 241,690 271,571
538,069 (2) 791,892 (2) 1,068,775 1,008,904 922,518 875,430 547,505 776,274 1,033,014 972,368 1,262,425 1,305,017
8,930,144 $ 9,541,311 $ 10,493,676 $ 10,934,227 $ 11,924,474 $ 12,220,818
1991 1992 1993 1994 1995 1996 4,639,536 $ 5,596,447 $ 6,140,718 $ 6,436,828 $ 6,822,277 $ 7,339,263
365,780 372,146 398,979 425,480 418,660 429,803 1,688,731 2,135,220 2,616,995 2,641,448 2,734,163 2,830,481
61,153 62,364 88,852 176,757 201,434 211,829 21,811 27,151 35,843 33,226 37,145 25,359 69,715 65,284 75,141 62,218 74,574 73,235
731,095 709,423 692,528 552,992 670,801 706,860 144,715 172,494 156,391 262,590 228,624 192,358
$ 7,722,536 $ 9,140,529 $ 10,205,447 $ 10,591,539 $ 11,187,678 $ 11,809,188
(2)
141

STATE OF CONNECTICUT Computation of Legal Debt Margin July 1, 1996
(Expressed in Thousands)
Estimated General Fund Tax Receipts for the Fiscal Year Ending June 30, 1996 $ 6,584,300 Factor 1.6
Statutory Debt Limit for Debt Incurred 10,534,880
Less: Authorized Bonds, Notes, and Other Obligations subject to certain limitations. 8,749,765
Legal Debt Margin $ 1,785,115
SOURCE: State of Connecticut General Obligation Bonds Offering Statement
Dated November 1, 1996.
Net General Long-Term Bonded Debt Per Capita Last Ten Fiscal Years
(Thousands)
YEAR POPULATION TOTAL DEBT
GENERAL LONG-TERM DEBT
NET DEBT
PER CAPITA
LESS DEBT
SERVICE FUND NET 1987 3,247 $2,049,465 $56,055 $1,993,410 $614 1988 3,272 2,394,513 159,802 2,234,711 683 1989 3,283 3,232,491 209,175 3,023,316 919 1990 3,289 4,249,439 291,621 3,957,818 1,204 1991 3,291 5,650,182 349,206 5,300,976 1,611 1992 3,279 6,503,455 388,425 6,115,030 1,865 1993 3,278 7,385,997 432,522 6,953,475 2,122 1994 3,275 7,927,705 489,584 7,438,121 2,271 1995 3,275 8,516,066 420,163 8,095,903 2,472 1996 3,275 9,200,672 455,740 8,744,932 2,670
SOURCES: U.S. Census Bureau
Combined Balance Sheet
142

STATE OF CONNECTICUT Ratio of Annual Debt Service General Bonded Debt To Total General Expenditures Last Ten Fiscal Years
(Expressed in Thousands)
YEAR PRINCIPAL INTEREST
TOTAL DEBT
SERVICE
(1)
TOTAL
GENERAL
EXPENDITURES
RATIO OF DEBT SERVICE TO
TOTAL GENERAL
EXPENDITURES 1987 $180,685 $154,410 $335,095 $5,881,929 5.7%
1988 179,950 160,568 340,518 6,372,347 5.3%
1989 201,203 183,527 384,730 7,778,963 4.9%
1990 230,876 233,710 464,586 8,533,819 5.4%
1991 248,544 298,961 547,505 8,930,144 6.1%
1992 312,571 378,214 690,785 9,541,311 7.2%
1993 362,356 398,550 760,906 10,493,676 7.3%
1994 404,921 387,722 792,643 10,934,227 7.2%
1995 560,746 438,172 998,918 11,924,474 8.4%
1996 523,090 448,880 971,970 12,220,818 8.0%
(1) Includes General, Special Revenue, and Debt Service Funds, also included are
Higher Education Expenditures Treated as Operating Transfers from the State's General fund.
Note: Beginning in 1992, principal and interest amounts do not include amounts expended for General
Obligation Notes.
SOURCE: Combined Statement of Revenues, Expenditures, and Changes in Fund Balances
143

FOR THE YEAR ENDED JUNE 30,
GROSS REVENUES(1)
DIRECT OPERATING EXPENSES (2)
NET REVENUE AVAILABLE FOR DEBT SERVICE
DEBT SERVICE REQUIREMENTS
PRINCIPAL INTEREST TOTAL COVERAGE
STATE OF CONNECTICUT Revenue Bond Coverage Rental Housing Last Ten Fiscal Years (Expressed in Thousands)
GROSS RECIEPTS USED DIRECT
FOR THE YEAR FOR DEBT OPERATING ENDED JUNE 30., SERVICES (1) EXPENSES (2)
NET REVENUE AVAILABLE FOR DEBT SERVICE
DEBT SERVICE REQUIREMENTS
PRINCIPAL INTEREST TOTAL COVERAGE 1987 $11,379 $2,257 $9,122 $2,450 $6,293 $8,743 1.04 1988 7,985 2,483 5,502 5,950 6,090 12,040 0.46 1989 13,206 3,210 9,996 1,550 7,480 9,030 1.11
1990 16,106 4,205 11,901 1,550 8,694 10,244 1.16 1991 18,113 3,234 14,879 1,550 11,360 12,910 1.15 1992 10,071 1,267 8,804 1,550 8,562 10,112 0.87 1993 17,163 1,585 15,578 1,000 7,805 8,805 1.77 1994 16,102 16,102 2,038 12,991 15,029 1.07 1995 14,012 61 13,951 1,052 8,310 9,362 _1.49 1996 10,225 1,329 8,896 2,305 7,856 10,161 0.88
Includes Operating and Non-Operating Revenues and Principal Collections. Includes Operating Expenses Less Depreciation, Amortization, Interest Expenses, and Provision for Loan Losses.
SOURCES: Combining Statement of Revenues, Expenses, and Changes in Retained Earnings Combining Statement of Cash Flows
Bradley International Airport Last Ten Fiscal Years (Expressed in Thousands)
1987 $22,074 $12,100 $9,974 $- $9,242 $9,242 1.08 1988 25,619 13,487 12,132 10,283 10,283 1.18 1989 32,049 14,395 17,654 995 10,093 11,088 1.59 1990 37,000 15,711 21,289 1,075 10,250 11,325 1.88 1991 33,589 16,312 17,277 1,175 10,305 11,480 1.50 1992 31,307 16,675 14,632 1,285 10,384 11,669 1.25 1993 30,399 17,859 12,540 1,405 8,157 9,562 1.31 1994 34,355 18,966 15,389 2,295 7,275 9,570 1.61 1995 40,217 18,757 21,460 2,455 7,104 9,559 2.25 1996 38,313 20,575 17,738 2,630 6,919 9,549 1.86
Includes Operating and Non-Operating Revenues. Includes Operating Expenses Less Depreciation, & Interest Expenses.
SOURCES: Bradley International Airport Financial Statements
144

STATE OF CONNNECTICUT Revenue Bond Coverage Connecticut Development Authority Last Ten Fiscal Years (Expressed in Thousands)
FOR THE YEAR ENDED JUNE 30,
GROSS RECEIPTS USED
FOR DEBT SERVICES(1)
DIRECT OPERATING EXPENSES(2)
AVAILABLE FOR DEBT SERVICE
DEBT SERVICE REQUIREMENTS PRINCIPAL INTEREST TOTAL COVERAGE
1987 $253,375 $1,901 1988 272,954 2,034 1989 341,359 2,494 1990 236,158 2,880 1991 308,592 8,812 1992(3) 32,205 8,068 1993 39,344 9,678 1994 54,748 16,584 1995 55,459 11,365 1996 52,459 12,767
$251,474 $103,157 $135,561 $238,718 1.05 270,920 122,331 137,169 259,500 1.04 338,865 192,285 139,536 331,821 1.02 233,278 83,363 144,287 227,650 1.02 299,780 177,784 122,300 300,084 1.00
24,137 7,340 15,651 22,991 1.05 29,666 14,300 10,988 25,288 1.17 38,164 30,606 6,424 37,030 1.03 44,094 41,715 9,221 50,936 0.87 39,692 17,665 7,610 25,275 1.57
Includes Operating and Non-Operating Revenues and Principal Collected on Loans. Includes Operating Expenses Less Depreciation, Amortization, and Interest Expenses. Beginning in 1992, the Authority no longer includes the assets and liabilities of its Self-Sustaining Bond Program in its financial statements. See Notel5b.
SOURCE: Connecticut Development Authority Financial Statements
Connecticut Housing Finance Authority Last Ten Fiscal Years (Expressed in Thousands)
GROSS RECIEPTS USED
FOR THE YEAR FOR DEBT ENDED DEC. 31., SERVICES (1)
DIRECT OPERATING EXPENSES (2)
NET REVENUE AVAILABLE DEBT SERVICE REQUIREMENTS FOR DEBT SERVICE PRINCIPAL INTEREST TOTAL COVERAGE
1986 $482,135 $11,719 $470,416 $222,425 $190,105 $412,530 1.14 1987 451,530 11,282 440,248 241,835 179,003 420,838 1.05 1988 367,793 15,444 352,349 140,915 175,957 316,872 1.11 1989 362,041 23,911 338,130 105,335 190,882 296,217 1.14 1990 382,364 40,999 341,365 260,750 202,547 463,297 0.74
1991 385,139 34,819 350,320 103,405 207,415 310,820 1.13
1992 456,281 28,61f 427,670 455,505 206,268 661,773 0.65
1993 556,670 42,778 513,892 544,375 192,589 736,964 0.70
1994 483,683 30,910 452,773 622,215 173,843 796,058 0.57
1995 421,706 38,373 383,333 452,210 174,752 626,962 0.61
Includes Operating and Non-Operating Revenues and Principal Collected on Loans. Includes Operating Expenses Less Depreciation, Amortization, and Interest Expenses
SOURCE: Connecticut Housing Finance Authority Financial Statements.
145

FOR THE YEAR ENDED JUNE 30,
GROSS REVENUES(1)
DIRECT OPERATING EXPENSES (2)
NET REVENUE AVAILABLE FOR DEBT SERVICE
DEBT SERVICE REQUIREMENTS
TOTAL COVERAGE PRINCIPAL INTEREST
FOR THE YEAR ENDED JUNE 30,
GROSS REVENUES(1)
DIRECT OPERATING EXPENSES (21
NET REVENUE AVAILABLE FOR DEBT SERVICE
DEBT SERVICE REQUIREMENTS
TOTAL COVERAGE PRINCIPAL INTEREST
STATE OF CONNECTICUT Revenue Bond Coverage Connecticut Higher Education Supplemental Loan Authority Last Three Fiscal Years (Expressed in Thousands)
1994 $8,778 $1,083 $7,695 $5,630 $3,858 $9,488 0.81
1995 10,511 1,509 9,002 2,940 5,097 8,037 1.12
1996 11,525 1,795 9,730 3,970 4,939 8,909 1.09
Includes Operating and Non-Operating Revenues and Principal Collections. Includes Operating Expenses Less Depreciation, Amortization and Interest Expenses.
SOURCE: Connecticut Higher Education Suplemental Loan Authority Financial Statements
Connecticut Health and Educational Facilities Authority Last Three Fiscal Years (Expressed in Thousands)
1994 $180,915 $1,854 $179,061 $161,640 $84,867 $246,507 0:73
1995 148,045 1,716 146,329 36,257 108,203 144,460 1.01 1996 154,981 2,074 152,907 60,869 117,743 178,612 0.86
Includes Operating and Non-Operating Revenues and Principal Collections. Includes Operating Expenses Less Depreciation, Amortization and Interest Expenses.
SOURCE: Connecticut Health and Educational Facilities Authority Financial Statements
146

DEBT SERVICE REQUIREMENTS
PRINCIPAL INTEREST TOTAL COVERAGE $3,164 $27,766 $30,930 0.93
6,531 27,700 34,231 1.18 10,989 28,778 39,767 0.96 12,198 27,650 39,848 0.90 16,029 26,534 42,563 0.72 17,790 26,415 44,205 1.12 28,983 25,667 54,650 1.01 23,473 24,531 48,004 1.04
STATE OF CONNECTICUT Revenue Bond Coverage Connecticut Resources Recovery Authority Last Eight Fiscal Years
(Expressed in Thousands)
FOR THE YEAR GROSS ENDED JUNE 30. REVENUES (I)
DIRECT OPERATING EXPENSES (21
NET REVENUE AVAILABLE FOR DEBT SERVICE
1989 $97,303 $68,681 $28,622 1990 133,435 93,086 40,349 1991 128,491 90,228 38,263 1992 128,186 92,291 35,895 1993 132,569 102,081 30,488 1994 147,753 98,342 49,411 1995 160,645 105,368 55,277 1996 151,468 101,592 49,876
Includes Operating Revenues and Investment Income. Includes Operating Expenses Less Depreciation and Amortization.
NOTE: Prior to 1989, Connecticut Resources Recovery Authority was considered a development stage enterprise as many of its facilities were still being constructed.
SOURCE: Connecticut Resources Recovery Authority Financial Statements
Bank Deposits Last Ten Fiscal Years (Expressed in Thousands)
TOTAL
AS OF BANK DEPOSITS
1987 $ 57,414,311
1988 64,533,081
1989 67,747,035
1990 69,505,683
1991 44,897,318
1992 38,322,461
1993 55,532,661
1994 54,836,057
1995 53,640,331
1996 39,120,816
NOTES: Beginning in 1991 totals are as of 6/30, before 1991 totals were as of 12/31.
For the years 1993 -1996, bank deposits for credit unions were not included.
The reduction in deposits in 1996 can be attributed to out of state bank mergers: Deposits with banks not headquartered in Connecticut are no longer included.
SOURCES: 1987 Branch Directory and Summary of Deposits, Decision Research Sciences, inc.
1988-1996 Department of Banking
147

STATE OF CONNECTICUT Resident Employment, Unemployment and Unemployment Rate Last Ten Years
(Thousands)
YEAR LABOR FORCE EMPLOYMENT
UNEMPLOYMENT UNEMPLOYMENT RATE
1987 1,752.0 1,695.0 58.0 3.3% 1988 1,739.0 1,688.0 52.0 3.0% 1989 1,761.0 1,697.0 64.0 3.7% 1990 1,833.2 1,738.7 94.5 5.2% 1991 1,841.4 1,716.2 125.1 6.8% 1992 1,819.5 1,680.8 138.7 7.6% 1993 1,784.4 1,672.6 111.8 6.3% 1994 1,735.9 1,639.3 96.7 5.6% 1995 1,709.1 1,614.9 94.2 5.5% 1996 (Oct) 1,753.5 1,665.9 87.6 5.0%
SOURCE: Bureau of Labor Statistics Annual, Seasonally Adjusted Data
Connecticut Non-Farm Employment By Industry Seasonally Adjusted Last Ten Years
(Thousands)
YEAR SERVICES
RETAIL & WHOLESALE
TRADE MANUFACTURING
FINANCE INSURANCE & REAL ESTATE
TRANSPORTATION & UTILITIES
1987 392.9 373.4 379.8 152.2 72.2 1988 413.7 375.6 368.7 151.8 73.7 1989 428.1 369.9 351.2 152.1 73.1 1990 421.9 350.4 330.2 149.7 71.1 1991 416.2 334.2 316.0 145.9 68.6 1992 428.8 327.7 299.3 140.7 67.8 1993 442.1 332.3 289.6 139.5 70.4 1994 458.3 336.9 282.9 133.5 70.9 1995 469.1 340.5 277.7 131.9 71.5 1996 (Oct) 477.5 347.8 274.1 131.6 72.1
SOURCE: U.S. Bureau of Labor Statistics
148

STATE OF CONNECTICUT Total Personal Income and Per Capita Personal Income Connecticut Compared to the United States and New England Last Ten Years
YEAR
TOTAL PERSONAL INCOME (Billions of Dollars)
U.S N.E CT.
PER CAPITA PERSONAL INCOME (Dollars)
U.S N.E CT. 1987 $3,863.1 $246.9 $70.1 $15,942 $19,068 $21,587 1988 4,160.7 271.8 77.4 17,015 20,773 23,658 1989 4,474.0 291.1 83.3 18,127 22,084 25,376 1990 4,774.0 300.3 86.7 19,142 22,715 26,375 1991 4,950.8 304.9 87.9 19,636 23,083 26,725 1992 5,248.6 319.1 92.9 20,581 24,166 28,343 1993 5,471.1 329.2 95.2 21,224 24,876 29,048 1994 5,739.9 342.5 98.4 22,047 25,812 30,054 1995 6,098.1 364.6 104.1 23,208 27,388 31,776 1996 (2nd quarter) 6,393.1 380.1 108.5 N/A N/A N/A
SOURCE: Bureau of Economic Analysis NOTE: Connecticut ranked first in the nation in per capita income in each year.
CONSTRUCTION MINING GOVERNMENT TOTAL NON-FARM
EMPLOYMENT 80.4 1.6 204.9 1,657.4 79.3 1.6 207.9 1,672.3 69.6 0.9 207.4 1,652.3 56.2 0.9 211.1 1,591.5 48.0 0.7 206.5 1,536.1 48.1 0.8 207.1 1,520.3 47.7 0.8 213.1 1,535.5 51.1 0.7 219.9 1,554.2 51.0 0.8 220.2 1,562.7 53.1 0.8 226.2 1,583.2
149

STATE OF CONNECTICUT Top Twenty Private Sector Employers June 30, 1996
Rank 1996
Rank 1995 Name Headquarters
Total CT Employees 1996 1995
1 1 (tie) Pratt & Whitney East Hartford 13,000 15,000
2 4 Stop & Shop Braintree, Mass. 12,412 11,775
3 1 (tie) Aetna Life & Casualty Hartford 11,688 15,000
4 8 Foxwoods Resort Casino MashantuCket Pequot Reservation, Ledyard 11,154 9,200
5 3 Electric Boat Groton 10,578 12,169
6 6 (tie) Yale University New Haven 9,629 9,600
7 10 ITT Hartford Insurance Group Hartford 8,967 8,956
8 5 Sikorsky Aircraft Stratford 8,375 8,768
9 6 (tie) SNET New Haven 8,360 9,600
10 9 Travelers Group Inc. New York 8,090 7,300
11 18 Edwards Super Food Windsor 6,797 6,728
12 15 (tie) Hartford Hospital Hartford 6,436 6,136
13 11 Northeast Utilites Berlin 6,150 6,350
14 (tie) 13 Pitney Bowes Inc. Stamford 6,000 5,800
14 (tie) 14 Yale New Haven Hospital New Haven 6,000 6,132
16 12 CIGNA Corp. Philadelphia 5,976 6,243
17 Fleet Financial Group Boston 5,794 N/A
18 - General Electric Co. Fairfield 5,300 N/A
19 17 Hamilton Standard Windsor Locks 5,000 7,100
20 20 J.C. Penny Plano, Texas 3,569 3,964
SOURCE: The Hartford Courant
150

STATE OF CONNECTICUT Economic Indicators Last Ten Years
YEAR
RETAIL
SALES
(MILLIONS)
DISPOSABLE
INCOME
(BILLIONS)
MEDIAN
HOUSEHOLD
INCOME
(CURRENT DOLLARS)
NON-FARM PAYROLL EMPLOYMENT
(SEASONALLY
ADJUSTED)
(THOUSANDS)
NEW PRIVATE
HOUSING UNITS 1987 $23,324 $59.03 $32,862 1,657.4 26,750
' 1988 26,681 66.12 36,213 1,672.3 18,865 1989 29,021 71.36 42,321 1,652.3 11,969 1990 28,429 74.71 38,870 1,591.5 7,584
1991 29,362 75.60 42,154 1,536.1 7,477
1992 28,701 78.66 40,841 1,520.3 8,011 1993 28,877 80.19 39,516 1,535.5 9,247
1994 29,860 82.85 41,097 1,554.2 9,460
1995 31,682 87.39 40,243 1,562.7 8,550 1996 33,196 N/A N/A 1,583.2 N/A
,SOURCES: Retail Sales, Department of Revenue Services
Disposable Income, Bureau of Economic Analysis
Median Household Income and Housing Units, Bureau of the Census
Non-Farm Payroll Employment, Bureau of Labor Statistics
NOTE: All data reported by calendar year except Retail Sales, which is on a fiscal year basis.
1 Demographics Last Ten Years
YEAR TOTAL
POPULATION
(Thousands)
POPULATION UNDER 5
POPULATION 65 OR OLDER
POPULATION BELOW FEDERAL POVERTY LEVEL
1987 3,247 215 429 N/A 1988 3,272 221 434 N/A 1989 3,283 227 441 N/A 1990 3,287 233 444 196 1991 3,291 236 451 N/A 1992 3,279 236 456 303 1993 3,278 235 461 277 1994 3,275 231 465 344 1995 3,275 228 467 318 1996 3,275 N/A N/A N/A
;SOURCES: U.S. Census Bureau
151

STATE OF CONNECTICUT Major Revenue Sources - General Fund Last Ten Fiscal Years (Millions)
FISCAL YEAR
SALES & USE TAX
% OF TOTAL
REVENUE
PERSONAL INCOME
TAX
% OF TOTAL
REVENUE CORPORATION
TAX
% OF TOTAL
REVENUE
CAPITAL GAINS
TAX
% OF TOTAL
REVENUE 1987 1,840.6 38.8% - 681.9 14.4% 467.8 9.9%
1988 2,000.4 41.2% 661.3 13.6% 386.3 7.9%
1989 2,097.5 38.1% - 870.0 15.8% 508.7 9.2%
1990 2,479.0 40.6% - 794.1 13.0% 624.7 10.2%
1991 2,417.8 41.6% - 669.0 11.5% 520.5 8.9%
1992 2,080.2 28.2% 1,976.6 26.7% 641.4 8.7% -
1993 2,056.2 27.2% 2,392.0 31.6% 715.2 9.4% -
1994 2,181.4 27.6% 2,517.7 31.8% 703.5 8.9%
1995 2,368.1 27.9% 2,589.9 30.6% 724.7 8.6%
1996 2,460.1 27.0% 2,879.4 31.6% 748.1 8.2%
NOTES: Effective in 1992, the Capital Gains Tax became an integral part of the newly implemented Personal Income Tax. Gross Revenues Including Statutory Accruals.
SOURCE: Annual Report of the State Comptroller (Schedule B-2)
Sales and Use Tax - Major Industrial Categories June 30, 1996 (Millions)
INDUSTRY TAX Manufacturing $141.6 6.1% Wholesale 115.2 5.0% Retail:
Hardware 66.4 2.9% General Merchandise 130.8 5.6% Food Products 85.5 3.7% Auto Products 266.3 11.5% Apparel 32.3 1.4% Home Appliances & Furnishings 128.8 5.6% Eating & Drinking Establishments 139.7 6.0% Miscellaneous Shopping Stores 235.7 10.2%
Business 517.8 22.3% All Other Businesses 459.5 19.8%
Total Sales & Use Tax $2,319.6
NOTE: The figures shown are based on returns filed on a timely basis and do not include audits or late returns.
SOURCE: Department of Revenue Services
152

STATE OF CONNECTICUT Miscellaneous Statistics June 30, 1996
Date of Ratification
January 9, 1788 Form of Government
Legislative - Executive - Judicial Miles of State Highway
4,075 Land Area
5,009 Square Miles
State Police Protection: Number of Stations
12 Number of State Police
943
Higher Education (Universities, Colleges and Community Colleges): Number of Campuses in State 26 Number of Educators 3,367 Number of Students 102,450
Recreation: Number of State Parks Area of State Parks Area of State Forests
Employees: Full-Time Part-Time (Permanent)
91 31,597 Acres 144,464 Acres
52,332 2,690
SOURCE: Connecticut State Register and Manual
153

STATE OF CONNECTICUT Office of the State Comptroller Organization As of June 30, 1996
Nancy Wyman State Comptroller
Mark E. Ojalcian Deputy Comptroller
MANAGEMENT SERVICES DIVISION ACCOUNTS PAYABLE DIVISION Bernard McLoughlin A. Douglas Vallee
Director Director
RETIREMENT & EMPLOYEE BENEFIT DIVISION COMPUTER SERVICES DIVISION Steven Weinberger Carl Kask
Director Director
POLICY EVALUATION & REVIEW DIVISION PAYROLL SERVICES DIVISION Jeanne Berube Gary Reardon
Director Director
BUDGET & FINANCIAL ANALYSIS DIVISION John Clark Director
Accounting Services Rober Krueger - Assistant Director
Hazel Brown
Financial Reporting Gerardo Villa, CPA
Nancy Fuda Julie Fanelli
Doris Przygocki
Accounting Operations Burton Gold Diane Nolan
Patrick Collins Karen Hurst
Carmen Guzman Debra Morris Yvette Jenkins
154


7
,