comprehensive annual financial report 2008 · 2008 comprehensive annual financial report 4 ... •...
TRANSCRIPT

Comprehensive AnnualFinancial Report
for the fiscal year ended June 30, 2008
State of ArizonaDepartment of Transportation

Comprehensive AnnualFinancial Report
for the fiscal year ended June 30, 2008
Prepared byFinancial Management ServicesDepartment of Transportation
State of Arizona

2008 Comprehensive Annual Financial Report
Arizona Department of Transportation Comprehensive Annual Financial Report for the fiscal year ended June 30, 2008
TABLE OF CONTENTS
Page INTRODUCTORY SECTION Letter of Transmittal.............................................................................................................................................. i-v
Certificate of Achievement for Excellence in Financial Reporting.........................................................................vi
List of Principal Officials .......................................................................................................................................vii
Organization Chart ................................................................................................................................................viii
FINANCIAL SECTION Independent Auditors’ Report .............................................................................................................................. 1-2
Management’s Discussion and Analysis .............................................................................................................3-14
Basic Financial Statements:
Government-wide Financial Statements:
Statement of Net Assets (Exhibit 1) .............................................................................................................15
Statement of Activities (Exhibit 2)...............................................................................................................16
Governmental Funds Financial Statements:
Balance Sheet - Governmental Funds (Exhibit 3) ...................................................................................17-18
Reconciliation of the Balance Sheet of Governmental Funds
to the Statement of Net Assets (Exhibit 3.1) ............................................................................................19
Statement of Revenues, Expenditures, and Changes in Fund
Balances - Governmental Funds (Exhibit 4) .......................................................................................20-23
Reconciliation of the Statement of Revenues, Expenditures, and Changes
in Fund Balances of Governmental Funds to the Statement of Activities (Exhibit 4.1)...........................24
Proprietary Funds Financial Statements:
Statement of Net Assets (Exhibit 5) .............................................................................................................25
Statement of Revenues, Expenses, and Changes in Fund Net Assets (Exhibit 6) ........................................26
Statement of Cash Flows (Exhibit 7) ...........................................................................................................27
Fiduciary Funds Financial Statement
Statement of Net Assets – Agency Funds (Exhibit 8) ..................................................................................28
Index of Notes to the Financial Statements ......................................................................................................29
Notes to the Financial Statements................................................................................................................30-54
Required Supplementary Information (Other than MD&A):
Budgetary Comparison Schedule – General Fund (State Highway Fund)........................................................55
Note to Required Supplementary Information..................................................................................................56
Information About Infrastructure Assets Reported Using the Modified Approach .....................................57-61

2008 Comprehensive Annual Financial Report
Arizona Department of Transportation Comprehensive Annual Financial Report for the fiscal year ended June 30, 2008
TABLE OF CONTENTS
(Continued) Page Supplementary Information:
Non-Major Governmental Funds Financial Statements:
Combining Balance Sheet (Exhibit 9) ....................................................................................................62-63
Combining Statement of Revenues, Expenditures, and Changes in Fund Balances (Exhibit 10) ..........64-65
Fiduciary Funds Financial Statements:
Combining Statement of Net Assets – Agency Funds (Exhibit 11) .............................................................66
Statement of Changes in Assets and Liabilities – Agency Funds (Exhibit 12) ............................................67
STATISTICAL SECTION
Overview................................................................................................................................................................68
Index of Statistical Section.....................................................................................................................................69
Financial Trends:
Change in Net Assets (Table 1) ...................................................................................................................70-71
Net Assets by Component (Table 2) .................................................................................................................72
Statement of Revenues, Expenditures, and Changes in Fund Balances (Table 3) ............................................73
Fund Balances of Governmental Funds (Table 4) ............................................................................................74
Expenditures of Federal Awards (Table 5) .......................................................................................................75
Government-wide Expenses by Function (Table 6)..........................................................................................76
Government-wide Revenues (Table 7) .............................................................................................................77
Revenue Capacity:
Highway User Revenue Fund Collections (Table 8) ........................................................................................78
Highway User Revenue Fund Distributions (Table 9)......................................................................................79
Fuel Tax Rates (Table 10).................................................................................................................................80
Motor Vehicle Fuel Tax – Top Ten Suppliers (Table 11).................................................................................81
Gasoline Volume Sold – Top Twenty-Five Suppliers (Table 12)................................................................82-83
Debt Capacity:
Highway User Revenue Fund – Legal Debt Margin (Table 13) .......................................................................84
Highway Revenue Bonds – Bond Coverage (Table 14) ...................................................................................85
Transportation Excise Tax Revenue Bonds – Bond Coverage (Table 15)........................................................86
Transportation Excise Tax Revenue Bonds – Debt Service Revenue and Cost Per Capita (Table 16) ............87

2008 Comprehensive Annual Financial Report
Arizona Department of Transportation Comprehensive Annual Financial Report for the fiscal year ended June 30, 2008
TABLE OF CONTENTS
(Continued) Page Demographic and Economic Information:
Number of Vehicle Registrations Per Year (Table 17) .....................................................................................88
Vehicle Registrations Per Year Compared to Fuel Sales (Table 18) ................................................................89
Demographic and Economic Statistics (Table 19)............................................................................................90
Principal Employers (Table 20) ........................................................................................................................91
Operating Information:
Appropriated Full Time Equivalents (FTEs) (Table 21)...................................................................................92
Capital Assets – Schedule by Function and Activity (Table 22) ......................................................................93
Capital Assets – Schedule of Changes by Function and Activity (Table 23)....................................................94
Total Public Road Mileage by Highway Class and Governmental Ownership (Table 24)...............................95
Daily Vehicle Miles Traveled with Population Data (Table 25).......................................................................96
Acknowledgments .......................................................................................................................................................97

Introductory Section


2008 Comprehensive Annual Financial Report vi

2008 Comprehensive Annual Financial Report
vii
Arizona Department of Transportation List of Principal Officials
Victor M. Mendez Director
Richard L. Travis
Deputy Director
John A. Bogert Chief of Staff
Floyd P. Roehrich, Jr.
State Engineer Intermodal Transportation Division
Stacey K. Stanton Assistant Director
Motor Vehicle Division
Rakesh Tripathi Assistant Director
Multimodal Planning Division
Barclay L. Dick Assistant Director
Aeronautics Division
John E. McGee Chief Financial Officer
Arizona State Transportation Board
Member
Counties Term
Expires Si L. Schorr, Chairman District 2 (Pima County) 2009 Delbert Householder, Vice Chairman District 4 (Gila, Graham and Pinal Counties) 2010 Robert M. Montoya District 5 (Navajo, Apache and Coconino Counties) 2011 Felipe Andres Zubia District 1 (Maricopa County) 2012 William (Bill) J. Feldmeier District 6 (Yavapai, Yuma, Mohave, and LaPaz Counties) 2012 Barbara (Bobbie) Ann Lundstrom District 3 (Cochise, Greenlee, and Santa Cruz Counties) 2013 Victor Flores District 1 (Maricopa County) 2014

State of ArizonaDepartment of Transportation
Organization Chart
Citizens
Governor
StateTransportation
Board
IntermodalTransportation
Division
DirectorDeputy Director
Motor VehicleDivision
MultimodalPlanning Division
AeronauticsDivisionChief of Staff
TransportationServices Group
2008 Comprehensive Annual Financial Report viii
Financial Section


Arizona Department of Transportation Management’s Discussion and Analysis
June 30, 2008
2008 Comprehensive Annual Financial Report
3
As management of the Arizona Department of Transportation (Department), we offer readers of the Department’s financial statements this narrative overview and analysis of the financial activities of the Department for the fiscal year ended June 30, 2008. We encourage readers to consider the information presented here in conjunction with the letter of transmittal, which can be found on pages i-v, and the Department’s basic financial statements, which begin on page 15, with the accompanying notes and Required Supplementary Information (RSI). Financial Highlights
Government-wide: • The net assets of the Department at the close of the fiscal year are $14.3 billion, compared to $13.5 billion
for fiscal year 2007, an increase of 5.5 percent. Of this amount, $209.8 million represents unrestricted net assets and may be used to meet the Department’s ongoing obligations to citizens and creditors as compared to $236.3 million at the end of 2007.
• The Department’s capital assets are $15.2 billion, compared to $14.3 billion for fiscal year 2007, an
increase of 6.7 percent. This increase is primarily attributable to highway construction activity. The Department’s invested in capital assets, net of related debt, is $13.3 billion, compared to $12.2 billion for fiscal year 2007, an increase of 8.8 percent.
• The Department’s non-current liabilities are $2.5 billion, compared to $2.0 billion in 2007. The Department
had $499.7 million more in bonds outstanding in 2008 than in 2007. During 2008, there were $632.0 million in bonds issued and $132.3 million in bonds repaid.
Fund Level: • As of the close of the fiscal year, the governmental funds of the Department reported combined ending
fund balances of $1.4 billion, as compared to $1.0 billion in 2007, a 30.8 percent increase over the prior fiscal year.
• The total reserved fund balance is $1.3 billion; of this, approximately $1.3 billion (97.6 percent) is reserved
for capital projects. Approximately $83.3 million (6.1 percent) is available for spending at the government’s discretion (unreserved fund balance) as compared to $39.0 million (3.7 percent) in 2007. At the end of the fiscal year, the unreserved fund balance for the General Fund (State Highway Fund) was $57.9 million.
• The proprietary funds reported net assets at year-end of $74.4 million, as compared to $72.0 million in
2007, an increase of 3.3 percent. Overview of the Financial Statements This discussion and analysis is intended to serve as an introduction of the Department’s basic financial statements. The Department’s basic financial statements consist of three components: 1) government-wide financial statements, 2) fund financial statements, and 3) notes to the financial statements. This report also contains other Required Supplementary Information in addition to the basic financial statements. Government-wide Financial Statements (Reporting the Department as a Whole) The government-wide financial statements are designed to present an overall picture of the financial position of the Department. These statements consist of the Statement of Net Assets and the Statement of Activities, and are prepared using the accrual basis of accounting, which is similar to the accounting used by most private-sector companies. All of the current year’s revenues and expenses are taken into account regardless of when cash is received or paid. The Statement of Net Assets combines and consolidates the Department’s current financial resources with capital assets and long-term obligations. This statement includes all of the Department’s non-fiduciary assets and liabilities.

Arizona Department of Transportation Management’s Discussion and Analysis
June 30, 2008
2008 Comprehensive Annual Financial Report
4
Net assets are the difference between the Department’s assets and liabilities, and represent one measure of the Department’s financial health.
• An increase or decrease in the Department’s net assets from one year to the next is an indicator of whether its financial health is improving or declining.
• Other indicators of the Department’s financial health include the condition of its roads and bridges (infrastructure) and economic trends affecting the Department’s future tax revenues.
The Statement of Activities focuses on both the gross and net cost of various activities (governmental and business-type); these costs are paid by the Department’s general tax and other revenues. This statement summarizes the cost of providing specific Department services and includes all current year revenues and expenses. The Statement of Net Assets and the Statement of Activities divide the Department’s activities into two types:
Governmental Activities
The Department’s basic services are reported here, including administration, aeronautics, highway, highway maintenance, motor vehicle division, and other activities. Taxes, fees, and federal grants finance most of these activities.
Business-type Activities
Activities for which the Department charges a fee to customers to pay most or all of the costs of certain services it provides are reported as business-type activities. The Department’s Arizona Highways Magazine and Highway Expansion and Extension Loan Program are reported here.
The government-wide financial statements can be found on pages 15-16 of this report. This report includes two schedules (Exhibit 3.1 and Exhibit 4.1) that reconcile the amounts reported on the governmental fund financial statements (prepared using the modified accrual basis of accounting and current financial resources measurement focus) with governmental activities (prepared using the accrual basis of accounting and economic resources measurement focus) on the appropriate government-wide statements. The following summarizes the impact of utilizing Governmental Accounting Standards Board Statement 34 (GASB 34) reporting:
• Capital assets used in governmental activities are not reported on governmental fund statements.
• Other long-term assets that are not available to pay for current period expenditures are not reported on governmental fund statements.
• Internal service fund activities are reported as governmental activities, but reported as proprietary funds in
the fund financial statements.
• Bond issuance costs are capitalized and amortized to expense as governmental activities, but reported as expenditures in the governmental fund statements.
• Unless currently due and payable, long-term liabilities, such as capital lease obligations, compensated
absences, notes payable, and others only appear as liabilities on the government-wide statements.
• Capital outlay spending results in capital assets on the government-wide statements, but is reported as expenditures on the governmental fund statements.
• Bond and note proceeds result in liabilities on the government-wide statements, but are recorded as other
financing sources on the governmental fund statements.

Arizona Department of Transportation Management’s Discussion and Analysis
June 30, 2008
2008 Comprehensive Annual Financial Report
5
• Certain other outflows represent either increases or decreases in liabilities on the government-wide statements, but are reported as expenditures on the governmental fund statements.
Fund Financial Statements (Reporting the Department’s Major Funds) The fund financial statements begin on page 17 and provide detailed information about the major individual funds. A fund is an accounting entity with a self-balancing set of accounts that the Department uses to keep track of specific sources of funding and spending for a particular purpose. The Department, like other state and local governments, uses fund accounting to ensure and demonstrate compliance with finance-related legal requirements. All of the funds of the Department can be divided into three categories: governmental funds, proprietary funds, and fiduciary funds.
Governmental Funds A majority of the Department’s activities are reported in governmental funds. Reporting of these funds focuses on how financial resources flow in to and out of the funds, and amounts remaining at year-end for future spending. Governmental funds are accounted for using the modified accrual basis of accounting, which measures cash and other assets that can be readily converted to cash. The governmental fund statements provide a detailed short-term view of the Department’s general governmental operations and the basic services it provides. This information should help determine whether there are more or less current financial resources available for the Department’s programs. The reconciliations following the fund financial statements explain the differences between the government’s activities, reported in the government-wide statement of activities, and the governmental funds.
The Department maintains fifteen individual governmental funds. Information is presented separately in the governmental funds Balance Sheet and the governmental funds Statement of Revenues, Expenditures, and Changes in Fund Balances for the General Fund (State Highway Fund), Maricopa Regional Area Road Construction Fund, Motor Vehicle Division Clearing Fund, Highway User Revenue Fund, Debt Service Fund, and Capital Projects Fund which are considered to be major funds. Data from the other nine governmental funds are combined into a single, aggregated presentation. Individual fund data for each of these non-major governmental funds are provided in the form of combining statements elsewhere in this report.
The legislature appropriates an annual budget for the Department’s General Fund (State Highway Fund). The Budgetary Comparison Schedule – General Fund (State Highway Fund) has been provided to demonstrate compliance with this budget and is presented as Required Supplementary Information.
The governmental funds financial statements can be found on pages 17-24 of this report.
Proprietary Funds When the Department charges customers for the services it provides, these services are generally reported in proprietary funds. Proprietary funds (enterprise and internal service) utilize full accrual accounting, the same method used by private sector businesses. Enterprise funds report activities that provide supplies and services to outside customers, other agencies, or to other divisions of the Department. The Department’s enterprise funds are the Arizona Highways Magazine Fund and the Highway Expansion and Extension Loan Program Fund. The internal service fund reports activities that provide supplies and services for the Department’s other programs and activities and other state agencies. The Equipment Fund is the Department’s only internal service fund. Internal service fund activities are reported as governmental activities on the government-wide statements.
The proprietary funds financial statements can be found on pages 25-27 of this report. Fiduciary Funds Fiduciary funds are used to account for resources held for the benefit of parties outside the government. Fiduciary funds are not reflected in the government-wide financial statements because the resources of those funds are not available to support the Department’s own programs. The fiduciary funds financial statement can be found on page 28.

Arizona Department of Transportation Management’s Discussion and Analysis
June 30, 2008
2008 Comprehensive Annual Financial Report
6
Notes to the Financial Statements The notes provide additional information that is essential to a full understanding of the data provided in the government-wide and fund financial statements. The notes to the financial statements can be found on pages 29-54 of this report. Required Supplementary Information In addition to the basic financial statements including accompanying notes, this section presents certain Required Supplementary Information including the Department’s Budgetary Comparison Schedule – General Fund (State Highway Fund) and the modified approach to reporting infrastructure assets. Required Supplementary Information can be found on pages 55-61 of this report. Supplementary Information Other Supplementary Information includes the combining statements for the non-major governmental funds and agency funds and is presented immediately following the Required Supplementary Information on budget and infrastructure assets. Combining and individual fund statements and schedules can be found on pages 62-67 of this report. Government-wide Financial Analysis As noted earlier, net assets may serve over time as a useful indicator of the Department’s financial health. The following tables, graphs, and analyses discuss the financial position and changes to financial position for the Department as a whole as of and for the fiscal years ended June 30, 2008 and 2007. The Department’s combined net assets increased by $747.8 million over the course of this fiscal year’s operations, an increase of 5.5 percent. The net assets of the governmental activities increased by $745.4 million or 5.5 percent and business-type activities increased by $2.4 million, an increase of 3.3 percent over the previous year. The overall increase in the Department’s net assets was due to an increase in the Department’s infrastructure resulting from more construction and more money received in federal grants. The following table reflects the condensed Statement of Net Assets as of June 30, 2008 and 2007:
2008 2007 2008 2007 2008 2007Assets:
Current and other assets 1,791,104,044$ 1,503,637,083$ 129,735,062$ 230,081,584$ 1,920,839,106$ 1,733,718,667$ Capital assets 15,249,215,994 14,290,099,071 172,725 225,179 15,249,388,719 14,290,324,250
Total assets 17,040,320,038 15,793,736,154 129,907,787 230,306,763 17,170,227,825 16,024,042,917 Liabilities:
Other liabilities 358,846,843 330,461,935 53,172,272 158,120,905 412,019,115 488,582,840 Non-current liabilities 2,481,455,779 2,008,715,222 2,315,611 151,201 2,483,771,390 2,008,866,423
Total liabilities 2,840,302,622 2,339,177,157 55,487,883 158,272,106 2,895,790,505 2,497,449,263
Net assets: Invested in capital assets,
net of related debt 13,285,437,940 12,211,861,155 172,725 225,179 13,285,610,665 12,212,086,334 Restricted 704,929,654 1,006,511,853 74,115,046 71,707,711 779,044,700 1,078,219,564 Unrestricted 209,649,822 236,185,989 132,133 101,767 209,781,955 236,287,756
Total net assets 14,200,017,416$ 13,454,558,997$ 74,419,904$ 72,034,657$ 14,274,437,320$ 13,526,593,654$
Governmental Activities Business-type Activities Total
Prior year numbers have been reclassified to reflect current and non-current liabilities for the Board Funding Obligations. The total assets of the Department were $17.2 billion, while total liabilities were $2.9 billion, resulting in a net assets balance of $14.3 billion. By far, the largest portion of the Department’s net assets, $13.3 billion (93.0 percent), was invested in capital assets (e.g., land, infrastructure, buildings, machinery, and equipment), net of any related debt used to acquire those assets. The Department uses these capital assets to provide services to citizens; consequently, these assets are not available for future spending. Although the Department’s investment in its capital assets is reported net of related debt, it should be noted that the resources needed to repay this debt must be provided from other resources, since the capital assets themselves cannot be used to liquidate these liabilities.

Arizona Department of Transportation Management’s Discussion and Analysis
June 30, 2008
2008 Comprehensive Annual Financial Report
7
As of June 30, 2008, the Department is able to report positive balances in all three categories of net assets for the governmental activities. The same situation held true for the prior fiscal year. The governmental activities reported an increase in capital assets with the largest increase being in the area of construction in progress. The Department also issued new Highway Revenue Bonds and Transportation Excise Tax Revenue Bonds which caused the non-current liabilities to increase for the governmental activities. Both the current assets and other liabilities decreased for the business-type activities due to the repayment of $140 million and the issuance of $50 million in board funding obligations. The business-type activities also reported a small increase in unrestricted net assets for the second year in a row. The Arizona Highways Magazine Fund’s contribution to this increase was primarily due to improved earnings as a result of a reduction in workforce associated with outsourcing of several services, a reduction in the amount of inventory (both finished goods and creative content), revising contracts with key suppliers to achieve more competitive pricing, and a price increase in the magazine subscription rate. The benefit of these changes was reduced by an overall decline in magazine subscription revenue. The following condensed financial information was derived from the government-wide Statement of Activities and reflects how the Department’s net assets changed during the year, compared to the prior year:
2008 2007 2008 2007 2008 2007Revenues:
Program revenues:Charges for services 150,024,350$ 158,019,080$ 9,379,457$ 10,969,360$ 159,403,807$ 168,988,440$ Operating grants and contributions 79,747,102 72,678,913 - - 79,747,102 72,678,913 Capital grants and contributions 523,727,885 354,023,589 - - 523,727,885 354,023,589
General revenues:Transportation excise taxes 253,741,944 262,263,939 - - 253,741,944 262,263,939 Vehicle, registration, title, license
and related taxes 1,033,504,644 1,029,000,817 - - 1,033,504,644 1,029,000,817 Fuel and motor carrier taxes and fees 766,393,661 790,908,552 - - 766,393,661 790,908,552 Flight property taxes 13,821,790 15,302,697 - - 13,821,790 15,302,697 Interest on investments 59,528,386 55,760,406 4,788,328 5,563,036 64,316,714 61,323,442 Gain <loss> on sale of capital assets 30,515,557 <464,317> <17,518> <2,749> 30,498,039 <467,066> Other 8,256,693 10,462,131 - - 8,256,693 10,462,131
Total revenues 2,919,262,012 2,747,955,807 14,150,267 16,529,647 2,933,412,279 2,764,485,454
Expenses:Administration 54,918,357 51,666,715 - - 54,918,357 51,666,715 Aeronautics 4,372,514 5,417,937 - - 4,372,514 5,417,937 Highway 132,873,981 138,788,381 - - 132,873,981 138,788,381 Highway maintenance 137,099,909 120,162,937 - - 137,099,909 120,162,937 Motor Vehicle 112,879,673 105,961,064 - - 112,879,673 105,961,064 Non-capital, including asset preservation 187,004,474 113,568,933 - - 187,004,474 113,568,933 Distributions to Arizona counties
and cities 1,238,382,891 1,219,208,067 - - 1,238,382,891 1,219,208,067 Distributions to other state agencies 176,691,851 114,795,378 - - 176,691,851 114,795,378 Local governmental assistance 37,285,011 48,760,126 - - 37,285,011 48,760,126 Interest on long-term debt 92,294,932 82,449,597 - - 92,294,932 82,449,597 Arizona Highways Magazine - - 7,711,629 8,071,836 7,711,629 8,071,836 Highway Expansion and Extension
Loan Program - - 4,053,391 4,354,619 4,053,391 4,354,619 Total expenses 2,173,803,593 2,000,779,135 11,765,020 12,426,455 2,185,568,613 2,013,205,590
Change in net assets before special item 745,458,419 747,176,672 2,385,247 4,103,192 747,843,666 751,279,864 Special item - State appropriation - 245,000,000 - - - 245,000,000
Change in net assets 745,458,419 992,176,672 2,385,247 4,103,192 747,843,666 996,279,864 Net assets - July 1 13,454,558,997 12,462,382,325 72,034,657 67,931,465 13,526,593,654 12,530,313,790 Net assets - June 30 14,200,017,416$ 13,454,558,997$ 74,419,904$ 72,034,657$ 14,274,437,320$ 13,526,593,654$
Governmental Activities Business-type Activities Total

Arizona Department of Transportation Management’s Discussion and Analysis
June 30, 2008
2008 Comprehensive Annual Financial Report
8
Governmental Activities: The following chart depicts revenues of the governmental activities for the fiscal year ended June 30, 2008:
Revenues - Governmental Activities$2,919,262,012
Other revenues including flight property taxes
0.8%
Interest on investments2.0%
Vehicle, registration, title, license and
related taxes35.4%
Operating grants and contributions
2.7%
Capital grants and contributions
17.9%
Charges for services5.1%
Gain <loss> on sale of capital assets
1.0%
Fuel and motor carrier taxes and fees
26.3%
Transportation excise taxes8.7%
$2.6 billion (or 88.3 percent) of the Department’s revenues are from the following four revenue sources:
• Vehicle, registration, title, license, and related taxes comprise the Department’s largest revenue source of $1.0 billion (35.4 percent).
• Fuel and motor carrier taxes and fees represent the Department’s second largest revenue source of $766.4 million (26.3 percent).
• Capital grants and contributions total $523.7 million (17.9 percent). • Transportation excise taxes total $253.7 million (8.7 percent).
The Department’s two main funding sources, the Highway User Revenue Fund (HURF) and the Maricopa County Transportation Excise Tax, posted no gains in fiscal year 2008. HURF collections totaled approximately $1.4 billion, basically the same as in fiscal year 2007. Maricopa County Transportation Excise Tax collections totaled $380.1 million, a decrease of 3.2 percent from fiscal year 2007, and 7.0 percent below the forecast. However, the Transportation Excise Tax distribution to the Department was $253.7 million compared to $262.3 million for fiscal year 2007. This decrease is the first year-over-year decrease in revenues since the inception of the tax in 1986. The Transportation Excise Tax revenues were negatively impacted by the persistently weak housing and credit markets, higher fuel and food prices, and slower employment and population growth. All of these factors caused consumers to restrain their spending in fiscal year 2008. The fuel and motor carrier tax percentage also decreased due to consumer restraint on spending.

Arizona Department of Transportation Management’s Discussion and Analysis
June 30, 2008
2008 Comprehensive Annual Financial Report
9
Capital grants and contributions increased from fiscal year 2007 due to an increase in the amount received in federal aid for fiscal year 2008. The Grant Anticipation Notes Fund, General Fund (State Highway Fund), and Maricopa Regional Area Road Construction Fund each reported an increase in fiscal year 2008. The majority of the increase this fiscal year was due to using federal funding on a larger percentage of projects, and therefore, increasing the capital grants and contributions revenue figure. The Department also had a gain on sale of capital assets due to the sale of two parcels of land that were no longer needed for highway development. The following chart depicts expenses of the governmental activities for the fiscal year ended June 30, 2008:
Expenses - Governmental Activities$2,173,803,593
Motor Vehicle5.2%
Highway maintenance6.3%
Highway 6.1%
Administration2.5%
Distributions to Arizona counties and
cities57.0%
Non-capital, including asset preservation
8.6%
Aeronautics0.2%
Interest on long-term debt4.2%
Local governmentalassistance
1.7%
Distributions to other state agencies
8.1%
$1.7 billion (or 80.0 percent) of the Department’s expenses were for the following:
• Distributions to Arizona counties and cities $1.2 billion (57.0 percent). • Non-capital, including asset preservation $187.0 million (8.6 percent). • Distributions to other state agencies $176.7 million (8.1 percent). • Highway maintenance $137.1 million (6.3 percent).
Distributions to Arizona counties and cities increased in fiscal year 2008. The distributions to Arizona counties and cities was impacted by a decline in Highway User Revenue Fund’s (HURF) collections, but was offset by an increase in grants to the Arizona counties and cities by the General Fund (State Highway Fund), Maricopa Regional Area Road Construction Fund, and State Aviation Fund. Non-capital, including asset preservation increased this fiscal year primarily due to the funds spent on pavement and bridge preservation. House Bill 2620 addressed statewide budget adjustments to help balance the State General Fund budget, in part by sweeping funds from state agencies. There was a $29.7 million sweep from the Department, which accounts for the Department’s increased distributions to other state agencies. The increase in Highway maintenance represents the Proposition 400 monies that the Department is now allowed to spend on landscape, litter, and sweeping and charge as maintenance expenses instead of as capital outlay. Local governmental assistance decreased in fiscal year 2008 primarily as a result of budget constraints and the availability of cash.

Arizona Department of Transportation Management’s Discussion and Analysis
June 30, 2008
2008 Comprehensive Annual Financial Report
10
Business-type Activities: Net assets for business-type activities increased by $2.4 million in fiscal year 2008. Total revenues were $14.2 million, with charges for services representing 66.2 percent and interest on investments 33.8 percent. The total expenses for business-type activities were $11.8 million. The Highway Expansion and Extension Loan Program had a decrease in revenues of $1.9 million which was primarily due to the Department using cash to pay off the board funding obligations and, therefore, not having the funds available for investment purposes. Interest revenue decreased this fiscal year due to a lower average principal balance outstanding on loans that were issued by the Department. The Arizona Highways Magazine had a decrease in revenues of $476 thousand primarily due to a decline in the number of subscriptions for the monthly publication. This decline in demand is consistent with industry trending for many other consumer periodicals with revenues based predominantly on annual subscriptions. Financial Analysis of the Department’s Funds As previously mentioned, the Department uses fund accounting to ensure and demonstrate compliance with budgetary and legal requirements. The following is a brief discussion of financial highlights from the fund financial statements. Governmental Funds The focus of the Department’s governmental funds financial statements (pages 17-24) is to provide information on near-term inflows, outflows, and balances of spendable resources. All major governmental funds are discretely presented on these financial statements, while the non-major governmental funds are combined into a single column. Combining statements for the non-major governmental funds may be found on pages 62-65. As of the end of the fiscal year, the fund balances of the governmental funds totaled $1.4 billion, an increase of $322.0 million over the previous fiscal year. Of this $1.4 billion balance, $83.3 million or 6.1 percent constitutes the unreserved fund balance, which was available for spending for the general purposes of the Department. The remaining fund balance of $1.3 billion, or 93.9 percent, was reserved for the following: 1) $7.1 million for inventories, 2) $3.2 million to pay debt service, 3) $1.3 billion to pay for capital projects, and 4) $20 million for the repayment of an advance from the Highway Expansion and Extension Loan Program Fund. The General Fund (State Highway Fund) is the primary operating fund of the Department. At the end of the current fiscal year, the unreserved fund balance of the General Fund (State Highway Fund) was $57.9 million and the reserved fund balance was $505.7 million. As a measure of the General Fund’s (State Highway Fund) liquidity, it may be useful to compare both the unreserved fund balance and the total fund balance to the total fund expenditures. Unreserved fund balance represents 5.2 percent of total General Fund (State Highway Fund) expenditures, while total fund balance represents 50.8 percent of the same amount. The Maricopa Regional Area Road Construction Fund is a major special revenue fund that receives Maricopa County Transportation Excise Tax monies that are used to provide a funding source for the construction of new freeways and other routes, improvements to existing freeways and other routes, improvements to the arterial street system, regional bus service, and high capacity transit services such as light rail. Total revenues collected in fiscal year 2008 were $342.1 million; Transportation Excise Tax revenue of $253.7 million (or 74.2 percent) was the bulk of the revenue. The remaining revenue was mainly federal revenue and interest on investments. Fiscal year 2008 saw the first new Transportation Excise Tax Revenue Bonds issuance since August 1, 2002. The Debt Service Fund is used for the accumulation of resources for, and the payment of, general long-term debt principal and interest of the governmental funds. The other financing sources of $231.6 million were transferred in from the General Fund (State Highway Fund) ($134.2 million), Maricopa Regional Area Road Construction Fund ($29.7 million), and Grant Anticipation Notes Fund ($67.6 million), and were used to pay the debt service. The remaining fund balance of $3.2 million is restricted for future debt service payments.

Arizona Department of Transportation Management’s Discussion and Analysis
June 30, 2008
2008 Comprehensive Annual Financial Report
11
The Capital Projects Fund is used to account for financial resources used for the acquisition or construction of major capital facilities of the governmental funds. During the fiscal year, the Department’s expenditures were $326.3 million. Capital outlay expenditures of $263.6 million (80.8 percent) accounted for the majority of the expenditures in the Capital Projects Fund. This expenditure for the acquisition and construction of new highways was converted to capital assets on the government-wide statements. The fund balance increased by $348.8 million due to unspent bond proceeds from three new bond issues. Budget Variances As a consequence of lower revenue collections and legislative fund sweeps, the Department reduced its fiscal year 2008 spending levels in certain key areas in order to cover contractor payments and daily operational expenses. The actual expenditures for fiscal year 2008 were less than the Department’s final budgeted amounts. A factor that contributed to the reduction in expenditures was the Governor of the State issuing a hiring freeze on February 21, 2008. With the hiring freeze in place, only those positions that are directly involved in providing for the health or safety of the public, or the collection or investment of state revenues are exempt from the hiring freeze. Capital Assets and Debt Administration Capital Assets (See Note 5A to the financial statements for additional information): The Department’s investment in capital assets for its governmental and business-type activities as of June 30, 2008, amounts to $15.2 billion (net of accumulated depreciation), a $950.8 million increase over the previous fiscal year.
2008 2007 2008 2007 2008 2007
Land 2,351,812,086$ 2,217,183,763$ 7,900$ 7,900$ 2,351,819,986$ 2,217,191,663$ Buildings and improvements 92,264,229 92,815,639 136,315 170,133 92,400,544 92,985,772 Improvements other than buildings 20,300,630 20,122,366 - - 20,300,630 20,122,366 Mobile fleet and aircraft 54,522,212 51,132,300 - - 54,522,212 51,132,300 Machinery and equipment 20,981,704 21,026,496 28,510 47,146 21,010,214 21,073,642 Infrastructure 10,101,407,936 9,855,140,388 - - 10,101,407,936 9,855,140,388 Construction in progress 2,607,927,197 2,032,678,119 - - 2,607,927,197 2,032,678,119
15,249,215,994$ 14,290,099,071$ 172,725$ 225,179$ 15,249,388,719$ 14,290,324,250$
Governmental Activities Business-type Activities Total
Total As provided by accounting principles generally accepted in the United States (GAAP), the Department has elected to record its infrastructure assets using the modified approach, as defined in GASB Statement 34. Assets accounted for under the modified approach include 6,785 center lane miles (18,546 travel lane miles) and 4,637 bridges that the Department is responsible for maintaining. The Five-Year Transportation Facilities Construction Program (Program) is a dynamic program and adjustments are made to the annual plans based on the needs of the Department to maintain the condition level of the roads and bridges at a level equal to, or greater than, the goals established by the Department. The Program is updated annually and adjustments are made monthly during the fiscal year, as circumstances may require. The Department manages its roads using the Present Serviceability Rating (PSR), which measures the condition of the pavement and its ability to serve the traveling public. The PSR uses a five-point scale (5 excellent, 0 impassable) to characterize the condition of the roadway. The Department’s serviceability rating goal is 3.23 for the overall system. The most recent assessment from the Transportation Material Technicians indicated that an overall rating of 3.91 was achieved for fiscal year 2008. The Department manages its bridges using the Arizona Bridge Information and Storage System (ABISS). The Department determines the condition rating based on standards developed by the Federal Highway Administration and additional internal criteria. It is the policy of the Department to maintain a Condition Rating Index (CRI) of 92.5 percent or better. In fiscal year 2008, a CRI of 93.4 percent was achieved.

Arizona Department of Transportation Management’s Discussion and Analysis
June 30, 2008
2008 Comprehensive Annual Financial Report
12
In addition to many smaller projects, each of the following major highway construction contracts in excess of $20 million was started during fiscal year 2008:
DescriptionContract Start
DateContract Amount
Fiscal Year 2008 Expenditures
Major median widening on Interstate 10 from Sarival to State Route 12/24/2007 80,600,323$ 15,234,622$ 101 loop in Maricopa County.Major widening of Interstate 17 from Jomax Road to Carefree Highway 01/23/2008 74,381,601 10,774,525 at State Route 74 in Maricopa County.Major widening of Interstate 17 from State Route 101 Loop to Jomax 12/24/2007 67,864,266 14,407,578 Road in Maricopa County.Construction of HOV lanes on State Route 101 from Princess Drive to 07/24/2007 47,467,400 16,574,638 State Route 202 Loop (Red Mountain Freeway) in Maricopa County.Major widening of Interstate 10 from the Picacho Peak traffic 09/24/2007 44,121,695 11,534,408 interchange to the Pinal Air Park in Pinal County north of Tucson.Construction of new roads at State Route 179 at the north forest 10/22/2007 39,921,373 9,566,900 boundary to city of Sedona in Coconino County.Major widening of State Route 101 from State Route 202 loop (Red 06/23/2008 31,241,376 - Mountain) to State Route 202 Loop (Santan) in Maricopa County.Construction of a 3-way roadway and bridge approach on US 191 08/20/2007 27,709,119 15,538,910 south of Clifton in Greenlee County. Construction of new roadway on US 93 at the Wickenburg bypass in 11/19/2007 26,970,653 7,077,969 Maricopa County.Construction of 64th Street traffic interchange on State Route 101 in 09/24/2007 23,642,706 19,366,040 Maricopa County.Capacity additions at the intersections of State Route 89 and 10/22/2007 23,589,901 8,239,964 State Route 69 in Yavapai County. In addition to many smaller projects, the following major highway construction projects had expenditures in excess of $20 million in fiscal year 2008. These project expenditures include payments made to construction contractors (as shown above) as well as utility, design, right-of-way, and landscaping costs.
Location DescriptionProject
Expenditures Interstate 10 from Price Road to 29th Street within the City of Tucson in Pima County. 80,225,610$ State Route Loop 202 (Red Mountain) from Power Road to University Drive within the City of Mesa 71,499,641 in Maricopa County.State Route Loop 101 (Agua Fria) and Interstate 17 interchange in Maricopa County. 39,308,201 US 60 roadway widening from Apache Junction to Globe in Pinal County. 38,736,599 State Route Loop 303 from Happy Valley Road to Interstate 17, north of Surprise in Maricopa County. 34,906,259 Interstate 17 Jomax Road and Dixiletta Drive Interchanges in Maricopa County. 34,461,667 State Route 179 south of Sedona in Coconino and Yavapai Counties. 32,046,857 State Route 51 from Shea Boulevard to State Route Loop 101 (Pima) in Maricopa County 28,445,574 Interstate 17 from Jomax Road to Carefree Highway in Maricopa County. 28,325,870 Interstate 10 from the Marana interchange to the Cortaro Road interchange in Pima County 20,443,465 State Route 101 (Pima) in the city of Phoenix in Maricopa County 20,232,600

Arizona Department of Transportation Management’s Discussion and Analysis
June 30, 2008
2008 Comprehensive Annual Financial Report
13
Non-Current Liabilities (See Note 5G to the financial statements for additional information): The Department’s non-current liabilities for its governmental and business-type activities as of June 30, 2008, amount to $2.5 billion, an increase of $474.9 million from the previous fiscal year. The decrease in advances and notes payable in governmental activities was due primarily to the repayment of loans to the Highway Expansion and Extension Loan Program by the General Fund (State Highway Fund).
2008 2007Highway revenue bonds 1,623,905,000$ 1,490,600,000$ Transportation excise tax revenue bonds 350,955,000 - Grant anticipation notes (GARVEE bonds) 298,280,000 282,860,000 Premium on bonds 128,586,354 108,034,322 Compensated absences 15,455,342 14,410,376 Capital leases 7,535,394 10,600,742 Advances and notes payable 56,738,689 102,209,782
Total governmental activities 2,481,455,779 2,008,715,222
Accrued interest payable 2,170,356 - Compensated absences 145,255 151,201
Total business-type activities 2,315,611 151,201
Total non-current liabilities 2,483,771,390$ 2,008,866,423$
Governmental Activities
Business-type Activities
The Department has issued revenue bonds in 42 separate issues between 1980 and 2008. All bonds outstanding as of June 30, 2008, are scheduled to mature on various dates, but not later than July 1, 2033. The bonds are obligations of the Transportation Board of the State of Arizona Department of Transportation (Transportation Board) and are not obligations of the State of Arizona. This data was gathered from the various bond records on file since the 1980s. Of the $6.5 billion total in bonds issued between 1980 and 2008, $1.4 billion, or approximately 22 percent, have been refunding issues to lower debt service costs. These efforts have resulted in cumulative debt service savings of $82.4 million in current dollars and $60.5 million on a present value basis. The senior lien Highway Revenue Bonds have been rated AAA/Aa1 by Standard & Poor’s Ratings Services and Moody’s Investors Service, respectively. The Department’s subordinate lien Highway Revenue Bonds, as a result of a rating increase on September 26, 2006, are rated AAA/Aa2. The Department’s Transportation Excise Tax Revenue bonds are rated AA+/Aa2. The Grant Anticipation Notes (GARVEE bonds) are rated AA-/Aa3/AA with the additional rating provided by Fitch Ratings. Arizona Revised Statutes, §28-7678, authorized the Transportation Board to issue non-negotiable Board Funding Obligations (BFOs) for purchase by the Arizona State Treasurer. Laws 2005, Chapter 150 (HB 2123), authorized the Transportation Board to issue BFOs in the principal amount of $200 million in any fiscal year from fiscal years 2006 through 2020, and that mature no later than four calendar years after the date of issuance. The distribution of this authority is $60 million to the General Fund (State Highway Fund) and $140 million to the Highway Expansion and Extension Loan Program Fund. The BFOs are used to help capitalize Arizona’s State Infrastructure Bank, which allows the Department and political subdivisions to apply for loans from the fund established by this legislation. Because of State General Fund cash requirements, the Transportation Board lowered the amount of outstanding BFOs from $200 million, as of the end of fiscal year 2007, to $110 million as of the end of fiscal year 2008.
In fiscal year 2008, the Department issued Highway Revenue Bonds totaling $193,950,000 to (i) finance portions of the Transportation Board’s Five-Year Transportation Facilities Construction Program and (ii) pay costs of issuing the bonds. In fiscal year 2007, the State Transportation Board received legislative authority to begin issuing

Arizona Department of Transportation Management’s Discussion and Analysis
June 30, 2008
2008 Comprehensive Annual Financial Report
14
Highway Revenue Bonds with maturities up to 30 years in length, replacing the 20 year maturity requirement that had been in place since 1980, and these were the first bonds issued under this new authority. Also in fiscal year 2008, the Department issued Transportation Excise Tax Revenue bonds totaling $370,000,000 to pay (i) the costs of design, right-of-way purchase, or construction of certain freeways and other routes within Maricopa County and (ii) the costs of issuing the bonds, and issued Grant Anticipation Notes (GARVEE bonds) totaling $68,000,000 for the purpose of (i) paying a portion of the costs of certain controlled-access highways in Maricopa County and (ii) paying the costs of issuing the note. Requests for Information This financial report is designed to provide our citizens, taxpayers, customers, investors, and creditors with an overview of the Department’s finances. Questions concerning any of the information provided in this report or requests for additional financial information should be addressed to the Controller, Arizona Department of Transportation, 206 S. 17th Avenue, Phoenix, Arizona, 85007 or by visiting our website at http://www.azdot.gov/Inside_ADOT/fms/cafr/CAFR2008.pdf.

Basic Financial StatementsGovernment-wide Financial Statements - include the Statement of Net Assets and the Statement of Activities and use the accrual basis of accounting for financial reporting.
Governmental Funds Financial Statements - include the Balance Sheet and Statement of Revenues, Expenditures, and Changes in Fund Balances for the major governmental funds and use the modified accrual basis of accounting for financial reporting. Also include the reconciliations to the government-wide financial statements.
Proprietary Funds Financial Statements - include the Statement of Net Assets, the Statement of Revenues, Expenses, and Changes in Fund Net Assets and the Statement of Cash Flows for the business-type activities and use the accrual basis of accounting for financial reporting.
Fiduciary Funds Financial Statement - includes the Statement of Net Assets for assets being held for parties outside of the Department.
Notes to the Financial Statements
2008 Comprehensive Annual Financial Report

Exhibit 1
Governmental Business-typeActivities Activities Total
ASSETSUnrestricted cash on deposit with the State Treasurer 97,875,861$ 1,963,752$ 99,839,613$ Receivables:
Notes and loans 10,921,678 68,005,408 78,927,086 Subscriptions, net of allowance for doubtful accounts - 226,753 226,753 Accrued interest 9,895,103 678,037 10,573,140 Taxes and fees 69,818,510 - 69,818,510 Other, net of allowance for doubtful accounts 22,318,406 271,839 22,590,245
Due from U.S. Government for reimbursable costs 50,603,460 - 50,603,460 Internal balances 19,996,904 <19,996,904> - Inventories 10,657,024 708,249 11,365,273 Prepaid items - 247,820 247,820 Deferred charges 32,024,532 - 32,024,532 Restricted cash on deposit with the State Treasurer 1,466,992,566 77,630,108 1,544,622,674 Capital assets not subject to depreciation (Note 5A) 15,061,147,219 7,900 15,061,155,119 Capital assets subject to depreciation, net of
accumulated depreciation (Note 5A) 188,068,775 164,825 188,233,600 Total assets 17,040,320,038 129,907,787 17,170,227,825
LIABILITIESAccounts payable and other current liabilities 14,743,230 99,438 14,842,668 Accrued payroll and other accrued expenses 20,329,156 98,932 20,428,088 Contracts and retainage payable 117,849,488 - 117,849,488
139,513,554 - 139,513,554 6,411,415 - 6,411,415
60,000,000 50,000,000 110,000,000 - 2,973,902 2,973,902
Non-current liabilities (Note 5G):Due within one year 165,846,297 145,255 165,991,552 Due in more than one year 2,315,609,482 2,170,356 2,317,779,838
Total liabilities 2,840,302,622 55,487,883 2,895,790,505
NET ASSETSInvested in capital assets, net of related debt 13,285,437,940 172,725 13,285,610,665 Restricted:
Loans and other financial assistance - 74,115,046 74,115,046 Debt service 2,234,889 - 2,234,889 Capital projects 702,694,765 - 702,694,765
Unrestricted 209,649,822 132,133 209,781,955 Total net assets 14,200,017,416$ 74,419,904$ 14,274,437,320$
The notes to the financial statements are an integral part of this statement.
Deferred revenues (Note 5C)Board funding obligations (Note 5H)
2008 Comprehensive Annual Financial Report
Arizona Department of TransportationStatement of Net Assets
June 30, 2008
Due to Arizona counties and citiesDue to other state agencies
15
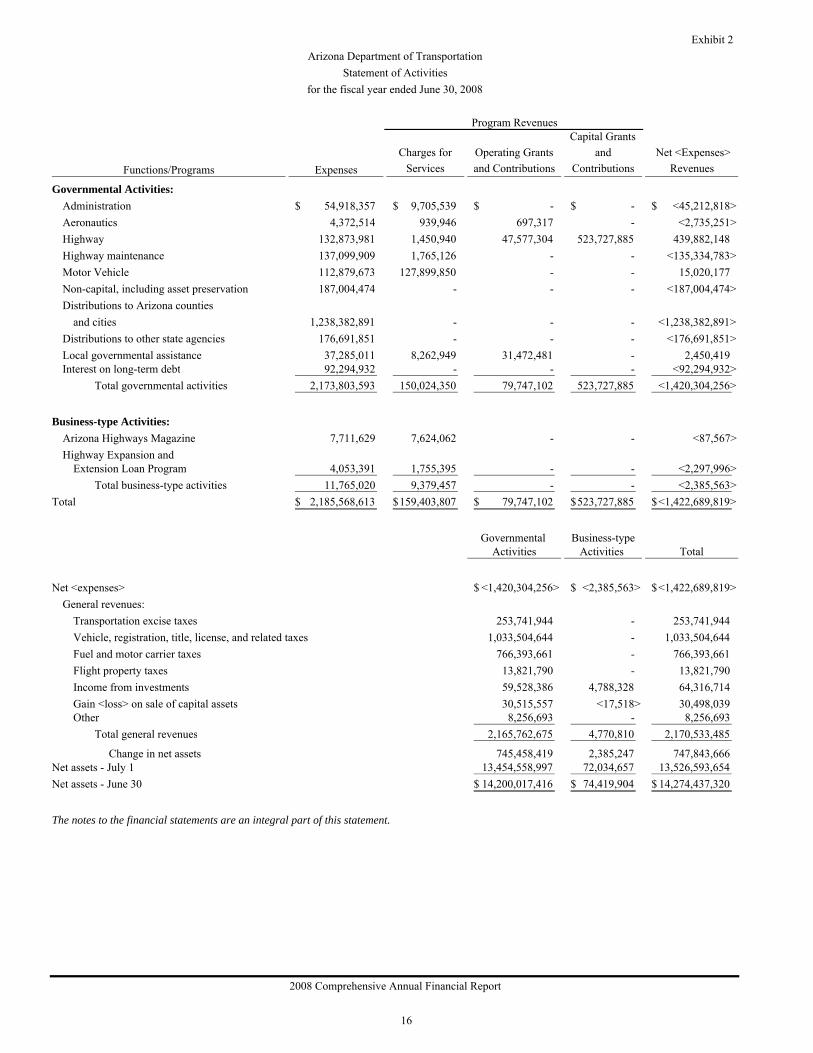
Exhibit 2
ExpensesCharges for
ServicesOperating Grants and Contributions
Capital Grants and
Contributions Net <Expenses>
Revenues
Governmental Activities:Administration 54,918,357$ 9,705,539$ -$ -$ <45,212,818>$ Aeronautics 4,372,514 939,946 697,317 - <2,735,251> Highway 132,873,981 1,450,940 47,577,304 523,727,885 439,882,148 Highway maintenance 137,099,909 1,765,126 - - <135,334,783> Motor Vehicle 112,879,673 127,899,850 - - 15,020,177 Non-capital, including asset preservation 187,004,474 - - - <187,004,474> Distributions to Arizona counties
and cities 1,238,382,891 - - - <1,238,382,891> Distributions to other state agencies 176,691,851 - - - <176,691,851> Local governmental assistance 37,285,011 8,262,949 31,472,481 - 2,450,419 Interest on long-term debt 92,294,932 - - - <92,294,932>
Total governmental activities 2,173,803,593 150,024,350 79,747,102 523,727,885 <1,420,304,256>
Business-type Activities:Arizona Highways Magazine 7,711,629 7,624,062 - - <87,567> Highway Expansion and
Extension Loan Program 4,053,391 1,755,395 - - <2,297,996> Total business-type activities 11,765,020 9,379,457 - - <2,385,563>
Total 2,185,568,613$ 159,403,807$ 79,747,102$ 523,727,885$ <1,422,689,819>$
Governmental Business-typeActivities Activities Total
Net <expenses> <1,420,304,256>$ <2,385,563>$ <1,422,689,819>$ General revenues:
Transportation excise taxes 253,741,944 - 253,741,944 Vehicle, registration, title, license, and related taxes 1,033,504,644 - 1,033,504,644 Fuel and motor carrier taxes 766,393,661 - 766,393,661 Flight property taxes 13,821,790 - 13,821,790 Income from investments 59,528,386 4,788,328 64,316,714 Gain <loss> on sale of capital assets 30,515,557 <17,518> 30,498,039 Other 8,256,693 - 8,256,693
Total general revenues 2,165,762,675 4,770,810 2,170,533,485
Change in net assets 745,458,419 2,385,247 747,843,666 Net assets - July 1 13,454,558,997 72,034,657 13,526,593,654 Net assets - June 30 14,200,017,416$ 74,419,904$ 14,274,437,320$
The notes to the financial statements are an integral part of this statement.
Arizona Department of TransportationStatement of Activities
for the fiscal year ended June 30, 2008
2008 Comprehensive Annual Financial Report
Program Revenues
Functions/Programs
16

Governmental Funds Financial Statements
Major Funds
General Fund (State Highway Fund)This fund is used to account for all financial transactions applicable to the general operations of the Department. The fund receives money from the Highway User Revenue Fund including vehicle registration, title, license, and related fees, and fuel and motor carrier taxes. Reimbursements for certain construction expenditures are received from the federal government, Arizona cities and counties, and other state agencies. The fund also receives interest and other revenues. The fund disburses money primarily for the engineering, construction, improvement, and maintenance of state highways, parts of highways forming state routes, and highways under cooperative agreements with the United States and day-to-day operating expenses.
Maricopa Regional Area Road Construction FundThis fund receives certain Maricopa County transportation excise tax monies collected by the Department of Revenue. These monies are used for the construction of new freeways and other routes, improvements to existing freeways and other routes, and improvements to the arterial street system within Maricopa County.
Motor Vehicle Division Clearing FundThis fund accounts for the collection and disbursement of Motor Vehicle Division revenues.
Highway User Revenue FundThis fund receives all revenues collected by the Motor Vehicle Division and its agents that are not designated for other purposes. The revenues include: motor fuel taxes, a portion of vehicle license tax, vehicle registration fees, driver license fees, dealer fees, permits, and other miscellaneous fees. These monies are distributed to the General Fund (State Highway Fund), the Department of Public Safety, the Economic Strength Project Fund, incorporated cities, counties, and other legislatively appropriated distributions.
Debt Service FundThis fund is used to administer all payments of principal and interest on bonds and notes issued by the Arizona Transportation Board for Highway Revenue Bonds, Transportation Excise Tax Revenue Bonds, and Grant Anticipation Notes (GARVEE bonds).
Capital Projects FundThis fund is used to administer bond proceeds for Arizona Transportation Board Highway Revenue Bonds, Arizona Transportation Board Transportation Excise Tax Revenue Bonds, Grant Anticipation Notes (GARVEE bonds), and Board Funding Obligations. These monies are expended for the construction of projects in the Five-Year Transportation Facilities Construction Program.
Non-Major Funds
Other Governmental Funds are the non-major funds and are all special revenue funds. These funds can be found on Exhibit 9 and Exhibit 10.
2008 Comprehensive Annual Financial Report

Maricopa MotorRegional Vehicle Highway
General Area Road Division UserFund Construction Clearing Revenue
(State Highway Fund) Fund Fund Fund
ASSETSUnrestricted cash on deposit with the
State Treasurer 65,523,282$ -$ -$ -$ Receivables:
Accrued interest 3,121,232 1,830,988 - 288,749 Interfund (Note 5E) 108,569,888 2,264,550 - 45,534,940 Taxes and fees - - 12,545,902 57,272,608 Notes and loans 2,268,000 24,712 - - Other (net) 16,598,374 2,155,653 - -
Amounts due from:U.S. Government 41,700,867 5,680,352 - -
Inventories 7,131,814 - - - Advance to other funds 20,000,000 - - - Deferred charges - - 8,128,423 - Land held for resale 13,184,013 - - - Restricted cash on deposit with the State Treasurer 478,558,769 232,015,767 66,767,001 110,972,849
Total assets 756,656,239$ 243,972,022$ 87,441,326$ 214,069,146$
LIABILITIES AND FUND BALANCESLiabilities:
Accounts payable 8,491,971$ -$ 4,998,424$ -$ Accrued payroll and other accrued
expenditures 14,647,042 4,837,629 - - Contracts and retainage payable 67,478,262 39,547,689 - - Interfund payables (Note 5E) 2,603,667 475 48,790,246 107,981,931 Amounts due to:
Arizona counties and cities - - 30,120,797 106,087,215 Other state agencies - - 3,510,359 -
Board funding obligations 60,000,000 - - - Surety and rental deposits 368,369 - 21,500 - Deferred revenue 2,268,000 24,712 - - Advances and notes payable 37,209,782 - - -
Total liabilities 193,067,093 44,410,505 87,441,326 214,069,146
Fund balances:Reserved for:
Inventories 7,131,814 - - - Advance to other funds 20,000,000 - - - Debt service - - - - Capital projects 478,558,769 199,561,517 - -
Unreserved reported in:General fund 57,898,563 - - - Non-major special revenue funds - - - -
Total fund balances 563,589,146 199,561,517 - - Total liabilities and fund balances 756,656,239$ 243,972,022$ 87,441,326$ 214,069,146$
The notes to the financial statements are an integral part of this statement.
2008 Comprehensive Annual Financial Report
Arizona Department of TransportationBalance Sheet
Governmental FundsJune 30, 2008
Special Revenue Funds
17

Exhibit 3
Total Non-Major
Debt Capital Governmental TotalService Projects Funds GovernmentalFund Fund (See Exhibit 9) Funds
-$ -$ 28,653,810$ 94,177,092$
604,455 3,821,862 194,485 9,861,771 - - 3,008,263 159,377,641 - - - 69,818,510 - - 8,628,966 10,921,678 - - 3,564,379 22,318,406
- - 3,222,241 50,603,460 - - - 7,131,814 - - - 20,000,000 - - - 8,128,423 - - - 13,184,013
2,607,901 559,614,482 16,455,797 1,466,992,566 3,212,356$ 563,436,344$ 63,727,941$ 1,932,515,374$
-$ -$ 827,084$ 14,317,479$
- - 235,849 19,720,520 - 6,615,778 4,207,759 117,849,488 - 222 - 159,376,541
- - 3,305,542 139,513,554 - - 2,901,056 6,411,415 - - - 60,000,000 - - - 389,869 - - 8,628,966 10,921,678 - - - 37,209,782 - 6,616,000 20,106,256 565,710,326
- - - 7,131,814 - - - 20,000,000
3,212,356 - 93 3,212,449 - 556,820,344 18,262,150 1,253,202,780
- - - 57,898,563 - - 25,359,442 25,359,442
3,212,356 556,820,344 43,621,685 1,366,805,048 3,212,356$ 563,436,344$ 63,727,941$ 1,932,515,374$
2008 Comprehensive Annual Financial Report
18

Exhibit 3.1
Total fund balances - governmental funds (Exhibit 3) 1,366,805,048$
Amounts reported for governmental activities in the Statement of NetAssets (Exhibit 1) are different because:
Capital assets used in governmental activities are not financial resourcesand, therefore, are not reported in the funds (Note 4 B). 15,193,591,198
Internal service funds are used by management to charge the costsof equipment rentals to individual funds. The assets and liabilities ofthe internal service funds are included in governmental activities in
the Statement of Net Assets (Exhibit 5). 55,601,234 Other long-term assets are not available to pay for current-period
expenditures and, therefore, are deferred in the funds (Note 4 B). 10,921,678 Long-term liabilities, including bonds payable, are not due and
payable in the current period and, therefore, are not reported in the funds (Note 4 B). <2,426,901,742>
Net assets of governmental activities (Exhibit 1) 14,200,017,416$
The notes to the financial statements are an integral part of this statement.
2008 Comprehensive Annual Financial Report
June 30, 2008
Reconciliation of the Balance Sheet of Governmental Funds Arizona Department of Transportation
to the Statement of Net Assets
19

Maricopa MotorRegional Vehicle Highway
General Area Road Division UserFund Construction Clearing Revenue
(State Highway Fund) Fund Fund Fund
Revenues:Transportation excise taxes -$ 253,741,944$ -$ -$ Vehicle registration, title, license,
and related taxes and fees 309,114,851 - 503,866,928 335,712,838 Fuel and motor carrier taxes and fees 373,892,981 - 5,918,026 353,582,197 Reimbursement of construction
expenditures - federal aid 350,402,640 76,582,391 - - Other federal grants and reimbursements 47,577,304 - - - Reimbursements from Arizona counties and cities 30,224,757 121,812 - - Distributions from other state agencies 462,792 - - - Interest on loans receivable 255,493 148,002 - - Income from investments 25,847,077 10,751,043 - 2,684,248 Flight property taxes - - - - Grand Canyon National Park Airport - - - - Rental income 1,089,766 276,832 - - Other 2,827,413 440,018 - 2,854,331
Total revenues 1,141,695,074 342,062,042 509,784,954 694,833,614
Expenditures:Current:
Transportation:Administration 43,517,358 303,054 - - Aeronautics - - - - Highway 130,300,418 3,548,739 - - Highway maintenance 124,325,879 5,108,014 - - Motor Vehicle 105,258,378 - - 1,821
Total transportation 403,402,033 8,959,807 - 1,821
The notes to the financial statements are an integral part of this statement.
Arizona Department of TransportationStatement of Revenues, Expenditures, and Changes in Fund Balances
Governmental Fundsfor the fiscal year ended June 30, 2008
Special Revenue Funds
2008 Comprehensive Annual Financial Report
20

Exhibit 4
Total Non-Major
Debt Capital GovernmentalService Projects Funds GovernmentalFund Fund (See Exhibit 10) Funds
-$ -$ -$ 253,741,944$
- - 10,779,391 1,159,474,008 - - 34,653,057 768,046,261
- - 67,599,433 494,584,464 - - 32,169,798 79,747,102 - - 8,262,949 38,609,518 - - - 462,792 - - 293,242 696,737
2,446,021 15,539,226 1,929,609 59,197,224 - - 13,821,790 13,821,790 - - 939,946 939,946 - - - 1,366,598 - - 84,288 6,206,050
2,446,021 15,539,226 170,533,503 2,876,894,434
48,475 453,237 - 44,322,124 - - 4,088,494 4,088,494 - - 37,285,011 171,134,168 - 6,195,246 - 135,629,139 - - 5,722,144 110,982,343
48,475 6,648,483 47,095,649 466,156,268
(continued)
Total
2008 Comprehensive Annual Financial Report
21

Maricopa MotorRegional Vehicle Highway
General Area Road Division UserFund Construction Clearing Revenue
(State Highway Fund) Fund Fund Fund
Arizona Department of TransportationStatement of Revenues, Expenditures, and Changes in Fund Balances
Governmental Fundsfor the fiscal year ended June 30, 2008
Special Revenue Funds
Intergovernmental:Distributions to Arizona counties and cities 45,030,296$ 31,121,828$ 471,457,051$ 674,427,121$ Distributions to other state agencies 56,715,904 - 38,327,903 20,404,672
Debt service:Principal 60,393,159 - - - Interest 1,416,562 - - - Bond issuance costs - - - -
Non-capital, including asset preservation 76,222,090 30,106,228 - - Capital outlay 466,501,003 259,809,925 - -
Total expenditures 1,109,681,047 329,997,788 509,784,954 694,833,614
Excess <deficiency> of revenues over<under> expenditures 32,014,027 12,064,254 - -
Other financing sources <uses>:Transfers in 71,949,416 - - - Transfers out for debt service <134,245,911> <29,718,101> - - Transfers out other - <67,697,989> - - Sale of capital assets 25,930,668 2,302,732 - - Insurance recovery 1,765,126 - - - Debt issuance 68,484,365 11,044,542 - - Premium from debt issuance - - - -
Total other financing sources <uses> 33,883,664 <84,068,816> - -
Net change in fund balances 65,897,691 <72,004,562> - - Fund balances - July 1 497,691,455 271,566,079 - - Fund balances - June 30 563,589,146$ 199,561,517$ -$ -$
The notes to the financial statements are an integral part of this statement.
2008 Comprehensive Annual Financial Report
22

Exhibit 4
Total Non-Major
Debt Capital GovernmentalService Projects Funds GovernmentalFund Fund (See Exhibit 10) Funds
Total
-$ -$ 19,073,388$ 1,241,109,684$ - - 57,956,972 173,405,451
132,270,000 - - 192,663,159 101,166,167 - - 102,582,729
- 3,447,378 - 3,447,378 - 52,662,715 - 158,991,033 - 263,570,660 - 989,881,588
233,484,642 326,329,236 124,126,009 3,328,237,290
<231,038,621> <310,790,010> 46,407,494 <451,342,856>
231,563,445 - - 303,512,861 - - <67,599,433> <231,563,445> - <4,188,471> <62,956> <71,949,416> - - - 28,233,400 - - - 1,765,126 - 631,950,000 - 711,478,907 - 31,861,772 - 31,861,772
231,563,445 659,623,301 <67,662,389> 773,339,205
524,824 348,833,291 <21,254,895> 321,996,349 2,687,532 207,987,053 64,876,580 1,044,808,699 3,212,356$ 556,820,344$ 43,621,685$ 1,366,805,048$
2008 Comprehensive Annual Financial Report
23

Exhibit 4.1
Net change in fund balances - total governmental funds (Exhibit 4) 321,996,349$
Amounts reported for governmental activities in the Statement of Activities (Exhibit 2) are different because:
Capital outlays are reported as expenditures in governmental funds (Note 4C). 956,234,903 Bond proceeds provide current financial resources to governmental funds.
However, issuing debt increases long-term liabilities in the statement
of net assets. Governmental funds report the effect of issuance costs,premiums, discounts, and similar items when the debt is first issued,whereas these amounts are deferred and amortized in the statementof activities (Note 4C). <743,340,679>
Repayment of long-term debt is reported as an expenditure in governmentalfunds, but the repayment reduces long-term liabilities in the statement ofnet assets (Note 4C). 206,267,729
Internal service funds are used by management to charge the cost of equipmentrentals to individual funds. The net loss of the internal service fundsis reported with governmental activities (Note 4C). 2,310,056
Some items reported in the statement of activities do not require the use of current financial resources and, therefore, are not reported as expendituresin governmental funds (Note 4C). 1,990,061
Change in net assets of governmental activities (Exhibit 2) 745,458,419$
The notes to the financial statements are an integral part of this statement.
2008 Comprehensive Annual Financial Report
Arizona Department of TransportationReconciliation of the Statement of Revenues,
to the Statement of Activitiesfor the fiscal year ended June 30, 2008
Expenditures, and Changes in Fund Balances of Governmental Funds
24

Proprietary Funds Financial Statements
Major Funds
Arizona Highways Magazine FundThe Department uses this fund in the publishing and marketing of the Arizona Highways Magazine and various other products that promote the State of Arizona.
Highway Expansion and Extension Loan Program FundThis fund is an innovative financing mechanism to administer monies designated to provide loans and credit enhancement assistance to the Department and to sponsors of local transportation projects.
Non-Major Fund
Internal Service FundThe Department’s own internal service fund, known as the Equipment Fund, purchases and maintains equipment and materials to be used by other funds and state agencies.
2008 Comprehensive Annual Financial Report

Exhibit 5
Highway Arizona GovernmentalExpansion and Highways Activities -
Extension Loan Magazine InternalProgram Fund Fund Total Service Fund
ASSETSCurrent assets:
Unrestricted cash on deposit with the State Treasurer -$ 1,963,752$ 1,963,752$ 3,698,769$ Restricted cash on deposit with the State Treasurer 77,630,108 - 77,630,108 - Receivables:
Subscriptions, net of allowance for doubtful accounts - 226,753 226,753 - Accrued interest 669,877 8,160 678,037 33,332 Loans 47,732,252 - 47,732,252 - Other, net allowance for doubtful accounts - 271,839 271,839 -
Inventories - 708,249 708,249 3,525,210 Prepaid items - 247,820 247,820 -
Total current assets 126,032,237 3,426,573 129,458,810 7,257,311
Non-current assets:Loans receivable 20,273,156 - 20,273,156 - Capital assets not subject to depreciation - 7,900 7,900 - Capital assets subject to depreciation, net of
accumulated depreciation - 164,825 164,825 55,624,796 Total noncurrent assets 20,273,156 172,725 20,445,881 55,624,796
Total assets 146,305,393 3,599,298 149,904,691 62,882,107
LIABILITIESCurrent liabilities:
Accounts payable - 99,438 99,438 35,882 Accrued payroll and other accrued expenses 6,170 92,762 98,932 608,636 Interfund payables (Note 5E) - - - 1,100 Board Funding Obligations (Note 5H) 50,000,000 - 50,000,000 - Compensated absences 13,821 131,434 145,255 522,149 Advance from other funds 20,000,000 - 20,000,000 - Deferred revenue - 2,973,902 2,973,902 - Capital leases payable (Note 5F) - - - 2,768,919
Total current liabilities 70,019,991 3,297,536 73,317,527 3,936,686
Non-current liabilities:2,170,356 - 2,170,356 -
Compensated absences - - - 234,473 Capital leases payable (Note 5F) - - - 3,109,714
Total noncurrent liabilities 2,170,356 - 2,170,356 3,344,187 Total liabilities 72,190,347 3,297,536 75,487,883 7,280,873
NET ASSETSInvested in capital assets, net of related debt - 172,725 172,725 49,746,163 Restricted for loans and other financial assistance 74,115,046 - 74,115,046 - Unrestricted - 129,037 129,037 5,855,071
Total net assets 74,115,046$ 301,762$ 74,416,808 55,601,234$
3,096 Net assets of business-type activities 74,419,904$
The notes to the financial statements are an integral part of this statement.
2008 Comprehensive Annual Financial Report
Business-type Activities - Enterprise Funds
Arizona Department of TransportationStatement of Net Assets
Proprietary FundsJune 30, 2008
Adjustment to reflect the consolidation of internal service fund activities related to enterprise funds
Accrued interest payable
25

Exhibit 6
Highway Arizona GovernmentalExpansion and Highways Activities -
Extension Loan Magazine InternalProgram Fund Fund Total Service Fund
Operating revenues:Sales and charges for services (net of write off $89,207) -$ 6,943,929$ 6,943,929$ 40,268,274$ Interest on loans receivables 1,755,395 - 1,755,395 - Other - 680,133 680,133 35,111
Total operating revenues 1,755,395 7,624,062 9,379,457 40,303,385
Operating expenses:Publication and promotional cost - 3,150,523 3,150,523 - Repair and maintenance 319 70,994 71,313 2,811,109 Fuel and lubricants - - - 9,708,534 Salaries and related benefits 146,321 2,123,481 2,269,802 14,439,277 Shipping and postage 229 1,175,499 1,175,728 - Supplies 2,477 68,516 70,993 312,421 Equipment purchase and rental - 13,942 13,942 133,577 Professional and outside services 24,759 715,153 739,912 156,249 Insurance - - - 605,300 Travel 254 18,622 18,876 70,173 Interest on notes payable 3,795,890 - 3,795,890 - Depreciation - 40,114 40,114 9,030,352 Other 891 333,521 334,412 1,407,077
Total operating expenses 3,971,140 7,710,365 11,681,505 38,674,069
Operating <loss> income <2,215,745> <86,303> <2,302,048> 1,629,316
Non-operating revenues <expenses>:Interest on investments 4,705,331 82,997 4,788,328 337,257 Investment expense <80,251> <1,466> <81,717> <6,095> Gain <loss> on sale/disposal of capital assets - <17,518> <17,518> <126,784> Insurance recoveries - - - 50,194 Interest on capital leases - - - <262,554> Distributions to other state agencies <2,000> - <2,000> <3,286,400>
Total non-operating revenues <expenses> 4,623,080 64,013 4,687,093 <3,294,382>
Capital contributions - - - 3,975,324
Changes in net assets 2,407,335 <22,290> 2,385,045 2,310,258 Total net assets - July 1 71,707,711 324,052 53,290,976 Total net assets - June 30 74,115,046$ 301,762$ 55,601,234$
202 Change in net assets of business-type activities 2,385,247$
The notes to the financial statements are an integral part of this statement.
2008 Comprehensive Annual Financial Report
Business-type Activities - Enterprise Funds
Arizona Department of TransportationStatement of Revenues, Expenses, and
Proprietary Fundsfor the fiscal year ended June 30, 2008
Changes in Fund Net Assets
Adjustment to reflect the consolidation of internal service fund activities related toenterprise funds
26
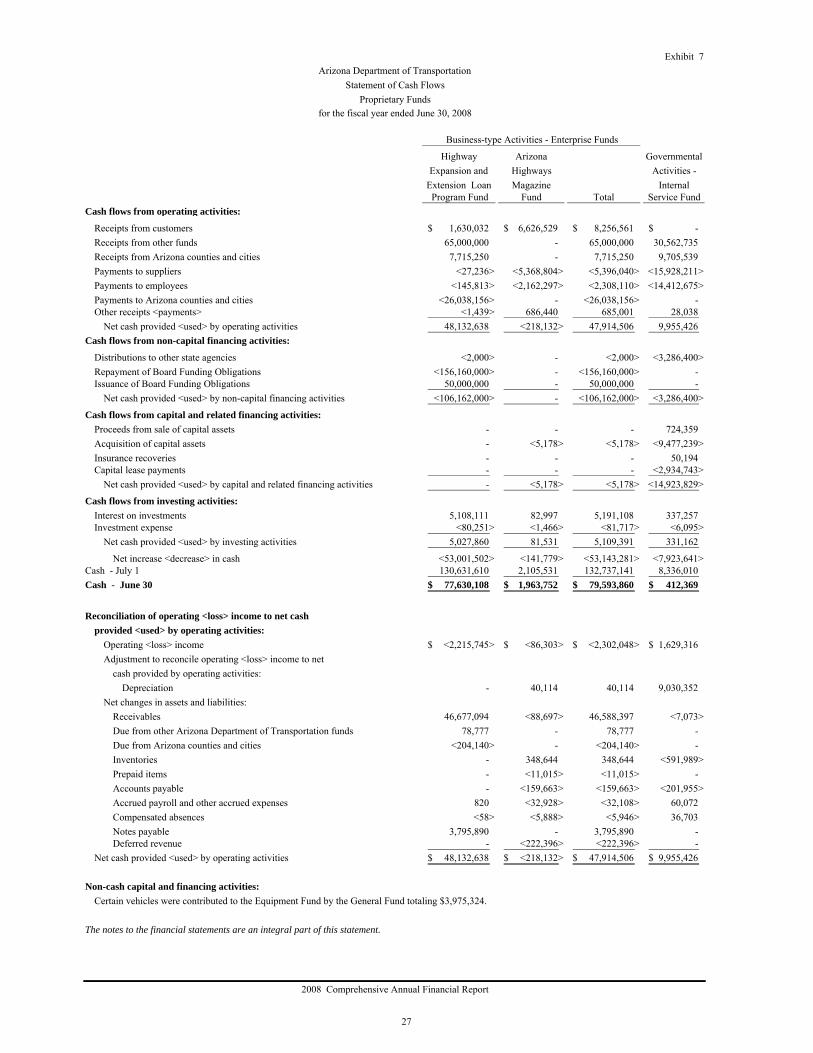
Exhibit 7
Highway Arizona GovernmentalExpansion and Highways Activities -
Extension Loan Magazine Internal Program Fund Fund Total Service Fund
Cash flows from operating activities:
Receipts from customers 1,630,032$ 6,626,529$ 8,256,561$ -$ Receipts from other funds 65,000,000 - 65,000,000 30,562,735 Receipts from Arizona counties and cities 7,715,250 - 7,715,250 9,705,539 Payments to suppliers <27,236> <5,368,804> <5,396,040> <15,928,211> Payments to employees <145,813> <2,162,297> <2,308,110> <14,412,675> Payments to Arizona counties and cities <26,038,156> - <26,038,156> - Other receipts <payments> <1,439> 686,440 685,001 28,038
Net cash provided <used> by operating activities 48,132,638 <218,132> 47,914,506 9,955,426 Cash flows from non-capital financing activities:
Distributions to other state agencies <2,000> - <2,000> <3,286,400> Repayment of Board Funding Obligations <156,160,000> - <156,160,000> - Issuance of Board Funding Obligations 50,000,000 - 50,000,000 -
Net cash provided <used> by non-capital financing activities <106,162,000> - <106,162,000> <3,286,400>
Cash flows from capital and related financing activities:Proceeds from sale of capital assets - - - 724,359 Acquisition of capital assets - <5,178> <5,178> <9,477,239> Insurance recoveries - - - 50,194 Capital lease payments - - - <2,934,743>
Net cash provided <used> by capital and related financing activities - <5,178> <5,178> <14,923,829>
Cash flows from investing activities:Interest on investments 5,108,111 82,997 5,191,108 337,257 Investment expense <80,251> <1,466> <81,717> <6,095>
Net cash provided <used> by investing activities 5,027,860 81,531 5,109,391 331,162
Net increase <decrease> in cash <53,001,502> <141,779> <53,143,281> <7,923,641> Cash - July 1 130,631,610 2,105,531 132,737,141 8,336,010 Cash - June 30 77,630,108$ 1,963,752$ 79,593,860$ 412,369$
Reconciliation of operating <loss> income to net cashprovided <used> by operating activities:
Operating <loss> income <2,215,745>$ <86,303>$ <2,302,048>$ 1,629,316$ Adjustment to reconcile operating <loss> income to net
cash provided by operating activities:Depreciation - 40,114 40,114 9,030,352
Net changes in assets and liabilities:Receivables 46,677,094 <88,697> 46,588,397 <7,073> Due from other Arizona Department of Transportation funds 78,777 - 78,777 - Due from Arizona counties and cities <204,140> - <204,140> - Inventories - 348,644 348,644 <591,989> Prepaid items - <11,015> <11,015> - Accounts payable - <159,663> <159,663> <201,955> Accrued payroll and other accrued expenses 820 <32,928> <32,108> 60,072 Compensated absences <58> <5,888> <5,946> 36,703 Notes payable 3,795,890 - 3,795,890 - Deferred revenue - <222,396> <222,396> -
Net cash provided <used> by operating activities 48,132,638$ <218,132>$ 47,914,506$ 9,955,426$
Non-cash capital and financing activities:Certain vehicles were contributed to the Equipment Fund by the General Fund totaling $3,975,324.
The notes to the financial statements are an integral part of this statement.
2008 Comprehensive Annual Financial Report
Arizona Department of TransportationStatement of Cash Flows
Proprietary Fundsfor the fiscal year ended June 30, 2008
Business-type Activities - Enterprise Funds
27

Fiduciary Funds Financial Statement
Agency Funds
Highway Properties - Privilege Tax FundThis fund collects monies from renters of properties previously acquired by the Department for use in future highway development. Monies collected are distributed to the Department of Revenue.
Highway Properties - 24 Percent FundThis fund collects 24 percent of the Department’s rental income from properties for use in future highway development. Monies collected are distributed to the local counties.
2008 Comprehensive Annual Financial Report

Exhibit 8
ASSETSRestricted cash on deposit with the State Treasurer 136,434$ Other receivables -
Total assets 136,434$
LIABILITIESDue to Arizona counties 136,434$ Other payables -
Total liabilities 136,434$
The notes to the financial statements are an integral part of this statement.
2008 Comprehensive Annual Financial Report
Arizona Department of TransportationStatement of Net Assets
June 30, 2008Agency Funds
28

Notes to the Financial Statements
2008 Comprehensive Annual Financial Report

Arizona Department of Transportation Index – Notes to the Financial Statements
June 30, 2008
2008 Comprehensive Annual Financial Report
29
Page Note 1 – Summary of Significant Accounting Policies ...............................................................................................30
A – Reporting Entity...........................................................................................................................................30
B – Government-wide and Fund Financial Statements.......................................................................................30
C – Measurement Focus, Basis of Accounting, and Financial Statement Presentation ......................................31
D – Assets, Liabilities, and Net Assets/Fund Balance........................................................................................33
E – Revenues and Expenditures/Expenses .........................................................................................................36
F – Interfund Activity and Balances ...................................................................................................................37
Note 2 – Funds by Classification.................................................................................................................................37
Note 3 – Budgeting, Budgetary Control, and Legal Compliance ................................................................................38
Note 4 – Accounting Pronouncements and Reconciliation of Government-wide and Fund Financial Statements .....38
A – New Accounting Pronouncements...............................................................................................................38
B – Explanations of Reconciling Items of the Balance Sheet of Governmental Funds to the
Statement of Net Assets ...........................................................................................................................40
C – Explanations of Reconciling Items of the Statement of Revenues, Expenditures, and
Changes in Fund Balances of Governmental Funds to the Statement of Activities .................................41
Note 5 – Detailed Notes on all Funds ..........................................................................................................................43
A – Capital Assets ..............................................................................................................................................43
B – Construction Commitments .........................................................................................................................44
C – Deferred Revenues.......................................................................................................................................44
D – Securities Held in Lieu of Retention............................................................................................................45
E – Interfund Receivables, Payables, Advances, and Transfers .........................................................................45
F – Leases ...........................................................................................................................................................46
G – Non-Current Liabilities................................................................................................................................47
H – Short-term Debt ...........................................................................................................................................52
I – Fund Balances ...............................................................................................................................................53
Note 6 – Other Information .........................................................................................................................................53
A – Subsequent Events .......................................................................................................................................53
B – Contingent Liabilities...................................................................................................................................53
C – Pension and Other Postemployment Benefits ..............................................................................................54

Arizona Department of Transportation Notes to the Financial Statements
June 30, 2008
2008 Comprehensive Annual Financial Report
30
1. SUMMARY OF SIGNIFICANT ACCOUNTING POLICIES The accounting and reporting policies of the Arizona Department of Transportation (Department) conform in all material respects to accounting principles generally accepted in the United States of America (GAAP) as applicable to governments. The Governmental Accounting Standards Board (GASB) is the primary standard setting body for establishing governmental accounting and financial reporting principles, which are primarily set forth in the GASB’s Codification of Governmental and Financial Reporting Standards (GASB Codification). Following is a summary of the Department’s significant accounting policies. A. Reporting Entity The Department is a department of the State of Arizona (State) and is not a legally separate entity. The Department has no component units. The Director of the Department serves as the Chief Administrative Officer and is directly responsible to the Governor. The Governor appoints a seven-member Transportation Board of the State of Arizona Department of Transportation (Transportation Board) which has responsibility for establishing a complete system of State highway routes, approving all highway construction contracts, and distributing monies for local airport facilities’ projects through a grant program. The Department is responsible for the construction and maintenance of all State highways. The Department cooperates with the various cities and counties within the state in the construction and maintenance of State roads and with the Federal Highway Administration in the construction and maintenance of interstate and other highways. Assistance in the development of local airports, registering motor vehicles and aircraft, licensing drivers, and the publishing of the Arizona Highways Magazine are also responsibilities of the Department. B. Government-wide and Fund Financial Statements The government-wide financial statements (i.e., the Statement of Net Assets and the Statement of Activities) report information on all of the non-fiduciary activities of the government. For the most part, the effect of interfund activity has been removed from these statements. Governmental activities, which normally are supported by federal reimbursement, taxes, and intergovernmental revenues, are reported separately from business-type activities, which rely to a significant extent on fees and charges for services. The Statement of Net Assets presents the reporting entity’s non-fiduciary assets and liabilities, with the difference reported as net assets. Net assets are reported in three categories:
Invested in capital assets, net of related debt consists of capital assets, net of accumulated depreciation and reduced by outstanding balances for bonds, notes, and other debt that are attributed to the acquisition, construction, or improvement of those assets. Restricted net assets result when constraints placed on asset use are either externally imposed by creditors, grantors, contributors, and the like, or imposed by law through constitutional provisions or enabling legislation. Unrestricted net assets consist of net assets which do not meet the definition of the two preceding categories. Unrestricted net assets often are designated to indicate that management does not consider them to be available for general operations. Unrestricted net assets often have constraints on resources which are imposed by management, but can be removed or modified by management or the Transportation Board.
The Statement of Activities demonstrates the degree to which the direct expenses of a given function are offset by program revenues. Direct expenses are those that are clearly identified with a specific function. Program revenues include: 1) charges to customers or applicants who purchase, use, or directly benefit from goods, services, or privileges provided by a given function, and 2) grants and contributions that are restricted to meeting the operational or capital requirements of a particular function. Taxes and other items not properly included among program revenues are reported instead as general revenues.

Arizona Department of Transportation Notes to the Financial Statements
June 30, 2008
2008 Comprehensive Annual Financial Report
31
Fund Financial Statements Separate statements are provided for governmental funds, proprietary funds, and fiduciary funds, even though the latter are excluded from the government-wide financial statements. Major individual governmental funds and major proprietary funds are reported as separate columns in the fund financial statements, with non-major funds being reported in a single column. C. Measurement Focus, Basis of Accounting, and Financial Statement Presentation The government-wide financial statements are reported using the economic resources measurement focus and the full accrual basis of accounting, as are the proprietary funds. Revenues are recorded when earned and expenses are recorded when the liability is incurred, regardless of the timing of related cash flows. Taxes are recognized as revenues in the year they are levied for transportation excise, aircraft licensing, aviation and motor fuel, flight property, and underground storage tanks. Motor carrier and vehicle license taxes are recognized when received. Grants and similar items are recognized as revenue as soon as all eligibility requirements imposed by the provider have been met. As allowed by GASB Statement No. 20, Accounting and Financial Reporting for Proprietary Funds and Other Governmental Entities that Use Proprietary Fund Accounting, the Department’s enterprise funds follow GASB pronouncements and those Financial Accounting Standard Board Statements (FASB) and Interpretations, Accounting Principle Board Opinions, and Accounting Research Bulletins that were issued on or before November 30, 1989, except those that conflict with a GASB pronouncement. The enterprise funds do not follow any FASB Statements and Interpretations issued after November 30, 1989. Governmental fund financial statements are reported using the current financial resources measurement focus and the modified accrual basis of accounting. Revenues are recognized as soon as they are both measurable and available. Revenues are considered to be available when they are collectible within the current period or soon enough thereafter to pay liabilities of the current period. For this purpose, the Department considers revenues to be available if they are collected within 60 days of the end of the fiscal year, e.g. federal revenue reimbursements, vehicle license taxes, and highway user revenue taxes. Expenditures generally are recorded when a liability is incurred as under accrual accounting. However, debt service expenditures, as well as expenditures related to compensated absences and claims and judgments, are recorded only when payment is due and payable. Financial Statement Presentation The Department reports the following major governmental funds:
The General Fund, known as the State Highway Fund, is the primary operating fund. It accounts for all financial resources except for those required to be accounted for in another fund. Expenditures are reported for general operations of the Department, including road and bridge repairs, maintenance and construction, planning and development, engineering, and administration. Revenues are received from the following primary sources: fuel and motor carrier taxes and fees; vehicle registrations, titles, licenses and related fees; and federal grants. The Maricopa Regional Area Road Construction Fund is a special revenue fund that receives Maricopa County Transportation Excise Tax monies collected by the Department of Revenue. These monies are expended for the construction of new freeways and other routes, improvements to existing freeways and other routes, improvements to the arterial street system, regional bus service and high capacity transit services such as light rail, which are included in the Maricopa County Regional Transportation Plan. The Motor Vehicle Division Clearing Fund is a special revenue fund which accounts for the collection and disbursement of certain Motor Vehicle Division revenues.

Arizona Department of Transportation Notes to the Financial Statements
June 30, 2008
2008 Comprehensive Annual Financial Report
32
The Highway User Revenue Fund is a special revenue fund which collects motor vehicle and liquid use fuel taxes and receives certain Motor Vehicle Division revenues from the Motor Vehicle Division Clearing Fund. These monies are distributed to the General Fund (State Highway Fund), the Department of Public Safety, the Economic Strength Project Fund, incorporated cities, counties and other legislatively appropriated distributions. The Debt Service Fund is used to account for the accumulation of resources for, and the payments of, general long-term debt principal and interest of the governmental funds. The Capital Projects Fund is used to account for financial resources to be used for the acquisition or construction of major capital facilities of the governmental funds.
The Department reports the following major proprietary funds:
The Highway Expansion and Extension Loan Program Fund is an innovative financing mechanism to administer funds designated to provide loan and credit enhancement assistance to sponsors of local transportation projects. The Arizona Highways Magazine Fund publishes and markets the Arizona Highways Magazine and various other products that promote the State of Arizona.
Additionally, the Department reports the following funds:
The Internal Service Fund, which accounts for purchases and maintenance of equipment and materials to be used by other divisions in the Department and other government agencies. The Equipment Fund is the Department’s only internal service fund. The Agency Funds are custodial in nature (assets equal liabilities) and do not involve measurement of results of operations. The Department has two agency funds, the Highway Properties – Privilege Tax Fund and the Highway Properties – 24 Percent Fund (neither are included in the government-wide statements).
As a general rule, the effect of interfund activity has been eliminated from the government-wide financial statements. Exceptions to this general rule are charges for services by the Equipment Fund to the other governmental functions. Elimination of these charges would distort the direct costs and program revenues reported for the various functions concerned. Amounts reported as program revenues include: 1) charges for services, 2) operating grants and contributions, and 3) capital grants and contributions. Internally dedicated resources are reported as general revenues rather than program revenues. Likewise, general revenues include all taxes. Proprietary funds distinguish operating revenues and expenses from non-operating items. Operating revenues and expenses generally result from providing services and producing and delivering goods in connection with a proprietary fund’s principal ongoing operations. The principal operating revenues are charges for services and magazine subscriptions. The Department also recognizes as operating revenues interest on loan receivables and other revenues intended to recover the cost of services. Operating expenses for the enterprise funds and the internal service fund include the cost of sales and services, administrative expenses, and depreciation on capital assets. All revenues and expenses not meeting this definition are reported as non-operating revenues and expenses. When both restricted and unrestricted resources are available for use, the Department generally expends the restricted resources first, and then unrestricted resources, as they are needed to maintain appropriate cash balances and finance the construction program.

Arizona Department of Transportation Notes to the Financial Statements
June 30, 2008
2008 Comprehensive Annual Financial Report
33
D. Assets, Liabilities, and Net Assets/Fund Balance Deposits and Investments The Department’s cash includes petty cash, bank accounts, and deposits with the State Treasurer for pooled investments. All investments are carried in the name of the State of Arizona. State statutes require the State Treasurer to invest these pooled funds in collateralized time certificates of deposit, repurchase agreements, obligations of the U.S. Government, or other permitted investments. All investments are carried at fair value. These balances are not subject to GASB Statement No. 3, Deposits with Financial Institutions, Investments (including Repurchase Agreements), and Reverse Repurchase Agreements, and GASB Statement No. 40, Deposit and Investment Risk Disclosures – an amendment of GASB Statement No. 3, classification because they are included in the state’s investment pool. The investment pool is not required to register (and is not registered) with the Securities and Exchange Commission under the 1940 Investment Advisors Act. The activity and performance of the pool is reviewed monthly by the State Board of Investment in accordance with Arizona Revised Statutes, §35-311. The fair value of investments is measured on a monthly basis. Participant shares are purchased and sold based on the Net Asset Value (NAV) of the shares. The NAV is determined by dividing the fair value of the portfolio by the total shares outstanding. The State Treasurer does not contract with an outside insurer in order to guarantee the value of the portfolio or the price of shares redeemed. As of June 30, 2008, the state’s investment pools were not rated. State statutes require the State Treasurer to maintain separate investment accounts for the portions of the Highway Revenue Bond Proceeds Fund relating to the Highway Revenue Bond issues and the Maricopa Regional Area Road Bond Proceeds Fund relating to the Transportation Excise Tax Revenue Bond issues. These funds may be invested by the Treasurer in the state’s investment pool. The Department’s investments are included in the state investment pool and these investments are not shown in the Department’s name. Therefore, the Department presents its equity in the internal pool as required in GASB Statement No. 31, Accounting and Financial Reporting for Certain Investments and for External Investment Pools. The Department has restricted cash for payment of capital projects for Maricopa and Pima Counties, for future debt service payments, for the Statewide Transportation Acceleration Needs account, and for loan repayments to the Highway Expansion and Extension Loan Program Fund. Receivables, Payables and Advances Activities between funds that are representative of lending/borrowing arrangements outstanding at the end of the fiscal year are referred to as interfund receivables/payables. All other outstanding balances between U.S. Government, Arizona counties and cities, and other state agencies are reported as due to/from. Any residual balances outstanding between the governmental activities and business-type activities are reported in the government-wide financial statements as internal balances. Advances between funds, as reported in the fund financial statements, are offset by a fund balance reserve account in applicable governmental funds to indicate that they are not available for appropriation and are not expendable available financial resources. The other receivables and subscriptions receivables are shown net of allowance for doubtful accounts. For other receivables comprising recoverable insurance claims, the amount reserved for doubtful accounts is comprised of 100% of balances greater than six years old, 95% of balances from four to six years old, and a percentage of balances less than four years old. The subscriptions receivable allowance for doubtful accounts is equivalent to an estimated number of issues delivered on outstanding subscription payments past due more than 90 days. Notes receivable represents loans made to parties purchasing assets previously owned by the Department for highway construction purposes.

Arizona Department of Transportation Notes to the Financial Statements
June 30, 2008
2008 Comprehensive Annual Financial Report
34
Inventories and Prepaid Items The governmental activities inventory is valued at cost, which approximates market, using the moving average method. This inventory is accounted for using the consumption method. Under this method, inventories are recorded as expenditures as they are used. The fund financial statement shows a reservation for inventory for the like amount indicating it does not constitute available expendable resources. No reservation of net assets is shown in the government-wide statements for inventories. The business-type activities’ inventories are stated at the lower of cost or market. Costs of enterprise fund inventories consisting of resale products and supplies are generally determined by moving average cost and specific identification methods, respectively. Costs of the internal service fund’s inventories (consisting of vehicle parts and supplies, fuels and lubricants, and other supplies) are determined by moving average cost methods. Certain payments to vendors reflect costs applicable to future accounting periods and are recorded as prepaid items in both the government-wide and fund financial statements. Restricted Assets Certain proceeds of the Department’s governmental revenue bonds, as well as certain resources of the General Fund (State Highway Fund) and the Highway Expansion and Extension Loan Program Fund (enterprise fund) are classified as restricted assets on the balance sheet because they are maintained in separate accounts and their use is limited by applicable bond covenants or state statutes. Effective July 1, 1981, state law required accumulation of at least 15 percent, which in fiscal year 1996 was modified to 12.6 percent, of the revenues allocated each year to the General Fund (State Highway Fund) from the Highway User Revenue Fund for the design, purchase of right-of-way, or construction of controlled-access highways which are included in the regional transportation plan of counties with populations in excess of 400,000 (Maricopa and Pima counties). The debt service fund is used to report the resources set aside for payment of future debt service. Bond proceeds are deposited in the capital projects fund and are restricted for acquisitions of right-of-way and construction of federal, state, and local highways. The Department has restricted cash for payment of capital projects for Maricopa and Pima Counties, for future debt service payments, for the Statewide Transportation Acceleration Needs account, and for loan repayments to the Highway Expansion and Extension Loan Program Fund. Capital Assets Capital assets, which include land, buildings and improvements, improvements other than buildings, machinery and equipment, infrastructure, and construction in progress, are reported in the applicable governmental or business-type columns in the government-wide financial statements. Capital assets are defined by the Department as assets with an initial, individual cost of $5,000 or more and an estimated useful life in excess of one year. Purchased capital assets are recorded at historical cost or estimated historical cost if historical cost is not available. Donated capital assets are recorded at estimated fair value at the date of donation. Costs of normal maintenance and repairs that do not add to the value of the asset or materially extend the assets’ lives are not capitalized. Outlays for capital assets are capitalized at the time of the purchase or, in the case of infrastructure, at the time of final acceptance by the Department from the contractor. Asset preservation costs are expensed as incurred.

Arizona Department of Transportation Notes to the Financial Statements
June 30, 2008
2008 Comprehensive Annual Financial Report
35
The Department depreciates non-infrastructure capital assets on a straight-line basis using the following estimated useful lives. Modular buildings are included on the Statement of Net Assets under the machinery and equipment category; however, modular buildings have an estimated useful life of fifteen (15) years.
Assets Years Buildings and improvements 40 Improvements other than buildings 40 Machinery and equipment 5-15 Mobile fleet and aircraft 5-15
Infrastructure was capitalized for the first time in fiscal year 2002. The infrastructure assets are reported in the governmental-type activities column of the Statement of Net Assets. The Department’s infrastructure assets consist of roads and bridges and are presented using the modified approach and, therefore, are not depreciated. In order to utilize the modified approach, the Department is required to: 1) maintain an asset management system that includes an up to date inventory of eligible infrastructure assets, 2) perform condition assessments of eligible assets and summarize the results using a measurement scale, 3) estimate each year the annual amount to maintain and preserve the assets at the condition level established and disclosed by the Department, and 4) document that the assets are being preserved approximately at or above the established condition level. Deferred Revenues In the government-wide statements and proprietary fund financial statements, deferred revenues are recorded when cash, receivables, or other assets are received prior to revenue being recognized. In the governmental funds, amounts are reported as deferred revenues until they are available to liquidate liabilities of the current period. Deferred revenues are reported in the government-wide statements for the business-type activities and in the fund statements for both the governmental and proprietary funds. In the government-wide statements, the deferred revenues relate to unearned subscription revenue for the Arizona Highways Magazine. Unearned subscription revenue is recorded when subscription orders are received and is amortized as revenue over the terms of the related subscriptions. Costs associated with the selling of subscriptions are expensed in the year incurred. In the fund statements for the General Fund (State Highway Fund), the deferred revenue represents the amount for the notes receivable for loans made to parties who purchased assets previously owned by the Department for highway construction purposes. For the Non-Major Governmental Funds, the deferred revenue represents airport capital improvements designed to generate airport revenues and/or related airport economic development efforts. Loans are typically for construction of aircraft storage hangars, fuel dispensing and storage facilities, and terminal buildings. Loan rates vary and are based on the Bond Buyer Index (BBI) for 25 year national revenue bonds. Loan periods are typically 10 to 25 years in length. Compensated Absences It is the Department’s policy to permit employees to accumulate earned but unused sick leave and vacation benefits as well as compensatory time. There is no liability for unpaid accumulated sick leave for the Department. All vacation pay and compensatory time is accrued when incurred in the government-wide and proprietary fund financial statements. Effective July 1, 1998, state employees are eligible to receive payment for an accumulated sick leave balance of 500 hours or more with a maximum of 1,500 hours, upon retirement directly from state service. The benefit value is calculated by taking the state hourly rate of pay at the retirement date, multiplied by the number of sick hours at the retirement date, times the eligibility percentage. The eligibility percentage varies based upon the number of accumulated sick hours from 25 percent for 500 hours to a maximum of 50 percent for 1,500 hours. The maximum benefit value is $30,000. The benefit is paid out in annual installments over three years. The Retiree Accumulated Sick Leave Fund is accounted for on the State’s financial statements as an Internal Service Fund.

Arizona Department of Transportation Notes to the Financial Statements
June 30, 2008
2008 Comprehensive Annual Financial Report
36
Employees are allowed to accumulate up to 240 hours of vacation leave (320 hours for uncovered employees) and up to 240 hours of compensatory time which is paid when vacation or compensatory time is taken or upon termination of employment at the individual’s then current rate of pay. The liabilities for vacation and compensatory time outstanding as of June 30 for both the governmental and proprietary funds are reported on the Statement of Net Assets. Long-term Obligations In the government-wide financial statements, long-term debt and other long-term obligations are reported as liabilities. Bond premiums and discounts are deferred and amortized using the effective interest method. Bonds payable are reported net of the applicable bond premium or discount. Bond issuance costs are reported as deferred charges and amortized over the term of the related debt. Other long-term obligations also include amounts that other governmental entities advance the Department for highway road construction projects. In the fund financial statements, governmental fund types recognize bond premiums and discounts, as well as issuance costs, during the current period. The face amount of the debt issued is reported as other financing sources. Premiums received on debt issuances are reported as other financing sources while discounts on debt issuances are reported as other financing uses. Issuance costs, whether or not withheld from the actual debt proceeds received, are reported as debt service expenditures. Advances from other governmental entities are recorded as debt issuance in other financing sources. Net Assets/Fund Balance The difference between assets and liabilities is “Net Assets” on the government-wide and proprietary statements and “Fund Balance” on the governmental fund statements. Reservations Fund balances for governmental funds are classified as either reserved or unreserved in the fund financial statements. Reserved fund balances reflect either: 1) funds legally segregated for a specific purpose, or 2) assets, which, by their nature, are not available for expenditure. Unreserved fund balances reflect the balances available for appropriation for the general purposes of the fund. E. Revenues and Expenditures/Expenses In the government-wide Statement of Activities, revenues and expenses are segregated by activity (governmental or business-type), then further by function (e.g. Administration, Aeronautics, Highway, etc). Additionally, revenues are classified between program and general revenues. Program revenues include: 1) charges for services, 2) operating grants and contributions, and 3) capital grants and contributions. Internally dedicated resources are reported as general revenue rather than as program revenue. General revenue includes all taxes and interest on investments. In the governmental fund financial statements, revenues are reported by source. Expenditures are reported by function (e.g., Administration, Distributions to Arizona counties and cities, and Distributions to other state agencies, Debt service, Capital outlay, etc.). The Distributions to Arizona counties and cities and Distributions to other state agencies are shared tax revenues that are distributed based on statutory requirements. Debt service includes both interest and principal outlays related to bonds, board funding obligations and capitalized leases. Capital outlay includes expenditures for real property or infrastructure (e.g. bridges and roads). Revenues and expenses of proprietary funds are classified as operating and non-operating and are sub-classified by object (e.g., salaries, equipment rental, depreciation, etc). Operating revenues and expenses generally result from providing services and producing and delivering goods. All other revenues and expenses are reported as non-operating.

Arizona Department of Transportation Notes to the Financial Statements
June 30, 2008
2008 Comprehensive Annual Financial Report
37
Other Financing Sources (Uses) Other financing sources are additions to the governmental fund balances in the fund financial statements and include resources and financing provided by bond issuance, sale of capital assets, capital leases, insurance recovery, and transfers from other funds. Other financing uses are reductions of governmental fund resources in fund financial statements normally resulting from transfers to other funds. F. Interfund Activity and Balances Interfund Activity As a general rule, the effect of interfund activity has been eliminated from the government-wide statements. Exceptions to this rule are activities between the funds reported as governmental activities and the funds reported as business-type activities (e.g. the transfer of the gain or loss from the Equipment Fund). Interfund Balances Interfund receivables and payables have been eliminated from the Statement of Net Assets, except for the residual amounts due between governmental and business-type activities. 2. FUNDS BY CLASSIFICATION The following table lists all of the funds whose balances are reflected in this financial report.
MAJOR FUNDS NON-MAJOR FUNDSGovernmental Funds: Other Governmental Funds:
General Fund (State Highway Fund) Special Revenue Funds:Special Revenue Funds: State Aviation Fund
Maricopa Regional Area Road Safety Enforcement andConstruction Fund Transportation Infrastructure Fund
Motor Vehicle Division Clearing Fund Motor Vehicle Liability InsuranceHighway User Revenue Fund Enforcement Fund
Debt Service Fund Vehicle Inspection and TitleCapital Projects Fund Enforcement Fund
Motor Carrier Safety Revolving FundProprietary Funds: Underground Storage Tank Fund
Arizona Highways Magazine Fund Economic Strength Project FundHighway Expansion and Extension Grant Anticipation Notes Fund
Loan Program Fund Local Agency Deposits Fund
FIDUCIARY FUNDSAgency Funds:
Highway Properties–Privilege Tax FundHighway Properties–24 Percent Fund
FUND TYPES

Arizona Department of Transportation Notes to the Financial Statements
June 30, 2008
2008 Comprehensive Annual Financial Report
38
3. BUDGETING, BUDGETARY CONTROL, AND LEGAL COMPLIANCE Annual budgets for the operating expenditures for the General Fund (State Highway Fund), and capital outlay including land, building, and improvements for the General Fund (State Highway Fund) and State Aviation Fund, are submitted to the Governor in accordance with state law. The budgets are legally enacted as appropriations after approval by the state legislature and signature by the Governor. The legal level of control for operating expenditures is at the program level and expenditure budgets are appropriated using a lump sum format with special line items. Expenditure details for personal services, employee related expenditures, and all other operating expenditures are specifically allocated within all divisions. In certain divisions, other specific programs are allocated in addition to these categories. Revenue budgets are developed internally by the Department and are not a part of the appropriation process. Amendments to the approved appropriations require legislative approval. However, since the Department’s appropriation is a lump sum appropriation by program, the allocation of funds between personal services, employee-related expenses, and other operating expenditures is an internal decision for the program manager. Accordingly, transfers between line items such as personal services and other operating expenditures within a particular program may be made by the program manager. Transfers of funds between programs require the approval of the Director of the Department of Administration. Expenditures may not exceed appropriations. All transfers of funds are reported to the Department’s Office of Strategic Planning and Budgeting for monitoring purposes. Budgets are prepared on the cash basis except that liabilities incurred before the end of the fiscal year and paid within the first month of the subsequent fiscal year are charged against the prior fiscal year’s budget. The Department’s appropriations lapse at year-end unless exempted by the legislature. The capital outlay appropriation includes state highway construction and land, building, and improvements for the General Fund (State Highway Fund). A legal limitation is adopted for land, building, and improvements; however, legislation allows the Department to spend in excess of its appropriation for state highway construction up to the current fund balance. The Department monitors expenditures through an internal budgetary process and the Five-Year Transportation Facilities Construction Program approved by the Transportation Board. A legal limitation is not adopted for the other special revenue funds, the debt service funds, capital projects funds, proprietary funds, and fiduciary funds. 4. ACCOUNTING PRONOUNCEMENTS AND RECONCILIATION OF GOVERNMENT-WIDE AND FUND FINANCIAL STATEMENTS A. New Accounting Pronouncements Statement No. 45 Accounting and Financial Reporting by Employers of Postemployment Benefits Other Than Pensions This Statement establishes standards for the measurement, recognition, and display of other postemployment benefits (OPEB) expense/expenditures and related liabilities (assets), note disclosures, and, if applicable, required supplementary information (RSI) in the financial reports of state and local governmental employers. This Statement improves the relevance and usefulness of financial reporting by (a) requiring systematic, accrual-basis measurement and recognition of OPEB cost (expense) over a period that approximates employee’s years of service and (b) providing information about actuarial accrued liabilities associated with OPEB and whether and to what extent progress is being made in funding the plan. The provisions of this Statement are effective for periods beginning after December 15, 2006. The Department has implemented this Statement.

Arizona Department of Transportation Notes to the Financial Statements
June 30, 2008
2008 Comprehensive Annual Financial Report
39
Statement No. 48 Sales and Pledges of Receivables and Future Revenues and Intra-Entity Transfers of Assets and Future Revenues This Statement establishes criteria that governments will use to ascertain whether the proceeds received should be reported as revenue or as a liability. The criteria should be used to determine the extent to which a transferor government either retains or relinquishes control over the receivables or future revenues through its continuing involvement with those receivables or future revenues. This Statement establishes that a transaction will be reported as a collateralized borrowing unless the criteria indicating a sale has taken place are met. If it is determined that a transaction involving receivables should be reported as a sale, the difference between the carrying value of the receivables and the proceeds should be recognized in the period of the sale in the change statements. If it is determined that a transaction involving future revenues should be reported as a sale, the revenue should be deferred and amortized, except when specific criteria are met. This Statement also provides additional guidance for sales of receivables and future revenues within the same financial reporting entity. The requirements of this Statement are effective for financial statements for periods beginning after December 15, 2006. The Department has implemented this Statement. Statement No. 49 Accounting and Financial Reporting for Pollution Remediation Obligations This Statement addresses accounting and financial reporting standards for pollution (including contamination) remediation obligations, which are obligations to address the current or potential detrimental effects of existing pollution by participating in pollution remediation activities such as site assessments and cleanups. The scope of the document excludes pollution prevention or control obligations with respect to current operations, and future pollution remediation activities that are required upon retirement of an asset, such as landfill closure and post closure care and nuclear plant decommissioning. Essentially, once any one of five specified obligating events occurs, a government is required to estimate the components of expected pollution remediation outlays and determine whether outlays for those components should be accrued as a liability or, if appropriate, capitalized when goods and services are acquired. The provisions of this Statement are effective for periods beginning after December 15, 2007. The Department will implement this Statement as appropriate. Statement No. 50 Pension Disclosures This Statement more closely aligns the financial reporting requirements for pensions with those for other postemployment benefits and, in doing so, enhances information disclosed in notes to financial statements or presented as required supplementary information by pension plans and by employers that provide pension benefits. This Statement amends Statements 25 and 27 to require defined benefit pension plans and sole and agent employers to present certain information related to note disclosures or required supplementary information. The provisions of this Statement are effective for periods beginning after June 15, 2007. The Department does not have any pension plans, as defined by this Statement, and therefore, this Statement is not applicable to the Department. Statement No. 51 Accounting and Financial Reporting for Intangible Assets The objective of this Statement is to establish accounting and financial reporting requirements for intangible assets to reduce inconsistencies, thereby enhancing the comparability of the accounting and financial reporting of such assets among state and local governments. This Statement requires that all intangible assets not specifically excluded by its scope provisions be classified as capital assets. Accordingly, existing authoritative guidance related to the accounting and financial reporting for capital assets should be applied to these intangible assets, as applicable. This Statement also provides authoritative guidance that specifically addresses the nature of these intangible assets. Such guidance should be applied in addition to the existing authoritative guidance for capital assets. The provisions of this Statement are effective for periods beginning after June 15, 2009. The Department will implement this Statement as appropriate.

Arizona Department of Transportation Notes to the Financial Statements
June 30, 2008
2008 Comprehensive Annual Financial Report
40
Statement No. 52 Land and Other Real Estate Held as Investments by Endowments This statement establishes consistent standards for the reporting of land and other real estate held as investments by essentially similar entities. It requires endowments to report their land and other real estate investments at fair value. Governments also are required to report the changes in fair value as investment income and to disclose the methods and significant assumptions employed to determine fair value, and other information that they currently present for other investments reported at fair value. The provisions of this Statement are effective for periods beginning after June 15, 2008. This Statement is not applicable to the Department. Statement No. 53 Derivative Instruments This statement addresses the recognition, measurement, and disclosure of information regarding derivative instruments entered into by state and local governments. Governments enter into derivative instruments as investments; as hedges of identified financial risks associated with assets or liabilities, or expected transactions; or to lower the cost of borrowing. The requirements of this statement are effective for financial statements for periods beginning after June 15, 2009. The Department will implement this Statement as appropriate. B. Explanations of Reconciling Items of the Balance Sheet of Governmental Funds to the Statement of Net Assets The governmental funds Balance Sheet includes reconciliation between fund balance – total governmental funds and net assets – government activities as reported on the government-wide Statement of Net Assets. The following explanations are necessary to clarify these differences between the governmental fund Balance Sheet and the government-wide Statement of Net Assets: 1. Capital assets are not included on the fund statements, but are included on the government-wide statement as follows:
Capital assets not subject to depreciation 15,061,147,219$ Capital assets subject to depreciation 188,068,775
15,249,215,994 less Internal Service Fund (Equipment Fund) assets <55,624,796>
15,193,591,198$ 2. Deferred revenues for assets shown in fund statements for the following funds:
Governmental Funds:General Fund (State Highway Fund) 2,268,000$ Maricopa Regional Area Road Construction Fund 24,712 State Aviation Fund 8,628,966
10,921,678$

Arizona Department of Transportation Notes to the Financial Statements
June 30, 2008
2008 Comprehensive Annual Financial Report
41
3. Long-term liabilities, including bonds payable, are not due and payable in the current period and are not reported in the current period on the fund statements. The detail for the difference is as follows:
Bonds payable <2,401,726,354>$ Deferred charges - bond issuance costs - outstanding amount 10,712,096 Capital leases <1,656,761> Compensated absences <14,698,720> Advances and notes payable <19,528,907> Business activity share of Equipment Fund gain <loss> <3,096>
<2,426,901,742>$ C. Explanations of Reconciling Items of the Statement of Revenues, Expenditures, and Changes in Fund Balances of Governmental Funds to the Statement of Activities The governmental funds Statement of Revenues, Expenditures, and Changes in Fund Balances includes a reconciliation between net changes in fund balances – total governmental funds and changes in net assets of governmental activities as reported on the government-wide Statement of Activities. The following explanations are necessary to clarify these differences between the governmental fund Statement of Revenues, Expenditures, and Changes in Fund Balances and the government-wide Statement of Activities: 1. Governmental funds report capital outlay as expenditures. However, in the Statement of Activities, these costs are removed; some costs are capitalized as assets while other costs are expensed as follows:
Capital outlay 989,881,588$ Adjustment to infrastructure <25,487,592> Less depreciation expense <8,159,093>
956,234,903$

Arizona Department of Transportation Notes to the Financial Statements
June 30, 2008
2008 Comprehensive Annual Financial Report
42
2. The issuance of long-term debt (e.g. bonds) provides current financial resources to governmental funds, while the repayment of principal of long-term debt consumes current financial resources of the governmental funds. Neither transaction, however, has any effect on net assets. Also, the government reports the effect of bond issuance costs, premiums, discounts, and similar items when debt is first issued, whereas these amounts are amortized in the Statement of Activities. The details of this difference are as follows:
Debt issued or incurred:
Issuance of Highway Revenue Bonds <193,950,000>$ Issuance of Transportation Excise Tax Revenue Bonds <370,000,000> Issuance Grant Anticipation Notes (GARVEE bonds) <68,000,000> Premium on bonds <31,861,772> Issuance of Board Funding Obligations <60,000,000> Advances and notes payable <19,528,907>
<743,340,679>$
Principal repayments:Highway Revenue Bonds 60,645,000$ Transportation Excise Tax Revenue Bonds 19,045,000 Grant Anticipation Notes (GARVEE bonds) 52,580,000 Board Funding Obligations 60,000,000
Amortization of premium and discount 11,309,740 Amortization of bond issuance costs 2,687,989
206,267,729$
3. The Internal Service Fund is used by the Department to charge the cost for purchases and maintenance of equipment and material to be used by other funds and state agencies. The gain <loss> in the Internal Service Fund represents over <under> billing and must be eliminated from the government-wide Statement of Activities for the business activity.
Internal Service Fund (Equipment Fund):Changes in net assets 2,310,258$ Business activity share of Equipment Fund <gain> loss <202>
2,310,056$ 4. Some expenses reported in the Statement of Activities do not require the use of current financial resources and therefore, are not reported as expenditures in the governmental funds. The details are as follows:
Capital lease 393,160$ Notes and loans 1,030,934 Compensated absences <1,008,264> Sale of capital assets 1,578,952 Compensated absences-change in 60 day accrual <4,721>
1,990,061$

Arizona Department of Transportation Notes to the Financial Statements
June 30, 2008
2008 Comprehensive Annual Financial Report
43
5. DETAILED NOTES ON ALL FUNDS A. Capital Assets Capital assets activity for the year ended June 30, 2008, was as follows:
July 1, 2007 June 30, 2008Beginning EndingBalance Increases Decreases Balance
Capital assets, not being depreciated:Land 2,217,183,763$ 259,321,548$ <124,693,225>$ 2,351,812,086$ Infrastructure 9,855,140,388 254,651,995 <8,384,447> 10,101,407,936 Construction in progress 2,032,678,119 842,543,604 <267,294,526> 2,607,927,197
Total capital assets, not being depreciated 14,105,002,270 1,356,517,147 <400,372,198> 15,061,147,219
Capital assets, being depreciated:Buildings and improvements 155,682,847 3,047,761 - 158,730,608 Improvements other than buildings 23,012,860 535,311 - 23,548,171 Machinery and equipment 56,537,449 5,222,290 <2,627,108> 59,132,631 Mobile fleet and aircraft 135,550,442 12,831,008 <5,548,962> 142,832,488
Total capital assets, being depreciated 370,783,598 21,636,370 <8,176,070> 384,243,898
Less accumulated depreciation for:Buildings and improvements <62,867,208> <3,599,171> - <66,466,379> Improvements other than buildings <2,890,494> <357,047> - <3,247,541> Machinery and equipment <35,510,954> <4,607,202> 1,967,229 <38,150,927> Mobile fleet and aircraft <84,418,143> <8,626,025> 4,733,892 <88,310,276>
Total accumulated depreciation <185,686,799> <17,189,445> 6,701,121 <196,175,123>
Total capital assets, being depreciated, net 185,096,799 4,446,925 <1,474,949> 188,068,775
Governmental activities capital assets, net 14,290,099,069$ 1,360,964,072$ <401,847,147>$ 15,249,215,994$
July 1, 2007 June 30, 2008Beginning EndingBalance Increases Decreases Balance
Capital assets, not being depreciated:Land 7,900$ -$ -$ 7,900$
Capital assets, being depreciated:Buildings and improvements 981,157 - - 981,157 Machinery and equipment 2,361,440 5,177 <175,176> 2,191,441
Total capital assets, being depreciated 3,342,597 5,177 <175,176> 3,172,598
Less accumulated depreciation for:Buildings and improvements <811,024> <33,818> - <844,842> Machinery and equipment <2,314,294> <6,296> 157,659 <2,162,931>
Total accumulated depreciation <3,125,318> <40,114> 157,659 <3,007,773>
Total capital assets, being depreciated, net 217,279 <34,937> <17,517> 164,825
Business-type activities capital assets, net 225,179$ <34,937>$ <17,517>$ 172,725$
Governmental Activities
Business-type Activities
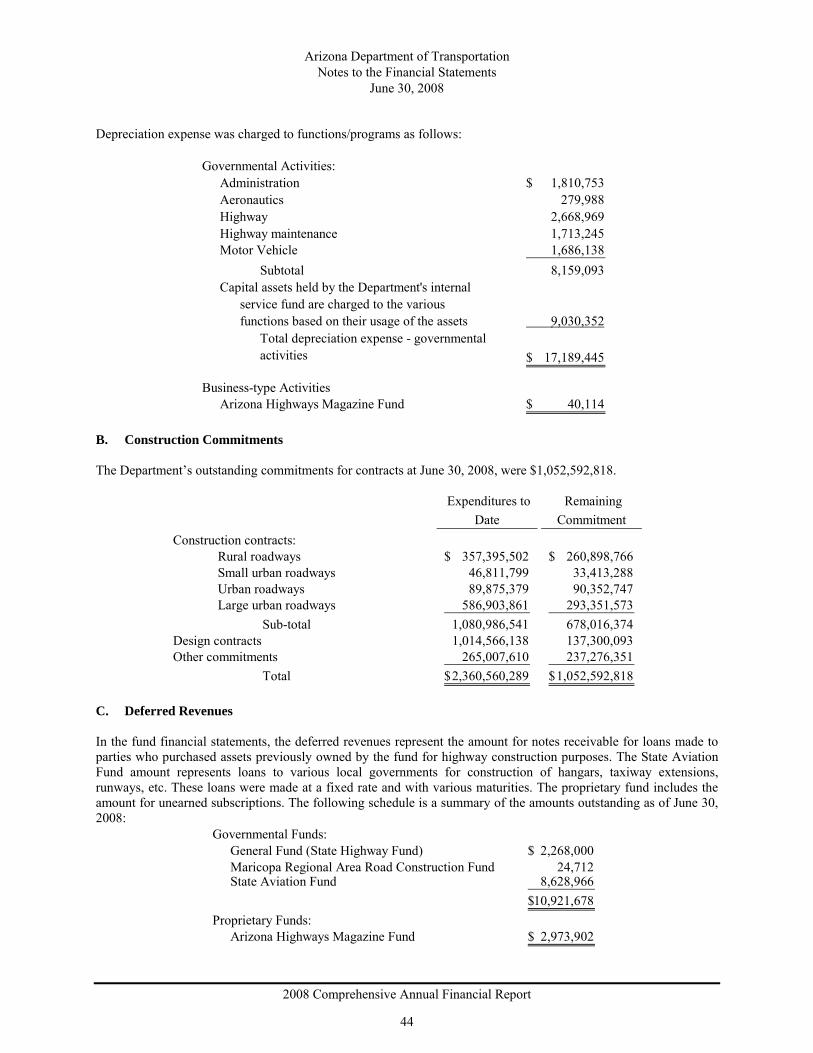
Arizona Department of Transportation Notes to the Financial Statements
June 30, 2008
2008 Comprehensive Annual Financial Report
44
Depreciation expense was charged to functions/programs as follows:
Governmental Activities:Administration 1,810,753$ Aeronautics 279,988 Highway 2,668,969 Highway maintenance 1,713,245 Motor Vehicle 1,686,138
Subtotal 8,159,093 Capital assets held by the Department's internal
service fund are charged to the various functions based on their usage of the assets 9,030,352
17,189,445$
Business-type ActivitiesArizona Highways Magazine Fund 40,114$
Total depreciation expense - governmental activities
B. Construction Commitments The Department’s outstanding commitments for contracts at June 30, 2008, were $1,052,592,818.
Expenditures to Date
Remaining Commitment
Construction contracts:Rural roadways 357,395,502$ 260,898,766$ Small urban roadways 46,811,799 33,413,288 Urban roadways 89,875,379 90,352,747 Large urban roadways 586,903,861 293,351,573
Sub-total 1,080,986,541 678,016,374 Design contracts 1,014,566,138 137,300,093 Other commitments 265,007,610 237,276,351
Total 2,360,560,289$ 1,052,592,818$ C. Deferred Revenues In the fund financial statements, the deferred revenues represent the amount for notes receivable for loans made to parties who purchased assets previously owned by the fund for highway construction purposes. The State Aviation Fund amount represents loans to various local governments for construction of hangars, taxiway extensions, runways, etc. These loans were made at a fixed rate and with various maturities. The proprietary fund includes the amount for unearned subscriptions. The following schedule is a summary of the amounts outstanding as of June 30, 2008:
Governmental Funds:General Fund (State Highway Fund) 2,268,000$ Maricopa Regional Area Road Construction Fund 24,712 State Aviation Fund 8,628,966
10,921,678$ Proprietary Funds:
Arizona Highways Magazine Fund 2,973,902$

Arizona Department of Transportation Notes to the Financial Statements
June 30, 2008
2008 Comprehensive Annual Financial Report
45
D. Securities Held in Lieu of Retention In accordance with Arizona law, a contractor may assign to the Department securities in lieu of retention and will deposit with a bank, cash, time certificates of deposit in federally insured banks licensed by the State of Arizona (Certificates of Deposit), securities of or guaranteed by the United States of America (Treasury Bills), or other eligible securities as defined in the Arizona Revised Statutes, Title 35, Chapter 2, Article 2, Section 35-313. At June 30, 2008, the banks held assignment on securities aggregating approximately $0.8 million in lieu of contractor retentions for construction. These additional securities are not reflected in the accompanying financial statements. E. Interfund Receivables, Payables, Advances and Transfers The balances of current interfund receivables and payables as of June 30, 2008, were:
AmountGovernmental activities:
General Fund (State Highway Fund) Highway User Revenue Fund 107,981,931$ Motor Vehicle Division Clearing Fund 586,160 Maricopa Regional Area Road Fund 475 Debt Service Fund 222 Equipment Fund 1,100
Highway User Revenue Fund Motor Vehicle Division Clearing Fund 45,195,823 General Fund (State Highway Fund) 339,117
Maricopa Regional Area Road Fund General Fund (State Highway Fund) 2,264,550 Non-major Governmental Funds Motor Vehicle Division Clearing Fund 3,008,263
159,377,641$
PayablesReceivables
The General Fund (State Highway Fund) receivable of $107,981,931 is an accrual for fuel tax revenues imposed in fiscal year 2008 from the Highway User Revenue Fund that will be collected in fiscal year 2009. The Highway User Revenue Fund receivable of $45,195,823 is an accrual for vehicle license taxes due in fiscal year 2008 from the Motor Vehicle Division Clearing Fund that will be collected in fiscal year 2009. In a prior fiscal year, the General Fund (State Highway Fund) advanced $20 million to the Highway Expansion and Extension Loan Program Fund to increase its loan capacity. The advance is due no later than December 31, 2008. Interfund transfers for the year ended June 30, 2008, consisted of the following:
GeneralFund(State
Highway Debt ServiceFund) Fund Total
General Fund (State Highway Fund) -$ 134,245,911$ 134,245,911$ Capital Projects Fund 4,188,471 - 4,188,471 Maricopa Regional Area Road
Construction Fund 67,697,989 29,718,101 97,416,090 Non-Major Governmental Funds 62,956 67,599,433 67,662,389
Total 71,949,416$ 231,563,445$ 303,512,861$
Interfund Transfers Out:
Interfund Transfers In:

Arizona Department of Transportation Notes to the Financial Statements
June 30, 2008
2008 Comprehensive Annual Financial Report
46
The General Fund (State Highway Fund) ($134,245,911) and Non-Major Governmental Funds - Grant Anticipation Notes Fund ($67,599,433) made transfers to the Debt Service Fund to pay bond debt service. The Maricopa Regional Area Road Construction Fund ($67,697,989) made loan principal and interest payments to the General Fund (State Highway Fund) for loan repayments to the Highway Expansion and Extension Loan Program Fund. F. Leases Operating Leases The Department leases data processing equipment, other equipment, and certain facilities from various lessors. The majority of these leases are for a one-year term, renewable annually. Total rental expenditures (excluding interfund transactions) for the fiscal year ended June 30, 2008, approximated $3.8 million. In fiscal year 2002, the Department renegotiated its long-term lease with the City of Phoenix for a facility located on Washington Street in Phoenix. The lease contains a three year option period which the Department has exercised. The future operating lease commitments are as follows:
Fiscal year ending June 30 Amount2009 899,965$ 2010 940,872
Future operating lease commitments 1,840,837$ In fiscal year 2003, the Department entered into a long-term lease to build a structure to house lab facilities in Gilbert, Arizona. The future operating lease commitments are as follows:
Fiscal year ending June 30 Amount2009 117,324$ 2010 120,660 2011 124,095 2012 127,635 2013 97,758
Future operating lease commitments 587,472$ Capital Leases The Department has entered into lease agreements as lessee for financing the acquisition of various vehicles, equipment, and modular office buildings. These lease agreements qualify as capital leases for accounting purposes and, therefore, have been recorded at the present value of their future minimum lease payments as of the inception date. The assets acquired through capital leases are as follows:
Governmental Activities
Assets:Machinery and equipment 13,422,677$ Modular office buildings 2,139,711 Less accumulated depreciation <3,554,109> Total 12,008,279$
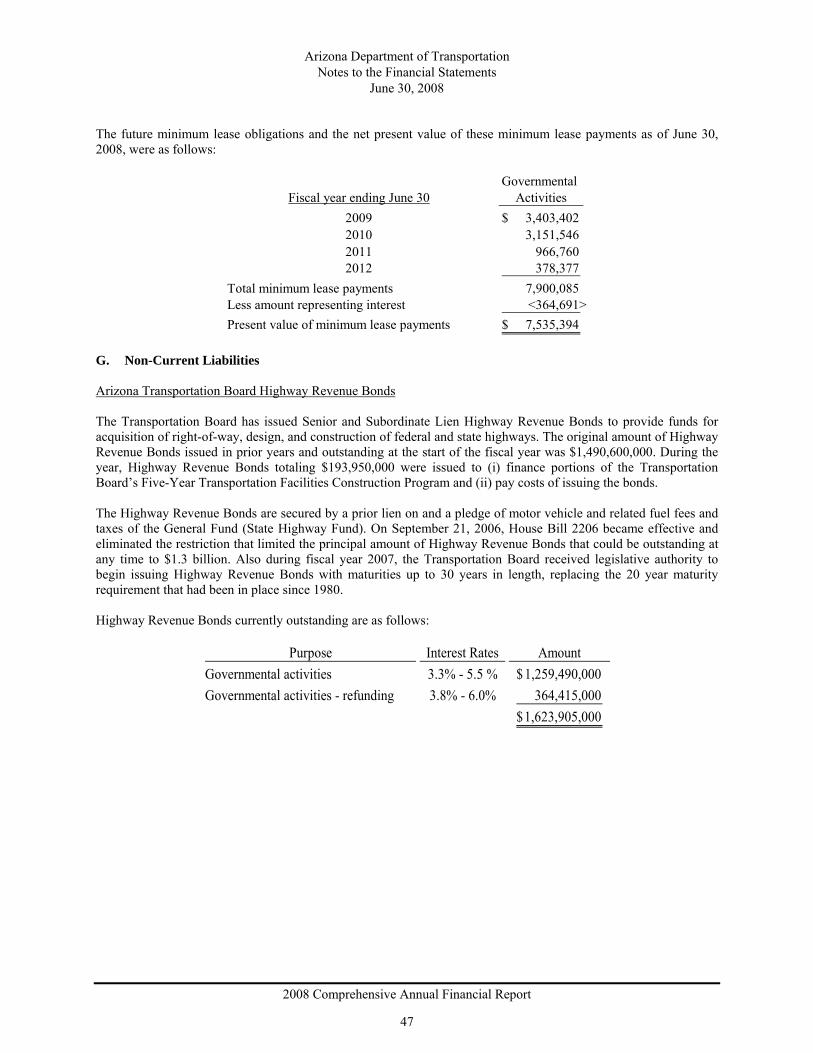
Arizona Department of Transportation Notes to the Financial Statements
June 30, 2008
2008 Comprehensive Annual Financial Report
47
The future minimum lease obligations and the net present value of these minimum lease payments as of June 30, 2008, were as follows:
Governmental Fiscal year ending June 30 Activities
2009 3,403,402$ 2010 3,151,546 2011 966,760 2012 378,377
Total minimum lease payments 7,900,085 Less amount representing interest <364,691> Present value of minimum lease payments 7,535,394$
G. Non-Current Liabilities Arizona Transportation Board Highway Revenue Bonds The Transportation Board has issued Senior and Subordinate Lien Highway Revenue Bonds to provide funds for acquisition of right-of-way, design, and construction of federal and state highways. The original amount of Highway Revenue Bonds issued in prior years and outstanding at the start of the fiscal year was $1,490,600,000. During the year, Highway Revenue Bonds totaling $193,950,000 were issued to (i) finance portions of the Transportation Board’s Five-Year Transportation Facilities Construction Program and (ii) pay costs of issuing the bonds. The Highway Revenue Bonds are secured by a prior lien on and a pledge of motor vehicle and related fuel fees and taxes of the General Fund (State Highway Fund). On September 21, 2006, House Bill 2206 became effective and eliminated the restriction that limited the principal amount of Highway Revenue Bonds that could be outstanding at any time to $1.3 billion. Also during fiscal year 2007, the Transportation Board received legislative authority to begin issuing Highway Revenue Bonds with maturities up to 30 years in length, replacing the 20 year maturity requirement that had been in place since 1980. Highway Revenue Bonds currently outstanding are as follows:
Purpose Interest Rates AmountGovernmental activities 3.3% - 5.5 % 1,259,490,000$ Governmental activities - refunding 3.8% - 6.0% 364,415,000
1,623,905,000$

Arizona Department of Transportation Notes to the Financial Statements
June 30, 2008
2008 Comprehensive Annual Financial Report
48
Annual debt service requirements to maturity for Highway Revenue Bonds are as follows:
Fiscalyear
endingJune 30 Principal Interest
2009 64,190,000$ 82,897,389$ 2010 68,140,000 78,624,156 2011 71,770,000 74,923,125 2012 75,415,000 71,325,075 2013 79,230,000 67,551,715
2014-2018 460,280,000 273,392,181 2019-2023 489,215,000 149,895,661 2024-2028 214,630,000 49,761,598 2029-2033 101,035,000 15,647,500
1,623,905,000$ 864,018,400$
Highway Revenue Bonds
The Department has pledged future motor vehicle and related fuel fees and taxes to repay $1,623,905,000 in outstanding Highway Revenue Bonds issued since 1993. Proceeds from the bonds finance portions of the Transportation Board’s Five-Year Transportation Facilities Construction Program. The bonds are payable solely from motor vehicle and related fuel fees and taxes and are payable through 2033. The total principal and interest remaining to be paid on the bonds is $2.5 billion. Principal and interest paid for the current year and total pledged revenues were $136.2 million and $658.6 million, respectively. The annual principal and interest payments on the bonds required 20.7 percent of the pledged revenues. Arizona Transportation Board Transportation Excise Tax Revenue Bonds The Maricopa County Regional Area Road Fund is used to record all payments of principal and interest for Transportation Excise Tax Revenue Bonds issued by the Transportation Board. These bonds are secured by transportation excise taxes collected by the Arizona Department of Revenue on behalf of Maricopa County. There were no outstanding amounts of Transportation Excise Tax Revenue Bonds issued in prior years and outstanding at the start of the fiscal year. During the year, Transportation Excise Tax Revenue Bonds totaling $370,000,000 were issued to pay (i) the costs of design, right-of-way purchase, or construction of certain freeways and other routes within Maricopa County, Arizona and (ii) the costs of issuing the bonds. On September 21, 2007, the Transportation Board adopted a Master Resolution relating to Transportation Excise Tax Revenue Bonds. Also on September 21, 2007, the Transportation Board adopted the First Supplemental Resolution authorizing the issuance of the first series of bonds under the Master Resolution in an amount not to exceed $370,000,000. No debt service reserve is required for the outstanding bonds. All Transportation Excise Tax Revenue Bonds mature no later than July 1, 2025. Transportation Excise Tax Revenue Bonds currently outstanding are as follows:
Purpose Interest Rates AmountGovermental activities 4.5% - 5.0% 350,955,000$

Arizona Department of Transportation Notes to the Financial Statements
June 30, 2008
2008 Comprehensive Annual Financial Report
49
Annual debt service requirements to maturity for Transportation Excise Tax Revenue Bonds are as follows:
Fiscalyear
endingJune 30 Principal Interest
2009 13,825,000$ 17,192,950$ 2010 14,445,000 16,570,825 2011 15,095,000 15,920,800 2012 15,820,000 15,195,850 2013 16,585,000 14,433,700
2014-2018 95,710,000 59,373,650 2019-2023 121,800,000 33,282,250 2024-2025 57,675,000 4,360,750
350,955,000$ 176,330,775$
Transportation Excise Tax Revenue Bonds
Bonds aggregating $200,475,000 are subject to redemption prior to their maturity dates at the option of the Transportation Board in whole or in part, at any time, on or after July 1, 2017. These bonds may be redeemed at par, plus accrued interest to the date fixed for redemption. Bonds aggregating $150,480,000 are not subject to redemption. The Department has pledged future transportation excise taxes to repay $350,955,000 in outstanding Transportation Excise Tax Revenue Bonds issued since 2007. Proceeds from the bonds pay the costs of design, right-of-way purchase, or construction of certain freeways and other routes within Maricopa County, Arizona. The bonds are payable solely from transportation excise taxes and are payable through 2025. The total principal and interest remaining to be paid on the bonds is $527.3 million. Principal and interest paid for the current year and total pledged revenues were $29.7 million and $253.7 million, respectively. The annual principal and interest payments on the bonds required 11.7 percent of the pledged revenues. Arizona Transportation Board Grant Anticipation Notes (GARVEE bonds) The Grant Anticipation Notes Fund administers all payments of principal and interest for notes issued by the Transportation Board and is secured by revenues received from the Federal Highway Administration under grant agreements and certain other federal-aid revenues. The original amount of Grant Anticipation Notes (GARVEE bonds – Grant Anticipation Revenue Vehicles) issued in prior years and outstanding at the start of the fiscal year was $282,860,000. Grant Anticipation Notes (GARVEE bonds) currently outstanding are as follows:
Purpose Interest Rates AmountGovermental activities 2.5% - 5.25% 298,280,000$

Arizona Department of Transportation Notes to the Financial Statements
June 30, 2008
2008 Comprehensive Annual Financial Report
50
Annual debt service requirements to maturity for Grant Anticipation Notes (GARVEE bonds) are as follows:
Advances and Notes Payable The Department’s outstanding advances and notes payable as of June 30, 2008, were $56,738,689 in governmental activities. The advances and notes payable represent the General Fund (State Highway Fund) loan payable to the Highway Expansion and Extension Loan Program Fund for $33,900,000 and a loan to the City of Goodyear, Arizona, for 5,947,938 for highway construction. The advances and notes payable amount also includes other intergovernmental advances for $16,890,751. Annual debt service requirements to maturity for advances and notes payable are as follows:
Fiscal yearending June 30 Principal Interest Principal Interest Principal Interest
2009 37,209,782$ 314,251$ -$ -$ 37,209,782$ 314,251$ 2010 8,484,365 39,572 - - 8,484,365 39,572$ 2012 10,893,112 - - - 10,893,112 - 2021 151,430 - - - 151,430 -
56,738,689$ 353,823$ - - 56,738,689$ 353,823$
Governmental Activities Business-type Activities Total
Refunded Bonds Deposited with Escrow Agents In prior fiscal years, the Transportation Board had refinanced various bond issues through refunding arrangements. Under the terms of the refunding bond issues, sufficient assets to pay all principal, redemption premium, if any, and interest on the refunded bond issues have been placed in irrevocable trust accounts at commercial banks and invested in U.S. Government securities which, together with interest earned thereon, will provide amounts sufficient for future payment of principal and interest of the issues refunded. The assets, liabilities, and financial transactions of these trust accounts and the liability for the defeased bonds are not reflected in the financial statements of the Department.
Fiscalyear
endingJune 30 Principal Interest
2009 24,050,000$ 14,490,432$ 2010 25,170,000 13,367,182 2011 70,570,000 12,191,182 2012 43,885,000 8,761,582 2013 35,340,000 6,641,482
2014-2016 99,265,000 7,696,682 298,280,000$ 63,148,542$
Grant Anticipation Notes(GARVEE bonds)

Arizona Department of Transportation Notes to the Financial Statements
June 30, 2008
2008 Comprehensive Annual Financial Report
51
Refunded bonds of the Department deposited with escrow agents at June 30, 2008, are as follows:
EscrowOriginal Issue Maturity Date Balance
1999 Series - Senior Highway Refunding Bonds July 1, 2009 64,130,000$ 1999 Series - Senior Highway Refunding Bonds July 1, 2009 13,985,000 2001 Series - Senior Highway Revenue Bonds July 1, 2011 86,170,000 2002 Series B - Senior Highway Revenue Bonds July 1, 2012 48,595,000
Total refunded bonds deposited with escrow agent 212,880,000$
Type
Changes in non-current liabilities The activity for the fiscal year ended June 30, 2008, was as follows:
Beginning EndingBalance Balance Due Within
July 1, 2007 Additions Reductions June 30, 2008 One Year
Governmental Activities:Bonds and notes:
Highway Revenue Bonds 1,490,600,000$ 193,950,000$ <60,645,000>$ 1,623,905,000$ 64,190,000$ Transportation Excise Tax
Revenue Bonds - 370,000,000 <19,045,000> 350,955,000 13,825,000 Grant Anticipation Notes
(GARVEE bonds) 282,860,000 68,000,000 <52,580,000> 298,280,000 24,050,000 Premium on bonds 108,034,322 31,861,772 <11,309,740> 128,586,354 13,002,887
Total bonds and notes 1,881,494,322 663,811,772 <143,579,740> 2,401,726,354 115,067,887 Capital leases 10,600,742 - <3,065,348> 7,535,394 3,181,016 Compensated absences 14,410,376 14,366,473 <13,321,507> 15,455,342 10,387,612 Advances and notes payable 102,209,782 19,528,907 <65,000,000> 56,738,689 37,209,782
Total governmental activities 2,008,715,222 697,707,152 <224,966,595> 2,481,455,779 165,846,297
Business-type Activities:Accrued interest payable - 2,170,356 - 2,170,356 - Compensated absences 151,201 118,238 <124,184> 145,255 145,255
Total business-type activities 151,201 2,288,594 <124,184> 2,315,611 145,255
Total non-current liabilities 2,008,866,423$ 699,995,746$ <225,090,779>$ 2,483,771,390$ 165,991,552$ Internal service funds predominantly serve the governmental funds. Accordingly, long-term liabilities for them are included as part of the above totals for governmental activities. At year-end, $756,622 of the internal service fund’s compensated absences and $7,535,394 of capital leases are included in the above amounts. The capital leases will be liquidated by the internal service fund as well as the General Fund (State Highway Fund). The General Fund (State Highway Fund) has paid compensated absences in the past while the advances and notes payable will be repaid with funds from the General Fund (State Highway Fund) and the Maricopa Regional Area Road Construction Fund.

Arizona Department of Transportation Notes to the Financial Statements
June 30, 2008
2008 Comprehensive Annual Financial Report
52
Bonds and notes issued by the Department require compliance with a number of covenants. The Department believes that it is in compliance with all such covenants. In addition, certain of the Department’s obligations are subject to Internal Revenue Service regulations pertaining to issuance of tax-exempt debt by governmental entities. The Department does not have and has not accrued a liability under these regulations. H. Short-term Debt – Board Funding Obligations The Transportation Board has issued Board Funding Obligations (BFOs) to the State Treasurer in accordance with Arizona Revised Statutes, §28-7678. The BFOs are nonnegotiable and are authorized by Transportation Board resolution specifying the rate(s) of interest, the date(s) of maturity, the terms of redemption, the form and manner of execution of the funding obligation, any terms necessary to secure credit enhancement or other sources of payment or security and any other item the Transportation Board determines is necessary. The total principal amount of BFOs at any one time shall not be more than $200 million and shall mature no later than four calendar years after the delivery. Up to $60 million of the proceeds shall be deposited into the General Fund (State Highway Fund) and up to $140 million shall be deposited into the Highway Expansion and Extension Loan Program Fund. The BFOs are special obligations of the Transportation Board; are not obligations that are general, special or otherwise of the State; are not a legal debt of the State; and are payable and enforceable only from the monies pledged and assigned in the authorizing resolutions of the Transportation Board. The State Treasurer shall provide written notice to the Transportation Board and the Department when the operating monies fall below $400 million. If operating monies fall below $200 million, the State Treasurer may call the investment in the BFOs in $25 million increments up to the amount that the operating monies are below $200 million. The State Treasurer shall give the Transportation Board and the Department at least fifteen days' notice of the call. The activity for the fiscal year ended June 30, 2008, was as follows:
Beginning EndingBalance Balance
July 1, 2007 Additions Reductions June 30, 2008
Governmental Activities:Board Funding Obliations 60,000,000$ 60,000,000$ <60,000,000>$ 60,000,000$
Total governmental activities 60,000,000 60,000,000 <60,000,000> 60,000,000
Business-type Activities:Board Funding Obligations 140,000,000 50,000,000 <140,000,000> 50,000,000
Total business-type activities 140,000,000 50,000,000 <140,000,000> 50,000,000
Total short-term debt 200,000,000$ 110,000,000$ <200,000,000>$ 110,000,000$ During fiscal year 2008, the Department repaid $60,000,000 in principal and $6,240,000 in accrued interest for the Series 2003 BFOs in the General Fund (State Highway Fund) and borrowed $60,000,000 of the Series 2007 BFOs in the General Fund (State Highway Fund). The Department also repaid $140,000,000 in principal and $14,534,466 in accrued interest for the Series 2003 BFOs in the Highway Expansion and Extension Loan Program Fund and borrowed $50,000,000 of the Series 2007 BFOs in the Highway Extension and Expansion Loan Program Fund. Interest accrued to date on the Series 2007 BFOs is $2,604,427 and $2,170,356, respectively. Both the principal and interest on the Series 2007 BFOs are due no later than August 8, 2011. During fiscal year 2007, there were no repayments and the Department accrued interest of $4,040,000 on the Series 2003 BFOs.
Arizona Department of Transportation Notes to the Financial Statements
June 30, 2008
2008 Comprehensive Annual Financial Report
53
I. Fund Balances Reservations Effective July 1, 1981, State law required accumulation of at least 15 percent, which in fiscal year 1996 was modified to 12.6 percent, of the revenues allocated each year to the General Fund (State Highway Fund) from the Highway User Revenue Fund for the design, purchase of right-of-way, or construction of controlled-access highways and other permitted facilities which are included in the regional transportation plan of counties with populations in excess of 400,000 (Maricopa and Pima counties). At June 30, 2008, approximately $155 million was reserved in the General Fund (State Highway Fund) for this purpose. In addition, the Statewide Transportation Acceleration Needs account held $302.7 million. The remaining $20.9 million was reserved for highway construction from federal highway monies and right of way. The Maricopa Regional Area Road Construction Fund is reserved for capital projects. The Capital Projects Fund is reserved for capital projects funded with Highway Revenue Bonds, Transportation Excise Tax Revenue Bonds, and Grant Anticipation Notes (GARVEE bonds). The Debt Service Fund reserve is for future debt service payments. 6. OTHER INFORMATION A. Subsequent Events On September 25, 2008, the Transportation Board issued $181,050,000 of Highway Revenue Bonds, Series 2008B for the purposes of i) financing portions of the Transportation Board's five-year capital program and ii) paying costs of issuing the Series 2008B Bonds. The Series 2008B Bonds were issued as senior lien bonds and mature from July 1, 2023 through July 1, 2033. Net proceeds totaled $187,470,581 (after receipt of $7,550,366 reoffering premium and payment of $1,129,785 in underwriting fees and costs of issuance). The bonds were rated AAA and Aa1 by Standard & Poor's Ratings Services and Moody's Investors Service, respectively. On October 23, 2008, the State Treasurer notified the Department and the Transportation Board of the potential call of the $60 million of the Series 2007 Board Funding Obligations outstanding and deposited in the General Fund and the $50 million of the Series 2007 Board Funding Obligations outstanding and deposited in the Highway Expansion and Extension Loan Program Fund. Arizona Revised Statutes, §35-313(D) (3), requires that the State Treasurer provide this notice when operating monies of the State fall below $400 million. This statute further provides that the State Treasurer may call the Board Funding Obligations (BFOs) in $25 million increments if operating monies of the State fall below $200 million. The BFOs may only be called with 15 days' notice. Interest accrued on any BFOs that are called is not payable until maturity of the BFOs. B. Contingent Liabilities Risk Management Insurance Losses The Department is exposed to various risks of loss related to torts; thefts of, damage to, and destruction of assets; errors and omissions; injuries to employees; and natural disasters. The Department is a participant in the state’s self-insurance program and, in the opinion of the Department’s management, any unfavorable outcomes from these claims and actions would be covered by the self-insurance program. Accordingly, the Department has no risk of loss beyond adjustments to future years’ premium payments to the state’s self-insurance program. All estimated losses for unsettled claims and actions of the state are determined on an actuarial basis and are included in the State of Arizona’s Comprehensive Annual Financial Report. Claims The Department has a variety of claims pending against it that arose during the normal course of its activities. Management of the Department believes, based on the advice of legal counsel, that losses, if any, resulting from settlement of these claims will not have a material effect on the financial position of the Department.

Arizona Department of Transportation Notes to the Financial Statements
June 30, 2008
2008 Comprehensive Annual Financial Report
54
Grants Amounts received or receivable from grant agencies are subject to audit and adjustment by grantor agencies, principally the federal government. Any disallowed claims, including amounts already collected, may constitute a liability of the applicable funds. The amount, if any, of expenditures which may be disallowed by the grantor cannot be determined at this time although the Department expects such amounts, if any, to be immaterial. Light Rail Transit System Arizona Revised Statutes, §28-9201, requires the Department to establish, implement, and enforce minimum safety standards for light rail transit systems. If a violation of the safety standards is discovered, the Department shall report the violation in writing to the Federal Transit Administration. Furthermore, the organization that operates a light rail transit system shall include a safety oversight function and pay the Department’s costs resulting from administration. C. Pension and Other Postemployment Benefits Plan descriptions — The Department contributes to a cost-sharing, multiple-employer defined benefit pension plan; a cost-sharing, multiple-employer defined benefit health care plan; and a cost-sharing, multiple-employer defined benefit long-term disability plan, all of which are administered by the Arizona State Retirement (System). The System (through its Retirement Fund) provides retirement (i.e. pension), death, and survivor benefits; the Health Benefit Supplement Fund provides health insurance premium benefits (i.e. a monthly subsidy); and the Long-Term Disability Fund provides long-term disability benefits. Benefits are established by state statute. The System is governed by the Arizona State Retirement System Board according to the provisions of Arizona Revised Statutes, Title 38, Chapter 5, Article 2. The System issues a Comprehensive Annual Financial Report that includes financial statements and required supplementary information. The most recent report may be obtained by writing the Arizona State Retirement System, 3300 North Central Avenue, P.O. Box 33910, Phoenix, AZ 85067-3910 or by calling (602) 240-2000 or (800) 621-3778. Funding policy — The Arizona State Legislature establishes and may amend active plan members’ and the Department’s contribution rates. For the year ended June 30, 2008, active plan members were required by statute to contribute at the actuarially determined rate of 9.6 percent (9.1 percent for retirement and 0.5 percent for long-term disability) of the members’ annual covered payroll and the Department was required by statute to contribute at the actuarially determined rate of 9.6 percent (8.05 percent for retirement, 1.05 percent for health insurance premium, and 0.5 percent for long-term disability) of the members’ annual covered payroll. The Department’s contributions for the current and two preceding years, all of which were equal to the required contributions, were as follows:
Fiscal year ended
June 30 Retirement Fund Health Benefit
Supplement Fund Long-Term
Disability Fund Total 2008 $ 15,697,915 $ 2,047,553 $ 975,019 $ 18,720,487 2007 13,589,541 1,772,548 844,065 16,206,154 2006 10,150,200 1,323,939 630,443 12,104,582
The Department's total payroll for fiscal year 2008 was $202.0 million. The System is funded through payroll deductions from employees' gross earnings and amounts contributed by the Department. Retirement benefits, health care benefits, and long term disability benefits are obligations of the System and not of the Department. The Arizona Revised Statutes provide statutory authority for employee and employer contributions. The contribution requirement for fiscal year 2008 was $18.7 million each by both the employees and the Department.

Required Supplementary Information
Budgetary Comparison Schedule - General Fund (State Highway Fund)
Note to Required Supplementary Information
Information About Infrastructure Assets Reported Using the Modified Approach
(Other than MD&A)
2008 Comprehensive Annual Financial Report

Arizona Department of Transportation Required Supplementary Information
June 30, 2008
2008 Comprehensive Annual Financial Report
55
Budgetary Comparison Schedule General Fund (State Highway Fund)
for the fiscal year ended June 30, 2008
Variance withFinal Budget -
Budgeted Amounts Actual PositiveOriginal Final Amounts <Negative>
Expenditures appropriated by State legislature in 2008 budgetAdministration 45,462,200$ 45,462,200$ 45,410,117$ 52,083$ Highways 267,610,900 267,610,900 262,746,114 4,864,786 Motor Vehicle 105,093,700 105,093,700 103,637,136 1,456,564
Total 418,166,800$ 418,166,800$ 411,793,367 6,373,433$
Timing differences:Prior year appropriation expenditures expended in current budgetary year 2,202,551 Current year appropriation expenditures expended in future budgetary year <3,204,965>
Basis differences:Net increase <decrease> from cash basis for budgeting purposes and
modified accrual basis for financial reporting purposes <13,635,568> Entity differences:
Funds not appropriated, but included for financial reporting purposes 6,246,648 Perspective differences:
Expenditures on modified accrual basis and not recognized on budgetary basis:Capital outlay and asset preservation 542,723,093 Distributions to Arizona counties and cities 45,030,296 Distributions to other state agencies 56,715,904 Interest expense 1,416,562 Principal repayment of debt 60,393,159
Total expenditures as reported on the Statement of Revenues, Expenditures, andChanges in Fund Balances - Governmental Funds (General Fund) - Exhibit 4 1,109,681,047$
The note to required supplementary information is an integral part of this statement.
Arizona Department of Transportation Required Supplementary Information
June 30, 2008
2008 Comprehensive Annual Financial Report
56
Note to Required Supplementary Information
1. Budgets and budgetary accounting Annual budgets for the operating expenditures for the General Fund (State Highway Fund), and capital outlay including land, building, and improvements for the General Fund (State Highway Fund) and State Aviation Fund, are submitted to the Governor in accordance with state law. The budgets are legally enacted as appropriations after approval by the State legislature and signature by the Governor. The legal level of control for operating expenditures is at the program level and expenditure budgets are appropriated using a lump sum format with special line items. Expenditure details for personal services, employee related expenditures, and all other operating expenditures are specifically allocated within all divisions. In certain divisions, other specific programs are allocated in addition to these categories. Revenue budgets are developed internally by the Department and are not a part of the appropriation process. Amendments to the approved appropriations require legislative approval. However, since the Department’s appropriation is a lump sum appropriation by program, the allocation of funds between personal services, employee-related expenses, and other operating expenditures is an internal decision for the program manager. Accordingly, transfers between line items such as personal services and other operating expenditures within a particular program may be made by the program manager. Transfers of funds between programs require the approval of the Director of the Department of Administration. Expenditures may not exceed appropriations. All transfers of funds are reported to the Department’s Office of Strategic Planning and Budgeting for monitoring purposes. Budgets are prepared on the cash basis except that liabilities incurred before the end of the fiscal year and paid within the first month of the subsequent fiscal year are charged against the prior fiscal year’s budget. The Department’s appropriations lapse at year-end unless exempted by the legislature. For financial reporting purposes, the accompanying financial statements present the legally adopted budget for the operations of the General Fund (State Highway Fund) that is subject to legislative appropriation. The capital outlay appropriation includes state highway construction and land, building, and improvements for the General Fund (State Highway Fund). A legal limitation is adopted for land, building, and improvements; however, legislation allows the Department to spend in excess of its appropriation for state highway construction up to the current fund balance. The Department monitors expenditures through an internal budgetary process and the Five-Year Transportation Facilities Construction Program approved by the Transportation Board.

Arizona Department of Transportation Required Supplementary Information
June 30, 2008
2008 Comprehensive Annual Financial Report
57
Information About Infrastructure Assets Reported Using the Modified Approach As allowed by Governmental Accounting Standards Board Statement No. 34, Basic Financial Statements – and Management’s Discussion and Analysis – for State and Local Governments (GASB 34), the Arizona Department of Transportation (Department) reports its roads and bridges using the modified approach. Assets accounted for under the modified approach include 6,785 center lane miles (18,546 travel line miles) of roads and 4,637 bridges that the Department is responsible to maintain. In order to utilize the modified approach, the Department is required to:
• Maintain an asset management system that includes an up to date inventory of eligible infrastructure assets. • Perform condition assessments of eligible assets and summarize the results using a measurement scale. • Estimate each year the annual amount to maintain and preserve the assets at the condition level established and
disclosed by the Department. • Document that the assets are being preserved approximately at or above the established condition level.
As adopted by the Transportation Board of the State of Arizona Department of Transportation (Transportation Board) on an annual basis, the Five-Year Transportation Facilities Construction Program (Program) contains estimated expenditures for highway system improvements and the preservation of existing roadway and bridges. Both of these factors impact the condition assessment of the roads and bridges as described in the following sections. The Program in effect for fiscal year 2009 and beyond was adopted by the Transportation Board on June 23, 2008. This Program is a dynamic instrument and adjustments are made to the annual plans based on the needs of the Department to maintain the condition level of the roads and bridges at a level equal to, or greater than, the goals established by the Department. In addition, not only are adjustments made during the life of the Program, circumstances may require that refinements to the individual components of the Program be made during the fiscal year. In comparing Estimated to Actual Expenditures in the tables that follow, significant variances can occur. These variances are primarily due to the methodology used in the preparation of the Program. In this Program, the Estimated Expenditures for the current year is based on “programmed” projects which may or may not be spent in the current year of the Program. “Programmed” expenditures consist of those items that are planned for the future, with contracts that have not yet been awarded. Furthermore, the Actual Expenditures will include projects that were “programmed” for a prior year’s Estimated Expenditures, but which did not occur, or were not completed, in the prior year. The following information pertains to the condition assessment and maintenance of infrastructure assets and reflects the Department’s success in achieving condition levels that exceed the established levels. Roads The mission of the Department’s Pavement Management Section (PMS) is to develop and provide a cost effective pavement rehabilitation construction program that preserves the State’s investment in its highway system and enhances public transportation and safety. The requirements of GASB 34 and the PMS both work toward the same basic goal, the efficient, effective management of the Department’s assets to produce long term benefits while minimizing expenditures. The PMS has developed performance goals for the condition level of the pavement in the State highway system. These goals require periodic assessment of pavement conditions and the budget level needed to meet that goal. The goal is expressed as a measure called “Serviceability” which can be defined as the ability of a pavement to serve the traveling public (as documented in 1961 after AASHTO Road Test, 1956-1961). Serviceability is based on detailed measurements of objective features of the pavement. Many surveys since the original road test have shown that these measurements closely track the subjective opinion of the traveling public. Most commonly, this number is called Present Serviceability Rating and abbreviated as PSR. PSR is a five-point scale (5 excellent, 0 impassable), similar to the Weaver/AASHTO Scale shown as follows:

Arizona Department of Transportation Required Supplementary Information
June 30, 2008
2008 Comprehensive Annual Financial Report
58
Information About Infrastructure Assets Reported Using the Modified Approach - continued
Numerical Rating
PSR
Weaver/AASHTO Scale
5 Excellent Perfect 4 Good Very Good 3 Fair Good 2 Poor Fair 1 Very Poor Poor 0 Impassable Very Poor
The goal of the Department is to maintain a condition level (PSR) rating of 3.23 or better for all roads in the State highway system. Annually, Transportation Material Technicians drive over the system with inertial profiling equipment and measure the roughness of the pavement. This process is continuous throughout the year in order to assess the condition level of all pavement on an annual basis. As of the end of fiscal year 2008, an overall rating of 3.91 was achieved, as shown in the following graph:
Condition Level - Roads
0
1
2
3
4
5
2004 2005 2006 2007 2008
Fiscal Year
PSR Actual Level
Desired Level
Figure 1
Preservation of the roads is accomplished through programs managed primarily by the Department’s PMS, as well as other units within the Department. The estimated (as specified in the Program as programmed amounts) and actual expenditures for fiscal years 2004 through 2008 were as follows:
Fiscal Year
Estimated Expenditures (in millions)
Actual Expenditures (in millions)
2004 $198.5 $218.5 2005 235.7 195.0 2006 218.5 211.5 2007 216.4 196.5 2008 260.7 247.9

Arizona Department of Transportation Required Supplementary Information
June 30, 2008
2008 Comprehensive Annual Financial Report
59
Information About Infrastructure Assets Reported Using the Modified Approach – continued Bridges The Department’s bridge assets constitute a significant portion of all infrastructure assets in Arizona. As of June 30, 2008, the Department owns and maintains 4,637 bridges with an approximate total deck area of 44,440,010 square feet. Bridges, for purposes of this report, include all structures erected over an opening or depression with a centerline of 20 feet or more. Information related to these bridges is stored and updated in the Arizona Bridge Information and Storage System (ABISS). This system is used to efficiently manage the bridge inventory through storing all bridge related data and assisting bridge engineers in arriving at appropriate bridge preservation decisions. Also, ABISS is used for reporting bridge inventory and condition, on a biennial basis, to the Federal Highway Administration (FHWA). A Condition Rating Index (CRI) is used to track the condition of the bridge network. The CRI is based on four selected bridge inspection condition ratings, which in turn are based on standards established in the FHWA’s “Recording and Coding Guide for the Structural Inventory of the Nation’s Bridges.” The four selected condition ratings that are included in the CRI computation are: the bridge joints condition, the deck condition, the super-structure condition, and the sub-structure condition. The bridge joints condition rating is an Arizona specific rating item not included in the FHWA condition rating guidelines, whereas the three other condition ratings are federally mandated condition ratings. The CRI is computed by subtracting from one the ratio of the sum of the deck areas of all bridges with a condition rating of four or less (see table below), which indicates that the rated element is at best in a poor condition, to the total sum of the deck areas. The rating system in this guide is as follows:
Numerical Rating
Condition Rating
9 Excellent 8 Very Good 7 Good 6 Satisfactory 5 Fair 4 Poor 3 Serious 2 Critical 1 Imminent Failure
Management of the bridge inventory is a major function of the Department’s Bridge Group and regularly scheduled biennial inspections are made of all bridges. A civil or structural engineer, licensed to practice in Arizona, performs these inspections. It is the policy of the Department to maintain State highway bridges so that the CRI exceeds 92.5%. In fiscal year 2008, the CRI was computed at 93.4%.
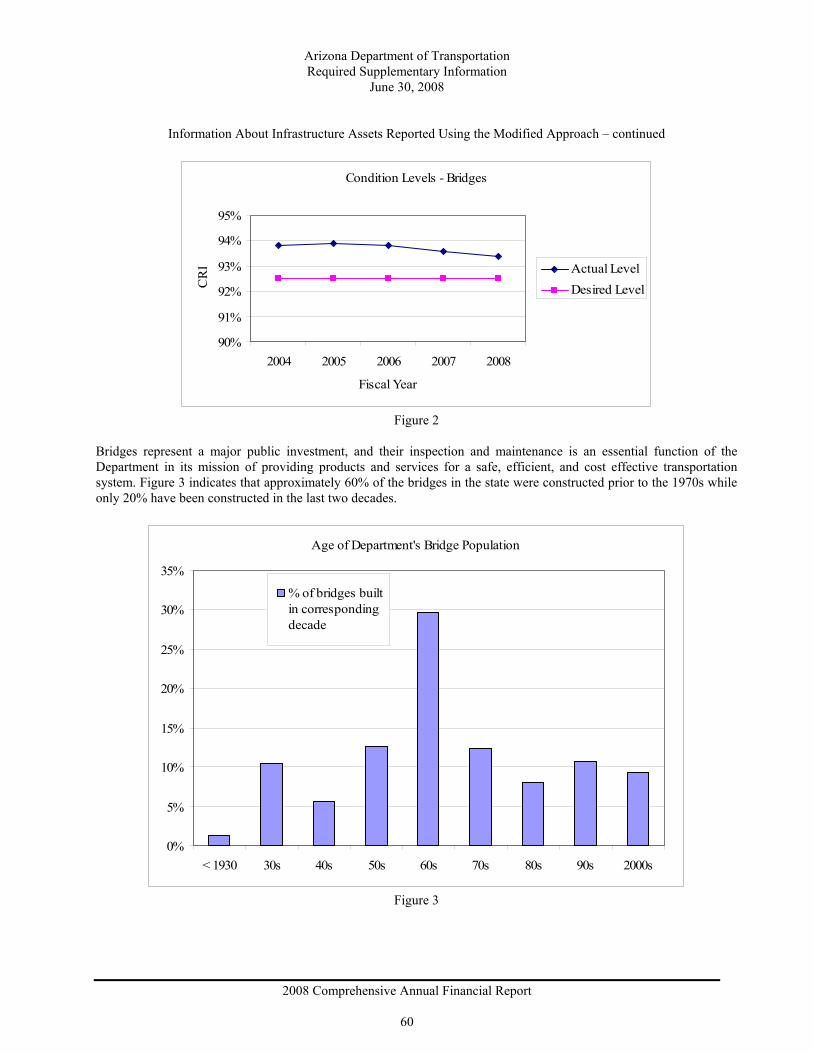
Arizona Department of Transportation Required Supplementary Information
June 30, 2008
2008 Comprehensive Annual Financial Report
60
Information About Infrastructure Assets Reported Using the Modified Approach – continued
Condition Levels - Bridges
90%
91%
92%
93%
94%
95%
2004 2005 2006 2007 2008
Fiscal Year
CR
I Actual LevelDesired Level
Figure 2
Bridges represent a major public investment, and their inspection and maintenance is an essential function of the Department in its mission of providing products and services for a safe, efficient, and cost effective transportation system. Figure 3 indicates that approximately 60% of the bridges in the state were constructed prior to the 1970s while only 20% have been constructed in the last two decades.
Age of Department's Bridge Population
0%
5%
10%
15%
20%
25%
30%
35%
< 1930 30s 40s 50s 60s 70s 80s 90s 2000s
% of bridges builtin correspondingdecade
Figure 3

Arizona Department of Transportation Required Supplementary Information
June 30, 2008
2008 Comprehensive Annual Financial Report
61
Information About Infrastructure Assets Reported Using the Modified Approach – continued Preservation of the bridges is accomplished through programs managed by the Bridge Group. The estimated (as specified in the Program as programmed amounts) and actual expenditures for fiscal years 2004 through 2008 were as follows:
Fiscal Year
Estimated Expenditures (in millions)
Actual Expenditures (in millions)
2004 $8.7 $9.2 2005 7.4 11.0 2006 10.6 11.3 2007 17.1 22.5 2008 13.4 18.1

Non-Major Governmental Funds
Financial Statements
Special Revenue Funds
Special revenue funds are used to account for specific revenues that are legally restricted to expenditures for particular purposes.
The State Aviation Fund is appropriated by the legislature and receives monies from aviation gasoline taxes, sale of abandoned and seized aircraft, flight property taxes, and the operation of the Grand Canyon National Park Airport. The Aviation Fund monies are used to build and maintain airport facilities throughout Arizona.
The Safety Enforcement and Transportation Infrastructure Fund is appropriated by the legislature and receives monies from the registration of vehicles of nonresidents for enforcement of vehicle safety requirements, maintenance of transportation facilities, and upgrades of transportation facilities, including roads, streets, and highways, approved by the Transportation Board within twenty-five miles of the border between Arizona and Mexico.
The Motor Vehicle Liability Insurance Enforcement Fund receives fees and interest to administer the State’s Mandatory Liability Insurance Program.
The Motor Vehicle Inspection and Title Enforcement Fund receives monies from a continuing appropriation to be used to defray the cost of investigations involving certificates of title, licensing fraud, registration enforcement, and other enforcement related issues.
The Motor Carrier Safety Revolving Fund receives fees to administer and enforce the rules governing the safety operations of motor carriers, shippers, and vehicles transporting hazardous materials, substances, or waste.
The Underground Storage Tank Fund receives certain Motor Vehicle Division revenues for distribution to the Department of Environmental Quality.
The Economic Strength Project Fund receives monies from the Highway User Revenue Fund for use on approved economic strength projects recommended by the Department of Commerce and Economic Development Commission.
The Grant Anticipation Notes Fund receives revenues from the Federal Highway Administration under various grant agreements for the repayment of Grant Anticipation Notes (GARVEE bonds).
The Local Agency Deposits Fund receives monies from the U.S. Government and local agencies for the payment of local agency sponsored county secondary road construction projects.
2008 Comprehensive Annual Financial Report

Safety Enforcement Motor Vehicle Vehicle
and Liability InspectionState Transportation Insurance and Title
Aviation Infrastructure Enforcement EnforcementFund Fund Fund Fund
ASSETSUnrestricted cash on deposit with
the State Treasurer 16,574,708$ 2,511,375$ 3,826,451$ 2,415,318$ Receivables:
Accrued interest 161,759 8,854 - - Interfund 64,849 112,630 106,718 52,090 Notes and loans 8,628,966 - - - Other 550,281 - - -
Amounts due fromU.S. Government - - - -
Restricted cash on deposit with the State Treasurer - - - -
Total assets 25,980,563$ 2,632,859$ 3,933,169$ 2,467,408$
LIABILITIESAccounts payable 826,785$ 299$ -$ -$ Accrued payroll and other
accrued expenditures 65,437 45,182 71,251 53,979 Contracts and retainage payable - - - - Amounts due to:
Arizona counties and cities - - - - Other state agencies - - - -
Deferred revenue 8,628,966 - - - Total liabilities 9,521,188 45,481 71,251 53,979
FUND BALANCESReserved for:
Debt service - - - - Capital projects - - - -
Unreserved special revenue funds 16,459,375 2,587,378 3,861,918 2,413,429 Total fund balances 16,459,375 2,587,378 3,861,918 2,413,429
Total liabilities and fund balances 25,980,563$ 2,632,859$ 3,933,169$ 2,467,408$
2008 Comprehensive Annual Financial Report
Arizona Department of TransportationCombining Balance Sheet
Non-Major Governmental FundsJune 30, 2008
62

Exhibit 9
Motor Carrier Underground Economic Grant Local TotalSafety Storage Strength Anticipation Agency Non-Major
Revolving Tank Project Notes Deposits GovernmentalFund Fund Fund Fund Fund Funds
37,342$ -$ 3,288,616$ -$ -$ 28,653,810$
- 6,946 16,926 - - 194,485 - 2,671,976 - - - 3,008,263 - - - - - 8,628,966 - - - - 3,014,098 3,564,379
- - - - 3,222,241 3,222,241
- 222,134 - 93 16,233,570 16,455,797 37,342$ 2,901,056$ 3,305,542$ 93$ 22,469,909$ 63,727,941$
-$ -$ -$ -$ -$ 827,084$
- - - - - 235,849 - - - - 4,207,759 4,207,759
- - 3,305,542 - - 3,305,542 - 2,901,056 - - - 2,901,056 - - - - - 8,628,966 - 2,901,056 3,305,542 - 4,207,759 20,106,256
- - - 93 - 93 - - - - 18,262,150 18,262,150
37,342 - - - - 25,359,442 37,342 - - 93 18,262,150 43,621,685 37,342$ 2,901,056$ 3,305,542$ 93$ 22,469,909$ 63,727,941$
2008 Comprehensive Annual Financial Report
63

Safety Enforcement Motor Vehicle Vehicle
and Liability InspectionState Transportation Insurance and Title
Aviation Infrastructure Enforcement EnforcementFund Fund Fund Fund
Revenues:Vehicle registration, title, license,
and related taxes and fees 7,449,685$ 3,329,706$ -$ -$ Fuel and motor carrier taxes and fees 424,647 - 2,906,495 1,652,600 Reimbursement of construction
expenditures - federal aid - - - - Other federal grants and reimbursements 697,317 - - - Reimbursements from Arizona counties and cities - - - - Interest on loans receivable 293,242 - - - Income from investments 1,448,624 130,573 - - Flight property taxes 13,821,790 - - - Grand Canyon National Park Airport 939,946 - - - Other 77,788 - - -
Total revenues 25,153,039 3,460,279 2,906,495 1,652,600
Expenditures: Current:
Transportation:Aeronautics 4,088,494 - - - Highway - - - - Motor Vehicle - 2,087,874 2,096,315 1,532,026
Total transportation 4,088,494 2,087,874 2,096,315 1,532,026 Intergovernmental:
Distributions to Arizona counties and cities 19,912,291 - - Distributions to other state agencies 18,116,800 2,178,400 5,564,374 1,244,700
Total expenditures 42,117,585 4,266,274 7,660,689 2,776,726
Excess <deficiency> of revenues over<under> expenditures <16,964,546> <805,995> <4,754,194> <1,124,126>
Other financing sources <uses>:Transfers out for debt service - - - - Transfers out other - - - -
Total other financing sources <uses> - - - -
Net change in fund balances <16,964,546> <805,995> <4,754,194> <1,124,126> Fund balances - July 1 33,423,921 3,393,373 8,616,112 3,537,555 Fund balances - June 30 16,459,375$ 2,587,378$ 3,861,918$ 2,413,429$
2008 Comprehensive Annual Financial Report
Arizona Department of TransportationCombining Statement of Revenues, Expenditures, and Changes in Fund Balances
Non-Major Governmental Fundsfor the fiscal year ended June 30, 2008
64

Exhibit 10
Motor Carrier Underground Economic Grant Local TotalSafety Storage Strength Anticipation Agency Non-Major
Revolving Tank Project Notes Deposits GovernmentalFund Fund Fund Fund Fund Funds
-$ -$ -$ -$ -$ 10,779,391$ - 28,669,315 1,000,000 - - 34,653,057
- - - 67,599,433 - 67,599,433 - - - - 31,472,481 32,169,798 - - - - 8,262,949 8,262,949 - - - - - 293,242 - 110,232 240,177 3 - 1,929,609 - - - - - 13,821,790 - - - - - 939,946
6,500 - - - - 84,288 6,500 28,779,547 1,240,177 67,599,436 39,735,430 170,533,503
- - - - - 4,088,494 - - - - 37,285,011 37,285,011 - 1,849 4,080 - - 5,722,144 - 1,849 4,080 - 37,285,011 47,095,649
- - <838,903> - - 19,073,388 - 28,777,698 2,075,000 - - 57,956,972 - 28,779,547 1,240,177 - 37,285,011 124,126,009
6,500 - - 67,599,436 2,450,419 46,407,494
- - - <67,599,433> - <67,599,433> - - - - <62,956> <62,956> - - - <67,599,433> <62,956> <67,662,389>
6,500 - - 3 2,387,463 <21,254,895> 30,842 - - 90 15,874,687 64,876,580 37,342$ -$ -$ 93$ 18,262,150$ 43,621,685$
2008 Comprehensive Annual Financial Report
65

Fiduciary Funds Financial Statements
Combining Statement of Net Assets
Statement of Changes in Assets and Liabilities
AGENCY FUNDS
Highway Properties - Privilege Tax Fund collects monies from renters of properties previously acquired by the Department for use in future highway development. Monies collected are distributed to the Department of Revenue.
Highway Properties - 24 Percent Fund collects 24 percent of the Department’s rental income from properties for use in future highway development. Monies collected are distributed to the local counties.
2008 Comprehensive Annual Financial Report

Exhibit 11
Highway Properties -Privilege Tax Fund
Highway Properties - 24 Percent Fund Total
ASSETSRestricted cash on deposit with the State Treasurer -$ 136,434$ 136,434$ Other receivables - - -
Total assets -$ 136,434$ 136,434$
LIABILITIESDue to Arizona counties -$ 136,434$ 136,434$ Other payables - - -
Total liabilities -$ 136,434$ 136,434$
2008 Comprehensive Annual Financial Report
Arizona Department of TransportationCombining Statement of Net Assets
Agency FundsJune 30, 2008
66

Exhibit 12
Balance BalanceJuly 1, 2007 Additions Deductions June 30, 2008
ASSETSRestricted cash on deposit with the State Treasurer -$ 3,039$ <3,039>$ -$
Total assets -$ 3,039$ <3,039>$ -$
LIABILITIESDue to Department of Revenue -$ 3,039$ <3,039>$ -$
Total liabilities -$ 3,039$ <3,039>$ -$
ASSETSRestricted cash on deposit with the State Treasurer 172,526$ 144,163$ <180,255>$ 136,434$ Other receivables 204 - <204> -
Total assets 172,730$ 144,163$ <180,459>$ 136,434$
LIABILITIESDue to Arizona counties 169,916$ 146,977$ <180,459>$ 136,434$ Other payables 2,814 - <2,814> -
Total liabilities 172,730$ 146,977$ <183,273>$ 136,434$
ASSETS
Restricted cash on deposit with the State Treasurer 172,526$ 147,202$ <183,294>$ 136,434$ Other receivables 204 - <204> -
Total assets 172,730$ 147,202$ <183,498>$ 136,434$
LIABILITIES
Due to Arizona counties 169,916$ 146,977$ <180,459>$ 136,434$ Due to Department of Revenue - 3,039 <3,039> - Other payables 2,814 - <2,814> -
Total liabilities 172,730$ 150,016$ <186,312>$ 136,434$
2008 Comprehensive Annual Financial Report
Arizona Department of TransportationStatement of Changes in Assets and Liabilities
for the fiscal year ended June 30, 2008Agency Funds
Highway Properties - Privilege Tax Fund
Highway Properties - 24 Percent Fund
Total
67

Statistical Section

Arizona Department of Transportation Overview – Statistical Section
for the fiscal year ended June 30, 2008
2008 Comprehensive Annual Financial Report
68
This part of the Arizona Department of Transportation’s (Department) Comprehensive Annual Financial Report provides detail in the form of graphs and tables intended to assist the reader of the report with understanding the information presented in the financial statements, note disclosures, and required supplementary information regarding the overall financial health of the department. Financial Trends These schedules show trend information that gives an insight into the Department’s financial well-being
and performance over time. Revenue Capacity Information about the Motor Vehicle Fuel Tax and the Highway User Revenue Fund, the Department’s
most significant own-source revenues, is presented in these tables. Debt Capacity These tables present information to help the reader assess the affordability of the Department’s current
levels of outstanding debt as well as the Department’s ability to issue additional debt in the future. Demographic and Economic Information The demographic and economic indicators presented in this section offer an understanding of the
environment in which the Department’s financial activities take place. Operating Information The Department’s relationship of the financial report to the services provided as well as its activities is
illustrated in these tables depicting service and infrastructure information. Sources: Unless otherwise stated, all information in the following tables is derived from the comprehensive annual financial reports for the years shown.

Arizona Department of Transportation Index – Statistical Section
for the fiscal year ended June 30, 2008
2008 Comprehensive Annual Financial Report
69
Page Financial Trends
Table 1 – Change in Net Assets.............................................................................................................................70-71
Table 2 – Net Assets by Component ..........................................................................................................................72
Table 3 – Statement of Revenues, Expenditures, and Changes in Fund Balances......................................................73
Table 4 – Fund Balances of Governmental Funds......................................................................................................74
Table 5 – Expenditures of Federal Awards.................................................................................................................75
Table 6 – Government-wide Expenses by Function ...................................................................................................76
Table 7 – Government-wide Revenues.......................................................................................................................77
Revenue Capacity
Table 8 – Highway User Revenue Fund Collections.................................................................................................78
Table 9 – Highway User Revenue Fund Distributions ..............................................................................................79
Table 10 – Fuel Tax Rates ...........................................................................................................................................80
Table 11 – Motor Vehicle Fuel Tax – Top Ten Suppliers ...........................................................................................81
Table 12 – Gasoline Volume Sold – Top Twenty-Five Suppliers ..........................................................................82-83
Debt Capacity
Table 13 – Highway User Revenue Fund – Legal Debt Margin..................................................................................84
Table 14 – Highway Revenue Bonds – Bond Coverage..............................................................................................85
Table 15 – Transportation Excise Tax Revenue Bonds – Bond Coverage ..................................................................86
Table 16 – Transportation Excise Tax Revenue Bonds – Debt Service Revenue and Cost Per Capita.......................87
Demographic and Economic Information
Table 17 – Number of Vehicle Registrations Per Year ...............................................................................................88
Table 18 – Vehicle Registrations Per Year Compared to Fuel Sales...........................................................................89
Table 19 – Demographic and Economic Statistics ......................................................................................................90
Table 20 – Principal Employers ..................................................................................................................................91
Operating Information
Table 21 – Appropriated Full Time Equivalents (FTEs) .............................................................................................92
Table 22 – Capital Assets – Schedule by Function and Activity.................................................................................93
Table 23 – Capital Assets – Schedule of Changes by Function and Activity ..............................................................94
Table 24 – Total Public Road Mileage by Highway Class and Governmental Ownership .........................................95
Table 25 – Daily Vehicle Miles Traveled with Population Data .................................................................................96

Table 1
Expenses: 2002 2003 2004 2005 2006 2007 2008Governmental activities:
Administration 57,864$ 52,533$ 57,703$ 42,298$ 45,002$ 51,667$ 54,918$ Aeronautics 3,751 3,848 7,512 9,804 10,705 5,418 4,373 Highway1 46,543 45,644 93,656 125,889 118,147 138,788 132,874 Highway maintenance 91,570 96,353 95,642 105,037 114,119 120,163 137,100 Motor Vehicle 82,904 83,090 86,845 91,676 96,937 105,961 112,880 Other 6,844 8,460 9,815 6,871 9,394 - - Non-capital, including asset preservation1 96,629 277,975 333,930 156,678 <53,981> 113,569 187,004 Distributions to Arizona counties and cities 915,219 957,057 1,022,768 1,086,955 1,095,671 1,219,208 1,238,383 Distributions to other state agencies 149,341 192,536 161,029 306,853 206,903 114,795 176,692 Local governmental assistance 24,791 30,235 39,205 42,440 36,771 48,760 37,285 Interest on long-term debt 89,605 84,084 89,431 86,870 88,279 82,450 92,295
Total governmental activities expenses 1,565,061 1,831,815 1,997,536 2,061,371 1,767,947 2,000,779 2,173,804
70 Business-type activities:Arizona Highways Magazine 10,711 11,118 10,007 10,270 8,175 8,072 7,712 Highway Expansion and Extension Loan Program 5,265 26,349 4,414 4,360 4,273 4,355 4,053
Total business-type activities expenses 15,975 37,467 14,421 14,630 12,448 12,427 11,765 Total primary government expenses 1,581,036$ 1,869,282$ 2,011,957$ 2,076,001$ 1,780,395$ 2,013,206$ 2,185,569$
Program Revenues:Governmental activities:
Charges for services:Administration -$ -$ -$ -$ -$ 8,843$ 9,706$ Aeronautics 974 717 902 919 1,214 1,133 940 Highway - - - - - 2,953 1,451 Highway maintenance - - - 1,518 537 577 1,765 Motor Vehicle 104,298 107,395 108,346 113,506 121,179 132,274 127,900 Other 3,341 4,219 4,848 5,564 7,099 - - Local governmental assistance 4,111 5,080 4,129 4,760 4,040 12,239 8,263
Operating grants and contributions 56,481 34,160 44,008 58,948 67,241 72,679 79,747 Capital grants and contributions 470,772 453,758 418,174 484,276 387,614 354,024 523,728
Total governmental activities program revenues 639,977 605,330 580,407 669,491 588,924 584,722 753,500
(Thousands of Dollars)
Arizona Department of TransportationChange in Net Assets
for fiscal year ended June 30

Business-type activities:Charges for services: Arizona Highways Magazine 9,614 9,596 9,271 8,443 8,012 8,060 7,624 Highway Expansion and Extension Loan Program 2,227 3,881 3,529 3,009 3,281 2,909 1,755
Total business-type activities program revenues 11,841 13,477 12,800 11,452 11,293 10,969 9,379 Total primary governmental program revenues 651,818$ 618,807$ 593,207$ 680,943$ 600,217$ 595,691$ 762,879$
Net <expenses>/revenues:Governmental activities <925,084>$ <1,226,485>$ <1,417,129>$ <1,391,880>$ <1,179,023>$ <1,416,057>$ <1,420,304>$ Business-type activities <4,134> <23,989> <1,621> <3,178> <1,155> <1,458> <2,386>
Total primary government net expense <929,218>$ <1,250,474>$ <1,418,750>$ <1,395,058>$ <1,180,178>$ <1,417,515>$ <1,422,690>$
General Revenues and Other Changes in Net Assets:Governmental activities:
Transportation excise taxes 267,563$ 268,721$ 288,600$ 316,806$ 316,491$ 262,264$ 253,742$ Vehicle, registration, title, license, and related taxes 899,092 832,492 914,657 966,885 994,052 1,029,001 1,033,505 Fuel and motor carrier taxes and fees 547,129 691,003 698,406 759,633 770,596 790,909 766,394 Flight property taxes 6,528 6,026 6,321 13,180 13,686 15,303 13,822 Interest on investments 29,863 19,803 8,352 19,245 28,538 55,760 59,528 71 Other 26,484 21,304 24,775 27,120 11,026 9,998 38,772
Governmental activities before accounting change 1,776,659 1,839,349 1,941,111 2,102,869 2,134,389 2,163,235 2,165,763 Cumulative effect of accounting change - 40,399 - - - - -
Special Item - State appropriation for Statewide TransportationAcceleration Needs (STAN) - - - - - 245,000 - Total governmental activities 1,776,659 1,879,748 1,941,111 2,102,869 2,134,389 2,408,235 2,165,763
Business-type activities:Interest on investments 5,625 2,440 1,588 2,764 3,518 5,563 4,788 Other 381 425 505 380 - <3> <17>
Total business-type activities 6,006 2,866 2,093 3,144 3,518 5,560 4,771 Total primary government 1,782,665$ 1,882,614$ 1,943,204$ 2,106,013$ 2,137,907$ 2,413,795$ 2,170,534$
Change in Net Assets:Governmental activities 851,575$ 653,263$ 523,982$ 710,989$ 955,366$ 992,178$ 745,459$ Business-type activities 1,872 <21,124> 472 <34> 2,363 4,102 2,385
Total primary government 853,447$ 632,140$ 524,454$ 710,955$ 957,729$ 996,280$ 747,844$
NOTE: 1Adjustments were made to Highway and Non-capital, including asset preservation, for the years 2004 - 2007 to conform to the current year's presentation.

Table 2
Fiscal Year
Invested in Capital Assets, Net of Related
Debt Restricted Unrestricted Total
Invested in Capital Assets, Net of Related
Debt Restricted Unrestricted Total
Invested in Capital Assets, Net of Related
Debt Restricted Unrestricted Total
2008 13,285,438$ 704,929$ 209,650$ 14,200,017$ 173$ 74,115$ 132$ 74,420$ 13,285,611$ 779,044$ 209,782$ 14,274,437$ 2007 12,211,861 1,006,512 236,186 13,454,559 225 71,708 102 72,035 12,212,086 1,078,220 236,288 13,526,594 2006 11,806,376 466,337 189,669 12,462,382 249 67,713 <30> 67,932 11,806,625 534,050 189,639 12,530,314 2005 10,780,474 491,995 234,548 11,507,017 499 65,273 <204> 65,568 10,780,973 557,268 234,344 11,572,585 2004 10,179,585 408,410 208,032 10,796,027 810 63,900 892 65,602 10,180,395 472,310 208,924 10,861,629 2003 9,621,204 439,045 211,796 10,272,045 1,126 63,225 780 65,131 9,622,330 502,270 212,576 10,337,176 2002 8,998,742 400,315 219,726 9,618,783 1,439 83,293 1,522 86,254 9,000,181 483,608 221,248 9,705,037
72
Governmental Activities Business-type Activities Primary Government
Arizona Department of TransportationNet Assets by Component
for fiscal year ended June 30(Thousands of Dollars)
Primary Government Net Assets By Type
$0
$2,000,000
$4,000,000
$6,000,000
$8,000,000
$10,000,000
$12,000,000
$14,000,000
$16,000,000
2002 2003 2004 2005 2006 2007 2008Fiscal Year
Thou
sand
s of D
olla
rs
Unrestricted
Restricted
Invested in CapitalAssets, net of relateddebt

Table 3
2002 2003 2004 2005 2006 2007 2008Revenues:Transportation excise taxes 267,563$ 268,721$ 288,600$ 316,806$ 316,491$ 262,264$ 253,742$ Vehicle registration, title, license, and related taxes and fees 1,003,499 940,022 1,023,004 1,080,391 1,207,265 1,159,379 1,159,474 Fuel and motor carrier taxes and fees 547,129 690,869 698,406 759,633 770,596 792,717 768,046 Reimbursement of construction expenditures - federal aid 516,647 459,458 421,220 503,646 407,891 334,376 494,584 Other federal grants and reimbursements 5,389 6,896 6,146 9,078 32,044 72,548 79,747 Reimbursements from Arizona counties and cities 12,346 24,818 38,012 32,186 13,566 34,971 38,609 Distributions from other state agencies 318 1,284 933 2,349 1,490 1,799 463 Interest on loans receivable 1,899 2,486 1,880 945 739 928 697 Interest on investments 29,697 19,702 8,333 19,162 28,351 55,393 59,197 Flight property taxes 6,528 6,026 6,321 13,180 13,686 15,303 13,822 Grand Canyon National Park Airport 941 717 902 919 1,214 1,133 940 Rental income - 1,632 1,635 1,596 1,702 1,434 1,367 Other 25,037 6,021 5,161 6,216 6,490 7,088 6,206
Total revenues 2,416,993 2,428,652 2,500,553 2,746,107 2,801,525 2,739,333 2,876,894 Expenditures:
Current:Transportation:
Administration 56,230 51,485 56,484 40,599 43,372 44,875 44,322 Aeronautics 3,491 74,244 7,228 9,517 10,470 3,876 4,089 Highway 68,369 94,978 130,117 159,408 161,496 184,240 171,134 Highway maintenance 89,314 81,517 95,144 105,887 111,378 118,940 135,629 Motor Vehicle 81,012 3,579 84,921 90,208 95,198 103,801 110,982 Other 2,369 2,304 2,940 1,802 2,309 - -
Total Transportation 300,785 308,107 376,834 407,421 424,223 455,732 466,156
Transportation not appropriated by State legislature: 7,480 9,594 - - - - - Intergovernmental:
Distributions to Arizona counties and cities 1,038,314 957,057 1,022,768 1,086,955 1,190,962 1,217,883 1,241,110 Distributions to other state agencies 28,880 189,784 160,029 306,852 206,903 114,795 173,405
Debt service:Principal 208,820 248,055 284,815 302,202 173,745 100,395 192,663 Interest 85,387 84,928 92,371 94,344 83,017 90,836 102,583 Bond issuance costs 1,049 2,424 2,546 1,996 1,252 1,592 3,447
Non-capital, including asset preservation 89,147 146,168 333,929 156,678 250,736 63,273 158,991 Capital outlay 1,009,290 833,731 599,819 623,829 663,316 741,506 989,882
Total expenditures 2,769,152 2,779,848 2,873,111 2,980,277 2,994,154 2,786,012 3,328,237 Excess <deficiency> of revenues over <under>expenditures <352,159> <351,196> <372,558> <234,170> <192,629> <46,679> <451,343>
Other financing sources <uses>:Transfers in 300,563 383,136 449,100 388,046 262,216 225,499 303,513 Transfers out for debt service <291,854> <321,327> <374,852> <374,162> <251,891> <186,856> <231,563> Transfers out other <8,709> <61,809> <74,249> <13,885> <10,325> <38,643> <71,950> Capital leases - - - - - 2,129 - Sale of capital assets - 7,229 16,023 18,392 11,118 10,162 28,233 Insurance recovery - 1,082 1,407 1,518 537 577 1,765 Debt issuance 142,000 331,475 319,942 292,645 118,250 325,000 711,479 Debt issuance - refunding bond 74,250 90,530 130,573 - 147,400 - - Premium from debt issuance 10,142 28,147 31,647 24,726 22,407 26,201 31,862 Payment to refunded bond escrow agent <77,135> <107,735> <145,965> - <161,726> - -
Total other financing sources<uses> 149,257 350,728 353,626 337,280 137,986 364,069 773,339
Net change in fund balances before accounting change <202,902> <468> <18,932> 103,110 <54,643> 317,390 321,996 Cumulative effect of accounting change for year 2003 - 40,399 - - - - - Special item - State appropriation for Statewide
Transportation Acceleration Needs (STAN) - - - - - 245,000 - Net change in fund balances <202,902> 39,931 <18,932> 103,110 <54,643> 562,390 321,996
Fund balances - July 1 615,856 421,954 452,884 433,952 537,062 482,419 1,044,809 Fund balances - June 30 412,954$ 461,885$ 433,952$ 537,062$ 482,419$ 1,044,809$ 1,366,805$
Debt service as a percentage of non-capital expenditures 16.8% 17.2% 16.7% 16.9% 11.1% 9.4% 12.8%Debt service as a percentage of total revenues 12.2% 13.8% 15.2% 14.5% 9.2% 7.0% 10.4%
Arizona Department of TransportationStatement of Revenues, Expenditures, and Changes in Fund Balances
for fiscal year ended June 30(Thousands of Dollars)
73

Table 4
2002 2003 2004 2005 2006 2007 2008
General Fund (State Highway Fund): Reserved 121,075$ 134,938$ 155,755$ 166,420$ 172,784$ 507,723$ 505,691$ Unreserved 67,253 48,696 48,619 57,123 9,342 <10,032> 57,899 Total General Fund 188,328$ 183,634$ 204,374$ 223,543$ 182,126$ 497,691$ 563,590$
All other governmental funds Reserved: Debt service 24,986$ 20,786$ 18,592$ 2,288$ 2,159$ 2,688$ 3,212$ Capital projects 176,245 232,079 190,640 277,884 258,236 495,428 774,644 Unreserved, reported in: Non-major special revenue funds 23,395 16,386 20,346 33,348 39,898 49,002 25,359
74 Total all other governmental funds 224,626$ 269,251$ 229,578$ 313,520$ 300,293$ 547,118$ 803,215$
Total general and other governmental funds 412,954$ 452,885$ 433,952$ 537,063$ 482,419$ 1,044,809$ 1,366,805$
Arizona Department of TransportationFund Balances of Governmental Funds
for fiscal year ended June 30(Thousands of Dollars)
Fund Balances of Governmental Funds
$0
$200,000
$400,000
$600,000
$800,000
$1,000,000
$1,200,000
$1,400,000
$1,600,000
2002 2003 2004 2005 2006 2007 2008
Fiscal Year
Thou
sand
s of D
olla
rs
UnreservedReserved

Table 5Arizona Department of Transportation
Expenditures of Federal Awards1
for the fiscal year ended June 30 (Thousands of Dollars)
FiscalYear FAA FRA FTA NHTSA FHWA FMCSA BLM BIA Sub-total FHWA Total
2008 715$ -$ 15,530$ 106$ 523,810$ 2,642$ 57$ -$ 542,860$ 31,472$ 574,332$ 2007 610 - 10,169 101 353,192 1,769 544 <21> 366,364 40,559 406,923 2006 4,338 - 8,837 69 389,575 2,231 162 - 405,212 33,268 438,480 2005 4,203 - 8,466 96 456,924 282 152 278 470,401 42,323 512,724 2004 480 - 5,549 84 384,416 434 79 - 391,042 36,324 427,366 2003 242 - 6,618 87 433,472 466 30 - 440,915 25,439 466,354 2002 - 3 5,264 83 496,509 282 47 - 502,188 19,848 522,036 2001 - 14 4,746 65 390,204 - - - 395,029 33,261 428,290 2000 6 2 3,717 65 393,958 - - 1,048 398,796 15,219 414,015 1999 6,278 69 5,107 275 371,013 - - 974 383,716 17,748 401,464
SOURCE: Single Audit Reports - fiscal years 1999 through 2008
NOTES: 1 Federal Aviation Administration (FAA); Federal Railroad Administration (FRA);Federal Transit Administration (FTA) - previously Urban Mass Transit Administration(UMTA); National Highway Transportation Safety Administration (NHTSA); FederalHighway Administration (FHWA); Federal Motor Carrier Safety Administration (FMCSA);Bureau of Land Management (BLM); and Bureau of Indian Affairs (BIA)
Total Expenditures of Federal Awards
$0
$100,000
$200,000
$300,000
$400,000
$500,000
$600,000
1999 2000 2001 2002 2003 2004 2005 2006 2007 2008
Fiscal Year
Thou
sand
of D
olla
rs
75

Table 6
Fiscal Year Administration Aeronautics Highway
Highway
Maintenance1Motor
Vehicle
Distributions to Arizona
Counties, Cities and Other State
Agencies
Local Governmental
Assistance
Interest on Long-Term
Debt Other
Arizona Highways Magazine
Highway Expansion
and Extension
Loan Program Total
2008 54,918$ 4,373$ 132,874$ 324,104$ 112,880$ 1,415,075$ 37,285$ 92,295$ -$ 7,712$ 4,053$ 2,185,569$ 2007 51,667 5,418 138,788 233,732 105,961 1,334,003 48,760 82,450 - 8,072 4,355 2,013,206 2006 45,002 10,705 118,147 60,138 96,937 1,394,609 36,771 88,278 9,394 8,175 4,273 1,872,429 2005 42,298 9,804 125,889 261,714 91,676 1,393,808 42,440 86,870 6,871 10,270 4,360 2,076,000 2004 57,703 7,512 93,656 429,571 86,845 1,183,797 39,205 89,431 9,815 10,007 4,414 2,011,956 2003 52,533 3,848 45,644 374,328 83,090 1,149,593 30,235 84,084 8,460 11,118 26,349 1,869,282 2002 57,864 3,751 46,543 188,198 82,904 1,064,560 24,791 89,605 6,844 10,711 5,265 1,581,036
NOTE: 1 Includes Non-capital, including asset preservation
76
(Thousands of Dollars)
Arizona Department of TransportationGovernment-wide Expenses by Function
for the fiscal year ended June 30
Government-wide Expenses by Function
$0
$500,000
$1,000,000
$1,500,000
$2,000,000
$2,500,000
2002 2003 2004 2005 2006 2007 2008
Fiscal Year
Thou
sand
s of D
olla
rs
Total Expenses

Table 7
TotalBusiness-Type
Fiscal Year
Charges for Services
Operating Grants and
Contributions
Capital Grants and
ContributionsCharges for
Services TaxesOther
RevenuesInterest on
InvestmentsOther
RevenuesInterest on
InvestmentsGovernment-wide
Revenues
2008 150,024$ 79,747$ 523,728$ 9,379$ 2,067,464$ 38,772$ 59,528$ <18>$ 4,788$ 2,933,412$ 2007 158,019 72,679 354,024 10,969 2,097,476 9,998 55,760 <3> 5,563 2,764,485 2006 134,068 67,241 387,614 11,293 2,186,859 11,026 28,538 - 3,518 2,830,157 2005 126,267 58,948 484,276 11,452 2,056,503 27,120 19,245 380 2,764 2,786,956 2004 118,225 44,008 418,174 12,800 1,907,984 24,775 8,352 505 1,588 2,536,411 2003 117,412 34,160 453,758 13,477 1,798,243 21,304 19,803 425 2,440 2,461,022 2002 112,724 56,481 470,772 11,841 1,720,313 26,484 29,863 381 5,625 2,434,484 77
GovernmentalProgram Revenues
Arizona Department of TransportationGovernment-wide Revenues
for the fiscal year ended June 30
Business-TypeGovernmentalGeneral Revenues
(Thousands of Dollars)
Government-wide Revenues
$0
$500,000
$1,000,000
$1,500,000
$2,000,000
$2,500,000
$3,000,000
$3,500,000
2002 2003 2004 2005 2006 2007 2008
Fiscal Year
Thou
sand
s of D
olla
rs
Total Revenues
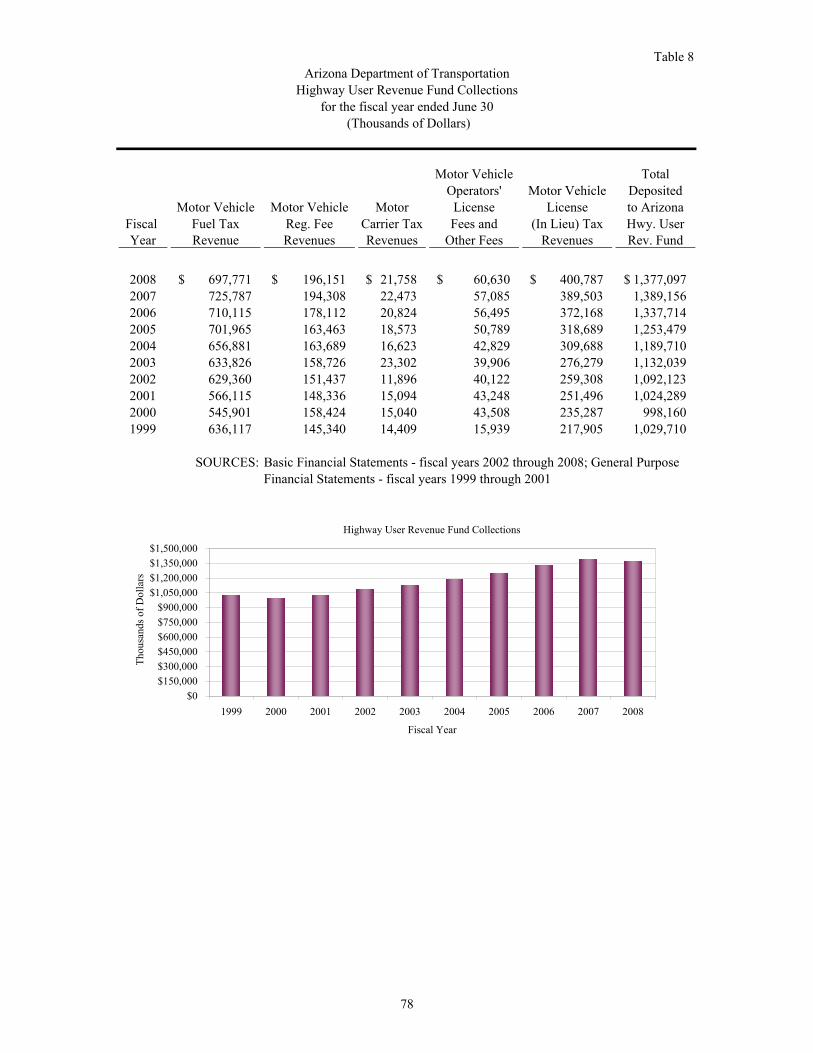
Table 8Arizona Department of Transportation
Highway User Revenue Fund Collectionsfor the fiscal year ended June 30
(Thousands of Dollars)
Motor Vehicle TotalOperators' Motor Vehicle Deposited
Motor Vehicle Motor Vehicle Motor License License to ArizonaFiscal Fuel Tax Reg. Fee Carrier Tax Fees and (In Lieu) Tax Hwy. UserYear Revenue Revenues Revenues Other Fees Revenues Rev. Fund
2008 697,771$ 196,151$ 21,758$ 60,630$ 400,787$ 1,377,097$ 2007 725,787 194,308 22,473 57,085 389,503 1,389,156 2006 710,115 178,112 20,824 56,495 372,168 1,337,714 2005 701,965 163,463 18,573 50,789 318,689 1,253,479 2004 656,881 163,689 16,623 42,829 309,688 1,189,710 2003 633,826 158,726 23,302 39,906 276,279 1,132,039 2002 629,360 151,437 11,896 40,122 259,308 1,092,123 2001 566,115 148,336 15,094 43,248 251,496 1,024,289 2000 545,901 158,424 15,040 43,508 235,287 998,160 1999 636,117 145,340 14,409 15,939 217,905 1,029,710
SOURCES: Basic Financial Statements - fiscal years 2002 through 2008; General PurposeFinancial Statements - fiscal years 1999 through 2001
Highway User Revenue Fund Collections
$0$150,000$300,000$450,000$600,000$750,000$900,000
$1,050,000$1,200,000$1,350,000$1,500,000
1999 2000 2001 2002 2003 2004 2005 2006 2007 2008
Fiscal Year
Thou
sand
s of D
olla
rs
78

Table 9Arizona Department of Transportation
Highway User Revenue Fund Distributionsfor the fiscal year ended June 30
(Thousands of Dollars)
State Department EconomicFiscal Highway Cities and of Public Strength
Year Fund Towns Counties Safety Project Fund Other1Total
2008 680,530$ 415,556$ 258,871$ 10,000$ 1,000$ 11,140$ 1,377,097$ 2007 688,451 417,541 260,107 10,000 1,000 12,057 1,389,156 2006 636,094 385,759 240,309 63,999 1,000 10,553 1,337,714 2005 483,047 362,965 226,110 52,216 1,000 128,141 1,253,479 2004 570,801 344,699 214,731 48,698 1,000 9,781 1,189,710 2003 537,668 324,431 202,105 54,416 1,000 12,419 1,132,039 2002 519,837 312,252 195,530 37,066 1,000 26,438 1,092,123 2001 503,611 305,009 188,982 10,937 1,000 14,750 1,024,289 2000 493,697 323,798 157,594 13,622 1,000 8,449 998,160 1999 512,149 295,879 199,591 12,630 1,000 8,461 1,029,710
The Highway User Revenue Fund receives certain Motor Vehicle Division revenuesfrom the Motor Vehicle Division Clearing Fund. These monies are distributed to theState Highway Fund and various counties and cities, based on statutory formulas.
SOURCES: Basic Financial Statements - fiscal years 2002 through 2008; General PurposeFinancial Statements - fiscal years 1999 through 2001
NOTE: 1 In fiscal years 1999 through 2008, an appropriation for Arizona State Parksis included. Fiscal years 2002 and 2005 include distributions to State General Fund.
79

Table 10
Fiscal Effective Gasoline Use Fuel
Year Date Tax Tax 1
2008 - 0.18$ 0.26$ 2007 - 0.18 0.26 2006 - 0.18 0.26 2005 - 0.18 0.26 2004 - 0.18 0.26 2003 - 0.18 0.26 2002 - 0.18 0.26 2001 07/01/2000 0.18 0.26 2000 - 0.18 0.27 1999 - 0.18 0.27
SOURCE: Arizona Revised Statutes §28-5606
NOTE: Gasohol is currently taxed at the same rate as gasoline and use fuel.Use fuel is primarily diesel.
1 Lightweight motor vehicles under 26,000 pounds pay $.18 pergallon.
Arizona Department of TransportationFuel Tax Rates
for the fiscal year ended June 30(Cents per Gallon)
80

Table 11
Fiscal YearGallons from Top
Ten SuppliersRevenue from Top
Ten Suppliers All Motor Vehicle Fuel Tax Revenue
Revenue Percentage from Top Ten
Suppliers
2008 1,883,959 339,113$ 697,771$ 48.6%2007 1,915,247 344,744 725,787 47.5%2006 1,679,379 302,288 710,115 42.6%2005 1,691,572 304,483 701,965 43.4%2004 1,848,459 332,723 656,881 50.7%2003 1,884,644 339,236 633,826 53.5%2002 1,788,066 321,852 629,360 51.1%
SOURCE: Highway User Revenue Fund distribution schedule, based on gallonage data reported by fuel suppliers
(Thousands)
Arizona Department of TransportationMotor Vehicle Fuel Tax - Top Ten Suppliers
for fiscal year ended June 30
$0
$100,000
$200,000
$300,000
$400,000
$500,000
$600,000
$700,000
$800,000
Thou
sand
s of D
olla
rs
2002 2003 2004 2005 2006 2007 2008
Fiscal Year
Motor Vehicle Fuel Tax Sources
All Fuel Tax Revenue Top Ten Suppliers
81

Range - in Millions of
Gallons
Suppliers within Range
Percentage of Total Gallons
Sold
Suppliers within Range
Percentage of Total Gallons
Sold
Suppliers within Range
Percentage of Total Gallons
Sold
Suppliers within Range
Percentage of Total Gallons
Sold
< 25 8 5.6% 11 8.4% 8 6.1% 7 5.5%26 - 50 6 8.3% 4 5.5% 6 9.4% 5 6.9%51 - 100 3 8.7% 2 4.6% 2 4.5% 6 14.1%101 - 200 3 14.8% 3 18.0% 5 29.3% 2 11.9%201 - 300 3 32.1% 3 30.7% 3 29.6% 4 39.4%> 300 2 24.4% 2 24.8% 1 13.2% 1 11.8%
25 93.8% 25 92.1% 25 92.1% 25 89.6%
2,479,233 2,501,654 2,554,032 2,631,239
87.0% 84.9% 79.7% 81.0%
369,033 445,453 652,439 616,165
13.0% 15.1% 20.3% 19.0%
Arizona Department of TransportationGasoline Volume Sold - Top Twenty-Five Suppliers
for fiscal year ended June 30
Total Gallons of Gasoline
Gasoline % of Total
Total Gallons of Use Fuel
Diesel % of Total
2000 2001 2002 2003
82
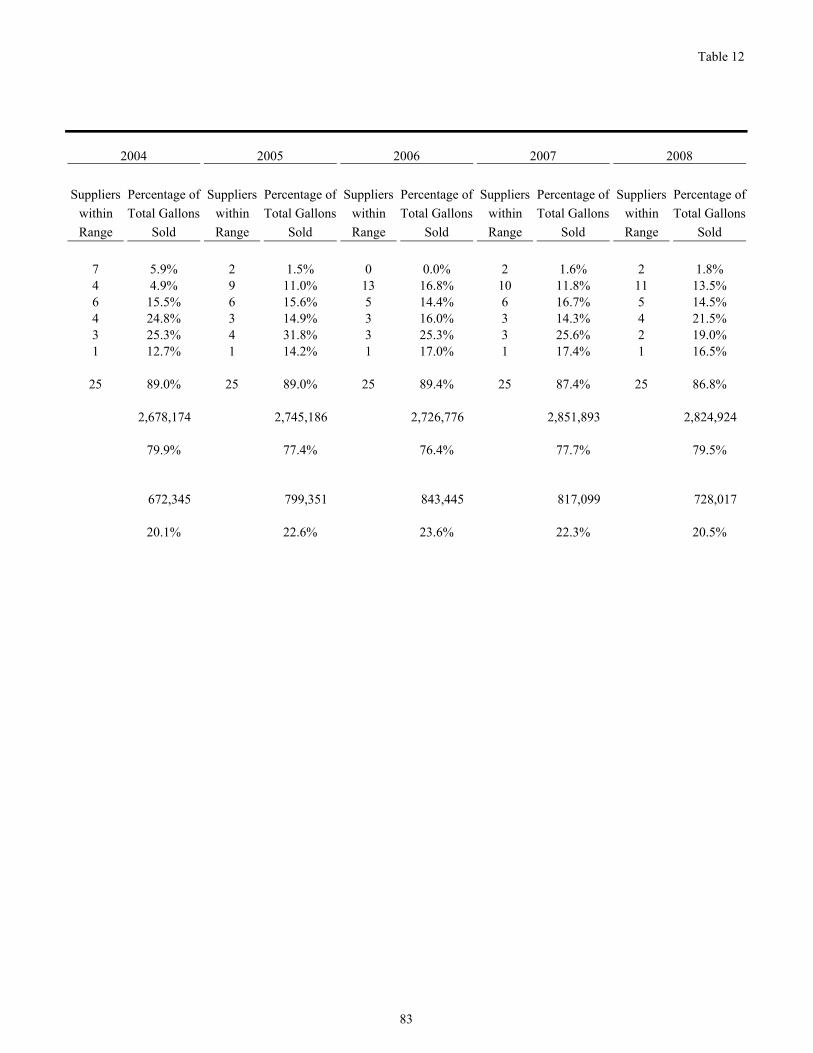
Table 12
Suppliers within Range
Percentage of Total Gallons
Sold
Suppliers within Range
Percentage of Total Gallons
Sold
Suppliers within Range
Percentage of Total Gallons
Sold
Suppliers within Range
Percentage of Total Gallons
Sold
Suppliers within Range
Percentage of Total Gallons
Sold
7 5.9% 2 1.5% 0 0.0% 2 1.6% 2 1.8%4 4.9% 9 11.0% 13 16.8% 10 11.8% 11 13.5%6 15.5% 6 15.6% 5 14.4% 6 16.7% 5 14.5%4 24.8% 3 14.9% 3 16.0% 3 14.3% 4 21.5%3 25.3% 4 31.8% 3 25.3% 3 25.6% 2 19.0%1 12.7% 1 14.2% 1 17.0% 1 17.4% 1 16.5%
25 89.0% 25 89.0% 25 89.4% 25 87.4% 25 86.8%
2,678,174 2,745,186 2,726,776 2,851,893 2,824,924
79.9% 77.4% 76.4% 77.7% 79.5%
672,345 799,351 843,445 817,099 728,017
20.1% 22.6% 23.6% 22.3% 20.5%
2008200720062004 2005
83

Table 13Arizona Department of Transportation
Highway User Revenue FundLegal Debt Margin
for the fiscal year ended June 30 (Thousands of Dollars)
Fiscal Year Debt Limit1
Total Principal Applicable to Limit
Legal Debt Margin
Total Principal Applicable to the Limit as a
Percentage of Debt Limit
2008 N/A 2 1,623,905$ N/A N/A2007 N/A 1,490,600 N/A N/A2006 1,300,000$ 1,223,425 76,575$ 94.11%2005 1,300,000 1,161,355 138,645 89.34%2004 1,300,000 1,017,360 282,640 78.26%2003 1,300,000 932,700 367,300 71.75%2002 1,000,000 734,155 265,845 73.42%2001 800,000 700,280 99,720 87.54%2000 800,000 608,500 191,500 76.06%1999 800,000 524,345 275,655 65.54%
NOTES: 1 The statutory limitation on the issuance of bonds, as outlined inARS §28-7510, applies only to the Highway User Revenue Fund (HURF).The only limitation on Maricopa County Regional Area Road Fund (RARF)and Grant Anticipation Notes (GANS) is the ability to secure the debtswith available excise tax monies and available grant revenues, respectively.2 As stated in House Bill 2206 of the Second Regular Session of the Forty-seventh Legislature, the $1.3 billion debt limit is eliminated from ARS §28-7510.The general effective date of this change was September 21, 2006.
84

Table 14Arizona Department of Transportation
Highway Revenue BondsBond Coverage
for the fiscal year ended June 30 (Thousands of Dollars)
Fiscal PledgedYear Principal Interest Total Revenues1,2
Coverage
2008 60,645$ 75,538$ 136,183$ 658,616$ 4.82007 57,825 73,785 131,610 635,140 4.82006 54,830 62,222 117,052 624,408 5.32005 44,265 60,459 104,724 461,763 4.42004 51,155 53,149 104,304 557,854 5.32003 44,490 41,932 86,422 540,540 6.32002 45,365 38,534 83,899 523,326 6.22001 52,055 36,581 88,636 513,890 5.82000 46,270 33,994 80,264 528,721 6.61999 43,805 31,090 74,895 509,935 6.8
SOURCES: Highway User Revenue Fund Schedule fiscal years 1999 through 2008;Debt Service Funds - fiscal years 1999 through 2008
NOTES: 1 Includes vehicle license tax revenues distributed directly to the StateHighway Fund. Fiscal year 2005 is net of a $118 million distribution tothe State General Fund.2 The Highway Revenue Bonds are secured by a prior lien on and pledgeof motor vehicle and related fuel fees and taxes.
85

86
Table 15Arizona Department of Transportation
Transportation Excise Tax Revenue BondsBond Coverage
for the fiscal year ended June 30 (Thousands of Dollars)
Fiscal Pledged
Year Principal Interest Total Revenues1Coverage
2008 19,045$ 10,673$ 29,718$ 253,742$ 8.52007 - - - 262,264 N/A2006 80,375 1,566 81,941 316,491 3.92005 208,625 14,318 222,943 316,806 1.42004 199,400 23,553 222,953 288,600 1.32003 190,415 31,533 221,948 268,721 1.22002 163,455 35,445 198,900 267,563 1.32001 156,865 40,035 196,900 264,722 1.32000 128,805 42,609 171,414 248,596 1.51999 106,765 43,251 150,016 229,470 1.5
SOURCE: Maricopa County Regional Area Road Fund Report
NOTE: Bond coverage ratio is based upon total Maricopa County TransportationExcise Tax collections.1 The Transportation Excise Tax Revenue Bonds are secured by transportationexcise taxes collected by the Department of Revenue on behalf of Maricopa County.
Transportation Excise Tax Revenue Bonds - Bond Coverage
$0
$50,000
$100,000
$150,000
$200,000
$250,000
$300,000
$350,000
1999 2000 2001 2002 2003 2004 2005 2006 2007 2008
Fiscal Year
Thou
sand
s of
Dol
lars
REVENUE DEBT SERVICE
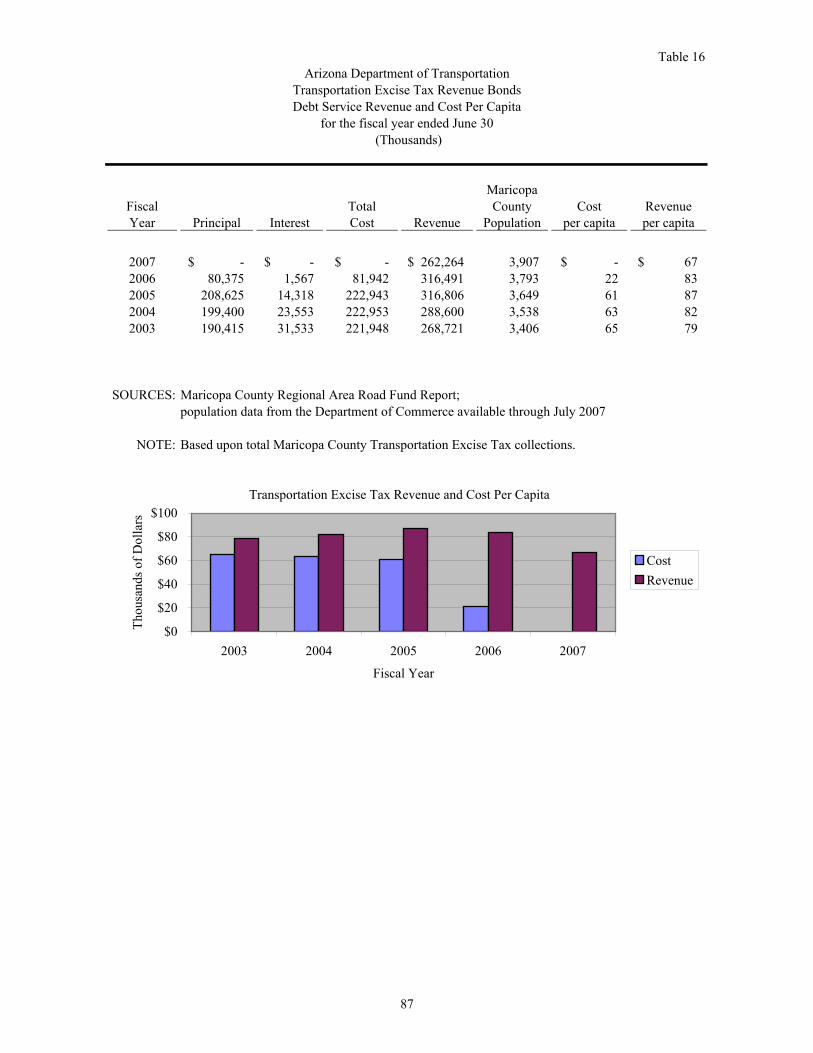
Table 16
MaricopaFiscal Total County Cost RevenueYear Principal Interest Cost Revenue Population per capita per capita
2007 -$ -$ -$ 262,264$ 3,907 -$ 67$ 2006 80,375 1,567 81,942 316,491 3,793 22 83 2005 208,625 14,318 222,943 316,806 3,649 61 87 2004 199,400 23,553 222,953 288,600 3,538 63 82 2003 190,415 31,533 221,948 268,721 3,406 65 79
SOURCES: Maricopa County Regional Area Road Fund Report;population data from the Department of Commerce available through July 2007
NOTE: Based upon total Maricopa County Transportation Excise Tax collections.
(Thousands)
Arizona Department of Transportation
Debt Service Revenue and Cost Per CapitaTransportation Excise Tax Revenue Bonds
for the fiscal year ended June 30
Transportation Excise Tax Revenue and Cost Per Capita
$0
$20
$40
$60
$80
$100
2003 2004 2005 2006 2007
Fiscal Year
Thou
sand
s of D
olla
rs
CostRevenue
87

Table 17
Change in NumberFiscal of Registered Arizona Change in
Year Total Vehicles Vehicles Population 1 Population
2007 6,609 290 6,339 1732006 6,318 373 6,166 2142005 5,945 306 5,952 2082004 5,639 327 5,744 1652003 5,312 193 5,579 1342002 5,118 479 5,445 144
SOURCE: Vehicle registrations from Motor Vehicle Division's annual reports
NOTE: 1 The Arizona population data are midyear population estimates of theU.S. Bureau of the Census. Years 2002 through 2006 have been revised to reflect revisions made by the U.S. Bureau of the Census.
for fiscal year ended June 30(Thousands)
Arizona Department of TransportationNumber of Vehicle Registrations Per Year
Change in Vehicles Registered Compared to Population Change
0
100,000
200,000
300,000
400,000
500,000
600,000
2002 2003 2004 2005 2006 2007
Fiscal Year
Cha
nge
Vehicles Population
88

Table 18
Fiscal YearVehicle
Registrations Percentage Change Fuel Sales 1 Percentage Change
2008 6,734 1.9% 3,707,315 <0.8%>2007 6,609 4.6% 3,737,123 2.7%2006 6,318 6.3% 3,636,195 2.8%2005 5,945 5.4% 3,542,631 3.3%2004 5,639 6.2% 3,429,136 2.7%2003 5,312 3.8% 3,339,089 2.9%2002 5,118 10.3% 3,245,274 2.8%
SOURCES: Vehicle registrations from Motor Vehicle Division's annual reports;fuel sales from Motor Vehicle Division data reported by fuel suppliers
NOTE: 1 Fuel sales include both gasoline and use fuel (primarily diesel) sales.
Arizona Department of TransportationVehicle Registrations Per Year Compared to Fuel Sales
for fiscal year ended June 30(Thousands)
Percentage Change in Vehicle Registrations Compared to Fuel Sales
-2.0%
0.0%
2.0%
4.0%
6.0%
8.0%
10.0%
12.0%
2002 2003 2004 2005 2006 2007 2008Fiscal Year
Perc
enta
ge C
hang
e
Vehicle Registrations Fuel Sales
89

Table 19
Calendar Personal Per CapitaYear Ended Income 2 Personal Unemployment
December 31 Population 1 (in thousands) Income 3 Rate 4
2007 6,338,755 208,544,895$ 32,900$ 3.8%2006 6,165,689 199,480,082 32,353 4.1%2005 5,952,083 182,564,435 30,672 4.7%2004 5,744,367 164,922,611 28,710 4.9%2003 5,579,307 150,582,313 26,989 5.7%2002 5,444,881 144,150,287 26,474 6.0%2001 5,301,097 138,853,800 26,193 4.7%2000 5,167,260 132,557,859 25,653 4.0%1999 5,023,823 120,857,125 24,057 4.5%1998 4,883,342 113,370,224 23,216 4.3%
SOURCES: U.S. Bureau of Economic Analysis (for population, personalincome, and per capita personal income figures); U.S. Bureau of the Census (also for population); Arizona Department ofEconomic Security's website, www.workforce.az.gov (forunemployment rates)
NOTES: 1 The Arizona population data are midyear population estimatesof the U.S. Bureau of the Census. Years 2000 through 2006 have been revised to reflect revisions made by the U.S. Bureau of theCensus.2 Personal income estimates for years 2004 through 2006 wererevised to reflect revisions made by the U.S. Bureau of theCensus.3 Per capita personal income is total personal income divided bytotal midyear population estimates of the U.S. Bureau of theCensus. Years 2000 through 2006 have been revised to reflectrevisions in personal income and population estimates.4 The unemployment rate for the year 2005 was revised to reflecta revision made by the Arizona Department of Economic Security website, www.workforce.az.gov.
Arizona Department of Transportation Demographic and Economic Statistics
for the Last Ten Calendar Years
90
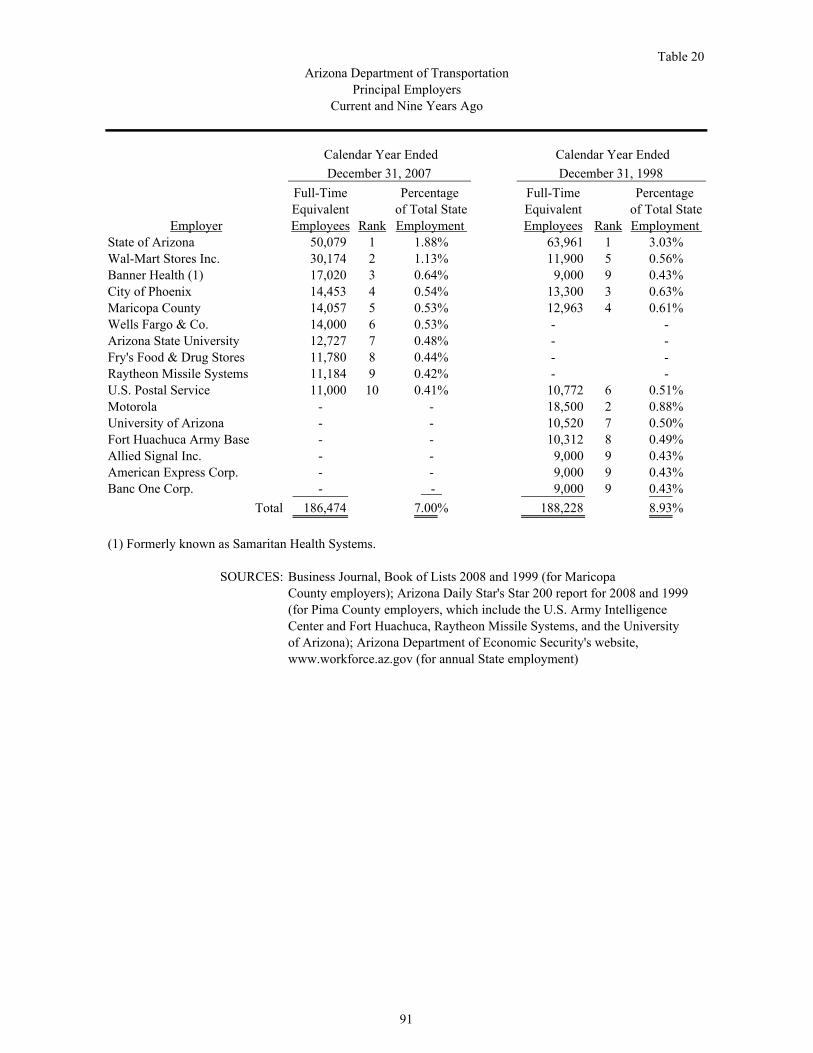
Table 20
Full-Time Percentage Full-Time Percentage Equivalent of Total State Equivalent of Total State
Employer Employees Rank Employment Employees Rank Employment State of Arizona 50,079 1 1.88% 63,961 1 3.03%Wal-Mart Stores Inc. 30,174 2 1.13% 11,900 5 0.56%Banner Health (1) 17,020 3 0.64% 9,000 9 0.43%City of Phoenix 14,453 4 0.54% 13,300 3 0.63%Maricopa County 14,057 5 0.53% 12,963 4 0.61%Wells Fargo & Co. 14,000 6 0.53% - -Arizona State University 12,727 7 0.48% - -Fry's Food & Drug Stores 11,780 8 0.44% - -Raytheon Missile Systems 11,184 9 0.42% - -U.S. Postal Service 11,000 10 0.41% 10,772 6 0.51%Motorola - - 18,500 2 0.88%University of Arizona - - 10,520 7 0.50%Fort Huachuca Army Base - - 10,312 8 0.49%Allied Signal Inc. - - 9,000 9 0.43%American Express Corp. - - 9,000 9 0.43%Banc One Corp. - - 9,000 9 0.43%
Total 186,474 7.00% 188,228 8.93%
(1) Formerly known as Samaritan Health Systems.
SOURCES: Business Journal, Book of Lists 2008 and 1999 (for MaricopaCounty employers); Arizona Daily Star's Star 200 report for 2008 and 1999(for Pima County employers, which include the U.S. Army IntelligenceCenter and Fort Huachuca, Raytheon Missile Systems, and the Universityof Arizona); Arizona Department of Economic Security's website,www.workforce.az.gov (for annual State employment)
Calendar Year EndedDecember 31, 1998
Calendar Year EndedDecember 31, 2007
Arizona Department of TransportationPrincipal Employers
Current and Nine Years Ago
91

Table 21
2002 2003 2004 2005 2006 2007 2008Operating:Administration-State Highway Fund 465.5 425.5 405.0 406.0 412.0 412.0 412.0 Administration-Air Quality Fund 1.5 1.5 - - - - - Highways Development and Administration 740.0 712.0 684.0 683.0 682.0 682.0 707.0 Construction Operating Budget - - 619.0 619.0 616.0 616.0 616.0 Maintenance-State Highway Fund 959.0 912.0 912.0 925.0 925.0 925.0 932.0 Maintenance-Safety Enforcement and Traffic Infrastructure 8.0 8.0 8.0 - - - - Transportation Planning 48.0 46.0 46.0 46.0 44.0 43.0 44.0 Public Transit-State General Fund 2.0 2.0 2.0 2.0 2.0 2.0 2.0 Public Transit-State Highway Fund - - - - - 1.0 - Equipment Services 247.0 247.0 247.0 247.0 247.0 247.0 247.0 Aeronautics 33.0 33.0 33.0 33.0 33.0 33.0 33.0 Motor Vehicle Division (MVD)
State Highway Fund 1,587.0 1,534.0 1,585.5 1,598.5 1,606.5 1,638.5 1,620.5 Safety Enforcement and Traffic Infrastructure Fund 29.0 29.0 29.0 31.0 22.0 - 22.0 Mandatory Insurance 16.0 16.0 16.0 17.0 29.0 50.0 28.0 Vehicle Inspections and Title Enforcement Fund 17.0 17.0 17.0 17.0 21.0 21.0 24.0 Air Quality Fund - - 1.5 1.5 1.5 1.5 1.5 Highway User Revenue Fund (HURF) - - - - 5.0 - - Driving Under the Influence Fund (DUI) - - - - 3.0 3.0 3.0 Third Party-Special Line Item - - - - - 16.0 18.0 Abandoned Vehicle - - - - - - 23.0 Fraud Investigation - - - - - - 11.0
Total Operating 4,153.0 3,983.0 4,605.0 4,626.0 4,649.0 4,691.0 4,744.0
Other Programs:Arizona Highways Magazine 72.0 72.0 72.0 72.0 72.0 60.0 28.0 Highway Construction 619.0 619.0 - - - - 7.0 Federal Fatality File (MVD from FY05) 2.0 2.0 2.0 2.0 2.0 2.0 - Motor Vehicle Division (Federal) NAFTA Border Projects - - - 21.0 19.0 16.0 -
- - - - - 11.0 - Motor Vehicle Division (Federal) Fuel Tax Evasion - - 2.0 5.0 8.0 8.0 - Public Transportation Division (Federal) 4.0 4.0 4.0 - 4.0 7.0 - Underground Storage-MVD 4.0 4.0 4.0 4.0 3.0 3.0 - Underground Storage-Transportation Services Group (TSG) - - - - 1.0 1.0 - Maricopa Regional Area Road Fund 1.0 1.0 1.0 1.0 1.0 1.0 17.0 Highway Expansion and Extension Loan Program (HELP) 3.0 3.0 3.0 3.0 3.0 3.0 -
Total Other Programs 705.0 705.0 88.0 108.0 113.0 112.0 52.0
Total All Programs 4,858.0 4,688.0 4,693.0 4,734.0 4,762.0 4,803.0 4,796.0
SOURCE: Arizona Department of Transportation 10-Year FTE History Report
NOTE: All FTE operating positions shown above are approved annually by the State legislature.
Motor Vehicle Division (Federal) NAFTA Grant Funding- International Registration Plan/International Fuel Tax Agreement
Arizona Department of TransportationAppropriated Full-Time Equivalents (FTEs)
for fiscal year ended June 30
92

Table 22Arizona Department of Transportation
Capital Assets Used in the Operation of Governmental FundsSchedule by Function and Activity1
June 30, 2008
Improvements Machinery ConstructionBuildings and other than Airport and in
Function and Activity Land Improvements Buildings Facilities Equipment Infrastructure Progress Total
Administration 879,017$ 20,392,810$ 1,117,827$ -$ 17,764,711$ -$ -$ 40,154,365$ Aeronautics - 411,037 401,058 7,150,274 1,355,942 12,789,265 - 22,107,576 Highway:
Administrative and other services 935,955 37,363,037 1,786,229 - 5,135,205 - - 45,220,426 Highway construction 2,332,738,545 6,852,067 384,415 - 7,103,032 10,088,618,671 2,607,927,197 15,043,623,927 Highway development 710,073 98,846 350 - 2,723,262 - - 3,532,531 Materials engineering - 4,849,537 7,077 - 3,812,358 - - 8,668,972 Traffic engineering - 356,896 21,667 - 1,275,464 - - 1,654,027 Transportation planning and research - 152,944 122,946 - 325,148 - - 601,038
Highway maintenance 4,907,328 41,747,196 8,984,545 - 8,099,553 - - 63,738,622 Motor Vehicle 11,641,168 46,506,238 3,571,783 - 7,936,099 - - 69,655,288
93 Total governmental funds capital assets 2,351,812,086$ 158,730,608$ 16,397,897$ 7,150,274$ 55,530,774$ 10,101,407,936$ 2,607,927,197$ 15,298,956,772$
NOTE: 1 This schedule presents only the capital asset balances related to governmental funds.Accordingly, the capital assets reported in the internal service fund are excluded from the above amounts. Generally, the capital assets of the internal service fund are included asgovernmental activities in the statement of net assets.

Table 23Arizona Department of Transportation
Capital Assets used in the Operation of Governmental FundsSchedule of Changes by Function and Activity1
for the fiscal year ended June 30, 2008
Governmental GovernmentalFunds Capital Funds Capital
Assets AssetsFunction and Activity July 1, 2007 Additions Deductions June 30, 2008
Administration 36,864,591$ 5,083,965$ <1,794,191>$ 40,154,365$ Aeronautics 21,222,010 885,566 - 22,107,576 Highway:
Administrative and other services 45,169,500 137,011 <86,085> 45,220,426 Highway construction 12,054,655,584 514,213,168 <133,172,022> 12,435,696,730 Highway development 3,354,157 281,650 <103,276> 3,532,531 Materials engineering 8,516,295 224,813 <72,136> 8,668,972 Traffic engineering 1,652,653 42,663 <41,289> 1,654,027 Transportation planning and research 598,576 66,166 <63,704> 601,038
Highway maintenance 63,232,750 776,747 <270,875> 63,738,622 Motor Vehicle 69,228,927 487,684 <61,323> 69,655,288
Functional sub-total 12,304,495,043 522,199,433 <135,664,901> 12,691,029,575
Construction in progress 2,032,678,119 842,543,604 <267,294,526> 2,607,927,197
Total governmental funds capital assets 14,337,173,162$ 1,364,743,037$ <402,959,427>$ 15,298,956,772$
NOTE: 1 This schedule presents only the capital asset balances related to governmental funds.Accordingly, the capital assets reported in the internal service fund are excluded from the above amounts. Generally, the capital assets of the internal service fund are included asgovernmental activities in the statement of net assets.
94

95
Table 24
F unc tional C lassific ation 2002 2003 2004 2005 2006 2007
R ural:Inter state fr eeway 996 980 980 981 981 980 P rinc ipal ar te rial 1,187 1,141 1,187 1,167 1,168 1,167 M inor ar te rial 1,274 1,276 1,343 1,363 1,359 1,357 M ajor collector 4,473 4,233 4,301 4,332 4,303 4,301 M inor collec tor 2,289 2,117 2,210 2,188 2,186 2,185 Loca l 27,450 26,004 26,016 27,015 27,819 27,685 T ota l Rura l 37,669 35,751 36,037 37,046 37,816 37,675
Ur ban:Inter state fr eeway 172 187 188 188 188 188 Urba n expr esswa y 153 145 150 156 168 171 P rinc ipal ar te rial 1,000 1,087 1,156 1,400 1,400 1,400 M inor ar te rial 1,274 1,189 1,279 1,790 1,791 1,792 Urba n collec tor 1,732 2,200 2,161 1,645 1,632 1,632 Loca l 15,188 16,969 17,142 17,564 17,380 17,735 T ota l Urba n 19,519 21,777 22,076 22,743 22,559 22,918
S ta te wide C omposite :F ree wa ys and e xpressways 1,321 1,312 1,318 1,325 1,337 1,339 Arter ia ls 4,735 4,693 4,965 5,720 5,718 5,716 C ollec tor s 8,494 8,550 8,672 8,165 8,121 8,118 Loca ls 42,638 42,973 43,158 44,579 45,199 45,420 T ota l Statewide Com posite 57,188 57,528 58,113 59,789 60,375 60,593
S OURC E: Ar iz ona's Highwa y Pe rform ance M onitoring S ystem ( HPM S)
for the ca le nda r ye ar ended Dec embe r 31( In C enter Lane M iles)
Arizona Depa rtment of Tr anspor ta tionT ota l Public R oad Milea ge by Highway C la ss and Gove rnme nta l Ownership
Total Public Road Mileage
0
10,000
20,000
30,000
40,000
50,000
60,000
70,000
2002 2003 2004 2005 2006 2007
Calendar Year
Mile
s UrbanRural

Table 25
CalendarYear Ended Non-State State All Public Arizona Daily Miles
December 31 Highways Highways Highways Population per capita
2007 89,293 83,228 172,521 6,339 27.22006 87,212 83,934 171,146 6,166 27.82005 80,400 83,425 163,825 5,952 27.52004 75,070 81,808 156,878 5,744 27.32003 75,396 72,258 147,654 5,579 26.5
SOURCES: Arizona's Highway Performance Monitoring System (HPMS);ADOT Transportation Planning Division office records
NOTE: The Arizona population data are midyear population estimates of the U.S. Bureau of the Census.Years 2003 through 2006 have been revised to reflect revisions made by the U.S. Bureau of the Census.
(Thousands)
Arizona Department of TransportationDaily Vehicle Miles Traveled with Population Data
for calendar year ended December 31
Daily Vehicle Miles Traveled
0
20,000
40,000
60,000
80,000
100,000
120,000
140,000
160,000
180,000
200,000
2003 2004 2005 2006 2007
Calendar Year
Thou
sand
s of M
iles
State Highways Non-State Highways
96

2008 Comprehensive Annual Financial Report
97
ACKNOWLEDGMENTS The Comprehensive Annual Financial Report was prepared by Financial Management Services, Fiscal Operations: Craig Rudolphy, CPA, CPFO, CGFM Sheryl Bodmer, CPA Diane Wascher, CPA Lawrence H. Ehrke, Jr. Jennifer Crummey Joel Konopken Winifred Gettings Patricia Markiw, CPA Special acknowledgment goes to: All Financial Management Services staff whose cooperation and hard work contributed to the compilation of
financial information that appears in this report.
A special thank you to Creative Services of Communication and Community Partnerships for their graphic design.

State of ArizonaDepartment of Transportation
206 South 17th AvenuePhoenix, Arizona 85007
www.azdot.gov