compost amendment to control runoff from turf rob harrison univ of washington rob harrison...
Post on 20-Dec-2015
216 views
TRANSCRIPT
Compost Amendment to Control
Runoff From Turf
Rob HarrisonUniv of Washington
Rob Harrison [email protected] http://128.95.36.3/robh
Ecosystem Sciences DivisionCollege of Forest ResourcesUniversity of WashingtonSeattle WA 98185 USA
Phil Cohen, Bruce Jensen, Kyle Kolsti, Steve Burgess, Mark Grey and Chuck Henry


Big Problems:
Rob HarrisonUniv of Washington
Lake Sammamish is increasingly polluted and subject to eutrophication
P in runoff is considered the problem

direct sources of P:soil erosionhuman and animal wastefertilizers
lower infiltration of water
aggravating problems:
increased peak runoff
septic tanks

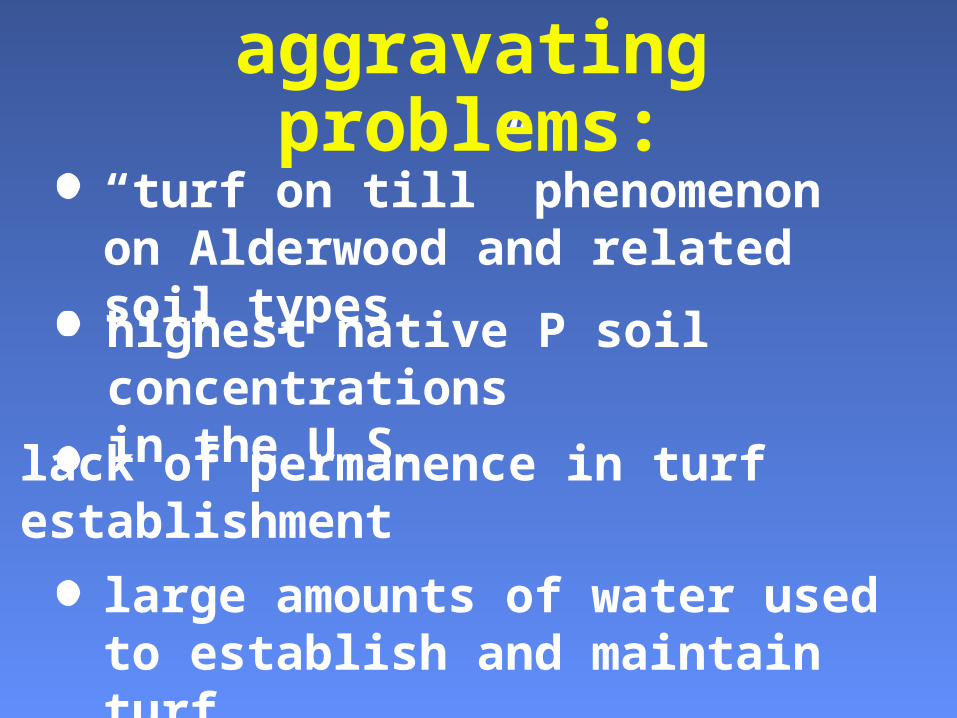
“turf on till” phenomenon on Alderwood and related soil types
aggravating problems:
highest native P soil concentrations in the U.S.lack of permanence in turf establishment
large amounts of water used to establish and maintain turf

turf industry estimates that...
did you know?
18 $billion per year spent on turfestablishment and maintenance
growth rate for industry is 35%per year
very little recycled material is used,but use is growing rapidly
1)
2)
3)

increase water percolation
primary needs:
decrease erosion and runoff
reduce use of phosphorus fertilizer

establish plots to turf
approach:
run natural and manmade storm events
evaluate runoff1) total amounts2) periodicity3) chemistry
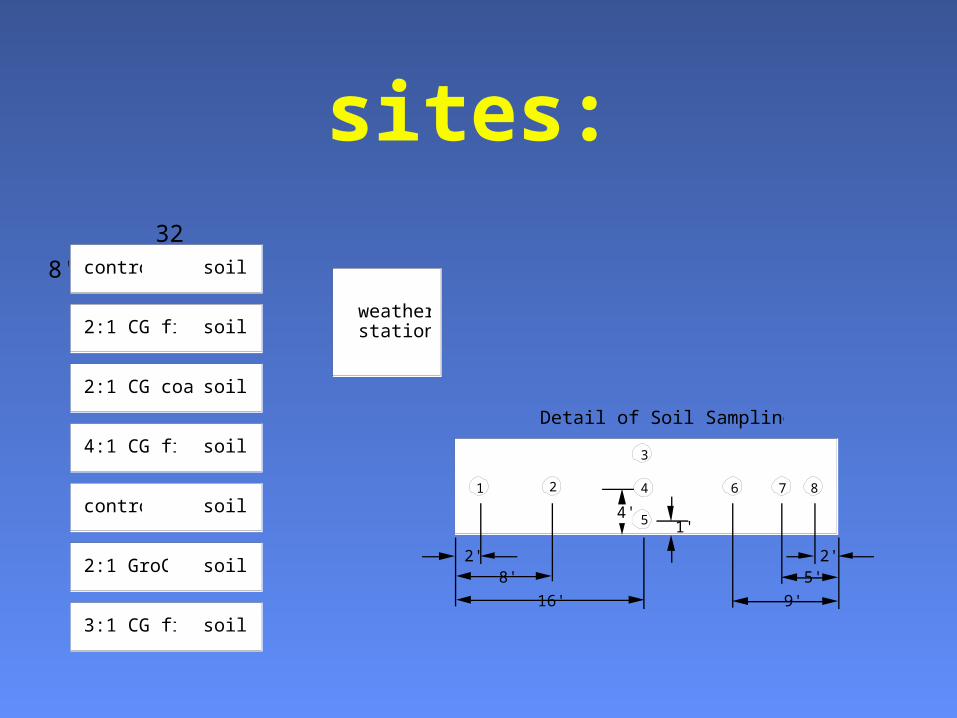
sites:
8'
32'control soil 1
soil 1
soil 1
soil 1
2:1 CG fine
2:1 CG coarse
4:1 CG fine
soil 2control
soil 2
soil 2
2:1 GroCo
3:1 CG fine
weatherstation
1 2 4 876
5
3
2'8'
1'
16'
2'5'
9'
4'
Detail of Soil Sampling Scheme

Turf runoff study at UW Center for Urban HorticultureTurf runoff study at UW Center for Urban Horticulture
2:1 “Clean 2:1 “Clean GreenGreen””
controlcontrol
3:1 “Clean Green”3:1 “Clean Green”
2:1 GroCo2:1 GroCo
4:1 “Clean Green”4:1 “Clean Green”
weather station weather station and recordersand recorders
3:1 GroCo3:1 GroCo
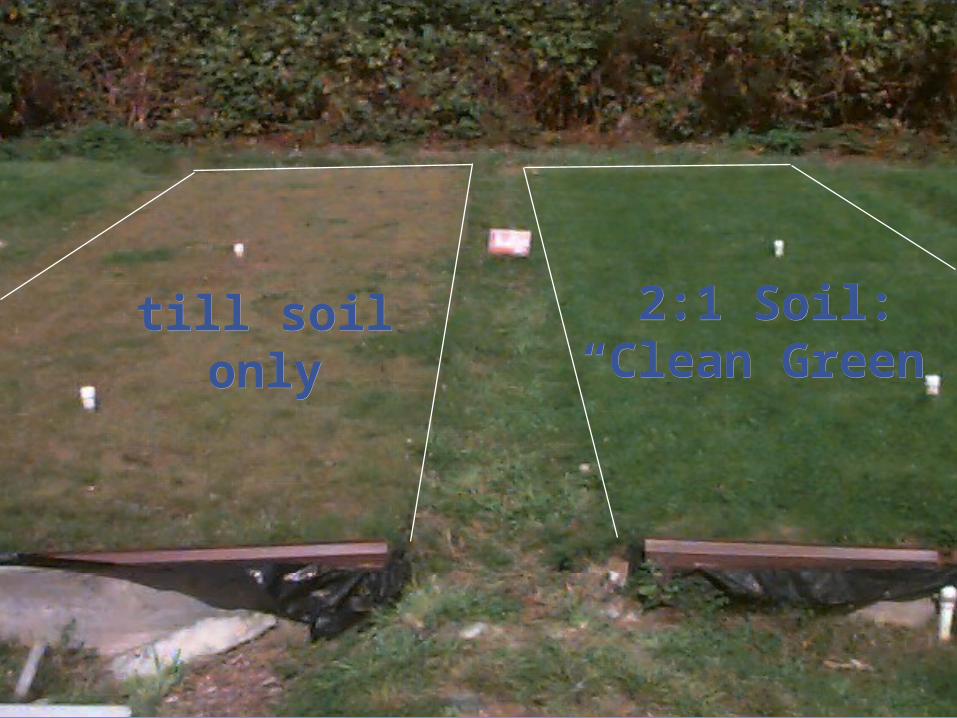
till soiltill soilonlyonly
2:1 Soil:2:1 Soil:““Clean Green”Clean Green”
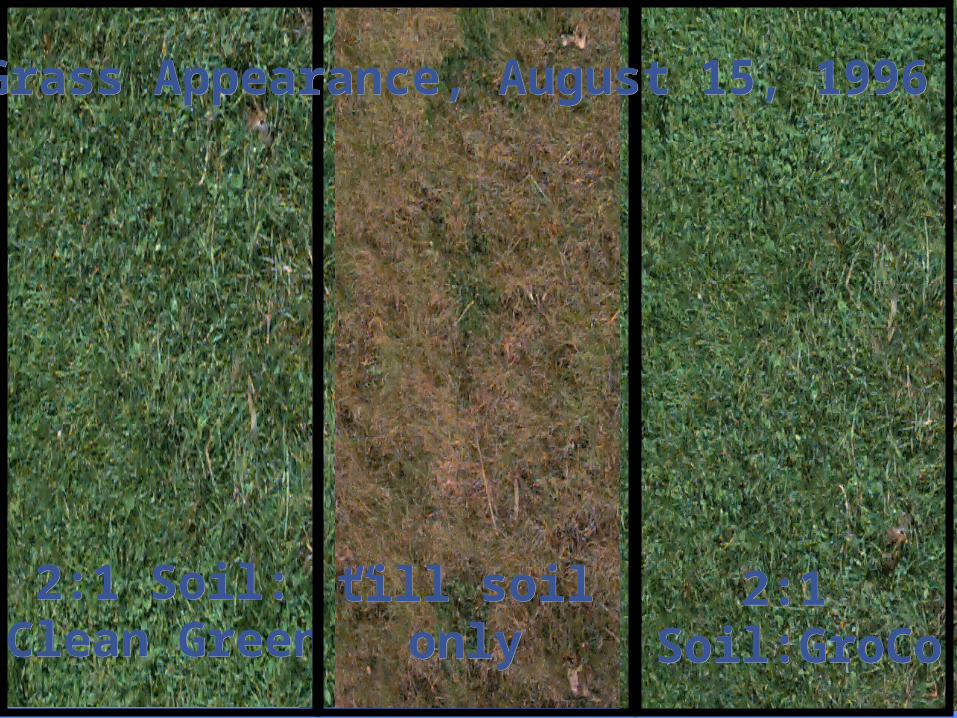
2:1 2:1 Soil:GroCoSoil:GroCo
2:1 Soil:2:1 Soil:““Clean Green”Clean Green”
till soiltill soilonlyonly
Grass Appearance, August 15, 1996Grass Appearance, August 15, 1996

Sampled in August, 1994Field Field
total total Capacity Capacity Total BulkSample designation C N g/g ml/ml Porosity Density
% % % % % g/cm3amended average 2.8 0.27 35 37 50 1.08
no compost average 0.3 0.12 19 24 49 1.28
changes in soil:

Summary of Run Collection Times
Field Collector placed Collector taken Sampling durationRun On Off (hours)
1 03/07/95--10:30 03/15/95--09:00 1912 04/25/95--09:00 04/26/95--09:00 24.03 04/27/95--10:00 04/28/95--11:00 25.04 05/01/95--10:18 05/03/95--18:00 565 05/04/95--09:30 05/08/95--09:30 966 05/08/95--09:30 05/12/95--09:00 957 05/12/95--09:00 05/15/95--09:00 728 05/15/95--09:00 05/15/95--12:45 3.89 05/15/95--12:45 05/15/95--13:15 0.510 05/15/95--13:15 05/16/95--10:10 20.911 05/16/95--10:14 05/16/95--12:15 2.012 05/16/95--12:15 05/16/95--12:30 0.313 05/16/95--12:30 05/16/95--13:00 0.514 05/16/95--13:00 05/24/95--12:00 19115 05/24/95--12:05 05/25/95--11:30 23.416 05/25/95--11:45 05/25/95--15:20 3.617 05/25/95--15:30 05/25/95--18:06 2.618 05/25/95--18:06 05/25/95--18:21 0.219 05/25/95--18:21 05/26/95--21:15 26.920 05/26/95--21:15 05/26/95--21:30 0.321 05/26/95--21:30 06/03/95--10:10 18122 05/27/95--09:00 05/27/95--12:20 3.323 05/27/95--12:20 05/27/95--15:15 2.924 05/27/95--15:15 05/27/95--15:46 0.525 05/27/95--15:46 05/27/95--21:10 5.426 05/27/95--21:10 05/31/95--09:55 8527 05/31/95--10:00 05/31/95--16:30 6.528 05/31/95--16:30 06/03/95--10:10 6629 05/27/95--21:10 05/31/95--09:55 8530 05/31/95--10:00 05/31/95--16:30 6.531 05/31/95--16:30 06/03/95--10:10 6632 06/03/95--10:10 06/06/95--19:52 8233 06/06/95--19:52 06/09/95--10:00 6234 06/09/95--10:00 06/09/95--20:10 10.235 06/09/95--20:10 06/10/95--20:16 24.136 06/09/95--10:00 06/10/95--20:16 34.3
total 1554
EventCollectionPeriods
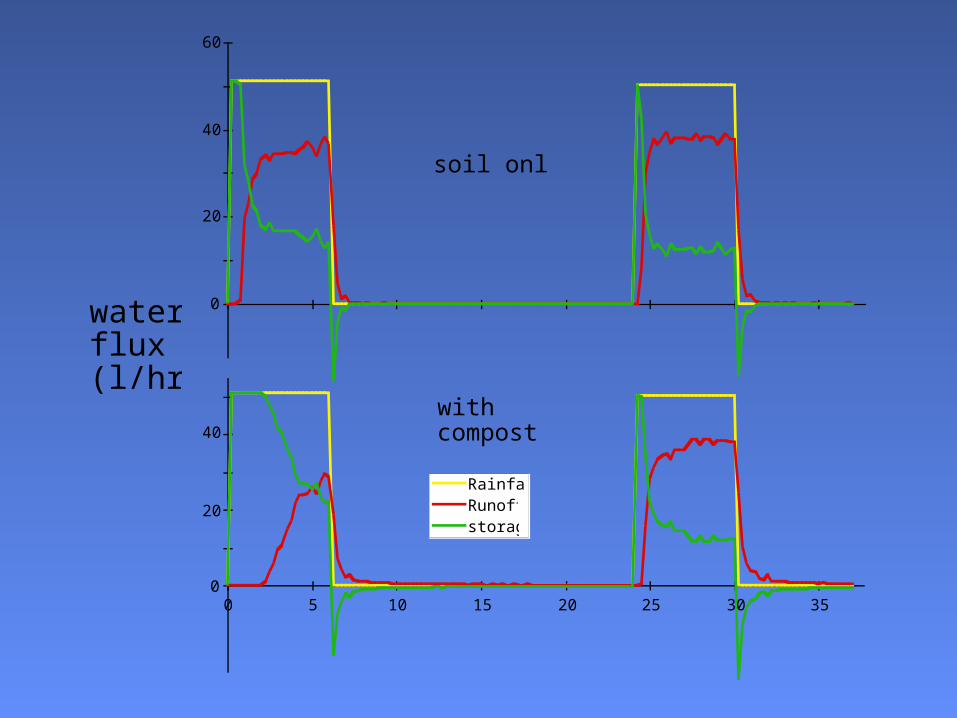
0
20
40
60
RainfallRunoffstorage
0 5 10 15 20 25 30 35
withcompost
soil only
0
20
40
waterflux(l/hr)
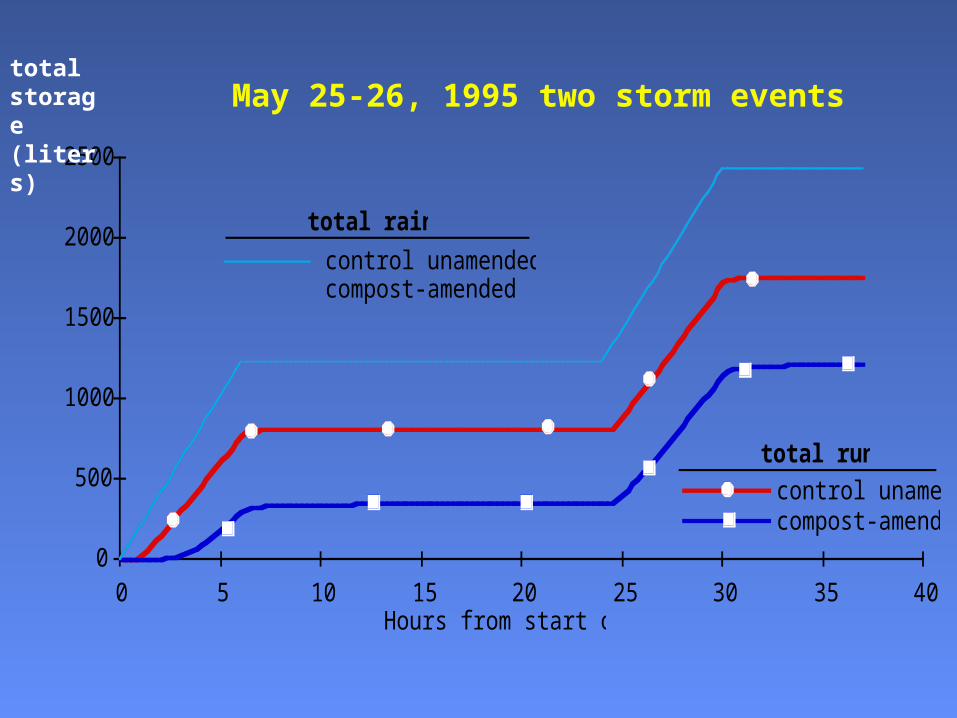
0
500
1000
1500
2000
2500
0 5 10 15 20 25 30 35 40
control unamendedcompost-amended
total runoff
Hours from start of event
control unamended and compost-amended
total rainfall
May 25-26, 1995 two storm eventstotalstorage(liters)

0
200
400
600
800
1000
1200
1400
0 5 10 15 20 25 30 35 40start 11:00 AMMay 25, 1995
control unamendedcompost-amended
rainfall storage
Hours from start of event
May 25-26, 1995 two storm eventstotalstorage(liters)
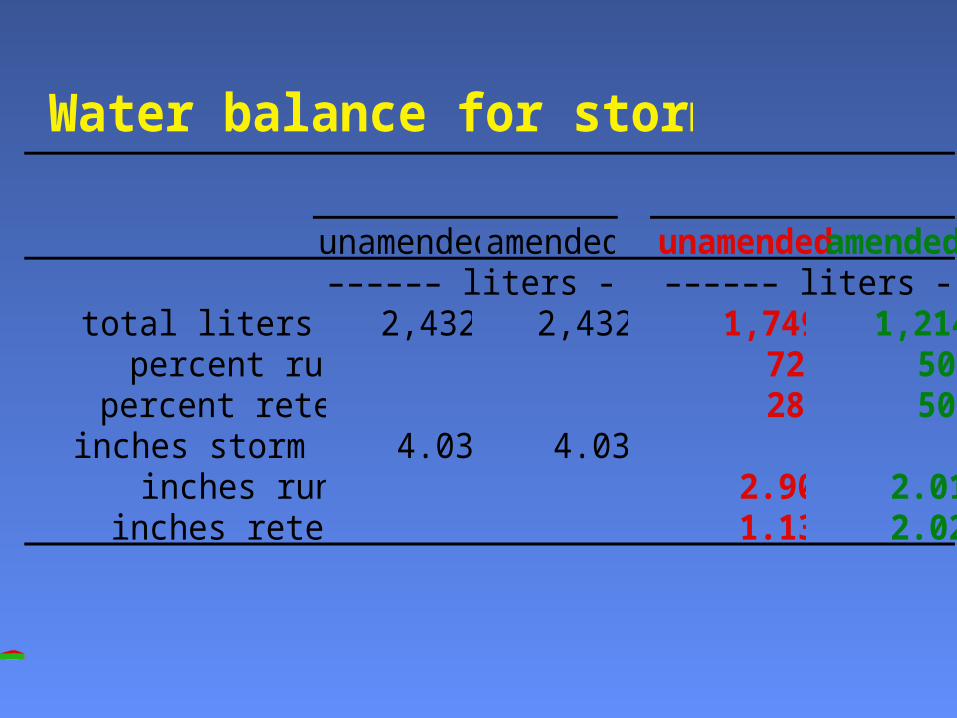
Water balance for storm event
Rainfall Runoffunamended amended unamended amended–––––– liters –––––– –––––– liters ––––––
total liters per plot 2,432 2,432 1,749 1,214percent runoff 72 50
percent retention 28 50inches storm event 4.03 4.03
inches runoff 2.90 2.01inches retention 1.13 2.02
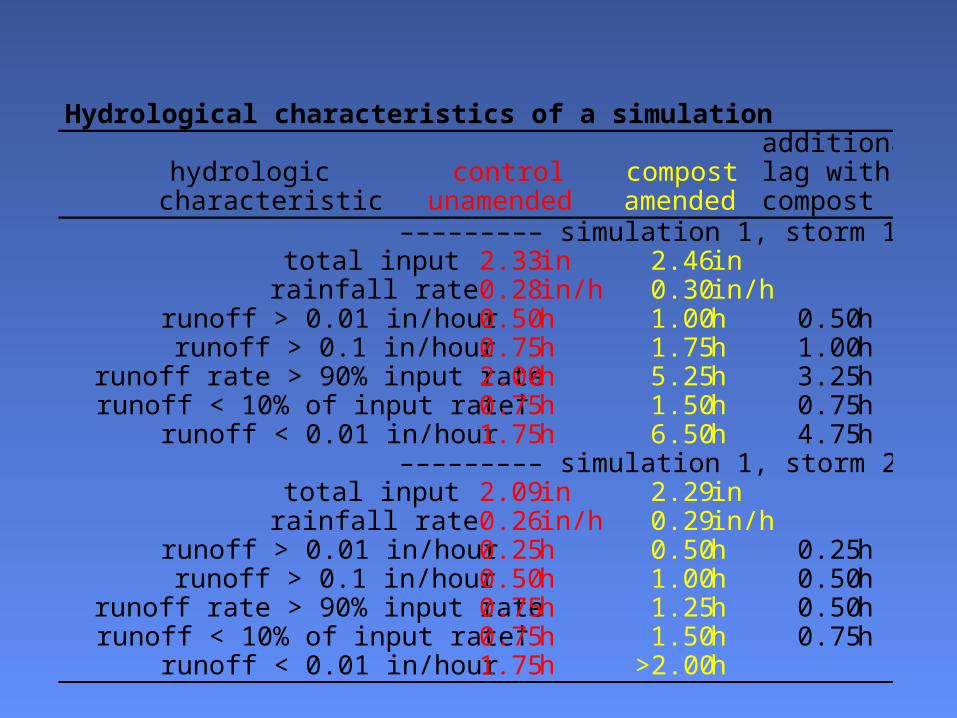
Hydrological characteristics of a simulationadditional
hydrologic control compost lag withcharacteristic unamended amended compost
––––––––– simulation 1, storm 1 –––––––––total input 2.33 in 2.46 in
rainfall rate 0.28 in/h 0.30 in/hrunoff > 0.01 in/hour 0.50 h 1.00 h 0.50 hrunoff > 0.1 in/hour 0.75 h 1.75 h 1.00 h
runoff rate > 90% input rate 2.00 h 5.25 h 3.25 hrunoff < 10% of input rate† 0.75 h 1.50 h 0.75 h
runoff < 0.01 in/hour 1.75 h 6.50 h 4.75 h––––––––– simulation 1, storm 2 –––––––––
total input 2.09 in 2.29 inrainfall rate 0.26 in/h 0.29 in/h
runoff > 0.01 in/hour 0.25 h 0.50 h 0.25 hrunoff > 0.1 in/hour 0.50 h 1.00 h 0.50 h
runoff rate > 90% input rate 0.75 h 1.25 h 0.50 hrunoff < 10% of input rate† 0.75 h 1.50 h 0.75 h
runoff < 0.01 in/hour 1.75 h >2.00 h

Summary statistics for solution chemistry analyses
totalreactive Total Nitrate-
P P nitrogenTreatment SRP TP NO3-N
–––––average conc. (mg/l) –––––overall average 1.14 2.72 1.55
control unamended 1.19 2.54 1.39compost amended 1.08 2.87 1.70

May 25-26, 1995 two storm events
TotalPhosphorus
0
2000
4000
6000
8000
10000
12000
14000
0 5 10 15 20 25 30 35 40
12,657
3,257
Time from start of first storm event (hours)
till soil onlytill with compost amendment
start 11:00 AMMay 25, 1995
Soluble Phosphate
0
1000
2000
3000
4000
5000
60005,189
1,880
0
100
200
300
400
0 20 40 60 80 100 120
0
400
800
1200
0 20 40 60 80 100 120
Time from start of first storm event (hours)
till soil onlytill with compost amendment
till soil onlytill with compost amendment
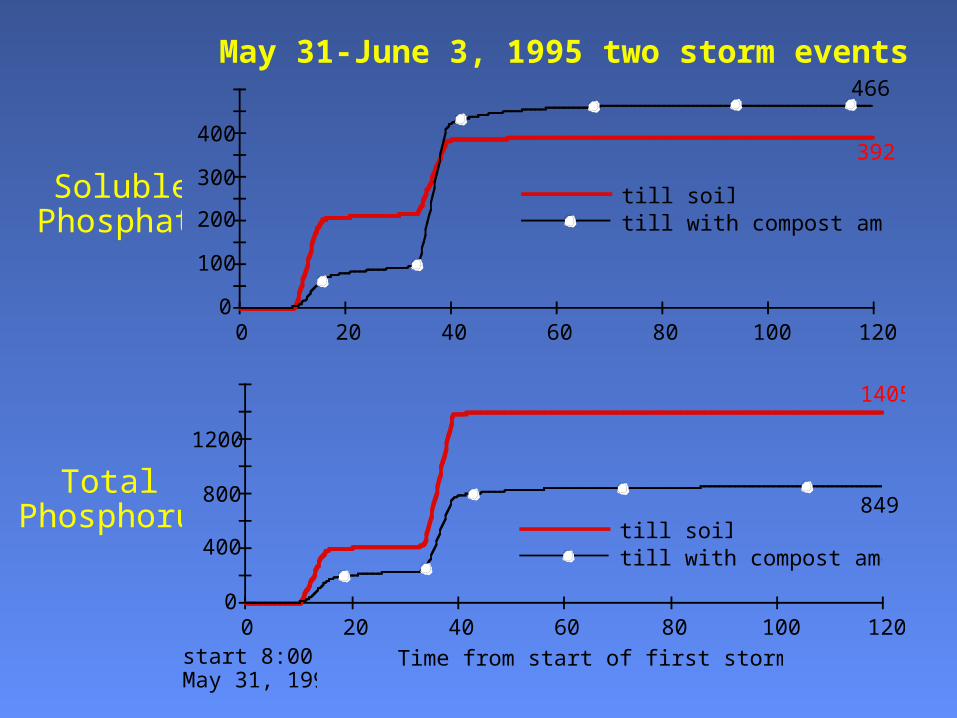
Soluble Phosphate
1405
849
392
466
start 8:00 AMMay 31, 1995
TotalPhosphorus
May 31-June 3, 1995 two storm events
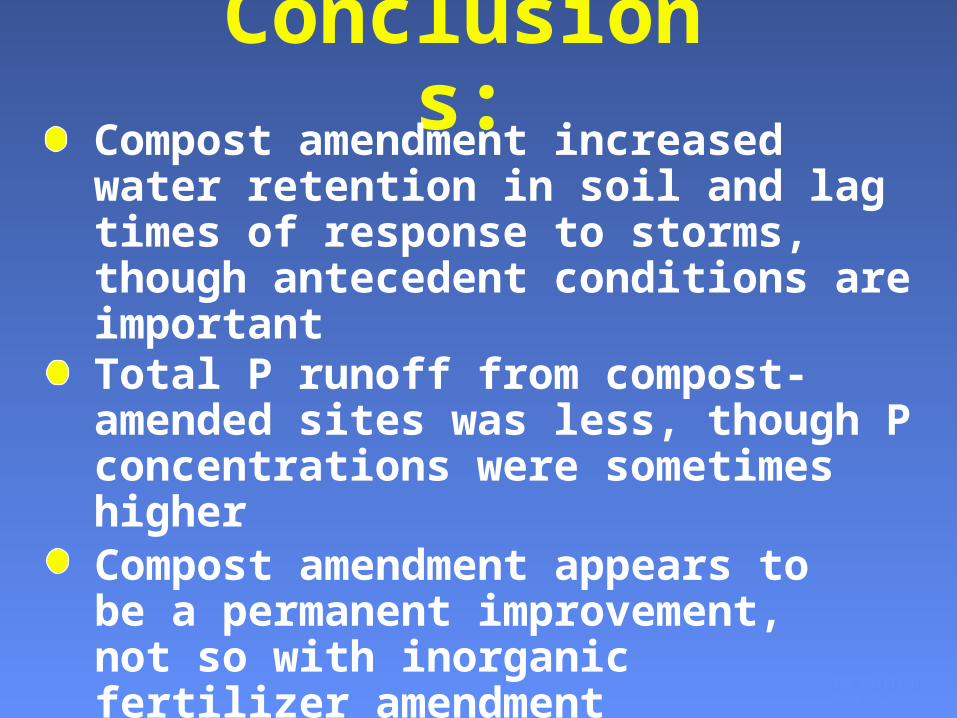
Conclusions:
Rob HarrisonUniv of Washington
Compost amendment increased water retention in soil and lag times of response to storms, though antecedent conditions are important
Compost amendment appears to be a permanent improvement, not so with inorganic fertilizer amendment
Total P runoff from compost-amended sites was less, though P concentrations were sometimes higher
Future directions:
Rob HarrisonUniv of Washington
What are implications on a watershed basis?
Will the properties of the unamended site improve with time?
Is the compost treatment permanent?