compositional and physicochemical changes in waste
TRANSCRIPT

1
Compositional and physicochemical changes in waste materials and biogas
production across 7 landfill sites in UK
Frank, R. R.1,2
, Cipullo, S.1, Garcia J.
1, Davies, S.
3, Wagland, S.T.
1, Villa, R.
1,
Trois, C.2, Coulon, F.
1,2*
1School of Water, Energy and Environment, Cranfield University, MK43 0AL,
UK
2Centre for Research in Environmental, Coastal and Hydrological Engineering
(CRECHE), School of Engineering, University of KwaZulu-Natal, Howard
College Campus, Durban, 4041, South Africa.
3Viridor Waste management Ltd, Viridor House, Priory Bridge Road, Taunton,
Somerset, TA1 1AP.
Corresponding author: [email protected] ; Tel: +44 (0)1234 754981
Abstract: The aim of this study was to evaluate the spatial distribution of the paper
and fines across seven landfill sites (LFS) and assess the relationship between waste
physicochemical properties and biogas production. Physicochemical analysis of the
waste samples demonstrated that there were no clear trends in the spatial distribution
of total solids (TS), moisture content (MC) and waste organic strength (VS) across
all LFS. There was however noticeable difference between samples from the same
landfill site. The effect of landfill age on waste physicochemical properties showed
no clear relationship, thus, providing evidence that waste remains dormant and non-
degraded for long periods of time. Landfill age was however directly correlated with

2
the biochemical methane potential (BMP) of waste; with the highest BMP obtained
from the most recent LFS. BMP was also correlated with depth as the average
methane production decreased linearly with increasing depth. There was also a high
degree of correlation between the Enzymatic Hydrolysis Test (EHT) and BMP test
results, which motivates its potential use as an alternative to the BMP test method.
Further to this, there were also positive correlations between MC and VS, VS and
biogas volume and biogas volume and CH4 content. Outcomes of this work can be
used to inform waste degradation and methane enhancement strategies for improving
recovery of methane from landfills.
Keywords: Waste composition; Waste physicochemistry; Biochemical methane
potential; Waste-biogas relationships; Enzymatic hydrolysis test.

3
1. Introduction
MSW in landfills is composed of a number of different organic and inorganic
materials, such as food, paper, wood, plastics, glass, metal and inert materials
(Machado et al., 2009). The composition of this waste within any landfill site is
highly variable, and is affected by a number of factors, including: location, climate,
landfill age and local policy drivers.
Bacterial decomposition of the waste accounts for the majority of the landfill gas
produced which principally consists of methane and carbon dioxide ranging between
50 – 55% and 40 – 45%, respectively (Johari et al., 2012; Donovan et al., 2011).
The process makes use of a complex, interactive network of aerobic and anaerobic
microorganisms to degrade organic material (food, garden waste, wood, paper)
(Godley et al., 2004). A number of chemical reactions can also account for landfill
gas production on account of the combination of waste materials during disposal
(Bogner and Spokas, 1993). The quantity of landfill gas along with its methane
content is influenced by several factors, which include among others the types and
age of the waste buried in the landfill, the quantity and types of organic compounds
in the waste, and the moisture content and temperature of the waste (Emkes et al.,
2015). Methane is highly combustible, and as a result can be exploited as a source of
renewable energy (Rada et al., 2015). In the UK, the utilisation of landfill gas for
energy has been particularly successful (Brown and Maunder, 1994; Emkes et al.,
2015). The UK however have adopted a number of waste management policies
aimed at reducing the amount of waste, in particular biodegradable waste, sent to
landfill sites (Laner et al., 2012). The EU Landfill Directive 99/31/EC (1999) further
transformed trends in MSW disposal by creating ambitious targets to shift waste

4
away from landfill sites. This was coupled with requirements for landfill sites to
install best-practise methane recovery technologies (Defra, 2006). Other policy
drivers in the UK that incentivise waste diversion from landfill include: the
introduction of landfill tax (1996), the Landfill Allowance Trading Schemes (LATS)
(2005/06) (Defra, 2006), the EU Waste Framework Directive 2008/98/EC (European
Commission, 2008) and the Renewable Energy Directive 2009/28/EC (European
Commission, 2009). UK waste policy drivers have certainly led to a significant
change in the composition of waste currently in UK landfill sites, and consequently
on gas production. The effect on the future landfill gas generation is still to be fully
elucidated.
A number of aerobic and anaerobic methods are currently available to assess the
biodegradability of waste thus providing insight into the potential biogas production.
Aerobic tests such as DR4 and ASTM, are typically more rapid than anaerobic tests
but do not fully measure biodegradability (Wagland et al., 2008). On the contrary,
anaerobic tests (i.e. GB21, GS90 and BM100) provide a more complete assessment
of waste biodegradability but the tests take substantially longer (> 30 days) and
therefore are not suitable for routine monitoring application (Wagland et al., 2009;
Shanmugam and Horan, 2008). Therefore, the development of a rapid, low cost test
method, which can accurately assess the biodegradability of waste, will be valuable
for monitoring and predictive application.
Previously an enzymatic hydrolysis tests (EHT) method was developed by Wagland
et al. (2007, 2008), which followed work by Godley et al (2004) on enzymatic
hydrolysis of cellulosic material and Rodriguez et al (2001) on the enzymatic
availability of cellulose in organic waste. Studies published to date on using the EHT

5
indicate a good correlation between EHT results and the standardised BM 100 test
results (Wagland et al., 2008 and 2011).
The aim of this study was to determine the current state of waste at UK landfill sites,
i.e. compositional and physicochemical properties, and its relationship with landfill
gas production. The specific objectives were to (1) evaluate the spatial distribution of
unspent carbon at seven landfill sites, (2) determine the physicochemical properties
of waste distributed between different landfill sites and a range of depths, (3)
understand the relationship between organic waste distribution, waste composition
and waste physicochemistry, and its effect on landfill gas production and methane
yield and (4) evaluate the use of enzymatic hydrolysis as a feasible, cost-effective
and rapid test method to determine potential biogas production.
2. Materials and Methods
2.1 Waste origin
95 municipal solid waste (MSW) samples were obtained from 7 UK landfill sites
(LFS) during drilling activities between October 2013 and June 2014. The sites are
referred to as LFS 1-7. Two separate tests sites were evaluated at LFS 4, which are
referred to as LFS 4.1 and LFS 4.2, respectively. Background information on the
LFS is provided in Table 1. Approximately 5 kg of waste was sampled at each depth.
The waste samples were then collected within a maximum of 2 weeks after drilling
and stored at 4 ºC until analysis.

6
2.2 Waste samples preparation and characterisation
Waste was screened and separated by hand into plastics, paper and fines as defined
by Quaghebeur et al. (2013) (degraded garden and food materials), textiles, glass and
metal. Waste composition was reported as a percentage contribution of total weight.
Dry matter (DM) or Total solids (TS) and Volatile Solids (VS) of the paper and fines
were determined in triplicate following the procedure BS EN 12879:2000 (Wagland
2008). This was done to calculate the amount of moisture and VS present in the
waste samples. It should be noted though that the VS determination should not be
taken as a direct correlation with the organic part of the waste as the loss of volatile
organic substances (i.e. plastics) can occur and therefore giving high VS results
(Section 5 of the BS EN 12879:2000 standards). The waste samples were dried at
105 °C for 24 h for the DM determination and at 505 °C for 4 h for the VS
determination. The paper and fines samples were shredded to particle size of 8 mm
as recommended by Wagland (2008). pH and soluble Chemical Oxygen Demand
(sCOD) of the separated paper and fines were determined according to the Standard
Analytical Methods published by the American Public Health Association (APHA,
1995). sCOD was conducted in duplicate due to reliability of test kits while all other
tests were conducted in triplicate.
2.3 Biochemical methane potential
The BMP test were carried out as described in Garcia et al. (2016). Briefly each
BMP test was conducted by mixing 20 g loss on ignition (LOI) equivalent of the
paper and fines with 40 g LOI equivalent of digested primary sludge in a 1 L bottle.
Sludge was obtained from the Cotton Valley wastewater treatment plant in Milton

7
Keynes, UK and was used to introduce the active microbial community. The bottles
were filled with distilled water up to 500 ml, leaving a headspace of 500 ml, and
flushed with nitrogen gas to set anaerobic conditions. Bottles were thereafter sealed,
and incubated at 38°C in a water bath. The volume of biogas was measured
volumetrically daily until no more biogas was produced. The concentration of
methane in the biogas was determined once a week using either gas chromatography
or a gas analyser (Servomex 1440 GA), depending on the availability of the
measuring device. Further to this, sludge alone and sludge + cellulose (both in the
absence of waste) were used as control BMP tests as recommended in the WRAP
guidelines (Walker et al., 2010). Cellulose was used at a concentration of 10 g kg-1
.
The amount of biogas produced was calculated considering the area of the columns
(specific to this study) and the environmental conditions of the laboratory, according
to Equation 1 (Walker et al., 2010):
𝑉𝑠𝑡𝑝 =𝑇𝑠𝑡𝑝 . 𝐴
𝑇𝑎𝑡𝑚 . 𝑃𝑠𝑡𝑝 . [(𝑃𝑎𝑡𝑚− 𝑃𝐻20 − 𝑝 . 𝑔 . (𝐻 − ℎ)). ℎ]
[Equation 1]
where, Vstp = volume of biogas (in standard conditions), Tstp = standard temperature,
Tatm = ambient temperature, Pstp = standard pressure, Patm = ambient pressure, PH2O =
pressure of the water, ρ = density, g = gravity, H = distance from the bottom to the
top of the column, h = void distance in the column.
The biogas production of the inoculum was subtracted when calculating the amount
of the biogas produced by the waste samples. The volume of biogas produced is

8
presented as L biogas per Kg total wet waste. Methane production is presented in ml
CH4/g VS waste.
2.4 Enzymatic Hydrolysis tests
Enzymatic Hydrolysis tests (EHT) were carried out as previously described by
Wagland et al., (2008). Briefly, an equivalent waste sample of 3 g of LOI was placed
in 250 ml glass bottles. 150 ml of 0.1M pH 5 buffer solution was then added to each
bottle. Approximately 20 ml of sample was removed and filtered using 0.45 μm
filters to remove the solids present in the liquid. The filtrate was then analysed for
soluble chemical oxygen demand (sCOD). The value obtained was recorded as Phase
1 oxygen demand. Then the sample mixture of the bottles was autoclaved at 121 ºC
for 15 minutes to remove any biological activity and thus to ensure that sCOD
release after enzyme addition was due to enzyme hydrolysis. Again, 20 ml of sample
was removed and filtered for sCOD analysis. The value obtained is the Phase 2
oxygen demand. Finally, between 10 – 20 ml of prepared enzyme solution (800
U/mg cellulose:200 U/mg hemicellulose) was added to the sample mixture as
described in Table 2. These concentrations were used at they showed optimal results
during preliminary tests (data not shown). All the bottles were placed in an orbital
shaker and incubated at 50 ºC. 20 ml of sample were removed and filtered after 20
hours of incubation for the Phase 3 sCOD analysis. EHT results were obtained by
calculating the change in COD between phases 2 and 3 according to Equation 2.
sCOD (g / gVS) = 𝑠𝐶𝑂𝐷 (mg / L)
𝑉𝑆 𝐶𝑜𝑛𝑐𝑒𝑛𝑡𝑟𝑎𝑡𝑖𝑜𝑛 (g / l) * 1000
Equation 2

9
Results from EHT are expressed in g sCOD / g VS and converted to L per gram
sample for comparison with results from BMP tests. EHT was conducted in duplicate
on 3 representative MSW samples from LFS 1 (core 1- 4 m, 6 m, 10 m), 3 from LFS
2 (core 2-10 m, 20 m, 30 m) 4 from LFS 3 (core 1 and core 5- 10 m, 20 m) and 3
from LFS 4.1 (3 m, 9 m 15 m). Samples were chosen to give a representative sample
of each landfill site at different depths while maintaining the core.
2.5 Statistical analysis
Statistical analysis was carried out using SPSS version 22. One-way analysis of
variance (ANOVA) tests were conducted to determine differences in waste
composition and physicochemical properties between independent variables; landfill
sites and depth. Depth was categorised into 3 groups: 0-9 m, 10-19 m, and 20+ m.
Two-way analysis of variance tests was also evaluated for the independent variables.
It was determined that there was no significant interaction effect for any of the
independent variable. All tests satisfied assumptions of normality (Kolmogorov-
Smirnov test) and homogeneity of variance (Levene’s test). Significance level was
set at 0.05. The relationships between waste depth, TS, VS, sCOD, organic
composition, biogas volume and methane content were assessed using a Draftsman’s
plot of the Primer statistical package version 6.

10
3. Results and Discussion
3.1. Waste composition
The spatial distribution of the paper and fines across the seven landfill sites is shown
in Figure 1. A statistical difference was observed in the distribution of paper and
fines across the seven landfill sites [F(7,83) = 8.486, p < 0.01]. This was expected as
the sites differed in their age, waste types, capacity and region. There was also a
statistical difference in the amount of fine material distributed between waste layers
(0-9 m, 10-19 m and 20+ m) [F (2,88) = 5.111, p < 0.01]. This finding is in
agreement with previous studies on the characterisation of excavated waste samples
who found the composition of organic fine materials to increase with depth (Mor et
al, 2006; Qaughebeur et al (2013); Garcia et al., 2016).
Overall, results showed that there is a large amount of unspent organic material
(between 20 and 90 %) distributed variably in the surface waste layers (above 20 m)
throughout all the test sites (Figure 2). Moreover, higher proportions were observed
below 20 m (Figure 1). This is likely on account of waste in lower layers being
entombed and therefore unable to undergo waste stabilisation, as suggested by
Reinhart et al (2002). The variability in its distribution also implies that there are no
site-specific physical, chemical or biological factors which influence its degradation,
particularly at surface depths.
3.2 Physicochemical properties of waste
A summary of the physicochemical properties (TS, VS, sCOD, pH and MC) of the
paper and fines from all LFS samples according to depth is presented in Table 3.
Total solids (TS) [F(2,88) = 0.235, p = 0.791] and VS [F(2.88) = 2.429, p = 0.094]

11
showed no statistical difference between the waste layers across all landfill sites.
This indicated that overall, there were no defined trends in the spatial distribution of
paper and fines across all landfill sites tested. Mor et al (2006) suggests that leachate
accumulates at the bottom of the waste cell, causing the waste near the bottom to
become saturated. In situ landfill waste data attained in this study does not
correspond. There was however a statistical difference in TS [F(7.83) = 3.814, p <
0.01) between landfill sites, which is understandable due to variations in climate,
landfill geomorphology and waste composition between the landfill sites. There was
also a significant difference in VS [F(7.83) = 3.948, p < 0.01] between landfills,
which is likely due to variations in landfill age (Table 1; Figure 2).
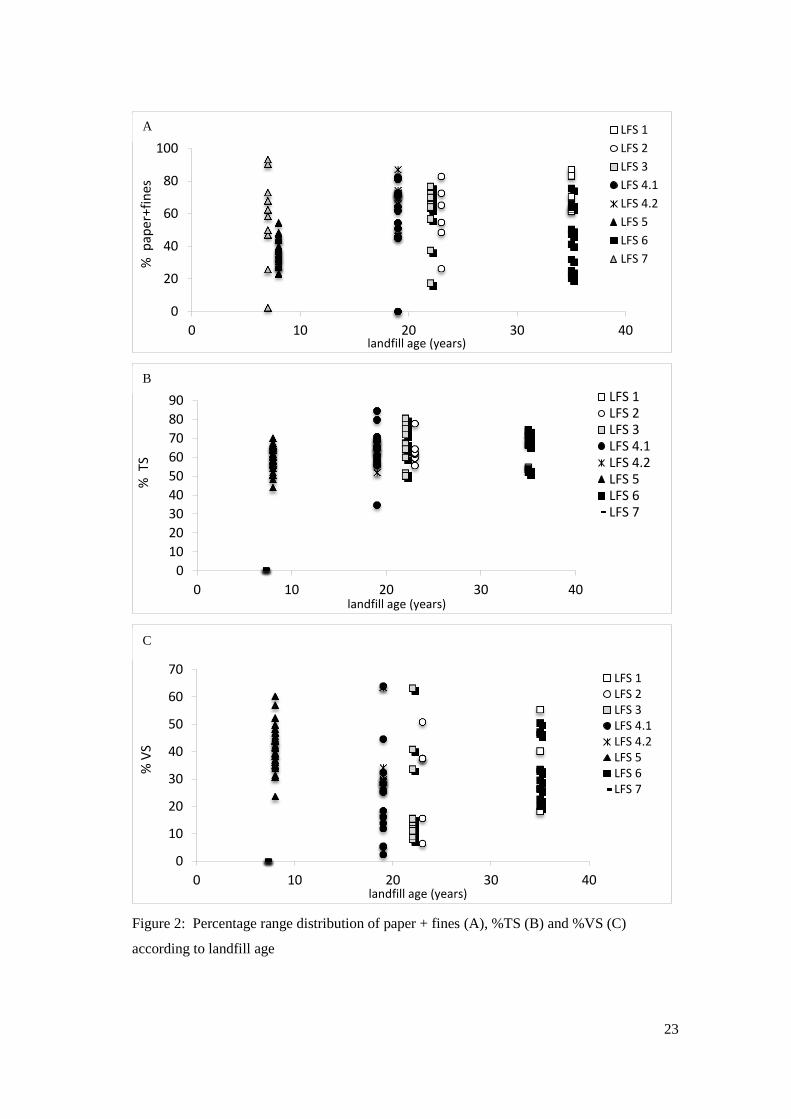
Further to this, there was no particular trend observed between paper and fines, TS,
VS and landfill age, which suggested that the age of landfill did not directly
influence the organic strength of the waste (Figure 2). One possible hypothesis for
this is presented by Reinhart et al (2002), who propose that conventional sanitary
landfills are designed and engineered to prevent moisture from entering the waste
mass and in doing so, prevents waste from degrading for long periods of time. This
study provides empirical field evidence of genuine landfill waste samples analysis
that current landfill practises allow waste to remain dormant for long periods of time,
and therefore, regardless of landfill age, contains a high content of paper and fines
with high organic strength (Table 3; Figure 2).
The average pH across all landfill sites was between 7 and 8 (data not shown),
indicating that sites were either in, or in a transition towards a methanogenic state
(Adhikari et al., 2014; Lee et al., 2010). The strong influence of pH on the anaerobic
waste degradation process is demonstrated by Staley et al (2011). The authors

12
suggest pH is a primary driver facilitating microbial activity during different stages
of anaerobic waste degradation. In this study the results showed no observable trend
between pH and landfill depth thus suggesting that the different stages of waste
degradation (acidogenesis, acetogenisis and methanogenesis) were not defined by
landfill depth (a variation of which is the relative age of waste within a landfill). This
therefore suggests that waste degradation processes occur in micro-niches across
different depths within the waste cell, as described by Staley et al (2011).
3.3 Biochemical methane potential test (BMP)
BMP tests were conducted on each paper and fines samples to determine the
maximum amount of biogas and methane content which could be attained per mass
of waste under optimal conditions (Figures 3 and 4). There was a significant
difference in the average amount of biogas produced from the paper and fines across
the seven tested landfill sites, (Figure 3; F(7,83) = 6.095, p < 0.01). Waste from LFS
5 and 7 produced approximately 4 and 2 times higher amounts of biogas than the
other sites, respectively. The same trend occurred in methane yield as LFS 5 and 7
produced significantly higher amounts of CH4 per gram VS MSW (Figure 4). These
two landfill sites are the youngest LFS, being 8 and 7 years old respectively. The
relationship between landfill age and biochemical methane yield is shown in Figure
5. These results are supported by Bogner and Spokas (1993), who proposed that
landfill age is a primary factor influencing landfill methane balance; along with
engineering and management practises and water balance. Full-scale in situ evidence
confirming this relationship is rare (Bogner and Spokas, 1993).

13
Results also demonstrated a statistical difference in the BMP of the paper and fines
according to landfill depth [F(2,88) = 5.213, p < 0.01]. The average methane
production decreased linearly with increasing depth being 86, 35 and 25 ml g-1
VS-1
,
for depths of 0-9 m, 10-19 m and 20+ m, respectively (Figure 6). Little work has
been done to spatially map methane potential of waste within landfill sites.
Understanding how waste with high methane potential is spatially distributed can be
used to inform strategies for improving recovery of methane from landfills. Based on
these observations, it is likely that methane enhancement strategies that focus on the
surface layers of younger landfills would yield more significant results.
3.4. Relationships between waste physicochemical properties and biogas
production
The relationship between the spatial distribution of the paper /fines fraction and the
physicochemistry and biogas/Biochemical methane production is shown in Figure 6.
There was a positive relationship between MC and VS, i.e. volatile solids content
was higher in wetter waste. It was also expected that there would be a relationship
between VS and sCOD, as a positive correlation was suggested by Contreras et al
(2002). Results from our study did not support this finding. MC percentage was
negatively correlated to TS % which was expected. There was also a weak negative
correlation between the paper and fines percentage and biogas production. Results
also indicated a positive relationship between MC and CH4 production, VS and
biogas volume, and biogas volume and CH4 content.
The relationship between biogas production and CH4 content indicated that sites
which typically produce high levels of biogas also produce high amounts of CH4. As

14
a result, the amount of biogas produced by a landfill site could also be indicative of
the total potential amount of methane, and thus potential energy production.
CH4 levels did not show any other trend with organic content or sCOD but did show
a weak positive relationship with VS, similar to that of biogas volume. The fact that
the waste organic composition did not correlate with biogas production suggests that
the quantity (composition) of organic material cannot be used as an indication of
potential biogas production. The organic strength however, as represented by the VS
content, provides a better indication of biogas potential. Shanmugam and Horan
(2008) confirmed the importance of VS in biogas production. Since VS and sCOD
are both measures of organic strength, the lacking correlation between waste sCOD
and biogas production further supports the relationship between VS and biogas
production.
3.5. EHT-BMP correlation
EHT were conducted on each waste sample in duplicate across the 7 landfill sites.
Comparison of the average EHT and BMP results across the 7 landfill sites indicated
a strong correlation between the two tests (Figure 7). This finding supports current
indications that EHT can be successfully used as a more rapid alternative test to
determine biogas production when compared to BMP tests (Wagland et al., 2008,
2009; Garcia et al., 2016). While the well-established BMP tests are considered
robust and accurate, they often require a relatively long time for completion which
limits their practicality and applicability for waste managers (Wagland et al., 2008).
EHT test method maintains result accuracy while reducing the time required for
results. The use of EHT for biogas potential is still in its infancy; however there is a

15
growing amount of evidence which suggests that it can be successfully used for
biogas prediction (Wagland et al., 2007, 2008, 2009, 2011; Godley et al., 2004). A
limitation of the EHT method compared to BMP tests is that BMP tests provide data
on biogas volume and methane concentration, while EHT does not. However, the
EHT as mentioned earlier offers an alternative and rapid method to assess the
biodegradability of waste with enough accuracy which positions the method as a
good alternative to the widely used EU standardised BM100.
4. Conclusions
Overall, this study provided valuable insights into the status quo of waste in landfill
sites. We determined that even with current waste diversion policy drivers, there is
still a large supply of unspent carbon distributed unequally throughout the landfill
sites, which could be converted to biogas via bacterial stimulation for example
through leachate recirculation (Woldeyohansa et al., 2014; Sanphotia et al., 2006;
Chana et al., 2002; Reinhart et al., 2002 Frank et al., 2016). However it has been
proved more problematic in practise (Reinhart et al., 2002) . There was also a direct
correlation between landfill age and paper and fines BMP, as well as paper and fines
BMP and landfill depth.
The BMP test method used to determine biogas production, while being repeatable
and effective, was extremely time and labour intensive. It is therefore impractical for
frequent use by landfill operators to attain insightful information about the biogas
potential of their waste. Evaluation of the EHT test method, in support of previous
studies, determined that there was a high degree of correlation between EHT and
BMP test results, which motivates its potential use as an alternative to the BMP test

16
method. To date there is little work that has previously been done to describe the
relationship between waste characteristics and biogas production in such detail. Such
research provides the fundamental basis needed to address and reform waste
management practises aimed at deriving value from landfill waste, particularly with
regards to waste degradation, and landfill gas production. It also provides valuable
information on the limiting chemical and biological mechanisms of biogas
production, and thus potential insights to the future of methane recovery from landfill
sites.
Acknowledgements: This work was financially supported by the National Research
Foundation, South Africa (Ref: SFH20110829000026157) and Viridor Ltd, UK.
References
Adhikari, B., Dahal, R. and Khanal, N., A. 2014. Review of factors affecting the
composition of municipal solid waste landfill leachate. International Journal of
Engineering Science and Innovative Technology 3, 273-281.
American Public Health Association (APHA) 2005. Standard Methods for the
examination of Water and Wastewater, 21st ed. Washington. American Public
Health Association, American Water Works Association, Water Environment
Federation, 9-169.
Bogner, J. and Spokas, K., 1993. Landfill CH4: rates, fates, and role in global carbon
cycle. Chemosphere, 26, 369-386.
Brown, K. A., Maunder, D. H. 1994. Exploitation of landfill gas: a UK perspective.
Water Science and Technology 30, 143-151.
17
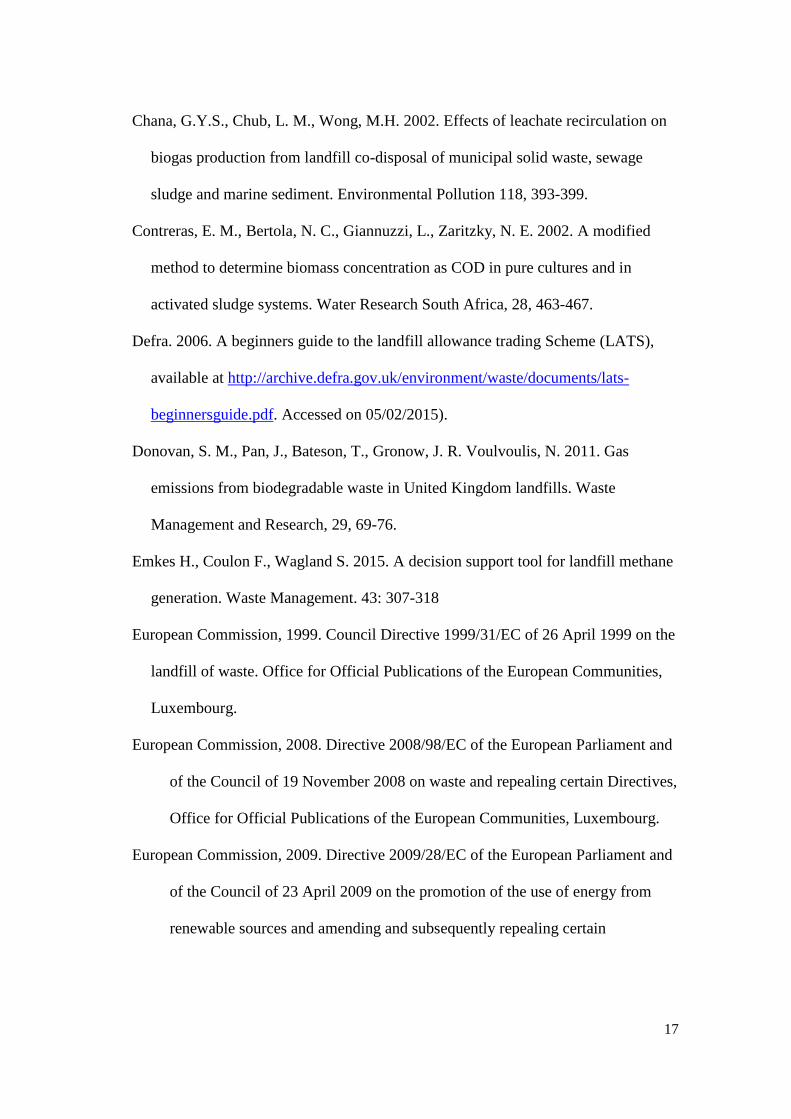
Chana, G.Y.S., Chub, L. M., Wong, M.H. 2002. Effects of leachate recirculation on
biogas production from landfill co-disposal of municipal solid waste, sewage
sludge and marine sediment. Environmental Pollution 118, 393-399.
Contreras, E. M., Bertola, N. C., Giannuzzi, L., Zaritzky, N. E. 2002. A modified
method to determine biomass concentration as COD in pure cultures and in
activated sludge systems. Water Research South Africa, 28, 463-467.
Defra. 2006. A beginners guide to the landfill allowance trading Scheme (LATS),
available at http://archive.defra.gov.uk/environment/waste/documents/lats-
beginnersguide.pdf. Accessed on 05/02/2015).
Donovan, S. M., Pan, J., Bateson, T., Gronow, J. R. Voulvoulis, N. 2011. Gas
emissions from biodegradable waste in United Kingdom landfills. Waste
Management and Research, 29, 69-76.
Emkes H., Coulon F., Wagland S. 2015. A decision support tool for landfill methane
generation. Waste Management. 43: 307-318
European Commission, 1999. Council Directive 1999/31/EC of 26 April 1999 on the
landfill of waste. Office for Official Publications of the European Communities,
Luxembourg.
European Commission, 2008. Directive 2008/98/EC of the European Parliament and
of the Council of 19 November 2008 on waste and repealing certain Directives,
Office for Official Publications of the European Communities, Luxembourg.
European Commission, 2009. Directive 2009/28/EC of the European Parliament and
of the Council of 23 April 2009 on the promotion of the use of energy from
renewable sources and amending and subsequently repealing certain

18
Directives, Office for Official Publications of the European Communities,
Luxembourg.
Frank R. R., Davies, S., Wagland, S.T., Villa R., Trois C., Coulon F. 2016.
Evaluating leachate recirculation with cellulase addition to enhance waste
biostabilisation and landfill gas production. Waste Management, in press
Garcia, J., Davies, S., Villa, R., Gomes, D.M., Coulon, F., Wagland, S.T. 2016.
Compositional analysis of excavated landfill samples and the determination of
residual biogas potential of the organic fraction. Waste Management
http://dx.doi.org/10.1016/j.wasman.2016.06.003
Godley, A. R., Lewin, K., Graham, A., Barker, H., Smith, R. 2004. Biodegradability
determination of municipal waste: an evaluation of methods. Waste 2004 -
Integrated Waste Management and Pollution Control: Policy and Practice,
Research and Solutions, Stratford-upon- Avon, UK.
Johari, A., Ahmed, S. I., Hashim, H., Alkali, H., Ramli, M. 2012. Economic and
environmental benefits of landfill gas from municipal solid waste in Malaysia.
Renewable and Sustainable Energy Reviews 16, 2907– 2912.
Laner, D., Crest, M., Scharff, H., Morris, J. W. F., Barlaze, M. A. 2012. A review of
approaches for the long-term management of municipal solid waste landfills.
Waste Management 32, 498-512.
Lee, A.H., Nikraz, H. and Hung, Y.T., 2010. Influence of waste age on landfill
leachate quality. International Journal of Environmental Science and
Development, 1:347-350.

19
Machado, S. L., Carvalho, M. F., Gourc, J., Vilar, O. M., do Nascimento, J. C. F.
2009. Methane generation in tropical landfills: Simplified methods and field
results. Waste Management 29, 153–161.
Mor, S., Ravindra, K., Visscher, A. D., Dahiya, R. P., Chandra, A. 2006. Municipal
solid waste characterization and its assessment for potential methane generation:
A case study. Science of the Total Environment 371, 1–10.
Quaghebeur, M., Laenen, B., Geysen, D., Nielsen, P., Pontikes, Y., van Gerven, T.,
Spooren, J., 2013. Characterization of landfilled materials: screening of the
enhanced landfill mining potential. Journal of Cleaner Production, 55, 72-83.
Rada, E.C., Ragazzi, M., Stefani, P., Schiavon, M., Torretta, V. 2015. Modelling the
potential biogas productivity range from a MSW landfill for its sustainable
exploitation, Sustainability, 7, 482-495
Reinhart, D. R., McCreanor, P. T., Townsend, T. 2002. The bioreactor landfill: Its
status and future. Waste Management and Research 20, 172-186.
Rodriguez, C., Hiligsmann, S., Lardinois, M., Destain, J., Radu, J. P., Charlier, R.,
Thonart, P. 2001. Cellulose enzymatic availability in solid waste. Proceedings
Sardinia 2001, Eighth International Waste Management and Landfill Symposium,
CISA, Cagliari.
Sanphotia, N., Towprayoona, S., Chaiprasertc, P., Nopharatanad, A. 2006. The
effects of leachate recirculation with supplemental water addition on methane
production and waste decomposition in a simulated tropical landfill. Journal of
Environmental Management 81, 27–35.

20
Shanmugam, P., Horan, N. J. 2008. Simple and rapid methods to evaluate methane
potential and biomass yield for a range of mixed solid wastes. Bioresource
Technology 100, 471-474.
Staley, B.F., Francis, L. and Barlaz, M.A., 2011. Effect of spatial differences in
microbial activity, pH, and substrate levels on methanogenesis initiation in refuse.
Applied and Environmental Microbiology, 77, 2381-2391.
Wagland, S.T. , 2008. Development and evaluation of rapid enzymatic hydrolysis
test method to assess the biodegradability oforganic waste. PhD thesis, Cranfield
University, Cranfield.
Wagland, S. T., Tyrrel, S. F., Godley, A. R., Smith, R., Blakey, N. 2007.
Development and application of an enzymatic hydrolysis test to assess the
biodegradability of organic waste material. Proceedings Sardinia 2007, Eleventh
International Waste Management and Landfill. Symposium, CISA, Cagliari
Wagland, S.T., Godley, A.R., Frederickson, J., Tyrrel, S.F., Smith, R. 2008.
Comparison of a novel enzymatic biodegradability test method with microbial
degradation methods. Communications in Waste and Resource Management 9,
80–86.
Wagland, S. T., Tyrell, S. F., Godley, A. R., Smith, R. 2009. Test methods to aid in
the evaluation of the diversion of biodegradable municipal waste (BMW) from
landfill. Waste Management 23, 1218-1226.
Wagland, S.T., Godley, A.R., Tyrell, S. F. 2011. Investigation of the application of
an enzyme-based biodegradability test method to a municipal solid waste
biodrying process. Waste Management 31, 1467-1471.

21
Walker, M., Banks, C., Heaven, S., Frederickson, J. 2010. Residual biogas potential
test for digestates, available at
http://www.wrap.org.uk/sites/files/wrap/Residual%20Biogas%20Potential.pdf
(Accessed on 5th January 2015).
Woldeyohansa, A. M., Workub, T., Kloosc, H., Mulat, W. 2014. Treatment of
leachate by recirculating through dumped solid waste in a sanitary landfill in
Addis Ababa, Ethiopia. Ecological Engineering 73, 253-259.

22
Figure 1: Spatial distribution of the paper and fines from seven UK landfill sites
0
10
20
30
40
50
60
70
80
90
100
0 5 10 15 20 25 30 35
% p
aper
+fi
nes
depth (m)
LFS 1
LFS 2
LFS 3
LFS 4.1
LFS 4.2
LFS 5
LFS 6
LFS 7
23
Figure 2: Percentage range distribution of paper + fines (A), %TS (B) and %VS (C)
according to landfill age
0
20
40
60
80
100
0 10 20 30 40
% p
aper
+fin
es
landfill age (years)
LFS 1
LFS 2
LFS 3
LFS 4.1
LFS 4.2
LFS 5
LFS 6
LFS 7
0
10
20
30
40
50
60
70
80
90
0 10 20 30 40
% T
S
landfill age (years)
LFS 1LFS 2LFS 3LFS 4.1LFS 4.2LFS 5LFS 6LFS 7
0
10
20
30
40
50
60
70
0 10 20 30 40
% V
S
landfill age (years)
LFS 1LFS 2LFS 3LFS 4.1LFS 4.2LFS 5LFS 6LFS 7
A
B
C

24
Figure 3: Average biogas production from BMP tests across seven UK landfill sites
(including standard deviation)
Figure 4: Average methane production from BMP tests across the seven landfill sites
(including standard deviation)
Figure 5: Methane yield according to landfill age
0
5
10
15
20
25
LFS 1 LFS 2 LFS 3 LFS 4.1 LFS 4.2 LFS 5 LFS 6 LFS 7
Ave
rage
Bio
gas
L kg
-1
mix
ed M
SW
Landfill site
0
5
10
15
20
25
LFS 1 LFS 2 LFS 3 LFS 4.1 LFS 4.2 LFS 5 LFS 6 LFS 7
Ave
rage
Met
han
e
ml g
-1 V
S-1 m
ixed
MSW
Landfill site
0
5
10
15
20
25
30
35
40
0 5 10 15 20 25 30 35 40
Ave
rage
Met
han
e
ml g
-1 V
S-1 m
ixed
MSW
landfill age (years)

25
1 Figure 6: Draftsman’s plot presenting the relationships between waste depth (m), VS (%), TS (%), paper and fines (P+F) composition (%), sCOD (mg 2
L-1
), biogas production (L kg-1
waste) and CH4 production (ml g-1
VS-1
). 3
20
40
60
VS
40
50
60
70
80
TS
20
40
60
80
% o
rgP
20
40
60
Bio
gas
1000
2000
3000
4000
sC
OD
20
30
40
50
60
MC
10
20
30
CH
4
5 10 15 20 25
depth20 40 60
VS40 50 60 70 80
TS20 40 60 80
% orgP20 40 60
Biogas1000 2000 3000 4000
sCOD20 30 40 50 60
MC
% P
+F
% P+F

26
4
5
Figure 7: Correlation between the BMP and EHT values across the seven landfill sites. 6
7
y = 0.0274x - 0.0006 R² = 0.9452
0.000
0.001
0.002
0.003
0.004
0.005
0.006
0.007
0.008
0.009
0.010
0.00 0.05 0.10 0.15 0.20 0.25 0.30 0.35 0.40
BM
P -
Bio
gas
L g-1
sam
ple
EHT - Biogas L g-1 sample
LFS7
LFS4.2
LFS3
LFS2
LFS1 LFS6

27
Table 1: Background information on the tested landfill sites 1-7 8
Landfill site Age of landfill site (as of
2015) (years)
Status of landfill (as of
2015) Capacity of site (Mt) Tonnage received per year (kt year
-1)
LFS 1 35 Closed 5.8 200-300
LFS 2 23 Open 6.6 300
LFS 3 22 Open 4.2 200-250
LFS 4 19 Closed 5.0 200-250
LFS 5 8 Open 0.9 100
LFS 6 35 Open 1.4 50
LFS 7 7 Closed 1.1 100-150
9
Table 2: Characteristics of the enzymatic mixtures used during the EHT test 10
Enzymatic
mixture
Enzyme
supplier Weight per sample (mg) Concentration (U/mg)
Units
(U/mg solid)
Cellulase Sinobios 2.67 300 800
Hemicellulase Sigma 133 1.5 200
11
12

28
Table 3: Physicochemical characteristics of the waste materials collected across the 7 LFS at the different depths 13
Site TS (%) VS (%) sCOD (mg.L-1) pH Moisture content (%)
0-9m 10-19m 20+ m 0-9m 10-19m 20+ m 0-9m 10-19m 20+ m 0-9m 10-19m 20+ m 0-9m 10-19m 20+ m
LFS 1 64 ± 10 55 ± 0 - 32 ± 17 14 ± 0 - 294 ± 154 792 ± 0 - 7.6 ± 0 8.3 ± 0 - 37 46 -
LFS 2 - 64 ± 12 56 ± 6 - 30 ± 11 32 ± 13 - 706 ± 0 688 ± 186 - 7.6 ± 1 8.3 ± 1 - 30 40
LFS 3 - 64 ± 10 68 ± 7 - 31 ± 14 24 ± 18 - 526 ± 113 226 ± 645 - 7.6 ± 0 7.8 ± 0 - 35 32
LFS 4.1 66 ± 11 65 ± 7 65 ± 0 18 ± 16 30 ± 17 12 ± 0 640 ± 983 689 ± 426 652 ± 42 7.1 ± 1 7.6 ± 2 5.7 ± 0 37 39 37
LFS 4.2 - 65 ± 3 60 ± 7 - 33 ± 16 29 ± 1 - 545 ± 394 543 ± 211 - 7.8 ± 0 7.3 ± 0 - 36 42
LFS 5 60 ± 6 56 ± 8 - 41 ± 9 42 ± 0 - 1290 ± 1328 647 ± 321 - 7.0 ± 0 7.3 ± 0 - 37 35 -
LFS 6 66 ± 11 65 ± 9 - 33 ± 13 33 ± 11 - 961 ± 638 642 ± 105 - 7.3 ± 1 8.0 ± 1 - 33 34 -
LFS 7 76 ± 5 73 ± 1 - 25 ± 10 24 ± 6 - 1126 ± 1227 219 ± 65 - 7.6 ± 1 7.8 ± 0 - 26 26 -
14
TS, VS, sCOD, pH and MC results are the average of all samples attained ± standard deviation (SD). Each sample was tested in triplicate except for 15
sCOD which was tested in duplicate. sCOD standard deviation is high due to waste heterogeneity across depths. 16
17
18
19
20
21