compositional and biogeochemical variations of sediments ... · the baker-martínez fjord system...
TRANSCRIPT
Accepted Manuscript
Compositional and biogeochemical variations of sediments across the terrestri-al-marine continuum of the Baker-Martínez fjord system (Chile, 48°S)
Lorena Rebolledo, Sebastien Bertrand, Carina B. Lange, Fabian J. Tapia,Eduardo Quiroga, Matthias Troch, Nelson Silva, Paola Cárdenas, Silvio Pantoja
PII: S0079-6611(18)30048-XDOI: https://doi.org/10.1016/j.pocean.2018.12.004Reference: PROOCE 2045
To appear in: Progress in Oceanography
Received Date: 23 March 2018Revised Date: 30 November 2018Accepted Date: 10 December 2018
Please cite this article as: Rebolledo, L., Bertrand, S., Lange, C.B., Tapia, F.J., Quiroga, E., Troch, M., Silva, N.,Cárdenas, P., Pantoja, S., Compositional and biogeochemical variations of sediments across the terrestrial-marinecontinuum of the Baker-Martínez fjord system (Chile, 48°S), Progress in Oceanography (2018), doi: https://doi.org/10.1016/j.pocean.2018.12.004
This is a PDF file of an unedited manuscript that has been accepted for publication. As a service to our customerswe are providing this early version of the manuscript. The manuscript will undergo copyediting, typesetting, andreview of the resulting proof before it is published in its final form. Please note that during the production processerrors may be discovered which could affect the content, and all legal disclaimers that apply to the journal pertain.

PiO special issue “Integrative Research in High-Latitude Austral Systems: Linking Ecosystems and Society “
Guest Managing Editor: José Luis Iriarte
Compositional and biogeochemical variations of sediments across the terrestrial-marine
continuum of the Baker-Martínez fjord system (Chile, 48°S)
Lorena Rebolledoa,b,1, Sebastien Bertrandc,1, Carina B. Langeb,d,e,1, Fabian J. Tapiad,e, Eduardo
Quirogae,f, Matthias Trochc, Nelson Silvaf, Paola Cárdenasb,e,g, Silvio Pantojad,e
a Instituto Antártico Chileno, INACH, Plaza Muñoz Gamero 1055, Punta Arenas, Chile
b Centro de Investigación Dinámica de Ecosistemas Marinos de Altas Latitudes (IDEAL), Universidad
Austral de Chile, Campus Isla Teja, Valdivia, Chile
c Renard Center of Marine Geology, Ghent University, Krijgslaan 281 S8, 9000, Gent, Belgium
d Departamento de Oceanografía, Universidad de Concepción, Barrio Universitario, Concepción,
Chile
e Centro de Investigación Oceanográfica COPAS Sur-Austral, Universidad de Concepción, Barrio
Universitario, Concepción, Chile
f Pontificia Universidad Católica de Valparaíso, Escuela de Ciencias del Mar, Avenida Altamirano
1480, Valparaíso, Chile
g Postgrado en Oceanografía, Facultad de Ciencias Naturales y Oceanográficas, Universidad de
Concepción, Barrio Universitario, Concepción, Chile
1 These authors contributed equally to this paper.
Corresponding author: [email protected]
2
ABSTRACT
The Baker-Martínez fjord system (Chile, 48⁰S) is a transitional environment between the terrestrial
ecosystems of Patagonia and the SE Pacific Ocean. This unique setting makes it an ideal system to
evaluate land-ocean gradients in sediment composition and in a range of biogeochemical
variables. Here, we studied the composition and organic geochemistry of surface sediments
deposited in the Baker-Martínez fjord system to assess spatial changes in sediment properties and
identify the best tracers of terrestrial input. We determined concentrations in biogenic opal,
organic carbon, calcium carbonate, and lithogenic particles, and we measured diatom abundance,
bulk elemental and isotopic organic geochemistry, and n-alkanes distribution, on a series of
surface sediment samples distributed along two proximal-to-distal transects (one in the Martínez
Channel and a second one in the Baker Channel). Results reveal clear proximal-to-distal trends in
the proportion of freshwater diatoms and in the fraction of organic carbon of terrestrial origin
calculated from the bulk organic δ13C measurements. Diatoms are particularly sensitive to
freshwater input in proximal environments, whereas bulk organic geochemistry better reflects
terrestrial input over long distances across the fjord system. Other terrestrial proxies frequently
used in the literature, such as the N/C ratio and the n-alkane-based terrestrial/aquatic ratio, did
not show clear variations with distance from the fjord head. Our results suggest that the isotopic
composition of bulk organic matter (δ13Corg) and the relative proportion of diatoms of freshwater
origin are the best-suited proxies to estimate past changes in terrestrial input from fjord sediment
archives, irrespective of the glacial status of the fjord and its watershed.
KEYWORDS: Chilean fjords, sediment composition, organic geochemistry, carbon stable isotopes,
n-alkanes, diatoms

3
1. Introduction
The Chilean fjords (41–55°S) constitute a dynamic estuarine system characterized by sharp
gradients in salinity, aquatic productivity, and suspended sediment concentrations (Aracena et al.,
2011; Sepúlveda et al., 2011; Silva et al. 2011; Vargas et al., 2011). Due to their location at the
interface between marine and terrestrial environments, they rapidly respond to changes in
continental and marine conditions alike (Sepúlveda et al., 2011; Bertrand et al., 2012b).
High freshwater and detrital inputs from Patagonian rivers and calving glaciers result in a
water column that is typically highly stratified with variable amounts of suspended solids (Silva et
al., 1998; González et al., 2013; Marín et al., 2013; Quiroga et al., 2016). During the productive
season, the fjords can also efficiently export carbon to the sediments, and therefore act as an
efficient CO2 sink (Sepúlveda et al., 2011; Torres et al., 2014; Smith et al., 2015). As a result,
Patagonian fjord sediments are increasingly used to reconstruct past changes in river discharge
(Bertrand et al., 2014; Rebolledo et al., 2015), glacier variability (Kilian and Lamy, 2012; Bertrand
et al., 2014, 2017), coastal ocean temperature (Sepúlveda et al., 2009; Caniupán et al., 2014), and
marine productivity (Rebolledo et al., 2008; Mayr et al., 2014; Aracena et al., 2015).
In recent years, the Baker-Martínez fjord system (48⁰S) has been the focus of several studies,
encompassing zooplankton community dynamics and along-fjord changes in estuarine circulation
(Meerhoff et al., 2013, 2014, 2015, 2018); internal tides related to river discharge pulses (Ross et
al., 2014); productivity changes in the water column (González et al., 2013); and benthic diversity
patterns and trophic structure (Quiroga et al., 2012, 2016). Seasonal changes in river outflow, for
example, have been shown to force the along-fjord displacement of salinity and turbidity fronts,
influencing plankton and benthic patterns (Meerhoff et al., 2014; Quiroga et al., 2016). Likewise,
the warming of subsurface waters along the Martínez Channel in summer and autumn has been
linked to intrusions of warmer water from the Gulf of Penas (Aiken, 2012; Moffat et al., 2018).
4
Semidiurnal internal tides in the Martínez Channel near the pycnocline were also shown to
correlate with high discharge pulses of the Baker River (Ross et al., 2014). In addition, turbidity in
Baker Fjord is increasingly affected by Glacial Lake Outburst Floods (GLOFs; Dussaillant et al., 2010;
Jacquet et al., 2017), which supply high volumes of freshwater with high suspended loads (Marín
et al., 2013). So far, very few studies have focused on the spatial patterns in the composition of
the sediments deposited along the Baker-Martínez fjord system.
In other Patagonian fjords, sediment carbon stable isotopes have provided reliable
information about the sources of organic matter (e.g., Sepúlveda et al., 2011; Silva et al., 2011;
Vargas et al., 2011; Lafon et al., 2014; Mayr et al., 2014), and long-chain n-alkanes have been used
as proxies for the provenance of terrigenous inputs (Pinto and Bonert, 2005; Sepúlveda et al.,
2011; Placencia et al., 2017). Additionally, biogenic opal and marine diatoms preserved in fjord
sediments have proven to be reliable proxies of changes in siliceous phytoplankton export
production (e.g., Rebolledo et al., 2005, 2015; Sepúlveda et al., 2005; Aracena et al., 2011), and
increases in the contents of freshwater diatoms in sediments have been related to periods of high
precipitation and river discharge (Rebolledo et al., 2015).
With this in mind, the main goal of this study was to evaluate the spatial distribution of
sedimentological and biogeochemical proxies, as well as diatom abundance and species
composition, of surface sediments from the Baker-Martinez fjord system to test their application
for paleoclimate and paleoenvironmental reconstructions in a region that appears to be
particularly sensitive to climate change. Since the Baker-Martinez fjord system is one of the few
Patagonian systems directly open to the Pacific Ocean, it has the advantage of covering the entire
continuum of terrestrial to marine conditions, making our results applicable to investigate
sediments deposited under different environmental conditions in the past.

5
2. Study area
The Baker-Martinez fjord system is a ~150 km long, W-E oriented basin that connects the
glaciated Patagonian Andes to the east with the SE Pacific Ocean to the west through the Gulf of
Penas (Fig. 1). It is located between the Northern and Southern Patagonian Icefields (NPI and SPI)
and it comprises two main channels: Martínez to the north and Baker to the south (Fig. 1). The
fjord system has a complex bathymetry with shallow depths (<50 m) at the head near the town of
Tortel and deep basins of more than 1000 m in the middle of Baker Channel (Fig. 2, top panel).
This system formed during the last deglaciation when the ice masses extended to the Pacific
Ocean and it is thought to have reached its present-day configuration after the separation of the
Patagonian Ice Sheet into the NPI and SPI approximately 8000 years ago (Glasser et al., 2016).
The Baker-Martinez fjord system is almost entirely fed by two large rivers: Baker (mean
discharge ~1100 m3/s) and Pascua (~750 m3/s), which originate from the large lakes General
Carrera and O’Higgins, respectively (Fig. 1). The discharge of Baker and Pascua rivers is highest in
austral summer (December–March), i.e., during the snowmelt season, and lowest in winter. This
hydrological regime may be defined as nival with glacial contributions (e.g., Lara et al., 2015).
Additionally, the channels receive freshwater from Steffen Fjord, which is fed by meltwaters from
Steffen Glacier (the third largest glacier of the NPI; Willis et al., 2012) via Huemules River, and
from the calving Jorge Montt Glacier (the northernmost SPI glacier) (Fig. 1). The latter has
experienced a rapid retreat during the last decade, with a rate of almost a kilometer per year
(Rivera et al., 2012).
Circulation studies based on ADCP deployments and CTD measurements have shown that the
circulation in the area corresponds to a typical two-layer estuarine system, with maximum surface
velocities that can reach up to 20 cm s-1 in summer (Cáceres, 2007; Ross et al., 2014, 2015). Tides
are mixed, mainly semidiurnal with amplitudes of 1 m (Ross et al., 2015), and wind velocities are

6
controlled year-round by the strength of the southern westerly winds (SWW). Modeling studies
have shown that regional wind forcing is a key factor explaining the circulation and hydrography of
the Gulf of Penas and Baker Channel (Aiken, 2012), including the modulation of warm water
intrusions into proglacial fjord Jorge Montt (Moffat, 2014; Moffat et al., 2018).
Although data on primary productivity in this region are scarce, they reveal low values of 91
mg C m-2 d-1 near Caleta Tortel (Aracena et al., 2011) and 650 mg C m-2 d-1 in Steffen Fjord (Jacob et
al., 2014). Pico- and nano-plankton dominates at inner sites, whereas a dominance of chain-
forming diatom genera (i.e., Thalassiosira, Chaetoceros, Skeletonema) is observed in outer, more
oceanic sections of the fjord. During spring, high loads of suspended sediments (42−105 mg/L in
the Martínez Channel; Marín et al., 2013) dramatically increase the surface attenuation of incident
light, which may limit primary productivity (e.g., González et al., 2013; Quiroga et al., 2016).
The region’s climate is maritime hyperhumid, with highest precipitation between May and
August (late fall and winter), and a mean air temperature of 8.9°C (Hijmans et al., 2005).
Vegetation cover in the Baker and Pascua river basins consists of evergreen and deciduous native
forests, shrublands, and peatlands (Luebert and Pliscoff, 2006; Rodríguez et al., 2008). Barren land
is located above the treeline. All prominent species use the C3 photosynthetic pathway (Powell
and Still, 2009). In the vicinity of Caleta Tortel, located next to the Baker River mouth, the
vegetation is dominated by Nothofagus, shrubs, and ferns. Anthropogenic disturbances consist of
logging by rural landowners, overgrazing by livestock, and road construction, which are promoting
biological invasions in the forests of the Baker River basin (Vidal et al., 2011).
3. Material and methods
3.1 Hydrographic data collection
7
Sixteen vertical CTD profiles were acquired in the Baker-Martinez fjord system (Fig. 2) during
the COPAS Sur-Austral 2014 campaign (October 2014), using a Seabird SBE model 25 CTD with a
sampling frequency of 8 Hz and average descent rate of 1 m s-1. The CTD profiles included
temperature, salinity, oxygen concentration, turbidity and fluorescence, down to a maximum of
447 m (station 14; Fig. 2). The same stations were revisited in October 2015 (spring), and January
and March 2016 (summer) to capture temporal variability in the spatial structure of hydrographic
variables during the productive season. The October 2015 survey was conducted using a different
CTD (RBR XR-620), with a sampling rate of 6 Hz. During post-processing, all CTD data were depth-
binned to obtain profiles with a vertical resolution of 1 m (i.e. 1 dbar).
To characterize temporal variability in salinity along the Martínez Channel, we used a set of
sub-surface salinity records gathered over one year (October 2012 through November 2013) at 5
points along the Martinez Channel. At each station, conductivity-temperature loggers (HOBO U24,
Onset Computer, USA) were deployed at depths that ranged between 1 and 2 m below mean
lower low water (MLLW). Salinity time series were obtained from conductivity data based on
calibration factors provided by the manufacturer. For each time step in the salinity record along
the Martinez Channel, linear interpolation was used to determine the along-fjord position of the
10 and 20 salinity contours. These values were later used to characterize the seasonal variability in
the position and strength of the surface salinity front.
3.2 Sampling
During the October 2014 campaign, water samples were collected at 11 stations with Niskin
bottles to measure chlorophyll-a (Chl-a) concentrations down to 30, 40, or 50 m depth, depending
on location (Table S1). Duplicate samples were frozen at -20° C prior to analysis by fluorometry
(Parsons et al., 1984). Chl-a values were integrated over the upper 30 m of the water column.
8
Vertical net tows (25 µm mesh) were used to collect phytoplankton samples from 0–15 m for
qualitative analysis at stations CO14-E3, E4, E5, E6, E8, and E13 (Fig. 1; Table S1). Observation of
phytoplankton samples was done at 400X magnification using a Zeiss Axio Scope A1 microscope
with phase contrast.
Surface sediment samples were collected during several campaigns carried out in the Baker-
Martinez fjord system and in Jorge Montt Fjord between 2008 and 2014: CIMAR 14 Fiordos
(October-November 2008; CF14), Jorge Montt 2013 (March and November 2013; Gu13), Martínez
Channel 2014 (March and August 2014; Qu14; Quiroga et al., 2016), COPAS Sur-Austral 2014
(October 2014; CO14), and CIMAR 20 Fiordos (November 2014; CF20) (Fig. 1; Table S2). A total of
53 surface sediment samples were obtained using box and Rumhor corers (0–1 cm) and grab
samplers. For each sampling location, we measured the distance from the nearest river or calving
glacier front using Google Earth (paths running through the center of the fjords). The spatial
distribution of the sedimentological and geochemical variables measured in the surface sediments
(Table S2) was visualized on maps made using Ocean Data View 4.7.10 (Schlitzer, 2017) and Global
Mapper 16.
In addition, living vegetation was collected near Caleta Tortel during the COPAS Sur-Austral
2014 campaign with the main goal of defining the terrestrial end-member of geochemical
parameters to be compared with the signal preserved in the surface sediments. This terrestrial
end-member was additionally constrained by a bulk river sediment sample (RS11-05) collected 8
km upstream of the outflow of Baker River.
3.3 Sediment composition
Fjord sediments are generally composed of variable mixtures of lithogenic particles, organic
matter, biogenic opal, and carbonates (Bertrand et al., 2012b). The relative contents of these four

9
sediment components were quantified according to the following methods.
Biogenic opal was estimated following the alkaline extraction procedure described by
Mortlock and Froelich (1989) and modified by Müller and Schneider (1993), which consists in
extracting 50 mg of sediment with NaOH at 85°C for 5 hours. Extraction and analysis by
molybdate-blue spectrophotometry were conducted at the laboratories of Marine Organic
Geochemistry and Paleoceanography, University of Concepción, Chile. Values are expressed as
biogenic opal after multiplication of the Si (%) values by 2.4 (Mortlock and Froelich, 1989).
Analytical precision was ± 0.5%.
The weight percentage of total inorganic carbon (TIC) was determined using an UIC CM5017
coulometer equipped with a CM5330 acidification module at Ghent University, Belgium. For each
sample, approximately 50 mg of sediment was precisely weighed into a glass flask and treated
with 5 ml 2N H3PO4 to release CO2. This method assumes that 100% of the measured CO2 is
derived from the dissolution of calcium carbonate. Calcium carbonate concentrations were
calculated as CaCO3 = TIC × 8.33. The detection limit was 0.03% CaCO3.
The bulk organic geochemistry of the sediments was measured in two different laboratories:
Bioanalytical laboratory, School of Biological Sciences, Washington State University, USA (most
samples), and Laboratory of Biogeochemistry and Applied Stable Isotopes (LABASI-PUC), Chile (the
11 samples from the CF14 cruise, and samples Qu14-E1Q and Qu14-E4Q). To determine organic
carbon (Corg) and total nitrogen (Ntot) contents, freeze-dried sediments were ground and acidified
(with 2N phosphoric acid at Bioanalytical laboratory and with HCl 2:1 v/v at LABASI) to remove
inorganic carbon. Corg and Ntot measurements were made on a Eurovector (Milan, Italy) elemental
analyzer at Bioanalytical laboratory, and on a Flash EA2000 elemental analyser at LABASI. Organic
matter (OM) was calculated from the Corg results as OM = Corg × 2.2 (Bertrand et al., 2012b).
10
The content of lithogenic particles (LP) was calculated as: LP = 100 % - CaCO3 - 2.2 × Corg -
biogenic opal, following Bertrand et al. (2012b).
3.4 Bulk organic geochemistry
Carbon (δ13Corg) and nitrogen (δ15N) stable isotopes were measured at the two laboratories
mentioned above. Most samples were measured at Bioanalytical laboratory using an elemental
analyzer coupled with an Isoprime isotope ratio mass spectrometer (IRMS), with a precision
±0.1‰ for δ13Corg and 0.3‰ for δ 15N. The running standard was a protein hydrolysate calibrated
against NIST standards. At LABASI, a Thermo Delta Advantage IRMS coupled with the Flash EA
2000 elemental analyser was used. Acetanilide, atropine, caffeine, glutamic acid, and high organic
sediment were used as internal standards. δ13Corg and δ15N were determined with a precision of
±0.18 and 0.2 ‰, respectively.
The vegetation samples collected near Caleta Tortel were analysed for Corg and Ntot
concentrations and stable isotopic composition at Bioanalytical laboratory, USA (Table S3). Prior to
analysis, samples were washed with distilled water, freeze-dried, and ground. About 1 mg of plant
tissue was put into a tin capsule and acidified with 2N phosphoric acid before analysis.
The <90 µm fraction of river sediment sample RS11-05 was isolated by dry sieving, and its bulk
organic geochemical composition was analyzed at the UCDavis Stable Isotope Facility after
acidification of the sample with 1N sulfurous acid. The precision, calculated by replicate analysis of
an internal standard, was 0.05‰ for δ13Corg and 0.08‰ for δ15N.
We used the δ13Corg of the sediment samples to estimate the relative contributions of
terrestrial and aquatic organic carbon (Meyers, 1997; Perdue and Koprivnjak, 2007; Sepúlveda et
al., 2011). The fraction of terrestrial Corg (fT) was calculated using a two end-member (linear)
mixing model (Thornton and McManus, 1994):
11
–
–
(1)
where δ13Corg sample, δ13Corg marine, and δ
13Corg terr are the isotopic values of the sample, terrestrial
end-member, and marine end-member, respectively. The end-member values used in this study
were determined on samples collected in fully marine and fully terrestrial conditions: -19.86‰ for
the marine end-member (site GeoB3323-4 on the continental margin off the coast of Northern
Chilean Patagonia; Hebbeln et al., 2000) and -27.72 ‰ for the terrestrial end-member (average of
five <125 µm sediment samples from rivers that discharge into the fjords; Bertrand et al., 2012b).
The latter value is supported by the δ13C composition of sediment sample RS11-05 <90 µm from
Baker River (-26.74‰). The proportion of marine organic carbon (ƒM) was calculated by difference
(100 % - ƒT). For three samples, the application of Eq. (1) provided ƒT values above 100, which were
then modeled to 100.
3.5 n-alkanes
Extraction of lipid biomarkers from sediments was carried out according to a modified Bligh
and Dyer (1959) protocol. Briefly, 0.3–2 g of freeze-dried samples (surface sediments and plant
tissues) were extracted by accelerated solvent extraction (Dionex ASE350) at high pressure (1500
psi) and high temperature (100 °C) with a mixture of dichloromethane and methanol (DCM:MeOH,
3:1 v/v). Column chromatography was applied to the total lipid extract using ca. 1g of silica gel as
stationary phase and successively 3/8 DV (Dead Volume) Hexane, 2 DV (DCM), 2DV DCM/EtoAC
(1:1) and 2DV DCM/MeOH (7:3) to elute the fractions containing hydrocarbons (F1), esters and
ketones (F2), sterols and alcohols (F3) and fatty acids (F4).
Samples for n-alkanes were analyzed on an Agilent 6890 GC series coupled to an Agilent 5972
mass spectrometer (MS), at the laboratory of Marine Organic Geochemistry, University of
12
Concepción, Chile. The chromatograph was equipped with a fused silica capillary column (30 m
length, i.d. = 0.25 mm HP5-MS, film thickness = 0.25 µm) and an automated injection system. The
GC oven temperature program was 80 °C to 130 °C at 20 °C min-1, and then to 310 °C at 4 °C min-1.
The MS was operated in electron impact mode (70 eV).
Long chain n-alkanes are important components of leaf waxes (Bianchi and Canuel, 2011). In
higher plants, n-alkanes show a predominance of molecules containing between 27 and 35 carbon
atoms, with a prevalence of odd- over even-numbered carbon chains (Eglinton and Hamilton,
1967). Aquatic sources such as algae and photosynthetic bacteria are dominated by C15, C17, and
C19. The shorter chain n-alkanes (C14−C25) are therefore mainly of algal phytoplankton origin (e.g.,
Eglinton and Hamilton 1967; Liu and Liu, 2016).
Three n-alkane-based indices were calculated as follows:
(1) The average chain length (ACL), i.e., the weight-averaged number of carbon atoms of
the higher plant C23-35 n-alkane, was calculated following Poynter et al. (1989):
ACL23-35 =
(2)
(2) The Carbon Preference Index (CPI) was calculated following Allan and Douglas (1977):
CPI =
(3)
(3) The terrigenous/aquatic ratio (TAR), which provides an estimate of the algal vs.
terrestrial organic matter, was calculated following Bourbonniere and Meyers (1996):
TAR =
(4)
ACL mostly reflects vegetation type (El Nemr et al., 2016), but it has also been shown to reflect
temperature, humidity, carbon assimilation pathway (C3 vs. C4), and the woody vs. non-woody
13
nature of the plants (Bush and McInerney, 2015). In paleo-studies, ACL is generally used as a
climate proxy, based on the observation that, on average, plants in forests form shorter chains
than grassland leaves (Cranwell, 1973). Likewise, in warmer climates, plants tend to produce
longer chains of n-alkanes (Jeng, 2006).
CPI and TAR have been used to estimate the source of OM in sediments. CPI values >5 are
indicative of n-alkanes derived from terrestrial sources, i.e., land-plants, which have a
predominance of odd-numbered carbon chains (Eglinton and Hamilton, 1963; Hedges and Prahl,
1993), whereas values 1.0–1.2 and < 1.0 reflect marine plankton (Corner, 1979) and petrogenic
inputs (Pendoley, 1992), respectively. However, it is worth noting that marine plankton does not
affect bulk CPI values much since plankton mostly produces short-chain n-alkanes (Rosell-Melé
and McClymont, 2007). In addition, CPI may reflect the state of degradation of organic matter
because the odd-even preference tends to decrease with diagenesis (Bianchi and Canuel, 2011).
TAR values reflect the ratio of vascular land plants over aquatic sources (Bourbonniere and
Meyers, 1996; Meyers, 1997). The absolute values may however be affected by selective
biodegradation (Peters et al., 2007).
3.6 Siliceous microorganisms
For siliceous microorganisms (mainly diatoms but also including sponge spicules,
silicoflagellates, and chrysophyte cysts), 0.5 g of freeze-dried sediment of each sample was
oxidized using a mix of 30% hydrogen peroxide, sodium pyrophosphate, and hydrochloric acid to
remove organic matter, clays, and carbonates, respectively. 0.2 ml of clean sample was deposited
onto a cover slip, air-dried, and mounted with Naphrax mounting medium (refraction index = 1.7).
Two permanent slides per sample were prepared in this fashion and observed under a Zeiss Axio
Scope A1 microscope with phase contrast at 400× and 1000×. Siliceous microorganisms were

14
counted on transects on microslides covering 1/2 or 1/5 of the slide, following counting
procedures of Schrader and Gersonde (1978). Concentrations are expressed as numbers per gram
dry weight (i.e., diatom valves g-1). Diatoms were determined to the lowest taxonomic level
following Cupp (1943), Rivera (1981), Hasle and Syvrtsen (1996), Sims (1996), and Witkowski et al.
(2000). Diatoms were grouped by ecological affinity into the following categories (based on Cupp
(1943), Round et al. (1990), Sims (1996), Witkowski et al. (2000), and Romero and Hebbeln (2003);
Table S4): high nutrient (HN), coastal planktonic (CP), warm water (WW), cold water (CW), marine
benthic (MB), and freshwater (FW). Laboratory and microscopy work was carried out at the
Paleoceanography laboratory, University of Concepción, Chile.
3.7 Statistical analysis
To identify the combination of variables that are most influential in terms of hydrographic
structure along the fjord, Principal Component Analysis (PCA) was applied to 0–20 m depth
averages of the four main variables (temperature, salinity, turbidity, and fluorescence) measured
during the CTD surveys of October 2014, October 2015, January 2016, and March 2016. A second
PCA (Spearman; XLStat 2016.01) was performed on the following 14 sediment variables: distance
from the nearest river mouth/calving glacier front, biogenic opal, Corg, CaCO3, lithogenic particles
(LP), N/C molar ratio, δ13Corg, δ15 N, total diatoms, total n-alkanes, ACL, CPI, TAR, and the
proportion of freshwater diatoms. Spearman PCA is preferred over Pearson PCA because
Spearman evaluates the monotonic, instead of linear, relationship between variables. The same
software was used to calculate Pearson correlation coefficients and p-values (two-tailed test of
significance) between variables. Correlations at p < 0.01 were considered significant.
4. Results

15
4.1 Water column
Surface water temperature in the Baker-Martinez fjord system in October 2014 ranged from
3.9 to 10.4°C, with a progressive warming towards the outer section of the channels (Fig. 2). The
warmest waters were found at ~50 m depth. The lowest salinity values (< 3 PSU) were observed
within the upper water column (0–5 m) at inner-fjord stations of the Baker-Martinez fjord system,
i.e., close to the mouths of Baker and Pascua rivers (Fig. 2). This low-salinity layer became thinner
towards the west, where it reached less than 3 m. Overall, salinity fluctuated widely between 1
and 33.4 PSU, with the highest values occurring in the deepest waters. Dissolved oxygen ranged
from 8.2 mL/L in surface waters to 3.2 mL/L at depth. No anoxic/hypoxic waters were detected
during the survey. Turbidity was higher in the upper water column, with the highest values
occurring in the colder surface water, especially near river mouths and calving glaciers. Turbidity
was lower at the outer fjord stations, where it fluctuated between 1.0 and 24.6 NTU. Surface
turbidity was 10x higher at inner and glacier sites than at more oceanic sites (Fig. 2). Fluorescence,
which is often used as a proxy for phytoplankton biomass, was essentially limited to the upper 20–
25 m of the water column, and showed a clear increase towards the outer part of the fjord system,
especially in Baker Channel (Fig. 2).
The PCA of the CTD data (Fig. 3) showed high positive covariance between fluorescence and
salinity, which covaried negatively with turbidity. Our analysis also indicated that fluorescence and
temperature were practically independent.
Concentrations of Chl-a integrated over the upper 30 m of the water column ranged between
8.3–92.5 mg Chl-a m-2 in the Martínez Channel and 11.5‒114.3 mg Chl-a m-2 in the Baker Channel
(Fig. 4a; Table S1). In both channels, the lowest values occurred in the most proximal
environments.
16
Twenty-five diatom taxa were recorded in the net tows of the six stations that were sampled.
Among them, chains of the genera Chaetoceros, Pseudo-nitzschia, Skeletonema, and Cerataulina
pelagica, and colonies of Thalassionema nitzschioides were commonly observed. Inner fjord
station E13 was the least diverse in terms of the numbers of diatom taxa (only 7 taxa were
observed; Table S5).
4.2 Bulk sediment composition
Throughout the Baker-Martinez fjord system, organic matter contents varied between 0.35
and 9.09 wt. %, biogenic opal contents ranged from 1.1 to 10.2 wt. %, and CaCO3 concentrations
were always below 0.3 wt. %, except at some outer fjord locations where they reached up to 2.4
wt. % (Fig. 5a-c; Table S2). The highest contents in organic matter, biogenic opal and CaCO3 all
occurred toward the outer section of the fjord system. In contrast, the lithogenic particle
concentrations were high along the entire fjord system (84.8–97.2 wt. %), with peak values
occurring near the Baker River mouth and Steffen Fjord (Fig. 5d). Station CO14-E6 in the outer
section of Martinez Channel (Fig. 1) contained high amounts of mollusk fragments, which explains
the particularly high CaCO3 concentrations (16.9%; Table S2). This station was therefore
considered as an outlier.
4.3 Bulk organic geochemistry
Corg is generally low along Martínez and Baker channels (<0.75%), with the lowest value
(0.16%) being recorded at station Gu13-E2, near Jorge Montt Glacier. Higher values (>1%) were
only reached towards the marine end of the fjord system (Fig. 6a). An exceptionally high value of
4.4% was observed at shallow station Qu14-E4Q (Fig. 6a). In general, the N/C values fell within the
range 0.08–0.20, with lower values at inner-fjord sites and near river mouths than towards the
17
open coast (Fig. 6b). Significantly higher N/C values (average: 0.2–0.5) were however observed in
glacial fjord Jorge Montt sediments, where samples have extremely low Corg contents (< 0.3 %;
Table S2; Figs. 6a, b).
Sedimentary stable isotopes of organic carbon (δ13Corg) showed depleted values (-25 to -29‰)
at mid- and inner fjord locations (e.g., heads of Baker and Martinez channels, and proglacial fjord
Jorge Montt) compared to sediments toward the outer fjords and in the Gulf of Penas (-21 to -
23‰, Fig. 6c). The proportion of terrestrial organic carbon varied between 15 and 100% and
obviously followed the same pattern as δ13 Corg (Fig. 6d).
4.4 n-alkanes
We compared the n-alkane composition of sediment samples from the Baker-Martinez fjord
system with living vegetation recovered near Caleta Tortel (Fig. 7, Table S3). n-alkanes of chain
length between C16 and C37 were recorded from trees, shrubs, and fern leaves (n=8) with total
concentrations varying from 1246 to 6073 µg g dw-1 (Figs. 7a and S1; Table S3). A marked
dominance of odd- over even-numbered n-alkanes was observed (Figs. 7a and S1). In sediments,
total n-alkane concentrations varied from 0.9 to 50.5 µg g dw-1 (Fig. 7b, Table S2) with chain
lengths between n-C14 and n-C38 (n=37) and a prevalence of odd- over even-numbered carbon
chains (Fig. 7b).
When comparing results from living vegetation with surface sediments (Fig. 7), it is evident that
the total concentration of n-alkanes preserved in the sediments is ~3 orders of magnitude lower
than for living vascular plants, which is consistent with the low sediment TOC values. Although
both exhibit a similar pattern in the odd- over even-numbered carbon prevalence, the pattern was
better expressed in the living vegetation.

18
For sediments, the ACL23–35 ranged from 27.9 to 29.5, with no clear spatial trend, although the
three lowest values were all located in the central part of the Baker-Martínez fjord system (Fig. 8a;
Table S2). The values for modern vegetation were similar (27.7–29.5), except for the shrub
Berberis ilicifolia (26.9) (Fig. S1, Table S3). CPI in surface sediments varied between 1.0 and 7.5
(Fig. 8b; Table S2), indicating a predominantly terrestrial source, and the values were positively
correlated with ACL (r=0.58; p< 0.001). For the vegetation samples, CPI ranged from 9.1−46.3, with
the most extreme value (46.3) being again associated with B. ilicifolia (Fig. S1, Table S3). TAR
values were high and particularly variable throughout the study area. They ranged from 2.7 to 18.7
in the middle and outer sections of the Baker-Martínez fjord system, and from 3.1 to 132.1 near
rivers and in glacial fjords (Fig. 8c, Table S2).
4.5 Siliceous microfossils
The analysis of siliceous microfossils in the surface sediment samples (Table S2) revealed a
dominance of diatoms, composing >99 % of the total siliceous assemblages. Sponge spicules,
silicoflagellates, and phytoliths were rare. The lowest diatom abundances were observed in glacial
fjord Jorge Montt (4 × 10³ to 1.2 × 10⁴ valves gdw-1), in contrast to outer fjord stations where peak
values were recorded (2 × 10⁷ valves gdw-1 at station Qu14-E3Q) (Table S2). There was a significant
positive correlation between diatom abundance and biogenic opal values (r= 0.64, p<0.001).
Resting spores of the genus Chaetoceros (C. radicans/cinctus, C. coronatus, C. didymus, C.
diadema, C. debilis) accompanied by Thalassionema nitzschioides and Skeletonema japonicum,
represented almost 50% of the total diatom assemblage. Other diatom groups were also recorded:
coastal planktonic (Thalassiosira eccentrica, T. oestrupii, T. angulata, Rhizosolenia setigera f.
pungens); tycopelagic and benthic (Paralia sulcata, Cocconeis costata, Cocconeis pacifica); and
freshwater (e.g., resting spores of Chaetoceros muellerii, and several species of the genera
19
Tabularia, Fragilaria, Frustulia, Cymbella, Navicula, and Synedra) (Table S4). The contribution of
the freshwater group to the total diatom assemblage fluctuated from 3.2 to 100%; it was the most
abundant group in Jorge Montt fjord sediments and at stations close to the Baker and Pascua
rivers (Fig. 8d, Table S5). Low values were observed at outer sites.
4.6 Principal component analysis of sediment variables
The PCA of the 14 sediment variables showed that the first two principal components explain
68 % of the total variance (Fig. 9). PC1 accounts for 51% of the total variance and the variables
with the highest F1 loadings are diatom abundance (0.96), proportion of freshwater diatoms (-
0.91), δ13C (0.87), distance from the nearest river mouth/calving glacier front (0.80), and
proportion of lithogenic particles (-0.80).
5. Discussion
5.1 Spatial and temporal variations in fjord productivity
Depth-integrated (0−30 m) Chl-a values in spring 2014 (October) ranged from 8 to 114 mg Chl-
a m-2 (Fig. 4a; Table S1) with average values of 42 mg m-2 in Martínez Channel and 49 mg m-2 in
Baker Channel. The low depth-integrated values at COPAS station CO14-E1 near Tortel and at the
mouth of glacial fjord Steffen are comparable to those measured by Jacob et al. (2014) in the same
area. Similarly low values were observed at the head of Baker Channel, near the mouth of Pascua
River (Fig. 4a). In both cases, these low values correspond to sites with particularly low surface
salinities and with the highest suspended sediment concentrations (Fig. 2), in agreement with
González et al. (2013) and Quiroga et al. (2016), suggesting that primary production in the Baker-
Martínez system is limited by low light availability due to abundant suspended sediments in the
water column. This is also in agreement with the regional-scale results of Jacob et al. (2014), who
20
suggested that, in addition to low photosynthetically available radiation south of 46°S, low light
availability due to suspended detritus in the water column − particularly at sites with high
freshwater inputs of glacial origin − might limit primary production to the upper 15 m of the water
column.
In contrast to the inner-fjord sites, Chl-a estimates were particularly high at the outermost
sites during our spring 2014 survey (Fig. 4a, Table S1), in agreement with the summer 2015
(January) observations of Quiroga et al. (2016). This however contrasts with the pattern observed
by Quiroga et al. (2016) in winter 2014 (August), when Chl-a concentrations were overall lower,
and when the highest values occurred at mid-fjord locations in the Martínez Channel.
The clear covariance between fluorescence, which is commonly used as a proxy for
phytoplankton biomass, and salinity in the upper 20m of the water column over a 3-year period
(Fig. 3) suggests that salinity can be used to estimate the position of the productivity front across
the Baker-Martínez fjord system. This is in agreement with both published and unpublished
hydrographic observations for the study area (Meerhoff et al. 2014, Quiroga et al. 2016, Tapia et
al., submitted), which point to a correspondence between the surface salinity front – with
salinities changing rapidly from <10 to >20 PSU – and maximum chlorophyll-a values, which in all
likelihood correspond with areas of greater carbon fluxes from the water column to the fjord
sediments. In Martínez Channel (Fig. 4b), low salinities reached their westernmost position in
December-February (austral summer), which are the months of maximum freshwater discharge
from the Baker river. In fact, the distance between median positions of the 10 and 20 salinity
contours in January-February (Fig. 4b) point to a sharp surface salinity gradient in these months,
due to the high freshwater discharge associated with glacier melting. The other time of the year
when these two contours are close to each other is the month of October, when river influence
reaches its lowest point – due to minimal freshwater discharge in early spring – and marine
21
conditions are most influential (Fig. 4b). Considering that chlorophyll-a tends to significantly
increase seaward of the 10–20 PSU salinity front, the fjord section where productivity increases
significantly should be located between stations 4 and 5 through fall-winter, and farther out
(between stations 5 and 6) in the late spring and summer months (Fig. 4b).
5.2 Water column–surface sediments comparison
The spring-summer pattern of “inner fjord: low Chl-a – outer fjord: high Chl-a” was also
reflected in the Chl-a values measured in surface sediments by Quiroga et al., 2016. Interestingly,
our diatom abundance estimates in the sediments of the Baker-Martinez fjord system seem to
reflect the same pattern (Table S2).
The qualitative diatom analysis of phytoplankton net tows (0‒15 m) yielded 25 taxa (Table S5)
that are common members of the spring micro-phytoplankton assemblage in Patagonian fjords
and channels between ~47°S and 50°S (González et al., 2013). However, there is a striking
difference in the composition of the diatom assemblage present in the water column with the one
preserved in the sediments (Table S5), which was dominated by the robust resting spores of the
genus Chaetoceros. In contrast, the fragile frustules of i.e., Pseudo-nitzschia, Cerataulina, and
Chaetoceros vegetative cells were a minor or missing component of the surface sediments.
Unfortunately, we do not have measurements in the area to be able to discern among the various
factors (grazing, bottom currents, erosion, lateral advection; e.g., Sancetta and Calvert, 1988;
Muñoz and Wellner, 2016) that may have affected and modified the assemblages either in the
water column or at the water/sediment interface.
Freshwater diatoms were only recorded in sediments (ca. 30% of total assemblage on
average), mostly at sites near rivers and glacier fronts (Fig. 8d). We did not observe any freshwater
diatoms in the water column (Table S5), suggesting that freshwater species sink rather rapidly
22
after being discharged by rivers, and/or that the river supply of freshwater diatoms is seasonal (no
significant production of freshwater diatoms in spring). Because freshwater diatoms are washed
into the fjord environment from the continent (mainly by rivers), they should however constitute a
good proxy to reconstruct changes in terrestrial input, as suggested by the significant negative
covariance between the proportion of freshwater diatoms and distance from river mouths/calving
glacier fronts (Fig. 9).
5.3 Variations in sediment composition
Our biogenic opal values (1.1–10.2%; Fig. 5) extend the range of data previously given by
Aracena et al. (2011) for our study area and are in agreement with the ones reported by Silva et al.
(2009) and Bertrand et al. (2012b) for the fjords of northern Chilean Patagonia (1.4−12.6% and
1.9–17.7%, respectively). Spatial distribution of Corg in the surface sediments follows that of
biogenic opal (r=0.72; p<0.001) and diatoms (r=0.50; p<0.01), with the lowest values observed at
stations near glacial fjords and the highest values occurring in the seaward section of the Baker
and Martínez channels (Fig. 5; Table S2). Carbonate contents are about an order of magnitude
lower than opal values, providing evidence that the main producers in the Baker-Martinez fjord
system are silica-based organisms.
The similarity of trends in Corg, biogenic opal, and, to a lesser extent, carbonate contents seems
to largely reflect dilution by lithogenic particles, which are supplied by rivers and calving glaciers.
This is also clearly illustrated in Figure 9, where biogenic opal, carbonate and Corg concentrations
have clear positive PC1 loadings, whereas lithogenic particles are clearly negatively loaded.
Comparing biogenic silica and carbonate productivity between sites would therefore require
measuring accumulation rates at each site, which is beyond the scope of this study. These results

23
also imply that identifying variables of terrestrial input and productivity should focus on indicators
that are independent of accumulation rates.
5.4 Sources of sedimentary organic matter
The sediments of the Baker-Martinez fjord system are characterized by variable amounts of
terrestrial and marine organic matter. In sedimentary environments, bulk N/C and δ13C have been
equally used to estimate the proportions of terrestrial and marine organic matter since terrestrial
vegetation is characterized by lower N/C and δ13C than marine organic matter (Meyers, 1997;
Perdue and Koprivnjak, 2007). Both approaches have been successfully applied to modern and
Holocene sediments from the Chilean fjords (e.g., Sepúlveda et al., 2009, 2011; Rebolledo et al.,
2008; Silva et al., 2011; Bertrand et al., 2012a, 2012b, 2014, 2017; Lafon et al., 2014), for which
regional end-member values have been defined (terrestrial N/C = 0.0624, δ13C = -27.72‰, and
marine N/C = 0.130, δ13C = -19.86‰; Sepúlveda et al., 2011; Bertrand et al., 2012b). In the Baker-
Martinez system, both variables decrease towards the open ocean (Fig. 6b, c; see also the lower
density results of Quiroga et al., 2016), as they do for fjords in northern Patagonia (Silva et al.,
2011).
N/C values measured in the sediments of proglacial fjord Jorge Montt and in the prodeltas of
Pascua and Baker rivers are much higher than expected for proximal environments (Fig. 10). This is
likely due to the combination of very low TOC (~0.2%) in proglacial environments and the
abundance of inorganic nitrogen bound to glacial clays (Kumar et al., 2016), resulting in
particularly high N/C values that cannot be directly used to infer organic matter sources.
Additionally, the relatively high abundance of cyanobacteria (mostly Synechococcus) in Jorge
Montt Fjord (Gutiérrez et al., 2015) may contribute to the high N/C ratio since Synechococcus is
known to efficiently fix nitrogen in proglacial environments (Zhu et al., 2016). This contrasts with
24
sites that are not directly affected by glacial clay input, where N/C and δ13C are positively
correlated (Fig. 10), although glacial clays likely influence N/C values throughout the entire fjord
system since Baker and Pascua rivers, as well as Jorge Montt Glacier, are the main sources of
sediment to this fjord system. In the (non-glacial) fjords further to the north, the fraction of
terrestrial carbon calculated from N/C and δ13C is highly correlated (r=0.94, p < 0.001; Bertrand et
al., 2012b). These observations suggest that δ13C is better suited than N/C to calculate the fraction
of terrestrial carbon in fjord sediments, as it is independent of the fjord’s glacial status.
The TAR ratio for all studied locations was >>1, which can be interpreted as a predominantly
terrestrial origin of the n-alkanes throughout the Baker-Martínez fjord system (Bourbonniere and
Meyers, 1996), in agreement with the observation that the highest TAR values are found close to
rivers and in glacial fjords (Fig. 8c). This interpretation of the TAR values is, however, in
contradiction with the quantification of terrestrial vs. aquatic sources of organic carbon based on
δ13C (Fig. 6d), which shows that terrestrial organic carbon only dominates in the most proximal
environments. The likely reason behind this discrepancy is that land-plant organic matter typically
contains more n-alkanes than marine organic matter, resulting in a disproportionate weight
assigned to land-plant input (Peters et al., 2007). This bias is also likely responsible for the lack of
significant correlation between TAR and δ13C (r=-0.347, p=0.028).
The ACL values measured in our surface sediment samples all fell between 27.9 and 29.5, and
the three lowest values occurred in the central part of the Baker-Martínez fjord system (Fig. 8a).
The lack of a significant relation with distance from river mouths/calving glacier fronts (Fig. 9)
reflects the relatively homogenous nature of the evergreen vegetation along the fjord system
(Luebert and Pliscoff, 2006), and the absence of significant tributaries in the western and central
part of the fjord system, which is also the case for fjords further north (Sepúlveda et al., 2011). The
presence of the lowest ACL values (27.9–28.2) in the central part of the fjord may reflect the

25
particularly high precipitation that occurs on the western slope of the Andes immediately to the
west of the icefields (Garreaud et al., 2013; Lenaerts et al., 2014). Likewise, the high CPI values
indicate that the long-chain n-alkanes are predominantly derived from terrestrial sources, i.e.,
land-plants, suggesting a low contribution of petrogenic carbon to the fjord sediments, in
agreement with the granitoid nature of the regional bedrock (Sernageomin, 2003). The significant
correlation between CPI and ACL (r=0.58; p<0.001) results from the fact that both indexes are
obtained using n-alkane from higher plants (Jeng, 2006).
5.5. Proxies for terrestrial input
Several of the proxies analyzed here are designed to reflect terrestrial input: the N/C molar
ratio, δ13Corg, TAR, and the proportion of freshwater diatoms. All of them are independent of
accumulation rates. In this section, we compare the capability of these indicators to reflect the
terrestrial-to-marine gradient that occurs in the Baker-Martinez fjord system in order to identify
the best proxies for terrestrial input. To do so, we represent their variations with distance from
the river mouths/calving glacier fronts (Fig. 11). Distance is a good indicator of terrestrial input, as
most of the sediment is transported in the upper freshwater lens, making sediment transport
independent of variations in bathymetry (Fig. 2).
As discussed in the previous section, δ13Corg is much more appropriate than N/C to calculate
the proportions of terrestrial and aquatic organic carbon, mostly due to the significant influence of
lithogenic N on the N/C measurements. When looking at variations across the terrestrial-marine
continuum of our study area (Fig. 11), it is evident that the fraction of terrestrial organic carbon
calculated from the bulk δ13Corg measurements progressively decreases with distance from the
river mouth/calving glacier front (Fig. 11a). By comparison, N/C shows very little changes with
distance (Fig. 11b), confirming that the lithogenic N contribution renders the proxy inapplicable in

26
most of the fjord system. This is in contrast with the non-glaciated fjords of northern Chilean
Patagonia, where N/C and δ13Corg co-vary and can generally be used to estimate the proportion of
terrestrial organic carbon in sediments (Sepúlveda et al., 2010; Silva et al., 2011; Bertrand et al.,
2012b). These differences suggest that δ13Corg is much more universally applicable than N/C in
fjord environments to reconstruct variations in organic matter sources through space and time.
End-member mixing models for fjord sedimentary organic matter should therefore be based on
δ13Corg and not N/C. This observation also explains why differences were observed between the
fractions of terrestrial organic carbon calculated from δ13Corg and N/C measurements in sediment
cores from proglacial Chilean fjords (e.g., Bertrand et al., 2012a, 2017), and they suggest that the
discrepancies between the two variables may actually be used as an indicator of glacial activity.
Although the TAR values show a slightly decreasing trend with distance from the river
mouths/calving glacier front (Fig. 11c), the values remain high (~10) across the fjord system due to
land plants containing more n-alkanes than aquatic organic matter. Even at the most oceanic site,
which only contains 20% terrestrial organic matter, the TAR value is clearly terrestrial (7.8–15.2;
Fig. 11c). TAR is therefore rather insensitive to changes in terrestrial input, due to the signal being
almost entirely controlled by land plants. Its use in fjord sediments is therefore not recommended.
The distribution of freshwater diatoms in the sediments of the Baker-Martínez fjord system
reflects input from the continent (Fig. 8d). The major difference with the trend in the fraction of
terrestrial carbon (Fig. 11) is that freshwater diatoms quickly drop within the first 40 km of the
river mouths/calving glacier fronts, whereas the fraction of terrestrial carbon displays a gradual
decrease over the 180 km of the fjord transect. Further offshore than 40 km from river mouths
and calving glacier fronts, the proportion of freshwater diatoms remains relatively stable at ~20%,
suggesting that diatoms are most sensitive in proximal environments (Fig. 11d). Also, there seems
to be no major difference between proglacial and non-glacial fjords, making the freshwater diatom
27
proxy as usable as δ13C to reconstruct changes in terrestrial input, irrespective of the sources of
freshwater (river discharge/calving). The main advantage of this proxy is that it might be less
dependent on the evolution of terrestrial ecosystems (e.g., vegetation cover) than δ13C, making it
readily applicable on longer timescales. Due to its apparent insensitivity to terrestrial inputs at
mid- and outer-fjord sites, its use should be restricted to relatively proximal fjord environments.
Thus, it appears that δ13Corg and the proportion of the freshwater diatoms constitute reliable
proxies of terrigenous input in the Baker-Martínez fjord system. They are the best candidates to
reconstruct changes in river discharge and precipitation, or meltwater input, from fjord sediment
cores. One should however keep in mind that these proxies are relative, i.e., a decrease in marine
productivity would appear similar to as increase in terrestrial input.
6. Conclusions
The terrestrial-marine continuum of the Baker-Martinez fjord system allowed us to investigate
spatial variations in marine and terrestrial indicators, and to identify the best tracers of terrestrial
input. Results show that the signals occurring in the water column and recorded in sediments are
predominantly driven by the input of lithogenic particles and terrestrial organic carbon from rivers
and calving glaciers. As a consequence, organic carbon, biogenic silica, and carbonates increase
with increasing distance from the fjord head. Among all the terrestrial input indicators that were
investigated in this study, the fraction of terrestrial organic carbon calculated from bulk δ13C
measurements and the proportion of freshwater diatoms are by far the most promising proxies to
reconstruct changes in terrestrial input through time using fjord sediment cores. Freshwater
diatoms are most sensitive within the first 40 km from the fjord head, whereas the fraction of
terrestrial organic carbon is better suited for sediment cores collected in mid and outer fjords.
The main advantage of these two proxies is that they are independent of the glacial status of the
28
fjords and their watersheds, which means that they are applicable to reconstruct terrestrial input
in both proglacial and non-glacial fjords. By comparison, n-alkane-based proxies are less promising
owing to the consistent terrestrial bias of the signal due to the disproportionally high production
of n-alkanes by land plants. Likewise, our results show that the N/C ratio is mostly unsuitable to
reconstruct the sources of organic matter due to the relatively high contribution of lithogenic
nitrogen, especially in carbon-poor proglacial environments. Based on these results, we
recommend focusing on δ13C and/or diatom analysis to reconstruct past changes in terrestrial
input from fjord sediment cores. This study therefore sets a baseline for future sediment-based
research in the Baker-Martinez fjord system and in Patagonian fjords in general, and it supports
the use of fjord sediment archives for paleoclimate and paleoenvironmental reconstructions.
7. Acknowledgments
We thank Dr. Marcelo Gutiérrez (UdeC) for kindly providing the Jorge Montt sediment
samples, and Dr. Juan Placencia (UCSC) for sharing some of the CF20 samples used in this study.
Paola Reinoso and Francisco Gallardo (PUCV) are acknowledged for their help in collecting the
CF14 sediment samples for bulk organic geochemical analysis. We also thank Dr. Roberto
Rodríguez (UdeC) for his help with the identification of vascular plants from the Tortel area, and
Víctor Acuña (COPAS Sur-Austral) and Alejandro Ávila (IDEAL Center) for n-alkanes and biogenic
opal analyses, respectively. We are grateful to the captain and crew of the L/C Sur-Austral for their
help during sample collection, and to the CIMAR program (Cruceros de Investigación Marina en
Áreas Remotas; Marine Research Cruises in Remote Areas). The research presented here was
funded by the Center for Oceanographic Research COPAS Sur-Austral (CONICYT PIA PFB31 and
CONICYT PIA APOYO CCTE AFB170006) and by UGent BOF project HYDROPROX (01N02216). Partial
support from the IDEAL Center (grant FONDAP 15150003 to CBL and LR), and projects CONA-C14F
29
08-13 and CONA C20F 14-06 (to NS) is also acknowledged. The authors wish to thank Rolf Kilian
and an anonymous reviewer for their valuable comments.

30
References
Aiken, C.M., 2012. Seasonal thermal structure and exchange in Baker Channel, Chile. Dynamics of
Atmospheres and Oceans 58, 1–19.
Allan, J., Douglas, A.G., 1977. Variation in the content and distribution of n-alkanes in a series of
Carboniferous vitrinites and sporinites of bituminous rank. Geochimica et Cosmochimica Acta
41, 1223–1230.
Aracena, C., Lange, C.B., Iriarte, J.L., Rebolledo, L., Pantoja, S., 2011. Latitudinal patterns of export
production recorded in surface sediments of the Chilean Patagonian fjord (41−55°S) as a
response to water column productivity. Continental Shelf Research 31, 340–355.
Aracena, C., Kilian, R., Lange, C.B., Bertrand, S., Lamy, F., Arz, H.W., De Pol-Holz, R., Baeza, O.,
Pantoja, S., Kissel, C., 2015. Holocene variations in productivity associated with changes in
glacier activity and freshwater flux in the central basin of the Strait of Magellan.
Palaeogeography, Palaeoclimatology, Palaeoecology 436, 112−122.
Bertrand, S., Hughen, K.A., Lamy, F., Stuut, J.B.W., Torrejón, F., Lange, C.B., 2012a. Precipitation as
the main driver of Neoglacial fluctuations of Gualas glacier, Northern Patagonian Icefield.
Climate of the Past 8, 519−534.
Bertrand, S., Hughen, K.A., Sepúlveda, J., Pantoja, S. 2012b. Geochemistry of surface sediments
from the fjords of Northern Chilean Patagonia (44−47°S): Spatial variability and implications for
paleoclimate reconstructions. Geochimica et Cosmochimica Acta 76 (1), 125–146.
Bertrand, S., Hughen, K., Sepúlveda, J., Pantoja, S., 2014. Late Holocene covariability of the
southern westerlies and sea surface temperature in northern Chilean Patagonia. Quaternary
Science Reviews 105, 195–208.
31
Bertrand, S., Lange, C.B., Pantoja, S., Hughen, K., Van Tornhout, E., Wellner, J.L., 2017. Postglacial
fluctuations of Cordillera Darwin glaciers (southernmost Patagonia) reconstructed from
Almirantazgo fjord sediments. Quaternary Science Reviews 177, 265−275.
Bianchi, T.S., Canuel, E.A., 2011. Chemical Biomarkers in Aquatic Ecosystems. Princeton University
Press, Princeton, New Jersey.
Bligh, E.G., Dyer, W.J., 1959. A rapid method of total lipid extraction and purification. Canadian
Journal of Biochemistry and Physiology 37(8), 911–917.
Bourbonniere, R.A., Meyers, P.A., 1996. Sedimentary geolipid records of historical changes in the
watersheds and productivities of Lakes Ontario and Erie. Limnology and Oceanography 41(2),
352–359.
Bush, R.T., McInerney, F.A., 2015. Influence of temperature and C4 abundance on n-alkane chain
length distributions across the central USA. Organic Geochemistry 79, 65–73
Cáceres, M., 2007. Caracterización Oceanográfica. In: Proyecto Hidroeléctrico Aysén.
Determinación de línea de base de oceanografía flora y fauna marina y estuarina. Informe
Final. Resumen Ejecutivo. Facultad de Ciencias del Mar y Recursos Naturales. Universidad de
Valparaíso. Serie Informes Científicos y Técnicos N° 34/2007.
Caniupán, M., Lamy, F., Lange, C.B., Kaiser, J., Kilian, R., Arz, H.W., León, T., Mollenhauer, G.,
Sandoval, S., De Pol-Holz, R., Pantoja, S., Wellner, J., Tiedemann, R., 2014. Holocene sea-
surface temperature variability in the Chilean fjord region. Quaternary Research 82, 342−353.
Corner, E.D.S., 1979. Pollution Studies with Marine Plankton: Part I. Petroleum Hydrocarbons and
Related Compounds. Advances in Marine Biology 15, 289−380.
32
Cupp, E.E., 1943. Marine plankton diatoms of the west coast of North America. Bulletin of the
Scripps Institution of Oceanography 5, 1–238.
Cranwell, P.A., 1973. Chain-length distribution of n-alkanes from lake sediments in relation to
post-glacial environmental change. Freshwater Biology 3, 259−265.
Dussaillant, A., Benito G., Buytaert, W., Carling, P., Meir, C., Espinoza, F., 2010. Repeated glacial-
lake outburst floods in Patagonia: an increasing hazard? Natural Hazards 54(2), 469–481.
Eglinton, G., Hamilton, R.J., 1963. The distribution of alkanes. In: T. Swain (Ed.), Chemical Plant
Taxonomy, Academic Press, pp. 187-217 .
Eglinton, G., Hamilton, R.J., 1967. Leaf epicuticular waxes. Science 156, 1322−1335.
El Nemr, A., Moneer, A.A., Ragab, S., El Sikaily, A., 2016. Distribution and sources of n-alkanes and
polycyclic aromatic hydrocarbons in shellfish of the Egyptian Red Sea coast. Egyptian Journal
of Aquatic Research 42(2), 121–131.
Garreaud, R.D, Lopez, P., Minvielle, M., Rojas, M., 2013. Large-scale control on the Patagonian
climate. American Meteorological Society 26, 215–230.
Glasser, N.F., Jansson, K.N., Duller G.A.T., Singarayer, J., Holloway, M., Harrison, S., 2016. Glacial
lake drainage in Patagonia (13−8 Kyr) and response of the adjacent Pacific Ocean. Scientific
Reports 6, 21064; doi:10.1038/srep21064.
González, H.E., Castro, L.R., Daneri, G., Iriarte, J.L., Silva, N., Tapia, F., Teca, E., Vargas, C.A., 2013.
Land-ocean gradient in haline stratification and its effects on plankton dynamics and trophic
carbon fluxes in Chilean Patagonian fjords (47−50°S). Progress in Oceanography 119, 32–47.

33
Gutiérrez, M.H., Galand, P.E., Moffat, C., Pantoja, S., 2015. Melting glacier impacts community
structure Bacteria, Archaea and Fungi in a Chilean Patagonia fjord. Environmental
Microbiology 17(10), 3882−3897.
Hasle, G.R., Syvertsen, E.E., 1996. Marine diatoms, in: Tomas, C.R. (Ed.), Identifying marine
diatoms and dinoflagellates. Academic Press, Inc., San Diego, pp. 5–385.
Hebbeln, D., Marchant, M., Freudenthal, T. Wefer, G., 2000. Surface sediment distribution along
the Chilean continental slope related to upwelling and productivity. Marine Geology 164, 119–
137.
Hedges, J.L., Prahl, F.G., 1993. Early Diagenesis: Consequences for Applications of Molecular
Biomarkers. In: Engel M.H., Macko S.A. (Eds.), Organic Geochemistry. Topics in Geobiology, vol
11, Plenum Press, New York, pp 237–253.
Hijmans, R.J., Cameron, S.E, Parra, J.L., Jones, P.G., Jarvis, A., 2005. Very high resolution
interpolated climate surfaces for global land areas. International Journal of Climatology 25,
1965–1978.
Jacob, B.G., Tapia, F.J., Daneri, G., Iriarte, J.L., Montero, P., Sobarzo, M., Quiñones, R.A., 2014.
Springtime size-fractionated primary production across hydrographic and PAR-light gradients
in Chilean Patagonia (41−50°S). Progress in Oceanography 129, Part A, 75–84.
Jacquet, J., McCoy, S. W., McGrath, D., Nimick, D. A., Fahey, M., O’kuinghttons, J., Friesen, B. A.,
Leidich, J., 2017. Hydrologic and geomorphic changes resulting from episodic glacial lake
outburst floods: Rio Colonia, Patagonia, Chile, Geophysical Research Letters 44, 854–864.
Jeng, W.L., 2006. Higher plant n-alkane average chain length as an indicator of petrogenic
hydrocarbon contamination in marine sediments. Marine Chemistry 102, 242−251.
34
Kilian, R., Lamy, F., 2012. A review of Glacial and Holocene paleoclimate records from
southernmost Patagonia (49–55°S). Quaternary Science Reviews 53, 1−23.
Kumar, V., Tiwari, M., Nagoji, S., Tripathi, S., 2016. Evidence of anomalously low δ13C of marine
organic matter in an Arctic Fjord. Scientific Reports 6, 36192; doi:10.1038/srep36192.
Lafon, A., Silva, N., Vargas, C.A., 2014. Contribution of allochthonous organic carbon across the
Serrano River Basins and the adjacent fjord system in Southern Chilean Patagonia: Insights
from the combined use of stable and fatty acid biomarkers. Progress in Oceanography 129,
Part A, 98–113.
Lara, A., Bahamondez, A., González-Reyes A., Muñoz, A.A., Cuq, E., Ruiz-Gómez, C., 2015.
Reconstructing streamflow variation of the Baker River from tree-rings in Northern Patagonia
since 1765. Journal of Hydrology 529, 511–523.
Lenaerts, J.T.M., van den Broeke, M.R., van Wessem, J.M., van de Berg, W.J., van Meijgaard, E.,
van Ulft, L.H., Schaefer, M., 2014. Extreme Precipitation and Climate Gradients in Patagonia
Revealed by High-Resolution Regional Atmospheric Climate Modeling. Journal of Climate 27,
4607-4621.
Liu, H., Liu, W., 2016. n-Alkane distributions and concentrations in algae, submerged plants and
terrestrial plants from Qinghai-Tibetan Plateau. Organic Geochemistry 99, 10–22.
Luebert, F. and Pliscoff, P. 2006. Sinopsis bioclimática y vegetacional de Chile. Editorial
Universitaria, Santiago de Chile.
Marín, V.H., Tironi, A., Paredes, M.A., Contreras, M., 2013. Modelling suspended solids in a
Northern Chilean Patagonia glacier-fed fjord: GLOF scenarios under climate change
conditions. Ecological Modelling 264, 7–16.

35
Mayr, C.C., Rebolledo, L., Schulte, K., Schuster, A., Zolitschka, B., Fösterra, G., Häusserman, V.,
2014. Responses of nitrogen and carbon deposition rates in Comau Fjord (42°S, Southern
Chile) to natural and anthropogenic impacts during the last century. Continental Shelf
Research 78, 29–38.
Meerhoff, E., Castro, L., Tapia, F.J., 2013. Influence of freshwater discharges and tides on the
abundance and distribution of larval and juvenile Munida gregaria in the Baker river estuary,
Chilean Patagonia. Continental Shelf Research 61-62, 1–11.
Meerhoff, E., Tapia, F.J., Castro, L., 2014. Spatial structure of the meroplankton community along a
Patagonian fjord − The role of changing freshwater inputs. Progress in Oceanography 129, Part
A, 125–135.
Meerhoff, E., Tapia, F.J., Sobarzo, M., Castro, L., 2015. Influence of estuarine and secondary
circulation on crustacean larval fluxes: a case study from a Patagonian fjord. Journal of
Plankton Research 37(1), 168−182.
Meerhoff, E., Castro, L.R., Tapia, F.J., Pérez-Santos, I., 2018. Hydrographic and biological impacts of
a Glacial Lake Outburst Flood (GLOF) in a Patagonian fjord. Estuaries and Coasts.
Meyers, P.A., 1997. Organic geochemical proxies of paleoceanographic, paleolimnologic and
paleoclimatic processes. Organic Geochemistry 27(5-6), 213–250.
Moffat, C., 2014. Wind-driven modulation of warm supply to a proglacial fjord, Jorge Montt
Glacier, Patagonia. Geophysical Research Letter 41, 3943−3950.
Moffat, C., Tapia, F.J., Nittrouer, C.A., Hallet, B., Bown, F., Iturra, C., Boldt, K., 2018. Seasonal
evolution of ocean heat supply and freshwater discharge from a rapidly retreating tidewater
glacier: Jorge Montt, Patagonia. Journal of Geophysical Research: Oceans. In press.
36
Mortlock, R.A., Froelich, P.N., 1989. A simple method for the rapid determination of biogenic opal
in pelagic marine sediments. Deep-Sea Research, Part A, 36, 1415–1426.
Muñoz, Y.P., Wellner, J., 2016. Local controls on sediment accumulation and distribution in a fjord
in the West Antarctic Peninsula: Implications for paleoenvironmental interpretations. Polar
Research, 35:1, 25284.
Müller, P.J.; Schneider, R., 1993. An automated leaching method for the determination of opal in
sediments and particulate matter. Deep Sea Research, Part I, 40, 425−444.
Parsons, T.R., Maita, Y., Lalli, C.M., 1984. A Manual of Chemical and Biological Methods for
Seawater Analysis. Pergamon Press, Oxford.
Pendoley, K., 1992. Hydrocarbons in Rowley Shelf (Western Australia) oysters and sediments.
Marine Pollution Bulletin 24, 210–215.
Perdue, E.M., Koprivnjak, J.F., 2007. Using the C/N ratio to estimate terrigenous inputs of organic
matter to aquatic environments. Estuarine Coastal and Shelf Science 73, 65–72.
Peters, K. E., Walters, C. C., Moldowan, J. M., 2007. The Biomarker Guide, Volume 2. Biomarkers
and Isotopes in Petroleum Systems and Earth History. Cambridge University Press, Cambridge.
Pinto, L.A., Bonert, C., 2005. Origen y distribución especial de hidrocarburos alifáticos en
sedimentos de Seno Aysén y Canal Moraleda, Chile Austral. Ciencia y Tecnología Marina 28(1),
35−44.
Piret, L., Bertrand, S., Vandekerkhove, E, Harada, N., Moffat, C., Rivera, A., 2017. Gridded
bathymetry of the Baker-Martinez fjord complex (Chile, 48°S) v1. Fig share.
https://doi.org/10.6084/m9.figshare.5285521.v3.
37
Placencia, J., Llanos, G., Contreras, S., 2017. Organic carbon sources across salinity gradients in
Chilean Fjords: Reloncaví Fjord (∼41ºS) and Southern Patagonian ice fields area (∼48°S).
Geophysical Research Abstracts 19, 9216.
Powell, R.L., Still, C.J., 2009. Biogeography of C3 and C4 vegetation in South America. Anais XIV
Simpósio Brasileiro Sensoriamento Remoto, 2935–2942.Poynter, J. G., Farrimond, P.,
Robinson, N., Eglinton, G., 1989. Aeolian-Derived Higher Plant Lipids in the Marine
Sedimentary Record: Links with Palaeoclimate. In: Leinen M., Sarnthein M. (Eds.),
Paleoclimatology and Paleometeorology: Modern and Past Patterns of Global Atmospheric
Transport. NATO ASI Series (Series C: Mathematical and Physical Sciences). Springer,
Dordrecht, vol 282, pp. 435–462.
Quiroga E., Ortiz, P., Reid, B., Villagrán, S., Gerdes, D., Quiñones, R., 2012. Organic enrichment and
structure of macrobenthic communities in the glacial Baker Fjord, northern Patagonia. Chile.
Journal of the Marine Biological Association UK 92, 73−83.
Quiroga, E., Ortiz, P., González, R., Tapia, F., Pérez-Santos, I., Rebolledo, L., Reid, B., Mansilla, R.,
Pineda, C., Cari, I., Salinas, N., Montiel, A., Gerdes, D., 2016. Seasonal patterns in the benthic
realm of a glacial fjord (Martinez Channel, Chilean Patagonia): the role of suspended
sediment and terrestrial organic matter. Marine Ecology Progress Series 56, 31−50.
Rebolledo, L., Lange, C.B., Figueroa, D., Pantoja, S., Muñoz, P., Castro, R., 2005. 20th century
fluctuations in the abundance of siliceous microorganisms preserved in the sediments of the
Puyuhuapi Channel (44ºS), Chile. Revista Chilena de Historia Natural 78(3), 469–488.
38
Rebolledo, L., Sepúlveda, J., Lange, C.B., Pantoja, S., Bertrand, S., Hughen, K., Figueroa, D., 2008.
Late Holocene marine productivity changes in Northern Patagonia-Chile inferred from a multi-
proxy analysis of Jacaf channel sediments. Estuarine, Coastal and Shelf Science 80, 314–322.
Rebolledo, L., Lange C.B., Bertrand, S., Muñoz, P., Salamanca, B., Lazo, P., Iriarte, J.J., Vargas, G.,
Pantoja, S., Dezileau, L., 2015. Late Holocene precipitation variability recorded in the
sediments of Reloncaví Fjord (41°S, 72° W). Quaternary Research 84(1), 21–36.
Rivera, P., 1981. Beiträge zur Taxonomie und Verbreitung der Gattung Thalassiosira Cleve.
Bibliotheca Pycologica 56, 1–220.
Rivera, A., Koppes, M., Bravo, C., Aravena, J.C., 2012. Little Ice Age advance and retreat of Glaciar
Jorge Montt, Chilean Patagonia. Climate of the Past 8, 403–414.
Rodríguez, R., Marticorena, A., Teneb, E., 2008. Plantas vasculares de los ríos Baker y Pascua,
Región de Aisén, Chile. Gayana Botánica 65(1), 39–70.
Romero, O.E., Hebbeln, D., 2003. Biogenic silica and diatom thanatocoenosis in surface sediments
below the Peru-Chile Current: controlling mechanisms and relationship with productivity of
surface waters. Marine Micropaleontology 48(1-2), 71−90.
Rosell-Melé, A., McClymont, E.L., 2007. Biomarkers as Paleoceanographic Proxies. In: Hillaire-
Marcel, De Vernal, A. (Eds.), Proxies in Late Cenozoic Paleoceanography, vol. 1. Developments
in Marine Geology. Elsevier. Amsterdam, pp. 441−-490.
Ross, L., Pérez-Santos, I., Valle-Levinson, A., Schneider, W., 2014. Semidiurnal internal tides in a
Patagonian fjord. Progress in Oceanography 129, Part A, 19−34.

39
Ross, L., Valle-Levinson, A., Pérez-Santos, I., Tapia, F.J., Schneider, W., 2015. Baroclinic annular
variability of internal motions in a Patagonian fjord. Journal of Geophysical Research: Oceans
120, 5668−5685.
Round, F.E., Crawford, R.M., Mann, D.G., 1990. The Diatoms: Biology & Morphology of the Genera.
Cambridge University Press, Cambridge, 760 p.
Sancetta, C., Calvert, S.E., 1988. The annual cycle of sedimentation in Saanich Inlet, British
Columbia. Implications for the interpretation of diatom fossil assemblages. Deep-Sea
Research, Part A, 35, 71–90.
Schlitzer, R., 2017. Ocean Data View, http://odv.awi.de
Schrader, H., Gersonde, S., 1978. Diatoms and silicoflagellates. In: Zachariasse, W.J., et al.
Microplaeontological counting methods and techniques - an exercise on an eight metres
section of the lower Pliocene of Capo Rossello. Sicily. Utrecht Micropaleontological Bulletins
17, pp. 129−-176.
Sepúlveda, J., Pantoja, S., Hughen, K.A, Lange, C.B., González, F., Muñoz, P., Rebolledo, L., Castro,
R., Contreras, S., Ávila, A., Rossel, P., Lorca, G., Salamanca, M., Silva, N., 2005. Fluctuations in
export productivity over the last century from sediments of a southern Chilean fjord (44°S).
Estuarine Coastal and Shelf Science 65, 587–600.
Sepúlveda, J., Pantoja, S., Hughen, K.A., Bertrand, S., Figueroa, D., Leon, T., Drenzek, N.J., Lange, C.,
2009. Late Holocene sea-surface temperature and precipitation variability in northern
Patagonia, Chile (Jacaf Fjord, 44⁰S). Quaternary Research 72, 400−409.

40
Sepúlveda, J., Pantoja, S., Hughen, K.A., 2011. Sources and distribution of organic matter in
northern Patagonian fjords, Chile (~44–47°S): A multi-tracer approach for carbon cycling
assessment. Continental Shelf Research 31(3-4), 315−329.
Sernageomin, 2003. Mapa geológico de Chile versión digital, escala 1/1.000.000.
Silva, N., Calvete, C., Sievers, H.A., 1998. Masas de agua y circulación general para algunos canales
australes entre Puerto Montt y Laguna San Rafael, Chile (Crucero Cimar-Fiordo 1). Ciencia y
Tecnología del Mar 21, 17–48.
Silva, N., Haro, J., Prego, R., 2009. Metals background and enrichment in the Chiloé Interior Sea
sediments (Chile). Is there any segregation between fjords, channels and sounds? Estuarine,
Coastal and Shelf Science 82, 469–476.
Silva, N., Vargas, C., Prego, R., 2011. Land-ocean distribution of allochthonous organic matter in
surface sediments of the Chiloé and Aysén interior seas (Chilean Northern Patagonia).
Continental Shelf Research 31(3-4), 330−339.
Sims, P.A. (Ed.), 1996. An Atlas of British Diatoms. Biopress Ltd, Bristol, United Kingdom.
Smith, R.W., Branchi, T., Allison, M., Svage, G., Galy, X., 2015. High rates of organic carbon burial in
fjords sediments globally. Nature Geoscience 8, 450–453.Tapia, F.J., D. Henriquez, C. Moffat,
V. Manriquez. Hydrographic structuring of larval abundance and stage structure for the squat
lobster Munida gregaria in a Patagonian fjord. Submitted to Estuaries and Coasts.
Torres, R., Silva, N., Reid, B., Frangopulos, M., 2014. Silicic acid enrichment of subantarctic surface
water from continental inputs along the Patagonian archipelago interior sea (41–56°S).
Progress in Oceanography 129, Part A, 50–61.

41
Thornton, S.F., McManus, J., 1994. Application of organic carbon and nitrogen stable isotope and
C/N ratios as source indicators of organic matter provenance in estuarine systems: evidence
from the Tay Estuary, Scotland. Estuarine Coastal and Shelf Science 38, 219–233.
Vargas, C.A., Martínez, R.A., San Martín, V., Aguayo, M., Silva, N., Torres, R., 2011. Allochthonous
subsidies of organic matter across a lake-river-fjord landscape in the Chilean Patagonia:
Implications for marine zooplankton in inner fjord areas. Continental and Shelf Research 31(3-
4), 187–201.
Vidal, O.J., Bannister, J., Sandoval, V., Perez, J., Ramirez, C., 2011. Woodland communities in
Chilean cold-temperate zone (Baker and Pascua basins): Floristic composition and morpho-
ecological transitions. Gayana Botanica 68 (2), 141–154.
Willis, M.J., Melkonian, A.K., Pritchard, M.E., Ramage, J.M., 2012. Ice loss rate of Northern
Patagonian Icefield derived using a decade of satellite remote sensing. Remote Sensing of
Environment 117, 184–198.
Witkowski, A., Lange-Bertalot, H., Metzeltin, D., 2000. Diatom Flora of Marine Coasts I. In: Lange-
Bertalot, H. (Ed.), Iconographia Diatomologica, vol. 7, Diversity – Taxonomy - Identification.
Koeltz Scientific Books, Königstein, Germany, 925 pp.
Zhu, Z.Y., Wu, Y., Liu, S.M., Wenger, F., Hu, J., Zhang, J., Zhang, R.F., 2016. Organic carbon flux and
particulate organic matter composition in Arctic valley glaciers: examples from the Bayelva
River and adjacent Kongsfjorden. Biogeosciences 13, 975−987.
42
Figure captions
Figure 1 – Location of the Baker-Martínez fjord system in Chilean Patagonia, with indication of the
main glaciers and rivers influencing the fjord system. Sediment sampling stations are represented
by red circles (see Table S2 for details). SPI = Southern Patagonian Icefield.
Figure 2 – Bathymetry of the Baker-Martínez fjord system (from Piret et al., 2017) and location of
the CTD stations investigated during the October 2014 COPAS Sur-Austral campaign (top). The
cross-sections of temperature, salinity, dissolved oxygen concentration, turbidity, and
fluorescence (from top to bottom) are shown for Martínez Channel (left) and Baker Channel
(right). CTD data were plotted using Ocean Data View (Schlitzer, 2017). The bathymetry is not
shown on the cross-sections due to its relatively low resolution but shallow (<100m) sills likely
occur in the center of Martínez Channel. The color scales are open-ended. Note the change in
depth scale for the lowermost (turbidity and fluorescence) cross-sections.
Figure 3 – Principal Component Analysis (PCA) of the four main environmental variables
(temperature, salinity, turbidity, and fluorescence) measured in the upper 20m of the water
column at the 17 stations shown in Fig. 2, during four campaigns in spring (October 2014, October
2015) and summer (January 2016, March 2016). For each variable, the averages of all
measurements obtained in the upper 20m of the water column were used. The results show high
covariance between fluorescence and salinity, suggesting that salinity is the main environmental
variable controlling the distribution of phytoplankton biomass in the Baker-Martínez fjord system.
Figure 4 – Spatial and temporal variability in phytoplankton biomass in the Baker-Martínez fjord
system. (a) Chlorophyll-a concentrations in October 2014 (austral spring) integrated over the
43
upper 30 m of the water column (COPAS 2014 campaign; data in Table S1). Underlined labels
indicate stations where phytoplankton samples were collected in the water column and analyzed
(results in Table S5). (b) Monthly statistics for the position of the 10 and 20 PSU surface salinity
contours along Martínez channel, based on hourly records of salinity gathered from five stations
(numbers 2 to 6) along the channel from October 2012 through November 2013. Symbols
correspond to the median position of the contours for each month in the record. Error bars
correspond to the first and third quartiles (25% and 75% percentiles) of the distribution for each
month. Based on the strong covariance between fluorescence and salinity (Fig. 3), a significant
increase in phytoplankton biomass is expected to occur between stations 4 and 5 through most of
the year, except for summer months (Dec–Feb) when it moves to the outer section between
stations 5 and 6.
Figure 5 – Spatial distribution of the four main components of surface sediments in the Baker-
Martínez fjord system. a) Organic matter (wt %), b) biogenic opal (wt %), c) CaCO3 (wt %), and d)
lithogenic particles (wt %). Data presented in Table S2.
Figure 6 – Spatial distribution of bulk organic geochemical parameters in surface sediments of the
Baker-Martínez fjord system. a) Corg (wt %), b) N/C (molar ratio), c) δ13Corg (‰), and d) proportion
of terrestrial organic carbon (wt %). Data presented in Table S2.
Figure 7 – Comparison of n-alkanes distribution and concentration between a) living vegetation at
Caleta Tortel, and b) surface sediments of the Baker-Martínez fjord system. Individual plant
species are shown in Fig. S1. The error bars indicate the 1σ standard deviation.

44
Figure 8 – Spatial distribution of n-alkanes and diatom-based indices in the Baker-Martínez fjord
system. a) ACL, b) CPI, c) TAR, and d) freshwater diatoms (%). The main rivers and glaciers are
indicated. Data are presented in Table S2.
Figure 9 – Spearman Principal Component Analysis (PCA) of the main variables measured in the
surface sediments of the Baker-Martínez fjord system: Corg, biogenic opal, total diatoms, CaCO3,
lithogenic particles (LP), δ13Corg, δ15 N, N/C ratio, total n-alkanes, carbon preference index (CPI),
average chain length (ACL), terrigenous/aquatic ratio (TAR), and proportion of freshwater diatoms.
Figure 10 – Molar N/C versus δ13Corg of surface sediment samples from the Baker-Martínez fjord
system. The end-member values are from Hebbeln et al. (2000)and Bertrand et al. (2012b):
terrestrial: N/C = 0.0624 and δ13C = -27.72‰; aquatic: N/C = 0.130 and δ13C = -19.86‰. The N/C
and δ13C measurements obtained on river sediment sample RS11-05 confirm the selection of the
terrestrial end-member values.
Figure 11 – Variations of the main terrestrial proxies with distance from the nearest river mouth or
calving glacier front: (a) Fraction of terrestrial carbon (fT) based on δ13Corg (%), (b) molar N/C ratio;
(c) n-alkane-based terrestrial-to-aquatic ratio (TAR) and (d) proportion of freshwater diatoms (%).
All proxies were plotted with the most terrestrial values towards the top of the figure. The open
symbols correspond to samples from proglacial fjord Jorge Montt.
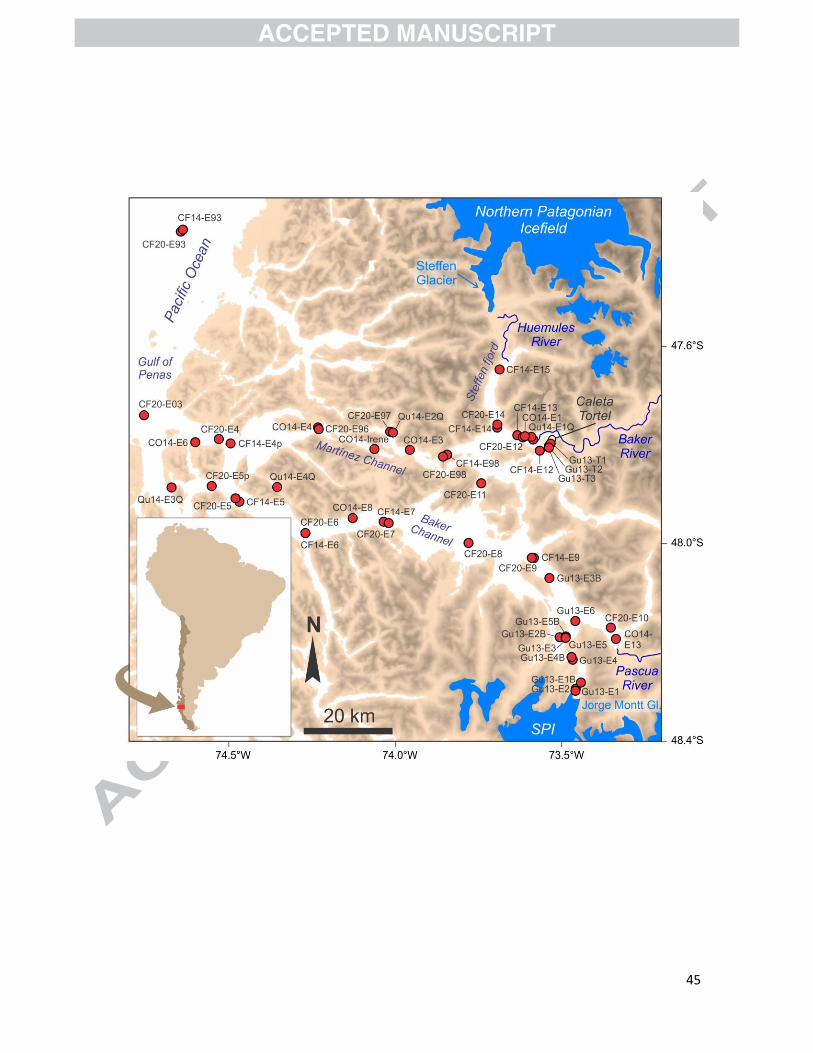
45

46
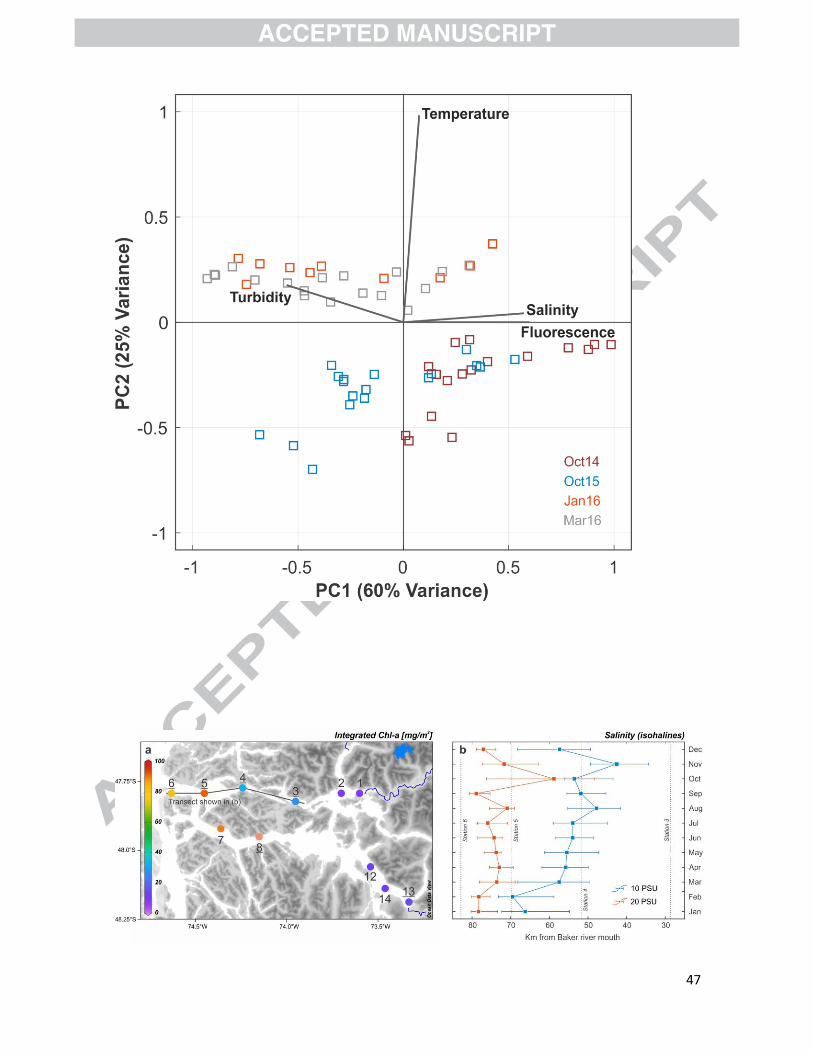
47

48
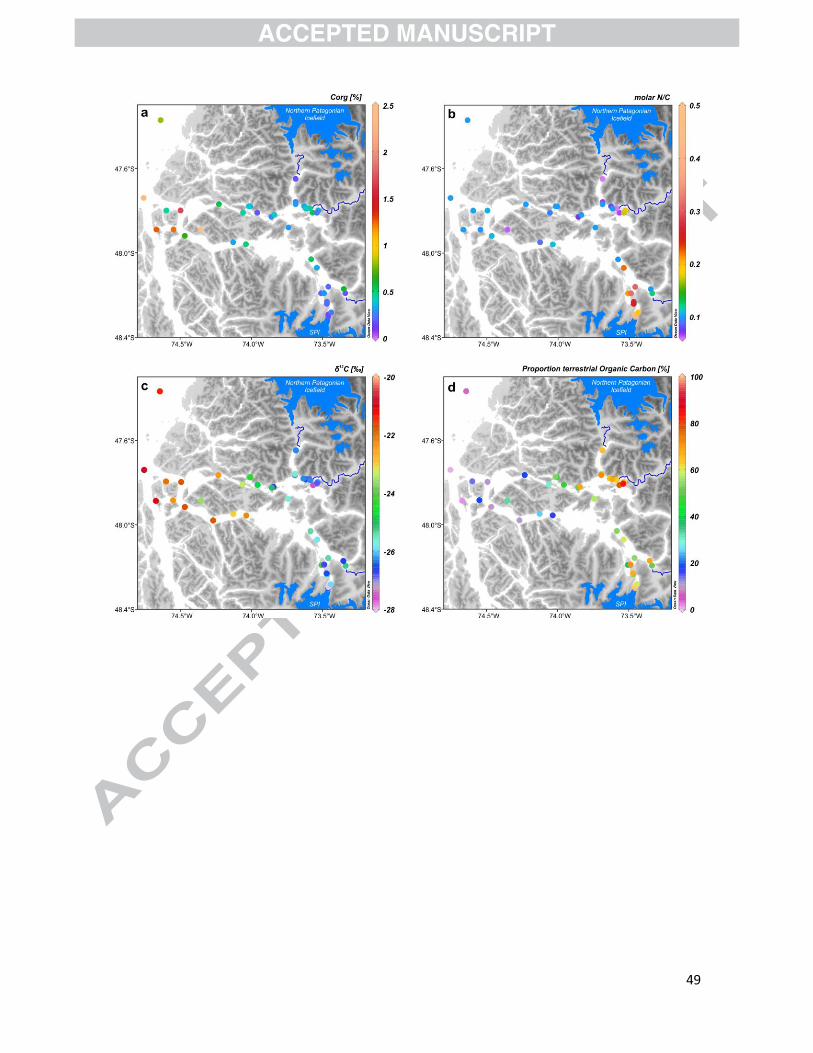
49
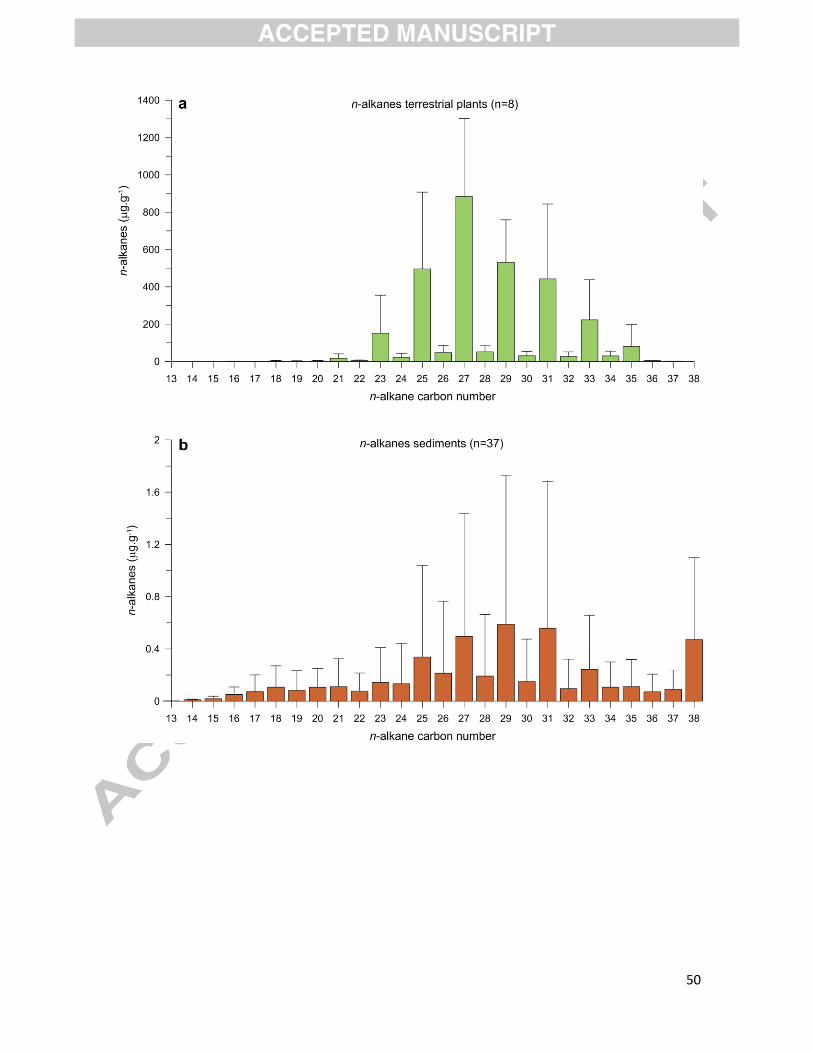
50
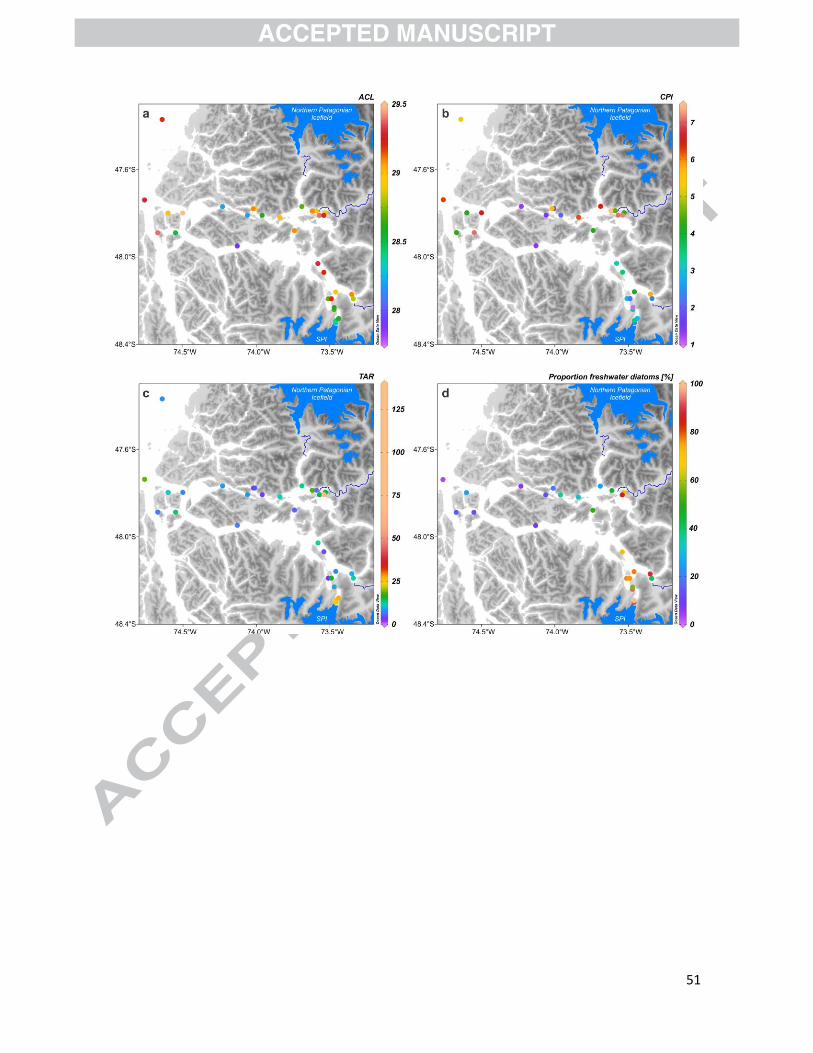
51
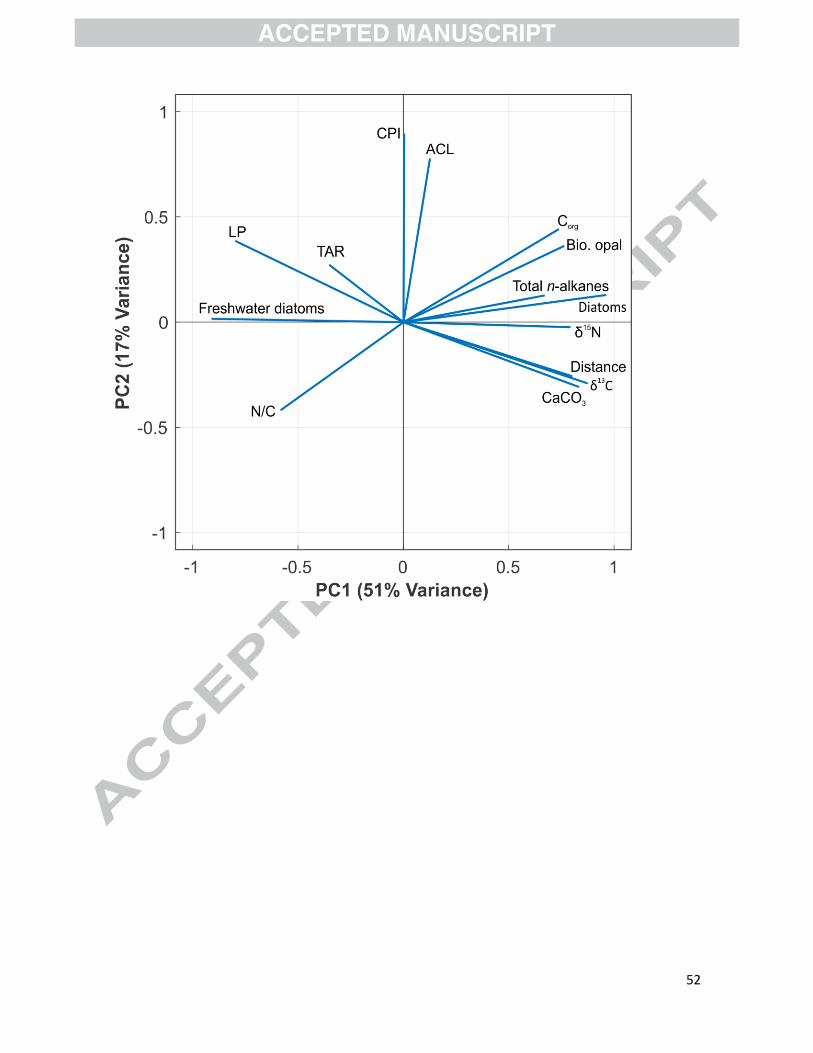
52

53
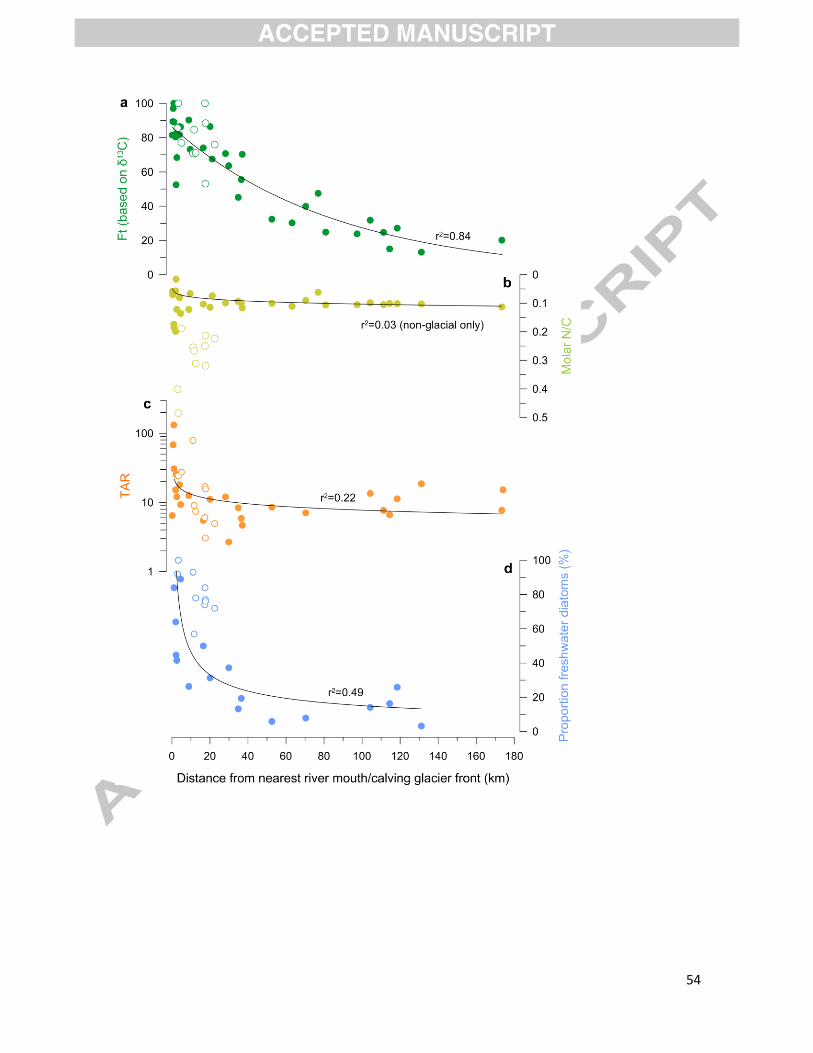
54

55
Highlights
The Baker-Martinez fjord system covers a complete terrestrial-to-marine continuum
Variability in sediment composition is mostly explained by distance from river mouths
Ntot/Corg measurements are strongly affected by glacial clay input
δ13Corg and freshwater diatoms are the best indicators of terrestrial input
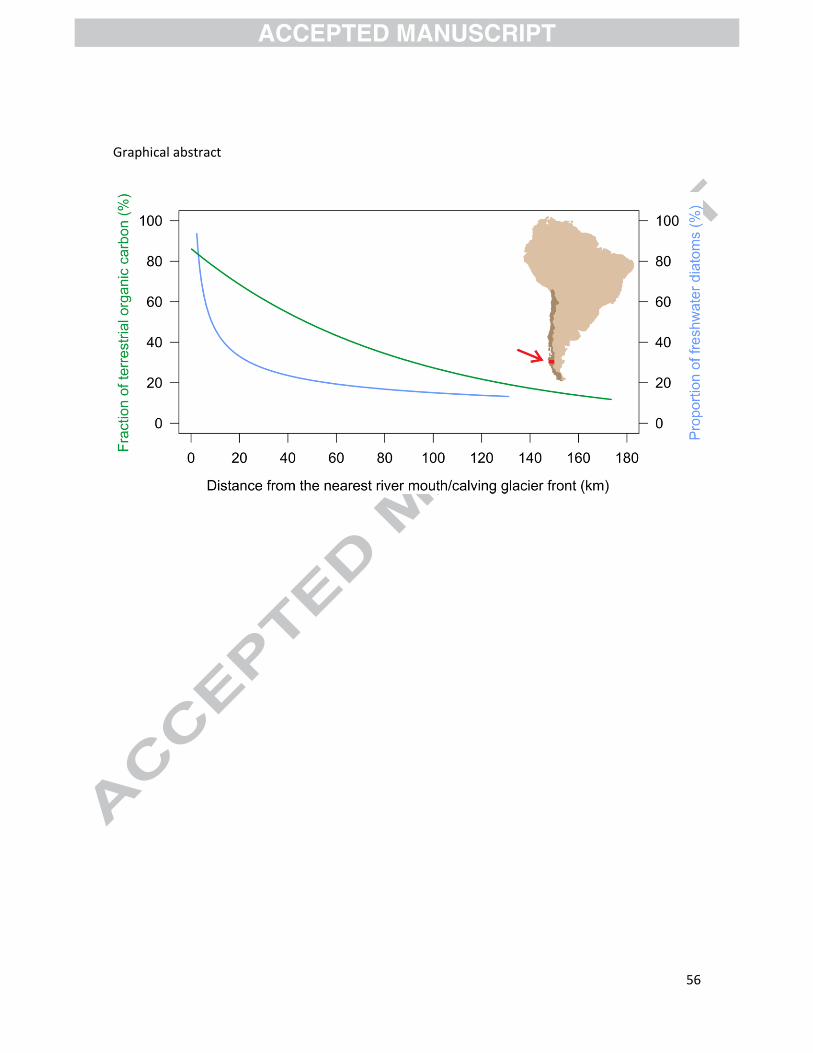
56
Graphical abstract