composition of weed flora in spring cereals in …orgprints.org/19399/1/salonen.pdffields have been...
TRANSCRIPT

A G R I C U L T U R A L A N D F O O D S C I E N C E
Salonen, J. et al. Weed flora in spring cereals in Finland Vol. 20(2011): 245–261.
245PB
© Agricultural and Food Science Manuscript received November 2010
Composition of weed flora in spring cereals in Finland – a fourth survey
Jukka Salonen*, Terho Hyvönen and Heikki JalliMTT Agrifood Research Finland, Plant Production Research, FI-31600 Jokioinen, Finland,
*e-mail: [email protected]
The weed flora in conventionally and organically grown spring cereals was investigated in southern and central Finland during 2007–2009. The survey was conducted in 16 regions, 283 farms and 595 fields (72 organically cropped and 523 conventionally cropped fields, of which 503 were treated with herbicides). The occurrence of weeds was assessed in late July–early August. Altogether 148 weed species were iden-tified, of which 128 were broad-leaved and 20 grass species. In organically cropped fields, the average species number per field was 21 and the most frequent species were Chenopodium album 96%, Stellaria media 94%, Viola arvensis 94% and Elymus repens 89%. In conventionally cropped fields, the average species number was 12 and the most frequent weed species were Viola arvensis 83%, Stellaria media 65%, Galeopsis spp. 59% and Galium spurium 59%. The average density of weeds was 160 m-2 (median = 112) in sprayed conventional fields and 519 m-2 (468) in organic fields. The average air-dry biomass of weeds was 167 kg ha-1 (median = 82) and 775 kg ha-1 (563), respectively. Elymus repens, the most frequent and abundant grass species, produced the highest proportion (about 30%) of the total weed biomass in both cropping systems. The frequency of Galium spurium in conventional cropping and Fumaria officinalis in organic cropping had increased substantially since the previous survey in 1997–1999. The average size of the weed seedbank in the 5 cm surface layer was about 1 700 seeds m-2, the most predominant seeds being of C. album. Although the weed flora in Finnish spring cereal fields consists of numerous species, only a fraction of them severely threaten crop production in terms of their frequency and abundance. Weeds in conventional cropping were effectively controlled with available herbicides whereas weed management in organic cropping calls for urgent measures such as direct mechanical weed control in crop stands, which was not practised at all in survey fields.
Key-words: weeds, spring cereals, biodiversity, conventional farming, organic farming, crop protection, seedbank, Elymus repens, Viola arvensis, Galium spurium

A G R I C U L T U R A L A N D F O O D S C I E N C E A G R I C U L T U R A L A N D F O O D S C I E N C E
Salonen, J. et al. Weed flora in spring cereals in Finland
247246
Introduction
Three extensive surveys of weeds in spring cereal fields have been carried out in Finland since the 1960s, the first in 1961–1964 (Mukula et al. 1969), the second in 1982–1984 (Erviö and Salonen 1987) and the third in 1997–1999 (Salonen et al. 2001a). In addition to conventionally cropped fields, organi-cally cropped fields were included in the survey protocol in the 1990s.
Similar comprehensive weed surveys have been conducted earlier in many countries, but new surveys and follow-up monitoring have been real-ized to a lesser extent. Nonetheless, recent informa-tion on composition of weed floras and factors af-fecting weed floras in cereal fields is available, e.g. from Bulgaria (Milanova et al. 2009), Denmark (Andreasen and Stryhn 2008, Andreasen and Sko-vgaard 2009), France (Fried et al. 2008), Hungary (Novak et al. 2010), the UK (Potts et al. 2010) and the US (Conn et al. 2011). In Finland, a small-scale survey of weeds in organically cropped spring ce-reals in coastal regions was carried out in the early 2000s (Riesinger and Hyvönen 2006a). Recently, the EWRS (European Weed Research Society) established a working group on weed mapping to facilitate communication among research groups monitoring weeds in arable habitats in Europe (http://www.ewrs.org/weedmapping/default.asp).
Since the previous extensive weed survey in Finland (Salonen et al. 2001a), which was con-ducted in 1997–1999, agri-environment policy has influenced the preconditions for cereal production. Some measures originating from EU regulations, such as restricted use of fertilizers, demand for over-wintering plant cover, reduced tillage and uncultivated buffer zones along watercourses have been extensively implemented in Finnish farms. Furthermore, several studies have demonstrated that organic farming clearly promotes weed floras, both in terms of diversity and abundance (e.g. van Elsen 2000, Salonen et al. 2001b, Hyvönen et al. 2003a, Hyvönen 2007, Romero et al. 2008).
In the present study, we report the results of the fourth extensive weed survey of Finnish spring cereals, conducted in 2007–2009. We expected that
continuous changes in cropping practices affect the species composition of the weed flora and the level of weed infestation, as discussed for instance by Andreasen and Streibig (2010). This report focuses on the composition of weed flora in spring cereals in 2007–2009. The changes in weed occurrence over the decades will be reported in detail sepa-rately.
As a supplement to previous weed surveys, sampling of soil seed banks was included in the present survey. The seed density data provide in-formation on the potential of germinating weed seedlings in the soil. Reference mapping of soil seed banks in cultivated soils in Finland dates back to the 1960s (Paatela and Erviö 1971). Since then factors like the use of herbicides (Hyvönen and Salonen 2003), crop rotations (Sjursen 2001) and changes in tillage practices (Yenish et al. 1992) have been of central importance in determining the amount of seeds in the soil seed bank.
Weed surveys in spring cereal fields in Fin-land are important in terms of crop dominance as spring cereals account for more than half of the total cropped area of around 2 million hectares (Niemi and Ahlstedt 2009). In addition to biodiver-sity aspects (species richness, high-value species, findings of new alien species etc.), the updated in-formation on weed infestation is aimed at farmers, advisory services and the chemical industry, with a view to promoting specific weed control measures. Weed shift is of agronomic interest primarily as regards the most abundant weeds species.
Material and methods
Study regions, farms and fieldsThe weed survey was carried out in southern and central Finland in 2007–2009 (Fig. 1). The highest number of fields (N = 369) was studied in southern Finland (Table 1), where spring cereals are grown on more than 50% of the arable area and annual spring-sown crops are predominant. The number of study fields decreased towards the east and north,

A G R I C U L T U R A L A N D F O O D S C I E N C E
Salonen, J. et al. Weed flora in spring cereals in Finland Vol. 20(2011): 245–261.
247246
where spring cereals account for less than 50% of the cultivated area, and many farms include grassland in their crop rotation.
The number of farms visited was 283, of which 243 were engaged in conventional and 40 in organ-ic farming. Three survey regions, Nauvo/Korppoo (region number 3), Tammela (4) and Laihia (9), were study regions without organically cultivated survey fields. The proportion of organic survey fields was highest, 30–35%, in eastern Finland (regions 6, 7 and 13) and in Kihniö/Parkano (15). The difference in cropping systems between survey regions is reflected to some extent in the results on overall weed occurrence.
One to five spring cereal fields were examined on each farm, giving a total of 595 fields: 267 un-der barley (Hordeum vulgare L.), 175 under oats (Avena sativa L.), 148 under wheat (Triticum aes-tivum L.) and 5 under oat/pea or spring-sown rye cultivation. Altogether 523 study fields were culti-vated conventionally and 72 organically.
The average area of the study fields was 5.7 ha (range 0.3 ha– 35.6 ha) and the total area surveyed,
3 378 ha. In the largest fields the investigated area was restricted to a maximum of 25 ha and in some fields the surveyed field area was adjusted accord-ing to previous surveys. The same 16 regions were surveyed ten years ago and altogether 443 out of the 595 surveyed fields were the same as in 1997–1999 (Salonen et al. 2001a).
A great majority of study fields had been sown by mid-May (mainly during weeks no. 18–20) and sprayed with herbicides by the end of June (weeks no. 24–26).
The permission to investigate weeds in survey fields was asked from farmers only in early July with the aim that all cropping practices influenc-ing the weed infestation, including the level of fertilization or choice of herbicide product, dose and time of application, were realized according to “house-style”. At the sampling time, information on cropping measures was recorded by interview-ing the farmers. Herbicides had been applied in 503 out of 523, i.e. 96%, conventionally cultivated fields. A common reasoning for not using chemical weed control
Fig.1. Weed survey regions (1-16) in three zones in 2007-2009. Key to region numbers: 1 = Jokioinen, 2 = Lammi, 3 = Nauvo/Korppoo, 4 = Tammela, 5 = Iitti, 6 = Kitee, 7 = Laukaa/Toivakka, 8 = Vieremä, 9 = Laihia, 10 = Laitila, 11 = Lieto/Paimio, 12 = Nurmijärvi, 13 = Ruokolahti, 14 = Mikkeli, 15 = Kihniö/Parkano, 16 = Nivala.

A G R I C U L T U R A L A N D F O O D S C I E N C E A G R I C U L T U R A L A N D F O O D S C I E N C E
Salonen, J. et al. Weed flora in spring cereals in Finland
249248
Table 1. Number of fields surveyed by region, production type and cereal species.
Region Number of fieldsProduction type Cereal species7
Year No Zone5 Total Conventional 6 Organic Barley Oat WheatMunicipality 2007
Jokioinen1 1 S 43 37 (36) 6 23 14 5Lammi2 2 S 50 45 (42) 5 18 15 17
2008Nauvo/Korppoo 3 S 28 28 (26) 0 9 10 9Tammela 4 S 40 40 (40) 0 20 14 6Iitti 5 S 35 31 (27) 4 13 12 8Kitee 6 E 20 13 (10) 7 8 10 2Laukaa/Toivakka 7 E 35 32 (30) 3 12 19 3Vieremä 8 W 26 24 (20) 2 18 6 2Laihia 9 W 41 41 (41) 0 24 1 16
2009Laitila 10 S 48 43 (42) 5 27 14 7Lieto/Paimio3 11 S 66 60 (60) 6 18 7 40Nurmijärvi 12 S 59 52 (52) 7 24 11 24Imatra/Ruokolahti 13 E 23 15 (15) 8 9 10 4Mikkeli4 14 E 25 17 (17) 8 9 13 3Kihniö/Parkano 15 W 26 18 (18) 8 10 16Nivala 16 W 30 27 (27) 3 25 3 2
Total 595 523 (503) 72 267 175 1481 including Humppila, Jokioinen, Koski Tl, Loimaa municipality, Somero, Ypäjä2 including Hämeenkoski, Kärkölä, Lammi, Mäntsälä, Pukkila3 including Lieto, Marttila, Paimio, Tarvasjoki4 including Joroinen, Juva, Jäppilä, Mikkeli, Pertunmaa5 S = South, E = East, W = West6 number of sprayed fields in parentheses7 added to this 5 fields with either cereal/pea or spring-sown rye
was either rainy weather conditions, particularly in 2008, or undersown clover/grass mixture. Four major types of active ingredients were used: pure MCPA (4-chloro-2-methylphenoxyacetic acid) in 7% of treated fields, phenoxy acid mixtures (22%), sulphonylureas (50%) and phenoxy acids + sulpho-nylurea tank mixtures (20%).
Weed sampling
The weed survey was carried out in 2007–2009 during a 4-week period starting in mid-July (weeks
no. 28–29), by which time the spring cereals had reached their heading stage and in most cases around one month had elapsed since herbicide treatment.
The weed sampling protocol was exactly the same as in the previous survey in 1997–1999 (Sa-lonen et al. 2001a). The occurrence of weeds was assessed from 10 sample quadrats randomly placed in each field. For this purpose, each field was split into a 10 x 10 cell grid in which the positions of sample quadrats were set with a random number calculator. The size of grid cells varied among fields according to the area of each field.
Weed density was determined by counting the number of plants or shoots of grass weeds by spe-

A G R I C U L T U R A L A N D F O O D S C I E N C E
Salonen, J. et al. Weed flora in spring cereals in Finland Vol. 20(2011): 245–261.
249248
cies in a rectangular frame measuring 0.1 m2 (25 cm × 40 cm), which was a corner area within a larger quadrat measuring 1.0 m2 (1.0 m × 1.0 m). The larger quadrat was used for observations on the presence/absence of each species. The results presented in the tables and figures derive from data collected from the 0.1 m2 quadrats and pooled over the 10 samples in each field. A complete list of the additional weed species found in the presence/absence observation (1 m2) is given in Appendix 1 as a supplement to the 40 most frequent species presented in the tables.
In four out of ten small sample quadrats, weeds and cereals were cut at the soil surface and their biomass was weighed by species after the samples had been dried in an air-flow dryer at 40°C for sev-eral days. The air-dry biomass results are presented in kg ha-1 which is the equivalent of 10 × g m-2.
Seed bank sampling
The seed sampling was conducted by taking one soil sample (10 × 10 cm in size, around 5 cm depth) from every weed sampling quadrat (0.1 m2, see above). The ten samples were mixed in the bucket and one 4 deciliter soil sample was taken for the final sample. Soil samples were taken to the laboratory and dried at room temperature. Seeds were separated from soil with tweezers and identified by species.
Nomenclature and data analysis
All weed species found in sampling areas were assessed. Nevertheless, some genera or taxa, e.g. Galeopsis spp. and Lamium spp., were pooled since they could not be unequivocally identified to species level at the small seedling stage.
The plant species nomenclature follows Hämet-Ahti et al. (1998), and the abbreviations of species names are according to the EPPO code system (formerly BAYER codes) available at the EPPO web site (www.eppo.org). The full scientific names
with attribution are given to the 40 most frequent species (Table 2).
The term frequency indicates the proportion of fields where the species was found. Differ-ences between frequency values were tested with Fisher’s Exact Test. For each field, the total weed density and biomass were summed, and the aver-ages, standard deviations and median values are presented by survey regions. Differences between the regions were tested with log-transformed val-ues using the MIXED procedure of SAS 9.2 (SAS Institute Inc, Cary, NC, USA). If not mentioned otherwise, the specific results concerning the weed occurrence in conventional cropping derive from the 503 fields treated with herbicides, i.e. the 20 non-sprayed fields were excluded.
The similarity of species composition between zones was compared using Jaccard’s similarity co-efficient Sj (Jaccard 1912) (Sj=c/(A+B-c), where c = number of species common to both samples A and B, A = number of species in sample A, B = number of species in sample B). The data were pooled over all fields of each zone before the analysis.
The diversity of weed species was described by species richness. The number of species was used as a measure of species richness. Since the number of species depends on the sample size and since the number of sampled fields varied among zones, regions and production types total species numbers could not be compared directly. Therefore, the expected number of species E(Sn) was calculated for each zone, region and produc-tion type using rarefaction:
( )E S
N NnNn
n
i
i
S
= −
−
=
∑ 11
where E(Sn) = expected number of species in a random sample of n individuals, S = total number of species in the entire collection, Ni = number of individuals in species i, N = total number of indi-viduals in the collection, n = sample size (number of individuals) chosen for standardization (see Heck et al. 1975).

A G R I C U L T U R A L A N D F O O D S C I E N C E A G R I C U L T U R A L A N D F O O D S C I E N C E
Salonen, J. et al. Weed flora in spring cereals in Finland
251250
Table 2. Frequencies (%) of weed species by regionsYear / Region
Species / Taxon 2007 2008 2009 Average1 2 3 4 5 6 7 8 9 10 11 12 13 14 15 16 2007–09
Achillea millefolium L 0 8 0 0 9 20 9 0 2 2 2 8 17 4 8 0 5Alopecurus geniculatus L. 5 0 0 0 3 5 6 12 2 0 8 7 4 4 8 10 4Artemisia vulgaris L. 0 10 0 3 0 20 0 0 0 21 0 14 17 4 8 0 6Brassica rapa L. ssp. oleifera (DC.) Metzg. 9 4 4 3 3 10 3 0 10 4 0 3 4 24 4 3 5Capsella bursa-pastoris (L.) Medik. 23 14 25 23 34 60 37 35 15 42 9 22 35 56 19 30 27
Cerastium fontanum Baumg. 7 6 0 5 11 60 0 27 0 0 0 12 9 12 12 0 8Chenopodium album L. 65 56 57 60 63 90 66 62 78 44 64 31 70 48 35 83 59Cirsium arvense (L.) Scop. 26 52 4 20 37 40 9 19 24 19 44 32 35 24 12 23 28Elymus repens (L.) Gould 30 50 46 63 51 80 63 85 54 46 45 44 96 72 69 63 56Epilobium angustifolium L. 0 6 0 8 9 0 14 12 0 2 2 0 4 4 12 13 5
Equisetum arvense L. 16 18 32 5 9 5 11 19 5 13 30 20 9 8 8 7 15Erysimum cheiranthoides L. 19 38 39 20 40 80 69 96 29 19 18 15 39 44 46 27 35Fallopia convolvulus (L.) À. Löve 51 62 39 68 54 45 26 8 78 38 70 68 96 28 12 63 53Fumaria officinalis L. 58 64 39 43 63 60 66 42 29 35 53 69 65 36 27 17 49Galeopsis L. spp.a 72 72 29 70 74 80 60 58 51 50 76 54 70 48 85 70 64
Galium spurium L.b 77 48 71 78 77 20 31 19 76 52 71 64 74 16 23 13 55Gnaphalium uliginom L. 5 36 0 30 37 75 66 88 2 25 0 8 43 64 58 17 29Juncus bufonius L. 0 0 0 3 14 20 0 23 0 2 0 0 0 16 12 0 4Lamium L. spp.c 42 28 93 35 54 10 14 0 20 60 68 56 48 24 8 7 39Lapsana communis L. 51 78 71 65 91 70 86 8 20 79 41 68 91 80 19 3 58
Matricaria matricarioides (Less.) Porter 16 20 7 25 29 55 57 58 17 21 12 19 52 52 58 47 29Myosotis arvensis (L.) Hill 42 58 32 38 66 70 69 54 39 40 44 39 57 76 38 33 48Persicaria lapathifolia (L.) Gray 21 36 14 43 26 50 46 31 17 15 44 34 57 48 62 60 36Phleum pratense L. 2 6 0 3 3 25 3 12 12 4 2 5 0 12 15 7 6Plantago major L. 5 18 7 5 11 55 31 42 5 8 5 14 13 24 4 10 14
Poa annua L. 12 14 14 25 14 45 71 65 29 33 21 20 9 44 62 60 31Poa pratensis L. 2 14 0 5 3 35 11 19 7 13 8 2 0 12 4 3 8Polygonum aviculare L. 35 40 36 53 57 65 57 58 44 60 61 59 26 40 62 73 52Ranunculus repens L. 7 26 7 8 29 65 40 69 7 4 9 19 26 24 50 20 22Sonchus arvensis L. 40 66 54 53 49 30 46 31 27 27 21 37 48 36 35 33 39
Sonchus asper (L.) Hill 7 10 0 5 0 0 0 0 5 0 20 5 0 0 0 0 5Spergula arvensis L. 16 46 32 53 34 85 71 62 22 44 24 17 78 56 88 43 43Stellaria media (L.) Vill. 86 54 50 83 66 80 57 58 78 73 82 47 78 60 73 80 69Taraxacum Weber spp. 53 64 14 40 60 70 17 81 32 6 24 63 57 24 8 17 39Thlaspi arvense L. 14 16 11 5 26 15 0 0 10 0 2 3 22 4 12 10 8
Trifolium L. spp.d 35 54 7 40 31 65 57 77 12 15 27 12 13 36 23 17 31Tripleurospermum inodorum (L.) Sch. Bip. 63 62 57 40 60 30 43 19 17 23 53 42 43 12 31 30 41Veronica L. spp.e 2 2 14 5 9 25 6 38 10 15 2 15 22 28 15 0 11Vicia L. spp.f 12 32 11 18 17 15 9 4 7 10 14 10 26 32 12 3 14Viola arvensis Murrayg 79 98 89 85 89 100 91 92 83 98 70 69 83 96 88 83 85amainly G. bifida and G. speciosa, bincl. G. aparine, cmainly L. purpureum, dmainly T. repens, emainly V. serpyllifolia, fmainly V. cracca, gincl. V. tricolor

A G R I C U L T U R A L A N D F O O D S C I E N C E
Salonen, J. et al. Weed flora in spring cereals in Finland Vol. 20(2011): 245–261.
251250
In rarefaction, the number of species of larger samples is scaled down to the given number of in-dividuals, which permits the comparison of species numbers among samples differing in size. Since the lowest numbers of individuals observed were 23081, 5316 and 37403 for zone, region and pro-duction type, respectively, we scaled sample sizes down to 23000, 5000 and 37000, respectively. Data from the ten 0.1 m2 sample quadrats were pooled before the calculation.
Results
Species richnessIn total 175 weed species were found in the large (1.0 m2) sampling quadrats and 148 in the small (0.1 m2) quadrats (see Appendix 1 for the species recorded in large quadrats but not included in the list of 40 most frequent species). The majority (i.e. 110 species) of the observed species occurred in less than 5% of the fields studied. Altogether 104 species were observed in organically cropped fields (N = 72) and 133 species in conventionally cropped, herbicide-treated fields (N = 503).
The total number of observed species, SOBS, in regions ranged from 48 to 76 (Table 3). In four regions (Jokioinen, Nauvo/Korppoo, Laihia and Laitila), the number of observed species was be-low 50 and in one region (Nurmijärvi) it exceeded 70. The same regions had the lowest and the high-est expected number of species, E(Sn), calculated by rarefaction analysis (Table 3). The total number of species was greatest in the southern and lowest in the western zone. The species composition of the southern zone was also most dissimilar among zones (Jaccard’s similarity: east vs. south = 0.411, south vs. west 0.311 and east vs. west 0.59).
Surprisingly, the total species number for con-ventionally farmed fields exceeded that for organi-cally farmed fields (Table 3). However, the average observed species number was higher in organically farmed fields, 21 (SD = 4.5, min 11, max 34), than
in conventionally farmed fields, 12 (SD = 4.7., min 3, max 26).
Frequency of weed species
The occurrence of the 40 most frequent weed species in the small 0.1 m2 sample quadrats is presented by region (Table 2) and the remaining species observed from the larger 1.0 m2 quadrats are listed by region (Appendix 1). The most com-mon weeds were broad-leaved species, including
Table 3. Observed (SOBS) and rarefied (E(Sn) and SD) number of species by zone, region and production type.
SOBS E(Sn)a SDZone South 131 113 2.91 East 105 101 1.81 West 84 84 0.16Region Jokioinen 49 48.4 0.69 Lammi 64 60.1 1.55 Nauvo/Korppoo 48 47.5 0.71 Tammela 63 59.1 1.60 Iitti 64 58.5 1.82 Kitee 63 61.3 1.18 Laukaa/Toivakka 63 55.5 2.01 Vieremä 57 57.0 0.17 Laihia 49 48.3 0.78 Laitila 49 45.7 1.44 Paimio/Tarvasjoki 62 56.2 1.86 Nurmijärvi 76 71.5 1.75 Imatra/Ruokolahti 64 60.6 1.42 Mikkeli mlk 65 62.9 1.28 Kihniö/Parkano 56 54.1 1.22 Nivala 51 50.6 0.64Production type Organic 105 105 0.33 Conventional 135 123 2.63aThe number of individuals used in the analysis: zone 23000, region 5000 and production type 37000

A G R I C U L T U R A L A N D F O O D S C I E N C E A G R I C U L T U R A L A N D F O O D S C I E N C E
Salonen, J. et al. Weed flora in spring cereals in Finland
253252
more frequent (p < 0.001) in organic than in con-ventional farming.
Some weed species were characteristic of cer-tain regions or zones in Finland; e.g. Lamium spp. and Galium spurium were most frequently found in southern regions, whereas the frequency of Ely-mus repens, Gnaphalium uliginosum, Matricaria matricarioides, Poa annua and Spergula arvensis increased towards the north. One of the most com-mon species, Lapsana communis, was relatively rare in the regions of western Finland.
Weed density
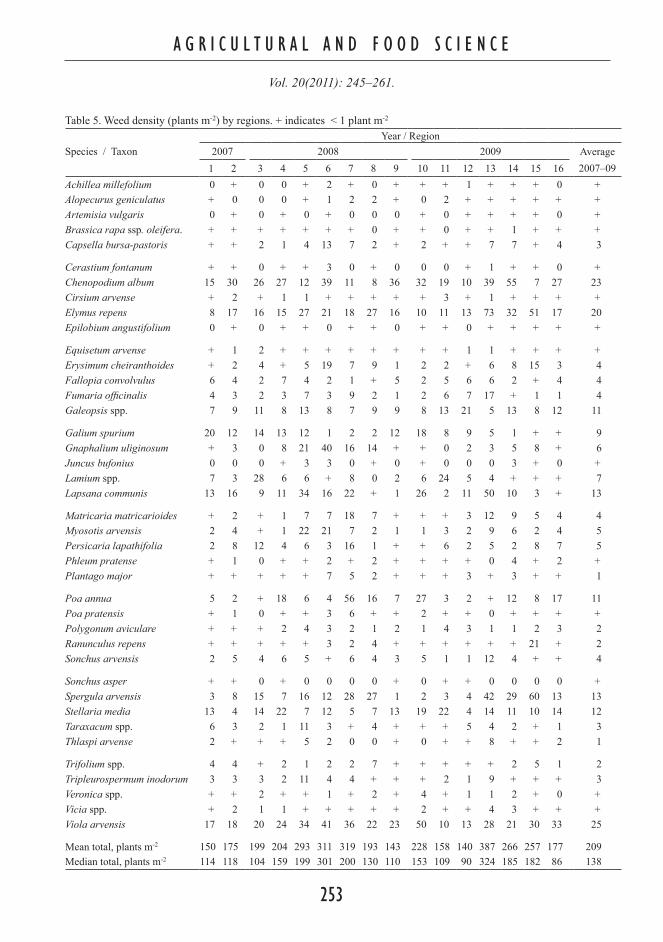
The average density of weeds in all fields surveyed was 209 plants m-2 (SD = 211, median = 138, N = 595) (Table 5). However, the difference between the two cropping systems was considerable; the average density of weeds in sprayed conventional fields was 160 plants m-2 (SD = 155, median = 112,
Viola arvensis, Stellaria media and Galeopsis spp., which were frequently found both in convention-ally and organically cropped fields. Nevertheless, there were evident differences in the ranking list of predominant weed species and their frequency levels between conventionally and organically cropped fields (Table 4).
With a frequency of 56%, Elymus repens was by far the most common grass weed (Table 4). The next most common grass species were Poa annua (31%), Poa pratensis (8%), Phleum pratense (6%) and Alopecurus geniculatus (4%). Altogether 23 grass species were identified in the sample quadrats (1.0 m2).
Highly productive perennial broad-leaved weed species occurred more frequently (p < 0.001) in organic than in conventional farming; Sonchus arvensis had a frequency of 61% in organic and 35% in conventional fields and Cirsium arvense 46% and 25%, respectively. Typical grassland weed species such as Achillea millefolium 26% vs. 1% and Ranunculus repens 47% vs. 17% were
Table 4. Frequency of ten most common weed species in two cropping systems and the change in frequency-% from 1997–1999 to 2007–2009. For comparison, additional four species from the other cropping system are included.
Sprayed conventional (N = 503) Organic (N = 72)Rank Weed species % Change Weed species % Change1 Viola arvensis 83 +2 Chenopodium album 96* 02 Stellaria media 65 0 Stellaria media 94* -13 Galeopsis spp. 59 -1 Viola arvensis 94* +14 Galium spurium 59 +16 Elymus repens 89* +85 Lapsana communis 57 +5 Spergula arvensis 89* +66 Fallopia convolvulus 53 +5 Galeopsis spp. 88* -57 Chenopodium album 52 -1 Erysimum cheiranthoides 86* +48 Elymus repens 50 -9 Myosotis arvensis 72* +129 Fumaria officinalis 48 +9 Polygonum aviculare 72* +210 Polygonum aviculare 48 -2 Persicaria lapathifolia 68* +15
Spergula arvensis 34 -1 Galium spurium 39* +2Erysimum cheiranthoides 25 -4 Lapsana communis 60 +3Myosotis arvensis 44 +4 Fallopia convolvulus 58 -5Persicaria lapathifolia 30 -3 Fumaria officinalis 58 +17
* indicates significant difference in species frequencies between cropping systems (Fisher's Exact Test, p < 0.05)
A G R I C U L T U R A L A N D F O O D S C I E N C E
Salonen, J. et al. Weed flora in spring cereals in Finland Vol. 20(2011): 245–261.
253252
Table 5. Weed density (plants m-2) by regions. + indicates < 1 plant m-2
Year / RegionSpecies / Taxon 2007 2008 2009 Average
1 2 3 4 5 6 7 8 9 10 11 12 13 14 15 16 2007–09Achillea millefolium 0 + 0 0 + 2 + 0 + + + 1 + + + 0 +Alopecurus geniculatus + 0 0 0 + 1 2 2 + 0 2 + + + + + +Artemisia vulgaris 0 + 0 + 0 + 0 0 0 + 0 + + + + 0 +Brassica rapa ssp. oleifera. + + + + + + + 0 + + 0 + + 1 + + +Capsella bursa-pastoris + + 2 1 4 13 7 2 + 2 + + 7 7 + 4 3
Cerastium fontanum + + 0 + + 3 0 + 0 0 0 + 1 + + 0 +Chenopodium album 15 30 26 27 12 39 11 8 36 32 19 10 39 55 7 27 23Cirsium arvense + 2 + 1 1 + + + + + 3 + 1 + + + +Elymus repens 8 17 16 15 27 21 18 27 16 10 11 13 73 32 51 17 20Epilobium angustifolium 0 + 0 + + 0 + + 0 + + 0 + + + + +
Equisetum arvense + 1 2 + + + + + + + + 1 1 + + + +Erysimum cheiranthoides + 2 4 + 5 19 7 9 1 2 2 + 6 8 15 3 4Fallopia convolvulus 6 4 2 7 4 2 1 + 5 2 5 6 6 2 + 4 4Fumaria officinalis 4 3 2 3 7 3 9 2 1 2 6 7 17 + 1 1 4Galeopsis spp. 7 9 11 8 13 8 7 9 9 8 13 21 5 13 8 12 11
Galium spurium 20 12 14 13 12 1 2 2 12 18 8 9 5 1 + + 9Gnaphalium uliginosum + 3 0 8 21 40 16 14 + + 0 2 3 5 8 + 6Juncus bufonius 0 0 0 + 3 3 0 + 0 + 0 0 0 3 + 0 +Lamium spp. 7 3 28 6 6 + 8 0 2 6 24 5 4 + + + 7Lapsana communis 13 16 9 11 34 16 22 + 1 26 2 11 50 10 3 + 13
Matricaria matricarioides + 2 + 1 7 7 18 7 + + + 3 12 9 5 4 4Myosotis arvensis 2 4 + 1 22 21 7 2 1 1 3 2 9 6 2 4 5Persicaria lapathifolia 2 8 12 4 6 3 16 1 + + 6 2 5 2 8 7 5Phleum pratense + 1 0 + + 2 + 2 + + + + 0 4 + 2 +Plantago major + + + + + 7 5 2 + + + 3 + 3 + + 1
Poa annua 5 2 + 18 6 4 56 16 7 27 3 2 + 12 8 17 11Poa pratensis + 1 0 + + 3 6 + + 2 + + 0 + + + +Polygonum aviculare + + + 2 4 3 2 1 2 1 4 3 1 1 2 3 2Ranunculus repens + + + + + 3 2 4 + + + + + + 21 + 2Sonchus arvensis 2 5 4 6 5 + 6 4 3 5 1 1 12 4 + + 4
Sonchus asper + + 0 + 0 0 0 0 + 0 + + 0 0 0 0 +Spergula arvensis 3 8 15 7 16 12 28 27 1 2 3 4 42 29 60 13 13Stellaria media 13 4 14 22 7 12 5 7 13 19 22 4 14 11 10 14 12Taraxacum spp. 6 3 2 1 11 3 + 4 + + + 5 4 2 + 1 3Thlaspi arvense 2 + + + 5 2 0 0 + 0 + + 8 + + 2 1
Trifolium spp. 4 4 + 2 1 2 2 7 + + + + + 2 5 1 2Tripleurospermum inodorum 3 3 3 2 11 4 4 + + + 2 1 9 + + + 3Veronica spp. + + 2 + + 1 + 2 + 4 + 1 1 2 + 0 +Vicia spp. + 2 1 1 + + + + + 2 + + 4 3 + + +Viola arvensis 17 18 20 24 34 41 36 22 23 50 10 13 28 21 30 33 25
Mean total, plants m-2 150 175 199 204 293 311 319 193 143 228 158 140 387 266 257 177 209Median total, plants m-2 114 118 104 159 199 301 200 130 110 153 109 90 324 185 182 86 138

A G R I C U L T U R A L A N D F O O D S C I E N C E A G R I C U L T U R A L A N D F O O D S C I E N C E
Salonen, J. et al. Weed flora in spring cereals in Finland
255254
Table 6. Weed biomass (kg ha-1) by regions. + indicates < 1 kg ha-1
Year / RegionSpecies / Taxon 2007 2008 2009 Average
1 2 3 4 5 6 7 8 9 10 11 12 13 14 15 16 2007–09Achillea millefolium 0 3 + 0 + 2 0 0 0 0 0 6 + 0 0 0 +Alopecurus geniculatus 0 0 0 0 + 2 3 1 2 0 2 3 + 0 + + 1Artemisia vulgaris 0 + 0 0 0 + 0 0 0 + 0 1 0 0 0 0 +Brassica rapa ssp. oleifera 0 0 0 0 + 2 0 0 1 + 0 0 1 10 0 3 +Capsella bursa-pastoris + 0 + + 3 2 2 6 + 3 0 + 2 4 + 4 1
Cerastium fontanum 0 0 0 0 + + 0 0 0 0 0 + 0 0 0 0 +Chenopodium album 11 25 17 46 37 60 8 5 51 29 12 8 31 104 4 40 27Cirsium arvense 8 6 0 7 29 1 2 0 7 3 18 5 8 23 + 2 8Elymus repens 19 63 34 95 72 50 65 102 79 45 38 49 217 127 196 61 72Epilobium angustifolium 0 0 0 0 0 0 + 0 0 0 0 0 0 0 0 + +
Equisetum arvense + 6 7 + 1 0 + + + 1 3 11 9 + 0 + 3Erysimum cheiranthoides + + + 1 1 12 4 2 1 3 + + + 4 4 2 2Fallopia convolvulus 3 3 2 7 7 4 1 0 5 3 2 5 9 3 + 4 4Fumaria officinalis 2 2 1 2 7 3 9 + 3 1 3 7 19 1 0 3 4Galeopsis spp. 8 11 2 32 21 20 12 11 30 32 9 20 9 20 13 13 17
Galium spurium 14 17 16 10 10 + 3 + 13 17 4 4 1 0 10 + 8Gnaphalium uliginosum + + 0 + + + + 0 0 + 0 0 + + 3 + +Juncus bufonius 0 0 0 + 2 5 0 + 0 0 0 0 0 + 0 0 +Lamium spp. 3 + 10 2 7 0 10 0 1 3 6 3 2 + 0 + 3Lapsana communis 4 12 4 11 12 12 10 0 1 16 + 6 53 8 1 0 8
Matricaria matricarioides + + 0 + 5 2 7 1 + + + + 2 6 + 4 2Myosotis arvensis 1 + + + 4 8 3 + + + + + 2 1 + 1 1Persicaria lapathifolia + 14 3 11 14 4 11 1 + + 9 2 6 5 11 22 7Phleum pratense 0 12 0 0 0 2 1 0 8 0 13 1 0 3 4 0 4Plantago major + + 0 0 + 5 + 0 0 + 0 + + 4 0 1 +
Poa annua + 0 0 6 3 + 11 9 12 21 + 2 + 5 2 24 6Poa pratensis 0 + 0 + 0 3 + 4 1 + + + 0 + 0 + +Polygonum aviculare + + + 5 7 6 3 + 1 + 8 4 + 2 + 8 3Ranunculus repens 0 + + + 0 2 + 2 0 0 + + + 0 + + +Sonchus arvensis 3 9 0 29 27 + 40 13 7 15 2 2 32 14 4 1 12
Sonchus asper + + 0 + 0 0 0 0 0 0 + + 0 0 0 0 +Spergula arvensis 1 3 31 8 16 15 33 65 3 1 2 7 44 50 89 13 18Stellaria media 4 + 7 25 8 12 2 4 8 34 9 5 7 23 19 14 11Taraxacum spp. + 3 + + 3 4 + + + 0 + 6 4 + 0 + 1Thlaspi arvense + 0 0 0 3 5 0 0 + 0 0 + 6 + + + +
Trifolium spp. + + 0 + 3 + + 0 + + + 2 0 0 0 0 +Tripleurospermum inodorum + 3 0 3 4 1 1 0 6 + + 4 3 0 0 + 2Veronica spp. + 0 1 0 0 0 + 1 + 5 + + 0 + 0 0 +Vicia spp. + 2 2 3 2 0 4 0 0 2 + 1 4 7 0 + 2Viola arvensis 4 7 + 11 11 17 10 7 11 26 1 3 7 8 4 12 8
Mean total, kg ha-1 93 212 140 338 333 272 263 247 255 288 148 189 494 449 377 241 251Median total, kg ha-1 28 84 36 141 195 220 155 163 153 144 61 88 335 195 248 109 110
A G R I C U L T U R A L A N D F O O D S C I E N C E
Salonen, J. et al. Weed flora in spring cereals in Finland Vol. 20(2011): 245–261.
255254
Table 6. Weed biomass (kg ha-1) by regions. + indicates < 1 kg ha-1
Year / RegionSpecies / Taxon 2007 2008 2009 Average
1 2 3 4 5 6 7 8 9 10 11 12 13 14 15 16 2007–09Achillea millefolium 0 3 + 0 + 2 0 0 0 0 0 6 + 0 0 0 +Alopecurus geniculatus 0 0 0 0 + 2 3 1 2 0 2 3 + 0 + + 1Artemisia vulgaris 0 + 0 0 0 + 0 0 0 + 0 1 0 0 0 0 +Brassica rapa ssp. oleifera 0 0 0 0 + 2 0 0 1 + 0 0 1 10 0 3 +Capsella bursa-pastoris + 0 + + 3 2 2 6 + 3 0 + 2 4 + 4 1
Cerastium fontanum 0 0 0 0 + + 0 0 0 0 0 + 0 0 0 0 +Chenopodium album 11 25 17 46 37 60 8 5 51 29 12 8 31 104 4 40 27Cirsium arvense 8 6 0 7 29 1 2 0 7 3 18 5 8 23 + 2 8Elymus repens 19 63 34 95 72 50 65 102 79 45 38 49 217 127 196 61 72Epilobium angustifolium 0 0 0 0 0 0 + 0 0 0 0 0 0 0 0 + +
Equisetum arvense + 6 7 + 1 0 + + + 1 3 11 9 + 0 + 3Erysimum cheiranthoides + + + 1 1 12 4 2 1 3 + + + 4 4 2 2Fallopia convolvulus 3 3 2 7 7 4 1 0 5 3 2 5 9 3 + 4 4Fumaria officinalis 2 2 1 2 7 3 9 + 3 1 3 7 19 1 0 3 4Galeopsis spp. 8 11 2 32 21 20 12 11 30 32 9 20 9 20 13 13 17
Galium spurium 14 17 16 10 10 + 3 + 13 17 4 4 1 0 10 + 8Gnaphalium uliginosum + + 0 + + + + 0 0 + 0 0 + + 3 + +Juncus bufonius 0 0 0 + 2 5 0 + 0 0 0 0 0 + 0 0 +Lamium spp. 3 + 10 2 7 0 10 0 1 3 6 3 2 + 0 + 3Lapsana communis 4 12 4 11 12 12 10 0 1 16 + 6 53 8 1 0 8
Matricaria matricarioides + + 0 + 5 2 7 1 + + + + 2 6 + 4 2Myosotis arvensis 1 + + + 4 8 3 + + + + + 2 1 + 1 1Persicaria lapathifolia + 14 3 11 14 4 11 1 + + 9 2 6 5 11 22 7Phleum pratense 0 12 0 0 0 2 1 0 8 0 13 1 0 3 4 0 4Plantago major + + 0 0 + 5 + 0 0 + 0 + + 4 0 1 +
Poa annua + 0 0 6 3 + 11 9 12 21 + 2 + 5 2 24 6Poa pratensis 0 + 0 + 0 3 + 4 1 + + + 0 + 0 + +Polygonum aviculare + + + 5 7 6 3 + 1 + 8 4 + 2 + 8 3Ranunculus repens 0 + + + 0 2 + 2 0 0 + + + 0 + + +Sonchus arvensis 3 9 0 29 27 + 40 13 7 15 2 2 32 14 4 1 12
Sonchus asper + + 0 + 0 0 0 0 0 0 + + 0 0 0 0 +Spergula arvensis 1 3 31 8 16 15 33 65 3 1 2 7 44 50 89 13 18Stellaria media 4 + 7 25 8 12 2 4 8 34 9 5 7 23 19 14 11Taraxacum spp. + 3 + + 3 4 + + + 0 + 6 4 + 0 + 1Thlaspi arvense + 0 0 0 3 5 0 0 + 0 0 + 6 + + + +
Trifolium spp. + + 0 + 3 + + 0 + + + 2 0 0 0 0 +Tripleurospermum inodorum + 3 0 3 4 1 1 0 6 + + 4 3 0 0 + 2Veronica spp. + 0 1 0 0 0 + 1 + 5 + + 0 + 0 0 +Vicia spp. + 2 2 3 2 0 4 0 0 2 + 1 4 7 0 + 2Viola arvensis 4 7 + 11 11 17 10 7 11 26 1 3 7 8 4 12 8
Mean total, kg ha-1 93 212 140 338 333 272 263 247 255 288 148 189 494 449 377 241 251Median total, kg ha-1 28 84 36 141 195 220 155 163 153 144 61 88 335 195 248 109 110
N = 503) and in organic production 519 plants m-2
(SD = 244, median = 468, N = 72). The total weed densities were significantly lower (p < 0.05) in the regions with intensive cereal production (e.g. regions 1, 4, 9, 12) compared with regions (e.g. 6, 7, 13) where cattle farms and organic production predominated.
The five most abundant weed species in organ-ic fields were Chenopodium album (on average 107 plants m-2), Elymus repens (68), Spergula ar-vensis (50), Viola arvensis (31) and Stellaria me-dia (26). Correspondingly, the five most abundant weed species in sprayed conventional fields were Viola arvensis (24), Lapsana communis (13), Poa annua (13), Elymus repens (12) and Chenopodium album (11).
Although not revealed in observations from sample quadrats, the substantially increased number of fields infested with Avena fatua was an evident discovery of the survey. Typically, some individuals of A. fatua grew in a few patches in infested fields. The information from farmers’ in-terviews provided support to this conclusion as they classified almost 30% (168 fields) of fields as infested and we detected even more fields. In comparison, the proportion of surveyed fields in-fested with A. fatua was only around 10% (74 fields out of 690 fields) ten years ago.
Weed biomass
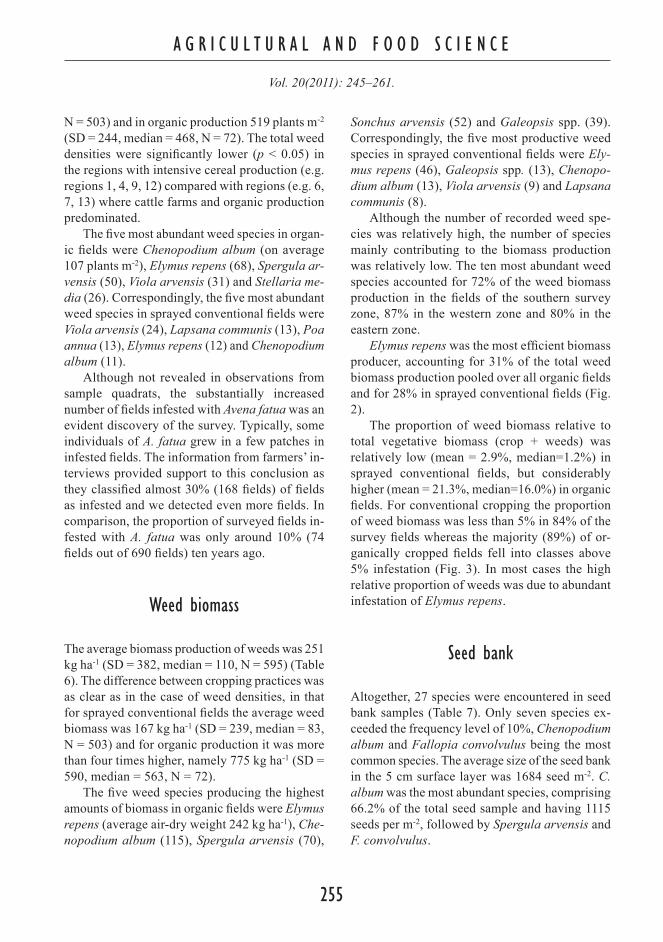
The average biomass production of weeds was 251 kg ha-1 (SD = 382, median = 110, N = 595) (Table 6). The difference between cropping practices was as clear as in the case of weed densities, in that for sprayed conventional fields the average weed biomass was 167 kg ha-1 (SD = 239, median = 83, N = 503) and for organic production it was more than four times higher, namely 775 kg ha-1 (SD = 590, median = 563, N = 72).
The five weed species producing the highest amounts of biomass in organic fields were Elymus repens (average air-dry weight 242 kg ha-1), Che-nopodium album (115), Spergula arvensis (70),
Sonchus arvensis (52) and Galeopsis spp. (39). Correspondingly, the five most productive weed species in sprayed conventional fields were Ely-mus repens (46), Galeopsis spp. (13), Chenopo-dium album (13), Viola arvensis (9) and Lapsana communis (8).
Although the number of recorded weed spe-cies was relatively high, the number of species mainly contributing to the biomass production was relatively low. The ten most abundant weed species accounted for 72% of the weed biomass production in the fields of the southern survey zone, 87% in the western zone and 80% in the eastern zone.
Elymus repens was the most efficient biomass producer, accounting for 31% of the total weed biomass production pooled over all organic fields and for 28% in sprayed conventional fields (Fig. 2).
The proportion of weed biomass relative to total vegetative biomass (crop + weeds) was relatively low (mean = 2.9%, median=1.2%) in sprayed conventional fields, but considerably higher (mean = 21.3%, median=16.0%) in organic fields. For conventional cropping the proportion of weed biomass was less than 5% in 84% of the survey fields whereas the majority (89%) of or-ganically cropped fields fell into classes above 5% infestation (Fig. 3). In most cases the high relative proportion of weeds was due to abundant infestation of Elymus repens.
Seed bank
Altogether, 27 species were encountered in seed bank samples (Table 7). Only seven species ex-ceeded the frequency level of 10%, Chenopodium album and Fallopia convolvulus being the most common species. The average size of the seed bank in the 5 cm surface layer was 1684 seed m-2. C. album was the most abundant species, comprising 66.2% of the total seed sample and having 1115 seeds per m-2, followed by Spergula arvensis and F. convolvulus.

A G R I C U L T U R A L A N D F O O D S C I E N C E A G R I C U L T U R A L A N D F O O D S C I E N C E
Salonen, J. et al. Weed flora in spring cereals in Finland
257256
Sprayed conventional (N=503)
0 5 10 15 20 25 30 35
AGRRE
GAESS
CHEAL
VIOAR
LAPCO
STEME
GALSP
SPRAR
POAAN
SONAR
Species rank
Proportion, %
0 5 10 15 20 25 30 35
AGRRE
CHEAL
SPRAR
SONAR
GAESS
STEME
POLLA
CIRAR
AVEFA
POLAV
Proportion, %
Species rank Organic (N=72)
Fig. 2. Proportion of the total weed biomass production by the most abundant species in conventional and organic fields. Key of EPPO code abbrevia-tions: AGRRE Elymus repens, AVEFA Avena fatua, CHEAL Chenopodium album, CIRAR Cirsium arvense , GAESS, Galeopsis spp., GALSP Galium spurium, LAPCO Lapsana com-munis, POAAN Poa annua, POLAV Polygonum aviculare, POLLA Persicaria lapathifo-lia, SONAR Sonchus arven-sis, SPRAR Spergula arven-sis, STEME Stellaria media, VIOAR Viola arvensis.
0
10
20
30
40
50
0-1 1-5 5-10 10-25 >25
Proportion of weed biomass, %
Fields (%)
Conventional Organic
Fig. 3. Relative number of fields (%) in different weed biomass classes in two cropping systems. Weed biomass is proportioned to total vegetative biomass (crop + weeds).

A G R I C U L T U R A L A N D F O O D S C I E N C E
Salonen, J. et al. Weed flora in spring cereals in Finland Vol. 20(2011): 245–261.
257256
Table 7. Occurrence of weed seeds in the top-soil (0–5 cm) of the survey fields.
Weed speciesFrequency of occurrence
(%)Proportion of total sample
(%)Seeds
m-2
Agrostis capillaris 0.5 0.1 1Alopecurus geniculatus 6.1 1.6 26Brassica rapa 0.5 0.1 1Capsella bursa-pastoris 0.3 0.1 2Chenopodium album 79.8 66.2 1115Cirsium arvense 0.5 <0.1 1Elymus repens 3.9 0.6 10Fallopia convolvulus 41.5 8.0 136Fumaria officinalis 1.5 0.1 2Galeopsis spp. 23.4 3.8 64Galium album 0.2 <0.1 <1Galium spurium 17.0 2.6 44Lapsana communis 1.2 0.1 2Myosotis arvensis 6.2 1.2 20Persicaria lapathifolia 13.8 1.8 30Phleum pratense 2.0 0.2 4Poa annua 0.3 0.1 1Polygonum aviculare 12.1 1.9 32Ranunculus repens 0.3 <0.1 1Rumex longifolius 0.2 <0.1 <1Sonchus asper 0.2 <0.1 <1Spergula arvensis 10.1 10.6 179Stellaria media 3.9 0.6 9Taraxacum officinale 0.2 0 <1Thlaspi arvense 1.0 0.1 1Vicia cracca 1.0 0.1 1Viola arvensis 1.3 0.3 4
Discussion
The weed survey in 2007–2009 can be regarded as a follow-up study for the previous survey car-ried out in 1997–1999 in the same 16 regions and mainly at the same farms and fields (Salonen et al. 2001a). Moreover, the monitoring protocol was exactly the same as in the 1990s. Spring cereals, covering about 50–55% of the arable land, still dominate crop production in Finland and the only major shift in cereal cropping during the last ten years has been the doubled area of spring wheat, reaching almost 200 000 ha, having been around
100 000 ha ten years ago (TIKE 2009). The areas of spring barley (52% of spring cereal area) and oats (30%) remain much higher than that of spring wheat. A marked shift towards winter cereal crop-ping, as in Denmark (Andreasen and Stryhn 2008), has not occurred in Finland.
The number of weed species, 148, found in small sample quadrats (0.1 m2) was slightly lower than ten years ago when 160 species were record-ed (Salonen et al. 2001a). In the larger (1.0 m2) quadrats the number of observed species was now

A G R I C U L T U R A L A N D F O O D S C I E N C E A G R I C U L T U R A L A N D F O O D S C I E N C E
Salonen, J. et al. Weed flora in spring cereals in Finland
259258
175 versus 188 species ten years ago. An obvious reason for reduction in floral diversity is that the total number of surveyed fields was lower (595 vs. 690). Particularly the number of organically grown fields was less than half compared with the 1997–1999 survey. In comparison, the total num-ber of weed species found in spring cereal fields in the Czech Republic was 101, with an average of 13 species per field (Tyšer & Kolárová 2010). Much lower total numbers of weeds, 64 species, were found in arable fields in Alaska, at a similar latitude as in Finland (Conn et al. 2011), whereas the species number recorded in Danish arable fields in 2001–2004 was as high as 225 (Andreasen and Stryhn 2008).
Only 38 weed species or taxa exceeded the overall frequency level of 5%. Among the most common weed species, Galium spurium, (+16% units increase since the 1990s), Fumaria officinalis (+9), Lapsana communis (+5) and Fallopia convol-vulus (+5) have become more frequent, whereas Elymus repens (-9) has become less frequent since 1997–1999. The newcomers in the list of 40 most frequent species were Alopecurus geniculatus, Artemisia vulgaris, Phleum pratense, Poa praten-sis and Sonchus asper. Appearance of new grass species in the list is evidently a consequence of increased proportion of survey fields with reduced tillage, which favours grasses, as demonstrated in other studies (e.g. Gruber et al. 2000, Jalli et al. 2006, Tørresen et al. 2006, Thomas et al. 2011). Moreover, it has been demonstrated that reduced tillage has a major, although complex, role in pro-moting weed species diversity (Murphy et al. 2006) and in determining the weed community compo-sition (Légère et al. 2005). In our survey fields, the proportion of non-inversion tillage (i.e. only tine-cultivated or direct-drilled) had increased from 14% in 1997–1999 to 44 % (27% tine-cultivated and 17% direct-drilled) in 2007–2009.
Overall, the frequencies of occurrence for the most common weed species were significantly higher in organic cropping than in conventional cropping. Evidently this is partly due to the success of chemical weed control, but is also a consequence of more intensive crop management resulting in more competitive crop stands in conventional crop-
ping. The impact of intensity is an obvious reason also for the tremendous decline in the number of seeds in the soil between the present survey (1168 seeds per m-2) and the 1960s survey (43850 seeds per m-2) (Paatela and Erviö 1971). Such a differ-ence is partly due to the difference in the soil sam-ple, which was taken from a 5 cm top layer in our study and from a 20 cm layer in the 1960s. How-ever, Chenopodium album was the most common and abundant species in both decades.
The proportion of organically cropped survey fields was relatively high in certain regions such as Kitee, Kihniö/Parkano and Imatra/Ruokolahti and this is reflected to some extent in the results, for instance as a higher frequency of Spergula arvensis in those regions. On the other hand, some common species were relatively rare in certain zones, like Lapsana communis in western Finland, as discov-ered already in the 1960s (Mukula et al. 1969). The regional specialization is a complex of many fac-tors, including prevailing crop rotations, soil types, tillage practices, proportion of organic farming etc., still existing and affecting the specific weed occur-rence in different regions.
Galium spurium (probably including some pop-ulations of Galium aparine) is a typical example of this ‘regionalization’ as it has become very frequent (66% in southern vs. 35–37% in eastern and west-ern zones) in the southern survey zone, which is characterized by clay soils, monoculture of cereals and reduced tillage. For instance, reduced tillage practices seem to favour Galium species (Tørresen & Skuterud 2002, Thomas et al. 2011). In addition, a long-lasting use of first generation sulphonylurea herbicides with weak efficacy against Galium spe-cies has been an evident promoting factor, although Hyvönen et al. (2003b) found only weak statistical support for the selection pressure on weed commu-nities due to the application of sulphonylureas. This aspect is worth re-analyzing by further dissecting the survey data series and making comparisons be-tween the decades now that sulphonylureas have largely replaced phenoxy acid herbicides.
Elymus repens is the most harmful weed spe-cies for spring cereals in Finland, producing about 30% of weed biomass in both cropping systems. In conventional cropping, farmers seemingly re-

A G R I C U L T U R A L A N D F O O D S C I E N C E
Salonen, J. et al. Weed flora in spring cereals in Finland Vol. 20(2011): 245–261.
259258
spond to the situation as the sales of glyphosate have more than doubled in ten years (Londesbor-ough et al. 2000, Evira 2010). Approximately 60% of the direct-drilled survey fields had been treated with glyphosate in the spring before sowing and the annual application of glyphosate before sowing time was a common practice in these fields. Like-wise, the decline of E. repens has been observed in Denmark and associated with increased use of glyphosate (Andreasen and Stryhn 2008).
The abundance of weeds in organic cropping is slowly approaching the infestation level of 1 000 kg ha-1 recorded in unsprayed conventionally cropped fields in the 1960s (Mukula 1974). There-fore, measures promoting crop competition, as well as reliance on physical weed control should be em-phasized in organic cropping (Kolb et al. 2010). For instance, the abundance of E. repens in organic cropping is a cause for some concern and calls for improved control strategies. Contradictory findings on the success of E. repens in organic cropping over time have been reported by Becker and Hurle (1998), who demonstrated decreased frequency of E. repens, whereas Riesinger and Hyvönen (2006b) found increased abundances as a function of the duration of organic farming. In general, E. repens is probably going to benefit from climate change, which could extend its period of autumn growth (Tørresen et al. 2010).
The area of organic farming in Finland has levelled out at around 6–7% of arable land (TIKE 2009) and subsidized by agri-environment policy this has successfully promoted diverse and abun-dant weed flora to the benefit of biological diver-sity. However, the success of E. repens in organic cropping should not be regarded as a positive trend because it is a very competitive species that greatly reduces crop yield and has only little benefit for biodiversity, and actually mainly benefits harmful phytophagous insects (Hyvönen and Huusela-Veis-tola 2008). As regards biological diversity, other frequently observed perennial weed species such as Cirsium arvense and Sonchus arvensis are more favourable (Hyvönen and Huusela-Veistola 2008)
In conventional cropping, the relatively high efficacy of weed control and good competitive ability of spring cereals leads to a conclusion that
enhancement of biodiversity with rich and ad-vantageous flora should be primarily realized by establishing specific flower-strips (e.g. van Elsen and Hotze 2008), “ecological compensation areas” (Aviron et al. 2009) or by introducing completely new incentives in which farmers commit them-selves to conservation of weed species by reduc-ing the chemical inputs, primarily fertilizers and herbicides (Ulber et al. 2010).
New grass weed species were introduced on to the list of most frequent species, possibly reflect-ing the changes in tillage practices towards non-inversion soil cultivation. The frequent occurrence of Avena fatua is alarming and requires prompt action to manage the problem. As suggested by Conn et al. (2011), research and implementation of prevention programmes should be emphasized as the costs of controlling an outbreak are much higher than for preventing one. Likewise, the suc-cess of Poa annua is worth taking note of as its frequency (31%) had significantly increased in ten years, having been 12% in 1997–1999 (Salonen et al. 2001a). The success of P. annua is in line with observations in the Nordic countries (Tørresen et al. 2006, Andreasen and Stryhn 2008). Among the broad-leaved weed species, the success of Galium spurium in conventional cropping, as well as Fu-maria officinalis, Myosotis arvensis and Persicaria lapathifolia in organic cropping, should be regard-ed as a weed shift.
In conclusion, although the weed flora in Finn-ish spring cereal fields consists of numerous weed species, only a fraction of them severely threaten crop production at national level in terms of fre-quency and abundance. A wider range of grass weed species may interfere with the production of cereals in the future, particularly if there will be a shift towards winter cereal cropping with reduced tillage. Thus, new grass weed management strate-gies, both preventive and curative, should be em-phasized. In general, the range of herbicides with different modes of action (mainly sulphonylureas, phenoxy acids and glyphosate) is limited on the Finnish market, and the risks of weeds evolving herbicide resistance should be taken into account.
At present, weeds in conventional cropping can be effectively managed with the current, relatively

A G R I C U L T U R A L A N D F O O D S C I E N C E A G R I C U L T U R A L A N D F O O D S C I E N C E
Salonen, J. et al. Weed flora in spring cereals in Finland
261260
intensive cropping measures and with available herbicides whereas weed management in organic cropping calls for urgent measures such as direct mechanical weed control in crop stands, which was not practiced at all in survey fields. This would likely benefit also species richness by diminishing the dominance of competitive perennial weeds.
Acknowledgements. The weed survey was part of the follow-up study on the impacts of agri-environment policy measures (MYTVAS) and part-financed by the Ministry of Agriculture and Forestry. We thank all farmers who allowed us to visit their fields and provided us with information about their farming practices. Our permanent technical staff, Eira-Maija Tanni, Anne Muotila and Marjo Segerstedt and a team of field assistants Miko Häsä, Osmo Jalli, Mar-jaana Järveläinen, Saara Kinnunen, Sini Stenbacka and Tuija Vihervirta are acknowledged for their enthusiastic toil. Timo Hurme advised us in statistics. This paper is dedicated to Professor Leila-Riitta Erviö who passed away in May 2011.
References Andreasen, C. & Skovgaard, I.M. 2009. Crop and soil fac-
tors of importance for the distribution of plant species on arable fields in Denmark. Agriculture, Ecosystems and Environment 133: 61–67.
Andreasen, C. & Streibig, J. 2011. Evaluation of changes in weed flora in arable fields of Nordic countries – based on Danish long-term surveys. Weed Research 51:214–226.
Andreasen, C. & Stryhn, H. 2008. Increasing weed flora in Danish arable fields and its importance for biodiver-sity. Weed Research 48: 1–9.
Aviron, S., Nitsch, H., Jeanneret, P., Buholzer, S., Luka, H., Pfiffner, L, Pozzi, S., Schüpbach, B., Walter, T. & Her-zog, F. 2009. Ecological cross compliance promotes farmland biodiversity in Switzerland. Frontiers in Ecol-ogy and the Environment 7: 247–252.
Becker, B. & Hurle, K. 1998. Unkrautflora auf Feldern mit unterschiedlich langer ökologischer Bewirtschaftung. Zeitschrift für Pflanzenkrankheiten und Pflanzenschutz, Sonderheft XVI: 155–161.
Conn, J.S., Werdin-Pfisterer, N.R. & Beattie, K.L. 2011. De-velopment of the Alaska agricultural weed flora 1981–2004: a case for prevention. Weed Research 51: 63–70.
Erviö, L.-R. & Salonen, J. 1987. Changes in the weed pop-ulation of spring cereals in Finland. Annales Agriculturae Fenniae 26: 210–226.
Evira 2010. Sales of agricultural herbicides. Available at: http://www.evira.fi/portal/en/plant_production_and_feeds/plant_protection_products/statistics/. Accessed 15 Jun 2010.
Fried, G., Norton, L.R. & Reboud, X. 2008. Environmen-tal and management factors determining weed species composition and diversity in France. Agriculture, Eco-systems and Environment 128: 68–76.
Gruber, H. Händel, K. & Broschewitz, B. 2000. Einfluß der Wirtschaftsweise auf die Unkrautflora in Mähdrusch-früchten einer sechsfeldrigen Fruchtfolge. Zeitschrift für Pflanzenkrankheiten und Pflanzenschutz, Sonder-heft XVII, 33–40.
Hämet-Ahti, L., Suominen, J., Ulvinen, T. & Uotila, P. 1998. Retkeilykasvio (Field Flora of Finland), 4th ed. Finnish Museum of Natural History, Botanical Museum. Hel-sinki. 656 p.
Heck, K.L.J., van Belle, G. & Simberloff, D. 1975. Explic-it calculation of the rarefaction diversity measurement and the determination of sufficient sample size. Ecolo-gy 56: 1459–1461.
Hyvönen, T. 2007. Can conversion to organic farming re-store the species composition of arable weed commu-nities? Biological Conservation 137: 382–390.
Hyvönen, T. & Huusela-Veistola, E. 2008. Arable weeds as indicators of agricultural intensity – A case study from Finland. Biological Conservation 141: 2857–2864.
Hyvönen, T. & Salonen, J. 2003. Weed seedbank develop-ment under low-input and conventional cropping practic-es. Aspects of Applied Biology 69: 119–123.
Hyvönen, T., Ketoja, E. & Salonen, J. 2003b. Changes in the abundance of weeds in spring cereals in Finland. Weed Research 43: 348–356.
Hyvönen, T., Ketoja, E., Salonen, J., Jalli, H. & Tiainen, J. 2003a. Weed species diversity and community com-position in organic and conventional cropping of spring cereals. Agriculture, Ecosystems and Environment 97: 131–149.
Jaccard, P. 1912. The distribution of the flora of the alpine zone. New Phytologist 11: 37–50.
Jalli, H., Laine, A. & Känkänen, H. 2006. No-till cultivation suppresses broad-leaved weeds but favours grasses. ‘Extended Abstracts’’ of the NJF Seminar 378, p. 72–77. (available at: http://www.njf.nu/seminars/378/).
Kolb, L.N., Gallandt, E.R. & Molloy, T. 2010. Improving weed management in organic spring barley: physical weed control vs. interspecific competition. Weed Re-search 50: 597–605.
Légère, A., Stevenson, F.C. & Benoit, D.L:.2005. Diver-sity and assembly of weed communities: contrasting responses across cropping systems. Weed Research 45: 303–315.
Londesborough, S., Hynninen, E.-L. & Blomqvist, H. 2000. Pesticide sales in Finland in 1999. Kemia-Kemi 27: 492–494.
Milanova, S., Dimitrova, T., Valkova, M., Tachkov, J., Atan-asova, L., Ilieva, L. & Christov, C. 2009. Weed infesta-tion of winter wheat in Pleven region, Bulgaria. Herbo-logia 10: 1–11.
Mukula, J. 1974. Weed competition in spring cereals in Fin-land. Forskning och forsøk i landbruket 25: 585–592.
Mukula, J. , Raatikainen, M., Lallukka, R. & Raatikainen, T. 1969. Composition of weed flora in spring cereals in Fin-land. Annales Agriculturae Fenniae 8: 59–109.
Murphy, S.D., Clements, D.R:, Belaoussoff, S., Kevan, P.G. & Swanton, C.J. 2006. Promotion of weed species di-versity and reduction of weed seedbanks with conserva-

A G R I C U L T U R A L A N D F O O D S C I E N C E
Salonen, J. et al. Weed flora in spring cereals in Finland Vol. 20(2011): 245–261.
261260
tion tillage and crop rotation. Weed Science 54: 69–77. Niemi, J. & Ahlstedt, J. (eds.) 2009. Finnish Agriculture and
Rural Industries 2009. MTT Economic Research Publi-cations, No 109a. 96. p.
Novak, R., Dancza, I., Szentey, L., Karamán, J., Béres, I., Kazinczi, G. & Gólya, G. 2010. ARABLE weeds of Hungary. The fifth national weed survey (2007–2008). Proceedings of the 15th EWRS Symposium, Kaposvar, Hungary. p. 8–9.
Paatela, J. & Erviö, L-R. 1971. Weed seeds in cultivat-ed soils in Finland. Annales Agriculturae Fenniae 10: 144–152.
Potts, G.R., Ewald, J.A. & Aebischer, N.J. 2010. Long-term changes in the flora of the cereal ecosystem on the Sus-sex Downs, England, focusing on the years 1968–2005. Journal of Applied Ecology 47: 215–226.
Riesinger, P. & Hyvönen, T. 2006a. Weed occurrence in Finnish coastal regions: a survey of organically cropped spring cereals. Agricultural and Food Science 15: 166–182.
Riesinger, P. & Hyvönen, T. 2006b. Impact of management on weed species composition in organically cropped spring cereals. Biological Agriculture and Horticulture 24: 257–274.
Romero, A., Chamorro, L. & Xavier Sans, F. 2008. Weed diversity in crop edges and inner fields of organic and conventional dryland winter cereal crops in NE Spain. Agriculture, Ecosystem and Environment 124: 97–104.
Salonen, J., Hyvönen, T. & Jalli, H. 2001a. Weeds in spring cereal fields in Finland – a third survey. Agricultural and Food Science in Finland 10: 347–364.
Salonen, J, Hyvönen, T. & Jalli, H. 2001b. Weed flora in organically grown spring cereals in Finland. Agricultural and Food Science in Finland 10: 231–242.
Sjursen, H. 2001. Change of the weed seed bank during the first complete six-course crop rotation after conver-sion from conventional to organic farming. Biological Agriculture and Horticulture 19: 71–90.
Thomas, A.G., Légere, A., Leeson, J.Y., Stevenson, F.C.,
Holm, F.A. & Gradin, B. 2011. Weed community re-sponses to contrasting integrated weed management systems for cool dryland annual crops. Weed Rese-arch 51: 41–50.
TIKE 2009. Maatilatilastollinen vuosikirja 2009 (Yearbook of farm statistics). Maa- ja metsätalousministeriön tie-topalvelukeskus TIKE. 268 p.
Tørresen, K.S., Fykse, H. & Rafoss, T. 2010. Autumn growth of Elymus repens, Cirsium arvense and Sonchus arven-sis at high latitudes in an outdoor pot experiment. Weed Research 50: 353–363.
Tørresen, K.S., Salonen, J., Fogelfors, H., Håkansson, S. & Melander, B. 2006. Weed problems in various tillage systems in the Nordic countries. ‘Extended Abstracts’’ of the NJF Seminar 378, p. 54–60. (available at: http://www.njf.nu/seminars/378/).
Tørresen, K.S. & Skuterud, R. 2002. Plant protection in spring cereal production with reduced tillage. IV. Chang-es in the weed flora and weed seedbank. Crop Protec-tion 21: 179–193.
Tyšer, L. & Kolárová, M. 2010. Current weed spectrum in selected areas of the Czech Republic. Proceedings of the 15th EWRS Symposium, Kaposvar, Hungary. p. 133.
Ulber, L., Klimek, S., Steinmann, H. & Isselstein, J. 2010. A market-based payment scheme for conservation of weed species diversity in arable systems. Proceedings of the 15th EWRS Symposium, Kaposvar, Hungary. p. 122–123.
van Elsen, T. 2000. Species diversity as a task for organic agriculture in Europe. Agriculture, Ecosystems and En-vironment 77: 101–109.
van Elsen, T. & Hotze, C. 2008. The integration of autoch-thon arable field plants and the corncockle into flower strips for organic farming. Journal of Plant Diseases and Protection 21: 373–377.
Yenish, J.P., Doll, J.D. & Buhler, D.D. 1992. Effects of till-age on vertical distribution and viability of weed seed in soil. Weed Science 40: 429–433.