composition and variability of biofouling organisms in...
TRANSCRIPT
Published Ahead of Print 6 May 2011. 10.1128/AEM.00122-11.
2011, 77(13):4390. DOI:Appl. Environ. Microbiol. Voutchkov, Eric M. V. Hoek and Baoli CaiMinglu Zhang, Sunny Jiang, Dian Tanuwidjaja, Nikolay Desalination PlantsOrganisms in Seawater Reverse Osmosis Composition and Variability of Biofouling
http://aem.asm.org/content/77/13/4390Updated information and services can be found at:
These include:
SUPPLEMENTAL MATERIAL Supplemental material
REFERENCEShttp://aem.asm.org/content/77/13/4390#ref-list-1at:
This article cites 50 articles, 18 of which can be accessed free
CONTENT ALERTS more»articles cite this article),
Receive: RSS Feeds, eTOCs, free email alerts (when new
http://journals.asm.org/site/misc/reprints.xhtmlInformation about commercial reprint orders: http://journals.asm.org/site/subscriptions/To subscribe to to another ASM Journal go to:
on January 20, 2013 by guesthttp://aem
.asm.org/
Dow
nloaded from
APPLIED AND ENVIRONMENTAL MICROBIOLOGY, July 2011, p. 4390–4398 Vol. 77, No. 130099-2240/11/$12.00 doi:10.1128/AEM.00122-11Copyright © 2011, American Society for Microbiology. All Rights Reserved.
Composition and Variability of Biofouling Organisms in SeawaterReverse Osmosis Desalination Plants�†
Minglu Zhang,1,2,3 Sunny Jiang,1* Dian Tanuwidjaja,4,5 Nikolay Voutchkov,6Eric M. V. Hoek,4 and Baoli Cai2
Civil and Environmental Engineering, University of California, Irvine, California 926971; Key Laboratory of Bioactive Materials,Ministry of Education, Department of Microbiology, Nankai University, Tianjin 300071, China2; School of Environment,
Tsinghua University, Beijing 100084, China3; Civil and Environmental Engineering, University of California, Los Angeles,California 900954; Long Beach Water Department, Long Beach, California 908065; and
Water Globe Consulting, LLC, Stamford, Connecticut 069016
Received 19 January 2011/Accepted 28 April 2011
Seawater reverse osmosis (SWRO) membrane biofouling remains a common challenge in the desalinationindustry, but the marine bacterial community that causes membrane fouling is poorly understood. Microbialcommunities at different stages of treatment processes (intake, cartridge filtration, and SWRO) of a desali-nation pilot plant were examined by both culture-based and culture-independent approaches. Bacterial isolateswere identified to match the genera Shewanella, Alteromonas, Vibrio, and Cellulophaga based on 16S rRNA genesequencing analysis. The 16S rRNA gene clone library of the SWRO membrane biofilm showed that afilamentous bacterium, Leucothrix mucor, which belongs to the gammaproteobacteria, accounted for nearly 30%of the clone library, while the rest of the microorganisms (61.2% of the total clones) were related to thealphaproteobacteria. 16S rRNA gene terminal restriction fragment length polymorphism (T-RFLP) analysisindicated that bacteria colonizing the SWRO membrane represented a subportion of microbes in the sourceseawater; however, they were quite different from those colonizing the cartridge filter. The examination of fiveSWRO membranes from desalination plants located in different parts of the world showed that although thebacterial communities from the membranes were not identical to each other, some dominant bacteria werecommonly observed. In contrast, bacterial communities in source seawater were significantly different based onlocation and season. Microbial profiles from 14 cartridge filters collected from different plants also revealedspatial trends.
Technological advances in reverse osmosis (RO) mem-branes during the past decade have significantly reduced theenergy cost of water production via desalination. Seawaterdesalination, at present, provides approximately 1% of theworld’s drinking water supply, and this percentage is increasingby the year (52). However, membrane fouling is one of themost important practical problems facing RO plant operatorsand membrane manufacturers. The phenomenon of the accu-mulation of marine organisms and their metabolic products(i.e., extracellular polysaccharides [EPS], proteins, and lipids)on the membrane surface is known as biofouling (10, 15, 16).Excessive membrane biofouling results in increased energydemand for salt separation and the deterioration of productwater quality (1, 3, 17, 45). Although research efforts have beendevoted to prevent or alleviate biofouling by, for example,disinfection, chemical cleaning, and aeration (26, 50), thesetreatments yield temporary results. Advancements in mem-brane materials and the optimization of operational conditionshave contributed to biofouling prevention (25, 26, 48, 51);however, these changes cannot eliminate it. The acceleratedgrowth of biofilm on RO membranes likely is due to the phys-
iological response of the bacteria. Systematic and effectivestrategies for biofouling control have not been established.
Investigations of the microbial community that causes ROmembrane fouling have not progressed much beyond studiesfocused on freshwater or wastewater RO treatment systems (5,6, 30, 42). Earlier studies on the cultivation and isolation offoulant organisms laid the critical foundation for our under-standing of biofilm formation on the membrane surface (42,43), yet it was discovered recently that these results do notnecessarily reflect the true composition of the microbial com-munity of membrane biofilm, because a very small fraction ofthe bacterial community can be cultivated under laboratoryconditions (46). More recently, culture-independent methodshave been used to examine the RO membrane biofilm in drink-ing water and wastewater treatment plants (5, 6, 40). Bere-schenko et al. (6) reported that biofilm formation was initiatedand dominated by Sphingomonas spp. in a freshwater ROtreatment facility. However, bacterial diversity and physiologyin seawater are significantly different from freshwater andwastewater. The bacteria that cause biofilm formation on sea-water RO (SWRO) membranes may be significantly differentfrom those in freshwater RO systems.
In this study, we applied both culture-based and culture-inde-pendent methods to investigate the composition and variability ofthe bacterial community in SWRO desalination plants. Thisstudy is motivated by several questions. (i) What are the dom-inant bacteria that cause biofouling on the SWRO membrane?
* Corresponding author. Mailing address: Civil and EnvironmentalEngineering, University of California, Irvine, CA 92697. Phone: (949)824-5527. Fax: (949) 824-3672. E-mail: [email protected].
† Supplemental material for this article may be found at http://aem.asm.org/.
� Published ahead of print on 6 May 2011.
4390
on January 20, 2013 by guesthttp://aem
.asm.org/
Dow
nloaded from
(ii) Is there a common group of bacteria that causes SWROmembrane biofouling in different desalination facilities and indifferent seasons? (iii) How do bacterial communities in theSWRO system vary with geographical location and seasonalchanges? (iv) Do organisms in source seawater vary with theseason and location, and how does this variation influencebiofouling organisms in the facility?
MATERIALS AND METHODS
Bacteria isolation. Bacteria were isolated from fouled cotton-woven cartridgefilters (Cuno) and SWRO membranes (SWC4�; Hydronautics Corp.) collectedin January 2009 from the Carlsbad Desalination Pilot Plant in southern Califor-nia (Table 1). Briefly, 5 to 10 ml of PBS (phosphate-buffered saline; pH 8.0) wasadded to sections of cartridge filter and SWRO membrane and soaked overnightat 4°C. The next day, the samples were vortexed and scraped with a sterile plasticpipette. One hundred �l of eluate was plated onto artificial seawater agar plates(ASWJP) supplemented with 1 mg/liter peptone and 0.5 mg/liter yeast extract aspreviously reported (41). The plates were incubated at 25°C for 48 h, and anindividual colony was picked and purified by three subsequent isolations. Strainsdesignated B1, B2, B3, and B4 were isolated from the SWRO membrane surface.Strains B5 and B6 were isolated from a cartridge filter upstream of the SWROfeed.
Bacterial clone library. A bacterial clone library was constructed using bacte-rial eluate from a fouled SWRO membrane collected in January 2009 from theCarlsbad Desalination Pilot Plant (Table 1). Briefly, total genomic DNA wasextracted from the SWRO membrane bacterial community using boiling lysate(9), which allows rapid total DNA extraction for PCR without introducing PCRinhibitors. Bacterium-specific primers 27F (5�-AGA GTT TGA TCM TGG CTCAG�3�) and 1492R (5�-GGT TAC CTT GTT ACG ACT T-3�) were used to
amplify a 1,500-bp region of the 16S rRNA gene as described previously (33).PCR product was purified using a Zymoclean gel DNA recovery kit (ZymoResearch, CA). The purified PCR fragments then were ligated into a pGEM-Tcloning vector and cloned into Escherichia coli JM109 according to the manu-facturer’s instructions (Promega). More than 90 colonies of ampicillin-resistanttransformants were picked randomly and cultured overnight in LB broth con-taining 50 mg/liter ampicillin. Plasmids were isolated using a plasmid purificationkit (Qiagen Inc.). The insert in the plasmid was checked by PCR using primersM13F and M13R (Promega). Restriction endonucleases MspI (CC/GG) andRsaI (GT/AC) (Promega) were used to digest plasmid extract from 67 cloneswith the correct-size inserts to determine the clone diversity. The resultingproducts were separated by gel electrophoresis in 2% agarose. Plasmids thatproduced the same RFLP (restriction fragment length polymorphism) weregrouped together and considered members of the same operational taxonomicunit (OTU), and the number of clones in each OTU was used as an indicator ofbacterial species abundance.
Sequencing and phylogenetic analysis. For bacterial isolates, PCR amplifica-tion of the 16S rRNA gene was performed on each individual strain using theprimers and conditions described previously (33). PCR amplicons were purifiedand used for direct sequencing. Each strain was sequenced three times usingprimer 27F, 533F, or 1492R each time for both directions (33). Each OTU fromthe clone library was sequenced using the 27F primer. The DNA sequences weredetermined using a BigDye 3.1 sequencing kit by following the manufacturer’sprotocols (Applied Biosystems). The final reactions were submitted to Laragen(Los Angeles, CA) for a sequencing run using ABI prism 3100 capillary sequenc-ing. Nucleotide sequences were submitted to the BLAST search engine at NCBIGenBank and identified through similarity values. The alignment, calculation ofthe distance matrices for the aligned sequences, and reconstruction of the phy-logenetic tree were performed using MEGA software (32).
T-RFLP analysis. Terminal restriction fragment length polymorphism (T-RFLP) was applied to analyze the bacterial community at different stages of
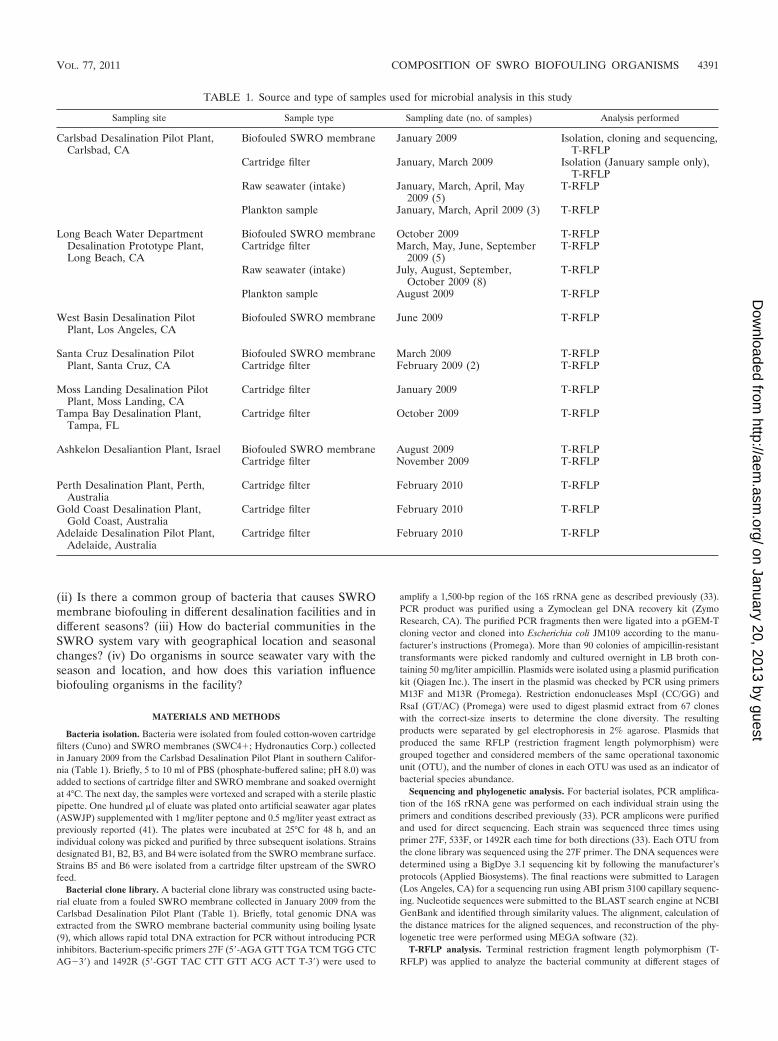
TABLE 1. Source and type of samples used for microbial analysis in this study
Sampling site Sample type Sampling date (no. of samples) Analysis performed
Carlsbad Desalination Pilot Plant,Carlsbad, CA
Biofouled SWRO membrane January 2009 Isolation, cloning and sequencing,T-RFLP
Cartridge filter January, March 2009 Isolation (January sample only),T-RFLP
Raw seawater (intake) January, March, April, May2009 (5)
T-RFLP
Plankton sample January, March, April 2009 (3) T-RFLP
Long Beach Water Department Biofouled SWRO membrane October 2009 T-RFLPDesalination Prototype Plant,Long Beach, CA
Cartridge filter March, May, June, September2009 (5)
T-RFLP
Raw seawater (intake) July, August, September,October 2009 (8)
T-RFLP
Plankton sample August 2009 T-RFLP
West Basin Desalination PilotPlant, Los Angeles, CA
Biofouled SWRO membrane June 2009 T-RFLP
Santa Cruz Desalination Pilot Biofouled SWRO membrane March 2009 T-RFLPPlant, Santa Cruz, CA Cartridge filter February 2009 (2) T-RFLP
Moss Landing Desalination PilotPlant, Moss Landing, CA
Cartridge filter January 2009 T-RFLP
Tampa Bay Desalination Plant,Tampa, FL
Cartridge filter October 2009 T-RFLP
Ashkelon Desaliantion Plant, Israel Biofouled SWRO membrane August 2009 T-RFLPCartridge filter November 2009 T-RFLP
Perth Desalination Plant, Perth,Australia
Cartridge filter February 2010 T-RFLP
Gold Coast Desalination Plant,Gold Coast, Australia
Cartridge filter February 2010 T-RFLP
Adelaide Desalination Pilot Plant,Adelaide, Australia
Cartridge filter February 2010 T-RFLP
VOL. 77, 2011 COMPOSITION OF SWRO BIOFOULING ORGANISMS 4391
on January 20, 2013 by guesthttp://aem
.asm.org/
Dow
nloaded from
desalination unit processes as well as in samples collected from different desal-ination plants and at different sampling times of year. Samples included in thisstudy are summarized in Table 1. Raw intake seawater samples from the Carls-bad Desalination Pilot Plant (five samples) and Long Beach Water Department(LBWD) Desalination Prototype Plant (eight samples) were collected from theintake pipe using triple-sample-rinsed carboys and were transported to the UCIrvine laboratory for immediate processing. In the laboratory, bacteria in theseawater were concentrated, extracted for total genomic DNA (see the supple-mental material), and used for T-RFLP. Phytoplankton samples were collectedfrom 100 liters intake seawater at both of the plants mentioned above using a20-�m-mesh-size plankton net (Wild Life Supply Company, Yulee, FL). Bacteriaattached to the phytoplankton (called epibionts) were extracted for genomicDNA analysis. Fouled SWRO membranes from both of these plants and fromthe West Basin Desalination Pilot Plant in Los Angeles County and the SantaCruz Desalination Pilot Plant in northern California were transported by car.Membrane autopsies were conducted either on site at the University of Califor-nia, Irvine, or by a third party within 48 h of the SWRO element’s removal fromthe treatment plants. An SWRO membrane sample from the Ashkelon Desali-antion Plant in Israel was shipped by international express service on dry ice(membrane section). Bacteria from the membrane surface were eluted using PBSand stored frozen until analysis. Fourteen cartridge filters installed upstream ofthe SWRO from desalination plants located on the east and west coasts of theUnited States, as well as from Australia and Israel (Table 1), were transported onice to UC Irvine and eluted with PBS to recover the total bacterial community.T-RFLP was conducted as originally described (36). Briefly, the bacterial 16SrRNA gene was amplified using eubacterial universal primers 8F (5�-AGA GTTTGA TCC TTG GCT CAG-3�) and 1492R. The forward primer 8F was labeledat the 5� end with 6-carboxyfluorescein (6-FAM). Ten �l of purified fluorescentPCR products was digested separately with 3 U of the enzymes RsaI and MspI(Promega) for 4 h at 37°C, followed by an inactivation step at 65°C for 10 min.The final reactions were submitted to Laragen (Los Angeles, CA) for a sequenc-ing run using ABI Prism 3100 capillary sequencing.
T-RFLP data analysis. T-RFLP profiles were analyzed using Peak Scannersoftware (Applied Biosystems, Foster City, CA) to determine the number,length, and relative abundance of each of the terminal restriction fragments(T-RFs) in a sample. The relative abundance of a T-RF in a T-RFLP profile wascalculated by dividing the peak area of the T-RF by the total peak area of allT-RFs in the profile. The relative abundance of all peaks of less than 0.5% wasnot included in further analyses. Parameters were set to exclude peaks of lessthan 50 fluorescent units and those smaller than 50 bp or larger than 900 bp.T-RFs that differed by less than 1 bp were clustered. To evaluate structuraldiversity between samples, the Shannon diversity index (H�), richness (S), even-ness (E) (4), and Simpson’s index (D) (47) were calculated based on the T-RFLPprofile. The richness of each sample (S) was calculated by summing all of thepeaks in each sample profile. Shannon and Simpson indices were calculated byusing the following equations: H� � �i�1
S �pi ln pi� and D � 1 � �i�1S p i
2, respec-tively, where pi is the relative intensity of each individual peak divided by the sumof the relative intensities of all fragments. Evenness (E) was calculated as E �
H�/H�max, where H�max is calculated from the Shannon index and H�max is themaximum value of H�, equal to H�max � �i � 1
S �1/S ln 1/S� � ln S.For principal component analysis (PCA), all T-RFLP data were processed and
analyzed using the T-REX software available at http://trex.biohpc.org/ (11).Processed data were subjected to the additive main effects and multiplicativeinteraction model (AMMI) analysis with T-REX using a data matrix constructedbased on the presence/absence of peaks.
T-RF identification. The identity of a peak from a T-RFLP fingerprint can beassigned by comparing its size to the restriction fragment size of a knownbacterium. Bacterial clones from the RO membrane clone library were examinedby in silico digestion with MspI and RsaI (49) and compared to the correspond-ing community fingerprint pattern. A specific clone was considered present in thesample only when both T-RFs generated by the two restriction enzymes alsowere present in the T-RFLP of the environmental sample (35). Some of theseclone sequences were not complete for the region of the 8F forward primer, andthe size of the T-RF for these sequences was estimated by filling in the gap witha sequence from a close relative as previously described (20).
Nucleotide sequence accession numbers. The GenBank accession numbers forthe sequences determined in the course of this work are FJ652053 to FJ652057,FJ939331 to FJ939334, FJ939336, FJ939338, FJ939339, FJ939343, FJ939344,FJ939346, FJ939348, FJ939349, FJ939351, FJ939358, GU254286, GU299342,and GU254287 to GU254291.
RESULTS
Identification of biofilm community on SWRO membrane by16S rRNA gene-based clone library and isolation. RFLP anal-ysis of 67 clones retrieved from the Carlsbad SWRO mem-brane biofilm clone library assigned the clones to 20 OTUs.16S rRNA gene sequences from 20 clones representing each of20 OTUs and six bacterial isolates were aligned with referencestrains and are presented in the phylogenetic tree shown in Fig.1. These 20 OTUs and six isolates fell into six large phyloge-netic groups. The proteobacteria phylum dominated the clonelibrary, in which the alphaproteobacteria class was the largestgroup (61.2%), including the genera Ruegeria and Donghicolaand the family Sphingomonadaceae. The majority of the alpha-proteobacteria were affiliated with the genus Ruegeria, repre-sented by OTU4 and OTU5 and accounting for 32.8% of theclones. The gammaproteobacteria subdivision (class) con-tained the largest OTU (OTU1, accounting for 28.4% of totalclones) and was identified as filamentous Leucothrix mucor.The rest of the OTUs contained one to two clones, which wereclosely related to the classes Sphingobacteria, Flavobacteria,Planctomycetacia, and Chloroflexi.
The 16S rRNA gene sequence of the bacterial isolates iden-tified them as well-known biofilm-forming bacteria. B2 and B3were nearly identical to genus Alteromonas, while B1 and B4were closely related and were highly similar to genus She-wanella. B6 was close to Vibrio. These five isolates belonged tothe gammaproteobacteria phylotype. B5 was distantly relatedto the other isolates that matched closely with the genus ofCellulophaga, which belonged to the Flavobacteria group.
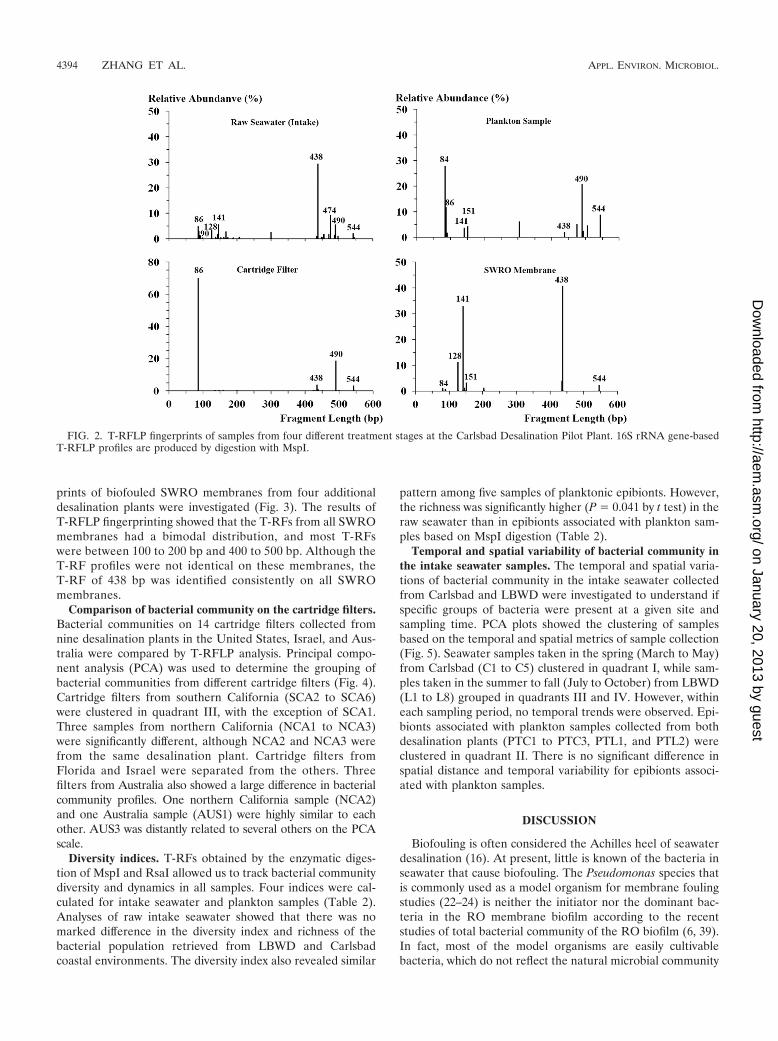
Comparison of bacterial community at different stages ofSWRO system using T-RFLP fingerprinting. To identify thesource of biofouling bacteria on the SWRO membrane, thecommunity fingerprints of samples collected in January fromfour different stages of treatment (intake, phytoplankton epi-bionts, cartridge filtration, and SWRO) at the Carlsbad pilotfacility were investigated (Fig. 2). The results of T-RFLP fin-gerprinting analysis indicated high bacterial community diver-sity in the raw seawater intake sample. At least 22 differentT-RFs were observed by MspI digestion, with 14 of themrepresenting less than 5% relative abundance among the totalcommunity. Bacteria associated with the plankton sample (epi-biotic bacteria) showed 12 T-RFs by MspI digestion that weresignificantly different from the free-living bacteria in the sea-water. The dominant bacteria at the bp 438 position among thefree-living bacteria community was suppressed among the epi-biotic bacteria, but two dominant bacteria at bp 84 and 490were detected.
T-RFLP profiles of the cartridge filter and SWRO membranewere, however, defined by a small number of dominant T-RFs.The dominant T-RFs on the SWRO membrane matched mostlywith peaks in the raw seawater, indicating that the biofoulingbacteria on SWRO were common microbes in source seawater(Fig. 2). However, a 151-bp T-RF on the SWRO was observedonly in the plankton sample. The cartridge filter had the lowestbacterial diversity, but the relative abundance of one T-RF (86bp) was the highest (70%) among all samples. The dominantT-RFs on the SWRO membrane either were a minor compo-nent or were absent from the cartridge filter, suggesting thatmicrobes colonizing the cartridge filter were not major con-
4392 ZHANG ET AL. APPL. ENVIRON. MICROBIOL.
on January 20, 2013 by guesthttp://aem
.asm.org/
Dow
nloaded from

tributors to SWRO fouling bacteria. T-RFLP profiles by RsaIdigestion supported the general diversity profile by MspI forbacterial communities in different stages of the desalinationsystem (data not shown).
In silico digestion of 16S rRNA gene sequences of SWROclones and isolates showed that, on the basis of MspI digestion,the most dominant peak on SWRO and intake seawater (T-RFof 438 bp) was assigned to the alphaproteobacteria class,Rhodobacteraceae family, including Roseobacter, Ruegeria, andRhodobacter genera. The 490-bp T-RF (421 bp by RsaI) thatwas prevalent in the epibiotic community but absent from
SWRO membranes belongs to Winogradskyella species and anuncultured Flavobacteria bacterium. The 151-bp T-RF foundon SWRO membranes and plankton samples is related to thegenera Novosphingomonas and Alteromonas. The most domi-nant SWRO biofilm clone of Leucothrix mucor yielded a 90-bpfragment by in silico MspI digestion of 16S rRNA gene se-quence, which represented only a minor peak on raw seawaterand SWRO membranes.
Comparison of bacterial community on SWRO membranesfrom different desalination plants. To compare biofouling bac-teria on different SWRO membranes, the community finger-
FIG. 1. Phylogenetic tree of 16S rRNA gene sequences retrieved from the Carlsbad Desalination Pilot Plant SRWO biofilm clone library andbacterial isolates. The phylogenetic tree was constructed using a neighbor-joining algorithm with Jukes-Cantor distance in MEGA3. Bootstrap(1,000) values greater than 50% are shown at the nodes, and the abundance of each OTU in the clone library is shown in parentheses.
VOL. 77, 2011 COMPOSITION OF SWRO BIOFOULING ORGANISMS 4393
on January 20, 2013 by guesthttp://aem
.asm.org/
Dow
nloaded from
prints of biofouled SWRO membranes from four additionaldesalination plants were investigated (Fig. 3). The results ofT-RFLP fingerprinting showed that the T-RFs from all SWROmembranes had a bimodal distribution, and most T-RFswere between 100 to 200 bp and 400 to 500 bp. Although theT-RF profiles were not identical on these membranes, theT-RF of 438 bp was identified consistently on all SWROmembranes.
Comparison of bacterial community on the cartridge filters.Bacterial communities on 14 cartridge filters collected fromnine desalination plants in the United States, Israel, and Aus-tralia were compared by T-RFLP analysis. Principal compo-nent analysis (PCA) was used to determine the grouping ofbacterial communities from different cartridge filters (Fig. 4).Cartridge filters from southern California (SCA2 to SCA6)were clustered in quadrant III, with the exception of SCA1.Three samples from northern California (NCA1 to NCA3)were significantly different, although NCA2 and NCA3 werefrom the same desalination plant. Cartridge filters fromFlorida and Israel were separated from the others. Threefilters from Australia also showed a large difference in bacterialcommunity profiles. One northern California sample (NCA2)and one Australia sample (AUS1) were highly similar to eachother. AUS3 was distantly related to several others on the PCAscale.
Diversity indices. T-RFs obtained by the enzymatic diges-tion of MspI and RsaI allowed us to track bacterial communitydiversity and dynamics in all samples. Four indices were cal-culated for intake seawater and plankton samples (Table 2).Analyses of raw intake seawater showed that there was nomarked difference in the diversity index and richness of thebacterial population retrieved from LBWD and Carlsbadcoastal environments. The diversity index also revealed similar
pattern among five samples of planktonic epibionts. However,the richness was significantly higher (P � 0.041 by t test) in theraw seawater than in epibionts associated with plankton sam-ples based on MspI digestion (Table 2).
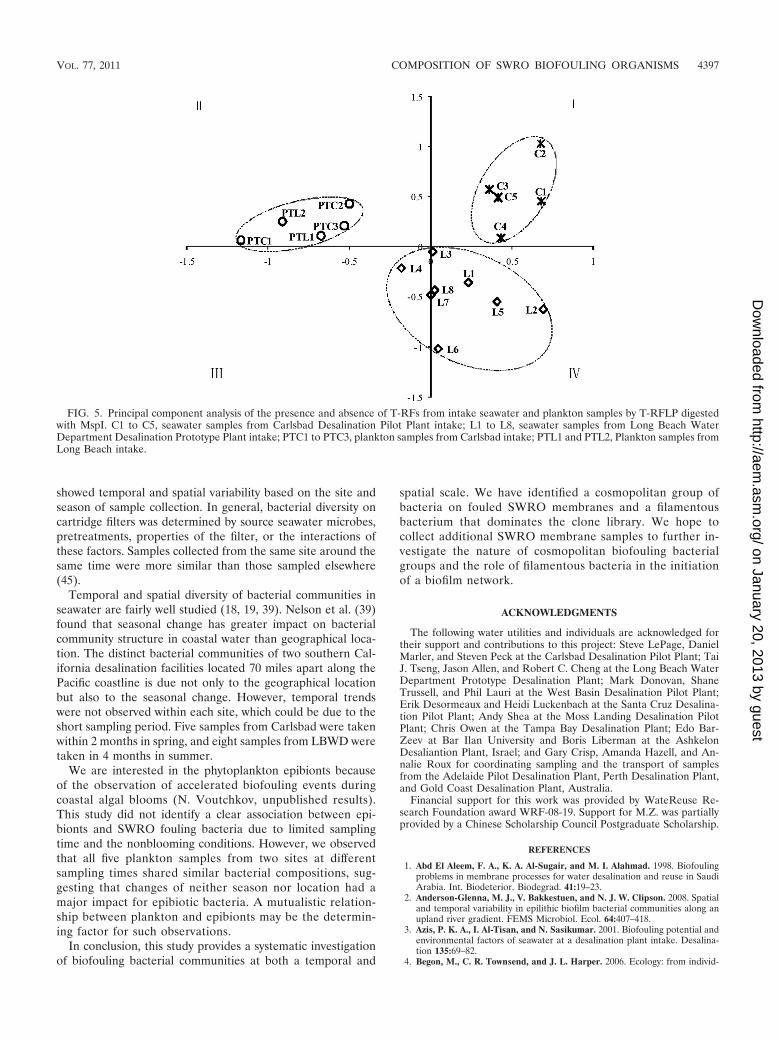
Temporal and spatial variability of bacterial community inthe intake seawater samples. The temporal and spatial varia-tions of bacterial community in the intake seawater collectedfrom Carlsbad and LBWD were investigated to understand ifspecific groups of bacteria were present at a given site andsampling time. PCA plots showed the clustering of samplesbased on the temporal and spatial metrics of sample collection(Fig. 5). Seawater samples taken in the spring (March to May)from Carlsbad (C1 to C5) clustered in quadrant I, while sam-ples taken in the summer to fall (July to October) from LBWD(L1 to L8) grouped in quadrants III and IV. However, withineach sampling period, no temporal trends were observed. Epi-bionts associated with plankton samples collected from bothdesalination plants (PTC1 to PTC3, PTL1, and PTL2) wereclustered in quadrant II. There is no significant difference inspatial distance and temporal variability for epibionts associ-ated with plankton samples.
DISCUSSION
Biofouling is often considered the Achilles heel of seawaterdesalination (16). At present, little is known of the bacteria inseawater that cause biofouling. The Pseudomonas species thatis commonly used as a model organism for membrane foulingstudies (22–24) is neither the initiator nor the dominant bac-teria in the RO membrane biofilm according to the recentstudies of total bacterial community of the RO biofilm (6, 39).In fact, most of the model organisms are easily cultivablebacteria, which do not reflect the natural microbial community
FIG. 2. T-RFLP fingerprints of samples from four different treatment stages at the Carlsbad Desalination Pilot Plant. 16S rRNA gene-basedT-RFLP profiles are produced by digestion with MspI.
4394 ZHANG ET AL. APPL. ENVIRON. MICROBIOL.
on January 20, 2013 by guesthttp://aem
.asm.org/
Dow
nloaded from

in water for treatment, because more than 99% of those bac-teria are not cultivable on nutrient-rich artificial medium (14,31). Although our work started from the isolation of marineorganisms, we quickly abandoned that approach because theisolates were not good representations of dominant biofilmbacteria on SWRO membranes according to the clone library.Isolation using nutrient-rich medium (i.e., peptone) seems tofavor gammaproteobacteria, as shown in this study and byanother group using a culture-based approach (29), while theculture-independent clone library suggests that alphaproteo-bacteria that are favored in the oligotrophic marine environ-ment are dominant components on the SWRO membrane andintake seawater (34).
The discovery of Leucothrix mucor as the dominant bacte-rium in the SWRO membrane biofilm is interesting. Althoughfilamentous bacteria have been observed on fouled membranesby electron microscopy (29), Leucothrix mucor has not beenreported due to the limited number of studies of seawater
desalination systems. This bacterium is a widespread epiphyteof seaweeds, fish eggs, and benthic crustaceans (27, 28). It iseasily recognized by light microscopy but not easily isolated onartificial medium (7, 28). Biofouling caused by filamentousLeucothrix mucor has been investigated for its impact on zoo-plankton activities and lobster eggs (38, 44). It is capable ofchemoorganoheterotrophic growth as well as of chemolitho-heterotrophic growth in the presence of reduced sulfur com-pounds (21). To date, there has not been any investigation oftheir contribution to SWRO membrane fouling. Our attemptto reveal its contribution to SWRO membrane fouling throughthe T-RFLP analysis of microbial profiles was unsuccessfulbecause of the restriction enzyme digestion bias and the lim-ited resolution of T-RF recognition (13). We hope to investi-gate its contribution to SWRO fouling using fluorescence insitu hybridization in the next phase.
The second dominant bacterium in the SWRO membranebiofilm clone library was Ruegeria species. Ruegeria belongs to
FIG. 3. Bacterial composition on the SWRO membranes from five different seawater desalination facilities determined by T-RFLP digestedwith MspI.
VOL. 77, 2011 COMPOSITION OF SWRO BIOFOULING ORGANISMS 4395
on January 20, 2013 by guesthttp://aem
.asm.org/
Dow
nloaded from

the family Rhodobacteraceae, which is a widely distributed bac-terium in marine environments (8). However, the role of Rue-geria species in biofilm formation is not well understood due toits fastidious nature. The dominance of the family Rhodobac-teraceae in source seawater and on all fouled SWRO mem-branes also was confirmed by the T-RF of 438 bp by MspIdigestion in T-RFLP profiles.
Despite the limitations of the T-RFLP technique, it is in-creasingly utilized to provide a rapid comparison of microbialcommunities under different conditions (2, 12, 37). The com-parative analysis in this study showed that bacterial communi-ties on fouled SWRO were different from those on cartridgefilters located upstream of the SWRO, which alleviates the
concern that the cartridge filter acted as an incubator to pro-duce additional SWRO-fouling bacteria. The biofouling bac-terial communities on SWRO membranes best resembledsource seawater microbes, yet some were suppressed whileothers were amplified. It is not surprising to observe suchresemblance, yet it is interesting that all five fouled SWROmembranes from different parts of the world, operated underdifferent conditions (data not shown) and collected at differenttimes of the year, had some common bacterial groups. Theseso-called metropolitan biofouling bacteria likely are adaptiveto attachment on SWRO membrane surfaces and to growunder oligotrophic or chemolithoheterotrophic conditions.
A comparison of bacterial communities on cartridge filters
FIG. 4. Principal component analysis of the presence and absence of T-RFs from 14 cartridge filters collected from nine desalination plants byT-RFLP digested with MspI. SCA1 to SCA5, Long Beach Water Department Desalination Prototype Plant; SCA6, Carlsbad Desalination PilotPlant; NCA1, Moss Landing Desalination Pilot Plant; NCA2 and NCA3, Santa Cruz Desalination Pilot Plant; FL, Tampa Bay Desalination Plant;IS, Ashkelon Desalination Plant, Israel; AUS1, Perth Desalination Plant, Australia; AUS2, Gold Coast Desalination Plant, Australia; AUS3,Adelaide Desalination Pilot Plant, Australia.
TABLE 2. Diversity indices calculated from T-RFLP profiles of 16S rRNA genes amplified from raw seawater samples
Samplename
Samplingdate (2009)
Samplingsite
Populationrichness
afterdigestion
with:
Index
MspI RsaI Simpson’s (D) Shannon (H�) Evenness (E)
C1 18 March Carlsbad, CA 27 26 0.86 2.23 0.76C2 20 March Carlsbad, CA 14 16 0.85 2.10 0.80C3 25 March Carlsbad, CA 16 17 0.79 2.10 0.76C4 22 April Carlsbad, CA 17 16 0.83 2.27 0.80C5 29 April Carlsbad, CA 17 15 0.71 1.92 0.68L1 21 July Long Beach, CA 18 17 0.91 2.59 0.90L2 28 July Long Beach, CA 18 20 0.86 2.34 0.81L3 4 August Long Beach, CA 10 15 0.75 1.77 0.77L4 11 August Long Beach, CA 12 13 0.80 1.99 0.80L5 18 August Long Beach, CA 14 18 0.96 1.56 0.55L6 18 September Long Beach, CA 20 16 0.74 2.07 0.69L7 23 September Long Beach, CA 19 17 0.84 2.27 0.77L8 16 October Long Beach, CA 19 15 0.84 2.32 0.79
4396 ZHANG ET AL. APPL. ENVIRON. MICROBIOL.
on January 20, 2013 by guesthttp://aem
.asm.org/
Dow
nloaded from
showed temporal and spatial variability based on the site andseason of sample collection. In general, bacterial diversity oncartridge filters was determined by source seawater microbes,pretreatments, properties of the filter, or the interactions ofthese factors. Samples collected from the same site around thesame time were more similar than those sampled elsewhere(45).
Temporal and spatial diversity of bacterial communities inseawater are fairly well studied (18, 19, 39). Nelson et al. (39)found that seasonal change has greater impact on bacterialcommunity structure in coastal water than geographical loca-tion. The distinct bacterial communities of two southern Cal-ifornia desalination facilities located 70 miles apart along thePacific coastline is due not only to the geographical locationbut also to the seasonal change. However, temporal trendswere not observed within each site, which could be due to theshort sampling period. Five samples from Carlsbad were takenwithin 2 months in spring, and eight samples from LBWD weretaken in 4 months in summer.
We are interested in the phytoplankton epibionts becauseof the observation of accelerated biofouling events duringcoastal algal blooms (N. Voutchkov, unpublished results).This study did not identify a clear association between epi-bionts and SWRO fouling bacteria due to limited samplingtime and the nonblooming conditions. However, we observedthat all five plankton samples from two sites at differentsampling times shared similar bacterial compositions, sug-gesting that changes of neither season nor location had amajor impact for epibiotic bacteria. A mutualistic relation-ship between plankton and epibionts may be the determin-ing factor for such observations.
In conclusion, this study provides a systematic investigationof biofouling bacterial communities at both a temporal and
spatial scale. We have identified a cosmopolitan group ofbacteria on fouled SWRO membranes and a filamentousbacterium that dominates the clone library. We hope tocollect additional SWRO membrane samples to further in-vestigate the nature of cosmopolitan biofouling bacterialgroups and the role of filamentous bacteria in the initiationof a biofilm network.
ACKNOWLEDGMENTS
The following water utilities and individuals are acknowledged fortheir support and contributions to this project: Steve LePage, DanielMarler, and Steven Peck at the Carlsbad Desalination Pilot Plant; TaiJ. Tseng, Jason Allen, and Robert C. Cheng at the Long Beach WaterDepartment Prototype Desalination Plant; Mark Donovan, ShaneTrussell, and Phil Lauri at the West Basin Desalination Pilot Plant;Erik Desormeaux and Heidi Luckenbach at the Santa Cruz Desalina-tion Pilot Plant; Andy Shea at the Moss Landing Desalination PilotPlant; Chris Owen at the Tampa Bay Desalination Plant; Edo Bar-Zeev at Bar Ilan University and Boris Liberman at the AshkelonDesaliantion Plant, Israel; and Gary Crisp, Amanda Hazell, and An-nalie Roux for coordinating sampling and the transport of samplesfrom the Adelaide Pilot Desalination Plant, Perth Desalination Plant,and Gold Coast Desalination Plant, Australia.
Financial support for this work was provided by WateReuse Re-search Foundation award WRF-08-19. Support for M.Z. was partiallyprovided by a Chinese Scholarship Council Postgraduate Scholarship.
REFERENCES
1. Abd El Aleem, F. A., K. A. Al-Sugair, and M. I. Alahmad. 1998. Biofoulingproblems in membrane processes for water desalination and reuse in SaudiArabia. Int. Biodeterior. Biodegrad. 41:19–23.
2. Anderson-Glenna, M. J., V. Bakkestuen, and N. J. W. Clipson. 2008. Spatialand temporal variability in epilithic biofilm bacterial communities along anupland river gradient. FEMS Microbiol. Ecol. 64:407–418.
3. Azis, P. K. A., I. Al-Tisan, and N. Sasikumar. 2001. Biofouling potential andenvironmental factors of seawater at a desalination plant intake. Desalina-tion 135:69–82.
4. Begon, M., C. R. Townsend, and J. L. Harper. 2006. Ecology: from individ-
FIG. 5. Principal component analysis of the presence and absence of T-RFs from intake seawater and plankton samples by T-RFLP digestedwith MspI. C1 to C5, seawater samples from Carlsbad Desalination Pilot Plant intake; L1 to L8, seawater samples from Long Beach WaterDepartment Desalination Prototype Plant intake; PTC1 to PTC3, plankton samples from Carlsbad intake; PTL1 and PTL2, Plankton samples fromLong Beach intake.
VOL. 77, 2011 COMPOSITION OF SWRO BIOFOULING ORGANISMS 4397
on January 20, 2013 by guesthttp://aem
.asm.org/
Dow
nloaded from

uals to ecosystems, 4th ed., p. 471–472. Blackwell Publishing, Oxford, UnitedKingdom.
5. Bereschenko, L. A., et al. 2008. Molecular characterization of the bacterialcommunities in the different compartments of a full-scale reverse-osmosiswater purification plant. Appl. Environ. Microbiol. 74:5297–5304.
6. Bereschenko, L. A., A. J. M. Stams, G. J. W. Euverink, and M. C. M. vanLoosdrecht. 2010. Biofilm formation on reverse osmosis membranes is ini-tiated and dominated by Sphingomonas spp. Appl. Environ. Microbiol. 76:2623–2632.
7. Brock, T. D. 1966. The habitat of Leucothrix Mucor, a widespread marinemicroorganism. Limnol. Oceanogr. 11:303–307.
8. Buchan, A., J. M. Gonzalez, and M. A. Moran. 2005. Overview of the marineRoseobacter lineage. Appl. Environ. Microbiol. 71:5665–5677.
9. Chun, J., A. Huq, and R. R. Colwell. 1999. Analysis of 16S–23S rRNAintergenic spacer regions of Vibrio cholerae and Vibrio mimicus. Appl. Envi-ron. Microbiol. 65:2202–2208.
10. Costerton, J. W. 1995. Overview of microbial biofilms. J. Ind. Microbiol.15:137–140.
11. Culman, S. W., R. Bukowski, H. G. Gauch, H. Cadillo-Quiroz, and D. H.Buckley. 2009. T-REX: software for the processing and analysis of T-RFLPdata. BMC Bioinformatics 10:171.
12. Edmonds, J. W., N. B. Weston, S. B. Joye, X. Z. Mou, and M. A. Moran. 2009.Microbial community response to seawater amendment in low-salinity tidalsediments. Microb. Ecol. 58:558–568.
13. Egert, M., and M. W. Friedrich. 2003. Formation of pseudo-terminal restric-tion fragments, a PCR-related bias affecting terminal restriction fragmentlength polymorphism analysis of microbial community structure. Appl. En-viron. Microbiol. 69:2555–2562.
14. Ferguson, R. L., E. N. Buckley, and A. V. Palumbo. 1984. Response ofmarine bacterioplankton to differential filtration and confinement. Appl.Environ. Microbiol. 47:49–55.
15. Flemming, H. C., and G. Schaule. 1988. Biofouling on membranes–a micro-biological approach. Desalination 70:95–119.
16. Flemming, H. C., G. Schaule, T. Griebe, J. Schmitt, and A. Tamachkiarowa.1997. Biofouling–the Achilles heel of membrane processes. Desalination113:215–225.
17. Flemming, H. C., A. Tamachkiarowa, J. Klahre, and J. Schmitt. 1998. Mon-itoring of fouling and biofouling in technical systems. Water Sci. Technol.38:291–298.
18. Fuhrman, J. A., et al. 2006. Annually reoccurring bacterial communities arepredictable from ocean conditions. Proc. Natl. Acad. Sci. U. S. A. 103:13104–13109.
19. Ghiglione, J. F., et al. 2007. Diel and seasonal variations in abundance,activity, and community structure of particle-attached and free-living bacte-ria in NW Mediterranean Sea. Microb. Ecol. 54:217–231.
20. Gonzalez, J. M., et al. 2000. Bacterial community structure associated with adimethylsulfoniopropionate-producing North Atlantic algal bloom. Appl.Environ. Microbiol. 66:4237–4246.
21. Grabovich, M. Y., N. M. Dul’tseva, and G. A. Dubinina. 2002. Carbon andsulfur metabolism in representatives of two clusters of bacteria of the genusLeucothrix: a comparative study. Microbiology 71:301–307.
22. Herzberg, M., and M. Elimelech. 2007. Biofouling of reverse osmosis mem-branes: role of biofilm-enhanced osmotic pressure. J. Membr. Sci. 295:11–20.
23. Herzberg, M., S. Kang, and M. Elimelech. 2009. Role of extracellular poly-meric substances (EPS) in biofouling of reverse osmosis membranes. Envi-ron. Sci. Technol. 43:4393–4398.
24. Herzberg, M., T. Z. Rezene, C. Ziemba, O. Gillor, and K. Mathee. 2009.Impact of higher alginate expression on deposition of Pseudomonas aerugi-nosa in radial stagnation point flow and reverse osmosis systems. Environ.Sci. Technol. 43:7376–7383.
25. Jin, X., X. F. Huang, and E. M. V. Hoek. 2009. Role of specific ion interac-tions in seawater RO membrane fouling by alginic acid. Environ. Sci. Tech-nol. 43:3580–3587.
26. Jin, X., A. Jawor, S. Kim, and E. M. Hoek. 2009. Effects of feed watertemperature on separation performance and organic fouling of brackishwater RO membranes. Desalination 239:346–359.
27. Kelly, M. T., and T. D. Brock. 1969. Molecular heterogeneity of isolates ofmarine bacterium Leucothrix mucor. J. Bacteriol. 100:14–21.
28. Kelly, M. T., and T. D. Brock. 1969. Physiological ecology of Leucothrixmucor. J. Gen. Microbiol. 59:153–162.
29. Khambhaty, Y., and J. Plumb. 2011. Characterization of bacterial populationassociated with a brackish water desalination membrane. Desalination 269:35–40.
30. Kim, D., S. Jung, J. Sohn, H. Kim, and S. Lee. 2009. Biocide application forcontrolling biofouling of SWRO membranes–an overview. Desalination 238:43–52.
31. Kogure, K., U. Simidu, and N. Taga. 1980. Distribution of viable marine-bacteria in Neritic seawater around Japan. Can. J. Microbiol. 26:318–323.
32. Kumar, S., K. Tamura, and M. Nei. 2004. MEGA3: integrated software formolecular evolutionary genetics analysis and sequence alignment. Brief.Bioinformatics 5:150–163.
33. Lane, D. J. 1991. 16S/23S rRNA sequencing, p. 115–147. In E. Stackebrandtand M. Goodfellow (ed.), Nucleic acid techniques in bacterial systematics.John Wiley & Sons, Chester, England.
34. Lee, J., et al. 2009. Selection of the most problematic biofoulant in fouledRO membrane and the seawater intake to develop biosensors for membranebiofouling. Desalination 247:125–136.
35. Lepere, C., D. Boucher, L. Jardillier, I. Domaizon, and D. Debroas. 2006.Succession and regulation factors of small eukaryote community composi-tion in a lacustrine ecosystem (Lake Pavin). Appl. Environ. Microbiol. 72:2971–2981.
36. Liu, W. T., T. L. Marsh, H. Cheng, and L. J. Forney. 1997. Characterizationof microbial diversity by determining terminal restriction fragment lengthpolymorphisms of genes encoding 16S rRNA. Appl. Environ. Microbiol.63:4516–4522.
37. Mason, O. U., et al. 2009. Prokaryotic diversity, distribution, and insights intotheir role in biogeochemical cycling in marine basalts. ISME J. 3:231–242.
38. McAllen, R., and G. W. Scott. 2000. Behavioural effects of biofouling in amarine copepod. J. Mar. Biol. Assoc. U.K. 80:369–370.
39. Nelson, J. D., S. E. Boehme, C. E. Reimers, R. M. Sherrell, and L. J.Kerkhof. 2008. Temporal patterns of microbial community structure in theMid-Atlantic Bight. FEMS Microbiol. Ecol. 65:484–493.
40. Pang, C. M., and W. T. Liu. 2007. Community structure analysis of reverseosmosis membrane biofilms and the significance of Rhizobiales bacteria inbiofouling. Environ. Sci. Technol. 41:4728–4734.
41. Paul, J. H. 1982. Use of Hoechst dye-33258 and dye-33342 for enumerationof attached and planktonic bacteria. Appl. Environ. Microbiol. 43:939–944.
42. Penna, V. T. C., S. A. M. Martins, and P. G. Mazzola. 2002. Identification ofbacteria in drinking and purified water during the monitoring of a typicalwater purification system. BMC Public Health 2:13.
43. Ridgway, H. F., A. Kelly, C. Justice, and B. H. Olson. 1983. Microbial foulingof reverse osmosis membranes used in advanced wastewater-treatment tech-nology: chemical, bacteriological, and ultrastructural analyses. Appl. Envi-ron. Microbiol. 45:1066–1084.
44. Sadusky, T. J., and R. A. Bullis. 1994. Experimental disinfection of lobstereggs infected with Leucothrix mucor. Biol. Bull. 187:254–255.
45. Saeed, M. O., et al. 2000. Biofouling in a seawater reverse osmosis plant onthe Red Sea coast, Saudi Arabia. Desalination 128:177–190.
46. Schut, F., et al. 1993. Isolation of typical marine-bacteria by dilution culture-growth, maintenance, and characteristics of isolates under laboratory condi-tions. Appl. Environ. Microbiol. 59:2150–2160.
47. Simpson, E. H. 1949. Measurement of diversity. Nature 163:688.48. Subramani, A., X. F. Huang, and E. M. V. Hoek. 2009. Direct observation of
bacterial deposition onto clean and organic-fouled polyamide membranes. J.Colloid. Interface Sci. 336:13–20.
49. Vincze, T., J. Posfai, and R. J. Roberts. 2003. NEBcutter: a program to cleaveDNA with restriction enzymes. Nucleic Acids Res. 31:3688–3691.
50. Vrouwenvelder, J. S., J. C. Kruithof, and M. C. M. Van Loosdrecht. 2010.Integrated approach for biofouling control. Water Sci. Technol. 62:2477–2490.
51. Wang, S., G. Guillen, and E. M. V. Hoek. 2005. Direct observation ofmicrobial adhesion to membranes. Environ. Sci. Technol. 39:6461–6469.
52. Wilf, M., and C. Bartels. 2005. Optimization of seawater RO systems design.Desalination 173:1–12.
4398 ZHANG ET AL. APPL. ENVIRON. MICROBIOL.
on January 20, 2013 by guesthttp://aem
.asm.org/
Dow
nloaded from