composition and behavior - us epa
TRANSCRIPT


Composition and Behavior of Ethanol Gasolines
Jim WeaverUS Environmental Protection Agency
National Exposure Research Laboratory
Athens, Georgia
For Freshwater Spills 2009
St. Louis, MissouriApril 27-30, 2009

Outline
• Historical Usage of Ethanol • Phase behavior of
ethanol/gasoline blends • Composition of Fuel Ethanol
Samples • Field Examples: Land and Water• Modeling Examples
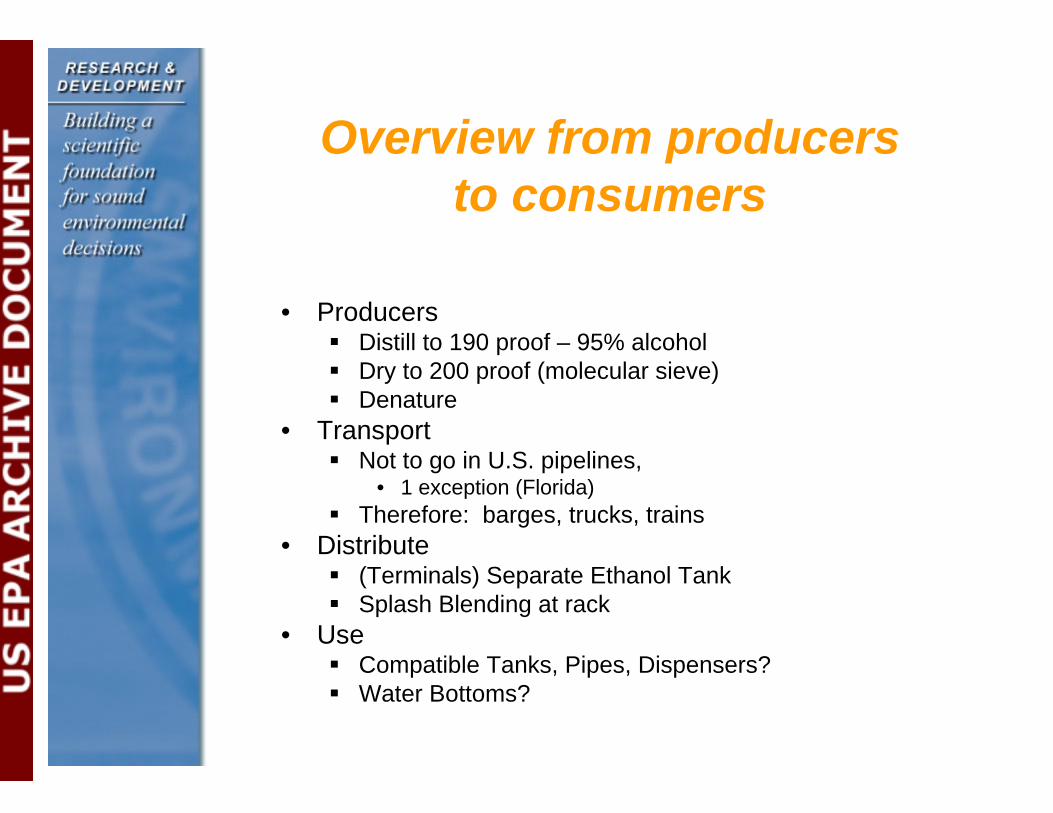
Overview from producers to consumers
• Producers � Distill to 190 proof – 95% alcohol � Dry to 200 proof (molecular sieve) � Denature
• Transport � Not to go in U.S. pipelines,
• 1 exception (Florida) � Therefore: barges, trucks, trains
• Distribute � (Terminals) Separate Ethanol Tank � Splash Blending at rack
• Use � Compatible Tanks, Pipes, Dispensers? � Water Bottoms?

Alternate Marketing Strategies

Terminology • Following ASTM D 4806 – 08a Standard
Specification for Denatured Fuel Ethanolfor Blending with Gasolines for Use as Automotive Spark-Ignition Engine Fuel.� Denaturant -- a material added to fuel ethanol to
make it unsuitable for beverage use, but not forunsuitable for automotive use.
� Fuel Ethanol -- ethanol with impurities common to its production including water but not denaturants.
� Denatured Fuel Ethanol – fuel ethanol made unfit for beverage use by the addition of denaturants.
� Higher Molecular Weight Alcohols – aliphatic alcohols of general formula CnH2n+1OH with n from 3 to 8.

Ethanol and Gasoline Blends
• E100: Non-denatured fuel ethanol • E95: Denatured fuel ethanol � ASTM 4806
• Min 92% ethanol • Denaturants: 2% to 5%
– Natural gasoline – Gasoline components – Unleaded gasoline
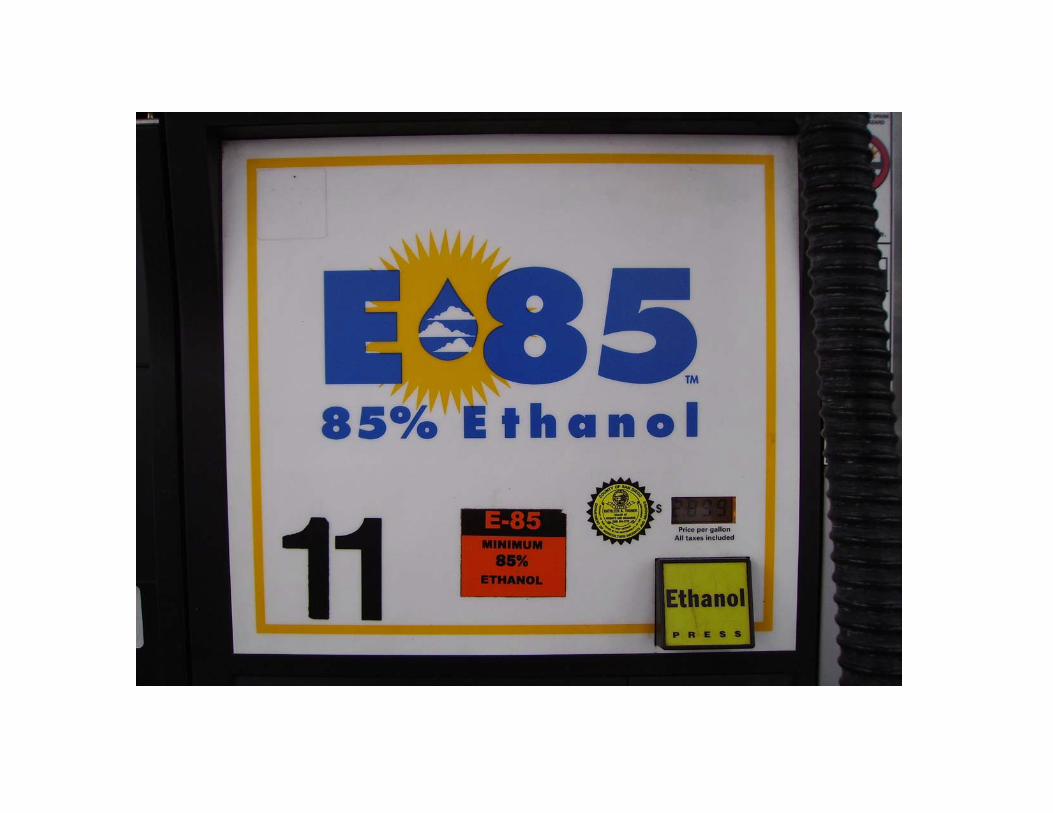
• E85: “Flex Fuel” ASTM D 5798 � Three ethanol classes: min. 70%, 74%,
79% • E10: “may contain 10% ethanol” � ~90% gasoline

ASTM SPEC
• Ethanol > 92.1% • Water < 1% • Methanol < 0.5% • Solvent-wasted gum < 5 mg/100
mL • Denaturant 1.96% to 5% • Inorganic Chloride < 10 mg/L

A Word on Taxes
• 2008 Food, Conservation, and Energy Act (Public Law 110-123) � January 1, 2009 � full ethanol production credit only if
denaturant content < 2%.• U.S. Internal Revenue Service � temporarily allowing credits for
denaturant(s) < 2.5% of the fuel ethanol � Notice 2009-06
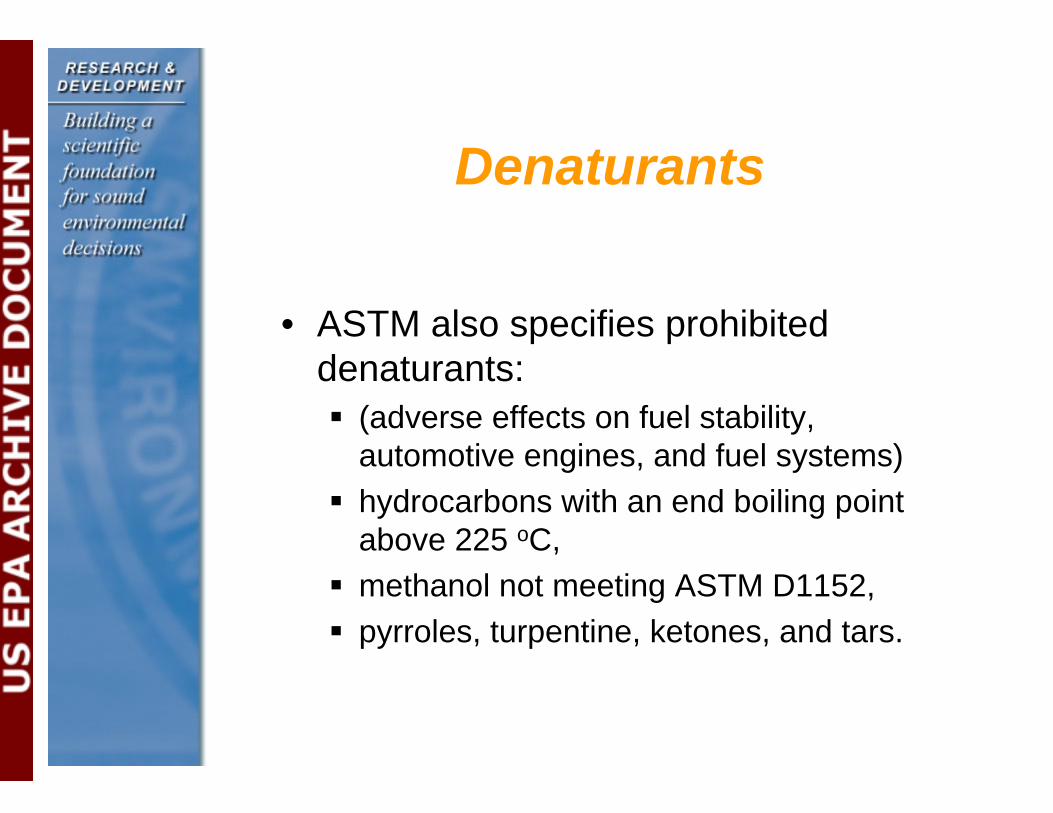
Denaturants
• ASTM also specifies prohibited denaturants: � (adverse effects on fuel stability,
automotive engines, and fuel systems) � hydrocarbons with an end boiling point
above 225 oC, � methanol not meeting ASTM D1152,� pyrroles, turpentine, ketones, and tars.

Ethanol Usage in Gasoline
• Historic � Known as an octane booster since the
1920s � Oxygenates required in reformulated
gasoline 1995-2006 • Mandated � Energy Policy Act 2005 � Energy Independence and Security Act of
2007 � Some state rules

Bill
ion
Gal
lons
40
30
20
10
0
2006 2008 2010 2012 2014 2016 2018 2020 2022
Year
Renewable Fuel Mandates EISA 2007 Renewable Fuel EISA 2007 Conventional Biofuel EISA 2007 Conventional and Cellulosic Biofuel EPAct 2005 Renewable Fuel
Cellulosic
Conventional (starch based)
OtherAdvanced
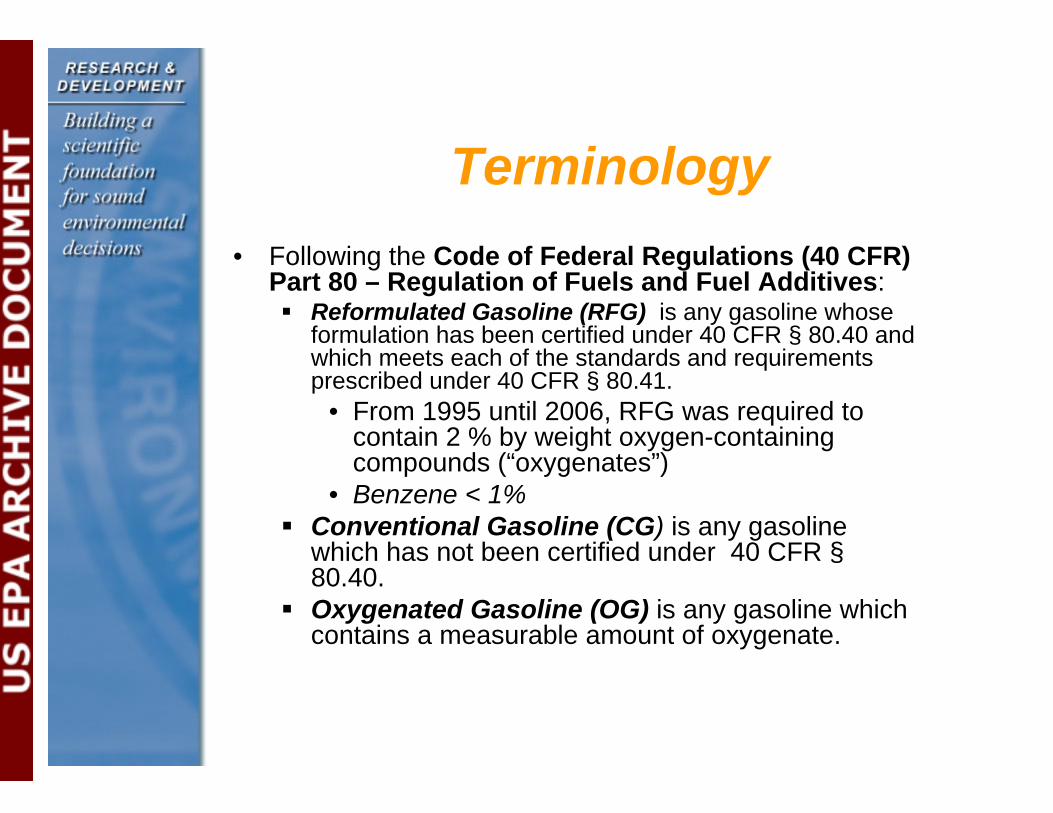
Terminology • Following the Code of Federal Regulations (40 CFR)
Part 80 – Regulation of Fuels and Fuel Additives: � Reformulated Gasoline (RFG) is any gasoline whose
formulation has been certified under 40 CFR § 80.40 and which meets each of the standards and requirementsprescribed under 40 CFR § 80.41.
• From 1995 until 2006, RFG was required to contain 2 % by weight oxygen-containing compounds (“oxygenates”)
• Benzene < 1% � Conventional Gasoline (CG) is any gasoline
which has not been certified under 40 CFR §80.40.
� Oxygenated Gasoline (OG) is any gasoline whichcontains a measurable amount of oxygenate.

Reformulated and Conventional Gasoline in the US
State Cle aner Burning Gasoline (CBG) Fe deral Oxygenate Re qui rement Duration
1.1.95 to 3.10.99 1.1.95 to 4.24.06 1.1.95 to 5.5.0 6 6.1.96 to 4.24.06 8.1.97 to 6.18.98 6.1.99 to 5.5.0 6 12.10 .02 to 4.2 4.06None
0 200 400 600 800 100 0 Kim

Wee
kly
Prod
uctio
n (1
000
BB
L/da
y)
0
1000
2000
3000
4000
5000
6000
7000
8000
9000
10000
Total
RFG + CG (w. alcohol)
RFG (w. alcohol)
RFG (w. ether)
DOE Production Data
Jan 14, Aug 01, Feb 17, Sep 05, Mar 24, Oct 10, Apr 28, Nov 14, Jun 01, Dec 18, Jul 06, 20092004 2004 2005 2005 2006 2006 2007 2007 2008 2008
Date
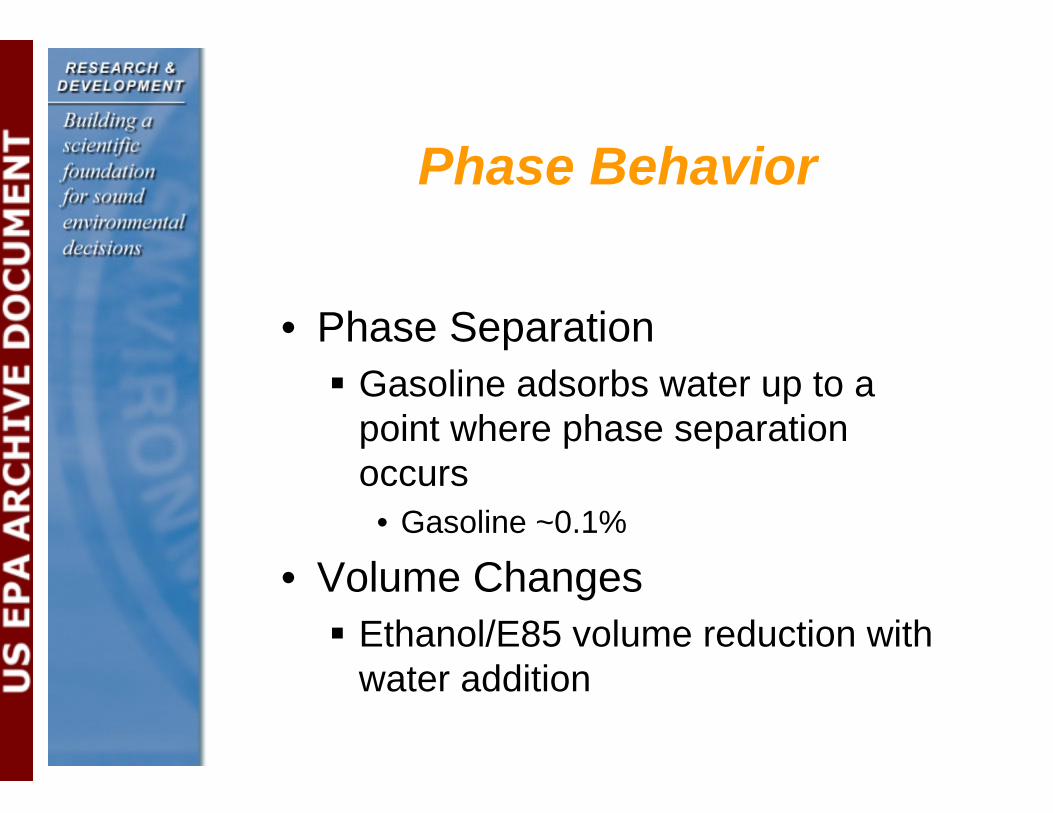
Phase Behavior
• Phase Separation � Gasoline adsorbs water up to a
point where phase separation occurs
• Gasoline ~0.1%
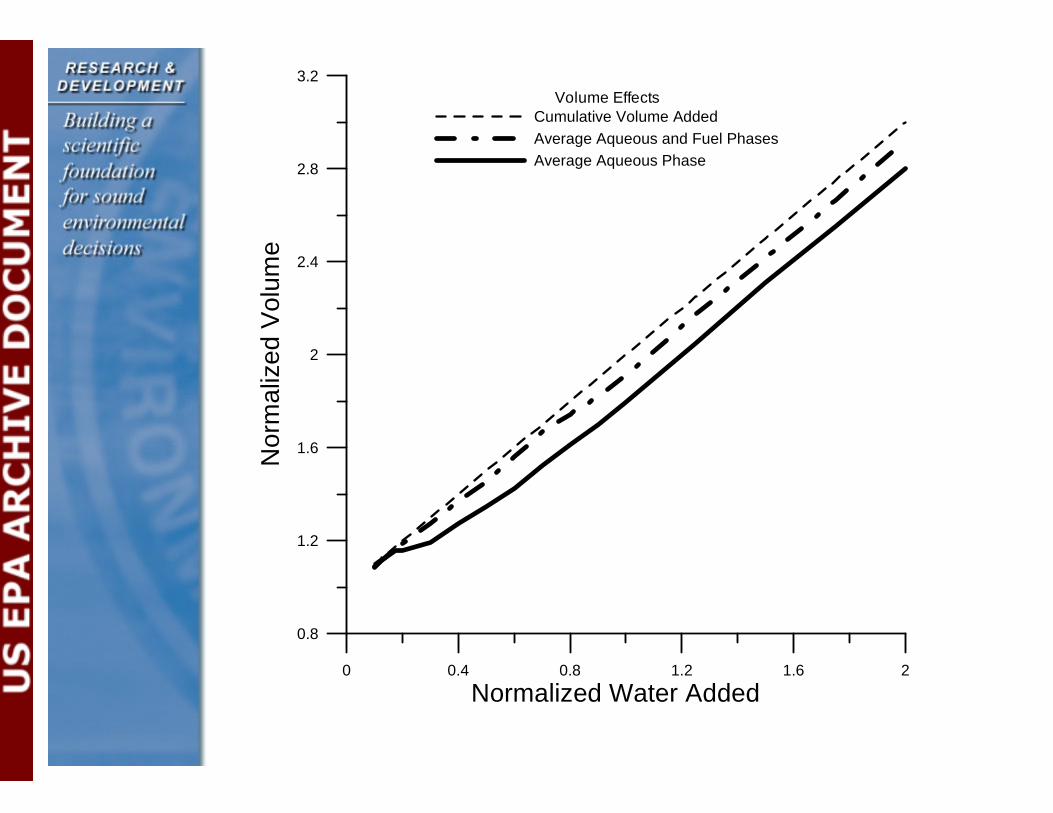
• Volume Changes � Ethanol/E85 volume reduction with
water addition


0 1
0 0.2 0.4 0.6 0.8 1 % Hydrocarbon
0.8
0.6
0.4
0.2
%Ethanol
0.8
0.6
0.4
0.2
%W
ater
Two Phase
One Phase
1 0


0 0.4 0.8 1.2 1.6 2
Normalized Water Addition
0 0.4 0.8 1.2 1.6 2
Normalized Water Addition
0
0.2
0.4
0.6
0.8
1
Nor
mal
ized
Gas
olin
e R
elea
sed
E85 and E95 E95
0
0.2
0.4
0.6
0.8
1
Nor
mal
ized
Gas
olin
e R
elea
sed
E85 and E95 E85 - 1 E85 - 2 E85 - 3 E85 - 4
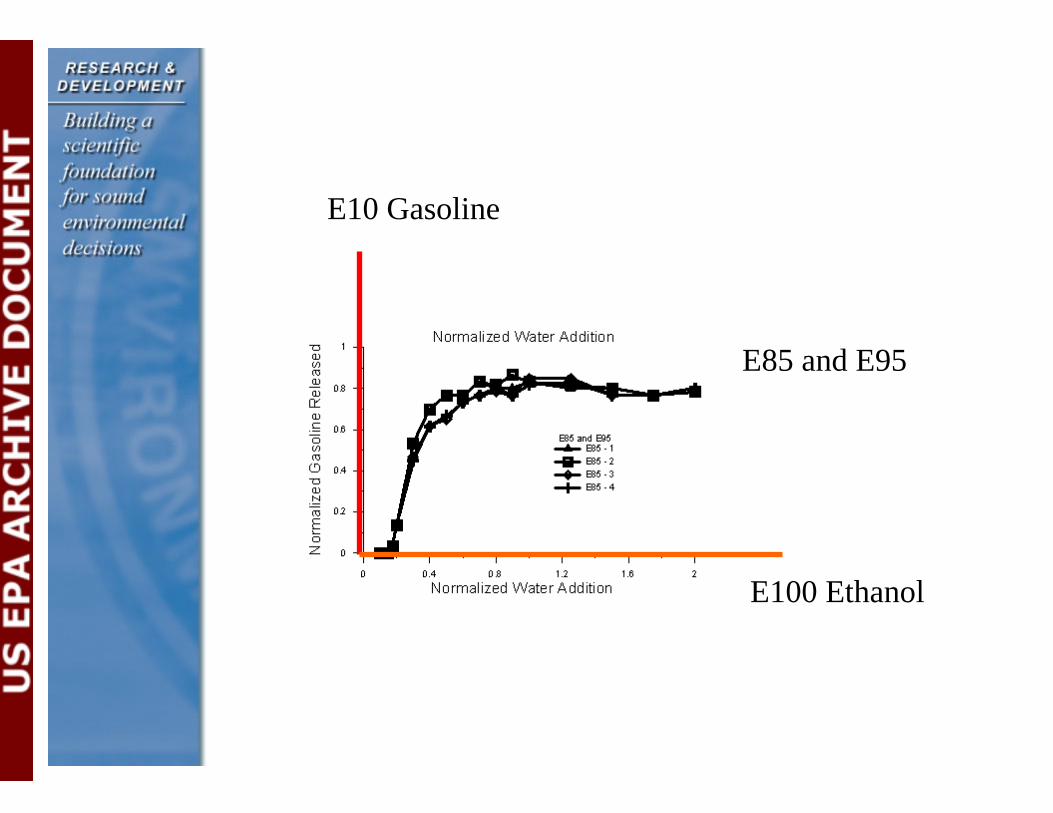
E10 Gasoline
E100 Ethanol
E85 and E95
0.8
1.2
1.6
2
2.4
2.8
3.2
Nor
mal
ized
Vol
ume
Volume Effects Cumulative Volume Added Average Aqueous and Fuel Phases Average Aqueous Phase
0 0.4 0.8 1.2 1.6 2
Normalized Water Added

Videos
• Dyed Water Added to E85 � Initially water is absorbed by E85 � Initially no increase in volume � E85 breaks into “gasoline” and aqueous/ethanol
phase • E85 added to water � Quiescent E85 jets into water � Cloudy surfactant layer over clear water � Gasoline accumulates on surface � In moving system gasoline “rides” surface

Dyed water and “gasoline” after phase separation

Phase separated E85 on water
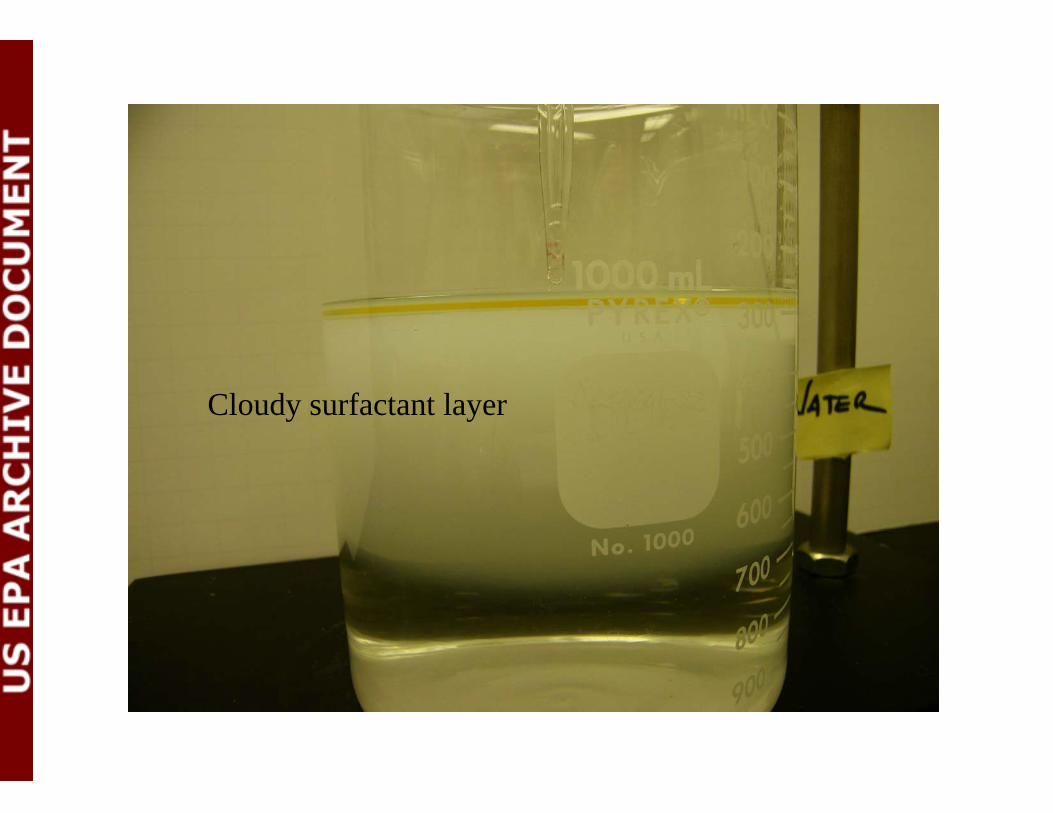
Cloudy surfactant layer

Gasoline on surface, Accumulating at edges

Gasoline “rides” the water surface into the vortex!

Ethanol
Ethanol
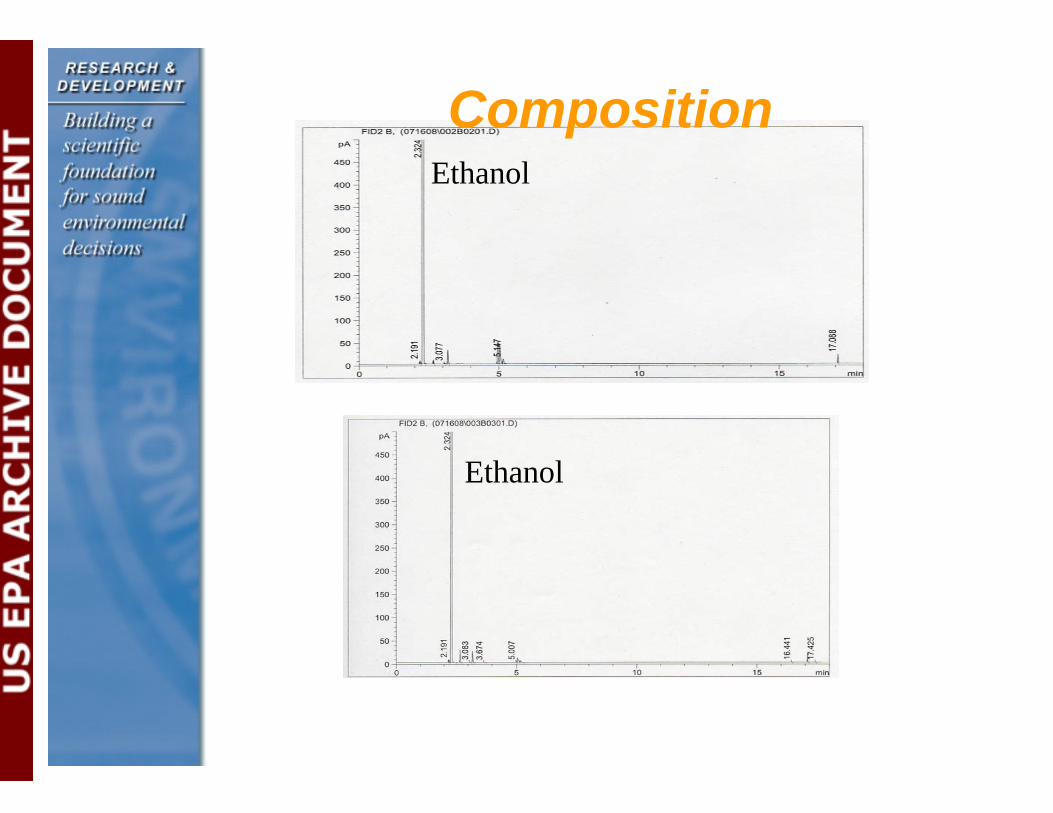
Composition

Ethanol Components Name Formula CAS. Number Concentration (wt. %)
Wet Mill Dry Mill Sample Sample
Water(1) H2O 7732-18-15 0.65 0.08
Methanol CH4O 67-55-1 0.07 0.06
Ethanol(2) C2H6O 64-17-5 97.89 99.75
1-Propanol C3H8O 71-23-8 0.03 0.08
Isobutyl Alcohol C4H10O 78-83-1 0.10 0.08
2-Methyl 1- C5H12O 137-32-6 0.06 0.01 Butanol
3-Methyl 1- C5H12O 123-51-3 0.21 0.02 Butanol
Ethyl Acetate C4H8O2 141-78-6 0.02 --1,1-Diethoxyethane C6H14O2 105-57-7 0.28 --
(1) Determined by Karl Fischer titration(2)Determined by remainder of other compounds

Observed Ethanol Concentrations in Gasoline

Northrop-Grumman (successor to NIPER)
Bartlesville, Oklahoma Summer 07 Conventional Gasoline
0
0.5
1
1.5
2
2.5
3
3.5
4
Ben
zene
(vol
%)
CG < 90 ON CG > 90 ON
0 2 4 6 8 10 12 14
Ethanol (vol %) 16

Northrop-Grumman (successor to NIPER)Bartlesville, Oklahoma
Reformulated Gasoline
0
0.5
1
1.5
2
2.5
3
3.5
4
Ben
zene
(vol
%)
RFG < 90 ON RFG > 90 ON
0 2 4 6 8 10 12 14
Ethanol (vol %) 16


Cosolubility
• Ethanol increases the aqueous solubility of petroleum hydrocarbons � Dependent on
• Ethanol concentration in water • Petroleum hydrocarbon concentration in gasoline
� Theory developed by Heerman and Powers, 1998 • Example:
– Gasoline containing 1% benzene, mixed with denatured alcohol
– Alcohol denatured with gasoline containing 1% benzene
– Benzene mass not limiting

Estimated Benzene Concentration
800
Estim
ated
Ben
zene
Con
cent
ratio
n(m
g/L)
700
Average Case 3
600 Case 6
500
400
300
200
100
0 0 0.1 0.2 0.3 0.4 0.5 0.6 0.7 0.8 0.9
Ethanol Volume Fraction 1
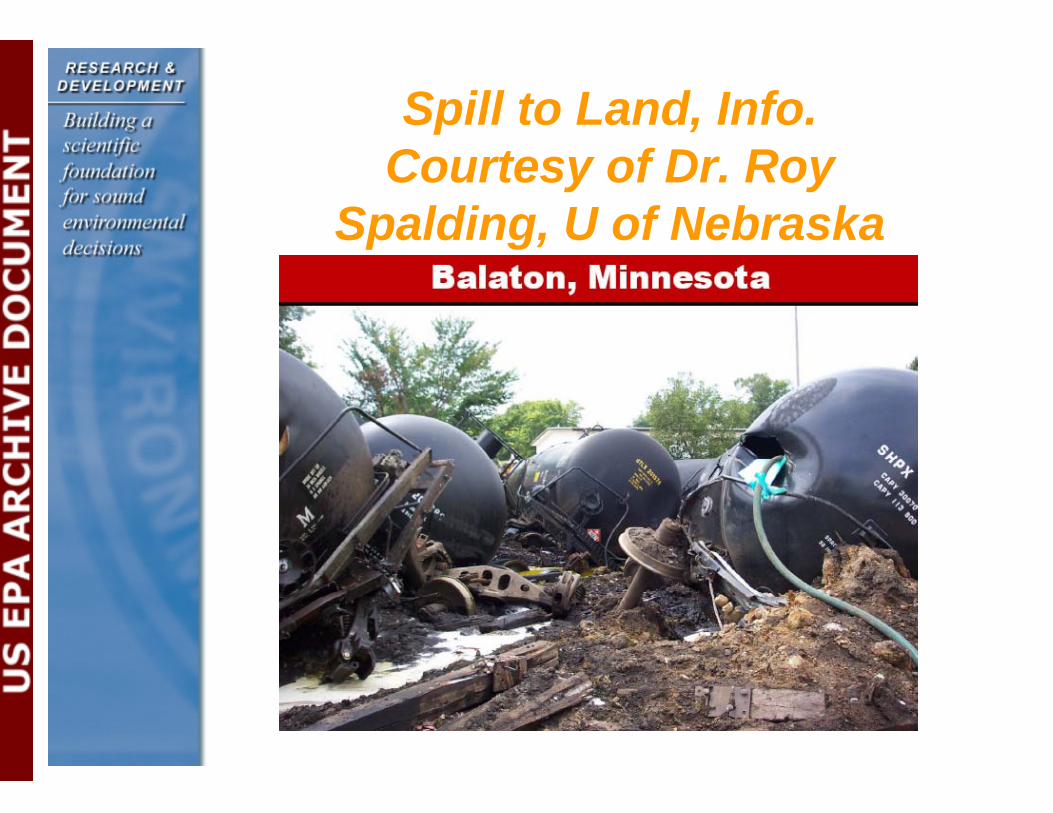
Spill to Land, Info. Courtesy of Dr. Roy
Spalding, U of Nebraska
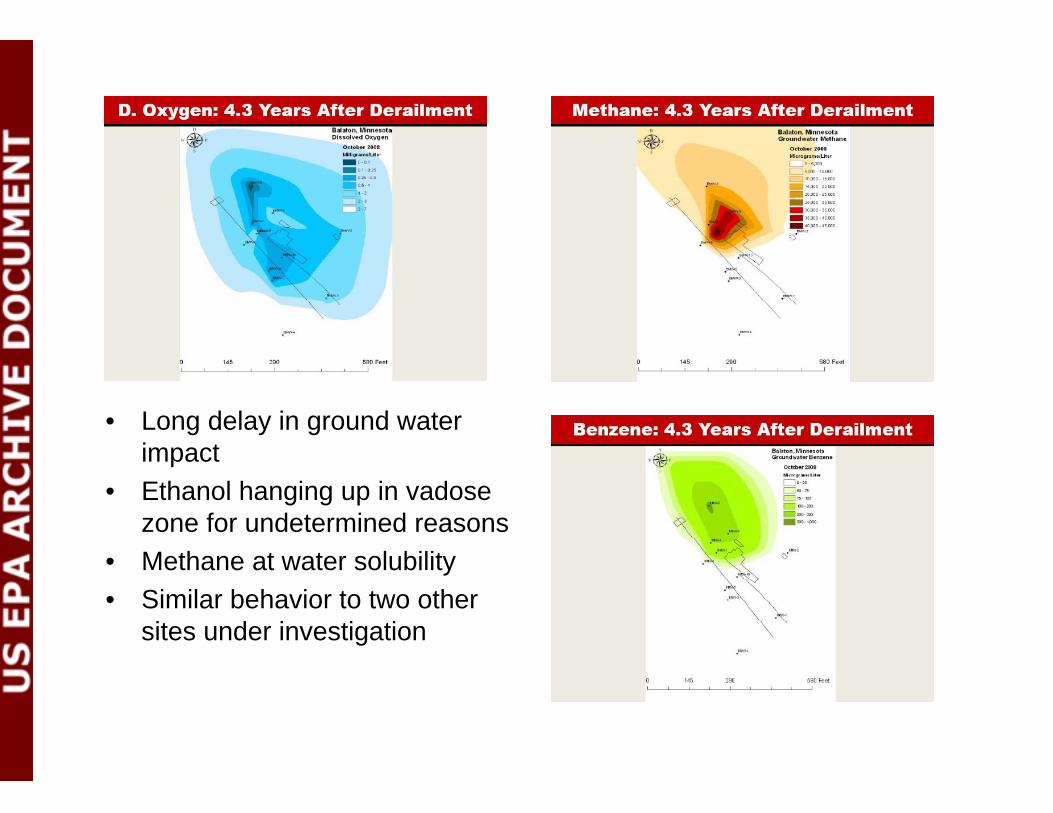
• Long delay in ground water impact
• Ethanol hanging up in vadose zone for undetermined reasons
• Methane at water solubility • Similar behavior to two other
sites under investigation

E10 Releases to Land
• Formation of groundwater plumes • Biotransformation of ethanol causes
extension of BTEX plumes � Order of 2x length
• Simulation (next slide) requires accounting for electron acceptors/donors: O2, NO2, Fe+++, SO4, CO2

Modeled RFG (w MTBE) vs E10
1 0 0 0 1 0 0 0 6 5 6 0 6 0 5 5 Benzene 5 0 9 0 0 5 5 9 0 0 5 0 4 5 4 5 4 0 4 0 3 5 8 0 0 8 0 0 3 5 3 0 Benzene 3 0 2 5 2 5 2 0
1 5 7 0 0 2 0 7 0 0 1 5 1 0 1 0 55
6 0 0 0 5 0 0 1 0 0 0 1 5 0 0 6 0 0 0 5 0 0 1 0 0 0
1 0 0 0 1 0 0 0 2 1 0 2 0 0 4 5 0 9 0 0 1 8 0
3 5 0
9 0 0 4 0 0 1 6 0
3 0 0 1 2 0
2 0 0
1 4 0 Ethanol8 0 0 2 5 0 MTBE 8 0 0 1 0 0
1 5 0 8 0 6 0 1 0 0 7 0 0 4 0 2 0
7 0 0 5 0
6 0 0 0 5 0 0 1 0 0 0 6 0 0 0 5 0 0 1 0 0 0 1 5 0 0
1 5 0 0
1 5 0 0
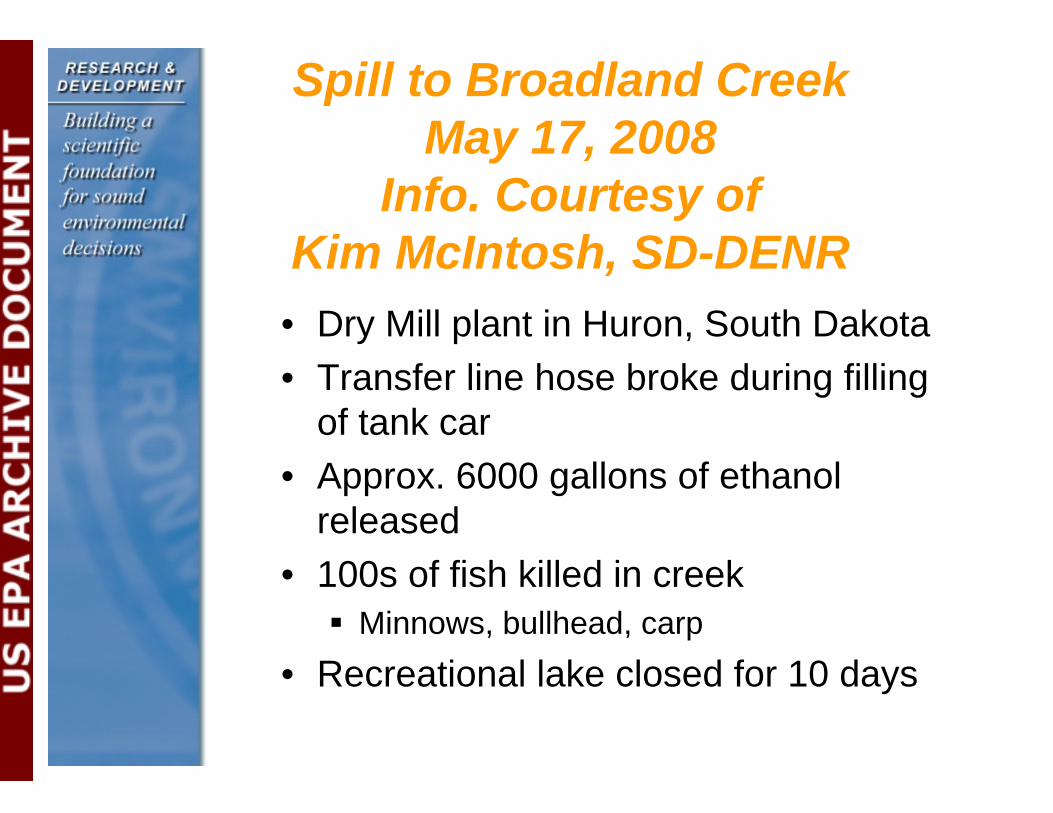
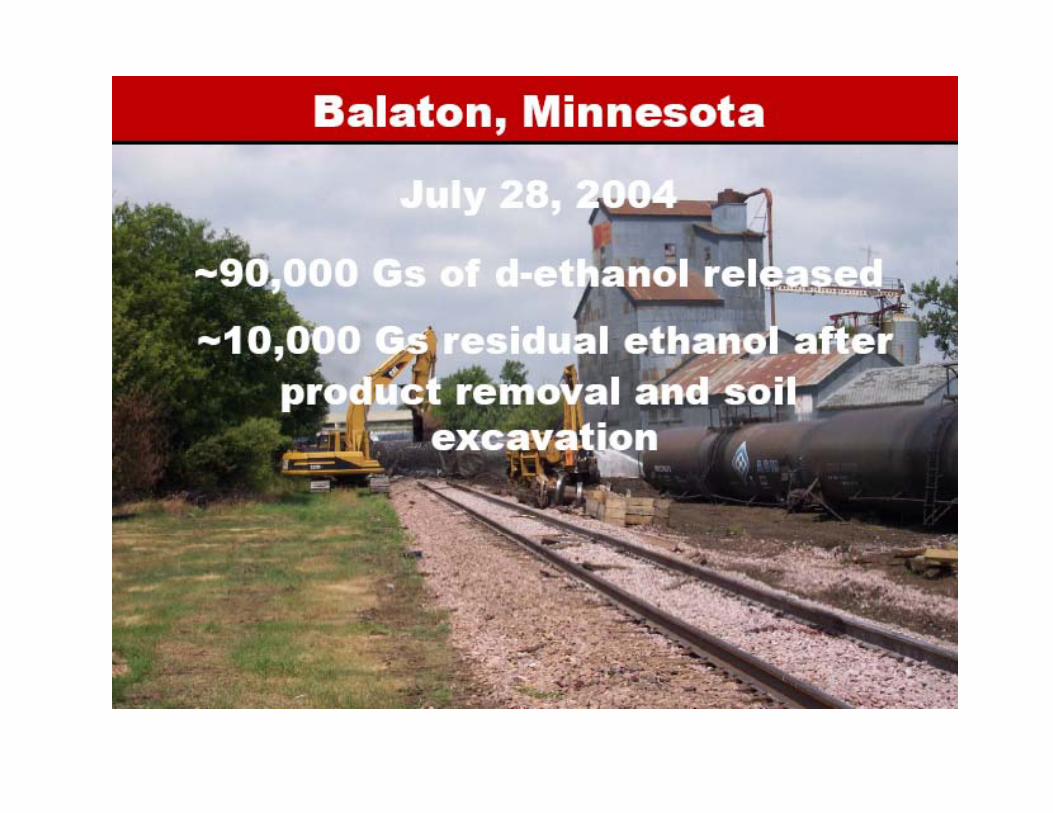
Spill to Broadland CreekMay 17, 2008
Info. Courtesy of Kim McIntosh, SD-DENR
• Dry Mill plant in Huron, South Dakota
• Transfer line hose broke during filling of tank car
• Approx. 6000 gallons of ethanol released
• 100s of fish killed in creek � Minnows, bullhead, carp
• Recreational lake closed for 10 days

Response
• Deploy boom and aerators 3 mi downstream • Daily check of temperature, dissolved oxygen, pH,
conductivity � 5/20/2008 am D.O. 0.2 to 10.6 mg/L � 5/21/2008 am D.O. 0.3 to 5.4 mg/L � 5/21/2008 pm D.O. 1.0 to 7.6 mg/L � 5/22/2008 am D.O. 1.0 to 6.0 mg/L � 5/22/2008 pm D.O. 1.2 to 5.7 mg/L (downstream) � 5/22/2008 pm D.O. 0.4 to 8.0 mg/L � 5/23/2008 am D.O. 1.0 to 6.6 mg/L (upstream) � 5/23/2008 pm D.O. 0.3 to 5.8 mg/L � 5/23/2008 pm D.O. 0.1 to 5.6 mg/L (downstream) � 5/24/2008 am D.O. 0.2 to 5.9 mg/L � 5/27/2008 am D.O. 1.0 to 8.0 mg/L
• Moved aerators as plume moved downstream
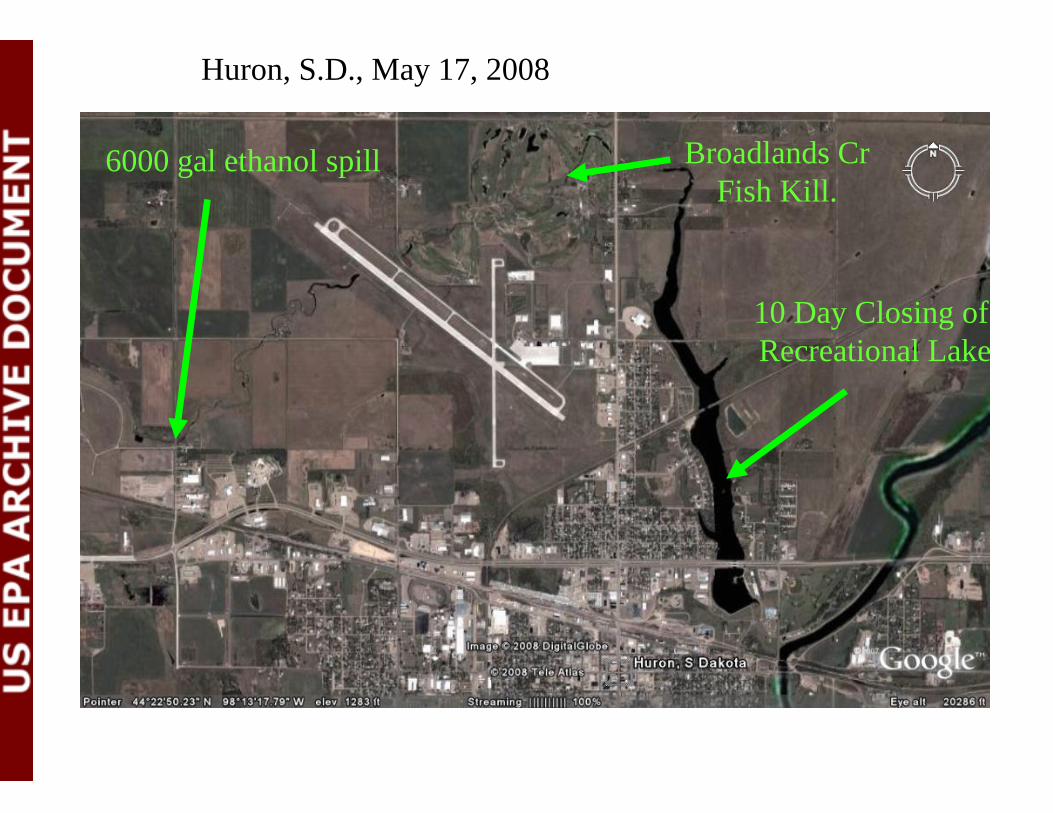
Huron, S.D., May 17, 2008
6000 gal ethanol spill Broadlands Cr Fish Kill.
10 Day Closing of Recreational Lake

Comments
• No gasoline obeserved • 4 water samples for VOCs 5/21 � BTEX, tri-methylbenzenes, ethanol,
methanol � Most results ND, one sample
ethanol at 6800 ppb
• Generally increased D.O. by 5/27/2008

Honeycutt Creek/Middle Oconee River
Athens, Georgia
• Scenario: � Small creek that drains area near
fuel terminal � Oil spill in 2003 (14K gallons mixed
gasoline, diesel, waste oil) � Approx 3 miles downstream
intercepts Middle Oconee River � Drinking Water Intake for Athens,
Georgia

Data
• Hypothetical Release Scenario • Composition and Phase Separation
Data from Laboratory • Stream network geometry from USGS
DEMs • Flows � Honeycutt Creek flow and geometry from
a day’s work � Middle Oconee River flows and discharge
stage from USGS gages

Spill Site
Honeycutt Creek
Middle Oconee River

USGS Station Geometry
• Depth and Width of River/Streams are necessary � Determines dilution of dissolved chemicals
• Velocity � Determines transport rate
• USGS surveys stations each year � Continual change due to scouring and
sedimentation � Our protocol is to use the latest data for a
given channel size
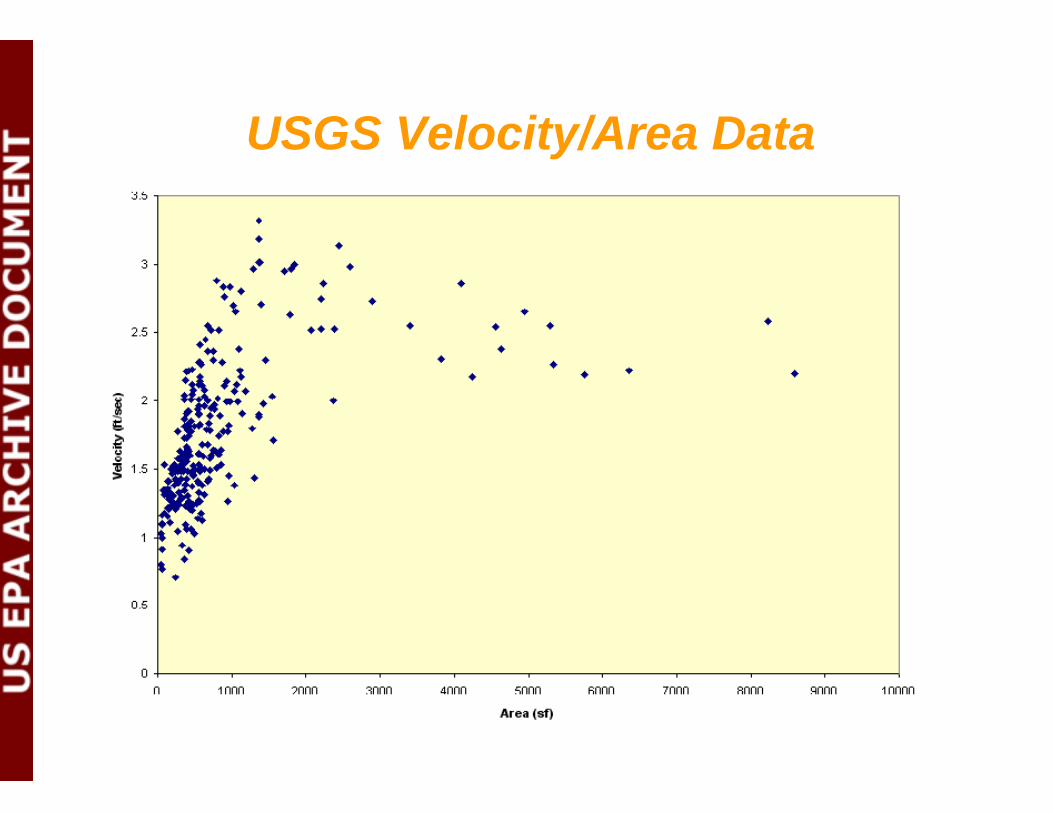
USGS Velocity/Area Data
Model Approach
• Use measured flows to drive Lagrangian transport model� Flow ~ spill rate
• Assume complete mixing • Adjust velocity via Manning formula
� Flow >> spill rate • Mixing zones defined from turbulent
diffusion coefficients

Spill Chacteristics
• 10,000 Gal Spill of E-85 • 5 hour spill duration

Simulated Gasoline and Aqueous Ethanol Extent
213 Minutes 306 Minutes
Leading Edges
397 Minutes
428 Minutes 459 Minutes

Simulated Gasoline and Aqueous Ethanol Extent
213 Minutes 306 Minutes
Trailing Edges Form After Spill Ends
397 Minutes
428 Minutes 459 Minutes

Simulated Gasoline and Aqueous Ethanol Extent
213 Minutes 306 Minutes
After Spill Ends, Evaporation Reduces Gasoline
397 Minutes
428 Minutes 459 Minutes

Oil Slick Extent
Middle Oconee River
Honeycut Creek

Conclusions
• Ethanol rapidly replaced ethers in mid 2006 in reformulated gasoline
• Ethanol is used in about 75% of U.S. gasoline.
• Fuel ethanol contains several impurities including higher molecularweight alcohols � 3 to 5 carbon atoms � …But at concentrations < 1/4 percent

Conclusions
• E85 and E95 adsorb about 20%-30% of own volume in water before phase separating � Fuel Ethanol doesn’t phase
separate
� E10 phase separates at about 0.5% water

Conclusions • Spills of denatured alcohol to land
based on three field studies: � Hangs up in the vadose zone � Methane at max solubility � Impacts to ground water delayed
• E10 Releases cause extended BTEX plumes
• Spills to water (Broadlands Ck) � No observed gasoline slick from
denatured alcohol� Loss of dissolved oxygen major impact

National Exposure Research Laboratory
• Although this work was reviewed by EPA and approved for presentation, it may not necessarily reflect official Agency policy.
• Thanks to: � Mark Toso, Minnesota PCA, � Cheryl Dickson, Northrop-Grumman � Kim McIntosh, South Dakota DENR, � Dr. Roy Spalding, University of Nebraska, � Dr. Illena Rhodes, Shell Global Solutions
• Contact: [email protected] • EPA report, April 2009: � Composition and Behavior of Fuel Ethanol, EPA
600/R-09/037� from www.epa.gov/athens/publications