composite analysis of the effects of enso events …meteor75/antarctica/jcli-d-15-0108.1.pdf ·...
TRANSCRIPT
Composite Analysis of the Effects of ENSO Events on Antarctica
LEE J. WELHOUSE
Antarctic Meteorological Research Center, Space Science and Engineering Center,
University of Wisconsin–Madison, Madison, Wisconsin
MATTHEW A. LAZZARA
Antarctic Meteorological Research Center, Space Science and Engineering Center, University of
Wisconsin–Madison, and Department of Physical Sciences, School of Arts and Sciences,
Madison Area Technical College, Madison, Wisconsin
LINDA M. KELLER, GREGORY J. TRIPOLI, AND MATTHEW H. HITCHMAN
Department of Atmospheric and Oceanic Sciences, University of Wisconsin–Madison, Madison, Wisconsin
(Manuscript received 1 February 2015, in final form 4 January 2016)
ABSTRACT
Previous investigations of the relationship between El Niño–Southern Oscillation (ENSO) and the Ant-
arctic climate have focused on regions that are impacted by both El Niño and La Niña, which favors analysis
over the Amundsen and Bellingshausen Seas (ABS). Here, 35 yr (1979–2013) of European Centre for
Medium-Range Weather Forecasts interim reanalysis (ERA-Interim) data are analyzed to investigate the
relationship between ENSO and Antarctica for each season using a compositing method that includes nine
El Niño and nine La Niña periods. Composites of 2-m temperature (T2m), sea level pressure (SLP), 500-hPa
geopotential height, sea surface temperatures (SST), and 300-hPa geopotential height anomalies were cal-
culated separately for El Niño minus neutral and La Niña minus neutral conditions, to provide an analysis of
features associated with each phase of ENSO. These anomaly patterns can differ in important ways from
El Niño minus La Niña composites, which may be expected from the geographical shift in tropical deep
convection and associated pattern of planetarywave propagation into the SouthernHemisphere. The primary
new result is the robust signal, during La Niña, of cooling over East Antarctica. This cooling is found from
December to August. The link between the southern annular mode (SAM) and this cooling is explored. Both
El Niño and LaNiña experience the weakest signal during austral autumn. The peak signal for LaNiña occursduring austral summer, while El Niño is found to peak during austral spring.
1. Introduction
This research focuses on the El Niño–Southern Oscil-
lation (ENSO) signal found throughoutAntarctic surface
observations and reanalysis data. [For a more complete
review of prior literature on interactions between ENSO
and Antarctica see Turner (2004).] Understanding of
ENSO, and its effects, has expanded substantially since it
was initially investigated in depth. ENSO is now un-
derstood to be among the dominant modes of variability
of both the atmosphere and ocean on decadal and sub-
decadal time scales. Its effects are found around the
globe, rather than simply in the Pacific where it has its
origin (Diaz and Markgraf 1992; Trenberth 1975a,b,
1976; Mo and White 1985). ENSO has been described
as a coupled system linking an oceanic segment and an
atmospheric segment, El Niño and the Southern Oscil-
lation, respectively (Philander and Rasmusson 1985).
The Southern Oscillation is measured using the surface
pressure variations between the equatorial western and
eastern Pacific, specifically between sites at Darwin,
Australia, and Tahiti. The definition of El Niño for the
oceanic Niño index (ONI) used predominantly in the
literature, and throughout this work, is that of greater
Corresponding author address: Lee J. Welhouse, Space Science
and Engineering Center, 1225 West Dayton St., Madison, WI
53706.
E-mail: [email protected]
Denotes Open Access content.
1 MARCH 2016 WELHOUSE ET AL . 1797
DOI: 10.1175/JCLI-D-15-0108.1
� 2016 American Meteorological Society
than a 0.48C anomaly from the mean of SSTs for
6 months or longer within the Niño-3.4 region (58N–58S,1508–908W) (NOAA/Climate Prediction Center 2015).
Similarly, the definition of La Niña is a less than
20.48C anomaly from the mean of SST for 6 months
or longer within the Niño-3.4 region. These criteria
indicate that El Niño conditions occur 31% of the time,
La Niña conditions occur 23% of the time, and neutral
events account for 56% of the time (Trenberth 1997).
Recent work, by Jin and Kirtman (2009), suggests that
the peak in Southern Hemisphere response leads the
peak in tropical signatures of ENSO by approximately
one season due to local seasonality in the tropical
convection. This work will discuss timing of peak sig-
nals, and how these signals differ between El Niñoevents and La Niña events.
Considerable work has gone into determining mech-
anisms for transmission of a signal to explain the tele-
connections found throughout the SouthernHemisphere.
Hoskins and Karoly (1981) found that an area of deep
convection near the equator can act to create Rossby
waves, which then propagate to high latitudes. It was then
indicated that these Rossby waves can have a further
effect on mid- and high-latitude storm tracks in turn, al-
lowing larger effects at high latitudes from smaller
changes in tropical SSTs (Held et al. 1989). Such wave
trains are known as the Pacific–North American (PNA)
pattern in the Northern Hemisphere and the Pacific–
South American (PSA) pattern in the Southern Hemi-
sphere (Karoly 1989). Specifically for this work, the
important PSA pattern is the PSA-1 pattern found in
Karoly (1989), which is largely associated with ENSO
variability in tropical convection. Though there was ini-
tially less evidence to support this designation, further
investigation into the PSA pattern has indicated that it
has effects throughout the Southern Hemisphere
(Harangozo 2000; Mo and Higgins 1998). Often ENSO
teleconnections in the region have been analyzed in
a largely symmetric manner, through composites of
El Niño2 La Niña (Fig. 1a) and spatial correlation maps
that incorporate both phases of ENSO. Symmetry as-
sumes El Niño and La Niña will have equal and opposite
impacts in generally similar regions, which is generally a
good assumption as seen in Figs. 1b and 1c. There are
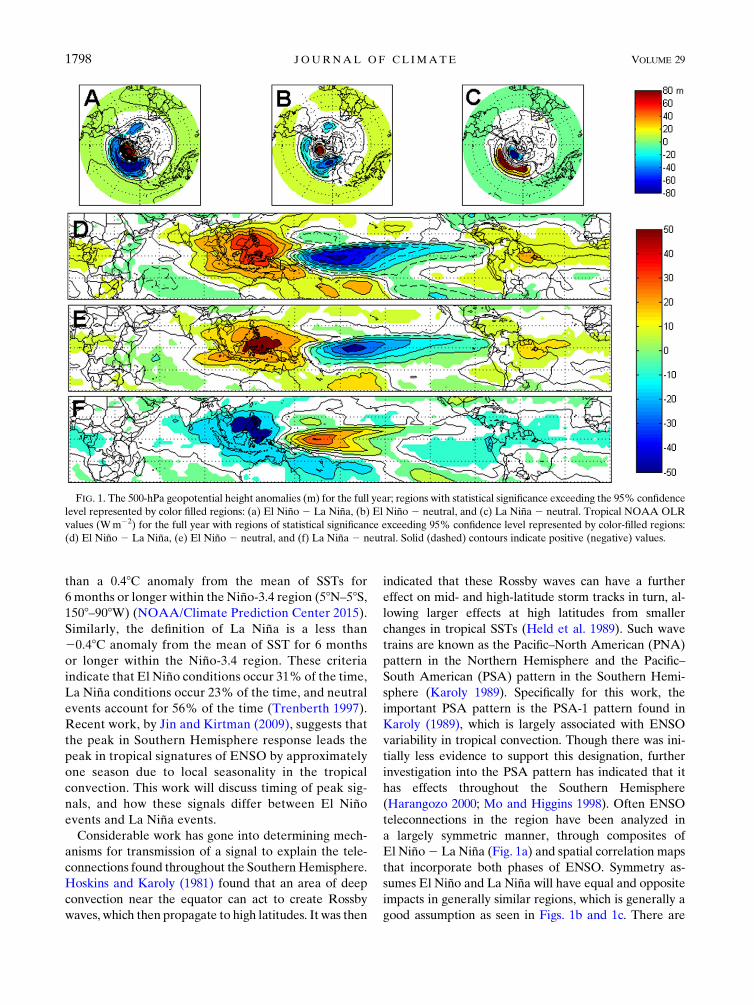
FIG. 1. The 500-hPa geopotential height anomalies (m) for the full year; regions with statistical significance exceeding the 95% confidence
level represented by color filled regions: (a) El Niño 2 La Niña, (b) El Niño 2 neutral, and (c) La Niña 2 neutral. Tropical NOAA OLR
values (Wm22) for the full year with regions of statistical significance exceeding 95% confidence level represented by color-filled regions:
(d) El Niño 2 La Niña, (e) El Niño 2 neutral, and (f) La Niña 2 neutral. Solid (dashed) contours indicate positive (negative) values.
1798 JOURNAL OF CL IMATE VOLUME 29

subtle differences in location with La Niña events shiftedtoward the Ross Ice Shelf region stretching into East
Antarctica (Fig. 1c), while El Niño shows a signal closer
to the peninsula (Fig. 1b) stretching into the Ross Ice
Shelf. We explore these subtle differences on seasonal
time scales throughout this work. Recent research in-
dicates the presence of significant nonlinearities, and
asymmetries in tropical regions between phases of ENSO
(Frauen et al. 2014). These differences warrant an ex-
ploration of how the phases impact the associated tele-
connections. Because of the prior symmetric view, the
literature (Turner 2004) has predominantly focused on
the Amundsen–Bellingshausen Sea (ABS) region and
much of West Antarctica. This is due to the ABS and
West Antarctica being a region where El Niño and La
Niña have opposite impacts, and it is the primary region
of impact related to Rossby wave trains associated with
the PSA. Regions where a single phase of ENSO impact,
such as East Antarctica during La Niña events, will be
largely ignored by these methods due to statistically sig-
nificant patterns being more difficult to find (Houseago-
Stokes and McGregor 2000). Surface area temperature
signals throughout this region have been commented on
in prior literature (Schneider et al. 2012) as being po-
tentially related to a coupling of southern annular mode
(SAM) and ENSO during austral summer. Other mech-
anisms for variation of teleconnections seen at high
southern latitudes are currently being explored and in-
clude interactions with the Indian Ocean dipole (IOD),
SAM, and variability of tropical convection outside of the
tropical Pacific (Clem and Fogt 2013; Li et al. 2015;Wilson
et al. 2014). Of particular interest for this study are in-
vestigations into the timing and extent of teleconnection
patterns as well as asymmetries in the form of distinctions
between El Niño and La Niña signals. This study exploresthe regions of these distinctions in depth in an attempt to
categorize the impact ENSO has on Antarctica during
each phase of ENSO as well as, where viable, to separate
the impact of ENSO from that of the SAM.
2. Data and methods
Numerous reanalysis datasets have been analyzed to
ensure broad agreement throughout both newer and
older datasets. Though it is beyond the scope of this study
to fully validate reanalyses, these datasets have been
compared with various Automatic Weather Stations
(AWS) throughout Antarctica to ensure accuracy within
the regions of important signal. There was good agree-
ment found in all regions discussed over the time period,
with high correlation to surface temperature and pressure
observation data (not shown).While biases were found in
the reanalysis they were relatively consistent throughout
the period explored. More information on these stations
can be found in Lazzara et al. (2012). Validation of older
reanalyses indicates they are sufficiently accurate, during
the time period, for the purposes of this study
(Bromwich and Fogt 2004; Yu et al. 2010). This section
describes the primary dataset utilized as well as the
methodologies used to explore the data. Of particular
interest is the European Centre for Medium-Range
Weather Forecasts (ECMWF) interim reanalysis
(ERA-Interim, 1979–2013) (Dee et al. 2011), as it has
been shown to be the best reanalysis currently available
(Bracegirdle and Marshall 2012; Jones and Lister 2015).
The Climate Forecast System Reanalysis (CFSR, 1979–
2011), and the 40-yr ECMWF Re-Analysis (ERA-40,
1979–2002) have also been analyzed with the methods
described in this study, and there is large agreement be-
tween the reanalysis products with regard to the signals
discussed, though these products capture fewer events,
and are of lower quality. Hence, results are shown only
for ERA-Interim.
a. ERA-Interim
While the ERA-Interim dataset will be used in this
analysis, the product is not without potential spurious
trends. For that reason, the data have been compared
with surface observational data and found to be in good
agreement (not shown; Bracegirdle and Marshall 2012).
The tropical outgoing longwave radiation (OLR) in the
convectively active regions of the tropics is limited in
accuracy (Itterly and Taylor 2014), so the National
Oceanic and Atmospheric Administration (NOAA)
OLR has been used as a proxy for tropical convection.
Further, efforts have been made to analyze detrended
data, and limited impact was found when compared to
nondetrended data for this analysis. This, at first, seems
contradictory given the importance of the SAM trend
and the impact it has on ENSO signals, but this em-
phasizes the difficulty of separating the SAMand ENSO
signals. The ERA-Interim has a resolution of 0.758 30.758 and extends from January 1979 to the present. For
the purposes of this analysis, the time period analyzed
was January 1979–December 2013. The ONI consists of
3-month averages of SST over the Niño-3.4 region.
Because of this, the values from the reanalysis were
formed into 3-month means for the composites. Surface
pressure (Fig. 4), SST (Fig. 6), 2-m temperature (T2m;
Fig. 5), 500-hPa geopotential heights (Fig. 3), and 300-
hPa geopotential heights (Fig. 2) have been evaluated.
b. Composite methods
There are a number of steps necessary to form com-
posites of any given phenomenon. The first step is
choosing a means to define events for compositing. In
1 MARCH 2016 WELHOUSE ET AL . 1799
prior work on ENSO composite analysis, generally the
positive basis was used to describe El Niño events, and
the negative basis was used to describe La Niña events
(Karoly 1989; Turner 2004). More recent studies (Fogt
et al. 2011; Fogt and Bromwich 2006) have analyzed
composites of separate phases, which are particularly
useful in determining the distinct features of each phase.
This study has used the definition of events described by
theONI to assign the events and nonevents. Specifically,
El Niño or La Niña events are compared with non-
ENSO events. After the events are chosen, they are
averaged. These averaged events are subtracted from
the average of the nonevents to form the composite.
Finally, statistical significance is determined by using a
two-tailed Student’s t test, and for the cases evaluated,
the confidence interval has been set at 0.95 and is de-
noted with colored shading.
c. Southern annular mode
Previous studies (Fogt et al. 2011; Fogt and Bromwich
2006; Schneider et al. 2012; Ciasto and Thompson 2008;
L’Heureux and Thompson 2006) have explored the in-
teractions between ENSO and SAM, finding coupling
between the phenomena with strong linear interactions
during the austral summer. Composite analysis finds,
as in prior literature (Schneider et al. 2012), a striking
similarity between the La Niña T2m and the SAM T2m
signals. In the interest of exploring the signal without the
SAM, the regression of the SAM has been removed
from the T2m during austral summers of both El Niñoand La Niña events. The December–February (DJF)
period was chosen as this is the period that shows a
strong trend toward positive SAM, while other seasons
have a less explicit impact from SAM.
3. Composite analysis and results
To ensure this analysis is not the result of just one
reanalysis product, or spurious trends within a single prod-
uct, comparison between multiple products is performed
(not shown). While only the ERA-Interim is shown, the
other reanalysis products analyzed all agree on the findings
this work discusses, despite covering shorter periods of time
or being from earlier generations of reanalyses. Further,
more effort goes into discussing the impacts of La Niñaevents asmany of the impacts of El Niño have already beencategorized in previous literature (Fogt et al. 2011; Turner
2004; Fogt and Bromwich 2006, Clem and Fogt 2013) as
they impact the ABS region. This region, while of great
importance when discussing ENSO teleconnections in
Antarctica, is not the only area of interest. All areas dis-
cussed achieve a confidence interval of 0.95 unless otherwise
indicated. As it is of general importance to still compare El
Niño and La Niña, the following figures show both El
Niño [panels (a)–(d)] and La Niña events [panels (e)–(h)].
a. El Niño
El Niño events generally account for approximately
31% of the SST conditions, and there have been nine
events during 1979–2014 (Table 1). Prior work indicates
an expected ABS higher pressure area (Turner 2004).
Of primary interest in this work is the seasonality of the
signal seen in the ABS region. Seasonality of ENSO
events has been explored in Schneider et al. (2012),
finding limited interactions in the Antarctic Peninsula
during DJF with a peak during September–November
(SON). Schneider et al. (2012) explored ENSO with
techniques predominantly focused on both phases of
ENSO, which may explain some of the disparities with
this work.
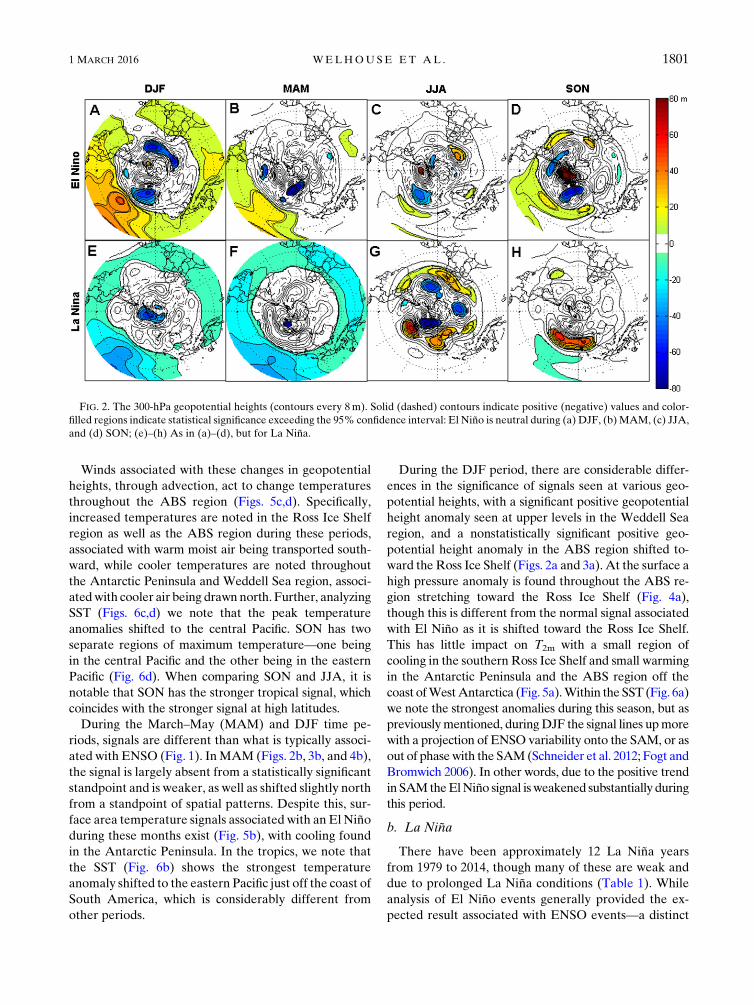
When analyzing the 300- and 500-hPa geopotential
height fields (Figs. 2 and 3) along with the SLP (Fig. 4)
we find an expected barotropic atmosphere during June–
August (JJA) (Figs. 2c, 3c, and 4c) and SON (Figs. 2d, 3d,
and 4d) as well as the strongest impact throughout the
ABS region. This lines up well with prior literature
(Schneider et al. 2012; Jin and Kirtman 2009; Jin and
Kirtman 2010). This signal takes the form of a positive
geopotential height anomaly in the ABS region. A neg-
ative geopotential height anomaly throughout the Wed-
dell Sea region also appears in JJA at upper levels
(Figs. 2c and 3c), whereas a positive anomaly is found
throughout the ABS region and the Weddell Sea region
during DJF (Figs. 2a and 3a). This DJF signal is partic-
ularly different than all other periods for El Niño events.
This is due to a change in the underlying mechanisms of
the teleconnection (Schneider et al. 2012; L’Heureux and
Thompson 2006). Schneider et al. (2012) found that
during DJF periods, the ENSO teleconnection related
to a projection of ENSO variability onto the SAM could
explain this departure, as the variability of SAM during
this period could significantly impact the teleconnection
within the area (Fogt et al. 2011).
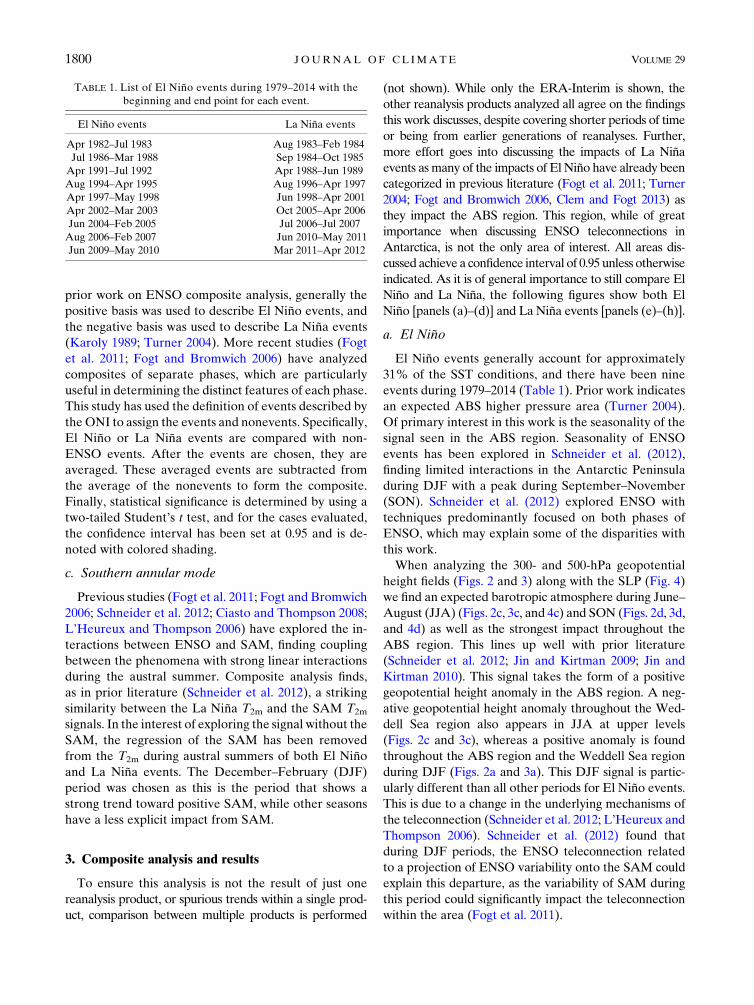
TABLE 1. List of El Niño events during 1979–2014 with the
beginning and end point for each event.
El Niño events La Niña events
Apr 1982–Jul 1983 Aug 1983–Feb 1984
Jul 1986–Mar 1988 Sep 1984–Oct 1985
Apr 1991–Jul 1992 Apr 1988–Jun 1989
Aug 1994–Apr 1995 Aug 1996–Apr 1997
Apr 1997–May 1998 Jun 1998–Apr 2001
Apr 2002–Mar 2003 Oct 2005–Apr 2006
Jun 2004–Feb 2005 Jul 2006–Jul 2007
Aug 2006–Feb 2007 Jun 2010–May 2011
Jun 2009–May 2010 Mar 2011–Apr 2012
1800 JOURNAL OF CL IMATE VOLUME 29
Winds associated with these changes in geopotential
heights, through advection, act to change temperatures
throughout the ABS region (Figs. 5c,d). Specifically,
increased temperatures are noted in the Ross Ice Shelf
region as well as the ABS region during these periods,
associated with warm moist air being transported south-
ward, while cooler temperatures are noted throughout
the Antarctic Peninsula and Weddell Sea region, associ-
atedwith cooler air being drawn north. Further, analyzing
SST (Figs. 6c,d) we note that the peak temperature
anomalies shifted to the central Pacific. SON has two
separate regions of maximum temperature—one being
in the central Pacific and the other being in the eastern
Pacific (Fig. 6d). When comparing SON and JJA, it is
notable that SON has the stronger tropical signal, which
coincides with the stronger signal at high latitudes.
During the March–May (MAM) and DJF time pe-
riods, signals are different than what is typically associ-
ated with ENSO (Fig. 1). InMAM (Figs. 2b, 3b, and 4b),
the signal is largely absent from a statistically significant
standpoint and is weaker, as well as shifted slightly north
from a standpoint of spatial patterns. Despite this, sur-
face area temperature signals associated with an El Niñoduring these months exist (Fig. 5b), with cooling found
in the Antarctic Peninsula. In the tropics, we note that
the SST (Fig. 6b) shows the strongest temperature
anomaly shifted to the eastern Pacific just off the coast of
South America, which is considerably different from
other periods.
During the DJF period, there are considerable differ-
ences in the significance of signals seen at various geo-
potential heights, with a significant positive geopotential
height anomaly seen at upper levels in the Weddell Sea
region, and a nonstatistically significant positive geo-
potential height anomaly in the ABS region shifted to-
ward the Ross Ice Shelf (Figs. 2a and 3a). At the surface a
high pressure anomaly is found throughout the ABS re-
gion stretching toward the Ross Ice Shelf (Fig. 4a),
though this is different from the normal signal associated
with El Niño as it is shifted toward the Ross Ice Shelf.
This has little impact on T2m with a small region of
cooling in the southern Ross Ice Shelf and small warming
in the Antarctic Peninsula and the ABS region off the
coast ofWestAntarctica (Fig. 5a).Within the SST (Fig. 6a)
we note the strongest anomalies during this season, but as
previouslymentioned, duringDJF the signal lines upmore
with a projection of ENSO variability onto the SAM, or as
out of phasewith the SAM(Schneider et al. 2012; Fogt and
Bromwich 2006). In other words, due to the positive trend
in SAMtheElNiño signal isweakened substantially duringthis period.
b. La Niña
There have been approximately 12 La Niña years
from 1979 to 2014, though many of these are weak and
due to prolonged La Niña conditions (Table 1). While
analysis of El Niño events generally provided the ex-
pected result associated with ENSO events—a distinct
FIG. 2. The 300-hPa geopotential heights (contours every 8m). Solid (dashed) contours indicate positive (negative) values and color-
filled regions indicate statistical significance exceeding the 95% confidence interval: El Niño is neutral during (a) DJF, (b) MAM, (c) JJA,
and (d) SON; (e)–(h) As in (a)–(d), but for La Niña.
1 MARCH 2016 WELHOUSE ET AL . 1801
signal in the ABS region (Turner 2004) or no distinct
signal—analysis of La Niña events provides a quite
different picture. A more symmetric view of ENSO
signals would indicate similar areas of effect with op-
posing signals, so El Niño having a distinct positive
geopotential height anomaly in the ABS region would
require La Niña to have a negative geopotential height
anomaly in the same region. While this signal is found
in some seasons, it is shifted toward the Ross Ice Shelf
region and additional signals are found in other regions.
The La Niña signal of a negative geopotential height
anomaly (Figs. 2 and 3), low pressure anomalies (Fig. 4),
and T2m (Fig. 5) anomalies associated with advection, in
the ABS region is readily apparent throughout the
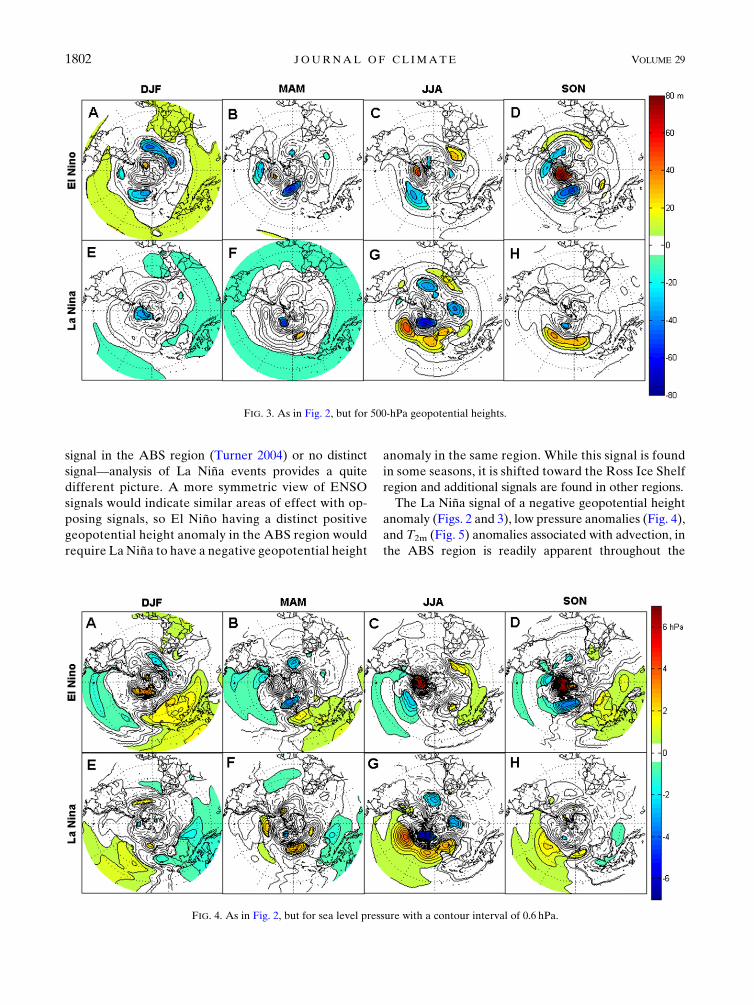
FIG. 3. As in Fig. 2, but for 500-hPa geopotential heights.
FIG. 4. As in Fig. 2, but for sea level pressure with a contour interval of 0.6 hPa.
1802 JOURNAL OF CL IMATE VOLUME 29
seasons, with variations primarily seen in the strength of
the signal and how far south it extends. The expected
signal consists of negative geopotential height anom-
alies in the Ross Sea and ABS regions, with warming
seen in the Antarctic Peninsula and cooling of the Ross
Sea. While this is seen in all of the seasons, the signal is
shifted toward the Ross Ice Shelf in all seasons at upper
levels (Figs. 2 and 3). Also notably, during DJF (Figs. 2e
and 3e),MAM (Figs. 2f and 3f), and JJA (Figs. 2g and 3g)
the upper-level negative geopotential height anomalies
stretch into East Antarctica, though this is only statisti-
cally significant during DJF. The months with the most
prominent signal for the El Niño were shown to be JJA
and SON, while for La Niña the seasons with the most
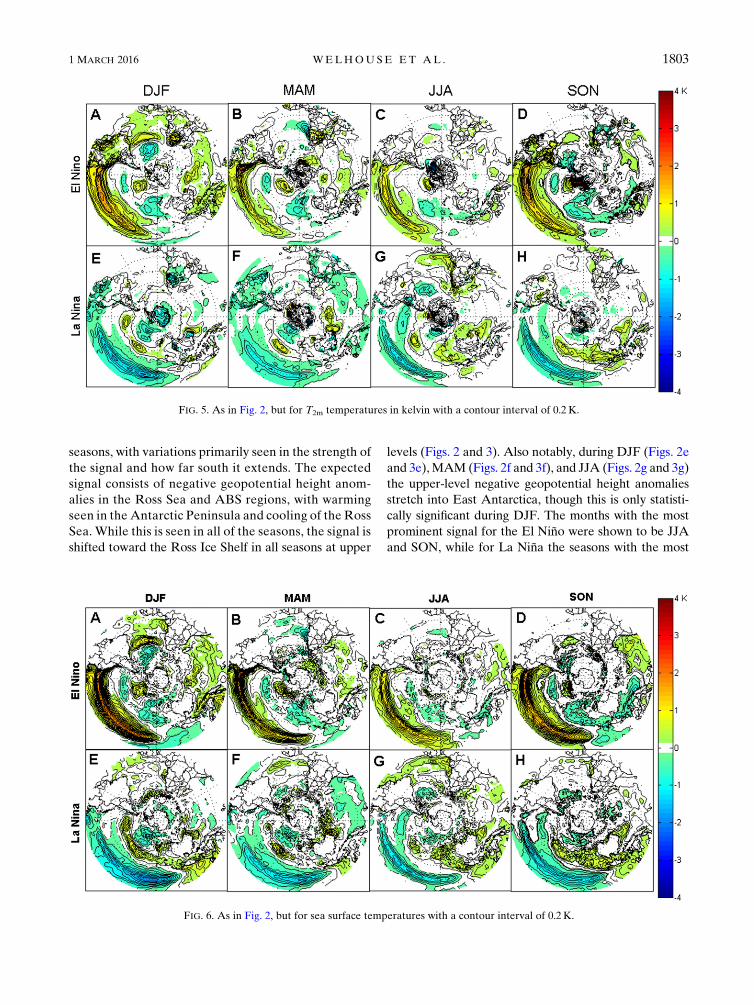
FIG. 5. As in Fig. 2, but for T2m temperatures in kelvin with a contour interval of 0.2 K.
FIG. 6. As in Fig. 2, but for sea surface temperatures with a contour interval of 0.2K.
1 MARCH 2016 WELHOUSE ET AL . 1803
prominent signal are JJA and DJF. For La Niña events,
the SON signal is considerably weaker and shifted north
away from Antarctica (Figs. 2g and 3g). This results in
considerably different temperature patterns with no im-
pact in the peninsula, and warming found in the northern
portion of the Ross Ice Shelf (Fig. 5g). MAM is relatively
weak for both phases though La Niña shows a more ro-
bust signal than El Niño during this season. This may be
due to asymmetries in the duration of events (Okumura
and Deser 2010). Considerable variations of these tele-
connections exist throughout the atmosphere depending
largely on seasonality. Because of the relatively baro-
tropic nature of the high southern latitude atmosphere, all
levels show approximately the same patterns in geo-
potential height and pressure anomalies, though signifi-
cance varies a great deal. Despite the comparatively small
signal duringMAMand SON, there are consistent signals
at each layer examined that line up with the patterns as-
sociated with ENSO signals, slightly shifted toward the
Ross Ice Shelf (Figs. 2f,g; 3f,g; and 4f,g).
Despite the lack of statistically significant SLP anoma-
lies during DJF, the T2m anomalies (Fig. 5e) are the widest
spread during these months, with cooling in West Ant-
arctica and the adjacent ocean regions, and warming in the
Antarctic Peninsula. The cooling in West Antarctica, and
warming in the peninsula is expected due to advection
associated with statistically significant geopotential height
changes seen throughout the upper atmosphere (Figs. 2e
and 3e) as well as pressure field changes seen at the surface
(Fig. 4e). Also, extensive cooling is seen throughout East
Antarctica, and in previous literature (Schneider et al. 2012;
Ciasto and Thompson 2008; L’Heureux and Thompson
2006) this has been linked to a coupling of SAMandENSO,
with La Niña being in phase with positive SAM. Given the
trend toward positive values of SAM, particularly in sum-
mer (Marshall 2003) and the interaction between positive
SAM and La Niña events, the teleconnection signal is am-
plified during this season. The presence of temperature
signals throughout East Antarctica, and specifically in
coastal Wilkes Land, during most seasons (Figs. 5e–g)
indicates a connection with ENSO. The small region of
cooling in Wilkes Land seems directly attributable to
ENSO, as it persists through multiple seasons, while the
cooling seen throughout the rest of East Antarctica in DJF
(Fig. 5e) is likely due SAM, and particularly visible due to
the trend toward positive amplifying the cold anomalies.
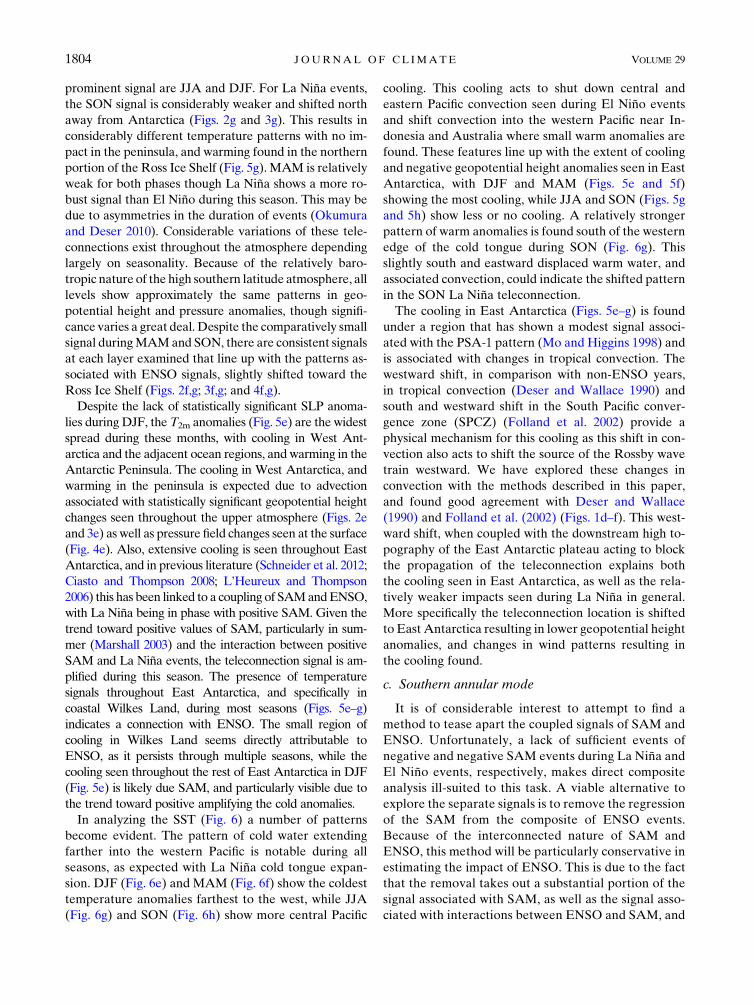
In analyzing the SST (Fig. 6) a number of patterns
become evident. The pattern of cold water extending
farther into the western Pacific is notable during all
seasons, as expected with La Niña cold tongue expan-
sion. DJF (Fig. 6e) and MAM (Fig. 6f) show the coldest
temperature anomalies farthest to the west, while JJA
(Fig. 6g) and SON (Fig. 6h) show more central Pacific
cooling. This cooling acts to shut down central and
eastern Pacific convection seen during El Niño events
and shift convection into the western Pacific near In-
donesia and Australia where small warm anomalies are
found. These features line up with the extent of cooling
and negative geopotential height anomalies seen in East
Antarctica, with DJF and MAM (Figs. 5e and 5f)
showing the most cooling, while JJA and SON (Figs. 5g
and 5h) show less or no cooling. A relatively stronger
pattern of warm anomalies is found south of the western
edge of the cold tongue during SON (Fig. 6g). This
slightly south and eastward displaced warm water, and
associated convection, could indicate the shifted pattern
in the SON La Niña teleconnection.
The cooling in East Antarctica (Figs. 5e–g) is found
under a region that has shown a modest signal associ-
ated with the PSA-1 pattern (Mo and Higgins 1998) and
is associated with changes in tropical convection. The
westward shift, in comparison with non-ENSO years,
in tropical convection (Deser and Wallace 1990) and
south and westward shift in the South Pacific conver-
gence zone (SPCZ) (Folland et al. 2002) provide a
physical mechanism for this cooling as this shift in con-
vection also acts to shift the source of the Rossby wave
train westward. We have explored these changes in
convection with the methods described in this paper,
and found good agreement with Deser and Wallace
(1990) and Folland et al. (2002) (Figs. 1d–f). This west-
ward shift, when coupled with the downstream high to-
pography of the East Antarctic plateau acting to block
the propagation of the teleconnection explains both
the cooling seen in East Antarctica, as well as the rela-
tively weaker impacts seen during La Niña in general.
More specifically the teleconnection location is shifted
to East Antarctica resulting in lower geopotential height
anomalies, and changes in wind patterns resulting in
the cooling found.
c. Southern annular mode
It is of considerable interest to attempt to find a
method to tease apart the coupled signals of SAM and
ENSO. Unfortunately, a lack of sufficient events of
negative and negative SAM events during La Niña andEl Niño events, respectively, makes direct composite
analysis ill-suited to this task. A viable alternative to
explore the separate signals is to remove the regression
of the SAM from the composite of ENSO events.
Because of the interconnected nature of SAM and
ENSO, this method will be particularly conservative in
estimating the impact of ENSO. This is due to the fact
that the removal takes out a substantial portion of the
signal associated with SAM, as well as the signal asso-
ciated with interactions between ENSO and SAM, and
1804 JOURNAL OF CL IMATE VOLUME 29

the variability of ENSO captured within the SAM in-
dex. During DJF, there is strong interaction between
ENSO and SAM signals causing a significant change in
the patterns seen as shown throughout this paper as
well as in prior literature (Schneider et al. 2012; Fogt
et al. 2011). Given this, it is likely that a portion of the
ENSO signal is removed with this technique. Despite
all these caveats, this provides a somewhat useful per-
spective of what La Niña and El Niñomight look like in
the absence of trends in SAM.
During La Niña the remaining statistically significant
signal consists of a small region of negative temperature
anomaly along the East Antarctic coastal region, as well
as negative temperature anomalies throughout the Ross
Sea and ABS regions, a slight warming of the Antarctic
Peninsula, and a small region of cooling within the East
Antarctic plateau (Fig. 7e). The placement of the East
Antarctic temperature anomaly is similar to the anom-
alies seen in other seasons (MAMand JJA) (Figs. 5f and
5g). The temperature signals throughout the Ross Sea
and ABS region remain as these regions are not asso-
ciated with SAM, and would be associated with advec-
tion caused by a negative geopotential height anomaly in
the Ross Sea and ABS regions. The cooling in East Ant-
arctica lines up with a westward shift in teleconnections as
discussed earlier.
FIG. 7. A comparison of La Niña and El Niño composites of 2-m temperature before and
after the removal of SAM regression with a contour interval of 0.2K: (a),(b) El Niño and La
Niña are neutral during DJF, respectively; (c) SAM regressed onto T2m field with values being
the response in kelvin per SAM index. (d),(e) El Niño and La Niña 2-m temperature after the
SAM regression have been removed, respectively. In (a)–(d), color-filled regions indicate
statistical significance exceeding the 95% confidence interval.
1 MARCH 2016 WELHOUSE ET AL . 1805
During El Niño (Fig. 7d) the relatively small regions of
statistically significant warming seen in the Antarctic
Peninsula have expanded, as has the cooling seen in the
Ross Ice Shelf, with some shift into East Antarctica. This
signal so far afield from the usual region of West Antarc-
tica, and the Antarctic Peninsula is a bit unexpected, but is
not unrealistic given the significantly abnormal upper-level
patterns seen during DJF in El Niño events (Figs. 2a and
3a). This expansion of temperature signals makes sense,
as positive SAM is expected to weaken the El Niñoteleconnection (Fogt et al. 2011), though the location of
the anomalies remains abnormal when compared with
other seasons of El Niño. Further exploration into the
dynamics of El Niño teleconnections during this season is
an area of growing study, which is unfortunately outside
the capabilities of the techniques usedwithin this analysis.
4. Discussion
In earlier ENSO studies, composite analyses were per-
formed using El Niño 2 La Niña (e.g., Mo and Higgins
1998; Turner 2004). This technique emphasizes regions of
common but opposite effect allowing for statistical sig-
nificance to more easily be achieved within these regions.
At the same time it discounts asymmetries in the form of
common regions of similar effect as seen during DJF
warming in the peninsula during both phases (Figs. 5a and
5e), regions that see effects in one phase of ENSO events
only as seen in the East Antarctic cooling during La Niñaevents (Figs. 5e–g), and makes differences in timing be-
tween the two phases difficult to determine. By separating
the composites to view El Niño and La Niña as distinct
events, these features become evident.
The general signal associated with ENSO tele-
connections within the Antarctic seems to be primarily
associated with El Niño events, and some seasons during
La Niña events. Further, the El Niño aspect of the signal
is shifted toward the Antarctic Peninsula, while La Niñaevents are shifted toward theRoss Ice Shelf, and in some
seasons seems to be split by the Transantarctic Moun-
tains showing clear signals within EastAntarctica as well
as signals within the ABS region though shifted toward
the Ross Ice Shelf. This ENSO signal has been shown to
have a demonstrable effect on Antarctic T2m and mean
sea level pressures. More specifically, during El Niñoevents, it generally acts to warm West Antarctica and
cool the Antarctic Peninsula.
There is also a clear signal associated with La Niñaevents during DJF and JJA. Both of these seasons are
characterized, at upper levels, by negative geopotential
height anomalies that stretch toward the Transantarctic
Mountains, and during DJF the signal seems to be split by
this terrain feature as well as having a far more poleward
signal. Fogt and Bromwich (2006) indicate that a strong
coupling exists between the SAM and ENSO such
that a positive (negative) SAM indicates a stronger LaNiña(ElNiño) signal seenat high latitudes.As theSAMhasbeen
trending positive most strongly in austral summer, there
is a prominent reason to expect a more robust signal
during DJF for La Niña and a weaker signal for El Niño(Marshall 2003).
An initial goal of this analysis was to determine what
signal, if any, associated with the specific phases of
ENSO events could be found at the surface in Antarc-
tica, and it has led to a number of general findings.
During this time period, El Niño events can be catego-
rized as having an effect shifted toward the Antarctic
Peninsula and Weddell Sea, with some impacts in West
Antarctica and the Ross Ice Shelf. La Niña events can
be categorized as having impacts shifted toward the
Ross Ice Shelf, with impacts in West Antarctica, the
Ross Ice Shelf, and East Antarctica. El Niño generally
has an impact of cooling throughout the peninsula and
adjacent ocean, with inconsistent warming seen in
coastal West Antarctica and the Ross Ice Shelf pre-
dominantly during SON. These features make sense
from a physical standpoint as shifts in the regions of
convection depends on both seasonality, as well as phase
of ENSO, with El Niño events shifting convection
eastward and the SPCZ shifted north and east, and La
Niña events shifting convection westward with the
SPCZ shifted south and west.
Prior to this study, La Niña events were expected to
affect similar regions as El Niño events, but this analysis
shows that East Antarctica experiences large-scale
cooling during La Niña events, which has been linked
to interactions with SAM. Further exploration of this
East Antarctic cooling indicates a small portion is less
dependent on interactions with SAM, and is a region
associated with PSA-1 pattern teleconnections associ-
ated with shifts in convection largely associated with
ENSO. This East Antarctic signal is predominantly as-
sociated with La Niña events. While signals within this
region have existed in prior literature they have often
gone undiscussed, or are not linked to La Niña. Theyare potentially associated with warm water being more
concentrated near Indonesia during La Niña events,
modulating ascending air and inciting Rossby waves
as discussed by Lachlan-Cope and Connolley (2006),
though more analysis is necessary to confirm this. Fur-
ther, there are strong seasonal aspects to the tempera-
ture impacts throughout West Antarctica with regions
near the peninsula experiencing warming during JJA,
and other regions experiencing cooling during DJF,
with these inconsistent patterns being undetectable in
analysis of annually averaged teleconnection patterns.
1806 JOURNAL OF CL IMATE VOLUME 29
5. Conclusions
Composite analysis has been shown to be an effective
means of analyzing ENSO effects at high latitudes, and
the new method of using nonevents as one portion of
the comparison allows for differences between differ-
ent phases of ENSO, El Niño, and La Niña to be dis-
tinguished. It must still be acknowledged that a
relatively few number of events have been analyzed
due to the quality of reanalysis data for the Southern
Hemisphere prior to 1979 being in question (Bromwich
and Fogt 2004). Despite the small number of events,
a number of conclusions can be drawn from the com-
posite analyses performed. As expected, the ABS
region remains the primary location of strong tele-
connections, with El Niño generally indicating a posi-
tive geopotential height anomaly extending toward the
Antarctic Peninsula and La Niña indicating a negative
geopotential height anomaly extending toward the
Ross Ice Shelf. There also seems to be greater seasonal
variance in the signal during La Niña events than El
Niño events. This is indicated by the consistent late
austral summer effect in East Antarctica seen both
in the surface area temperatures, as well as throughout
the upper atmosphere. This East Antarctica signal
warrants further exploration for mechanisms of changes
in the location of teleconnections, as it has largely
been viewed as an interaction of ENSO and SAM, which
may not fully explain the interactions. The seasonality
of both phases of ENSO, particularly the breakdown of
the signal during peakENSOmonths also warrants further
exploration as prior studies indicate that a lack of a sig-
nal in the Antarctic Peninsula during DJF is
paradoxical (Schneider et al. 2012), but based on this
analysis it seemsbothphases are having a similar impact on
warming.
Acknowledgments. This material is based upon work
supported by the National Science Foundation Grants
ANT-1245663,ANT- 0944018, andAGS-1256215.ECMWF
ERA-40 and ERA-Interim data used in this study have
been obtained from the ECMWF data server. The CFSR
and NCEP–NCAR reanalysis data were developed by
NOAA’s National Centers for Environmental Prediction
(NCEP). The data for this study are from the Research
Data Archive (RDA), which is maintained by the
Computational and Information Systems Laboratory
(CISL) at theNational Center for Atmospheric Research
(NCAR). The National Center for Atmospheric Research
is sponsored by the National Science Foundation. The
original data are available from the RDA (http://rda.ucar.
edu) in dataset number ds093.2.UninterpolatedOLRdata
were provided by the NOAA/OAR/ESRL PSD, Boulder,
Colorado, from their web site at http://www.esrl.noaa.gov/
psd/. The authors thank Dan Vimont of the Atmospheric
and Oceanic Sciences Department at the University of
Wisconsin–Madison, and Ryan Fogt of the Department of
Geography at The Ohio State University, for their assis-
tance in methods for analyzing interactions between
ENSO and SAM. The authors would also like to thank
David Bromwich of The Ohio State University for orga-
nizing this special issue, as well as the editor and reviewers
for their comments that resulted in a greatly improved paper.
REFERENCES
Bracegirdle, T. J., and G. J. Marshall, 2012: The reliability of
Antarctic tropospheric pressure and temperature in the latest
global reanalyses. J. Climate, 25, 7138–7146, doi:10.1175/
JCLI-D-11-00685.1.
Bromwich, D. H., and R. L. Fogt, 2004: Strong trends in the skill of
the ERA-40 and NCEP–NCAR reanalysis in the high and
middle latitudes of the Southern Hemisphere, 1958–2001.
J. Climate, 17, 4603–4619, doi:10.1175/3241.1.
Ciasto, L. M., and D. W. J. Thompson, 2008: Observations of
large-scale ocean atmosphere interaction in the Southern
Hemisphere. J. Climate, 21, 1244–1259, doi:10.1175/
2007JCLI1809.1.
Clem, K. R., and R. L. Fogt, 2013: Varying roles of ENSO and SAM
on theAntarctic Peninsula climate in austral spring. J.Geophys.
Res. Atmos., 118, 11 481–11 492, doi:10.1002/jgrd.50860.Dee, D. P., and Coauthors, 2011: The ERA-Interim reanalysis:
Configuration and performance of the data assimilation sys-
tem. Quart. J. Roy. Meteor. Soc., 137, 553–597, doi:10.1002/
qj.828.
Deser, C., and J. Wallace, 1990: Large-scale atmospheric circulation
features of warm and cold episodes in the tropical Pacific.
J. Climate, 3, 1254–1281, doi:10.1175/1520-0442(1990)003,1254:
LSACFO.2.0.CO;2.
Diaz, H. F., and V. Markgraf, 1992: El Niño: Historical and Pale-
oclimatic Aspects of the Southern Oscillation. Cambridge
University Press, 476 pp.
Fogt, R. L., and D. H. Bromwich, 2006: Decadal variability of the
ENSO teleconnection to the high-latitude South Pacific gov-
erned by coupling with the southern annular mode. J. Climate,
19, 979–997, doi:10.1175/JCLI3671.1.
——, ——, and K. M. Hines, 2011: Understanding the SAM influ-
ence on the South Pacific ENSO teleconnection. Climate Dyn.,
36, 1555–1576, doi:10.1007/s00382-010-0905-0.
Folland, C. K., J. A. Renwick, M. J. Salinger, and A. B. Mullan,
2002: Relative influences of the Interdecadal Pacific Oscillation
and ENSO on the South Pacific Convergence Zone. Geophys.
Res. Lett., 29, doi:10.1029/2001GL014201.
Frauen, C., D. Dommenget, N. Tyrrell, M. Rezny, and S. Wales,
2014: Analysis of the nonlinearity of El Niño–Southern Os-
cillation teleconnections. J. Climate, 27, 6225–6244,
doi:10.1175/JCLI-D-13-00757.1.
Harangozo, S. A., 2000: A search for ENSO teleconnections in the
west Antarctic Peninsula climate in Austral winter. Int.
J. Climatol., 20, 663–679, doi:10.1002/(SICI)1097-0088(200005)20:
6,663::AID-JOC493.3.0.CO;2-I.
Held, I. M., S. W. Lyons, and S. Nigam, 1989: Transients and the
extratropical response to El Niño. J. Atmos. Sci., 46, 163–174,
doi:10.1175/1520-0469(1989)046,0163:TATERT.2.0.CO;2.
1 MARCH 2016 WELHOUSE ET AL . 1807
Hoskins, B. J., and D. J. Karoly, 1981: The steady linear
response of a spherical atmosphere to thermal and oro-
graphic forcing. J. Atmos. Sci., 38, 1179–1196, doi:10.1175/
1520-0469(1981)038,1179:TSLROA.2.0.CO;2.
Houseago-Stokes, R. E., and G. R. McGregor, 2000: Spatial
and temporal patterns linking southern low and high lati-
tudes during South Pacific warm and cold events. Int.
J. Climatol., 20, 793–801, doi:10.1002/1097-0088(20000615)20:7,793::AID-JOC502.3.0.CO;2-9.
Itterly, K. F., and P. C. Taylor, 2014: Evaluation of the tropical
TOA flux diurnal cycle in MERRA and ERA-Interim retro-
spective analyses. J. Climate, 27, 4781–4796, doi:10.1175/
JCLI-D-13-00737.1.
Jin, D., and B. P. Kirtman, 2009: Why the Southern Hemisphere
ENSO responses lead ENSO. J. Geophys. Res., 114, D23101,
doi:10.1029/2009JD012657.
——, and——, 2010:How the annual cycle affects the extratropical
response to ENSO. J. Geophys. Res., 115, D06102, doi:10.1029/
2009JD012660.
Jones, P. D., and D. H. Lister, 2015: Antarctic near-surface air
temperatures compared with ERA-Interim values since 1979.
Int. J. Climatol., 35, 1354–1366, doi:10.1002/joc.4061.
Karoly, D. J., 1989: Southern Hemisphere circulation features
associatedwithElNiño–SouthernOscillation events. J.Climate,
2, 1239–1252, doi:10.1175/1520-0442(1989)002,1239:
SHCFAW.2.0.CO;2.
Lachlan-Cope, T., and W. Connolley, 2006: Teleconnections be-
tween the tropical Pacific and the Amundsen–Bellinghausens
Sea: Role of the El Niño/Southern Oscillation. J. Geophys.
Res., 111, D23101, doi:10.1029/2005JD006386.
Lazzara, M. A., G. A. Weidner, L. M. Keller, J. E. Thom, and J. J.
Cassano, 2012: Antarctic Automatic Weather Station Pro-
gram: 30 years of polar observations.Bull. Amer.Meteor. Soc.,
93, 1519–1537, doi:10.1175/BAMS-D-11-00015.1.
L’Heureux, M. L., and D. W. J. Thompson, 2006: Observed re-
lationships between the El Niño/Southern Oscillation and the
extratropical zonal-mean circulation. J. Climate, 19, 276–287,doi:10.1175/JCLI3617.1.
Li, X., E. P. Gerber, D. M. Holland, and C. Yoo, 2015: A Rossby
wave bridge from the tropical Atlantic to West Antarctica.
J. Climate, 28, 2256–2273, doi:10.1175/JCLI-D-14-00450.1.
Marshall, G. J., 2003: Trends in the Southern Annular Mode from
observations and reanalysis. J. Climate, 16, 4134–4143,
doi:10.1175/1520-0442(2003)016,4134:TITSAM.2.0.CO;2.
Mo, K. C., and G. H.White, 1985: Teleconnections in the Southern
Hemisphere. Mon. Wea. Rev., 113, 22–37, doi:10.1175/
1520-0493(1985)113,0022:TITSH.2.0.CO;2.
——, and W. Higgins, 1998: The Pacific–South American modes
and tropical convection during the Southern Hemisphere
winter. Mon. Wea. Rev., 126, 1581–1596, doi:10.1175/
1520-0493(1998)126,1581:TPSAMA.2.0.CO;2.
NOAA/Climate Prediction Center, 2015: Oceanic Niño Index
ERSST.v4b.NOAA/National Climatic Data Center, Subset
used: January 1979–December 2013, accessed January 2015.
[Available online at http://www.cpc.ncep.noaa.gov/products/
analysis_monitoring/ensostuff/ensoyears_ERSSTv3b.shtml.]
Okumura,Y.M., andC.Deser, 2010: Asymmetry in the duration of
El Niño and La Niña. J. Climate, 23, 5826–5843, doi:10.1175/
2010JCLI3592.1.
Philander, S. G., and E. M. Rasmusson, 1985: The southern oscil-
lation and El Niño. Advances in Geophysics, Vol. 28, Aca-
demic Press, 197–215, doi:10.1016/S0065-2687(08)60224-1.
Schneider, D. P., Y. Okumura, and C. Deser, 2012: Observed
Antarctic interannual climate variability and tropical linkages.
J. Climate, 25, 4048–4066, doi:10.1175/JCLI-D-11-00273.1.
Trenberth,K.E., 1975a:Aquasi-biennial standingwave in the Southern
Hemisphere and interrelations with sea surface temperature.
Quart. J.Roy.Meteor. Soc.,101, 55–74, doi:10.1002/qj.49710142706.
——, 1975b: Reply to comment on ‘A quasi-biennial standing wave
in the Southern Hemisphere and interrelations with sea sur-
face temperature’ by K. E. Trenberth. Quart. J. Roy. Meteor.
Soc., 101, 174–176.
——, 1976: Spatial and temporal variations of the southern oscil-
lation. Quart. J. Roy. Meteor. Soc., 102, 639–653, doi:10.1002/qj.49710243310.
——, 1997: The definition of El Niño. Bull. Amer. Meteor. Soc.,
78, 2771–2777, doi:10.1175/1520-0477(1997)078,2771:
TDOENO.2.0.CO;2.
Turner, J., 2004: The El Niño–SouthernOscillation andAntarctica.
Int. J. Climatol., 24, 1–31, doi:10.1002/joc.965.
Wilson, A. B., D. H. Bromwich, K. M. Hines, and S. Wang, 2014:
El Niño flavors and their simulated impacts on atmospheric
circulation in the high southern latitudes. J. Climate, 27,
8934–8955, doi:10.1175/JCLI-D-14-00296.1.
Yu, L., Z. Zhang, M. Zhou, S. Zhong, D. Lenschow, H. Hsu,
H. Wu, and B. Sun, 2010: Validation of ECMWF and NCEP-
NCAR Reanalysis Data in Antarctica. Adv. Atmos. Sci., 27,
1151–1168, doi:10.1007/s00376-010-9140-1.
1808 JOURNAL OF CL IMATE VOLUME 29