comportamiento ciclico.pdf
DESCRIPTION
comportamiento cíclico de estructurasTRANSCRIPT
Journal of Constructional Steel Research 59 (2003) 1–25www.elsevier.com/locate/jcsr
Cyclic behavior of steel moment frameconnections under varying axial load and lateral
displacements
J.A. Zepedaa, A.M. Itani a,∗, R. Sahaib
a Department of Civil Engineering/258, University of Nevada–Reno, Reno, NV 89557-0152, USAb Structural Design Engineers, Inc., San Francisco, CA 95285, USA
Received 15 December 2001; received in revised form 11 March 2002; accepted 18 March 2002
Abstract
This paper discusses the cyclic behavior of four steel moment connections tested undervariable axial load and lateral displacements. The beam specimens consisted of a reduced-beam section, wing plates and longitudinal stiffeners. The test specimens were subjected tovarying axial forces and lateral displacements to simulate the effects on beams in a Coupled-Girder Moment-Resisting Framing system under lateral loading. The test results showed thatthe specimens responded in a ductile manner since the plastic rotations exceeded 0.03 radwithout significant drop in the lateral capacity. The presence of the longitudinal stiffenerassisted in transferring the axial forces and delayed the formation of web local buckling. 2002 Elsevier Science Ltd. All rights reserved.
Keywords: Steel moment connections; Reduced-beam sections; Wing plate; Longitudinal stiffener; Plas-tic rotation
1. Introduction
Aimed at evaluating the structural performance of reduced-beam section (RBS)connections under alternated axial loading and lateral displacement, four full-scalespecimens were tested. These tests were intended to assess the performance of themoment connection design for the Moscone Center Expansion under the Design
∗ Corresponding author. Tel.:+1-775-784-4379; fax:+1-775-784-4466.E-mail address: [email protected] (A.M. Itani).
0143-974X/02/$ - see front matter 2002 Elsevier Science Ltd. All rights reserved.PII: S0143 -974X(02)00028-7
2 J.A. Zepeda et al. / Journal of Constructional Steel Research 59 (2003) 1–25
Basis Earthquake (DBE) and the Maximum Considered Earthquake (MCE). Previousresearch conducted on RBS moment connections [1,2] showed that connections withRBS profiles can achieve rotations in excess of 0.03 rad. However, doubts have beencast on the quality of the seismic performance of these connections under combinedaxial and lateral loading.
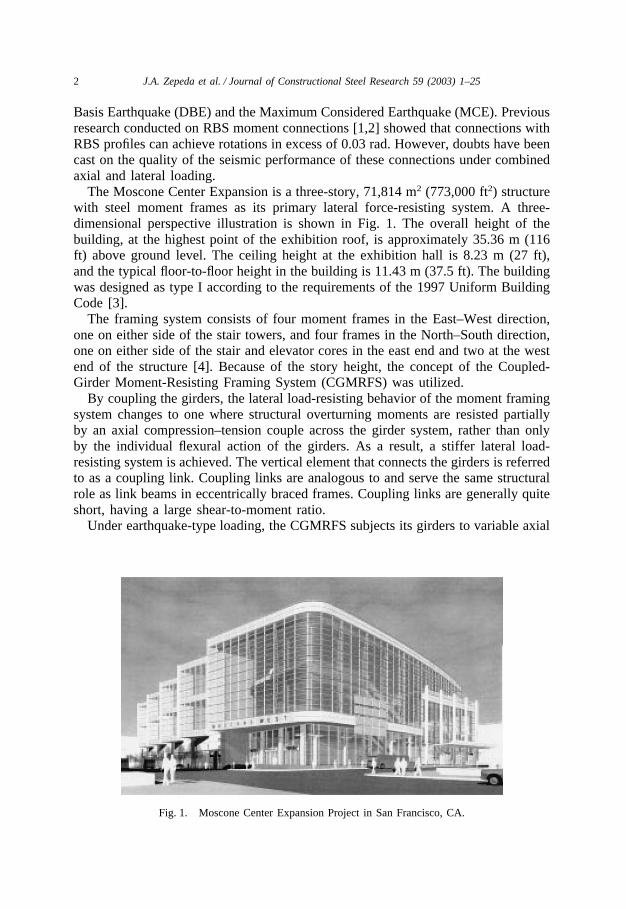
The Moscone Center Expansion is a three-story, 71,814 m2 (773,000 ft2) structurewith steel moment frames as its primary lateral force-resisting system. A three-dimensional perspective illustration is shown in Fig. 1. The overall height of thebuilding, at the highest point of the exhibition roof, is approximately 35.36 m (116ft) above ground level. The ceiling height at the exhibition hall is 8.23 m (27 ft),and the typical floor-to-floor height in the building is 11.43 m (37.5 ft). The buildingwas designed as type I according to the requirements of the 1997 Uniform BuildingCode [3].
The framing system consists of four moment frames in the East–West direction,one on either side of the stair towers, and four frames in the North–South direction,one on either side of the stair and elevator cores in the east end and two at the westend of the structure [4]. Because of the story height, the concept of the Coupled-Girder Moment-Resisting Framing System (CGMRFS) was utilized.
By coupling the girders, the lateral load-resisting behavior of the moment framingsystem changes to one where structural overturning moments are resisted partiallyby an axial compression–tension couple across the girder system, rather than onlyby the individual flexural action of the girders. As a result, a stiffer lateral load-resisting system is achieved. The vertical element that connects the girders is referredto as a coupling link. Coupling links are analogous to and serve the same structuralrole as link beams in eccentrically braced frames. Coupling links are generally quiteshort, having a large shear-to-moment ratio.
Under earthquake-type loading, the CGMRFS subjects its girders to variable axial
Fig. 1. Moscone Center Expansion Project in San Francisco, CA.

3J.A. Zepeda et al. / Journal of Constructional Steel Research 59 (2003) 1–25
forces in addition to their end moments. The axial forces in the girders result fromthe accumulated shear in the link.
2. Analytical model of CGMRF
Nonlinear static pushover analysis was conducted on a typical one-bay model ofthe CGMRF. Fig. 2 shows the dimensions and the various sections of the model.The link flange plates were 28.5 mm × 254 mm (1 1 /8 in × 10 in) and the web platewas 9.5 mm × 476 mm (3/8 in × 18 3/4 in). The SAP 2000 computer program wasutilized in the pushover analysis [5]. The frame was characterized as fully restrained(FR). FR moment frames are those frames for which no more than 5% of the lateraldeflections arise from connection deformation [6]. The 5% value refers only todeflection due to beam–column deformation and not to frame deflections that resultfrom column panel zone deformation [6, 9].
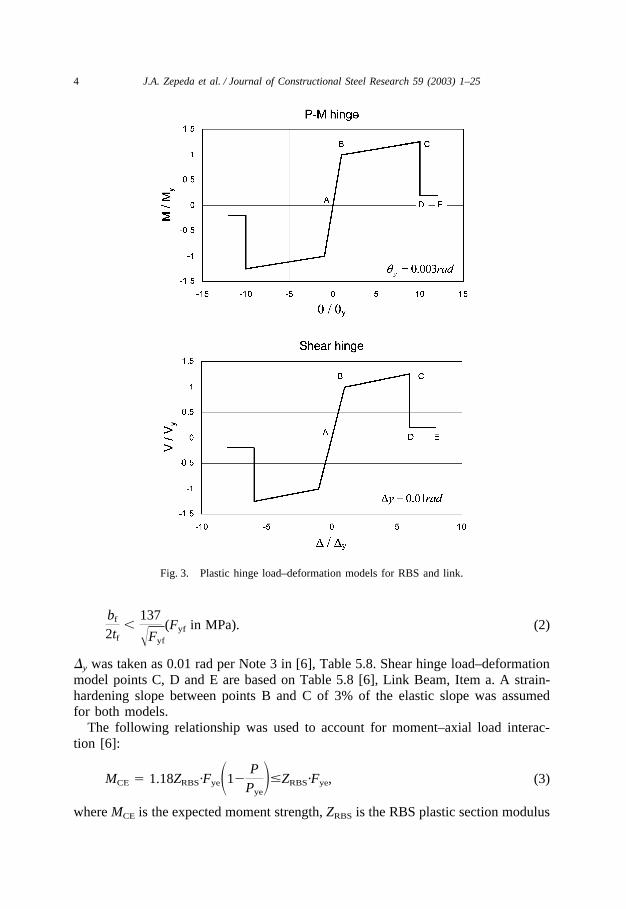
The analysis was performed using an expected value of the yield stress and ulti-mate strength. These values were equal to 372 MPa (54 ksi) and 518 MPa (75 ksi),respectively. The plastic hinges’ load–deformation behavior was approximated bythe generalized curve suggested by NEHRP Guidelines for the Seismic Rehabilitationof Buildings [6] as shown in Fig. 3. �y was calculated based on Eqs. (5.1) and (5.2)from [6], as follows:
qy�z·Fye·lb
6EIb�1�
PPye
� � 0.003 rad. (1)
P–M hinge load–deformation model points C, D and E are based on Table 5.4 from[6] for
Fig. 2. Typical coupled-girder moment-resisting framing system.
4 J.A. Zepeda et al. / Journal of Constructional Steel Research 59 (2003) 1–25
Fig. 3. Plastic hinge load–deformation models for RBS and link.
bf
2tf�
137
�Fyf
(Fyf in MPa). (2)
�y was taken as 0.01 rad per Note 3 in [6], Table 5.8. Shear hinge load–deformationmodel points C, D and E are based on Table 5.8 [6], Link Beam, Item a. A strain-hardening slope between points B and C of 3% of the elastic slope was assumedfor both models.
The following relationship was used to account for moment–axial load interac-tion [6]:
MCE � 1.18ZRBS·Fye�1�P
Pye��ZRBS·Fye, (3)
where MCE is the expected moment strength, ZRBS is the RBS plastic section modulus
5J.A. Zepeda et al. / Journal of Constructional Steel Research 59 (2003) 1–25
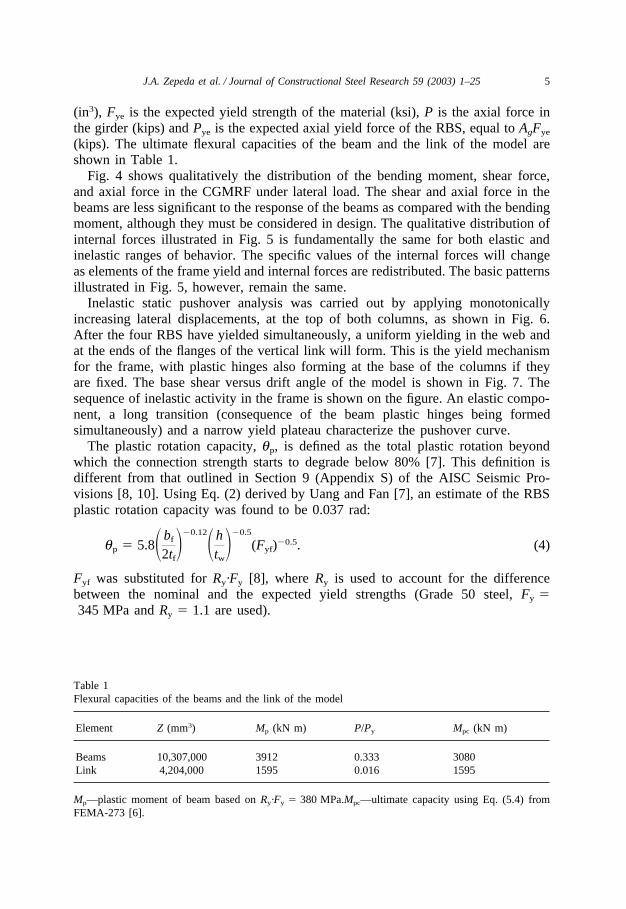
(in3), Fye is the expected yield strength of the material (ksi), P is the axial force inthe girder (kips) and Pye is the expected axial yield force of the RBS, equal to AgFye
(kips). The ultimate flexural capacities of the beam and the link of the model areshown in Table 1.
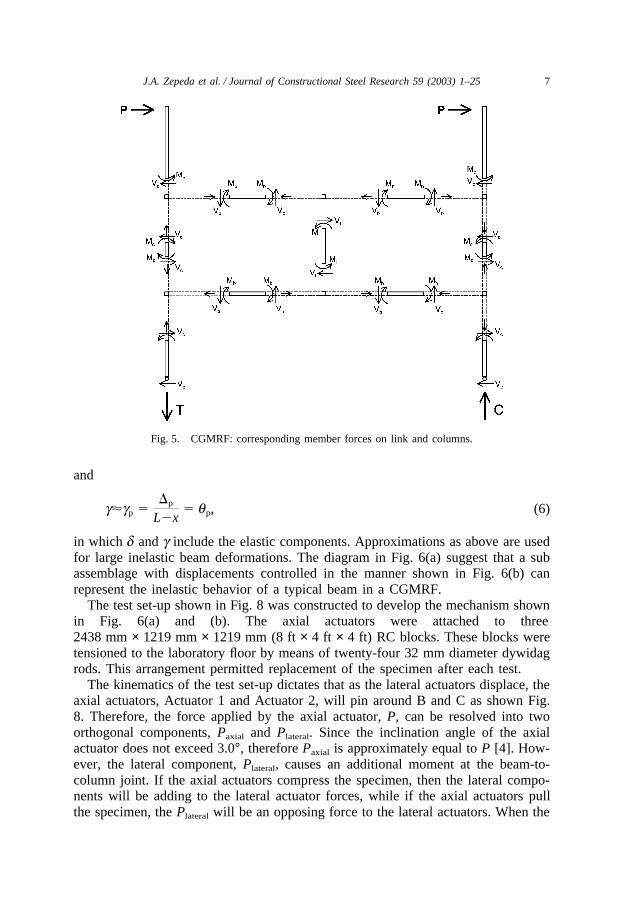
Fig. 4 shows qualitatively the distribution of the bending moment, shear force,and axial force in the CGMRF under lateral load. The shear and axial force in thebeams are less significant to the response of the beams as compared with the bendingmoment, although they must be considered in design. The qualitative distribution ofinternal forces illustrated in Fig. 5 is fundamentally the same for both elastic andinelastic ranges of behavior. The specific values of the internal forces will changeas elements of the frame yield and internal forces are redistributed. The basic patternsillustrated in Fig. 5, however, remain the same.
Inelastic static pushover analysis was carried out by applying monotonicallyincreasing lateral displacements, at the top of both columns, as shown in Fig. 6.After the four RBS have yielded simultaneously, a uniform yielding in the web andat the ends of the flanges of the vertical link will form. This is the yield mechanismfor the frame, with plastic hinges also forming at the base of the columns if theyare fixed. The base shear versus drift angle of the model is shown in Fig. 7. Thesequence of inelastic activity in the frame is shown on the figure. An elastic compo-nent, a long transition (consequence of the beam plastic hinges being formedsimultaneously) and a narrow yield plateau characterize the pushover curve.
The plastic rotation capacity, qp, is defined as the total plastic rotation beyondwhich the connection strength starts to degrade below 80% [7]. This definition isdifferent from that outlined in Section 9 (Appendix S) of the AISC Seismic Pro-visions [8, 10]. Using Eq. (2) derived by Uang and Fan [7], an estimate of the RBSplastic rotation capacity was found to be 0.037 rad:
qp � 5.8�bf
2tf��0.12�h
tw��0.5
(Fyf)�0.5. (4)
Fyf was substituted for Ry·Fy [8], where Ry is used to account for the differencebetween the nominal and the expected yield strengths (Grade 50 steel, Fy �345 MPa and Ry � 1.1 are used).
Table 1Flexural capacities of the beams and the link of the model
Element Z (mm3) Mp (kN m) P/Py Mpc (kN m)
Beams 10,307,000 3912 0.333 3080Link 4,204,000 1595 0.016 1595
Mp—plastic moment of beam based on Ry·Fy � 380 MPa.Mpc—ultimate capacity using Eq. (5.4) fromFEMA-273 [6].

6 J.A. Zepeda et al. / Journal of Constructional Steel Research 59 (2003) 1–25
Fig. 4. CGMRF: (a) typical moment diagram, (b) typical axial force diagram, and (c) typical sheardiagram.
3. Experimental program
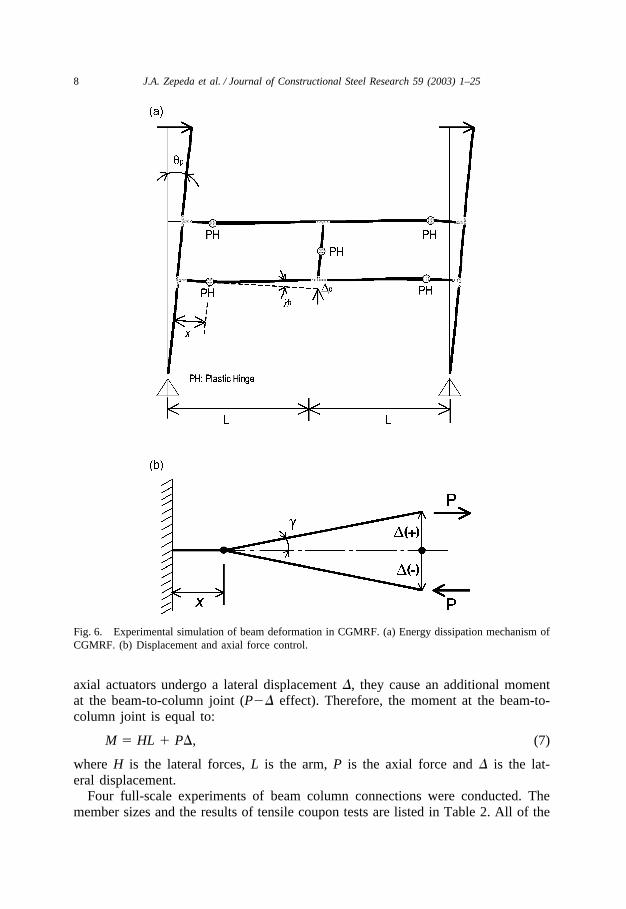
The experimental set-up for studying the behavior of a connection was based onthe kinematics of energy dissipation mechanisms of the typical CGMRF shown inFig. 6(a). Using the plastic displacement dp, plastic rotation gp, and plastic story driftangle qp shown in the figure, from geometry, it follows that
���p � (L�x)qp (5)
7J.A. Zepeda et al. / Journal of Constructional Steel Research 59 (2003) 1–25
Fig. 5. CGMRF: corresponding member forces on link and columns.
and
g�gp ��p
L�x� qp, (6)
in which d and g include the elastic components. Approximations as above are usedfor large inelastic beam deformations. The diagram in Fig. 6(a) suggest that a subassemblage with displacements controlled in the manner shown in Fig. 6(b) canrepresent the inelastic behavior of a typical beam in a CGMRF.
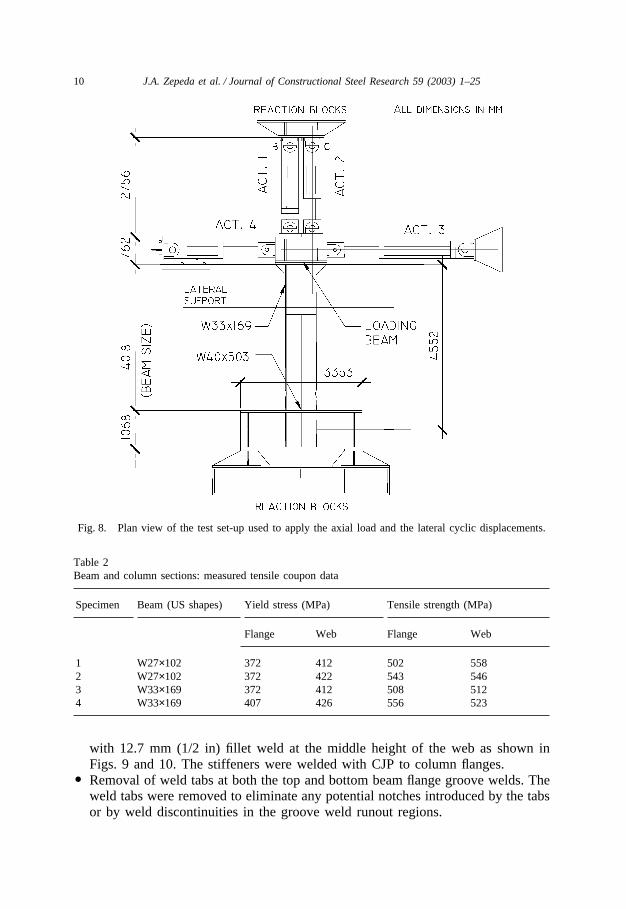
The test set-up shown in Fig. 8 was constructed to develop the mechanism shownin Fig. 6(a) and (b). The axial actuators were attached to three2438 mm × 1219 mm × 1219 mm (8 ft × 4 ft × 4 ft) RC blocks. These blocks weretensioned to the laboratory floor by means of twenty-four 32 mm diameter dywidagrods. This arrangement permitted replacement of the specimen after each test.
The kinematics of the test set-up dictates that as the lateral actuators displace, theaxial actuators, Actuator 1 and Actuator 2, will pin around B and C as shown Fig.8. Therefore, the force applied by the axial actuator, P, can be resolved into twoorthogonal components, Paxial and Plateral. Since the inclination angle of the axialactuator does not exceed 3.0°, therefore Paxial is approximately equal to P [4]. How-ever, the lateral component, Plateral, causes an additional moment at the beam-to-column joint. If the axial actuators compress the specimen, then the lateral compo-nents will be adding to the lateral actuator forces, while if the axial actuators pullthe specimen, the Plateral will be an opposing force to the lateral actuators. When the
8 J.A. Zepeda et al. / Journal of Constructional Steel Research 59 (2003) 1–25
Fig. 6. Experimental simulation of beam deformation in CGMRF. (a) Energy dissipation mechanism ofCGMRF. (b) Displacement and axial force control.
axial actuators undergo a lateral displacement �, they cause an additional momentat the beam-to-column joint (P�� effect). Therefore, the moment at the beam-to-column joint is equal to:
M � HL � P�, (7)
where H is the lateral forces, L is the arm, P is the axial force and � is the lat-eral displacement.
Four full-scale experiments of beam column connections were conducted. Themember sizes and the results of tensile coupon tests are listed in Table 2. All of the

9J.A. Zepeda et al. / Journal of Constructional Steel Research 59 (2003) 1–25
Fig. 7. Global pushover curve.
columns and beams were of A572 Grade 50 steel (Fy � 344.5 MPa). The actualmeasured beam flange yield stress value was equal to 372 MPa (54 ksi), while theultimate strength ranged from 502 MPa (72.8 ksi) to 543 MPa (78.7 ksi).
Table 3 shows the values of the plastic moment for each specimen (based onmeasured tensile coupon data) at the full cross-section and at the reduced section atmid-length of the RBS cutout.
The specimens were designated as specimen 1 through specimen 4. Test specimensdetails are shown in Fig. 9 through Fig. 12. The following features were utilized inthe design of the beam–column connection:
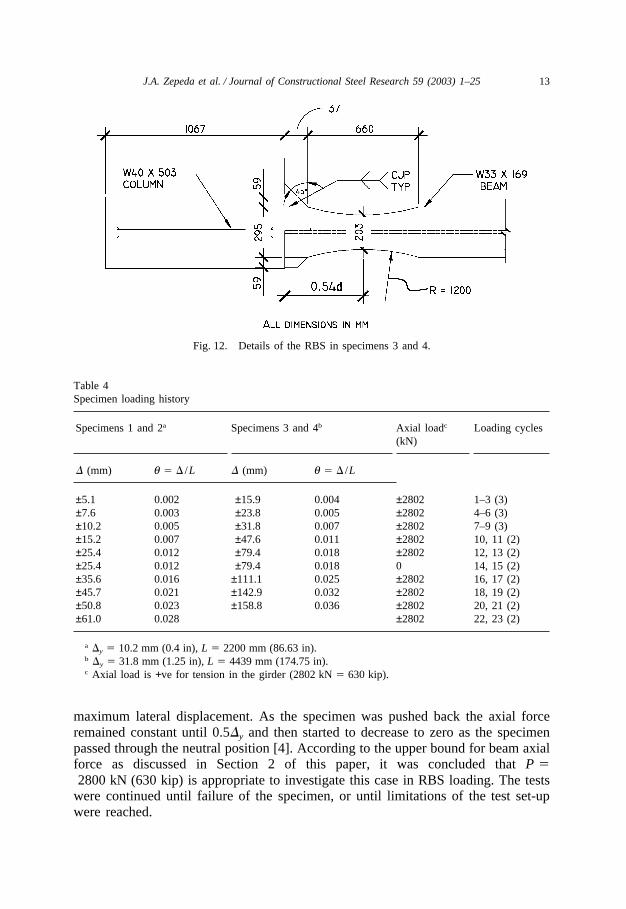
� The use of RBS in beam flanges. A circular cutout was provided, as illustratedin Figs. 11 and 12. For all specimens, 30% of the beam flange width was removed.The cuts were made carefully, and then ground smooth in a direction parallel tothe beam flange to minimize notches.
� Use of a fully welded web connection. The connection between the beam weband the column flange was made with a complete joint penetration groove weld(CJP). All CJP welds were performed according to AWS D1.1 Structural WeldingCode [11].
� Use of two side plates welded with CJP to exterior sides of top and bottom beamflanges, from the face of the column flange to the beginning of the RBS, as shownin Figs. 11 and 12. The end of the side plate was smoothed to meet the beginningof the RBS. The side plates were welded with CJP with the column flanges. Theside plate was added to increase the flexural capacity at the joint location, whilethe smooth transition was to reduce the stress raisers, which may initiate frac-ture [4].
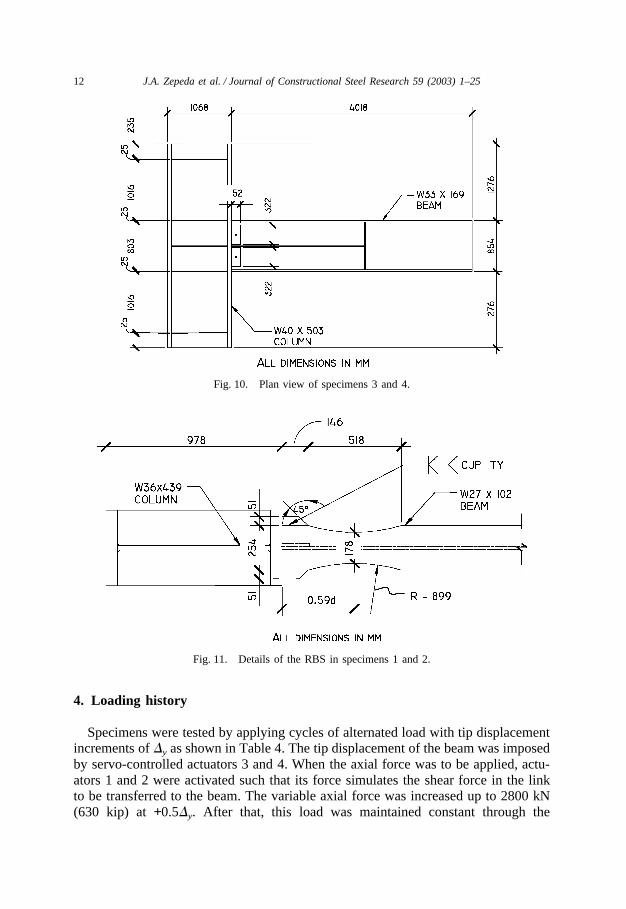
� Two longitudinal stiffeners, 95 mm × 35 mm (3 3 /4 in × 1 3/8 in), were welded
10 J.A. Zepeda et al. / Journal of Constructional Steel Research 59 (2003) 1–25
Fig. 8. Plan view of the test set-up used to apply the axial load and the lateral cyclic displacements.
Table 2Beam and column sections: measured tensile coupon data
Specimen Beam (US shapes) Yield stress (MPa) Tensile strength (MPa)
Flange Web Flange Web
1 W27×102 372 412 502 5582 W27×102 372 422 543 5463 W33×169 372 412 508 5124 W33×169 407 426 556 523
with 12.7 mm (1/2 in) fillet weld at the middle height of the web as shown inFigs. 9 and 10. The stiffeners were welded with CJP to column flanges.
� Removal of weld tabs at both the top and bottom beam flange groove welds. Theweld tabs were removed to eliminate any potential notches introduced by the tabsor by weld discontinuities in the groove weld runout regions.
11J.A. Zepeda et al. / Journal of Constructional Steel Research 59 (2003) 1–25
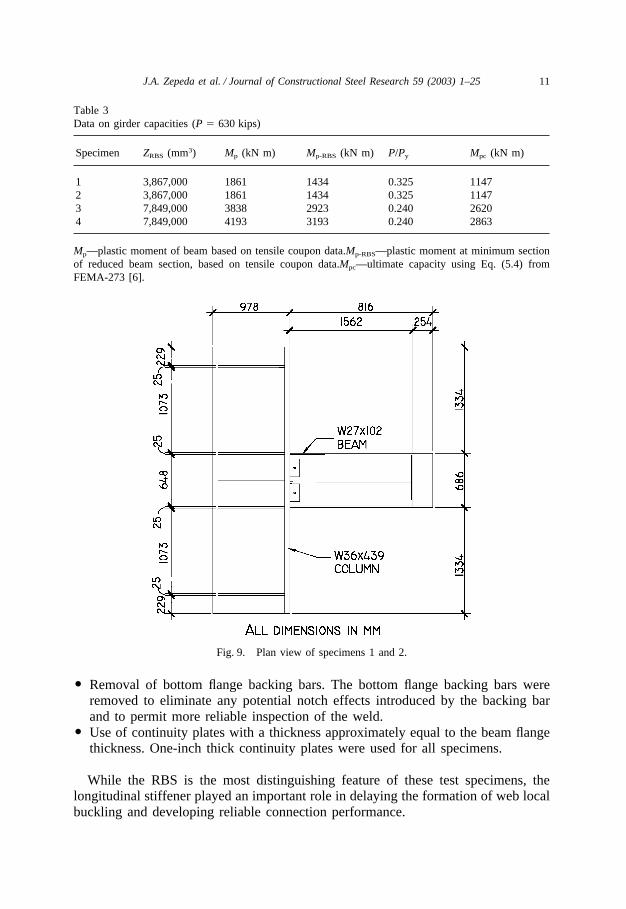
Table 3Data on girder capacities (P � 630 kips)
Specimen ZRBS (mm3) Mp (kN m) Mp-RBS (kN m) P/Py Mpc (kN m)
1 3,867,000 1861 1434 0.325 11472 3,867,000 1861 1434 0.325 11473 7,849,000 3838 2923 0.240 26204 7,849,000 4193 3193 0.240 2863
Mp—plastic moment of beam based on tensile coupon data.Mp-RBS—plastic moment at minimum sectionof reduced beam section, based on tensile coupon data.Mpc—ultimate capacity using Eq. (5.4) fromFEMA-273 [6].
Fig. 9. Plan view of specimens 1 and 2.
� Removal of bottom flange backing bars. The bottom flange backing bars wereremoved to eliminate any potential notch effects introduced by the backing barand to permit more reliable inspection of the weld.
� Use of continuity plates with a thickness approximately equal to the beam flangethickness. One-inch thick continuity plates were used for all specimens.
While the RBS is the most distinguishing feature of these test specimens, thelongitudinal stiffener played an important role in delaying the formation of web localbuckling and developing reliable connection performance.
12 J.A. Zepeda et al. / Journal of Constructional Steel Research 59 (2003) 1–25
Fig. 10. Plan view of specimens 3 and 4.
Fig. 11. Details of the RBS in specimens 1 and 2.
4. Loading history
Specimens were tested by applying cycles of alternated load with tip displacementincrements of �y as shown in Table 4. The tip displacement of the beam was imposedby servo-controlled actuators 3 and 4. When the axial force was to be applied, actu-ators 1 and 2 were activated such that its force simulates the shear force in the linkto be transferred to the beam. The variable axial force was increased up to 2800 kN(630 kip) at +0.5�y. After that, this load was maintained constant through the
13J.A. Zepeda et al. / Journal of Constructional Steel Research 59 (2003) 1–25
Fig. 12. Details of the RBS in specimens 3 and 4.
Table 4Specimen loading history
Specimens 1 and 2a Specimens 3 and 4b Axial loadc Loading cycles(kN)
� (mm) q � � /L � (mm) q � � /L
±5.1 0.002 ±15.9 0.004 ±2802 1–3 (3)±7.6 0.003 ±23.8 0.005 ±2802 4–6 (3)±10.2 0.005 ±31.8 0.007 ±2802 7–9 (3)±15.2 0.007 ±47.6 0.011 ±2802 10, 11 (2)±25.4 0.012 ±79.4 0.018 ±2802 12, 13 (2)±25.4 0.012 ±79.4 0.018 0 14, 15 (2)±35.6 0.016 ±111.1 0.025 ±2802 16, 17 (2)±45.7 0.021 ±142.9 0.032 ±2802 18, 19 (2)±50.8 0.023 ±158.8 0.036 ±2802 20, 21 (2)±61.0 0.028 ±2802 22, 23 (2)
a �y � 10.2 mm (0.4 in), L � 2200 mm (86.63 in).b �y � 31.8 mm (1.25 in), L � 4439 mm (174.75 in).c Axial load is +ve for tension in the girder (2802 kN � 630 kip).
maximum lateral displacement. As the specimen was pushed back the axial forceremained constant until 0.5�y and then started to decrease to zero as the specimenpassed through the neutral position [4]. According to the upper bound for beam axialforce as discussed in Section 2 of this paper, it was concluded that P �2800 kN (630 kip) is appropriate to investigate this case in RBS loading. The tests
were continued until failure of the specimen, or until limitations of the test set-upwere reached.
14 J.A. Zepeda et al. / Journal of Constructional Steel Research 59 (2003) 1–25
5. Test results
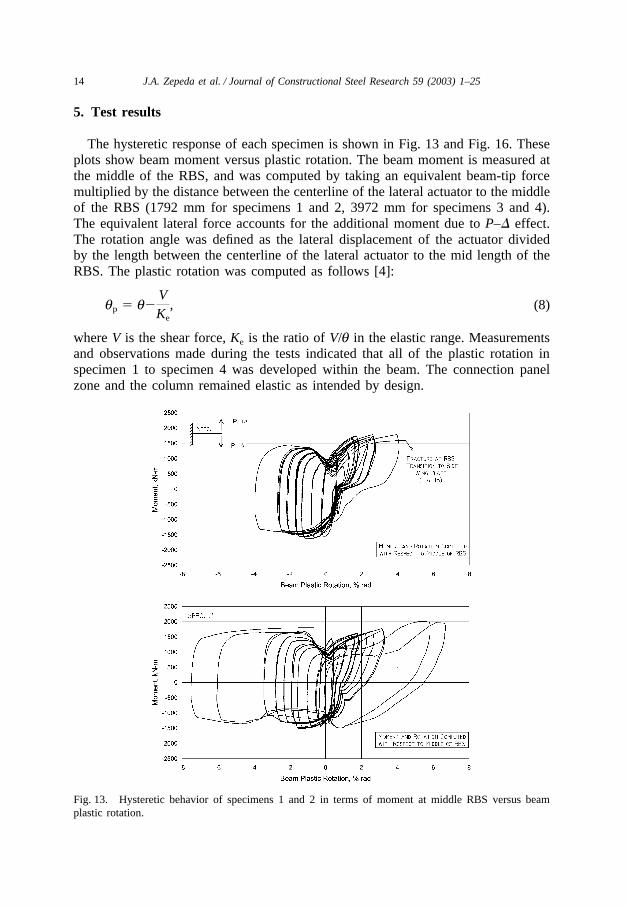
The hysteretic response of each specimen is shown in Fig. 13 and Fig. 16. Theseplots show beam moment versus plastic rotation. The beam moment is measured atthe middle of the RBS, and was computed by taking an equivalent beam-tip forcemultiplied by the distance between the centerline of the lateral actuator to the middleof the RBS (1792 mm for specimens 1 and 2, 3972 mm for specimens 3 and 4).The equivalent lateral force accounts for the additional moment due to P–� effect.The rotation angle was defined as the lateral displacement of the actuator dividedby the length between the centerline of the lateral actuator to the mid length of theRBS. The plastic rotation was computed as follows [4]:
qp � q�VKe
, (8)
where V is the shear force, Ke is the ratio of V/q in the elastic range. Measurementsand observations made during the tests indicated that all of the plastic rotation inspecimen 1 to specimen 4 was developed within the beam. The connection panelzone and the column remained elastic as intended by design.
Fig. 13. Hysteretic behavior of specimens 1 and 2 in terms of moment at middle RBS versus beamplastic rotation.

15J.A. Zepeda et al. / Journal of Constructional Steel Research 59 (2003) 1–25
Table 5 lists the total plastic rotation achieved by each specimen at the end ofthe test. The target level of plastic rotation for acceptable performance was taken as±0.03 rad, as suggested in the AISC Seismic Provisions for Structural Steel Buildings[8]. All of the specimens met the acceptance performance criteria.
All specimens provided good plastic deformation and energy dissipation. Yieldingwas first observed in the bottom flange during the loading cycles at ±1�y beam-tipdisplacement, and then increased and spread during subsequent loading cycles.
5.1. Specimens 1 and 2
The responses of specimens 1 and 2 are shown in Fig. 13. Initial yielding occurredduring cycles 7 and 8 at 1�y with yielding observed in the bottom flange. For alltest specimens, initial yielding was observed at this location and attributed to themoment at the base of the specimen [4]. Progressing through the loading history,yielding started to propagate along the RBS bottom flange. During cycle 3.5�y
initiation of web buckling was noted adjacent to the yielded bottom flange. Yieldingstarted to propagate along the top flange of the RBS and some minor yielding alongthe middle stiffener. During the cycle of 5�y with the increased axial compressionload to 3115 KN (700 kips) a severe web buckle developed along with flange localbuckling. The flange and the web local buckling became more pronounced with eachsuccessive loading cycle. It should be noted here that the bottom flange and web localbuckling was not accompanied by a significant deterioration in the hysteresis loops.
A crack developed in specimen 1 bottom flange at the end of the RBS where itmeets the side plate during the cycle 5.75�y. Upon progressing through the loadinghistory, 7�y, the crack spread rapidly across the entire width of the bottom flange.Once the bottom flange was completely fractured, the web began to fracture. This
Table 5Summary of test results
Specimen Plastic rotation Comments(rad)
1 +0.050 Specimen failed by fracture started at bottom flange RBS transition-to-wing plate; beam capacity slightly reduced in the negative zonedue to web and flange local buckling
�0.0422 +0.069 No connection failure— a small crack was observed in bottom flange
RBS transition-to-wing plate; test terminated due to reaching forcecapacity of test set-up
�0.0763 +0.036 No connection failure—test terminated due to reaching force capacity
of test set-up�0.040
4 +0.032 No connection failure—test terminated due to reaching force capacityof test set-up
�0.033

16 J.A. Zepeda et al. / Journal of Constructional Steel Research 59 (2003) 1–25
fracture appeared to initiate at the end of the RBS, then propagated through the webnet section of the shear tab, through the middle stiffener and the through the web netsection on the other side of the stiffener. The maximum bending moment achieved onspecimen 1 during the test was 1.56 times the plastic moment capacity of the beam.
During the cycle 6.5�y, specimen 2 also showed a crack in the bottom flange atthe end of the RBS where it meets the wing plate. Upon progressing through theloading history, 15�y, the crack spread slowly across the bottom flange. Specimen2 test was stopped at this point because the limitation of the test set-up was reached.
The maximum force applied to specimens 1 and 2 was 890 kN (200 kip). Thekink that is seen in the positive quadrant is due to the application of the varyingaxial tension force. The load-carrying capacity in this zone did not deteriorate asevidenced with the positive slope of the force–displacement curve. However, theload-carrying capacity deteriorated slightly in the negative zone due to the web andthe flange local buckling.
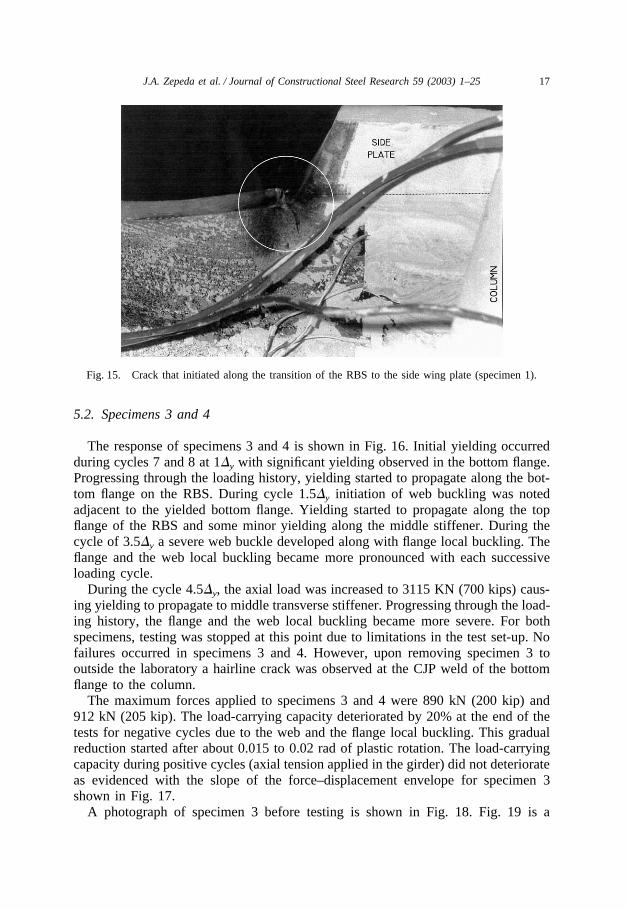
Photographs of specimen 1 during the test are shown in Figs. 14 and 15. Severelocal buckling occurred in the bottom flange and portion of the web next to thebottom flange as shown in Fig. 14. The length of this buckle extended over the entirelength of the RBS. Plastic hinges developed in the RBS with extensive yieldingoccurring in the beam flanges as well as the web. Fig. 15 shows the crack thatinitiated along the transition of the RBS to the side wing plate. Ultimate fracture ofspecimen 1 was caused by a fracture in the bottom flange. This fracture resulted inalmost total loss of the beam-carrying capacity. Specimen 1 developed 0.05 rad ofplastic rotation and showed no sign of distress at the face of the column as shownin Fig. 15.
Fig. 14. Local buckling in the bottom flange and portion of the web (specimen 1).
17J.A. Zepeda et al. / Journal of Constructional Steel Research 59 (2003) 1–25
Fig. 15. Crack that initiated along the transition of the RBS to the side wing plate (specimen 1).
5.2. Specimens 3 and 4
The response of specimens 3 and 4 is shown in Fig. 16. Initial yielding occurredduring cycles 7 and 8 at 1�y with significant yielding observed in the bottom flange.Progressing through the loading history, yielding started to propagate along the bot-tom flange on the RBS. During cycle 1.5�y initiation of web buckling was notedadjacent to the yielded bottom flange. Yielding started to propagate along the topflange of the RBS and some minor yielding along the middle stiffener. During thecycle of 3.5�y a severe web buckle developed along with flange local buckling. Theflange and the web local buckling became more pronounced with each successiveloading cycle.
During the cycle 4.5�y, the axial load was increased to 3115 KN (700 kips) caus-ing yielding to propagate to middle transverse stiffener. Progressing through the load-ing history, the flange and the web local buckling became more severe. For bothspecimens, testing was stopped at this point due to limitations in the test set-up. Nofailures occurred in specimens 3 and 4. However, upon removing specimen 3 tooutside the laboratory a hairline crack was observed at the CJP weld of the bottomflange to the column.
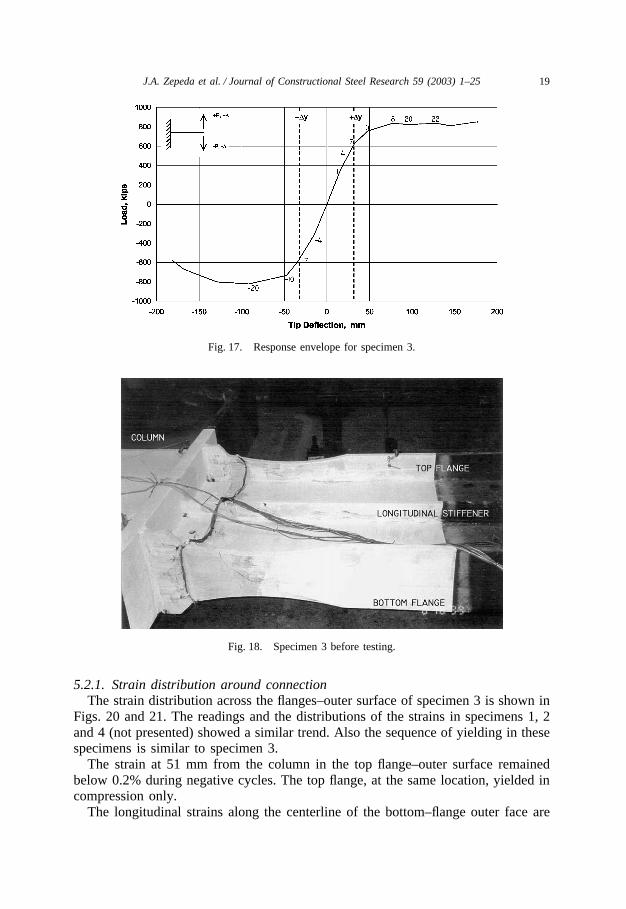
The maximum forces applied to specimens 3 and 4 were 890 kN (200 kip) and912 kN (205 kip). The load-carrying capacity deteriorated by 20% at the end of thetests for negative cycles due to the web and the flange local buckling. This gradualreduction started after about 0.015 to 0.02 rad of plastic rotation. The load-carryingcapacity during positive cycles (axial tension applied in the girder) did not deteriorateas evidenced with the slope of the force–displacement envelope for specimen 3shown in Fig. 17.
A photograph of specimen 3 before testing is shown in Fig. 18. Fig. 19 is a

18 J.A. Zepeda et al. / Journal of Constructional Steel Research 59 (2003) 1–25
Fig. 16. Hysteretic behavior of specimens 3 and 4 in terms of moment at middle RBS versus beamplastic rotation.
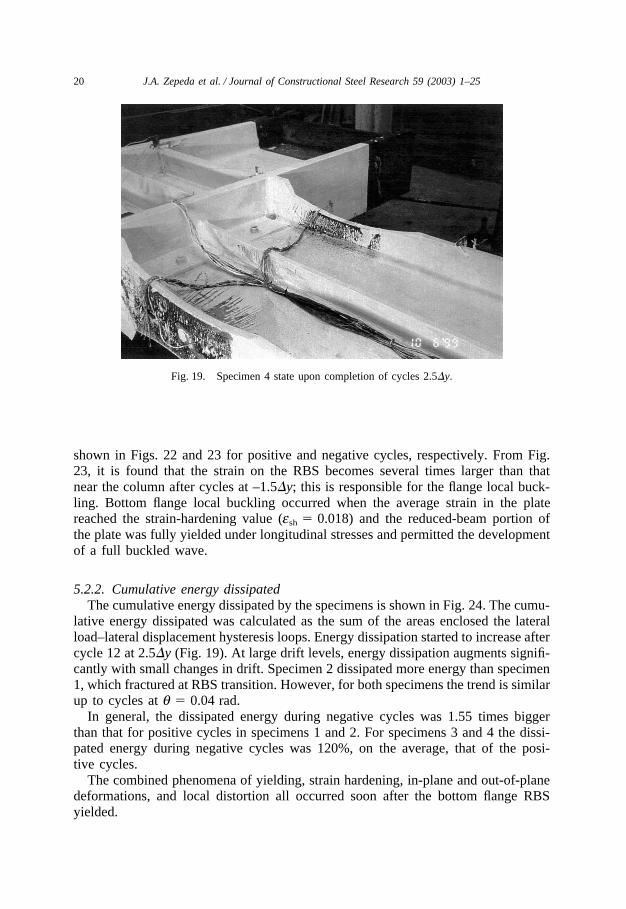
photograph of specimen 4 taken after the application of 0.014 rad displacementcycles, showing yielding and local buckling at the hinge region. The beam webyielded over its full depth. The most intense yielding was observed in the web bottomportion, between the bottom flange and the middle stiffener. The web top portionalso showed yielding, although less severe than within the bottom portion. Yieldingwas observed in the longitudinal stiffener. No yielding was observed in the web ofthe column in the joint panel zone. The unreduced portion of the beam flanges nearthe face of the column did not show yielding either. The maximum displacementapplied was 174 mm, and the maximum moment at the middle of the RBS was 1.51times the plastic moment capacity of the beam. The plastic hinge rotation reachedwas about 0.032 rad (the hinge is located at a distance 0.54d from the column surface,where d is the depth of the beam).
19J.A. Zepeda et al. / Journal of Constructional Steel Research 59 (2003) 1–25
Fig. 17. Response envelope for specimen 3.
Fig. 18. Specimen 3 before testing.
5.2.1. Strain distribution around connectionThe strain distribution across the flanges–outer surface of specimen 3 is shown in
Figs. 20 and 21. The readings and the distributions of the strains in specimens 1, 2and 4 (not presented) showed a similar trend. Also the sequence of yielding in thesespecimens is similar to specimen 3.
The strain at 51 mm from the column in the top flange–outer surface remainedbelow 0.2% during negative cycles. The top flange, at the same location, yielded incompression only.
The longitudinal strains along the centerline of the bottom–flange outer face are
20 J.A. Zepeda et al. / Journal of Constructional Steel Research 59 (2003) 1–25
Fig. 19. Specimen 4 state upon completion of cycles 2.5�y.
shown in Figs. 22 and 23 for positive and negative cycles, respectively. From Fig.23, it is found that the strain on the RBS becomes several times larger than thatnear the column after cycles at –1.5�y; this is responsible for the flange local buck-ling. Bottom flange local buckling occurred when the average strain in the platereached the strain-hardening value (esh � 0.018) and the reduced-beam portion ofthe plate was fully yielded under longitudinal stresses and permitted the developmentof a full buckled wave.
5.2.2. Cumulative energy dissipatedThe cumulative energy dissipated by the specimens is shown in Fig. 24. The cumu-
lative energy dissipated was calculated as the sum of the areas enclosed the lateralload–lateral displacement hysteresis loops. Energy dissipation started to increase aftercycle 12 at 2.5�y (Fig. 19). At large drift levels, energy dissipation augments signifi-cantly with small changes in drift. Specimen 2 dissipated more energy than specimen1, which fractured at RBS transition. However, for both specimens the trend is similarup to cycles at q � 0.04 rad.
In general, the dissipated energy during negative cycles was 1.55 times biggerthan that for positive cycles in specimens 1 and 2. For specimens 3 and 4 the dissi-pated energy during negative cycles was 120%, on the average, that of the posi-tive cycles.
The combined phenomena of yielding, strain hardening, in-plane and out-of-planedeformations, and local distortion all occurred soon after the bottom flange RBSyielded.

21J.A. Zepeda et al. / Journal of Constructional Steel Research 59 (2003) 1–25
Fig. 20. Positive-cycles strain distribution across the flanges at 51 mm from the face of the column(specimen 3).
6. Conclusions
Based on the observations made during the tests, and on the analysis of the instru-mentation, the following conclusions were developed:
1. The plastic rotation exceeded the 3% radians in all test specimens.2. Plastification of RBS developed in a stable manner.3. The overstrength ratios for the flexural strength of the test specimens were equal
to 1.56 for specimen 1 and 1.51 for specimen 4. The flexural strength capacity

22 J.A. Zepeda et al. / Journal of Constructional Steel Research 59 (2003) 1–25
Fig. 21. Negative-cycles strain distribution across the flanges at 51 mm from the face of the column(specimen 3).
was based on the nominal yield strength and on the FEMA-273 beam–column equ-ation.
4. The plastic local buckling of the bottom flange and the web was not accompaniedby a significant deterioration in the load-carrying capacity.
5. Although flange local buckling did not cause an immediate degradation ofstrength, it did induce web local buckling.
6. The longitudinal stiffener added in the middle of the beam web assisted in trans-ferring the axial forces and in delaying the formation of web local buckling. How-

23J.A. Zepeda et al. / Journal of Constructional Steel Research 59 (2003) 1–25
Fig. 22. Longitudinal strains along centerline of bottom flange during positive cycles (specimen 3).
Fig. 23. Longitudinal strains along centerline of bottom flange during negative cycles (specimen 3).
ever, this has caused a much higher overstrength ratio, which had a significantimpact on the capacity design of the welded joints, panel zone and the column.
7. A gradual strength reduction occurred after 0.015 to 0.02 rad of plastic rotationduring negative cycles. No strength degradation was observed during positivecycles.
8. Compression axial load under 0.0325Py does not affect substantially the connec-tion deformation capacity.

24 J.A. Zepeda et al. / Journal of Constructional Steel Research 59 (2003) 1–25
Fig. 24. Energy dissipated.
9. CGMRFS with properly designed and detailed RBS connections is a reliable sys-tem to resist earthquakes.
Acknowledgements
Structural Design Engineers, Inc. of San Francisco financially supported theexperimental program. The tests were performed in the Large Scale Structures Lab-oratory of the University of Nevada, Reno. The participation of Elizabeth Ware,Adrianne Dietrich and of the technical staff is gratefully acknowledged.
References
[1] Engelhardt MD, Winneberger T, Zekany AJ, Potyraj TJ. The dogbone connection: part II. Mod.Steel Construct. 1996;36(8):46–55.
[2] Engelhardt MD, Winneberger T, Zekany AJ, Potyraj TJ. Experimental investigation of dogbonemoment connections. Eng. J. , AISC 1998;35(4):128–39.
[3] Uniform building code. Whittier (CA): International Conference of Building Officials, 1997 (April).[4] Itani AM, Zepeda JA, Ware EC. Cyclic behavior of steel moment frame connections for the Moscone
Center Expansion. In: Report No. CCEER 99-14. Reno (NV): University of Nevada–Reno, 1999(December).
[5] SAP2000 (Static and dynamic finite element of structures). San Francisco (CA): Computers andStructures, Inc, 2000.
[6] FEMA-273, NEHRP guidelines for the seismic rehabilitation of buildings. Washington, D.C: FederalEmergency Management Agency, 1997.
[7] Uang C-M, Fan C. Cyclic stability criteria for steel moment connections with reduced beam section.J. Struct. Eng., ASCE 2001;127(9):1021–7.
[8] Seismic provisions for structural steel buildings. Chicago (IL): American Institute of Steel Construc-tion (AISC), 1997 (146 pp.).

25J.A. Zepeda et al. / Journal of Constructional Steel Research 59 (2003) 1–25
[9] McGuire W, Gallagher RH, Ziemian RD. Matrix structural analysis., 2nd ed. New York: JohnWiley, 2000.
[10] FEMA-350, Recommended seismic design criteria for new steel moment-frame buildings. Wash-ington, D.C: Federal Emergency Management Agency, 2000 (460 pp.).
[11] ANSI/AWS D1.1-99, Structural welding code. Miami (FL): American Welding Society (AWS) 1999.