components of tourism supply -...
TRANSCRIPT
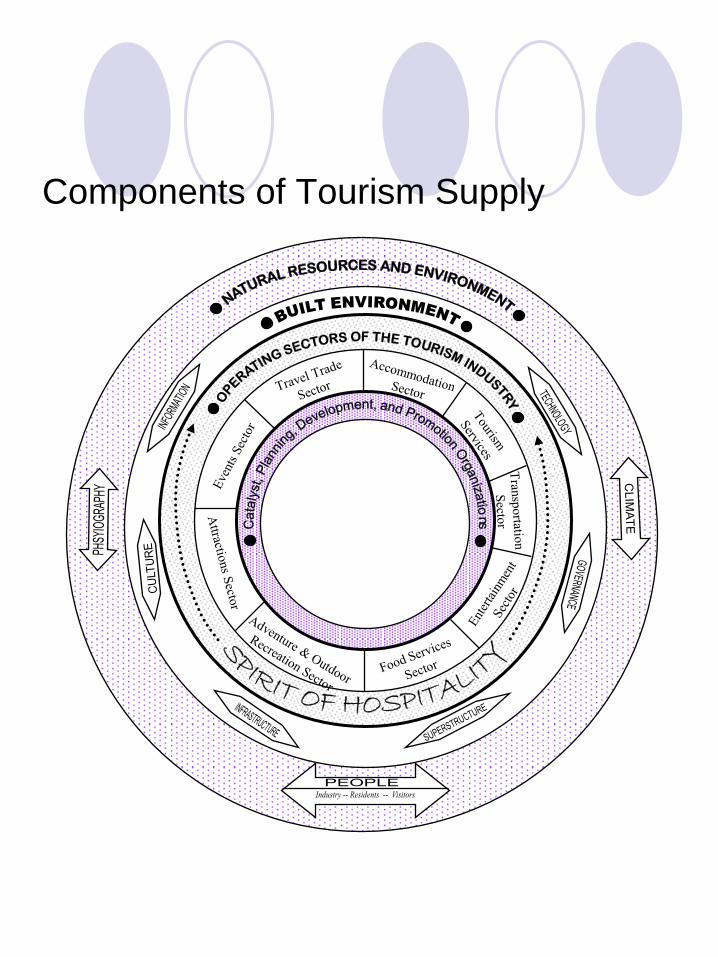
Components of Tourism Supply
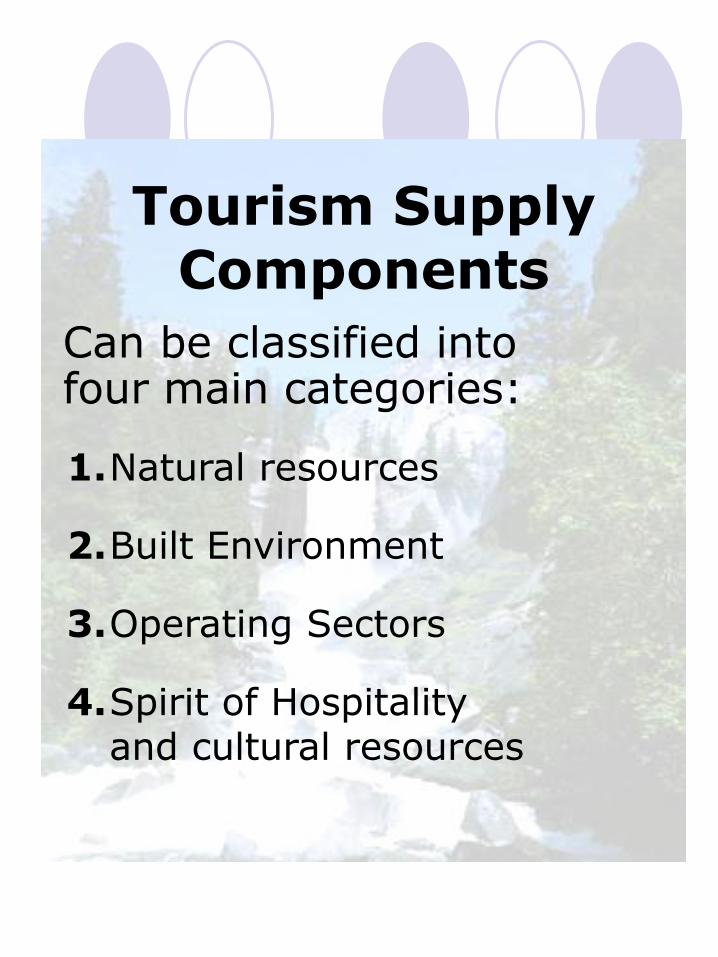
Tourism Supply Components
Can be classified intofour main categories:
1.Natural resources
2.Built Environment
3.Operating Sectors
4.Spirit of Hospitalityand cultural resources

Natural Resources and
environment
Air and climate
Physiography
Landforms
Terrain
Flora and Fauna
Bodies of water/beaches
Water supply
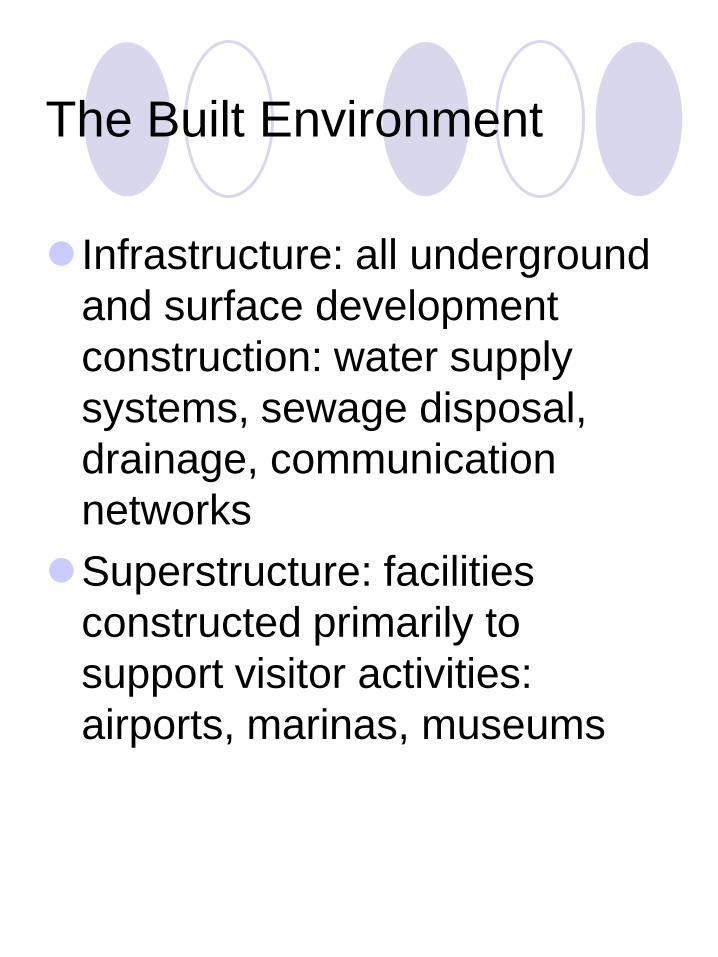
The Built Environment
Infrastructure: all underground
and surface development
construction: water supply
systems, sewage disposal,
drainage, communication
networks
Superstructure: facilities
constructed primarily to
support visitor activities:
airports, marinas, museums
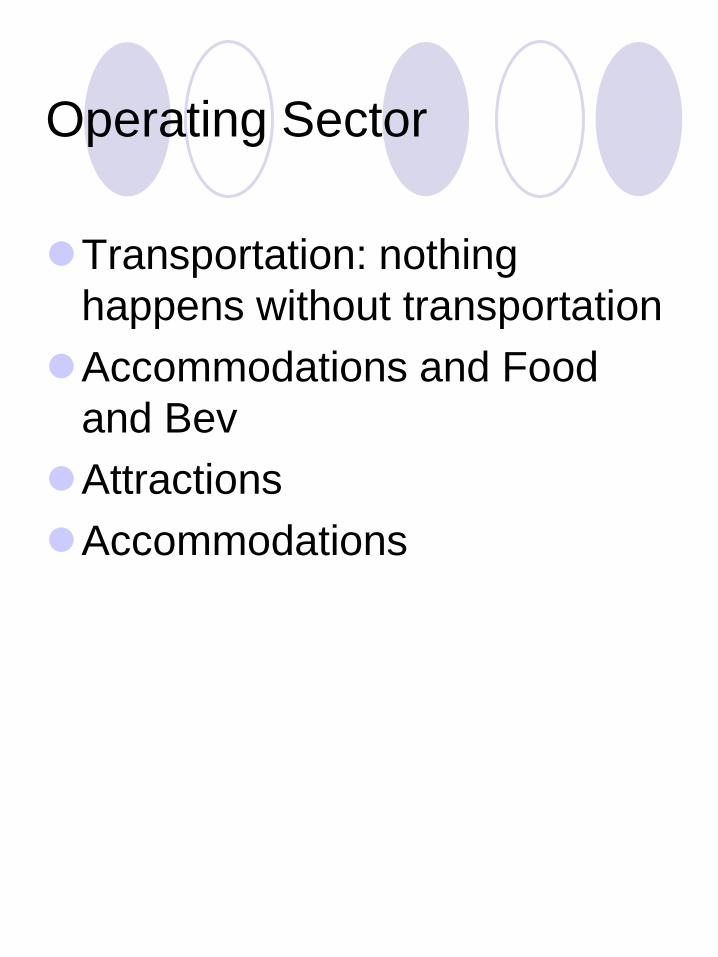
Operating Sector
Transportation: nothing
happens without transportation
Accommodations and Food
and Bev
Attractions
Accommodations

Spirit of Hospitality and
Cultural Resources
Social foundation of the
destination: the culture
What is the culture of the host
community with respect to
tourism?
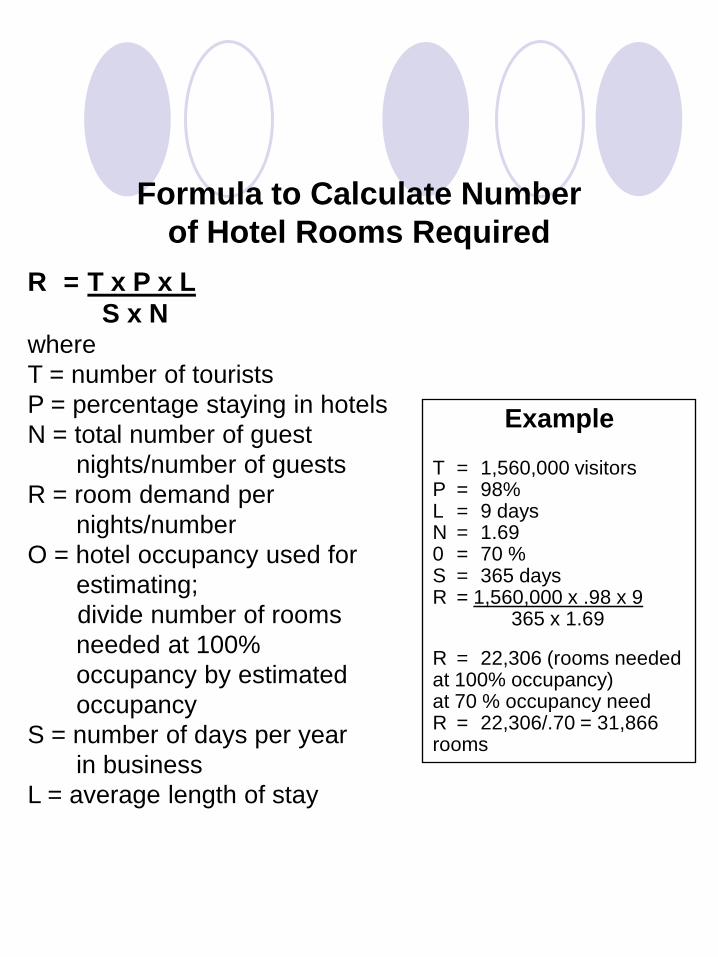
Formula to Calculate Number
of Hotel Rooms Required
R = T x P x L
S x Nwhere
T = number of tourists
P = percentage staying in hotels
N = total number of guest
nights/number of guests
R = room demand per
nights/number
O = hotel occupancy used for
estimating;
divide number of rooms
needed at 100%
occupancy by estimated
occupancy
S = number of days per year
in business
L = average length of stay
Example
T = 1,560,000 visitorsP = 98%L = 9 daysN = 1.690 = 70 %S = 365 daysR = 1,560,000 x .98 x 9
365 x 1.69
R = 22,306 (rooms needed at 100% occupancy) at 70 % occupancy needR = 22,306/.70 = 31,866 rooms

Task Analysis
Task analysis is the procedure used in matching supply with demand. The following steps are usually employed:
1. Identification of the present demand
2. A quantitative and qualitative inventory of the existing supply
3. The adequacy of present supply with present demand
4. Examination of present markets and the socioeconomic trends
5. Forecast of tourism demand
6. Matching supply with anticipated demand
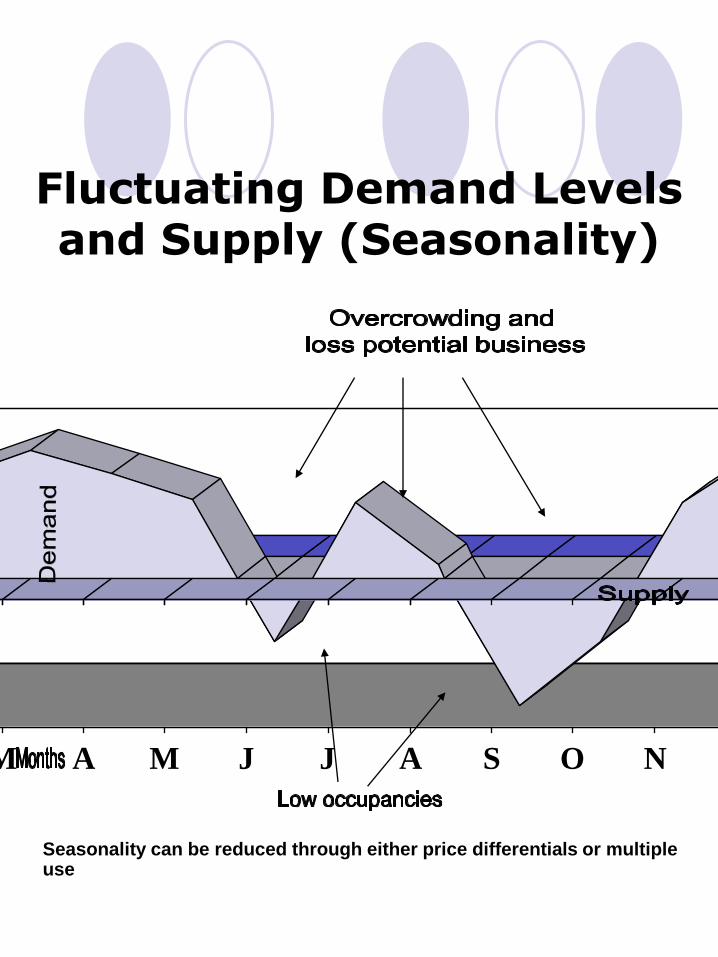
J F M A M J J A S O N D
Fluctuating Demand Levelsand Supply (Seasonality)
Seasonality can be reduced through either price differentials or multiple use
Vital Demand Data
1. Number of visitors
2. Means of transportation used by visitors to arrive at destination
3. Length of stay and type of accommodations used
4. Amount of money spentby visitors
Demand to a Destination
Demand for travel to a particular destination is a function of the propensity of the individual to travel and the reciprocal of the resistant of the link between origin and destination areas.
Demand = f(propensity, resistance)

Propensity and Resistance
Propensity
depends on:
Psychographics
Demographics
(socioeconomic
status)
Marketing
effectiveness
Resistance
depends on:
Economic
distance
Cultural distance
Cost of tourist
services
Quality of service
Seasonality
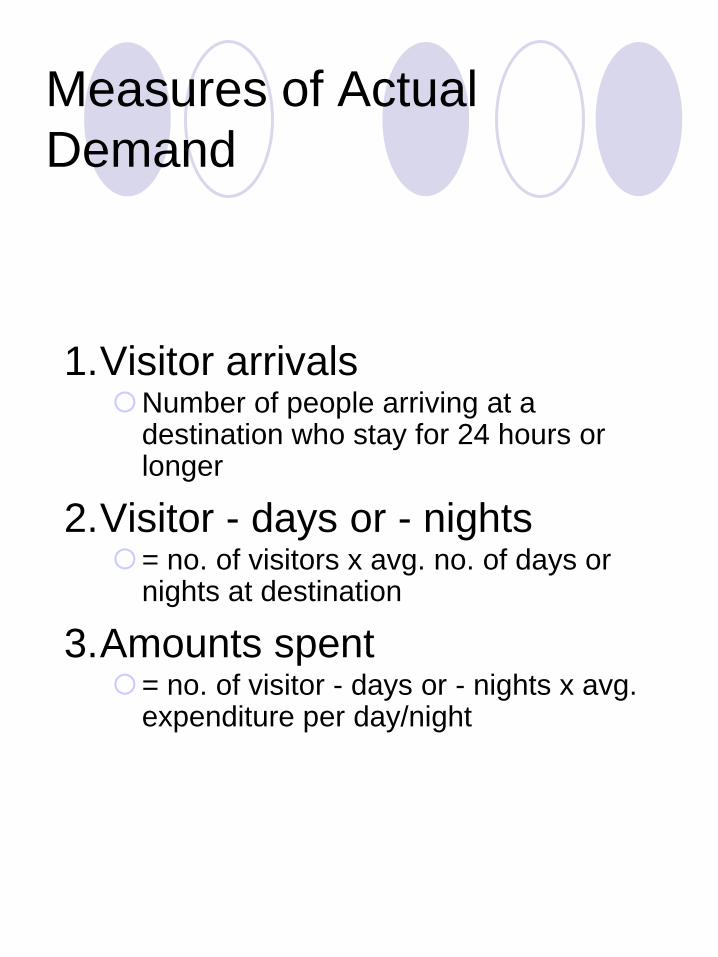
Measures of Actual
Demand
1.Visitor arrivalsNumber of people arriving at a
destination who stay for 24 hours or longer
2.Visitor - days or - nights= no. of visitors x avg. no. of days or
nights at destination
3.Amounts spent= no. of visitor - days or - nights x avg.
expenditure per day/night
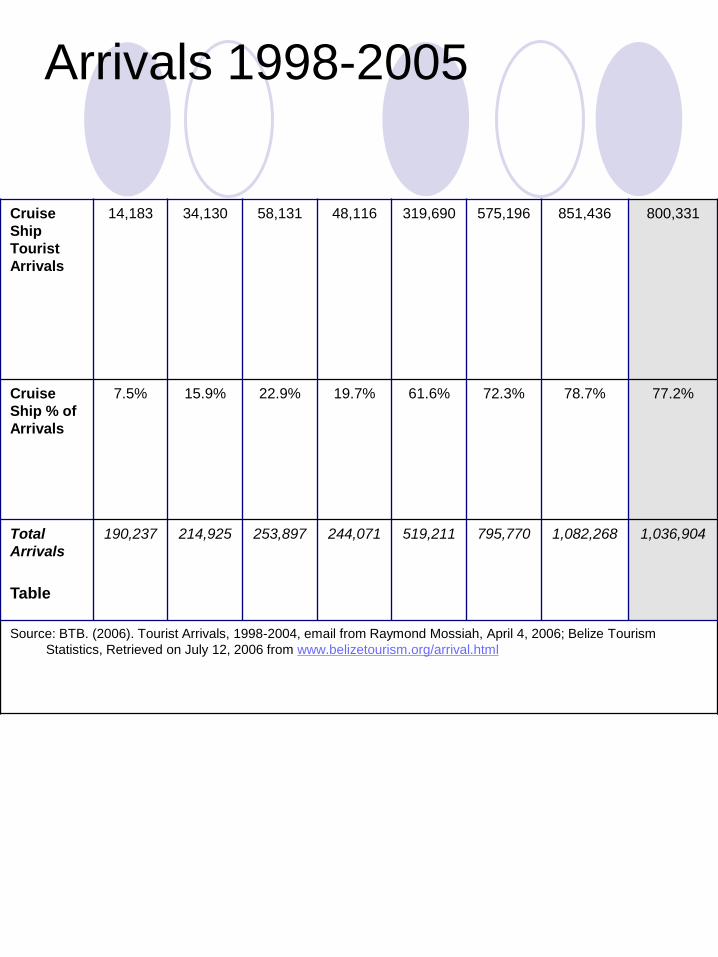
Arrivals 1998-2005
Cruise
Ship
Tourist
Arrivals
14,183 34,130 58,131 48,116 319,690 575,196 851,436 800,331
Cruise
Ship % of
Arrivals
7.5% 15.9% 22.9% 19.7% 61.6% 72.3% 78.7% 77.2%
Total
Arrivals
190,237 214,925 253,897 244,071 519,211 795,770 1,082,268 1,036,904
Source: BTB. (2006). Tourist Arrivals, 1998-2004, email from Raymond Mossiah, April 4, 2006; Belize Tourism
Statistics, Retrieved on July 12, 2006 from www.belizetourism.org/arrival.html
Table
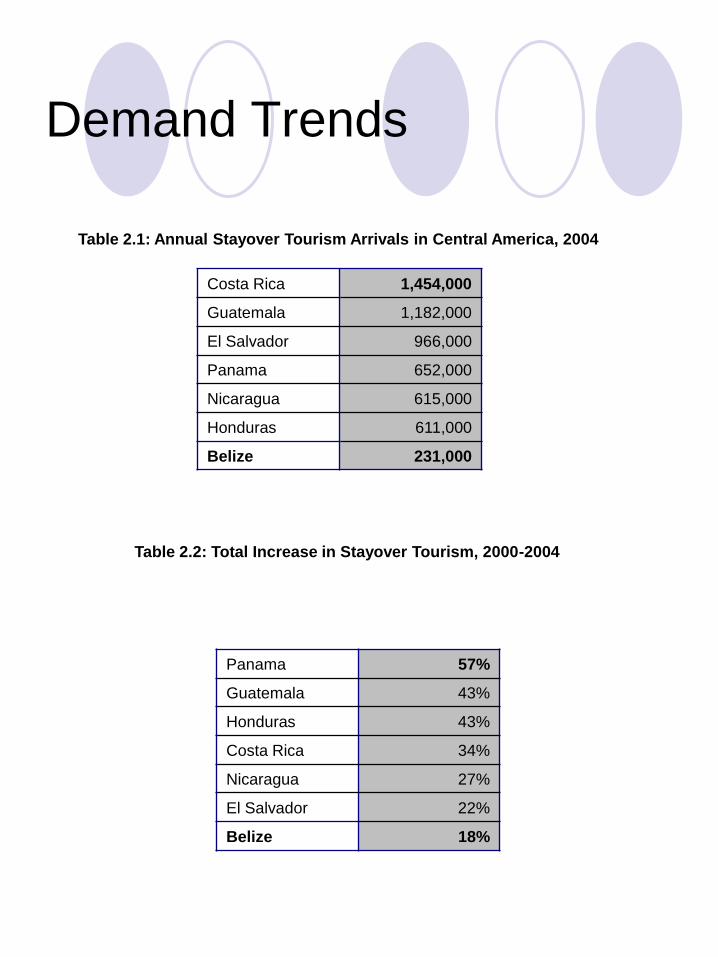
Demand Trends
Table 2.1: Annual Stayover Tourism Arrivals in Central America, 2004
Costa Rica 1,454,000
Guatemala 1,182,000
El Salvador 966,000
Panama 652,000
Nicaragua 615,000
Honduras 611,000
Belize 231,000
Table 2.2: Total Increase in Stayover Tourism, 2000-2004
Panama 57%
Guatemala 43%
Honduras 43%
Costa Rica 34%
Nicaragua 27%
El Salvador 22%
Belize 18%
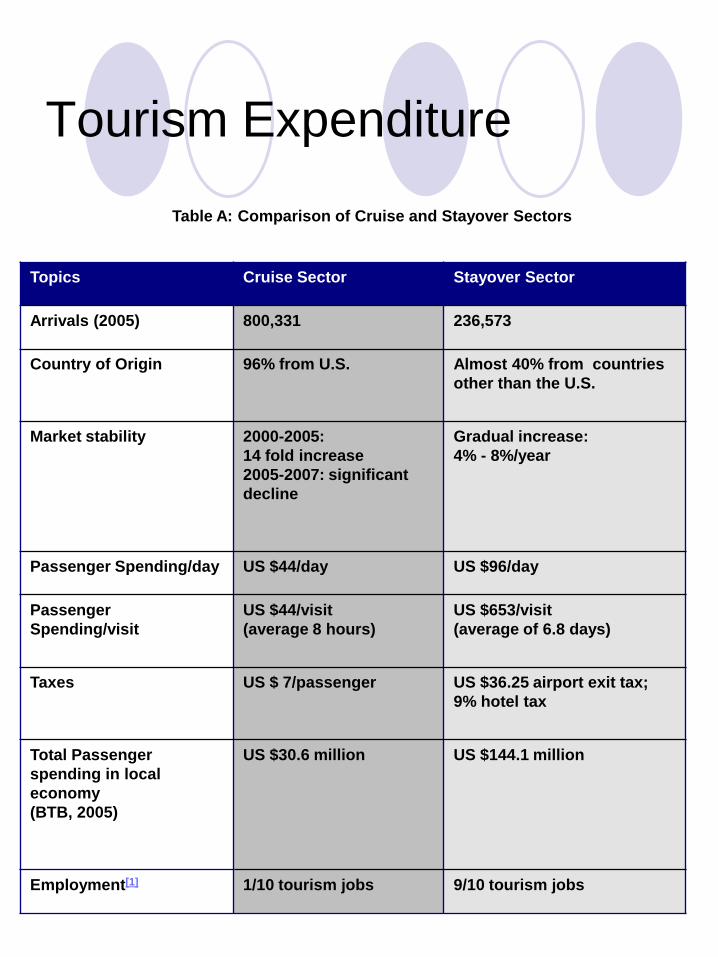
Tourism Expenditure
Table A: Comparison of Cruise and Stayover Sectors
Topics Cruise Sector Stayover Sector
Arrivals (2005) 800,331 236,573
Country of Origin 96% from U.S. Almost 40% from countries
other than the U.S.
Market stability 2000-2005:
14 fold increase
2005-2007: significant
decline
Gradual increase:
4% - 8%/year
Passenger Spending/day US $44/day US $96/day
Passenger
Spending/visit
US $44/visit
(average 8 hours)
US $653/visit
(average of 6.8 days)
Taxes US $ 7/passenger US $36.25 airport exit tax;
9% hotel tax
Total Passenger
spending in local
economy
(BTB, 2005)
US $30.6 million US $144.1 million
Employment[1] 1/10 tourism jobs 9/10 tourism jobs
Projection Methodology
Several statistical methods or econometric analysis can be usedto project demand.
• Trend analysis method
• Simple Regression — Linear least square
method
• Multiple Regression — Linear least squares
method
• Computer simulations and models
• Executive Judgement (Delphi) method