component d: managing the workforce expenditure …€¦ · · 2013-07-29employees whose salary...
TRANSCRIPT

74 Annual Report 2011/12
Skills Development Expenditure
R'000
Management level Gender
Employees as at the begin-ning of the
financial year
Original Budget and Actual Expenditure on skills development Year 1
Learnerships Skills programmes & other short courses
Other forms of training
Total
No. Original Budget
Actual Original Budget
Actual Original Budget
Actual Original Budget
Actual
Sub totalFemale 100 850 850 2 145 250 125 1102 1120
Male 184 658 688 135 290 172 948 995
Total 284 1508 1538 2 280 540 297 2050 2115
*% and *R value of municipal salaries (original budget) allocated for workplace skills plan. %* *R
T4.5.3
COMPONENT D: MANAGING THE WORKFORCE EXPENDITURE
INTRODUCTION TO WORKFORCE EXPENDITURE T 4.6.0
4.6 EMPLOYEE EXPENDITURE
Source: MBRR SA22 T 4.6.1
Number Of Employees Whose Salaries Were Increased Due To Their Positions Being Upgraded
Beneficiaries Gender Total
Lower skilled (Levels 1 -2)Female 0
Male 0
Skilled (Levels 3 -5)Female 0
Male 0
Highly skilled production (Levels 6 -8)
Female 0
Male 0
75Sedibeng District Municipality
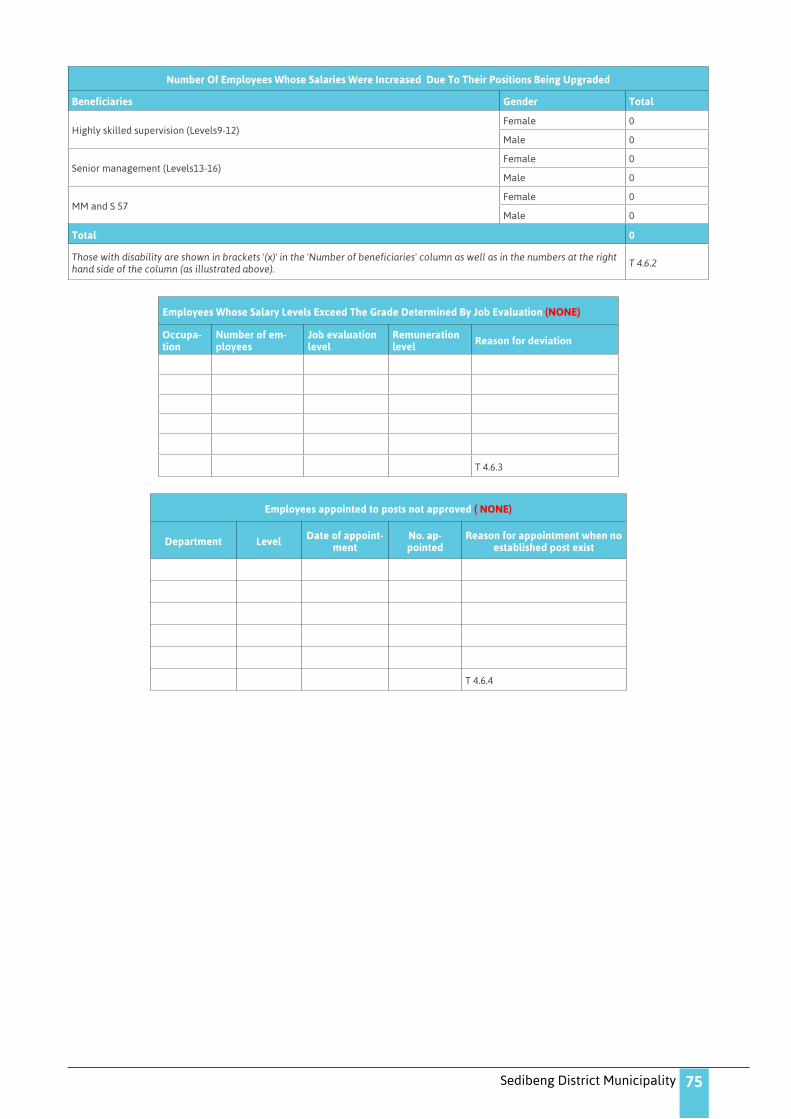
Number Of Employees Whose Salaries Were Increased Due To Their Positions Being Upgraded
Beneficiaries Gender Total
Highly skilled supervision (Levels9 -12)Female 0
Male 0
Senior management (Levels13 -16)Female 0
Male 0
MM and S 57Female 0
Male 0
Total 0
Those with disability are shown in brackets '(x)' in the 'Number of beneficiaries' column as well as in the numbers at the right hand side of the column (as illustrated above).
T 4.6.2
Employees Whose Salary Levels Exceed The Grade Determined By Job Evaluation (NONE)
Occupa-tion
Number of em-ployees
Job evaluation level
Remuneration level Reason for deviation
T 4.6.3
Employees appointed to posts not approved ( NONE)
Department Level Date of appoint-ment
No. ap-pointed
Reason for appointment when no established post exist
T 4.6.4
76 Annual Report 2011/12
CHAPTER 5 – FINANCIAL PERFORMANCEINTRODUCTION
T5.0.1
COMPONENT A: STATEMENTS OF FINANCIAL PERFORMANCE
INTRODUCTION TO FINANCIAL STATEMENTS
Note: Statements of Revenue Collection Performance by vote and by source are included at AppendixK.
T5.1.0
5.1 STATEMENTS OF FINANCIAL PERFORMANCE
CHIEF FINANCIAL OFFICER’S OVERVIEW FOR THE ANNUAL REPORT 2011/ 2012
1. INTRODUCTION
The Sedibeng District Municipality is situated in the southern part of Gauteng Province. As a district municipality it performs a coordinating function over three local municipalities namely Emfuleni, Lesedi, and Midvaal Local Municipalities.
The District Municipality’s mission is the creation of a local government dedicated to the provision of quality services in an effective, efficient and financially sound manner by promoting the Batho Pele principles of ensuring cost effective and affordable service delivery, monitoring and developing staff to ensure consistently high work output, adhering to good governance and sound management practices, as well as developing a culture of accountability and transparency.
National Treasury and the Department of Cooperative Governance and Traditional Affairs (COGTA) launched the Operation Clean Audit Programme in 2009. At this event the National Minister bestowed upon Sedibeng District Municipality and its local municipalities the award as Ambassador of Operation Clean Audit to assist other municipalities in the country to achieve this status as well.
It is within this context that Sedibeng District Municipality works in collaboration with its local municipalities through our intergovernmental relation structures towards a district wide Clean Audit Status approach.
2. DISCUSSION
2.1 Internal Quality Control Processes:
The annual financial statements attached hereto as ANNEXURE “A” was subjected to a rigorous quality assessment as part of our Operation Clean Audit (OPCA) internal control processes. SDM undertook for our financial statements to be reviewed externally by a professional service provider, in order to assure the quality on the face of the financial statements as well as the accompanying notes and lead schedules. In line with this process we have also reviewed and amended our financial policies and procedures which are also subject and ready for audit by the Auditor -General. In addition SDM has over the last two and a half years implemented a cost containment strategy which purported to place austerity measures within the municipality to save costs. The process is ongoing and the fruits of the outcome has generated a substantial saving in our budget.
2.2 Objective:
The basic financial reporting objectives as prescribed by the Accounting Standards Board are:
z Financial reporting should assist in fulfilling government’s duty to be publicly accountable and should enable users to assess that accountability by: -
Providing information to determine whether current year revenues were sufficient to meet the cost of providing current year services rendered.
• Demonstrating whether resources were obtained and used in accordance with Council’s legally adopted budget, and demonstrating compliance with other finance -related legal or contractual requirements.

77Sedibeng District Municipality
• Providing information to assist users in assessing the service efforts, costs, and accomplishments of the entity.
z Financial reporting should assist users in evaluating the operating results of Council for the year by: -
• Providing information about sources and uses of financial resources.
• Providing information about how it finances its activities and meet its cash flow requirements.
• Providing information necessary to determine whether its financial position improved or deteriorated as a result of the year’s operations.
z Financial reporting should assist users in assessing the level of services that can be provided by Council and its ability to meet its obligations as they become due by: -
• Providing information about its financial position and condition.
• Providing information about its physical and other non -financial resources having useful lives that extend beyond the current year, including information that can be used to assess the service potential of those resources.
• Disclosing legal or contractual restrictions on resources and the risk of potential loss of resources.
This report analyses the financial position and financial performance trends over the past four years of Sedibeng District Municipality as per the UNAUDITED FINANCIAL STATEMENTS FOR THE YEAR ENDING 30 JUNE 2012, annexed hereto as ANNEXURE “A”.
Key words:Accountability, Evaluation, Assessment, Statement of Financial Position, Statement of Financial Performance, Statement of Change in Net Assets, Statement of Cash Flow, Assets, Liabilities, Net Assets, Financial Ratios
2.3 Statement of Financial Position Definitions
The financial position of a municipality is directly measured by the number of resources controlled by the municipality from which future economic benefits are expected (assets), obligations resulting in a outflow of municipal resources (liabilities) and the residual interest in the assets of Council after deducting all the liabilities of the municipality, also known as the community’s wealth or Council’s net worth (net assets).
What Council Owns (Assets) – What Council Owes (Liabilities) = Council’s Net Assets
Item Description Item DefinitionCurrent Assets These are the most liquid assets
Property, plant & equipment Fixed assets of Council
Current Liabilities
Obligations Council must pay within the next year• Accrued expenses are unpaid expenses• Current portion of long -term debt are the mon -
ies owed in the next year on long -term debt
Non -current Liabilities Monies borrowed to finance long -term assets
The net assets of Council are primarily composed of the accumulated surplus and reserves that Council has built up over the years. The nature of these reserves is that they are ring -fenced for specific purposes. These reserves are not supported by cash but are only used for book entry purposes for the phasing in of increased depreciation charges as a result of the full implementation of GRAP 17.
The accumulated surplus, on the other hand, is built up over the years from savings made every year from the service delivery operations of Council. The accumulated surplus is then utilised for funding those projects that Council were not able to procure external (grant) funding for. These are referred to as internally funded projects. It must be noted that the accumulated surplus is made up of accounting book -entries and does not necessarily imply that these sums are cash -backed by physical funds in investments. The monies held in investments for Council are mostly made up of grant monies received that are not yet utilised.

78 Annual Report 2011/12
2.4 Analysis of the Statement of Financial Position:
The statement of financial position states Council’s financial position at the end of an operating period of a 12 -month fiscal year (July 2011 to June 2012). It represents the assets, liabilities, net assets and their relationship to one another. This report performs a horizontal analysis of Council’s balance sheet items over the past four fiscal years.
2012 2011 2010 2009
ASSETS 237,569,552 265 190 491 339 325 458 351 212 640
Current Assets 51,412,714 70,279,076 170 541 735 221 201 520
Non -Current Assets 186,156,838 194,911,415 168 783 723 130 011 120
LIABILITIES 62,217,351 93,647,803 76 401 755 66 390 200
Current Liabilities 62,217,351 93,647,803 76 401 755 66 390 200
Non -current Liabilities
NET ASSETS 175,352,201 171,542,688 262 923 703 284 822 440
Item Description Discussion/ Trend Analysis
AssetsCouncil assets have shown a diminishing increase over the last four financial periods. The last two financial periods have shown a decline in total assets resulting in an average de -crease of 14% in current assets.
LiabilitiesCouncil liabilities have shown an average decrease 6% over the last four financial periods. This is primarily due to Council’s increase in operations as there have been no long -term liabilities for the past three financial years.
Net Assets
Council net assets have shown a steady decline of an average of 20% over the last four finan -cial periods. This is mostly due to the decrease in Council assets due the transfer of capital project construction assets of over R85million to the local municipalities as this transfer impacts directly on the calculation of the operating deficit which in turn adversely affects the accumulated surplus.
2.5 Description of Statement of Financial Performance:
The statement of financial performance shows the results of operations over the past four -year period. It lists sources of revenue and expenses. The statement measures the performance of Council for a given period of time. Surplus or deficit is used to measure financial performance and directly related to the measurement of revenue and expenditure for the reporting period.
Operating expenses are incurred in the course of conducting normal Council business. They are classified by function such as employee related costs, general expenses, finance charges and contributions to provisions.
2.6 Analysis of Statement of Financial Performance:
Council has moved from declaring an operating surplus to a deficit for the previous two financial years. This deficit is directly in relation to the transfer of completed capital projects to the local municipalities paid as grants & subsidies to the value of R85,525,748 in the 2010/11 financial year. Due to our cost containment measures implemented council
managed to reduce general expenses which resulted in the 2012 financial year end to close with a operating surplus of R4,4 million. A detailed discussion on various operating line items is provided below.

79Sedibeng District Municipality
2.7 Operating Revenue:
Revenue is the gross inflow of economic benefits or service potential during the reporting period when those inflows result in an increase in net assets. Revenue categories include:
Category Description Definition
Sale of goods Income derived from sale of fuel at the airport
Rental of facilities and equipment Rental of facilities and equipment such as the town hall and theatres
Interest received Interest received from trading activities as well as on investments
Income from agency services Income from agency services performed in the provision of IT services to local municipalities
Licenses and permits Income received from performing the motor vehicle licensing and permits function on behalf of provincial administration
Government grants & subsidies Government grants & subsidies received as per DoRA allocations
Other income Other Income consists of income items such as ambulance fees, airfield fees, profit on sale of assets, skills levy income, tender income as well as recoveries from telephone costs and commission on salaries
2012 2011 2010 2009 Ave
Revenue
Sale of goods 1,217,207 74% 321,965
5% 305,674 -22% 371,463 26%
Rental of facilities and equipment
7,799,499 1% 7,695,109 -10% 8,428,823 5% 8,026,490 -1%
Interest received (trading)
- - - 141
-9289% 13,238
Income from agency services
6,963,365 7% 6,496,536 13% 5,664,190 28% 4,057,196 16%
Licenses and permits 59,605,708 17% 49,309,873 14% 42,223,033 9% 38,477,430 14%
Government grants & subsidies
292,212,987 1% 290,229,183 13% 252,453,877 9% 228,808,544 8%
Other income 1,380,793 16% 1,163,667 -60% 1,865,007 -12% 2,091,036 -19%
Interest received – investment
2,221,854 -181% 6,237,003 -121% 13,813,333 -41% 19,441,804 -114%
Total Revenue 371,401,413 3% 361,453,336 10% 324,754,078 7% 301,287,201 7%
The marginal average increase in income from agency services, licenses & permits, grants & subsidies and “other income” does not compensate for the drastic declines in the other sources of revenue, which is a contributory factor to the closing on a deficit for the previous two financial years. The revenue generated from interest on investments averages at a decline of 114%, with 2011 reporting a decline of 121% and 2012 a decline of 181%. This is directly attributed to
Council’s reducing cash held in short -term investments due to the continual compensation of a shortfall in the EMS subsidy allocation from Provincial Department of Health. Revenue has also increased at a lower rate than the CPI rate which had a direct impact on expenses.

80 Annual Report 2011/12
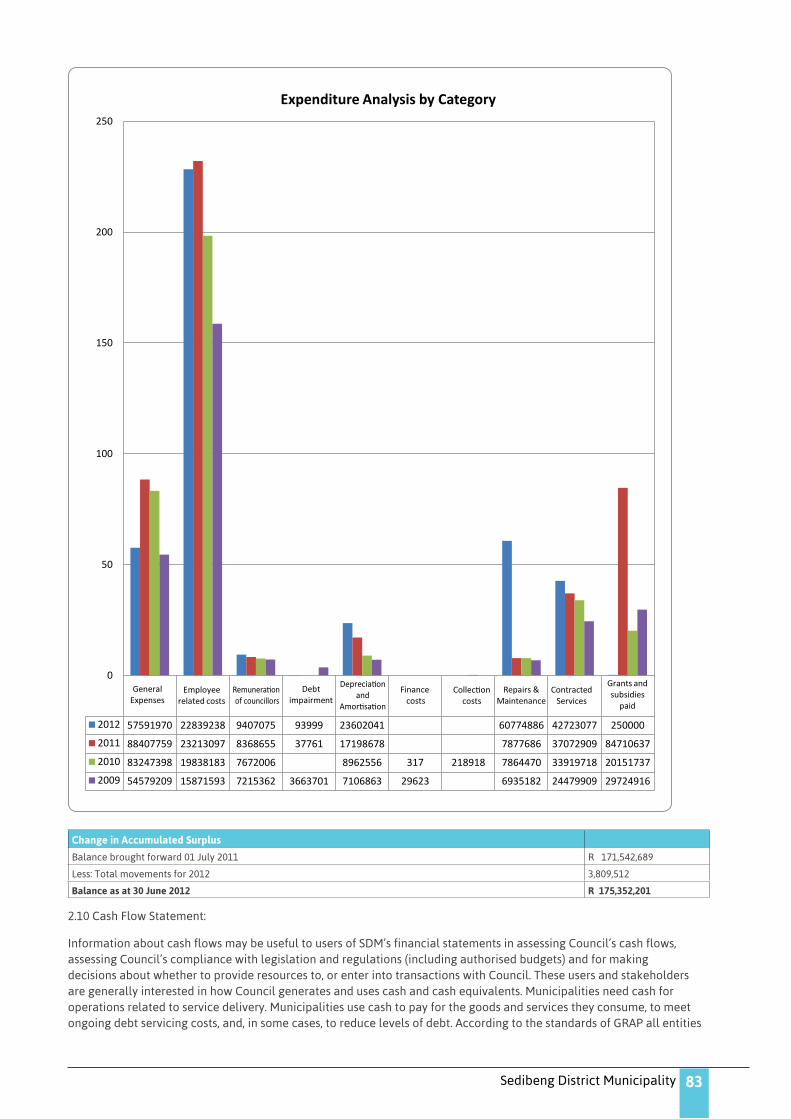
2.8 Operating Expenses:
Expenses are decreases in economic benefits or service potential during the reporting period in the form of outflows or consumption of assets or incurrence of liabilities that result in decreases in net assets. Operating expenses were divided into ten categories:
Category Description Definition
General Expenses Those expenses directly relating to revenue production and service delivery
Employee Related Costs Labour related costs
Remuneration of Councillors Costs related to Public Office Bearers allowances as per the Upper Limits gazetted
Debt ImpairmentThe process of reducing a current asset by the amount by which the carrying amount of the cur -rent asset (debtor) exceeds its recoverable amount
Depreciation &AmortisationThe systematic allocation of the depreciable amount of an asset over its useful life with depre -ciable amount being the cost of an asset, or other amount substituted for cost, less its residual value
Finance Costs Expenses that reflect the price of purchasing goods, services and financial instruments
Collection Costs Costs related to the application of Council’s credit control & debt collection policy
Repairs & Maintenance Costs related to the day -to -day servicing of Council’s property, plant & equipment
Contracted Services Expenses related to the engagement of external service providers for the performance of a knowledge -based expertise specialty function
Grants & Subsidies Paid Government grants & subsidies paid as per DoRA allocations and MTREF
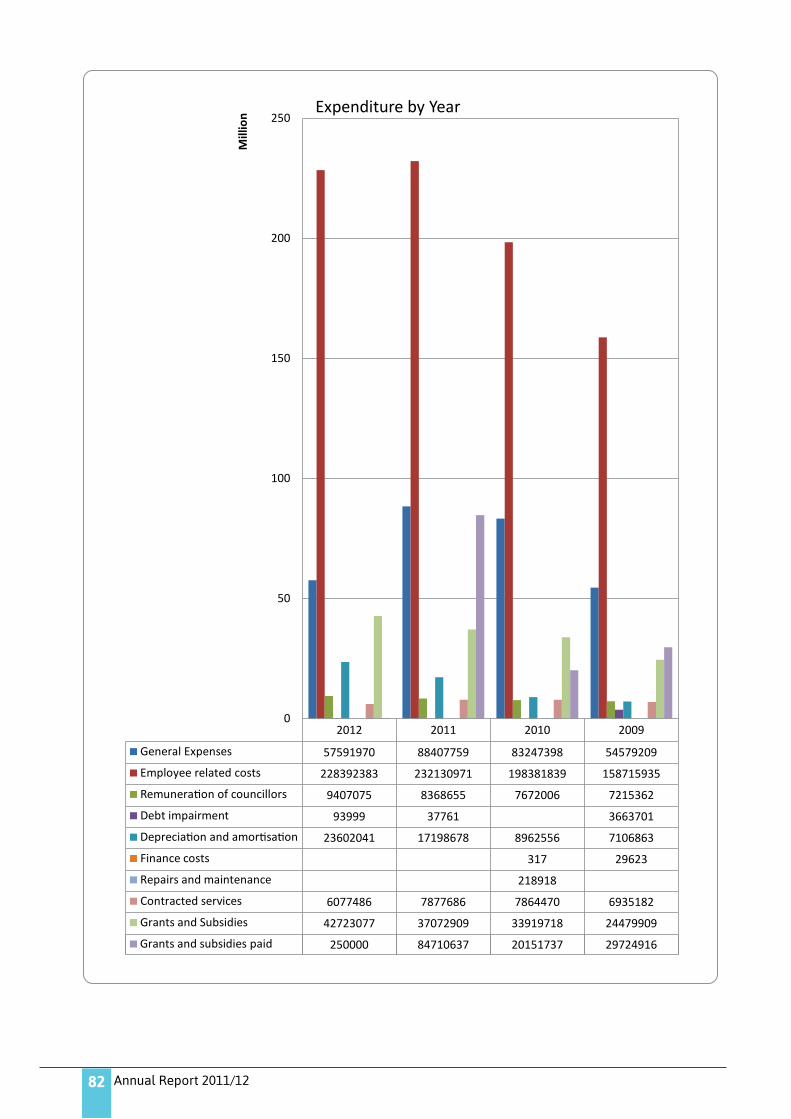
2012 2011 2010 2009 Ave
Expenditure
General Expenses 57,591,970 -54% 88,407,759 6% 83,247,398 34% 54,579,209 -4%
Employee related costs 228,392,383 -2% 232,230,971 15% 98,381,839 20% 58,715,935 11%Remuneration of council -lors
9,407,075 11% 8,368,655 8% 7,672,806 6% 7,215,362 8%
Debt impairment 93,999 60% 37,761 - 3,663,701 60%Depreciation and amor -tisation
23,602,041 27% 17,198,678 48% 8,962,556 21% 7,106,863 32%
Finance costs - - 317 -9245% 29,623 -9245%
Collection costs 218,918 100% -
Repairs and maintenance 6,077,486 -29.62% 7,877,686 0% 7,864,470 12% 6,935,182 -6%
Contracted services 42,723,077 13% 37,072,909 9% 33,919,718 28% 24,479,909 17%
Grants and subsidies paid 250,000 -33784% 84,710,637 76% 20,151,737 -48% 29,724,916 -11252%
Total Expenditure 368,138,031 -29% 475,905,056 24% 360,419,759 19% 292,450,700 5%
2.8.1 General Expenses
81Sedibeng District Municipality
Council has made a concerted effort to reduce operating expenses by implementing cost cutting and containment practices. This has resulted in a 54% decrease in general expenses from the previous reporting year (2011) to the one under review (2012).
2.8.2 Employee Related Costs
Although the average increase in salaries and contributions to benefits has been 11% for the past four financial years, the decrease for 2012 was as a result of the moratorium on placements, demonstrating that cost containment exercises have been proving successful.
2.8.3 Debt Impairment
Debt impairment is assessed and recommended on an ad -hoc basis as each case is reviewed and evaluated individually according to the debtor’s specific circumstances as per Council’s credit control and debt collection policy.
The motivations for the recommendation are tabled accordingly to Council for their approval prior to any write -off’s.
2.8.4 Depreciation and Amortisation
Depreciation costs are transacted on a straight -line method as per the accounting policies and have increased by an average of 32% for the last four years due to the average increase of 11% (refer to Statement of Financial Position) in Council non -current asset acquisitions.
2.8.5 Finance Costs
No finance costs for the reporting period due to the discontinuation of Council long -term liabilities.
2.8.6 Collection Costs
No collection costs incurred due to the repeal of RSC levies and write -off of outstanding balances.
2.8.7 Repairs & Maintenance
Although repairs & maintenance costs have decreased by an average of 6% over the last four financial years, the decrease in 2012 of 29.62% was well below the average at an indicator of 0,17%. This further indicates that Council has been unable to implement routine repairs & maintenance on Council -owned assets in recent financial periods due to the financial constraints imposed by the global financial crisis of 2009.
2.8.8 Contracted Services
There was a 13% increase in 2012 for contracted services and an average increase of 17% over the last four financial years. All contracts entered into by Council are reviewed thoroughly by Corporate Services: Legal and approved by the Municipal Manager.
2.8.9 Grants & Subsidies Paid
Grants & subsidies of R250 000 was paid to Emfuleni Local Municipality in the 2012 financial year. No Assets under construction will be transferred in the current financial year until a proper evaluation of where the asset belongs based on functions is performed. This was a sharp decrease against 2011 and is due to the several completed construction projects that were handed over to local municipalities in 2011.
2.9 Statement of Changes in Net Assets:
The purpose of this statement is to disclose transactions impacting on the components of community wealth (net assets) included in the statement of financial position. These transactions may include adjustments and movements to and from reserves. These reserves comprise of the Government Grant reserve, the Re -valuation Reserve and the Accumulated Surplus. This statement reports on changes in Council’s net assets between two reporting dates by reflecting the increase or decrease in its net assets during the period.
The overall change in net assets represents the total net surplus/deficit for the period, other revenues and expenses recognised directly as changes in net assets.
82 Annual Report 2011/12
83Sedibeng District Municipality
Change in Accumulated Surplus
Balance brought forward 01 July 2011 R 171,542,689
Less: Total movements for 2012 3,809,512
Balance as at 30 June 2012 R 175,352,201
2.10 Cash Flow Statement:
Information about cash flows may be useful to users of SDM’s financial statements in assessing Council’s cash flows, assessing Council’s compliance with legislation and regulations (including authorised budgets) and for making decisions about whether to provide resources to, or enter into transactions with Council. These users and stakeholders are generally interested in how Council generates and uses cash and cash equivalents. Municipalities need cash for operations related to service delivery. Municipalities use cash to pay for the goods and services they consume, to meet ongoing debt servicing costs, and, in some cases, to reduce levels of debt. According to the standards of GRAP all entities
84 Annual Report 2011/12
are required to present a cash flow statement.
Benefits of cash flow information
• Information about the cash flows of an entity is useful in assisting users to predict the future cash requirements of the entity, its ability to generate cash flows in the future and fund changes in the scope and nature of its activities. A cash flow statement also provides a means by which an entity can discharge its accountability for cash inflows and cash outflows during the reporting period.
• A cash flow statement, when used in conjunction with other financial statements, provides information that enables users to evaluate the changes in net assets (net worth) of an entity, its financial structure (including its liquidity and solvency) and its ability to affect the amounts and timing of cash flows in order to adapt to changing circumstances and opportunities. It also enhances the comparability of the reporting of operating performance by different entities, because it eliminates the effects of using different accounting treatments for the same transactions, other events and conditions.
• Historical cash flow information is often used as an indicator of the amount, timing and certainty of future cash flows. It is also useful in checking the accuracy of past assessments of future cash flows.
2.11 Financial Ratio Analysis:
The application of financial ratio analysis enables and informs our public office bearers and stakeholders decision making with regards to:
• Ability to meet long -term commitments;• Ability to meet short -term commitments from liquid resources;• Determine whether investments are yielding acceptable returns;• Reduce risks arising from below average performance; and• Make recommendations to address challenges.
Advantages Disadvantages
Communicate aspects of an entity's overall economic situation more broadly and succinctly than financial statement data alone
Distort comparisons by over -reliance on book values rather than mar -ket values
Facilitate understanding how certain variables may influence each other
Involve comparative norms which are statistically unreliable due to bias and/or small sample size
Help determine a variety of financial aspects Be difficult to obtain for use in public sector auditing
Lead to misleading conclusions if viewed out of context
Ignore unique factors which make municipalities fundamentally incom -parable
It must be noted by the Committee that ratio analysis is not as widespread in government as in private sector as generally no applicable ratios have been developed for the purpose of use at (local) government level as each municipality differs in political and economic climates, demographics, missions, values and goals based on their unique individual nature and community needs. The ratios applied in this analysis were selected based on their usefulness in being able to indicate to Council factors & conditions which may lead to poor financial circumstances.
2.8.10 Current Position
These ratios focus on working capital and serve as supplements to the statements of financial performance and cash flow.

85Sedibeng District Municipality
Ratio Equation Calculation 2012 2011 2010 2009 Indication
Ratios that measure Council’s ability to pay short -term obligations
Acid Test =
0.29 0.74 2.28 2.57
A decrease of 155% against the previous year demon -strates a decline in Council’s ability to meet its current financial obligations.
Current Ratio
=
0.82 0.75 2.85 3.07
A increase of 9% against the previous year demonstrates an improvement in Council’s ability to meet its current financial obligations.
Ratios measuring Council’s activity
Ave. collection period for Accounts Receivables
=
25.56 152.22 72.63 12.60
A 72% decrease in the no. of average days taken to recover A/R shows a increase in Coun -cil’s position to recover debt quickly.
Inventory turnover
=
77.04 44.78 81.57 233.37
A increase of 42% in turnover demonstrates that Council has implement measures to optimize on sales for the reporting year.
2.8.11 Equity Position
Ratios that measure long -term solvency of Council and its capacity to generate and obtain investment resources.
Ratio Equation Calculation 2012 2011 2010 2009 Indication
Creditors’ Equity to Total Assets
=
0.26 0.35 0.17 0.20
A decrease of 35% indicates that Council’s liabilities are decreasing against Council’s assets.
Debt to Net Worth Ratio
=
0.35 0.54 0.21 0.24
A decrease of 54% indicates that Council’s liabilities are decreasing against Council’s net worth (net assets) due to the increase of Council’s total assets base.
2.8.12 Economic Vitality and Financial Viability
Ratio 2012 2011 2010 2009 Indication
= 0.51 0.29 0.37 0.19
This ratio is an indicator that Council’s dependency on Grants & Subsidies has increased by 43% from the previous financial year as only a fifth of total expenditure is funded by internally generated revenue
Soundness of Financial Management Practices
Ratio 2012 2011 2010 2009 Indication
=
0.02 -0.67 0.03 0.38
Due to Council’s reducing short -term investment balances, Council’s ability to generate income from interest re -ceived on investment has decreased as opposed to 2011.
86 Annual Report 2011/12
3 EXPRESSION OF APPRECIATION
Allow me this opportunity to convey my sincere gratitude and appreciation to His Worship the Honourable Executive Mayor, Members of the Mayoral Committee, The Chairperson and Members of the Finance Portfolio Committee, The Audit Committee, The Municipal Manager, The Chief Operations Officer and my Fellow Executive Directors for their support and cooperation during the year under review.
I also wish to convey a special word of appreciation to the staff responsible for the compilation of the annual financial statements for their dedication, as well as to all finance staff for their support.
I further wish to express my gratitude to the staff of the Office of the Auditor -General for their assistance, professionalism and support during the year.
Yours in good governance,
BRENDON SCHOLTZ
CHIEF FINANCIAL OFFICER
The sections 5.2 to 5.11 have been covered in the CFO’s Overview above
5.2 GRANTS
5.3 ASSET MANAGEMENT
5.4 FINANCIAL RATIOS BASED ON KEY PERFORMANCE INDICATORS
COMPONENT B: SPENDING AGAINST CAPITAL BUDGET
5.5 CAPITAL EXPENDITURE
5.6 SOURCES OF FINANCE
5.7 CAPITAL SPENDING ON 5 LARGEST PROJECTS
5.8 BASIC SERVICE AND INFRASTRUCTURE BACKLOGS– OVERVIEW
COMPONENT C: CASH FLOW MANAGEMENT AND INVESTMENTS
5.9 CASH FLOW
5.10 BORROWING AND INVESTMENTS
5.11 PUBLIC PRIVATE PARTNERSHIPS
COMPONENT D: OTHER FINANCIAL MATTERS
87Sedibeng District Municipality
5.12 SUPPLY CHAIN MANAGEMENT
Adoption and amendment of Supply Chain Management Policy
The Local Government: Municipal Finance Management Act (Act 56 of 2003) requires the municipality to have and implement a Supply Chain Management Policy (SCM Policy) which gives effect to the provisions of Part 1 of Chapter 11 of the Act that deals with ‘Supply Chain Management’.
In addition, the Preferential Procurement Policy Framework Act (Act 5 of 2000) requires an organ of state to determine its Preferential Procurement Policy and to implement it within the framework prescribed.
On the 30th May 2005 the Municipal Supply Chain Management Regulations were issued in terms of Government Gazette Number 27636. Sedibeng District Municipality complies with the provisions of these regulations. The SCM Policy has been approved by Council on the 30th January 2012 and the set of applicable system of delegations was approved with the previous SCM Policy on the 08th December 2008.
Oversight role of the council of the municipality
Although Section 117 of the MFMA prohibits a Councilor from being a member of a bid committee or any other committee evaluating or approving quotations and/or bids, the Council has an oversight role to ensure that the Accounting Officer implements all supply chain management activities in accordance with the approved policy.
The Executive Mayor must provide general political guidance over the fiscal and financial affairs of the SDM and may monitor and oversee the exercises of responsibilities assigned to the Accounting Officer and the Chief Financial Officer in terms of MFAM.
There are no Councillors who are members of any bid committees or who participate in the supply chain management processes at Sedibeng District Municipality.
Training of Supply Chain Management Officials
National Treasury has issued Guidelines for Municipal Competency Levels for Heads of Supply Chain Management and Supply Chain Management; these guidelines have been issued in terms of Municipal Regulations on Minimum Competency Levels.
For the purpose of competency regulations, the financial and supply chain management skills required of officials have been categorized into 11 (eleven) competency areas, they are:
• Strategic leadership and management
• Strategic Financial management
• Operational Financial Management
• Governance, ethics and values in financial management;
• Financial and performance reporting
• Risk and change management
• Project Management
• Legislation, policy and implementation
• Stakeholder relations
• Supply chain management
• Audit and assurance
SCM Heads must be competent in the Unit Standards prescribed in regulation 11 for 8 (eight) of the 11 (eleven) competency areas. SCM Managers must be competent in the Unit Standards prescribed in regulation 12 for 6 (six) of the eleven competency areas.
The Director: Supply Chain Management, Assistant Manager: Demand and Acquisition Management and Supply Chain Management Specialist: Logistics Management complies with these minimum competency levels. All other five officials will be enrolled with the South African Institute of Chartered Accountants for this programme.

88Sedibeng District Municipality
Past audit queries and remedial actions taken:
1. Three quotations not being obtained. SCM unit uses an automated system to request quotations from 9 suppliers at the time, on rotational basis. An attempt is made at all times to obtain 3 quotations, in the case where three quotations cannot be obtained, reasons are recorded and reported to the Chief Financial Officer.
2. Non-disclosure of deviations from supply chain management proceduresA deviation template to record all deviations has been developed. All deviations are reported to council on monthly basis and annual deviations are disclosed as a note on the annual financial statements.
3. Non-declaration of business, commercial and other financial interests by councillors and officialsDeclarations of interests by officials are the responsibility of Human Resources Department and the Office of the Speaker is responsible to handle declarations of interests by councillors. Supply Chain Unit can only support the two departments.
T 5.12.1
5.13 GRAP COMPLIANCE
The annual financial statements have been prepared in accordance with Standards of Generally Recognised Accounting Practices (GRAP).
The annual financial statements are based upon appropriate accounting policies consistently applied and supported by reasonable and prudent judgments and estimates.
The accounting officer acknowledges that he is ultimately responsible for the system of internal financial control established by the municipality and place considerable importance on maintaining a strong control environment. To enable the accounting officer to meet these responsibilities, the accounting officer sets standards for internal control aimed at reducing the risk of error or loss in a cost effective manner.
The standards include the proper delegation of responsibilities within a clearly defined framework, effective accounting procedures and adequate segregation of duties to ensure an acceptable level of risk. These controls are monitored throughout the municipality and all employees are required to maintain the highest ethical standards in ensuring the municipality’s business is conducted in a manner that in all reasonable circumstances is above reproach. The focus of risk management in the municipality is on identifying, assessing, managing and monitoring all known forms of risk across the municipality. While operating risk cannot be fully eliminated, the municipality endeavours to minimise it by ensuring that appropriate infrastructure, controls, systems and ethical behaviour are applied and managed within predetermined procedures and constraints.
The accounting officer is of the opinion, based on the information and explanations given by management that the system of internal control provides reasonable assurance that the financial records may be relied on for the preparation of the annual financial statements. However, any system of internal financial control can provide only reasonable, and not absolute, assurance against material misstatement or loss.
The accounting officer has reviewed the municipality’s cash flow forecast for the year to 30 June 2013 and, in the light of this review and the current financial position, he is satisfied that the municipality has or has access to adequate resources to continue in operational existence for the foreseeable future.
T 5.13

89Sedibeng District Municipality
CHAPTER 6 – AUDITOR GENERAL AUDIT FINDINGS
INTRODUCTION
Note: The Constitution S188 (1) (b) states that the functions of the Auditor -General includes the auditing and reporting on the accounts, financial statements and financial management of all municipalities. MSA section 45 states that the results of performance measurement… must be audited annually by the Auditor -General.
T6.0.1
COMPONENT A: AUDITOR-GENERAL OPINION OF FINANCIAL STATEMENTSYEAR -1
6.1 AUDITOR GENERAL REPORTS Year -1 (Previous year)
Auditor-General Report on Financial Performance: Year -1
Audit Report Status*: Unqualified
Non -Compliance Issues Remedial Action Taken
Note:*The report status is supplied by the Auditor General and ranges from un -qualified (at best); to unqualified with other matters specified; qualified; adverse; and disclaimed (at worse)
T 6.1.1
Auditor-General Report on Service Delivery Performance: Year -1
Audit Report Status: Unqualified
Non -Compliance Issues Remedial Action Taken
T 6.1.2
COMPONENT B: AUDITOR-GENERAL OPINION YEAR 0 (CURRENT YEAR)
6.2 AUDITOR GENERAL REPORT YEAR 0
Auditor-General Report on Financial Performance Year 0*
Status of audit report: Unqualified
Non-Compliance Issues Remedial Action Taken
Note:* The report's status is supplied by the Auditor General and ranges from un-qualified (at best); to unqualified with other matters specified; qualified; adverse; and disclaimed (at worse). This tabb will be completed prior to the publication of the Annual report but following the receipt of the Auditor- General Report on Financial Performance Year 0.
T 6.2.1
COMMENTS ON MFMA SECTION 71 RESPONSIBILITIES:
Section 71 of the MFMA requires municipalities to return a series of financial performance data to the National Treasury at specified intervals throughout the year. The Chief Financial Officer states that these data sets have been
returned according to the reporting requirements.
Signed
T6.2.5

90 Annual Report 2011/12
Not
es t
o th
e A
nnua
l Fin
anci
al S
tate
men
tsFi
gure
s in
Ran
d 20
12
2011
39.
Stat
emen
t of
com
para
tive
and
act
ual i
nfor
mat
ion
FIN
AN
CIA
L PE
RIO
D 2
012
Ori
gina
l bud
get
Bud
get
adju
stm
ents
(i.
t.o. s
28 a
nd s
31 o
f th
e M
FMA
)Fi
nal b
udge
tA
ctua
l out
com
eV
aria
nce
Act
ual o
utco
me
as %
of
fina
l bud
get
Act
ual o
utco
me
as %
of o
rigi
nal
budg
etFi
nanc
ial P
erfo
rman
ce
Inve
stm
ent
reve
nue
7,88
5,26
02,
939,
301
2,93
9,30
12,
221,
854
717,
447
76%
28%
Tran
sfer
s re
cogn
ised
- op
erat
iona
l27
5,08
8,00
027
6,25
4,00
027
6,25
4,00
029
2,21
2,98
7(1
5,95
8,98
7)10
6%10
6%
Oth
er o
wn
reve
nue
82,8
81,6
1177
,704
,436
77,7
04,4
3678
,128
,303
(423
,867
)10
1%94
%
Tota
l rev
enue
(exc
ludi
ng c
apit
al t
rans
-fe
rs a
nd c
ontr
ibut
ions
)36
5,85
4,87
135
6,89
7,73
735
6,89
7,73
737
2,56
3,14
4(1
5,66
5,40
7)10
4%10
2%
Emp
loye
e co
sts
(242
,243
,900
)(2
29,3
69,4
06)
(229
,369
,406
)(2
28,3
92,3
83)
(977
,023
)10
0%94
%
Rem
uner
atio
n of
cou
ncill
ors
(8,8
66,4
49)
(9,6
22,1
41)
(9,6
22,1
41)
(9,4
07,0
75)
(215
,066
)98
%10
6%
Deb
t im
pai
rmen
t -
(100
,000
)(1
00,0
00)
(93,
999)
(6,0
01)
94%
%
Dep
reci
atio
n an
d as
set
imp
airm
ent
(8,0
00,0
00)
(23,
693,
552)
(23,
693,
552)
(23,
602,
041)
(91,
511)
100%
295%
Tran
sfer
s an
d gr
ants
-(8
,540
,000
)(8
,540
,000
)(2
50,0
00)
(8,2
90,0
00)
3%%
Oth
er e
xpen
ditu
re(9
4,89
0,38
7)(1
13,3
11,6
91)
(113
,311
,691
)(1
06,3
92,5
33)
(6,9
19,1
58)
94%
112%
Tota
l exp
endi
ture
(354
,000
,736
)(3
84,6
36,7
90)
(384
,636
,790
)(3
68,1
38,0
31)
(16,
498,
759)
96%
104%
Surp
lus/
(Def
icit
)11
,854
,135
(27,
739,
053)
(27,
739,
053)
4,42
5,11
3(3
2,16
4,16
6)(1
6)%
36%
Tran
sfer
s re
cogn
ised
- ca
pit
al2,
310,
000
8,34
0,00
08,
340,
000
-8,
340,
000
-% -%
Surp
lus/
(Def
icit
) for
the
yea
r14
,164
,135
(19,
399,
053)
(19,
399,
053)
4,42
5,11
3(2
3,82
4,16
6)(2
3)%
30%

91Sedibeng District Municipality
GLOSSARY Accessibility indicators Explore whether the intended beneficiaries are able to access services or outputs.
Accountability documentsDocuments used by executive authorities to give “full and regular” reports on the matters under their control to Parlia -ment and provincial legislatures as prescribed by the Constitution. This includes plans, budgets, in -year and Annual Reports.
Activities The processes or actions that use a range of inputs to produce the desired outputs and ultimately outcomes. In es -sence, activities describe "what we do".
Adequacy indicators The quantity of input or output relative to the need or demand.
Annual ReportA report to be prepared and submitted annually based on the regulations set out in Section 121 of the Municipal Finance Management Act. Such a report must include annual financial statements as submitted to and approved by the Auditor -General.
Approved Budget The annual financial statements of a municipality as audited by the Auditor General and approved by council or a provincial or national executive.
Baseline Current level of performance that a municipality aims to improve when setting performance targets. The baseline relates to the level of performance recorded in a year prior to the planning period.
Basic municipal service A municipal service that is necessary to ensure an acceptable and reasonable quality of life to citizens within that particular area. If not provided it may endanger the public health and safety or the environment.
Budget year The financial year for which an annual budget is to be approved – means a year ending on 30 June.
Cost indicators The overall cost or expenditure of producing a specified quantity of outputs.
Distribution indicators The distribution of capacity to deliver services.
Financial Statements Includes at least a statement of financial position, statement of financial performance, cash -flow statement, notes to these statements and any other statements that may be prescribed.
General Key performance indicators
After consultation with MECs for local government, the Minister may prescribe general key performance indicators that are appropriate and applicable to local government generally.
Impact The results of achieving specific outcomes, such as reducing poverty and creating jobs.
Inputs All the resources that contribute to the production and delivery of outputs. Inputs are "what we use to do the work". They include finances, personnel, equipment and buildings.
Integrated Development Plan (IDP) Set out municipal goals and development plans.
National Key performance areas
• Service delivery & infrastructure• Economic development • Municipal transformation and institutional development • Financial viability and management• Good governance and community participation
OutcomesThe medium -term results for specific beneficiaries that are the consequence of achieving specific outputs. Outcomes should relate clearly to an institution's strategic goals and objectives set out in its plans. Outcomes are "what we wish to achieve".
OutputsThe final products, or goods and services produced for delivery. Outputs may be defined as "what we produce or deliver". An output is a concrete achievement (i.e. a product such as a passport, an action such as a presentation or im -munization, or a service such as processing an application) that contributes to the achievement of a Key Result Area.
Performance IndicatorIndicators should be specified to measure performance in relation to input, activities, outputs, outcomes and impacts. An indicator is a type of information used to gauge the extent towhich an output has been achieved (policy developed, presentation delivered, service rendered)
Performance Information Generic term for non -financial information about municipal services and activities. Can also be used interchangeably with performance measure.
Performance Standards:
The minimum acceptable level of performance or the level of performance that is generally accepted. Standards are informed by legislative requirements and service -level agreements. Performance standards are mutually agreed cri -teria to describe how well work must be done in terms of quantity and/or quality and timeliness, to clarify the outputs and related activities of a job by describing what the required result should be. In this EPMDS performance standards are divided into indicators and the time factor.
Performance Targets:The level of performance that municipalities and its employees strive to achieve. Performance Targets relate to current baselines and express a specific level of performance that a municipality aims to achieve within a given time period.
Service Delivery Budget Imple -mentation Plan
Detailed plan approved by the mayor for implementing the municipality’s delivery of services; including projections of the revenue collected and operational and capital expenditure by vote for each month. Service delivery targets and performance indicators must also be included.
Vote:
One of the main segments into which a budget of a municipality is divided for appropriation of money for the different departments or functional areas of the municipality. The Vote specifies the total amount that is appropriated for the purpose of a specific department or functional area. Section 1 of the MFMA defines a “vote” as:a) one of the main segments into which a budget of a municipality is divided for the appropriation of money for the different departments or functional areas of the municipality; andb) which specifies the total amount that is appropriated for the purposes of the department or functional area con -cerned
Sedibeng District Municipality
Appendices
92
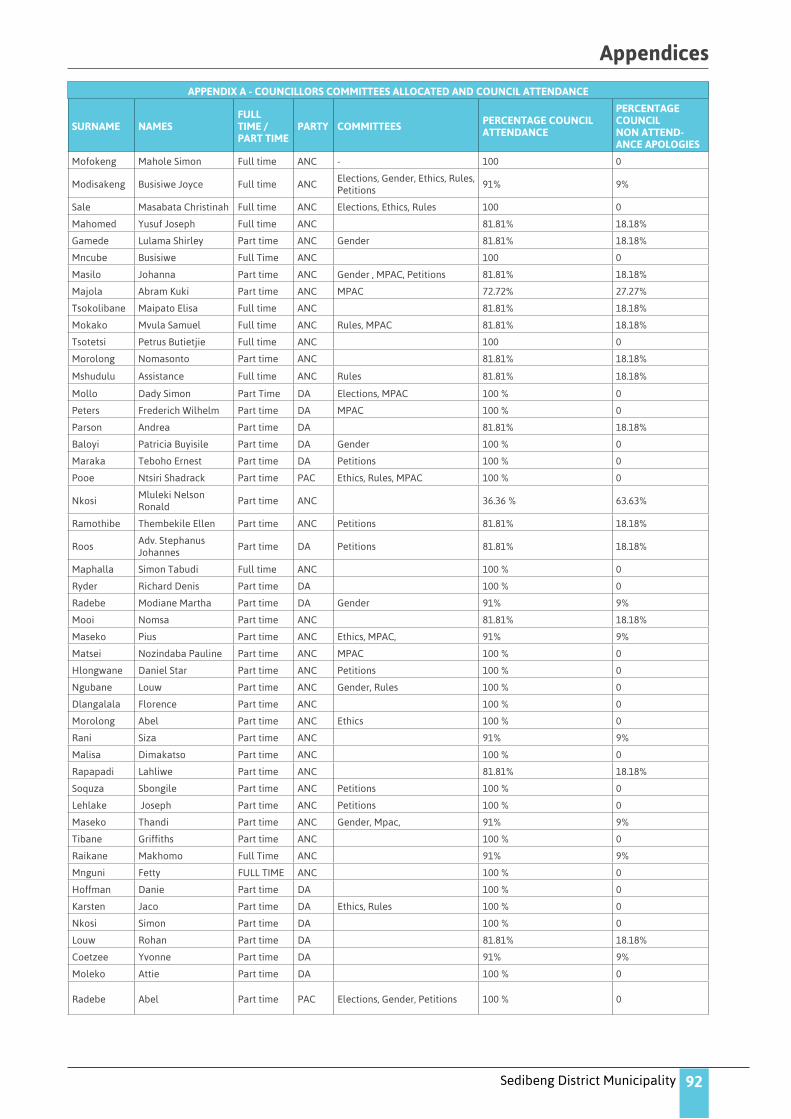
SURNAME NAMESFULL TIME /PART TIME
PARTY COMMITTEES PERCENTAGE COUNCIL ATTENDANCE
PERCENTAGE COUNCILNON ATTEND-ANCE APOLOGIES
Mofokeng Mahole Simon Full time ANC - 100 0
Modisakeng Busisiwe Joyce Full time ANCElections, Gender, Ethics, Rules, Petitions
91% 9%
Sale Masabata Christinah Full time ANC Elections, Ethics, Rules 100 0
Mahomed Yusuf Joseph Full time ANC 81.81% 18.18%
Gamede Lulama Shirley Part time ANC Gender 81.81% 18.18%
Mncube Busisiwe Full Time ANC 100 0
Masilo Johanna Part time ANC Gender , MPAC, Petitions 81.81% 18.18%
Majola Abram Kuki Part time ANC MPAC 72.72% 27.27%
Tsokolibane Maipato Elisa Full time ANC 81.81% 18.18%
Mokako Mvula Samuel Full time ANC Rules, MPAC 81.81% 18.18%
Tsotetsi Petrus Butietjie Full time ANC 100 0
Morolong Nomasonto Part time ANC 81.81% 18.18%
Mshudulu Assistance Full time ANC Rules 81.81% 18.18%
Mollo Dady Simon Part Time DA Elections, MPAC 100 % 0
Peters Frederich Wilhelm Part time DA MPAC 100 % 0
Parson Andrea Part time DA 81.81% 18.18%
Baloyi Patricia Buyisile Part time DA Gender 100 % 0
Maraka Teboho Ernest Part time DA Petitions 100 % 0
Pooe Ntsiri Shadrack Part time PAC Ethics, Rules, MPAC 100 % 0
NkosiMluleki Nelson Ronald
Part time ANC 36.36 % 63.63%
Ramothibe Thembekile Ellen Part time ANC Petitions 81.81% 18.18%
RoosAdv. Stephanus Johannes
Part time DA Petitions 81.81% 18.18%
Maphalla Simon Tabudi Full time ANC 100 % 0
Ryder Richard Denis Part time DA 100 % 0
Radebe Modiane Martha Part time DA Gender 91% 9%
Mooi Nomsa Part time ANC 81.81% 18.18%
Maseko Pius Part time ANC Ethics, MPAC, 91% 9%
Matsei Nozindaba Pauline Part time ANC MPAC 100 % 0
Hlongwane Daniel Star Part time ANC Petitions 100 % 0
Ngubane Louw Part time ANC Gender, Rules 100 % 0
Dlangalala Florence Part time ANC 100 % 0
Morolong Abel Part time ANC Ethics 100 % 0
Rani Siza Part time ANC 91% 9%
Malisa Dimakatso Part time ANC 100 % 0
Rapapadi Lahliwe Part time ANC 81.81% 18.18%
Soquza Sbongile Part time ANC Petitions 100 % 0
Lehlake Joseph Part time ANC Petitions 100 % 0
Maseko Thandi Part time ANC Gender, Mpac, 91% 9%
Tibane Griffiths Part time ANC 100 % 0
Raikane Makhomo Full Time ANC 91% 9%
Mnguni Fetty FULL TIME ANC 100 % 0
Hoffman Danie Part time DA 100 % 0
Karsten Jaco Part time DA Ethics, Rules 100 % 0
Nkosi Simon Part time DA 100 % 0
Louw Rohan Part time DA 81.81% 18.18%
Coetzee Yvonne Part time DA 91% 9%
Moleko Attie Part time DA 100 % 0
Radebe Abel Part time PAC Elections, Gender, Petitions 100 % 0
APPENDIX A - COUNCILLORS COMMITTEES ALLOCATED AND COUNCIL ATTENDANCE

Annual Report 2011/12
Appendices
93
APPENDIX B – COMMITTEES ANDCOMMITTEE PURPOSES
COMMITTEE PURPOSE
Gender Committee Oversight
Elections Committee Oversight
Rules Committee Oversight
Ethics Committee Oversight
Petitions Committee Oversight
Audit Committee Oversight
MPAC Oversight
Remuneration Committee Oversight
Mayoral Committee Oversight
Council Oversight
8 Section 80 Portfolio Committees Oversight
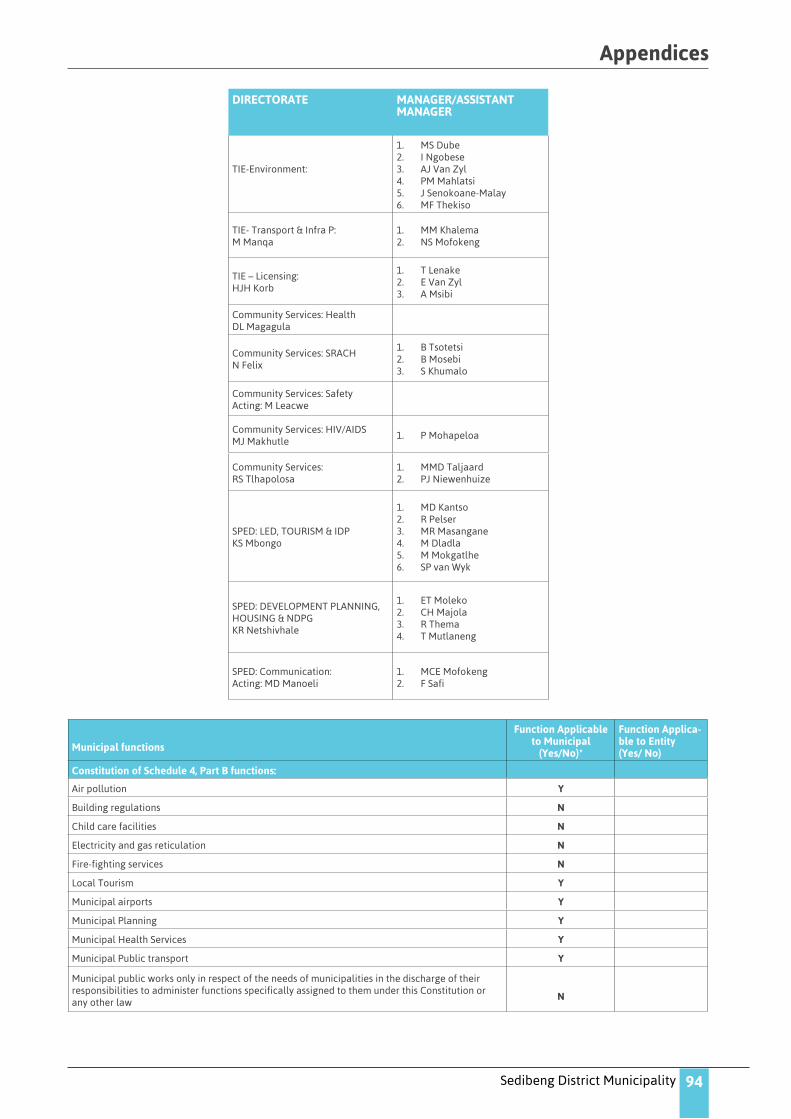
APPENDIX C –THIRD TIER ADMINISTRATIVE STRUCTURE
DIRECTORATE MANAGER/ASSISTANT MANAGER
Mayor Admin:AM Mapetla
1. TN Ndaba2. TM Sebusi
Speaker Admin:TJ Tsoho
1. TT Maleka2. HM Mpontshane (Acting)3. RTP Morobe
Office of the Chief Whip:SJ Dhlamini
COO’s office:1. MB Masibihlele2. FM Mathe
Financial Management:CE Steyn
1. A Lubbe2. VT Mokoari3. KZ Kowlessar
Supply Chain Management:TM Tsie
1. NS Mmbidi
Coorporate Services:GR Deyzel
Human Resources:MW Ramotsedisi
1. TS Maloka2. SBB Taunyane3. Pl Modimoeng4. MI Kolokoto5. LM Nkele
Legal:NP Shembe
1. N Tshabalala2. MT Ngake
Facilities:LB Khumalo
1. BW Johnson2. AL Hlongwane (on suspen -
sion)3. Maranda (Acting Manager)
Utilities:WT Molato
1. TJ Tsotetsi
IT:Y Chamda
1. MC Visagie2. HAJ Mans3. AM O’Kelly
Sedibeng District Municipality
Appendices
94
DIRECTORATE MANAGER/ASSISTANT MANAGER
TIE -Environment:
1. MS Dube2. I Ngobese3. AJ Van Zyl4. PM Mahlatsi5. J Senokoane -Malay6. MF Thekiso
TIE - Transport & Infra P:M Manqa
1. MM Khalema2. NS Mofokeng
TIE – Licensing:HJH Korb
1. T Lenake2. E Van Zyl3. A Msibi
Community Services: HealthDL Magagula
Community Services: SRACHN Felix
1. B Tsotetsi2. B Mosebi3. S Khumalo
Community Services: SafetyActing: M Leacwe
Community Services: HIV/AIDSMJ Makhutle
1. P Mohapeloa
Community Services: RS Tlhapolosa
1. MMD Taljaard2. PJ Niewenhuize
SPED: LED, TOURISM & IDPKS Mbongo
1. MD Kantso2. R Pelser3. MR Masangane4. M Dladla5. M Mokgatlhe6. SP van Wyk
SPED: DEVELOPMENT PLANNING, HOUSING & NDPGKR Netshivhale
1. ET Moleko2. CH Majola3. R Thema4. T Mutlaneng
SPED: Communication:Acting: MD Manoeli
1. MCE Mofokeng2. F Safi
Municipal functions
Function Applicable to Municipal
(Yes/No)*
Function Applica-ble to Entity(Yes/ No)
Constitution of Schedule 4, Part B functions:
Air pollution Y
Building regulations N
Child care facilities N
Electricity and gas reticulation N
Fire -fighting services N
Local Tourism Y
Municipal airports Y
Municipal Planning Y
Municipal Health Services Y
Municipal Public transport Y
Municipal public works only in respect of the needs of municipalities in the discharge of their responsibilities to administer functions specifically assigned to them under this Constitution or any other law
N

Annual Report 2011/12
Appendices
95
Municipal functions
Function Applicable to Municipal
(Yes/No)*
Function Applica-ble to Entity(Yes/ No)
Constitution of Schedule 4, Part B functions:
Pontoons, ferries, jetties, piers and harbours, excluding the regulation of international and na -tional shipping and related thereto N
Stormwater management systems in built -up areas N
Trading regulations N
Water and sanitation services limited to potable water supply systems and domestic waste -water and sewage disposal systems
N
Beaches and amusement facilities N
Billboards and the display of advertisements in public places N
Cemeteries, funeral parlours and crematories N
Cleansing N
Control of public nuisances N
Control of undertakings that sell liquor to the public N
Facilities for the accommodation, care and burial of animals N
Fencing and fences N
Licensing of dogs N
Licensing and control of undertakings that sell food to the public N
Local amenities N
Local sport facilities N
Markets Y
Municipal abattoirs Y
Municipal parks and recreation N
Municipal roads N
Noise pollution N
pounds N
Public places N
Refuse removal, refuse dumps and solid waste disposal N
street trading N
Street lighting N
Traffic and parking N
*If municipality: indicate (yes or No); *If entity: Provide name of entity TD
APPENDIX E –WARD REPORTING[NOT APPLICABLE TO SDM]
APPENDIX F – WARD INFORMATION[NOT APPlICAblE TO SDM]
APPENDIX G – RECOMMENDATIONS OF THE MUNICIPAL AUDIT COMMITTEE YEAR 0
MUNICIPAL AUDIT COMMITTEE RECOMMENDATIONS
Date of Committee Committee Recommendations During Year Recommendations adopted (Enter Yes) if not adopted (Provide explanation)
13 July 2011 (Special Audit Committee Meeting)
The following reports were presented to the Committee for approval and noting:1. Mid -Year Performance Report 2010/112. Schedule of Audit Committee Meetings 2011/123. Evaluation of the Audit Committee 2011/124. Report on the year end program for the preparation of the annual financial statements 2010/115. Progress Report on the Auditor General action plan 2010/116. Auditor General Key Controls Review Dashboard Report7. Auditor General: Audit Strategy 2010/11
Yes

Sedibeng District Municipality
Appendices
96
MUNICIPAL AUDIT COMMITTEE RECOMMENDATIONS
Date of Committee Committee Recommendations During Year Recommendations adopted (Enter Yes) if not adopted (Provide explanation)
29 August 2011 (1st Quarter Meeting)
The following reports were presented to the Committee for approval:1. Comparative Analysis Report of the unaudited Annual Financial Statements for the year ended 30 June 2011.2. Annual review of the Audit Committee Charter.3. Annual review of the Internal Audit Charter.4. 2011/12 annual Internal Audit Plan.5. Internal Audit Reports. - Application Control Review: Venus System - Strategic Planning and IDP - Financial Discipline Review - Performance against objectives Quarter 1 -4 - Follow up Audits.
Yes
09 December 2011 (2nd Quarter Meeting)
The following reports were presented to the Committee for approval:Final Management Letter for Regularity Audit Auditor -General (Deferred to next Audit Committee Meeting)Comparative Analysis Report on the audited annual finan -cial statements (Deferred to next Audit Committee Meeting).Introduction of newly appointed Internal Audit Service Provider.Internal Audit Catalyst and Audit Reports for the period July 2011 to September 2011.Enterprise Risk Management Framework and Policy (De-ferred to next Audit Committee Meeting).6. Annual Organisational Performance Report 2010/11 (Deferred to next Audit Committee Meeting).
2 Reports were adopted by the Audit Commit -tee.
4 of the 6 Reports were deferred to the next Audit Committee Meeting (26 January 2012)
26 January 2012 (3rd Quarter Meeting, Continua -tion of 2nd Quarter Meeting)
The following reports were presented to the Committee for approval:Final Management Letter for Regularity Audit Auditor -General (Deferred from 09 December 2011 Meeting)Comparative Analysis Report on the audited annual finan -cial statements (Deferred from 09 December 2011 Meeting)Annual Organisational Performance Report 2010/11 (De-ferred from 09 December 2011 Meeting)Enterprise Risk Management Framework and Policy(Deferred from 09 December 2011 Meeting)Annual Report 2010/11Action Plan on the Auditor -General Findings 2010/11
2 Reports were adopted by the Audit Committee.
3 of the 5 Reports were deferred to the next Audit Committee Meeting (10 April 2012)
10 April 2012 (4th Quarter Meeting)
The following reports were presented to the Committee for approval:
Action Plan on the Auditor -General Findings 2010/11(Deferred from 26 January 2012 Meeting)Status Report on the Annual Internal Audit Plan.Risk Assessment Report 2010/11Enterprise Risk Management Framework and Policy (De-ferred from 26 January 2012 Meeting)Electronic performance management system (ePMS) pro -gress report Annual Organisational Performance Report 2010/11 (De-ferred from 26 January 2012 Meeting)
Yes
APPENDIX H – LONG TERM CONTRACTS AND PUBLIC PRIVATE PARTNERSHIPS
Long Term Contracts (20 Largest contracts entered into for the year 2012)
No. Name of Service Provider (Entity or Municipal Department)
Description of Ser-vices Rendered by the Service Provider
Start Date of Contract
Expiry date of Contract Project Manager Contract Value
(R)
1 AXTON MATRIX CONSTRUCTIONConstruction of consti -tutional walk. Bid no: 8/2/4/8 -2009
07 March 2011 21 May 2012 Robert Thema R 19 313 276.42

Annual Report 2011/12
Appendices
97
Long Term Contracts (20 Largest contracts entered into for the year 2012)
No. Name of Service Provider (Entity or Municipal Department)
Description of Ser-vices Rendered by the Service Provider
Start Date of Contract
Expiry date of Contract Project Manager Contract Value
(R)
2FUTURIS GUARDING SYSTEMS (PTY)LTD
Provision of Security to SDM for 3 years Bid no:8/2/2/25 -2012
13 March 2010 12 March 2013 Tilly Hlongwane R 18 391 235.59
3KLATRADE 470 PTY(LTD) T/A SECURELINK
Supply, Installation and commissioning of an integrated CCTV street surveillance system. Bid no: 8/2/5/4 -2008
15 June 2009 14 June 2012 MalehoLeacwe
R 17 426 111.60proposal for Supply, deliver, Install, Test and commission a fibre optic cabling solution. Bid no; 8/2/2/15 -2011
13 April 2011 12 April 2013 Andre Mans
4 KAMO BUSINESS ENTERPRISES CC
Additions, Alterations, repairs and renova -tions to Sharpeville community hall cnrZwane and Seiso Street sharpeville. Bid no: 8/2/6/1 -2012
28 August 2010 27 August 2011 Charity R 5 467 433.00
5LE -NASH INTERNATIONAL INVEST -MENTS CC T/A LE -NASH S
Supply and erection of warning, regulatory and directional signs posting for Emfuleni Local Municipality. Bid no: 8/2/4/13 -2009
09 November 2010
08 December 2011 SorriousManele R 4 903 156.45
6BOKANA CONTRUCTION & PRO -JECTS
Proposal for facilita -tion and supervision of five (5) taxi ranks in the Emfuleni Local Municipality
01 October 201030 September 2013
PhindileZwane R 3 363 021.31
7 HALIFAX SUPPLIES CCUpgrading of Sharpe -ville Exhibition Centre. Bid no: 8/2/4/5 -2009
13 April 2010 20 June 2011 Robert Thema R 2 980 696.37
8 VEREENIGING TRUST (PTY) LTDRental for Office Space at Vaal Value Warehouse
01 December 2010
Month to month until March 2013
JabuKumalo R 2 973 814.06
9LATERAL UNISON INSURANCE BROKERS (PTY)LTD
Proposal for Short Term Insurance Brokers for Sedibeng District Municipality. 8/2/
01 February 2010 30 June 2012 Andre Lubbe R 2 837 478.39
10AKHILE MANAGEMENT AND CON -SULTING (PTY) LTD
Proposals for Perfor -mance Management System for Sedibeng District Municipality. Bid no: 8/2/1/2 -2011 (Re -advert)
15 November 2011
30 -Aug -13 MotsumiMathe R 1 999 981.27
Development of fund -ing and tariff model for the district and 3 local municipalities
31 January 2012 24 July 2012 KajalKowlessar R 623 387.35
11 BLUE SANDS TRADING 106CC
Construction of Pedes -trian Paving in Evaton - Union and Boundary street.
19 July 1900 14 June 2012MarriousS -choombee
R 2 048 423.14

Sedibeng District Municipality
Appendices
98
Long Term Contracts (20 Largest contracts entered into for the year 2012)
No. Name of Service Provider (Entity or Municipal Department)
Description of Ser-vices Rendered by the Service Provider
Start Date of Contract
Expiry date of Contract Project Manager Contract Value
(R)
12
AMYSA STATIONERS CC Proposals for Panel of Supply and delivery of original printer cartridges to the Sedibeng District Municipality’s Infor -mation Technology Department. Bid no: 8/2/2/49 -2011
23 January 2012 22 January 2015 NnehengSehau R 1 896 158.30
SAGE COMPUTER TECHNOLOGIES (PTY) LTD
PALMERTON CARTRIDGES CC
SHOSHO INDUSTRIAL SUPPLIERS CCT/A SHO SHO SUPPLIERS
13URBAN GENESIS MANAGEMENT (PTY) LTD
Sharpeville precinct. Construction of exhi -bition hall, upgrading of cemetery & Sharp -eville hall
01 July 2009
01 May 2010, but period of contract kept on being extended
Charity Majola R 1 864 355.15
14AMTRONICS CC T/A DIAMOND CORNER
Supply and delivery of Computer Equipment, Printer and other peripherals to the Sedibeng District Mu -nicipality Information Technology Depart -ment for 3 years. Bid no: 8/2/2/112 -2012
15 April 2012 14 April 2015 CorneVisagie R 1 342 571.09
15UBUNTU BUSINESS ADVISORY & CONSULTING (PTY) LTD
Proposal for service providers to develop a long tern financial plan for Sedibeng District Municipality. Bid no:
15 January 201130 September 2011
TshwaneloMokoari R 1 315 307.62
16 RANTOA SERVICE PROVIDERS CC
Construction of pedes -trian paving in Evaton: Hamilton Street. Bid no: 8/2/4/9 -2010
01 August 2010 01 February 2011MarriousS -choombee
R 1 271 592.16
17WOZA (PTY) LTD T/A WOZA SER -VICE STATION
Supply of Petrol, Oil and Diesel to Sedibeng District Municipality's fleet management depart -ment
01 July 2008 To date David Maranda R 1 119 234.91
18 FRESHMARK SYSTEMS (PTY)LTDSoftware maintenance and support agree -ment
01 July 2006
Remain in force until terminated by either party by notice
Sylvia Loubsher R 1 078 092.30
19GLOBAL ACCESS TELECOMMUNI -CATIONS SERVICES (PTY)LTD
Proposal for the sup -ply of Audio Visual and Broadcasting Services for the IT de -partment of Sedibeng District Municipality. Bid no: 8/2/2/32 -2012
23 May 2012 23 May 2012 CorneVisagie R 846 756.20
20GEMINI MOONM TRADING T/A HARVEY WORLD TRAVEL WOODM
Panel of Travel Agency
31 March 2010 30 March 2011 SeikaneMareletse R 795 833.16

Annual Report 2011/12
Appendices
99
APPENDIX I – MUNICIPAL ENTITY/ SERVICE PROVIDER PERFORMANCE SCHEDULE[NOT AVAILABLE]
APPENDIX J – DISClOSURES OF FINANCIAl INTERESTS
All Councillors and officials of the Sedibeng District Municipality are not conducting any business with the Council. Their signed Declaration of Interest forms are filed in the Municipal Offices, thus accessible to the public.
Disclosure of Financial Interests
Period 1 July to 30 June Year 0 (Current year)
Position NameDescription of Financial interests (Persons doing business with Council)
(Nil/Or details)Speaker Councillor B.J Modisakeng N/A
Chief Whip Councillor M.C Sale N/A
Executive Mayor Councillor S.M. Mofokeng N/A
Members of Mayoral Committee
Councillor P.B.Tsotetsi N/A
Councillor S. Maphalla N/A
Councillor Y. Mahomed N/A
Councillor S.A. Mushudulu N/A
Councillor M.E. Tsokolibane N/A
Councillor B. Mncube N/A
Councillor Z. Raikane N/A
Councillor F. Mnguni N/A
Councillors Councillor B.P.Baloyi N/A
Councillor Y. Cortzee N/A
Councillor F. Dlangalala F N/A
Councillor L.S.A Gamede N/A
Councillor S Hlongwane N/A
Councillor D.C.J Hoffman N/A
Councillor A.S.J Karsten N/A
Councillor B.J Lehlake N/A
Councillor R Louw N/A
Councillor A.K Majola N/A
Councillor J.K Malindi N/A
Councillor D.M Malisa N/A
Councillor T.E Maraka N/A
Councillor P Maseko N/A
Councillor T Maseko N/A
Councillor J Masilo N/A
Councillor N Matsei N/A
Councillor S.Morolong N/A
Councillor M.S Mokako N/A
Councillor A Moleko N/A
Councillor D.S Mollo N/A
Councillor A. Morolong N/A
Councillor N.J Mooi N/A
Councillor L. Ngubane N/A
Councillor M.N.R Nkosi N/A
Councillor S Nkosi N/A
Councillor A. Parson N/A
Councillor F.W Peters N/A
Councillor N.S Pooe N/A
Councillor A Radebe N/A
Councillor M.M Radebe N/A
Councillor T.E Ramothibe N/A

Sedibeng District Municipality
Appendices
100
Disclosure of Financial Interests
Period 1 July to 30 June Year 0 (Current year)
Position NameDescription of Financial interests (Persons doing business with Council)
(Nil/Or details)Councillor S Rani N/A
Councillor L. Rapapadi N/A
Councillor S.J Roos N/A
Councillor D.R Ryder N/A
Councillor G Tibane N/A
Municipal Manager Mr Y Chamda N/A
Chief Operations Officer
Mr T.L. Mkaza N/A
Chief Financial OfficerMr B. Scholtz N/A
Other section 57 Of-ficials
Mrs M. Phiri -Khaole N/A
Mrs M. Mazibuko N/A
Mr. H. Sekoto N/A
Mr S. Manele N/A
APPENDIX K: REVENUE COLLECTION PERFORMANCE BY VOTE AND BY SOURCE
APPENDIX K (I): REVENUE COLLECTION PERFORMANCE BY VOTE
Revenue Collection Performance by Vote R’ 000
Vote Description
Year -1 Current: Year 0 Year 0 Variance
Actual OriginalBudget
AdjustedBudget Actual Original
BudgetAdjustments
Budget
Executive & Council 9 959 0 10 170 22 641 100% 55%
Budget & Treasury 263 166 896 237 455 460 225 877 072 234 101 527 -1% 4%
Corporate Service 14 622 437 18 902 427 19 453 987 15 958229 -18% -22%
Community & Social Service 34 536 119 39 119 000 46 353 195 37 047 047 -6% -25%
Transport & Infrastructure 43 268 762 58 737 984 59 579 437 60 333 081 3% 1%
Planning & Development 30 170 11 690 000 5 673 876 25 100 966 53% 77%
Total Revenue by Vote 355 634 365 905 356 948 372 563 0 0
Variances are calculated by dividing the difference between actual and original/adjustments budget by the actual. This table is aligned to MBRR table A3

Annual Report 2011/12
Appendices
101
APPENDIX K (II): REVENUE COLLECTION PERFORMANCE BY SOURCE
Revenue Collection Performance by Source R ‘000
Description
Year -1 Year 0 Year 0 Variance
Actual OriginalBudget
AdjustmentsBudget Actual Original
Budget
Adjust-mentsBudget
Property rates - - - -
Property rates - penalties 8 collection charges - - - -
Service Charges - electricity revenue - - - -
Service Charges - water revenue - - - -
Service Charges - sanitation revenue - - - -
Service Charges - refuse revenue - - - -
Service Charges - other 7 159 7 623 7 625 7 276 -5% -5%
Rentals of facilities and equipment 536 446 613 524 15% -17%
Interest earned - external investments 6 237 7 885 2 939 2 222 -255% -32%
Interest earned - outstanding debtors
Dividends received
Fines
Licences and permits 49 310 58 728 59 562 59 606 1% 0%
Agency services 6 497 6 775 6 804 6 963 3% 2%
T ransfers recognised - operational 290 229 275 088 276 254 292 213 6% 5%
Other revenue 1 486 9 180 2 970 2 598 -253% -14%
Gains on disposal of PPE 107 180 180 1 162 85% 85%
Enviromental Proctection
Total Revenue (excluding capital transfers and contributions)
361 560 365 905 356 948 372 563 1.79% 4.19%
Variances are calculated by dividing the difference between actual and original/adjustments budget by the actual. This table is aligned to MBRR table A4. T K.2
APPENDIX L: CONDITIONAL GRANTS RECEIVED: EXCLUDING MIG
Conditional Grants: excluding MIG
R’ 000
Details BudgetAdjust-mentsBudget
Actual
VarianceMajor conditions applied by donor (continue
below if necessary)Budget Adjustments
Budget
Neighbourhood Development Partnership Grant
14000000 6000000 26054063 46% 77%
OtherSpecify:

Sedibeng District Municipality
Appendices
102
HIV & AIDS 4813000 4813000 1558624 -209% -1436% 0% 3%
-209%
-1436% 0% 3%
Lotto Sport 6030000 6030000 392635
MSIG 800000 800000 800000
FMG 1250000 1250000 1288256
LED Project 1700000 1700000 0
Dept of Agricultural 270000 270000 0
Total
* This includes Neighbourhood Development Partnership Grant, Public Transport Infrastructure and Systems Grant and any other grant exclud-ing Municipal Infrastructure Grant (MIG) which is dealt with in the main report, see T 5.8.3. Variances are calculated by dividing the difference between actual and original/adjustments budget by the actual. Obtain a list of grants from national and provincial government. TL
T L.1
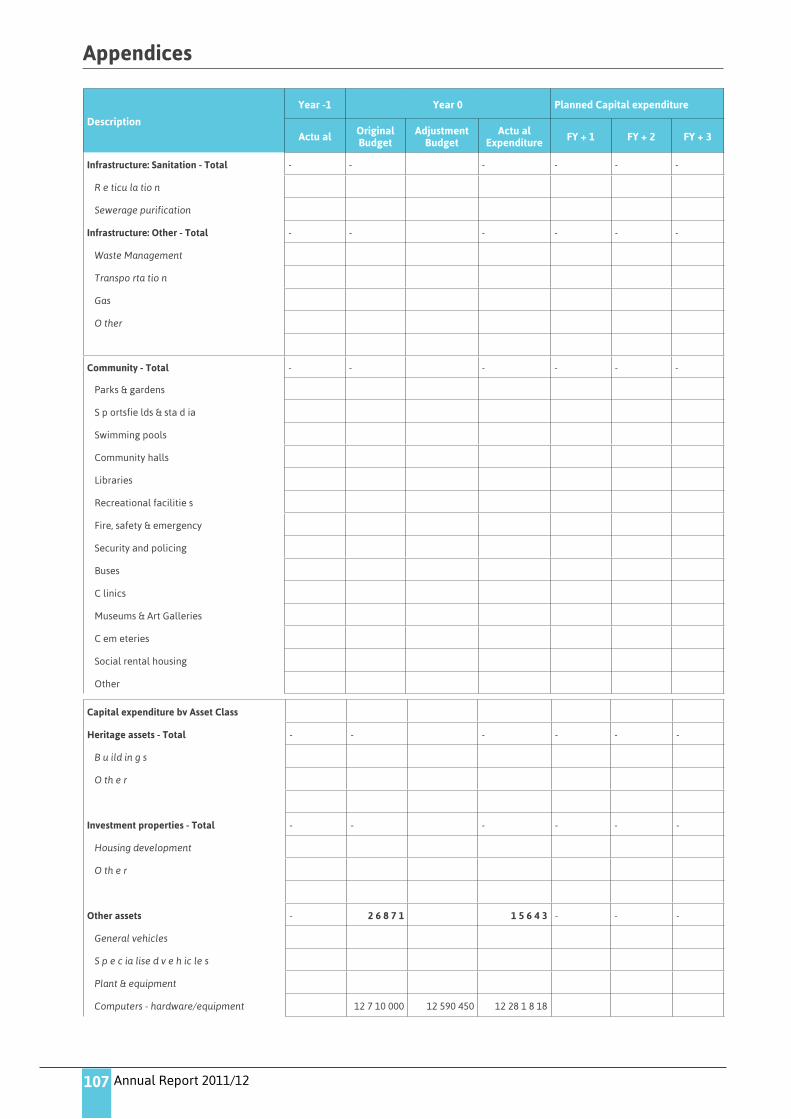
APPENDIX M: CAPITAL EXPENDITURE – NEW & UPGRADE/RENEWAL PROGRAMMES
Description
Year -1 Year 0 Planned Capital expenditure
Actu al OriginalBudget
AdjustmentBudget
Actu al Expenditure FY + 1 FY + 2 FY + 3
Capital expenditure by Asset Class
Infras tructure - Total - - - - - -
Infrastructure: Road transport - Total - - - - - -
Roads, Pavements & Bridges
Storm water
Infrastructure: Electricity - Total - - - - - -
Genera tion
Transmission & Reticulation
Street Lighting
Infrastructure: W ater - Total - - - - - -
Dams & Reservoirs
Water purification
Reticu la tion
Infrastructure: Sanitation - Total - - - - - -
R e ticu la tio n
Sewerage purification
Infrastructure: Other - Total - - - - - -
Waste Management
Transpo rta tio n
Gas
O ther
Community - Total
Parks & gardens - - - - - -
S p ortsfie lds & sta d ia
Annual Report 2011/12
Appendices
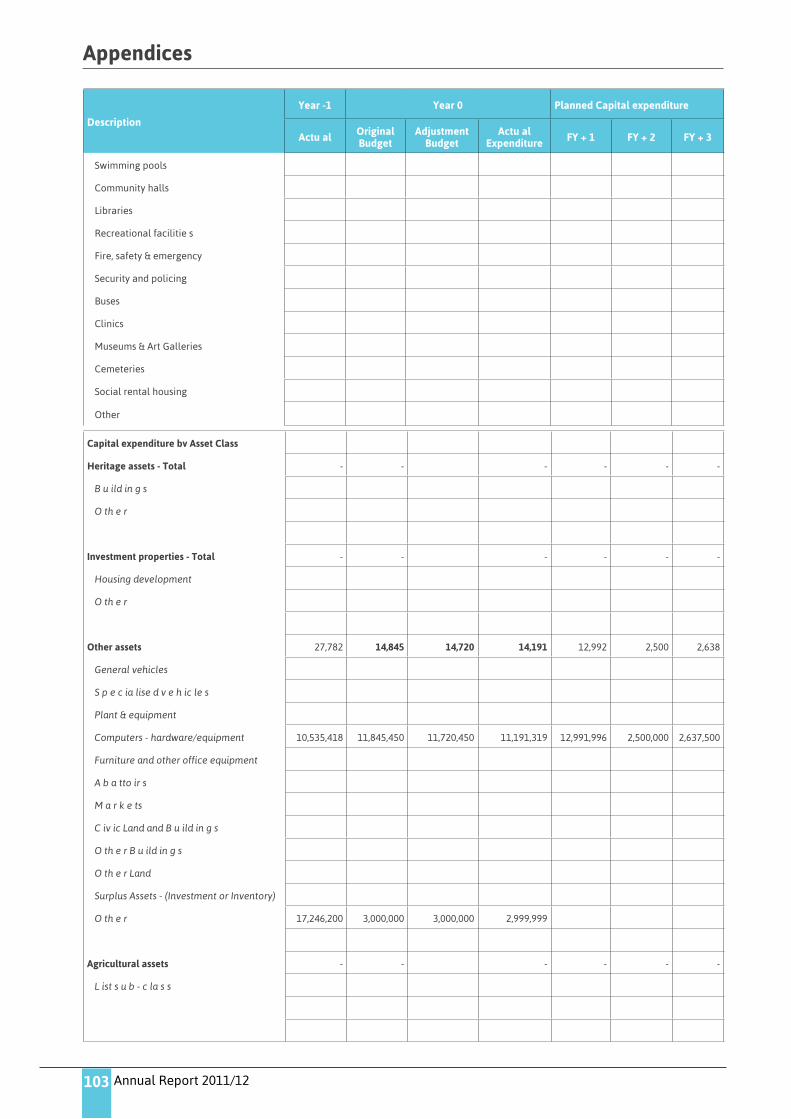
103
Description
Year -1 Year 0 Planned Capital expenditure
Actu al OriginalBudget
AdjustmentBudget
Actu al Expenditure FY + 1 FY + 2 FY + 3
Swimming pools
Community halls
Libraries
Recreational facilitie s
Fire, safety & emergency
Security and policing
Buses
Clinics
Museums & Art Galleries
Cemeteries
Social rental housing
Other
Capital expenditure bv Asset Class
Heritage assets - Total - - - - - -
B u ild in g s
O th e r
Investment properties - Total - - - - - -
Housing development
O th e r
Other assets 27,782 14,845 14,720 14,191 12,992 2,500 2,638
General vehicles
S p e c ia lise d v e h ic le s
Plant & equipment
Computers - hardware/equipment 10,535,418 11,845,450 11,720,450 11,191,319 12,991,996 2,500,000 2,637,500
Furniture and other office equipment
A b a tto ir s
M a r k e ts
C iv ic Land and B u ild in g s
O th e r B u ild in g s
O th e r Land
Surplus Assets - (Investment or Inventory)
O th e r 17,246,200 3,000,000 3,000,000 2,999,999
Agricultural assets - - - - - -
L ist s u b - c la s s

Sedibeng District Municipality
Appendices
104
Biological assets - - - - - -
L ist s u b - c la s s
Intangibles - - - - - -
Computers - software & programming
O th e r (list su b - cla s s)
Total Capital Expenditure on new assets 27,782 14,845 14,720 14,191 12,992 2,500 2,638
Specialised vehicles - - - - - -
Refuse
Fire
Conservancy
Ambulances
*Note: Information for this table may be sourced from MBRR (2009: Table SA34a) TM.1
R ‘000Capital Expenditure - Upgrade/Renewal Programme*
Description
Year -1 Year 0 Planned Capital expenditure
Actu al OriginalBudget
AdjustmentBudget
Actu al Expenditure FY + 1 FY + 2 FY + 3
Capital expenditure by Asset Class
Infras tructure - Total - - - - - -
Infrastructure: Road transport - Total - - - - - -
Roads, Pavements & Bridges
Storm water
Infrastructure: Electricity - Total - - - - - -
Genera tion
Transmission & Reticulation
Street Lighting
Infrastructure: W ater - Total - - - - - -
Dams & Reservoirs
Water purification
Reticu la tion
Infrastructure: Sanitation - Total - - - - - -
R e ticu la tio n
Sewerage purification
Infrastructure: Other - Total - - - - - -
Waste Management
Transpo rta tio n
Gas

Annual Report 2011/12
Appendices
105
R ‘000Capital Expenditure - Upgrade/Renewal Programme*
Description
Year -1 Year 0 Planned Capital expenditure
Actu al OriginalBudget
AdjustmentBudget
Actu al Expenditure FY + 1 FY + 2 FY + 3
O ther
Community - Total
Parks & gardens - - - - - -
S p ortsfie lds & sta d ia
Swimming pools
Community halls
Libraries
Recreational facilitie s
Fire, safety & emergency
Security and policing
Buses
Clinics
Museums & Art Galleries
Cemeteries
Social rental housing
Other
Heritage assets - Total B u ild in g sO th e r
- - - - - -
Capital expenditure bv Asset Class
Investment properties - Total - - - - - -
Housing development
O th e r
Other assets 7,937 29,355 8,160 944 6,238 10,632 10,667
General vehicles 3,163,648
S p e c ia lise d v e h ic le s 292,882
Plant & equipment 1,412,305 105.000 131,200 31,420
Computers - hardware/equipment
Furniture and other office equipment 2,427,801 800.000 800,000 699,135 600,000 631,800 666,549
A b a tto ir s
M a r k e ts
C iv ic Land and B u ild in g s 640,412 28,450,000 7,228,800 213,200 5,638,000 10,000,000 10,000,000
O th e r B u ild in g s
O th e r Land

Sedibeng District Municipality
Appendices
106
Surplus Assets - (Investment or Inventory)
O th e r 17,246,200 3,000,000 3,000,000 2,999,999
Agricultural assets - - - - - -
L ist s u b - c la s s
Biological assets - - - - - -
L ist s u b - c la s s
Intangibles 246 870 870 864 - - -
Computers - software & programming 245,948 870,000 870,000 864,426
O th e r (list su b - cla s s)
Total Capital Expenditure on new assets 8,183 30,225 9,030 1,808 6,238 10,632 10,667
Specialised vehicles - - - - - -
Refuse
Fire
Conservancy
Ambulances
*Note: Information for this table may be sourced from MBRR (2009: Table SA34a) TM.2
APPENDIX M (I): CAPITAL EXPENDITURE - NEW ASSETS PROGRAMME
Description
Year -1 Year 0 Planned Capital expenditure
Actu al OriginalBudget
AdjustmentBudget
Actu al Expenditure FY + 1 FY + 2 FY + 3
Capital expenditure by Asset Class
Infras tructure - Total - - - - - -
Infrastructure: Road transport - Total - - - - - -
Roads, Pavements & Bridges
Storm water
Infrastructure: Electricity - Total - - - - - -
Genera tio n
Transmission & Reticulation
Street Lighting
Infrastructure: W ater - Total - - - - - -
Dams & R e servo irs
Water pu rificatio n
R e ticu la tio n
Annual Report 2011/12
Appendices
107
Description
Year -1 Year 0 Planned Capital expenditure
Actu al OriginalBudget
AdjustmentBudget
Actu al Expenditure FY + 1 FY + 2 FY + 3
Infrastructure: Sanitation - Total - - - - - -
R e ticu la tio n
Sewerage purification
Infrastructure: Other - Total - - - - - -
Waste Management
Transpo rta tio n
Gas
O ther
Community - Total - - - - - -
Parks & gardens
S p ortsfie lds & sta d ia
Swimming pools
Community halls
Libraries
Recreational facilitie s
Fire, safety & emergency
Security and policing
Buses
C linics
Museums & Art Galleries
C em eteries
Social rental housing
Other
Capital expenditure bv Asset Class
Heritage assets - Total - - - - - -
B u ild in g s
O th e r
Investment properties - Total - - - - - -
Housing development
O th e r
Other assets - 2 6 8 7 1 1 5 6 4 3 - - -
General vehicles
S p e c ia lise d v e h ic le s
Plant & equipment
Computers - hardware/equipment 12 7 10 000 12 590 450 12 28 1 8 18

Sedibeng District Municipality
Appendices
108
Furniture and other office equipment 13 1 200 13 1 200 166 997
A b a tto ir s
M a r k e ts
C iv ic Land and B u ild in g s 2 500 000 2 500 000 0
O th e r B u ild in g s 500 000 498000 194 600
O th e r Land
Surplus Assets - (Investment or Inventory)
O th e r 11 030 000 9 030 000 3 000 000
Agricultural assets - - - - - -
L ist s u b - c la s s
Biological assets - - - - - -
L ist s u b - c la s s
Intangibles - - - - - -
Computers - software & programming
O th e r (list su b - cla s s)
Total Capital Expenditure on new assets - 2 6 8 7 1 1 5 6 4 3 - - -
Specialised vehicles - - - - - -
Refuse
Fire
Conservancy
Ambulances
*Note: Information for this table may be sourced from MBRR (2009: Table SA34a) TM.1
APPENDIX M (II): CAPITAL EXPENDITURE – UPGRADE/RENEWAL PROGRAMME
D escrip tio n
Year -1 Year 0 Planned Capital expenditure
Actu a l Original B u d g e t
A d ju stm e n t Budget
Actu a l Ex-penditure F Y + 1 F Y + 2 F Y + 3
Capital expenditure by Asset Class
Infrastructure - Total - - - - - -
Infrastructure: Road transport - Total - - - - - -
Roads, Pavements & B rid g e s
S to rm w a te r
Infrastructure: Electricity - Total - - - - - -
Genera tio n
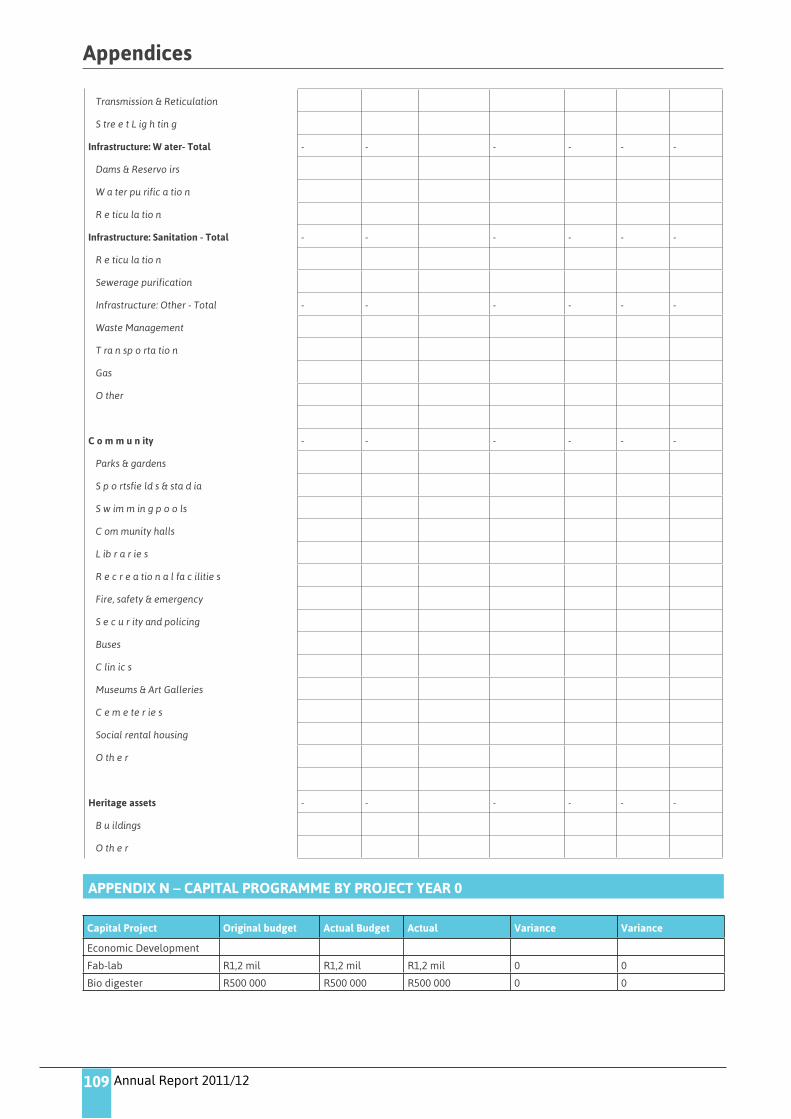
Annual Report 2011/12
Appendices
109
Transmission & Reticulation
S tre e t L ig h tin g
Infrastructure: W ater- Total - - - - - -
Dams & Reservo irs
W a ter pu rific a tio n
R e ticu la tio n
Infrastructure: Sanitation - Total - - - - - -
R e ticu la tio n
Sewerage purification
Infrastructure: Other - Total - - - - - -
Waste Management
T ra n sp o rta tio n
Gas
O ther
C o m m u n ity - - - - - -
Parks & gardens
S p o rtsfie ld s & sta d ia
S w im m in g p o o ls
C om munity halls
L ib r a r ie s
R e c r e a tio n a l fa c ilitie s
Fire, safety & emergency
S e c u r ity and policing
Buses
C lin ic s
Museums & Art Galleries
C e m e te r ie s
Social rental housing
O th e r
Heritage assets - - - - - -
B u ildings
O th e r
APPENDIX N – CAPITAL PROGRAMME BY PROJECT YEAR 0
Capital Project Original budget Actual Budget Actual Variance Variance
Economic Development
Fab -lab R1,2 mil R1,2 mil R1,2 mil 0 0
Bio digester R500 000 R500 000 R500 000 0 0

Sedibeng District Municipality
Appendices
110
APPENDIX O – CAPITAL PROGRAMME BY PROJECT BY WARDYEAR 0[NOT APPLICABLE]
APPENDIX P – SERVICE CONNECTION BACKLOGS AT SCHOOLS AND CLINICS[NOT APPLICABLE]
APPENDIX Q – SERVICE bACKlOGS EXPERIENCED bY THE COMMUNITY WHERE ANOTHER SPHERE OF GOVERNMENT IS RESPONSIblE FOR SERVICE PROVISION
Service Backlogs Experienced by the community where another Sphere of Government is the Service Provider (where the municipality whether or not act on agency basis)
Services & Locations Scale of backlogs Impact of backlogs
Clinics:
Clinics are clustered more in Urban areas while most Rural areas and informal settlements are serviced through mobile units which provide respective services once or twice a week. There are backlogs of Maternity Obstetric Units (MOUs) and fully fledged Community Health Centres (CHCs) in Lesedi and Midvaal Local Municipalities.
Poor delivery of PHC Services to communities which impedes attainment of Millennium Develop-ment Goals. Health standards and targets are compromised.
Emfuleni Local Municipality
BoiketlongCape Gate
Bophelong(Chris Hani)
Garage
Iron Side Industry
Lybia
New Village
Vereeniging Old Hospital
Polomiet
Sebokeng Ext 24
Sonderwater
Soul City
Tshepiso Taxi Rank
Winnies Park
Zone 17
Zone 7
Zone 7 Ext
Tshepiso North (Temporary Houses)
Boipatong Informal
Powerville Park
Sharpeville Area
Waterdal
4000364
591
70
457
891
569
374
324
562
1216
407
675
217
30
230
1090
337
102
96
1970
97
Impact on basic emerging services, e.g. water, sewer and electricity

Annual Report 2011/12
Appendices
111
Service Backlogs Experienced by the community where another Sphere of Government is the Service Provider (where the municipality whether or not act on agency basis)
Services & Locations Scale of backlogs Impact of backlogs
Midvaal Local MunicipalityBoitumelo
Brakfontein
Driefontein
Dusting
Herolds Farm
Keyalitsha
Lehlakeng
Mamelo
Schoongezicht
Sicelo
Skansdam
Sporong
Vogelfontein
Waterval
82
5
20
31
18
116
18
148
12
1505
16
10
30
62
Impact on basic engineering services, e.g. water, sewer and electricity
Lesedi Local Municipality
RatandaExt. 8: Formalized informal shack dwell -ings ObedNkosi/ Kaydale Informal shack dwellings Ext. 9: Informal shacks Impumelelo: Enkanini: Informal shacks Impumelelo Extension 2 & 3
Kwazenzele: Informal shacks
684
140
360
2000
1600
Impact on basic engineering services, e.g. water, sewer and electricity
Licencing and Testing Centre:
Provincial wide,there are 400,000 applicants sitting with learner licences that need to be tested for driving.The capacity of municipal testing centres in Gauteng can only test 200,000 driver applicants per annum.
The 400,000 application backlog is annually increasing because :More youth are getting into the age of being required to obtain drivers licencesOut of the 200,000 driver testing capacity only about 60 % do pass the drivers test meaning 80,000 ap -plicants join the queue again.
Reservoirs
Schools (Primary and High)Are not adequate in some townships, in rural and informal areas.
Undermine Nation building, Healthy lifestyles and the Quality of Education.
Sports Fields:Are not adequate in some townships, in rural and informal areas.
Undermine Nation building, Healthy lifestyles and the Quality of Education.

Sedibeng District Municipality
Appendices
112
APPENDIX R – DECLARATION OF LOANS AND GRANTS MADE BY THE MUNICIPALITY [NONE]
APPENDIX S – NATIONAl AND PROVINCIAl OUTCOMES FOR lOCAl GOVERNMENT
National and Provincial Outcomes for Local Government
Outcome/Output Progress to dateNumber or Percentage
AchievedImplementation of the Com -munity Works Programme
The project was launched in June 2012 at Saul Tsotetsi for 3000 job opportuni -ties in Emfuleni Local Municipality, Midvaal Local Municipality and Lesedi Local Municipality
0

Annual Report 2011/12113
VOLUME II: ANNUAL FINANCIAL STATEMENTS

Sedibeng District Municipality 114
SED
IBEN
G D
ISTR
ICT
MU
NIC
IPA
LITY
AN
NEX
UR
E "A
"A
NN
EXU
RE
"A"
SUM
MA
RY
OF
AU
DIT
FIN
DIN
GS
Num
ber
Find
ing
RES
PON
SIB
LE C
LUST
ER A
ND
D
EPA
RTM
ENT
AC
TIO
N R
EQU
IRED
TAR
GET
DA
TEPR
OG
RES
S TO
DA
TE B
Y SD
M.
FIN
AL
OU
TCO
ME
AN
D IN
PUT
BY
AG
.
Cas
h an
d ca
sh
equi
vale
nts
66In
vest
men
t: N
on -
disc
losu
re o
f inv
estm
ent
bala
nces
in t
he F
inan
cial
sta
tem
ents
FIN
AN
CE
Rec
tifi
ed in
Fin
anci
al S
tate
men
tsN
ov -1
2C
omp
lete
d
Cas
h fl
ow
stat
emen
ts
41G
ross
cas
h re
ceip
ts a
nd p
aym
ents
- Not
di
sclo
sed
FIN
AN
CE
Rec
tifi
ed in
Fin
anci
al S
tate
men
tsN
ov -1
2C
omp
lete
d
Em
ploy
ee c
osts
47Em
plo
yee
rela
ted
cost
s: V
acan
t Po
sts
CO
RPO
RA
TE S
ERV
ICES
-HR
The
fill
ing
of t
he v
acan
cies
was
hel
d in
abe
yanc
e p
endi
ng t
he r
evie
w (a
dec
isio
n m
ade
duri
ng t
he
year
und
er r
evie
w) o
f the
org
aniz
atio
nal s
truc
ture
whi
ch p
roce
ss w
ill b
e co
nclu
ded
in O
ctob
er
2012
Oct
-12
Com
ple
ted
49Em
plo
yee
rela
ted
cost
: Non
com
plia
nce
wit
h th
e O
vert
ime
Polic
y/ B
asic
Con
diti
on
of E
mp
loym
ent
Act
CO
RPO
RA
TE S
ERV
ICES
-HR
The
pol
icy
on t
he r
egul
atio
n of
ove
rtim
e w
ork
will
be
adop
ted
by c
ounc
il du
ring
the
cur
rent
fi
nanc
ial y
ear
and
a co
py
of t
he d
raft
pol
icy
was
giv
en t
o th
e A
udit
or G
ener
al’s
Off
ice
for
revi
ew.
In a
ddit
ion
we
met
wit
h th
e D
epar
tmen
t of
Lab
our
to o
btai
n ad
vice
on
this
com
plia
nce
mat
ter
and
how
we
shou
ld d
eal w
ith
it.
Feb -
13D
raft
pol
icy
in p
lace
Emp
loye
e re
late
d co
st: H
R D
evel
opm
ent
Plan
CO
RPO
RA
TE S
ERV
ICES
-HR
The
Hum
an R
esou
rces
str
ateg
y w
hich
flow
s ou
t of
the
GD
S do
es e
xist
. Doc
umen
t w
ill b
e ke
pt
wit
h H
RJa
n -13
Dev
elop
men
t p
lan
will
be
kep
t w
ith
HR
for
audi
t p
urp
oses
51Em
plo
yee
rela
ted
cost
: Min
imum
C
omp
eten
cies
CO
RPO
RA
TE S
ERV
ICES
-HR
The
coun
cil h
as a
pp
oint
ed a
ser
vice
pro
vide
r th
at w
ill d
o th
e co
mp
eten
cy a
sses
smen
t an
d th
e re
late
d ca
pac
ity
deve
lop
men
t re
lati
ng t
o m
inim
um c
omp
eten
cy r
equi
rem
ents
. Cou
ncil
will
co
ncur
rent
ly a
pp
ly t
o th
e N
atio
nal T
reas
ury
for
exte
nsio
n of
the
ret
urn
date
for
the
com
pet
ency
re
quir
emen
ts
Janu
ary
2013
- ap
plic
atio
n to
N
atio
nal T
reas
ury
18 m
onth
s to
mee
t re
quir
emen
ts
Serv
ice
pro
vide
r cu
rren
tly
busy
w
ith
asse
smen
ts
53Em
plo
yee
Rel
ated
Cos
t :L
eave
Bal
ance
CO
RPO
RA
TE S
ERV
ICES
-HR
Emp
loye
es in
the
Em
erge
ncy
Med
ical
Ser
vice
s (E
MS)
exc
essi
ve le
ave
days
are
/wer
e hi
gh a
nd k
ept
due
to t
he fa
ct t
hat
they
cou
ld n
ot t
ake
annu
al le
ave
beca
use
of/o
per
atio
nal r
equi
rem
ents
. The
EM
S fu
ncti
on h
as b
een
mig
rate
d to
Pro
vinc
e
Nov
-12
Emp
loye
es w
ill fo
rfei
t le
ave
days
in
acc
ess
of 4
8 da
ys
Aud
it C
omm
itte
e
54A
udit
com
mit
tee
was
not
eva
luat
ed b
y co
unci
l by
year
end
OFF
ICE
OF
THE
CO
OTh
e fi
nal A
udit
Com
mit
tee
Eval
uati
on R
epor
t p
rep
ared
by
the
Prov
inci
al T
reas
ury
is c
omp
lete
d an
d w
as p
rese
nted
to
Cou
ncil
at it
s C
ounc
il M
eeti
ng s
ched
uled
for
26 S
epte
mbe
r 20
12.
Sep
-12
Com
ple
ted
Pre
dete
rmin
ed
Obj
ecti
ves
30A
oPO
: No
cons
iste
ncy
betw
een
pre
sent
atio
n of
pla
nned
tar
gets
in t
he
SDB
IP a
nd p
rese
ntat
ion
of t
arge
ts in
the
A
nnua
l Per
form
ance
and
als
o be
twee
n p
lann
ed a
nd r
epor
ted
obje
ctiv
es
OFF
ICE
OF
THE
CO
OTh
e Se
dibe
ng D
istr
ict
Mun
icip
alit
y ad
opte
d th
e th
ree
tem
pla
tes
for
rep
orti
ng p
urp
oses
th
us t
o m
ake
rep
orti
ng t
o di
ffer
ent
stru
ctur
es u
ser
frie
ndly
. A
ll C
lust
ers
rep
ort
on a
ll 3
tem
pla
tes
and
ta
bled
dif
fere
ntly
to
diff
eren
t st
ruct
ures
. Thu
s no
info
rmat
ion
is lo
st o
r lim
ited
.
Ong
oing
67A
oPO
: 11 -
12 S
DB
IP a
pp
rove
d m
ore
than
28
days
aft
er B
udge
t ap
pro
val
OFF
ICE
OF
THE
CO
OTh
e 20
11 -1
2 ID
P/B
udge
t/SD
BIP
pro
cess
coi
ncid
ed w
ith
the
Loca
l Gov
ernm
ent
elec
tion
s, w
here
by
Mun
icip
alit
ies
wer
e gi
ven
an o
pti
on o
f tim
elin
es t
o ta
ble
and
app
rove
the
ir ID
Ps, a
ccor
ding
to
the
Nat
iona
l Tre
asur
y B
udge
t C
ircu
lar
rele
ased
. T
he o
pti
ons
wer
e th
at e
ithe
r th
e ou
tgoi
ng C
ounc
il or
the
inco
min
g on
e ap
pro
ves
the
IDP/
Bud
get.S
DM
sel
ecte
d op
tion
1, a
lso
noti
ng t
hat
the
new
eP
MS
syst
em w
as la
unch
ed in
the
ent
ire
mun
icip
alit
y.
This
pro
cess
was
mea
nt t
o au
tom
ise
the
IDP
deve
lop
men
t p
roce
ss a
nd t
o ch
ange
the
SD
BIP
into
a R
esul
ts -b
ased
doc
umen
t. H
ence
tim
elin
es
wer
e up
set
Jul -
12C
omp
lete
d
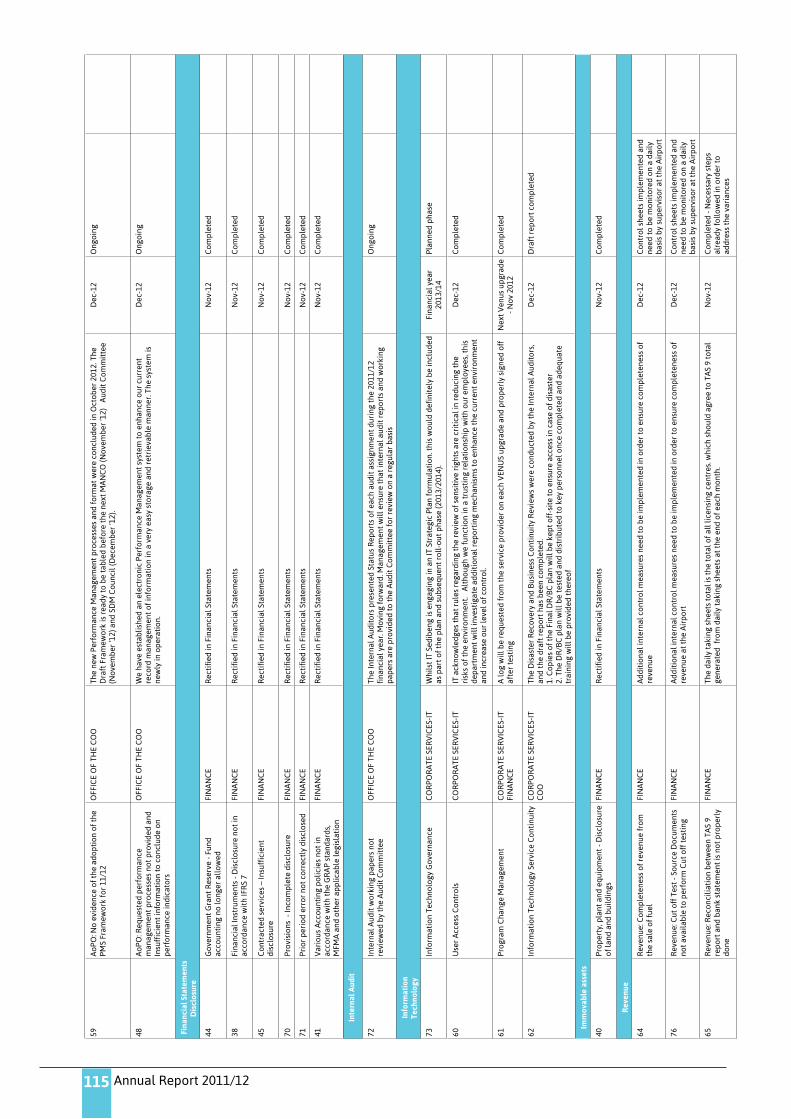
Annual Report 2011/12115
59A
oPO
: No
evid
ence
of t
he a
dop
tion
of t
he
PMS
Fram
ewor
k fo
r 11
/12
OFF
ICE
OF
THE
CO
OTh
e ne
w P
erfo
rman
ce M
anag
emen
t p
roce
sses
and
form
at w
ere
conc
lude
d in
Oct
ober
201
2. T
he
Dra
ft F
ram
ewor
k is
rea
dy t
o be
tab
led
befo
re t
he n
ext
MA
NC
O (N
ovem
ber
‘12)
A
udit
Com
mit
tee
(Nov
embe
r ‘1
2) a
nd S
DM
Cou
ncil
(Dec
embe
r ‘1
2).
Dec
-12
Ong
oing
48A
oPO
: Req
uest
ed p
erfo
rman
ce
man
agem
ent
pro
cess
es n
ot p
rovi
ded
and
Insu
ffic
ient
info
rmat
ion
to c
oncl
ude
on
per
form
ance
indi
cato
rs
OFF
ICE
OF
THE
CO
OW
e ha
ve e
stab
lishe
d an
ele
ctro
nic
Perf
orm
ance
Man
agem
ent
syst
em t
o en
hanc
e ou
r cu
rren
t re
cord
man
agem
ent
of in
form
atio
n in
a v
ery
easy
sto
rage
and
ret
riev
able
man
ner.
The
syst
em is
ne
wly
in o
per
atio
n.
Dec
-12
Ong
oing
Fin
anci
al S
tate
men
ts
Dis
clos
ure
44G
over
nmen
t G
rant
Res
erve
- Fu
nd
acco
unti
ng n
o lo
nger
all
owed
FIN
AN
CE
Rec
tifi
ed in
Fin
anci
al S
tate
men
tsN
ov -1
2C
omp
lete
d
38Fi
nanc
ial I
nstr
umen
ts -
Dis
clos
ure
not
in
acco
rdan
ce w
ith
IFR
S 7
FIN
AN
CE
Rec
tifi
ed in
Fin
anci
al S
tate
men
tsN
ov -1
2C
omp
lete
d
45C
ontr
acte
d se
rvic
es –
Insu
ffic
ient
di
sclo
sure
FIN
AN
CE
Rec
tifi
ed in
Fin
anci
al S
tate
men
tsN
ov -1
2C
omp
lete
d
70Pr
ovis
ions
- In
com
ple
te d
iscl
osur
eFI
NA
NC
ER
ecti
fied
in F
inan
cial
Sta
tem
ents
Nov
-12
Com
ple
ted
71Pr
ior
per
iod
erro
r no
t co
rrec
tly
disc
lose
dFI
NA
NC
ER
ecti
fied
in F
inan
cial
Sta
tem
ents
Nov
-12
Com
ple
ted
41V
ario
us A
ccou
ntin
g p
olic
ies
not
in
acco
rdan
ce w
ith
the
GR
AP
stan
dard
s,
MFM
A a
nd o
ther
ap
plic
able
legi
slat
ion
FIN
AN
CE
Rec
tifi
ed in
Fin
anci
al S
tate
men
tsN
ov -1
2C
omp
lete
d
Inte
rnal
Aud
it
72In
tern
al A
udit
wor
king
pap
ers
not
revi
ewed
by
the
Aud
it C
omm
itte
eO
FFIC
E O
F TH
E C
OO
The
Inte
rnal
Aud
itor
s p
rese
nted
Sta
tus
Rep
orts
of e
ach
audi
t as
sign
men
t du
ring
the
201
1/12
fi
nanc
ial y
ear.
Mov
ing
forw
ard.
Man
agem
ent
will
ens
ure
that
inte
rnal
aud
it r
epor
ts a
nd w
orki
ng
pap
ers
are
pro
vide
d to
the
Aud
it C
omm
itte
e fo
r re
view
on
a re
gula
r ba
sis
Ong
oing
Info
rmat
ion
Tech
nolo
gy
73In
form
atio
n Te
chno
logy
Gov
erna
nce
CO
RPO
RA
TE S
ERV
ICES
-IT
Whi
lst
IT S
edib
eng
is e
ngag
ing
in a
n IT
Str
ateg
ic P
lan
form
ulat
ion.
thi
s w
ould
def
init
ely
be in
clud
ed
as p
art
of t
he p
lan
and
subs
eque
nt r
oll -
out
pha
se (2
013/
2014
).
Fina
ncia
l yea
r 20
13/1
4Pl
anne
d p
hase
60U
ser
Acc
ess
Con
trol
sC
OR
POR
ATE
SER
VIC
ES -I
TIT
ack
now
ledg
es t
hat
rule
s re
gard
ing
the
revi
ew o
f sen
siti
ve r
ight
s ar
e cr
itic
al in
red
ucin
g th
e ri
sks
of t
he e
nvir
onm
ent.
Alt
houg
h w
e fu
ncti
on in
a t
rust
ing
rela
tion
ship
wit
h ou
r em
plo
yees
, thi
s de
par
tmen
t w
ill in
vest
igat
e ad
diti
onal
rep
orti
ng m
echa
nism
s to
enh
ance
the
cur
rent
env
iron
men
t an
d in
crea
se o
ur le
vel o
f con
trol
.
Dec
-12
Com
ple
ted
61Pr
ogra
m C
hang
e M
anag
emen
tC
OR
POR
ATE
SER
VIC
ES -I
TFI
NA
NC
EA
log
will
be
requ
este
d fr
om t
he s
ervi
ce p
rovi
der
on e
ach
VEN
US
upgr
ade
and
pro
per
ly s
igne
d of
f af
ter
test
ing
Nex
t V
enus
up
grad
e - N
ov 2
012
Com
ple
ted
62In
form
atio
n Te
chno
logy
Ser
vice
Con
tinu
ity
CO
RPO
RA
TE S
ERV
ICES
-IT
CO
OTh
e D
isas
ter
Rec
over
y an
d B
usin
ess
Con
tinu
ity
Rev
iew
s w
ere
cond
ucte
d by
the
Inte
rnal
Aud
itor
s,
and
the
draf
t re
por
t ha
s be
en c
omp
lete
d.
1. C
opie
s of
the
Fin
al D
R/B
C p
lan
will
be
kep
t of
f -si
te t
o en
sure
acc
ess
in c
ase
of d
isas
ter
2. T
he D
R/B
C p
lan
will
be
test
ed a
nd d
istr
ibut
ed t
o ke
y p
erso
nnel
onc
e co
mp
lete
d an
d ad
equa
te
trai
ning
will
be
pro
vide
d th
ereo
f
Dec
-12
Dra
ft r
epor
t co
mp
lete
d
Imm
ovab
le a
sset
s
40Pr
oper
ty, p
lant
and
equ
ipm
ent
- Dis
clos
ure
of la
nd a
nd b
uild
ings
FIN
AN
CE
Rec
tifi
ed in
Fin
anci
al S
tate
men
tsN
ov -1
2C
omp
lete
d
Rev
enue
64R
even
ue: C
omp
lete
ness
of r
even
ue fr
om
the
sale
of f
uel
FIN
AN
CE
Add
itio
nal i
nter
nal c
ontr
ol m
easu
res
need
to
be im
ple
men
ted
in o
rder
to
ensu
re c
omp
lete
ness
of
reve
nue
Dec
-12
Con
trol
she
ets
imp
lem
ente
d an
d ne
ed t
o be
mon
itor
ed o
n a
daily
ba
sis
by s
uper
viso
r at
the
Air
por
t
76R
even
ue: C
ut o
ff T
est
- Sou
rce
Doc
umen
ts
not
avai
labl
e to
per
form
Cut
off
tes
ting
FIN
AN
CE
Add
itio
nal i
nter
nal c
ontr
ol m
easu
res
need
to
be im
ple
men
ted
in o
rder
to
ensu
re c
omp
lete
ness
of
reve
nue
at t
he A
irp
ort
Dec
-12
Con
trol
she
ets
imp
lem
ente
d an
d ne
ed t
o be
mon
itor
ed o
n a
daily
ba
sis
by s
uper
viso
r at
the
Air
por
t
65R
even
ue: R
econ
cilia
tion
bet
wee
n TA
S 9
rep
ort
and
bank
sta
tem
ent
is n
ot p
rop
erly
do
ne
FIN
AN
CE
The
daily
tak
ing
shee
ts t
otal
is t
he t
otal
of a
ll li
cens
ing
cent
res.
whi
ch s
houl
d ag
ree
to T
AS
9 to
tal
gene
rate
d fr
om d
aily
tak
ing
shee
ts a
t th
e en
d of
eac
h m
onth
.N
ov -1
2C
omp
lete
d - N
eces
sary
ste
ps
alre
ady
foll
owed
in o
rder
to
addr
ess
the
vari
ance
s

Sedibeng District Municipality
Annual Financial Statements
116
REPORT OF THE AUDITOR-GENERAL TO THE GAUTENG PROVINCIAL LEGISLATURE AND THE COUNCIL OF THE SEDIBENG DISTRICT MUNICIPALITY
REPORT ON THE FINANCIAL STATEMENTS
Introduction
1. I have audited the accompanying financial statements of the Sedibeng District Municipality, which comprise the statement of financial position as at 30 June 2012, and the statement of financial performance, statement of changes in net assets and cash flow statement for the year then ended and a summary of significant accounting policies and other explanatory information, as set out on pages H t° 11 -
Accounting Officers responsibility for the financial statements
2. The accounting officer is responsible for the preparation and fair presentation of these financial statements in accordance with South African Standards of Generally Recognised Accounting Practice (SA Standards of GRAP) and the requirements’ of the Municipal Finance Management Act of South Africa, 2003 (Act No. 56 of 2003) (MFMA), Division of Revenue Act of South Africa 2010 (Act No. 1 of 2010) (DoRA) and for such internal control as management determines is necessary to enable the preparation of the financial statements that are free from material misstatement, whether due to fraud or error.
Auditor-General’s responsibility
3. My responsibility is to express an opinion on these financial statements based on my audit. I conducted my audit in accordance with the Public Audit Act of South Africa, 2004 (Act No. 25 of 2004) (PAA), the General Notice issued in terms thereof and International Standards on Auditing. Those standards require that I comply with ethical requirements and plan and perform the audit to obtain reasonable assurance about whether the financial statements are free from material misstatement.
4. An audit involves performing procedures to obtain audit evidence about the amounts and disclosures in the financial statements. The procedures selected depend on the auditor’s judgement, including the assessment of the risks of material misstatement of the financial statements, whether due to fraud or error. In making those risk assessments, the auditor considers internal control relevant to the entity’s preparation and fair presentation of the financial statements in order to design audit procedures that are appropriate in the circumstances, but not for the purpose of expressing an opinion on the effectiveness of the entity’s internal control. An audit also includes evaluating the appropriateness of accounting policies used and the reasonableness of accounting estimates made by management, as well as evaluating the overall presentation of the financial statements.
5. I believe that the audit evidence ! have obtained is sufficient and appropriate to provide a v basis for my audit opinion.
Opihion
6. In my opinion, the financial statements present fairly, in all material respects, the financial position of the Sedibeng District Municipality as at 30 June 2012 and its financial performance and its cash flows for the year then end in accordance with the South African Standards of Generally Recognised Accounting Practice and the requirements of the Municipal Finance Management Act of South Africa, 2003 (Act No. .56 of 2003)
Emphasis of matters
7. I draw attention to the matters below. My opinion is not modified in respect of these matters:
Significant uncertainties
8. As disclosed in note 29 to the financial statements, the entity is a defendant in. various lawsuits. The ultimate outcome of the matters cannot presently be determined and therefore no provision for any liabilities that may result has been made in the financial statements.
Material underspending
9. The municipality has materially underspent on the capital expenditure budget amounting to R7 750 950 (33%). As a consequence, the municipality has not achieved some of its capital project objectives.
Additional matter

Annual Report 2011/12
Annual Financial Statements
117
10. I draw attention to the matter below. My opinion is not modified in respect of this matter:
Unaudited supplementary schedules
11. The supplementary information set out on page xx does not form part of the financial statements and is presented as additional information. I have not audited this schedule and, accordingly, I do not express an opinion thereon
REPORT ON OTHER LEGAL AND REGULATORY REQUIREMENTS
12. In accordance with the PAA and the General Notice issued in terms thereof, I report the following findings relevant to performance against predetermined objectives, compliance with laws and regulations and internal control, but not for the purpose of expressing an opinion.
Predetermined objectives
13. I performed.: procedures to obtain evidence about. the usefulness and reliability of . the , .. information in the name of annual, performance report as set out ori pages If to B of the annual report.
14. The reported performance against predetermined objectives was evaluated against the overall criteria of usefulness and reliability. The usefulness of information in the annual performance report relates to whether it is presented in accordance with the National Treasury annual reporting principles and whether the reported performance is consistent with the planned development priorities or objectives/The usefulness of information further relates to whether indicators arid targets are measurable (i.e. we!! defined, verifiable, specific, measurable and time bound) and relevant as required by the. National Treasury Framework for managing programme performance information.
The reliability of the information in respect of the selected development priorities or objectives is assessed to determine whether it adequately reflects the facts (i.e. whether it is. valid, accurate and complete).
15. The material findings are as follows:
Usefulness of information
Reported indicators and targets not consistent with planned indicators and targets
16. The Municipal Systems Act, section 41(c) requires that the integrated development plan should form the basis for the annual report, therefore requiring the consistency of objectives, indicators and targets between planning and reporting documents. -A total of 23% of the reported indicators and targets are not consistent with the indicators and targets as per the approved SDBIP. This is due to the lack of oversight responsibility regarding performance reporting.
Reliability of selected objectives in the annual performance report
17. Based on my work described in this report, nothing has come to my attention that causes me to believe the annual performance report is not fairly stated in all material respects, in accordance with the predetermined criteria.
Additional matters
18. I draw attention to the following matters below. These matters do not have an impact on the predetermined objectives audit findings reported above.
Achievement of planned targets
19. 19; Of the total number of 1117 planned targets 257 were not achieved during the year under review; This represents 23% of total planned targets that were not achieved during the year. : Under review. This was mainly due to the fact’that indicators and targets Were not suitably . developed during the strategic planning process
Compliance with laws and regulations
20. I performed procedures to obtain evidence that the municipality has complied with applicable laws and regulations regarding financial matters, financial management and other related matters. My findings on material non -compliance with specific matters in key applicable laws and regulations as set out in the General Notice issued in terms of the PAA are as follows:
Annual Financial statements, performance and annual report
21. The financial statements submitted for auditing were not prepared in all material respects in accordance with

Sedibeng District Municipality
Annual Financial Statements
118
the requirements of section 122 of the MFMA. Material misstatements of disclosure items for receivables and expenditure identified by the auditors were adequately corrected, resulting in the financial statements receiving an unqualified audit opinion.
INTERNAL CONTROL
22. I considered internal control relevant to my audit of the financial statements, annual performance report and compliance with laws iand regulations. The matters reported below under the fundamentals of internal control are limited to the significant deficiencies that resulted in the findings on the annual performance report and the findings on compliance with laws and regulations included in this report.
Leadership
23. The accounting officer did not adequately exercise oversight responsibility regarding performance reporting. The performance objectives reported were not consistent with the annual performance plan, resulting in findings being raised.
Financial and performance management
24. Management did not have sufficient monitoring controls to ensure consistent reporting on the annual performance report.
25. Management did not comply with the accounting framework on the preparation of disclosure notes..
Johannesburg
30 November 2012
Auditing fo build public confidence

Annual Report 2011/12119
Sedibeng District MunicipalityAnnual Financial Statements for the year ended 30 June 2012
General Information
The following is included in the scope of operation District Municipality
Grading of local authority Grade 11 Local Authority
Chief Finance Officer (CFO) Mr Brendon Scholtz
Registered office Municipal Offices
Civic Centre
Cnr. Beaconsfield & Leslie street
Vereeniging
1930
Business address Municipal Offices
Civic Centre
Cnr. Beaconsfield & Leslie street
Vereeniging
1930
Postal address PO Box 471
Vereeniging
1930
Bankers ABSA Bank Limited
Auditors Auditor General South Africa
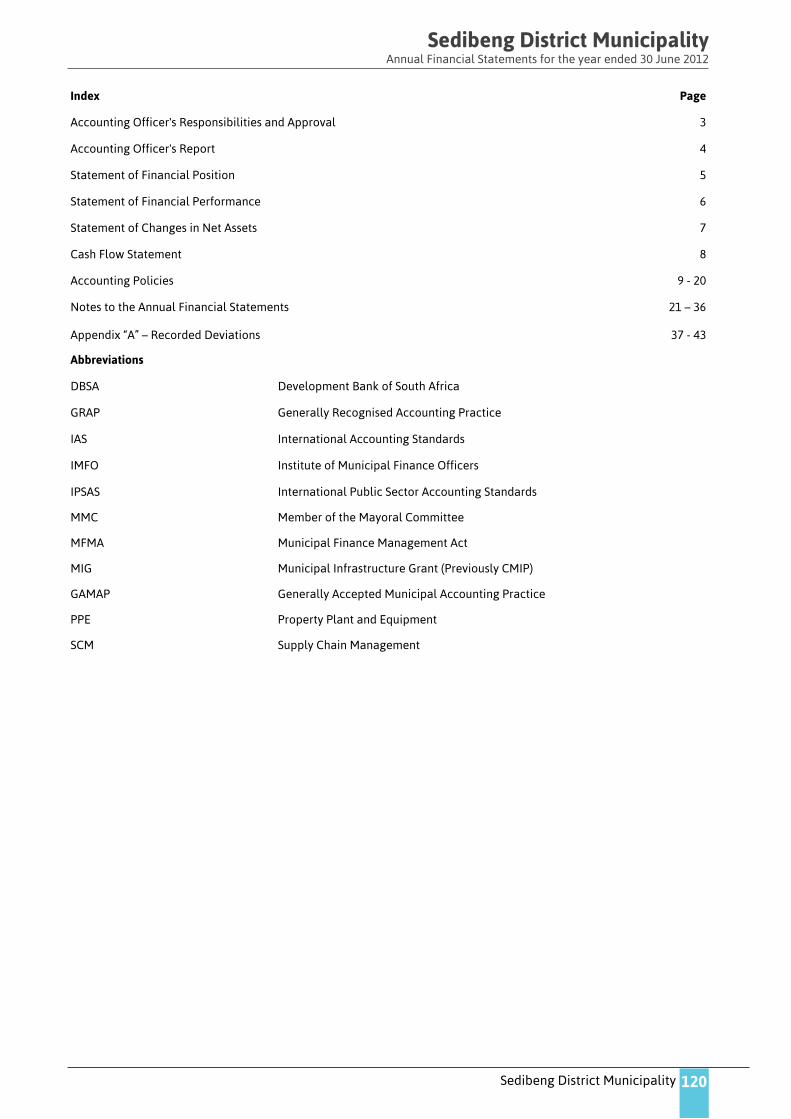
Sedibeng District Municipality 120
Sedibeng District MunicipalityAnnual Financial Statements for the year ended 30 June 2012
Index Page
Accounting Officer's Responsibilities and Approval 3
Accounting Officer's Report 4
Statement of Financial Position 5
Statement of Financial Performance 6
Statement of Changes in Net Assets 7
Cash Flow Statement 8
Accounting Policies 9 - 20
Notes to the Annual Financial Statements
Appendix “A” – Recorded Deviations
21 – 36
37 - 43
Abbreviations
DBSA Development Bank of South Africa
GRAP Generally Recognised Accounting Practice
IAS International Accounting Standards
IMFO Institute of Municipal Finance Officers
IPSAS International Public Sector Accounting Standards
MMC Member of the Mayoral Committee
MFMA Municipal Finance Management Act
MIG Municipal Infrastructure Grant (Previously CMIP)
GAMAP Generally Accepted Municipal Accounting Practice
PPE Property Plant and Equipment
SCM Supply Chain Management
Annual Report 2011/12121
Sedibeng District MunicipalityAnnual Financial Statements for the year ended 30 June 2012
Accounting Officer’s Responsibilities and ApprovalThe accounting officer is required by the Municipal Finance Management Act (Act 56 of 2003), to maintain adequate accounting records and is responsible for the content and integrity of the annual financial statements and related financial information included in this report. It is the responsibility of the accounting officer to ensure that the annual financial statements fairly present the state of affairs of the municipality as at the end of the financial year and the results of its operations and cash flows for the period then ended. The external auditors are responsible for reporting on the fair presentation of the annual financial statements.
The annual financial statements have been prepared in accordance with Standards of Generally Recognised Accounting Practices (GRAP).
The annual financial statements are based upon appropriate accounting policies consistently applied and supported by reasonable and prudent judgments and estimates.
The accounting officer acknowledges that he is ultimately responsible for the system of internal financial control established by the municipality and place considerable importance on maintaining a strong control environment. To enable the accounting officer to meet these responsibilities, the accounting officer sets standards for internal control aimed at reducing the risk of error or loss in a cost effective manner. The standards include the proper delegation of responsibilities within a clearly defined framework, effective accounting procedures and adequate segregation of duties to ensure an acceptable level of risk. These controls are monitored throughout the municipality and all employees are required to maintain the highest ethical standards in ensuring the municipality’s business is conducted in a manner that in all reasonable circumstances is above reproach. The focus of risk management in the municipality is on identifying, assessing, managing and monitoring all known forms of risk across the municipality. While operating risk cannot be fully eliminated, the municipality endeavours to minimise it by ensuring that appropriate infrastructure, controls, systems and ethical behaviour are applied and managed within predetermined procedures and constraints.
The accounting officer is of the opinion, based on the information and explanations given by management, that the system of internal control provides reasonable assurance that the financial records may be relied on for the preparation of the annual financial statements. However, any system of internal financial control can provide only reasonable, and not absolute, assurance against material misstatement or loss.
The accounting officer has reviewed the municipality’s cash flow forecast for the year to 30 June 2013 and, in the light of this review and the current financial position, he is satisfied that the municipality has or has access to adequate resources to continue in operational existence for the foreseeable future.
The annual financial statements set out on pages 4 to 34, which have been prepared on the going concern basis, were approved by the accounting officer on 31 August 2012:
Mr Yunus Chamda
Sedibeng District Municipality 122
Sedibeng District MunicipalityAnnual Financial Statements for the year ended 30 June 2012
Accounting Officer’s ReportThe accounting officer submits his report for the year ended 30 June 2012.
1. Incorporation
The municipality was incorporated on 01 January 1988 and obtained its certificate to commence its business as a regional services council on the same day.
2. Going concern
We draw attention to the fact that at 30 June 2012, the municipality had accumulated surplus of R172,660,370 and that the municipality’s total assets exceed its liabilities by R175,352,201.
The annual financial statements have been prepared on the basis of accounting policies applicable to a going concern. This basis presumes that funds will be available to finance future operations and that the realisation of assets and settlement of liabilities, contingent obligations and commitments will occur in the ordinary course of business.
3. Accounting policies
The annual financial statements are prepared in accordance with the prescribed Standards of Generally Recognised Accounting Practices (GRAP) issued by the Accounting Standards Board as the prescribed framework by National Treasury.
The current bankers appointed by Council through a formal tender process are ABSA Bank Limited.
4. Accounting Officer
NameNationality
Mr Yunus ChamdaRSA
5. Bankers
The current bankers appointed by Council through a formal tender process are ABSA Bank Limited.
6. Auditors
The Auditor General will continue in office for the next financial period.
7. Cost cutting measures
Following the global economic crisis of 2009 and in line with MFMA Circular 48, the executive management of Sedibeng District Municipality had taken the decision to make conscientious efforts to increase revenue and decrease operating expenses by:
Increasing revenue through Cost containment measures
— Optimizing all revenue streams; — Educating staff to be more conscientious
— Reviewing billing processes; — Better cash management
— Rigorously applying credit control; — Claiming discounts from creditors/ suppliers
— Tightening internal control measures and SCM processes — Institutionalising discussion on under -provision of EMS grant
— Institutionalising discussion on under -provision of equitable share
— Value -for -money spending and application of economies -of -scale pro -curement
— Closer monitoring of repairs & maintenance will lead to reduction in productivity losses
— Reducing & reviewing discretionary spending
.

Annual Report 2011/12123
Sedibeng District MunicipalityAnnual Financial Statements for the year ended 30 June 2012
Statement of Financial PositionFigures in Rand Note(s) 2012 2011
Assets
Current Assets
Construction of assets in progress 4 32,053,089 -
Inventories 5 307,522 370,013
Receivables from exchange transactions 6 5,434,493 22,889,557
VAT receivable 7 1,125,614 4,590,801
Cash and cash equivalents 8 12,491,996 42,428,705
51,412,714 70,279,076
Non -Current Assets
Property, plant and equipment 2 184,233,785 192,591,725
Intangible assets 3 1,923,053 2,319,690
186,156,838 194,911,415
Total Assets 237,569,552 265,190,491
Liabilities
Current Liabilities
Payables from exchange transactions 12 46,668,534 57,936,799
Unspent conditional grants and receipts 10 12,793,066 33,740,053
Provisions 11 2,755,751 1,970,951
62,217,351 93,647,803
Total Liabilities 62,217,351 93,647,803
Net Assets 175,352,201 171,542,689
Net Assets
Accumulated surplus 175,352,201 171,542,689
Total Net Assets 175,352,201 171,542,689

Sedibeng District Municipality 124
Sedibeng District MunicipalityAnnual Financial Statements for the year ended 30 June 2012
Statement of Financial PerformanceFigures in Rand Note(s) 2012 2011
Revenue
Sale of goods 1,217,207 321,965
Rental of facilities and equipment 7,799,499 7,695,109
Income from agency services 6,963,365 6,496,536
Licences and permits 59,605,708 49,309,873
Government grants and subsidies 15 292,212,987 290,229,183
Other income 16 1,380,793 1,163,667
Interest received – investment revenue 21 2,221,854 6,237,003
Gains on disposal of assets 1,161,731 107,092
Total Revenue 372,563,144 361,560,428
Expenditure
Employee related cost 18 (228,392,383) (232,230,971)
Remuneration of councilors 19 (9,407,075) (8,368,655)
Depreciation and amortisation 22 (23,602,041) (17,198,678)
Debt impairment 20 (93,999) (37,761)
Public participation (8,724) (140,129)
Repairs and maintenance (6,077,486) (7,877,686)
Contracted services 25 (42,723,077) (37,072,909)
Grants and subsidies paid 26 (250,000) (84,710,637)
General expenses 17 (57,583,246) (88,267,630)
Total Expenditure (368,138,031) (475,905,056)
Surplus (deficit) for the year 4,425,113 (114,344,628)
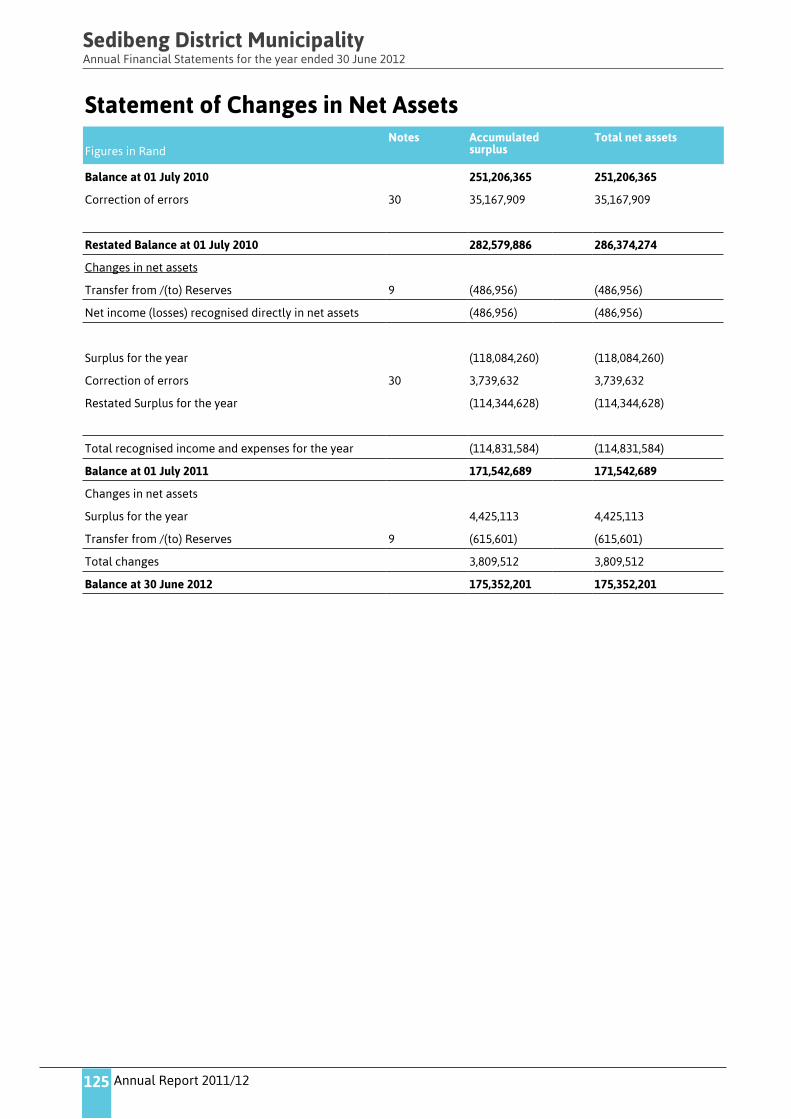
Annual Report 2011/12125
Sedibeng District MunicipalityAnnual Financial Statements for the year ended 30 June 2012
Statement of Changes in Net Assets
Figures in RandNotes Accumulated
surplusTotal net assets
Balance at 01 July 2010 251,206,365 251,206,365
Correction of errors 30 35,167,909 35,167,909
Restated Balance at 01 July 2010 282,579,886 286,374,274
Changes in net assets
Transfer from /(to) Reserves 9 (486,956) (486,956)
Net income (losses) recognised directly in net assets (486,956) (486,956)
Surplus for the year (118,084,260) (118,084,260)
Correction of errors 30 3,739,632 3,739,632
Restated Surplus for the year (114,344,628) (114,344,628)
Total recognised income and expenses for the year (114,831,584) (114,831,584)
Balance at 01 July 2011 171,542,689 171,542,689
Changes in net assets
Surplus for the year 4,425,113 4,425,113
Transfer from /(to) Reserves 9 (615,601) (615,601)
Total changes 3,809,512 3,809,512
Balance at 30 June 2012 175,352,201 175,352,201

Sedibeng District Municipality 126
Sedibeng District MunicipalityAnnual Financial Statements for the year ended 30 June 2012
Cash Flow StatementFigures in Rand Note(s) 2012 2011
Cash flows from operating activities
Receipts
Grants 271,266,000 278,718,934
Interest income 2,221,854 6,237,003
License receipts 195,301,700 164,082,041
Other receipts 78,412,634 142,380,094
547,202,188 591,418,072
Payments
Employee costs (237,799,458) (240,629,523)
License authority (138,529,619) (101,446,335)
Other suppliers (186,379,598) (289,194,870)
(562,708,675) (631,270,728)
Net cash flows from operating activities 27 (15,506,487) (39,852,656)
Cash flows from investing activities
Purchase of property, plant and equipment 2 (15,135,073) (35,718,666)
Proceeds from disposal of property, plant and equipment 2 1,569,276 273,656
Purchase of other intangible assets 3 (864,426) (245,948)
Net cash flows from investing activities (14,430,223) (35,690,958)
Net increase/(decrease) in cash and cash equivalents (29,936,710) (75,543,614)
Cash and cash equivalents at the beginning of the year 42,428,705 117,972,319
Cash and cash equivalents at the end of the year 8 12,491,995 42,428,705
Annual Report 2011/12127
Sedibeng District MunicipalityAnnual Financial Statements for the year ended 30 June 2012
1. SIGNIFICANT ACCOUNTING POLICIES TO THE ANNUAL FINANCIAL STATEMENTS
1.1 BASIS OF PRESENTATION
The Annual Financial Statements have been prepared on an accrual basis of accounting and are in accordance with the historical cost basis unless otherwise stated. Under this basis the effects of transactions and other events are recognised when they occur and are recorded in the financial statements within the period to which they relate.
The annual financial statements have been prepared in accordance with the effective Standards of Generally Recognised Accounting Practices (GRAP) prescribed by the Minister of Finance in terms of General Notices 991 of 2005 and General Notice 516 of 2008, including any interpretations and directives issued by the Accounting Standards Board
Accounting policies for material transactions, events or conditions not covered by the above GRAP have been developed in accordance with paragraphs 7, 11 and 12 of GRAP 3. These accounting policies and the applicable disclosures have been based on the South African Statements of Generally Accepted Municipal Accounting Practices (SA GAMAP) including any interpretations of such statements issued by the Accounting Practices Board.
The Minister of Finance has, in terms of General Notice 1290 of 2008 exempted compliance with certain of the above -mentioned standards and aspects or parts of these standards. Details of the exemptions applicable to the municipality have been provided in the notes to the annual statements.
These accounting policies are consistent with those of the previous financial year.
Offsets
Assets, liabilities, revenues and expenses have not been offset except when offsetting is required or permitted by a standard of GRAP.
The principal accounting policies adopted in the preparation of these annual financial statements are set out below.
1.2 PRESENTATION CURRENCY
These annual financial statements are presented in South African Rand and are rounded to the nearest Rand.
1.3 SIGNIFICANT ESTIMATES, JUDGEMENTS AND ASSUMPTIONS
These annual financial statements have been prepared on a going concern basis.
In preparing the annual financial statements to conform with the standards of GRAP, management is required to make estimates, judgments and assumptions that affect the amounts represented in the annual financial statements and related disclosures. Use of available information and the application of judgment are inherent in the formation of estimates. Actual results in the future may differ from these estimates.
All significant estimates, judgments and underlying assumptions are reviewed on constant basis. All necessary revisions of significant estimates are recognised in the period during such revisions as well as in any future affected periods.
Specific areas where these significant estimation uncertainties as well as critical judgments and assumptions were made in the application of accounting policies with the most significant effect in the annual financial statements are included in the following notes:
Note 11: Provisions
Note 29: Contingencies
Note 28: Lease classification
Note 20: Debt Impairment
1.5 PROPERTY, PLANT & EQUIPMENT
An item of property, plant and equipment which qualifies for recognition as an asset has been initially be measured at cost except where land and buildings have been revalued at fair value at date of the revaluation less subsequent depreciation.
The cost of an item of property, plant and equipment comprises of its purchase price, including import duties and non -refundable purchase taxes and any directly attributable costs of bringing the asset to working condition for its intended use.

Sedibeng District Municipality 128
Sedibeng District MunicipalityAnnual Financial Statements for the year ended 30 June 2012
Where an item of property, plant and equipment was donated, is initially recognised at its fair value as at the date of acquisition.
Where an asset is acquired through a non -exchange transaction, its cost shall be measured at its fair value as at date of acquisition.
The cost of an item of property, plant and equipment acquired in exchange for a non -monetary asset or monetary assets, or a combination of monetary and non -monetary assets was measured at its fair value. If the acquired item could not be measured at its fair value, its cost was measured at the carrying amount of the asset given up.
Subsequent expenditure is capitalised when the recognition and measurement criteria of an asset are met. If expenditure only restores the originally best estimate of the expected useful life of the asset, then it is regarded as repairs and maintenance and is expensed.
Incomplete construction work is stated at historical cost. Depreciation only commences when the assets is ready to be used.
Properties in the course of construction for production, rental or administrative purposes, or for purposes not yet determined, are carried at cost, less any recognised impairment loss. Cost includes professional fees and, for qualifying assets, borrowing costs capitalised in accordance with the Municipality’s accounting policy, refer to note 4. Depreciation of these assets, on the same basis as other property assets, commences when the assets are ready for their intended use.
Subsequently property, plant and equipment, are stated at cost, less accumulated depreciation and accumulated impairment losses.
Land is not depreciated as it is regarded as having an infinite life.
The gain or loss arising on the disposal or retirement of an item of property, plant and equipment is determined as the difference between the proceeds of disposal and the carrying value and is recognised in the Statement of Financial Performance.
Depreciation is calculated on the asset's depreciable amount, using the straight -line method over the useful life of the asset. The depreciable amount is determined after deducting the residual value of the asset from its cost. The depreciation charge is recognised as an expense unless it is included in the carrying amount of another asset under construction. Assets will be depreciated according to their annual depreciation rates based on the following estimated useful life:
Infrastructure Assets Years
Street names, signs and parking meters 5
Water reservoirs and reticulation 15 – 20
Community Assets Years
Parks and gardens 10 -30
Sport fields 20 – 30
Community halls 30
Recreation facilities 20 – 30
Other Assets Years
Motor vehicles 5
Plant and equipment 2 – 15
Security measures 3 – 10
Buildings 30
IT equipment 3 – 5
Office equipment 3 - 7
Specialised vehicles 10
Annual Report 2011/12129
Sedibeng District MunicipalityAnnual Financial Statements for the year ended 30 June 2012
The residual value and the useful life and depreciation method of each asset are reviewed at the end of each reporting date. If the expectations differ from previous estimates, the change is accounted for as a change in accounting estimate. Reviewing the useful life of an asset on an annual basis does not require the entity to amend the previous estimates unless expectations differ from the previous estimate.
The municipality has complied with Directive 4 of February 2008 and applied the requirements of the standard of GRAP 3, Accounting policies, Changes in accounting estimates and errors on the standard on Property, Plant and Equipment, GRAP 17, on initial adoption of the standard.
1.6 INTANGIBLE ASSETS
Intangible assets acquired separately or internally generated are reported at cost less accumulated amortisation and accumulated impairment losses. Refer to impairment of assets accounting policy 1.7
Where an intangible asset has been acquired at no or for a nominal cost, its cost is its fair value on the date of acquisition.
Subsequent expenditure is capitalised only when it increases the future economic benefits embodied in the specific asset to which it relates. All other expenditure, including expenditure on internally generated goodwill and brands are recognised in the statement of financial performance as incurred.
Costs associated with developing or maintaining computer software programmes are recognised as an expense as incurred. Costs that are directly associated with the development of identifiable and unique software products controlled by the Municipality and that will probably generate economic benefits exceeding costs beyond one year are recognised as intangible assets. Costs include the employee costs incurred as a result of developing software and an appropriate portion of relevant overheads.
1.6.1 Research and Development
Expenditure on research activities, undertaken with the prospect of gaining new scientific or technical knowledge and understanding, is recognised in the statement of financial performance when incurred.
Development activities involve a plan or design for the production of new or substantially new improved products and processes.
Development expenditure is capitalised only if development costs can be measured reliably, the product or process is technically and commercially feasible, future economic benefits are probable, and the municipality intends to and has sufficient resources to complete development and to use or sell the asset.
The expenditure capitalised includes the cost of materials, direct labour and overhead costs that are directly attributable to preparing the asset for its intended use.
Other development expenditure is recognised in the statement of financial performance as incurred.
1.6.2 Amortisation
Amortisation is recognised in the statement of financial performance on a straight -line basis over the estimated useful lives of intangible assets, other than goodwill, from the date that they are available for use. The estimated useful lives for the current and comparative periods are as follows:
Item Useful Life
Computer software 3 Years
Each item of intangible asset is amortised separately.
Intangible assets that have an indefinite useful life are tested for impairment annually.
The estimated useful life, the amortisation method and the residual values are reviewed annually at the end of the financial year. Any adjustments arising from the annual review are applied prospectively.
1.7 IMPAIRMENT OF FINANCIAL ASSETS
Sedibeng District Municipality 130
Sedibeng District MunicipalityAnnual Financial Statements for the year ended 30 June 2012
Impairment of Non-financial assets
Non -Financial assets, excluding investment property and inventories, are assessed at each reporting date to determine whether there is an indication that the carrying amount of the asset may be impaired. If such an indication exists, the recoverable amount of the asset is determined. Irrespective of whether an indication of impairment exists, the recoverable amount of goodwill, indefinite -life intangible assets and intangible assets not available for use are determined annually.
The recoverable amount of an asset is the higher of its fair value less costs to sale and its value in use. In determining the value in use, the estimated future cash flows of the asset is discounted to their present value based on pre -tax discount rates that reflects current market assessments of the time value of money and the risks that are specific to the asset. If the value in use of an asset for which there is an indication of impairment cannot be determined, the recoverable amount of the cash -generating unit to which the asset belongs is determined. An asset's cash generating unit is the smallest group of identifiable assets that includes the asset and that generates cash inflows from continuing use that are largely independent from cash inflows from other assets.
An impairment loss is recognised in the statement of financial performance when the carrying amount of an individual asset or of a cash -generating unit exceeds its recoverable amount. If the loss relates to the reversal of a previous revaluation surplus, it is recognised in equity. Impairment losses recognised on cash -generating units are allocated on a pro rata basis, to the assets in the cash -generating unit.
Impairment losses are reversed if there has been a change in the estimates used to determine the recoverable amount of the asset or cash -generating unit. Reversals of impairment losses on cash -generating units are allocated on a pro rata basis to the assts in the unit. Impairment losses are reversed only to the extent that the carrying amount of the asset does not exceed the carrying amount that would have been recognised in the past. Reversals of impairment losses are recognised directly in the statement of financial performance.
Impairment of Monetary assets
A provision for impairment is created when there is objective evidence that the municipality will not be able to collect all amounts due according to the original terms of the receivables. The carrying value is reduced through the use of a provision and is recognised as a charge to the statement of financial performance. When a receivable is uncollectible, it is written off against the provision. Any subsequent recoveries of amounts previously written off are credited directly in the statement of financial performance.
An available for sale financial asset is impaired when there is a significant or prolonged decline in the fair value of the asset below its cost price or amortised cost. At such a point, a cumulative gains or losses that have been accumulated in equity are removed from equity as a reclassification adjustment and are recognised in the statement of financial performance. Any subsequent impairment losses are recognised directly in the statement of financial performance.
Where Held -to -maturity investments have been impaired, the carrying value is adjusted by the impairment loss and this is recognised as an expense in the period that the impairment is identified.
1.8 NON-CURRENT ASSETS HELD FOR SALE
Non -current assets or disposal groups are classified as non -current assets held for sale when the carrying amount of the asset or disposal group is to be recovered principally through a sale transaction rather than through continuing use.
Immediately before the classification of the asset or disposal group as held for sale, the carrying amount of the assets, or the assets and liabilities in the disposal group, are measured in accordance with applicable GRAP standards. Subsequently the asset or disposal group is measured at the lower of its carrying amount and fair value less cost to sell, with any adjustment recorded in the statement of financial performance.
The municipality complied with Directive 4 of February 2008, on initial adoption of the standard of GRAP on Non -current Assets Held for Sale and Discontinued Operations, GRAP 100,and has done so prospectively, for all non -current assets (or disposal groups), that meet the criteria to be classified as held for sale.
1.9 LEASES
Leases that transfer substantially all the risks and rewards of ownership are classified as finance leases. All other leases are classified as operating leases.
Operating leases are those leases that do not fall within the scope of the above definition. Operating lease payments are

Annual Report 2011/12131
Sedibeng District MunicipalityAnnual Financial Statements for the year ended 30 June 2012
recognised as an expense on a straight -line basis over the lease period.
The Municipality as Lessee
Assets leased in terms of finance lease agreements are capitalied at amounts equal at the inception of the lease to the fair value of the leased property, or lower, at the present value of the minimum lease payments. Capitalised leased assets are depreciated in accordance with the accounting policy applicable to property, plant and equipment; refer to property, plant and equipment policy 1.5. The corresponding rental obligations, net of finance charges, are included in long -term borrowings. Lease finance charges are amortised to the statement of financial performance (unless they are directly attributable to qualifying assets) over the duration of the leases so as to achieve a constant rate of interest on their remaining balance of the liability.
Obligations incurred under operating leases are charged to the statement of financial performance in equal installments over the period of the lease, except when an alternative method is more representative of the time pattern from which benefits are derived.
1.10 FINANCIAL INSTRUMENTS
Financial instruments are initially measured at fair value, plus, in the case of financial instruments not at fair value through profit or loss, transaction costs. The fair value of a financial instrument that is initially recognised is normally the transaction price, unless the fair value is evident from the observable market data. The municipality uses a discounted cash flow model which incorporates entity -specific variables to determine the fair value of financial instruments that are not traded in an active market. Differences may arise between the fair value initially recognised in (which in accordance with IAS 39, is generally the transaction price) and the amount initially determined using the valuation technique. Any such differences are subsequently recognised in profit or loss only to the extent that they relate to a change in the factors (including time) that market participants would consider in setting the price.
Financial instruments include cash and bank balance, investments, trade receivables and borrowings. The municipality classifies its financial assets as loans and receivables.
Effective interest method
The effective interest method is a method of calculating the amortised cost of a financial asset and of allocating interest income over the relevant period. The effective interest rate is the rate that exactly discounts estimated future cash receipts (including all fees on points paid or received that form an integral part of the effective interest rate, transaction costs and other premiums or discount) through the expected life of the financial asset, or, where appropriate a shorter period.
1.10.1 Financial assets
Financial assets are recognised in the municipality's statement of financial position when the municipality becomes a party to the contractual provisions of an instrument. Regular way purchases and sales of financial assets are recorded on the trade date.
The municipality classifies its financial assets in the following categories: fair value through profit or loss, loans and receivables, held -to -maturity as well as available for sale. All financial assets that are within the scope of IAS 39 are classified into one of the four categories.
1.10.1.1 Financial assets at fair value through profit and loss
An instrument is at fair value through profit or loss if it is held for trading or designated as such. Purchase or sale decisions with regard to these investments are managed in accordance with the municipality's documented risk or investment strategy. Financial assets at Fair value through profit or loss are stated at fair value, with any resultant gain or loss recognised in the statement of financial performance. The net gain or loss recognised in the statement of financial performance incorporates any dividend or interest earned on the financial asset.
1.10.1.2 Loans and receivables
Loans and receivables are non -derivative financial assets with fixed or determinable payments that are not quoted in an active market. They are included in current assets, except for maturities in excess of 12 months. These are classified as non -current assets. They include short -term receivables, such as property rates, trade and other receivables, and long -term receivables, such as loans granted. This category may also include financial assets that would have been impaired or past due if the terms of the instrument were not renegotiated.

Sedibeng District Municipality 132
Sedibeng District MunicipalityAnnual Financial Statements for the year ended 30 June 2012
Loans and receivables are recognised initially at fair value, plus transaction costs. Subsequently items in this category are measured at amortised cost using the effective interest rate, and interest income is included in the statement of financial performance for the period. Net gains or losses represent; reversals of impairment losses, impairment losses, refer to impairment of assets policy as well as gains or losses on derecognition. These net gains and losses are included in the statement of financial performance.
1.10.1.3 Held-to-maturity investments
Debt securities that the Municipality has the expressed intention and ability to hold to a fixed maturity date are recognised on a trade date basis and are initially measured at fair value plus transaction cost.
Subsequent to initial recognition, held -to -maturity assets are measured at amortised cost calculated using the effective interest method.
Investments which include listed government bonds, unlisted municipal bonds, fixed deposits and short term deposits invested in registered banks are stated at cost.
Surplus funds are invested in terms of Council’s Investment Policy. Investments are only made with financial institutions registered in terms of the Deposit Taking Institutions Act of 1990 with an A1 or similar rating institution for safe investment purposes.
The investment period should be such that it will not be necessary to borrow funds against the investments at a penalty interest rate to meet commitments.
1.10.1.4 Available for sale assets
Non -derivative assets that do not fall into any of the other categories are classified as available for sale. These financial instruments are stated at fair value plus transaction costs. Fair value is determined with reference to quoted market prices. Gains and losses arising from changes in fair value, with the exception of impairment losses, refer to assets management policy, are recognised directly in equity in the Mark -to -Market reserve.
Dividends on available for sale equity instruments are recognised in the surplus or deficit when the Municipality’s right to receive payment is established.
1.10.2 FINANCIAL LIABILITIES
Financial liabilities are recognised in the municipality's statement of financial position when the municipality becomes party to the contractual provisions of the instrument.
The municipality classifies its financial liabilities in the following categories: at fair value through profit or loss and other financial liabilities. The classification depends on the purpose for which the financial liabilities were issued/obtained.
1.10.2.1 Financial liabilities at fair value through profit or loss
Financial liabilities are classified as at Fair Value Through Profit or Loss where the financial liability is either held for trading or it is designated as at Fair Value Through Profit or Loss.
Financial liabilities at Fair Value Through Profit or Loss are stated at fair value, with any resultant gain or loss recognised in the statement of financial performance. Interest expense is calculated using the effective interest rate method and included as part of finance costs in the Statement of Financial Performance.
1.10.3 Other financial liabilities
Other financial liabilities, including interest bearing borrowings, are initially measured at fair value, net of transaction costs.
Subsequently, other financial liabilities are measured at amortised cost using the effective rate method, with interest costs being recognised on an effective yield basis.
1.11 INVENTORIES
Inventories are initially measured at cost which cost of inventories comprises of all costs of purchase, costs of development, costs of conversion and other costs incurred in bringing the inventories to their present location and condition.
Annual Report 2011/12133
Sedibeng District MunicipalityAnnual Financial Statements for the year ended 30 June 2012
Consumable stores, raw materials, work in progress, unused water, and finished goods are valued at the lower of cost and net realisable value. In general, the basis of determining cost is the weighted average cost of commodities.
Redundant and slow -moving stock are identified and written down with regard to their estimated economic or realisable values and sold by public auction. Consumables are written down with regard to age, condition and utility.
Unsold properties are valued at the lower of cost and net realisable value on a specific identification cost basis. Direct costs are accumulated for each separately identifiable development. Costs also include a proportion of overhead costs.
The municipality complied with Directive 4 of February 2008, on initial adoption of the standard of on Inventories, GRAP 12, and has done so retrospectively according to the Standard of GRAP on Accounting Policies, Changes in Accounting Estimates and Errors.
The necessary disclosures have been made for non -measurement of inventories in accordance with GRAP 12.
1.12 CASH AND CASH EQUIVALENTS
Cash includes cash on hand and cash with banks.
For the purposes of the cash flow statement, cash and cash equivalents comprise cash on hand and cash at bank. Short term investments are included. Bank overdrafts are recorded on the facility utilised. Finance charges on bank overdrafts are expensed as incurred.
1.13 PROVISIONS AND CONTINGENCIES
Provisions are recognised when the municipality has a present or constructive obligation, as a result of past events, that is probable to cause an outflow of resources embodying economic benefits required to settle the obligation and a reliable estimate of the provision can be made.
Where the effect of the time value of money is material, the amount of a provision is the present value of the expenditures expected to be required to settle the obligation. The discount rate used in calculating the present value is the interest rate implicit in the transaction. Where this is impractical to determine the average interest rate cost of borrowing rate of the Municipality is used.
Provisions are reviewed at each reporting date and adjusted to reflect the current best estimate. If it is no longer probable that an outflow of resources embodying economic benefits or service potential will be required to settle the obligation, the provision is reversed.
The municipality on initial adoption of the standard of GRAP on Provisions, Contingent Liabilities and Contingent Assets has done so retrospectively according to the Standard of GRAP on Accounting Policies, Changes in Accounting Estimates and Errors.
Due to the transitional provisions under the Standard of GRAP on Property, Plant and Equipment, certain assets have not been recognised as Property, Plant and Equipment. Due to the non -recognition of such assets, the requirements of the Standard on Provisions, Contingent Liabilities and Contingent assets have not been applied until the expiration the Property, Plant and Equipment transitional provisions. All necessary disclosure for those assets not recognised as Property, Plant and Equipment have been made.
The municipality complied with Directive 4 of February 2008, on initial adoption of the standard of on Provisions, Contingent Liabilities and Contingent Assets, GRAP 19, and has done so retrospectively according to the Standard of GRAP on Accounting Policies, Changes in Accounting Estimates and Errors.
Where items have not been recognised in accordance with GRAP 17, Property, Plant and equipment as a result of transitional provisions, which take precedence over the requirements of GRAP 19. The GRAP 17 will have to be complied with first, or transitional provisions of this standard are to expire prior to application of GRAP 19.
The necessary disclosures have been made for non -recognition of provisions (which form part of the cost of an asset).
1.14 EMPLOYEE BENEFITS
1.14.1 Short-term employee benefits
The cost of short -term employee benefits, which include salaries and wages, short -term compensated absences and profit sharing and bonus plans, are expensed in the Statement of Financial Performance in the financial year during which the
Sedibeng District Municipality 134
Sedibeng District MunicipalityAnnual Financial Statements for the year ended 30 June 2012
payment is made.
Liabilities for short -term employee benefits that are unpaid at year -end are measured at the undiscounted amount that the municipality expected to pay in exchange for that service that had accumulated at the reporting date.
1.14.2 Termination Benefits
Termination benefits are recognised when actions have been taken that indicate that the municipality is demonstrably committed to either terminate the employment of an employee or group of employees before the normal retirement date; or provide termination benefits as a result of an offer made in order to encourage voluntary redundancy.
1.14.3 Retirement benefits
The municipality provides retirement benefits for its employees and councilors.
Contributions to defined contribution retirement benefit plans are recognised as an expense when employees and councilors have rendered the employment service or served office entitling them to the contributions.
1.14.4 Defined contribution plans
A defined contribution plan is a post -employment benefit plan under which the municipality pays fixed contributions into a separate entity and will have no legal or constructive obligation to pay further amounts. Obligations for contributions to defined contribution pension plans are recognised as an employee benefit expense in the statement of financial performance when they are due. Prepaid contributions are recognised as an asset to the extent that a cash refund or a reduction in future payments is available.
1.14.5 Post employment medical care benefits
The municipality provides post employment medical care benefits to its employees and their legitimate spouses. The entitlement to post–retirement medical benefits is based on employees remaining in service up to retirement age and the completion of a minimum service period.
1.15 REVENUE RECOGNITION
Revenue shall be measured at the fair value of the consideration received or receivable. Revenue is reduced for estimated customer returns, rebates, VAT and other similar allowances.
1.15.1 Revenue from exchange transactions
Rendering of services
Flat rate service charges relating to rental of facilities and the reporting date shall be recognised when:
• It is probable that the economic benefits or service potential associated with the transaction will flow to the municipality; and
• The amount of the revenue can be measured reliably.
Interest, royalties and dividends
Interest shall be recognised on a time proportionate basis that takes into account the effective yield on the asset;
Royalties are recognised as they are earned on a time basis is recognised on a straight -line basis over the period of the agreement. Royalty revenue that is based on production, sales and other measures is recognised in accordance with the substance of the relevant agreement; and
Dividends are recognised on the date that the Municipality becomes entitled to receive the dividend.
Agency Services
Income for agency services is recognised on a monthly basis once the income collected on behalf of agents has been quantified.
The income recognised is in terms of the agency agreement.
Collection charges are recognised when such amounts are incurred.

Annual Report 2011/12135
Sedibeng District MunicipalityAnnual Financial Statements for the year ended 30 June 2012
The municipality complied with Directive 4 of February 2008, on initial adoption of the standard of on Revenue from Exchange Transaction, GRAP 9, and has done so retrospectively according to the Standard of GRAP on Accounting Policies, Changes in Accounting Estimates and Errors.
Sale of Goods
Revenue from the sale of goods is recognised when all the following conditions have been satisfied:
• The municipality has transferred to the purchaser the significant risks and rewards of ownership of goods;• The municipality retains neither continuing managerial involvement to the degree usually associated with
ownership nor effective control over goods sold;• The amount of revenue can be measured reliably;• It is probable that the economic benefits or service potential associated with the transaction will flow to the
municipality; and• The costs incurred or to be incurred in respect of the transaction can be measured reliable.
1.15.2 Revenue from non-exchange transactions
Grants and donations received
Government Grants can be in the form of grants to acquire or construct fixed assets (capital grants), grants for the furtherance of national and provincial government policy objectives and general grants to subsidise the cost incurred by municipalities rendering services.
Capital grants and general grants for the furtherance of government policy objectives are usually restricted revenue in that stipulations are imposed in their use.
Conditional grants, donations and funding were recognised as revenue in the Statement of Financial Performance to the extent that the Municipality has complied with any criteria, conditions or obligations embodied in the agreement/arrangement. To the extent that the criteria, conditions and obligations have not been met a liability is raised in the Statement of Financial Position. Unconditional grants, donations and funding are recognised as revenue in the Statement of Financial Performance at the earlier of the date of receipt or when the amount is receivable.
Contributed assets are recognised at fair value when the risks and rewards associated with such assets are transferred to the Municipality.
1.15.3 Transfer revenue
Assets and revenue recognised as a consequence of a transfer at no or nominal cost is measured at the fair value of the assets recognised as at the date of recognition. Non -monetary assets are measured at their fair value, which is determined by reference to observable market values or by independent appraisal by a member of the valuation profession.
1.15.4 Other
Revenue from the recovery of unauthorised, irregular, fruitless and wasteful expenditure is based on legislated procedures, including those set out in the Municipal Finance Management Act (Act No.56 of 2003) and is recognised when the recovery thereof from the responsible councilors or officials is virtually certain.
Revenue from the recovery of unauthorised irregular, fruitless and wasteful expenditure is based on legislated procedures.
VALUE ADDED TAX
The municipality accounts for Value Added Tax on the cash basis.
1.17 UNAUTHORISED EXPENDITURE
Unauthorised expenditure is expenditure that has not been budgeted, expenditure that is not in terms of the conditions of an allocation received from another sphere of government, municipality or organ of state and expenditure in the form of a grant that is not permitted in terms of the Municipal Finance Management Act (Act 56 of 2003).

Sedibeng District Municipality 136
Sedibeng District MunicipalityAnnual Financial Statements for the year ended 30 June 2012
Unauthorised expenditure is accounted for as an expense in the Statement of Financial Performance and where recovered, it is subsequently accounted for as revenue in the Statement of Financial Performance.
1.18 IRREGULAR EXPENDITURE
Irregular expenditure is expenditure that is contrary to the Municipal Finance Act (Act 56 of 2003), the Municipal Systems Act (Act 32 of 2000), the Public Office Bearers Act (Act 20 of 1998) or is in contravention of the municipality’s supply chain management policy. Irregular expenditure excludes unauthorised expenditure. Irregular expenditure is accounted for as expenditure in the Statement of Financial Performance and where recovered, it is subsequently accounted for as revenue in the Statement of Financial Performance.
1.19 FRUITLESS AND WASTEFUL EXPENDITURE
Fruitless and wasteful expenditure is expenditure that was made in vain and would have been avoided had reasonable care been exercised. Fruitless and wasteful expenditure is accounted for as expenditure in the Statement of Financial Performance and where recovered, it is subsequently accounted for as revenue in the Statement of Financial Performance.
1.20 COMPARATIVE INFORMATION
When the presentation or classification of items in the annual financial statements is amended, prior period comparative amounts are reclassified. The nature and reason for the reclassification is disclosed.

Annual Report 2011/12
Sedibeng District MunicipalityAnnual Financial Statements for the year ended 30 June 2012
Notes to the Annual Financial StatementsFigures in Rand 2012 2011
137
2. Property, plant and equipment
2012 2011
Cost / Valuation Accumulated depre-ciation and accumu-
lated impairment
Carrying value
Cost / Valuation Accumulated de-preciation and accumulated impairment
Carrying value
Land 41,907,735 (608,655) 41,299,080 41,907,735 (608,655) 41,299,080
Buildings 72,866,451 (8,176,676) 64,689,775 72,653,251 (5,738,828) 66,914,423
Furniture and fixtures 15,572,819 (11,675,252) 3,897,567 15,010,431 (10,501,683) 4,508,748
Motor vehicles 10,134,059 (5,753,465) 4,380,594 12,111,460 (5,984,223) 6,127,237
Electronic equipment 32,372,675 (11,962,447) 20,410,228 22,723,171 (8,541,550) 14,181,621
Infrastructure 71,796,612 (25,868,354) 45,928,258 68,796,613 (14,763,303) 54,033,310
Plant and equipment 8,610,440 (5,530,133) 3,080,307 9,468,404 (4,528,615) 4,939,789
Specialised vehicles 699,972 (151,996) 547,976 745,973 (158,456) 587,517
Total 253,960,763 (69,726,978) 184,233,785 243,417,038 (50,825,313) 192,591,725
Reconciliation of property, plant and equipment - 2012
Opening balance Additions Disposals Depreciation Total
Land 41,299,080 - - - 41,299,080
Buildings 66,914,423 213,200 - (2,437,848) 64,689,775
Furniture and fixtures 4,508,748 699,135 (14,270) (1,296,046) 3,897,567
Motor vehicles 6,127,237 - (149,964) (1,596,679) 4,380,594
Electronic equipment 14,181,621 11,191,319 (53,505) (4,909,207) 20,410,228
Infrastructure 54,033,310 2,999,999 - (11,105,051) 45,928,258
Plant and equipment 4,939,789 31,420 (180,630) (1,710,272) 3,080,307
Specialised vehicles 587,517 - (9,176) (30,365) 547,976
192,591,725 15,135,073 (407,545) (23,085,468) 184,233,785
Reconciliation of property, plant and equipment – 2011
Opening balance Additions Disposals Depreciation Total
Land 41,299,080 - - - 41,299,080
Buildings 68,683,927 640,412 - (2,409,916) 66,914,423
Furniture and fixtures 4,119,665 2,427,801 (12,670) (2,026,048) 4,508,748
Motor vehicles 4,415,997 3,163,648 (32,930) (1,419,478) 6,127,237
Electronic equipment 5,766,453 10,535,418 (120,964) (1,999,286) 14,181,621
Infrastructure 44,239,324 17,246,200 - (7,452,214) 54,033,310
Plant and equipment 5,070,803 1,412,305 - (1,543,319) 4,939,789
Specialised vehicles 311,296 292,882 - (16,661) 587,517
173,906,545 35,718,666 (166,564) (16,866,922) 192,591,725
A register containing the information required by section 63 of the Municipal Finance Management Act is available for inspection at the registered office of the municipality.
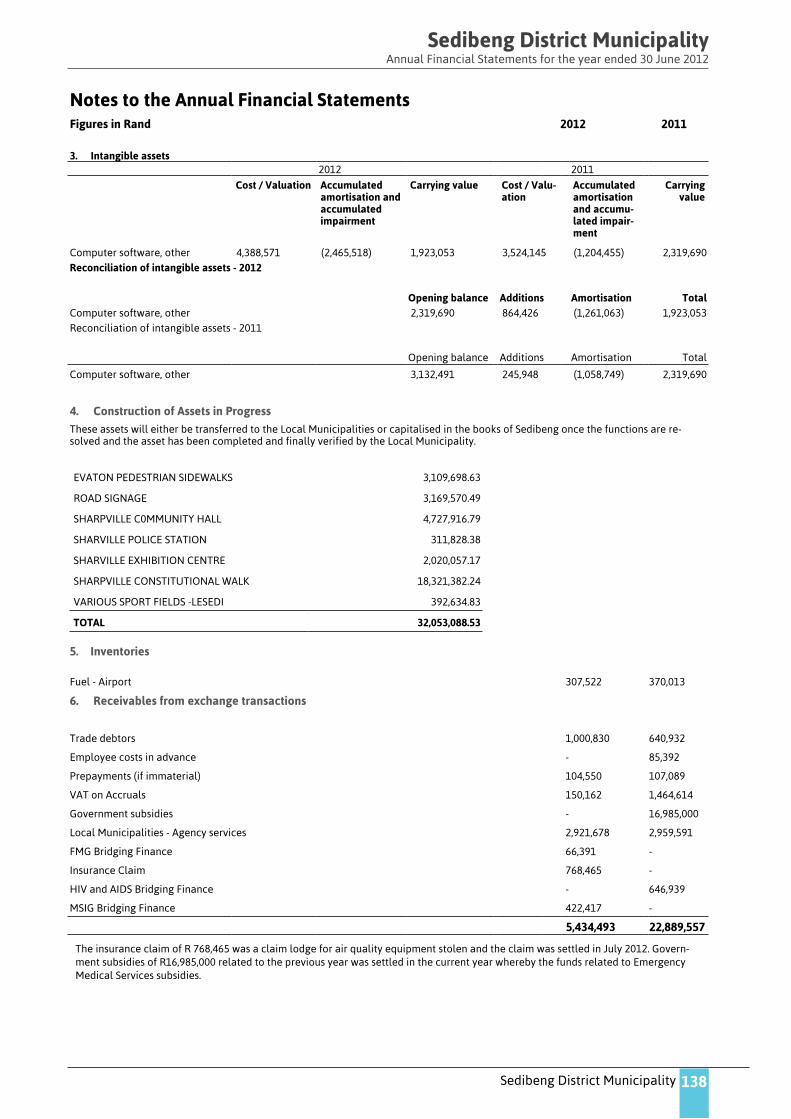
Sedibeng District Municipality
Sedibeng District MunicipalityAnnual Financial Statements for the year ended 30 June 2012
Notes to the Annual Financial StatementsFigures in Rand 2012 2011
138
3. Intangible assets2012 2011
Cost / Valuation Accumulated amortisation and accumulated impairment
Carrying value Cost / Valu-ation
Accumulated amortisation and accumu-lated impair-ment
Carrying value
Computer software, other 4,388,571 (2,465,518) 1,923,053 3,524,145 (1,204,455) 2,319,690 Reconciliation of intangible assets - 2012
Opening balance Additions Amortisation TotalComputer software, other 2,319,690 864,426 (1,261,063) 1,923,053 Reconciliation of intangible assets - 2011
Opening balance Additions Amortisation Total
Computer software, other 3,132,491 245,948 (1,058,749) 2,319,690
4. Construction of Assets in Progress
These assets will either be transferred to the Local Municipalities or capitalised in the books of Sedibeng once the functions are re -solved and the asset has been completed and finally verified by the Local Municipality.
EVATON PEDESTRIAN SIDEWALKS 3,109,698.63
ROAD SIGNAGE 3,169,570.49
SHARPVILLE C0MMUNITY HALL 4,727,916.79
SHARVILLE POLICE STATION 311,828.38
SHARVILLE EXHIBITION CENTRE 2,020,057.17
SHARPVILLE CONSTITUTIONAL WALK 18,321,382.24
VARIOUS SPORT FIELDS -LESEDI 392,634.83
TOTAL 32,053,088.53
5. Inventories
Fuel - Airport 307,522 370,013
6. Receivables from exchange transactions
Trade debtors 1,000,830 640,932
Employee costs in advance - 85,392
Prepayments (if immaterial) 104,550 107,089
VAT on Accruals 150,162 1,464,614
Government subsidies - 16,985,000
Local Municipalities - Agency services 2,921,678 2,959,591
FMG Bridging Finance 66,391 -
Insurance Claim 768,465 -
HIV and AIDS Bridging Finance - 646,939
MSIG Bridging Finance 422,417 -
5,434,493 22,889,557
The insurance claim of R 768,465 was a claim lodge for air quality equipment stolen and the claim was settled in July 2012. Govern -ment subsidies of R16,985,000 related to the previous year was settled in the current year whereby the funds related to Emergency Medical Services subsidies.
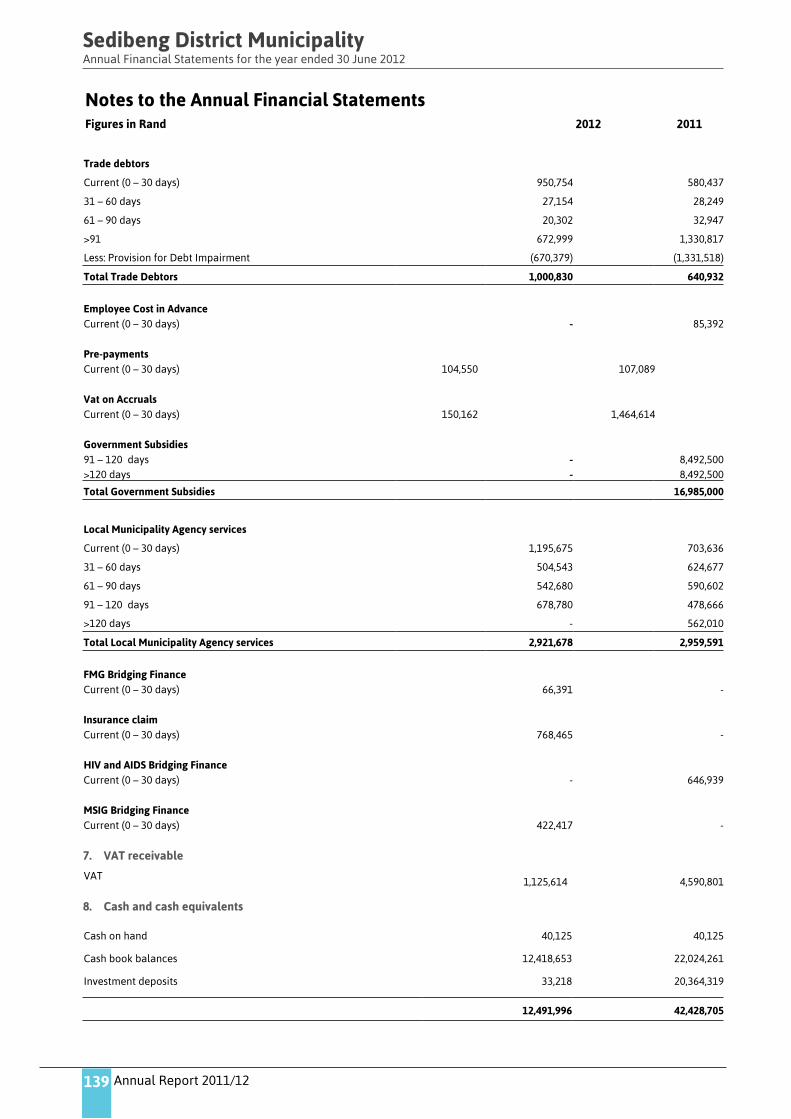
Annual Report 2011/12
Sedibeng District MunicipalityAnnual Financial Statements for the year ended 30 June 2012
Notes to the Annual Financial StatementsFigures in Rand 2012 2011
139
Trade debtors
Current (0 – 30 days) 950,754 580,437
31 – 60 days 27,154 28,249
61 – 90 days 20,302 32,947
>91 672,999 1,330,817
Less: Provision for Debt Impairment (670,379) (1,331,518)
Total Trade Debtors 1,000,830 640,932
Employee Cost in AdvanceCurrent (0 – 30 days) - 85,392
Pre-paymentsCurrent (0 – 30 days) 104,550 107,089
Vat on AccrualsCurrent (0 – 30 days) 150,162 1,464,614
Government Subsidies91 – 120 days - 8,492,500>120 days - 8,492,500
Total Government Subsidies 16,985,000
Local Municipality Agency services
Current (0 – 30 days) 1,195,675 703,636
31 – 60 days 504,543 624,677
61 – 90 days 542,680 590,602
91 – 120 days 678,780 478,666
>120 days - 562,010
Total Local Municipality Agency services 2,921,678 2,959,591
FMG Bridging FinanceCurrent (0 – 30 days) 66,391 -
Insurance claimCurrent (0 – 30 days) 768,465 -
HIV and AIDS Bridging FinanceCurrent (0 – 30 days) - 646,939
MSIG Bridging FinanceCurrent (0 – 30 days) 422,417 -
7. VAT receivable
VAT 1,125,614 4,590,801
8. Cash and cash equivalents
Cash on hand 40,125 40,125
Cash book balances 12,418,653 22,024,261
Investment deposits 33,218 20,364,319
12,491,996 42,428,705
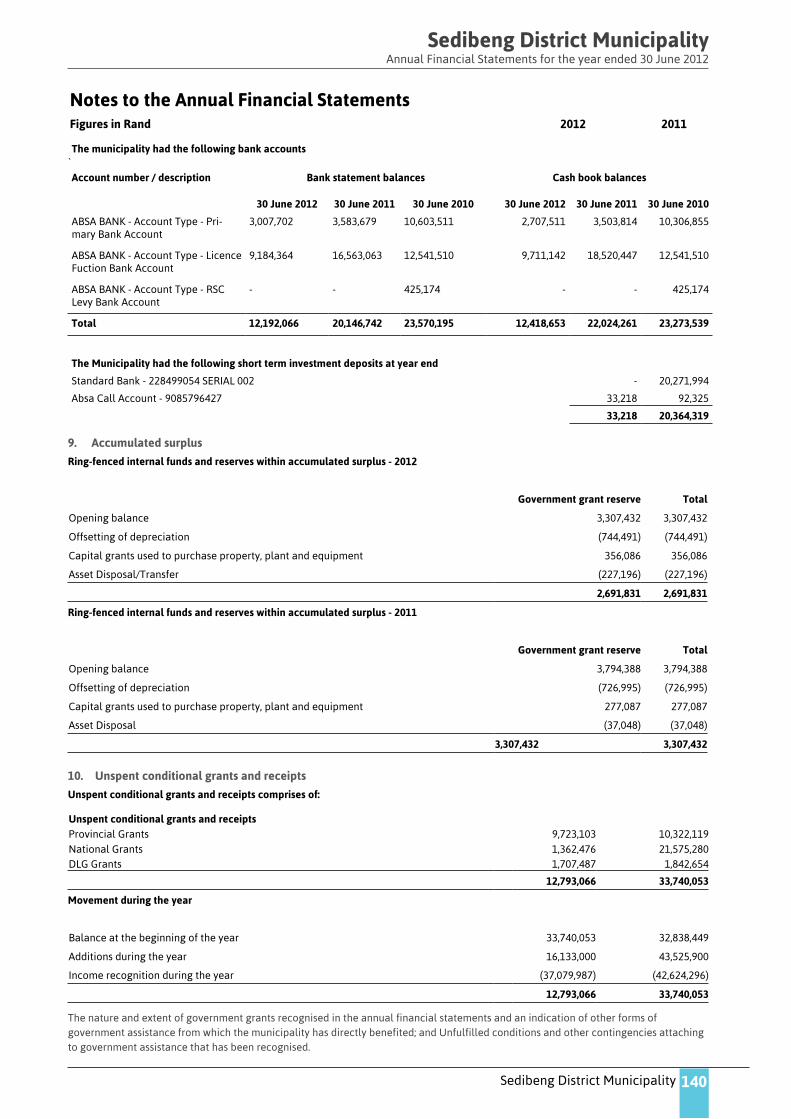
Sedibeng District Municipality
Sedibeng District MunicipalityAnnual Financial Statements for the year ended 30 June 2012
Notes to the Annual Financial StatementsFigures in Rand 2012 2011
140
The nature and extent of government grants recognised in the annual financial statements and an indication of other forms of government assistance from which the municipality has directly benefited; and Unfulfilled conditions and other contingencies attaching to government assistance that has been recognised.
The municipality had the following bank accounts`Account number / description Bank statement balances Cash book balances
30 June 2012 30 June 2011 30 June 2010 30 June 2012 30 June 2011 30 June 2010
ABSA BANK - Account Type - Pri -mary Bank Account
3,007,702 3,583,679 10,603,511 2,707,511 3,503,814 10,306,855
ABSA BANK - Account Type - Licence Fuction Bank Account
9,184,364 16,563,063 12,541,510 9,711,142 18,520,447 12,541,510
ABSA BANK - Account Type - RSC Levy Bank Account
- - 425,174 - - 425,174
Total 12,192,066 20,146,742 23,570,195 12,418,653 22,024,261 23,273,539
The Municipality had the following short term investment deposits at year end
Standard Bank - 228499054 SERIAL 002 - 20,271,994
Absa Call Account - 9085796427 33,218 92,325
33,218 20,364,319
9. Accumulated surplus
Ring-fenced internal funds and reserves within accumulated surplus - 2012
Government grant reserve Total
Opening balance 3,307,432 3,307,432
Offsetting of depreciation (744,491) (744,491)
Capital grants used to purchase property, plant and equipment 356,086 356,086
Asset Disposal/Transfer (227,196) (227,196)
2,691,831 2,691,831
Ring-fenced internal funds and reserves within accumulated surplus - 2011
Government grant reserve Total
Opening balance 3,794,388 3,794,388
Offsetting of depreciation (726,995) (726,995)
Capital grants used to purchase property, plant and equipment 277,087 277,087
Asset Disposal (37,048) (37,048)
3,307,432 3,307,432
10. Unspent conditional grants and receipts
Unspent conditional grants and receipts comprises of:
Unspent conditional grants and receiptsProvincial Grants 9,723,103 10,322,119National Grants 1,362,476 21,575,280DLG Grants 1,707,487 1,842,654
12,793,066 33,740,053
Movement during the year
Balance at the beginning of the year 33,740,053 32,838,449
Additions during the year 16,133,000 43,525,900
Income recognition during the year (37,079,987) (42,624,296)
12,793,066 33,740,053
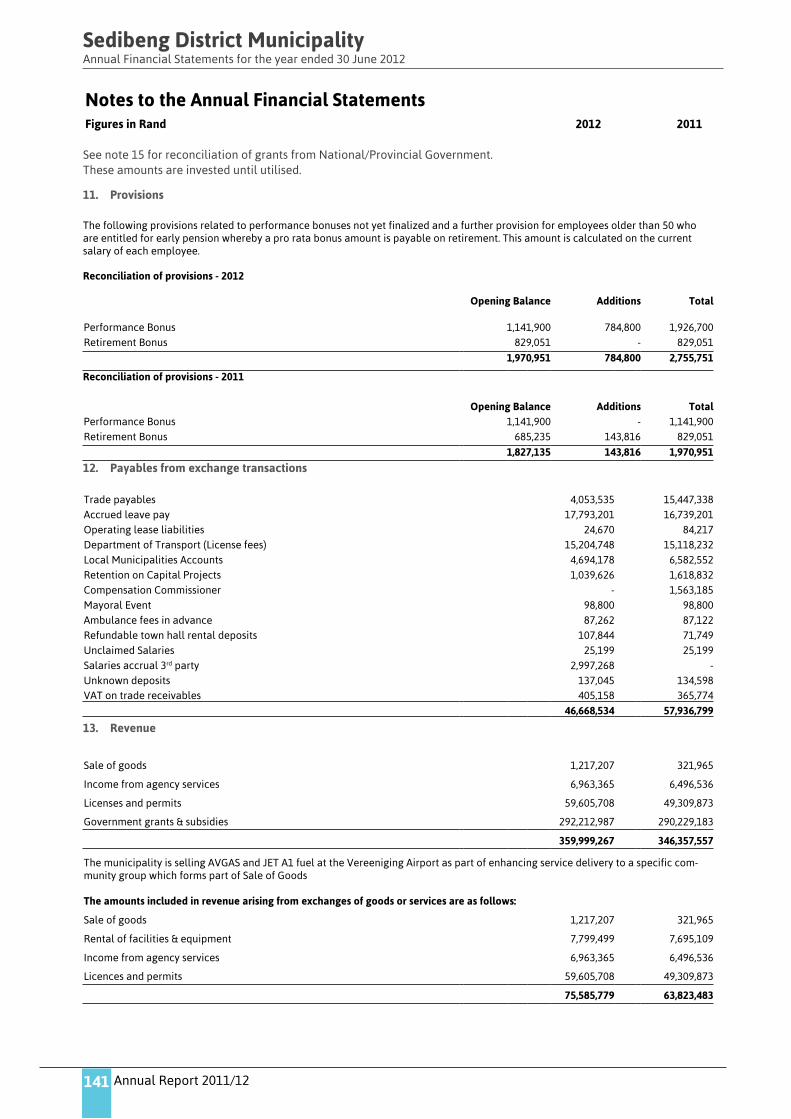
Annual Report 2011/12
Sedibeng District MunicipalityAnnual Financial Statements for the year ended 30 June 2012
Notes to the Annual Financial StatementsFigures in Rand 2012 2011
141
See note 15 for reconciliation of grants from National/Provincial Government.These amounts are invested until utilised.
11. Provisions
The following provisions related to performance bonuses not yet finalized and a further provision for employees older than 50 who are entitled for early pension whereby a pro rata bonus amount is payable on retirement. This amount is calculated on the current salary of each employee.
Reconciliation of provisions - 2012
Opening Balance Additions Total
Performance Bonus 1,141,900 784,800 1,926,700Retirement Bonus 829,051 - 829,051
1,970,951 784,800 2,755,751
Reconciliation of provisions - 2011
Opening Balance Additions TotalPerformance Bonus 1,141,900 - 1,141,900Retirement Bonus 685,235 143,816 829,051
1,827,135 143,816 1,970,951
12. Payables from exchange transactions
Trade payables 4,053,535 15,447,338Accrued leave pay 17,793,201 16,739,201Operating lease liabilities 24,670 84,217Department of Transport (License fees) 15,204,748 15,118,232Local Municipalities Accounts 4,694,178 6,582,552Retention on Capital Projects 1,039,626 1,618,832Compensation Commissioner - 1,563,185Mayoral Event 98,800 98,800Ambulance fees in advance 87,262 87,122Refundable town hall rental deposits 107,844 71,749Unclaimed Salaries 25,199 25,199Salaries accrual 3rd party 2,997,268 -Unknown deposits 137,045 134,598VAT on trade receivables 405,158 365,774
46,668,534 57,936,799
13. Revenue
Sale of goods 1,217,207 321,965
Income from agency services 6,963,365 6,496,536
Licenses and permits 59,605,708 49,309,873
Government grants & subsidies 292,212,987 290,229,183
359,999,267 346,357,557
The municipality is selling AVGAS and JET A1 fuel at the Vereeniging Airport as part of enhancing service delivery to a specific com -munity group which forms part of Sale of Goods
The amounts included in revenue arising from exchanges of goods or services are as follows:
Sale of goods 1,217,207 321,965
Rental of facilities & equipment 7,799,499 7,695,109
Income from agency services 6,963,365 6,496,536
Licences and permits 59,605,708 49,309,873
75,585,779 63,823,483

Sedibeng District Municipality
Sedibeng District MunicipalityAnnual Financial Statements for the year ended 30 June 2012
Notes to the Annual Financial StatementsFigures in Rand 2012 2011
142
The amounts included in revenue arising from non-exchange transactions is as follows:
Transfer revenue
Levies 292,212,987 290,229,183
14. Cost of sales
Sale of goods
Cost of goods sold - Avgas Fuel 1,349,956 413,976
This expense forms part of general expenditure as per note 17
15. Government grants and subsidies
Equitable share 220,439,000 213,221,000
Ambulance Subsidies 34,694,000 33,970,000
Support Grants 37,079,987 43,038,183
292,212,987 290,229,183
Equitable Share
Current -year receipts (220,439,000) (213,221,000)
Conditions met - transferred to revenue 220,439,000 213,221,000
- -
Emergency Medical Services
Current -year receipts (34,694,000) (33,970,000)
Conditions met - transferred to revenue 34,694,000 33,970,000
- -
Provincial Grants
Balance unspent at beginning of year 10,322,119 10,654,036
Current -year receipts 8,083,000 4,427,900
Conditions met - transferred to revenue (8,682,016) (4,759,817)
9,723,103 10,322,119
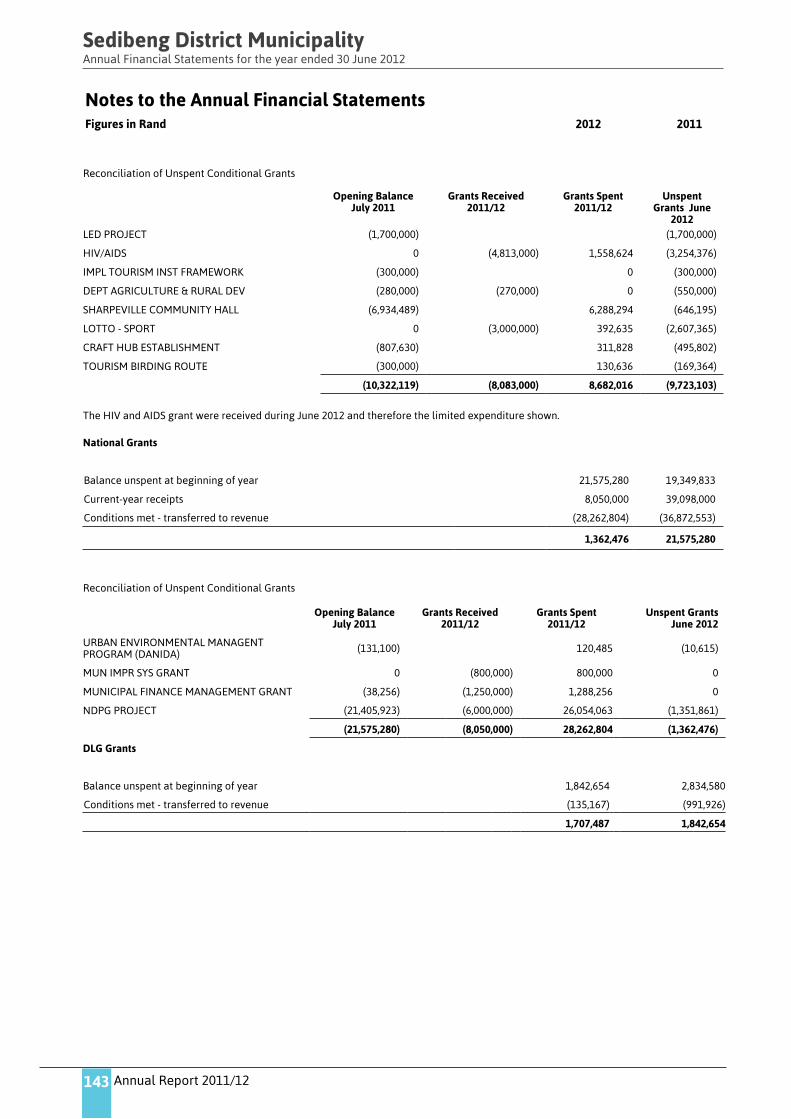
Annual Report 2011/12
Sedibeng District MunicipalityAnnual Financial Statements for the year ended 30 June 2012
Notes to the Annual Financial StatementsFigures in Rand 2012 2011
143
Reconciliation of Unspent Conditional Grants
Opening Balance July 2011
Grants Received 2011/12
Grants Spent 2011/12
Unspent Grants June
2012LED PROJECT (1,700,000) (1,700,000)
HIV/AIDS 0 (4,813,000) 1,558,624 (3,254,376)
IMPL TOURISM INST FRAMEWORK (300,000) 0 (300,000)
DEPT AGRICULTURE & RURAL DEV (280,000) (270,000) 0 (550,000)
SHARPEVILLE COMMUNITY HALL (6,934,489) 6,288,294 (646,195)
LOTTO - SPORT 0 (3,000,000) 392,635 (2,607,365)
CRAFT HUB ESTABLISHMENT (807,630) 311,828 (495,802)
TOURISM BIRDING ROUTE (300,000) 130,636 (169,364)
(10,322,119) (8,083,000) 8,682,016 (9,723,103)
The HIV and AIDS grant were received during June 2012 and therefore the limited expenditure shown.
National Grants
Balance unspent at beginning of year 21,575,280 19,349,833
Current -year receipts 8,050,000 39,098,000
Conditions met - transferred to revenue (28,262,804) (36,872,553)
1,362,476 21,575,280
Reconciliation of Unspent Conditional Grants
Opening Balance July 2011
Grants Received 2011/12
Grants Spent 2011/12
Unspent Grants June 2012
URBAN ENVIRONMENTAL MANAGENT PROGRAM (DANIDA) (131,100) 120,485 (10,615)
MUN IMPR SYS GRANT 0 (800,000) 800,000 0
MUNICIPAL FINANCE MANAGEMENT GRANT (38,256) (1,250,000) 1,288,256 0
NDPG PROJECT (21,405,923) (6,000,000) 26,054,063 (1,351,861)
(21,575,280) (8,050,000) 28,262,804 (1,362,476)
DLG Grants
Balance unspent at beginning of year 1,842,654 2,834,580
Conditions met - transferred to revenue (135,167) (991,926)
1,707,487 1,842,654
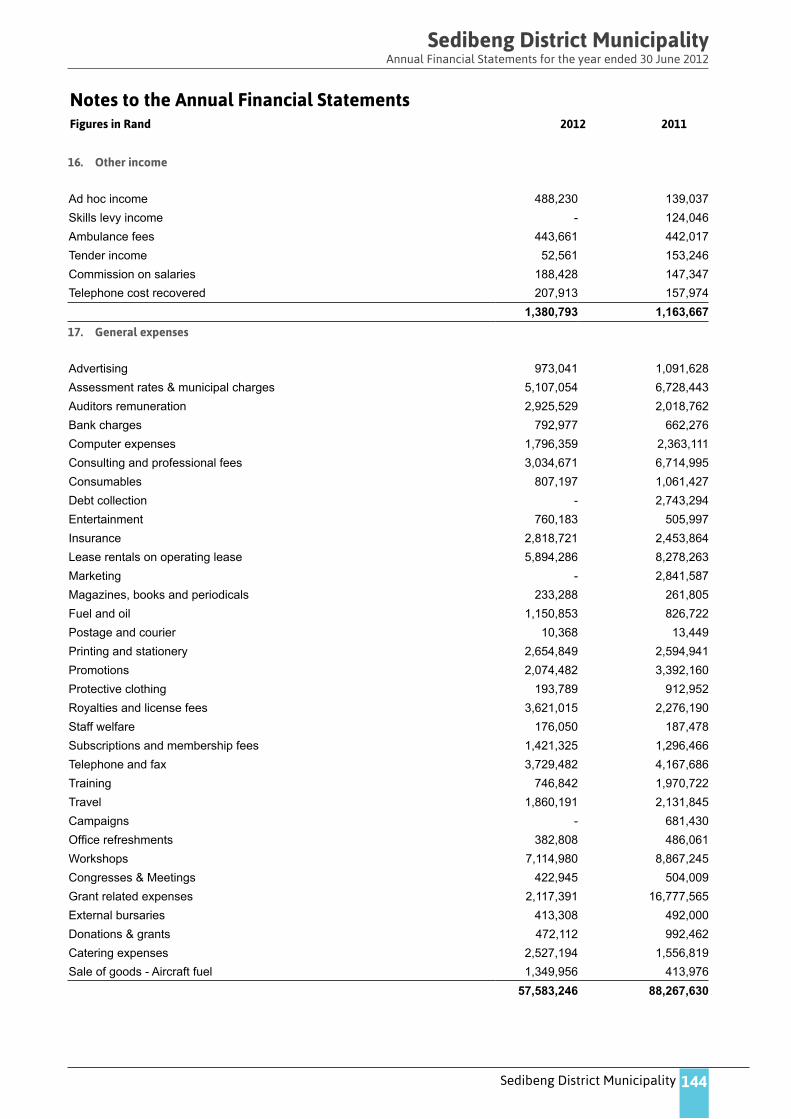
Sedibeng District Municipality
Sedibeng District MunicipalityAnnual Financial Statements for the year ended 30 June 2012
Notes to the Annual Financial StatementsFigures in Rand 2012 2011
144
16. Other income
Ad hoc income 488,230 139,037Skills levy income - 124,046Ambulance fees 443,661 442,017Tender income 52,561 153,246Commission on salaries 188,428 147,347Telephone cost recovered 207,913 157,974
1,380,793 1,163,66717. General expenses
Advertising 973,041 1,091,628Assessment rates & municipal charges 5,107,054 6,728,443Auditors remuneration 2,925,529 2,018,762Bank charges 792,977 662,276Computer expenses 1,796,359 2,363,111Consulting and professional fees 3,034,671 6,714,995Consumables 807,197 1,061,427Debt collection - 2,743,294Entertainment 760,183 505,997Insurance 2,818,721 2,453,864Lease rentals on operating lease 5,894,286 8,278,263Marketing - 2,841,587Magazines, books and periodicals 233,288 261,805Fuel and oil 1,150,853 826,722Postage and courier 10,368 13,449Printing and stationery 2,654,849 2,594,941Promotions 2,074,482 3,392,160Protective clothing 193,789 912,952Royalties and license fees 3,621,015 2,276,190Staff welfare 176,050 187,478Subscriptions and membership fees 1,421,325 1,296,466Telephone and fax 3,729,482 4,167,686Training 746,842 1,970,722Travel 1,860,191 2,131,845Campaigns - 681,430Office refreshments 382,808 486,061Workshops 7,114,980 8,867,245Congresses & Meetings 422,945 504,009Grant related expenses 2,117,391 16,777,565External bursaries 413,308 492,000Donations & grants 472,112 992,462Catering expenses 2,527,194 1,556,819Sale of goods - Aircraft fuel 1,349,956 413,976
57,583,246 88,267,630

Annual Report 2011/12
Sedibeng District MunicipalityAnnual Financial Statements for the year ended 30 June 2012
Notes to the Annual Financial StatementsFigures in Rand 2012 2011
145
18. Employee related costs
Employee related costs exclusive of Section 57 employees 141,468,141 138,410,255Medical aid - company contributions 12,566,370 11,510,204UIF 1,157,801 1,188,621WCA 1,803,450 1,563,185SDL 1,772,745 1,774,466Other payroll levies 2,698,069 2,731,895Leave pay charge 2,565,817 4,142,851Post‑employment benefits ‑ Pension ‑ Defined contribution plan 28,691,427 27,306,816Overtime payments 5,078,430 9,073,41013th Cheques 11,735,255 14,777,634Car allowance 9,174,893 10,890,088Housing benefits and allowances 1,270,591 1,133,404Telephone Allowances 500 500Standby Allowance 1,820,817 1,904,083
221,804,306 226,407,412Remuneration of Municipal Manager
Annual Remuneration 978,092 897,906Car Allowance 119,784 119,784Contributions to UIF, Medical and Pension Funds 88,675 83,666
1,186,551 1,101,356Remuneration of Chief Finance Officer
Annual Remuneration 593,410 556,417Car Allowance 122,000 120,000Contributions to UIF, Medical and Pension Funds 167,500 159,772Housing Allowance 4,800 4,800
887,710 840,989Remuneration of Executive Directors
Annual Remuneration 2,849,073 2,277,043Car Allowance 372,348 372,348Contributions to UIF, Medical and Pension Funds 303,377 294,070
3,524,798 2,943,461Remuneration of Chief Operating Officer
Annual Remuneration 943,005 894,007Contributions to UIF, Medical and Pension Funds 46,013 43,746
989,018 937,753Total 228,392,383 232,230,971

Sedibeng District Municipality
Sedibeng District MunicipalityAnnual Financial Statements for the year ended 30 June 2012
Notes to the Annual Financial StatementsFigures in Rand 2012 2011
146
19. Remuneration of Councilors
Executive Mayor 694,124 656,507Mayoral Committee Members 4,454,813 3,963,438Speaker 574,916 527,510Councillors 2,866,775 2,449,887Councilors’ pension contribution 816,447 771,313
9,407,075 8,368,655Benefits-in-kindThe Executive Mayor, Speaker, Chief Whip and Mayoral Committee Members are full time. Each is provided with an office and secretarial support at the cost of the Council.
The Executive Mayor has the use of a Council owned vehicle for official duties. The Executive Mayor and Speaker have full time bodyguards.
20. Debt impairment
Debt impairment 93,999 37,761
21. Investment revenue
Interest revenue
Bank 2,221,854 6,237,003
22. Depreciation and amortisation
Property, plant and equipment 22,340,978 16,153,659
Intangible assets 1,261,063 1,045,019
23,602,041 17,198,678
23. Finance costs
Council currently do not have any financial leases
24. Auditors' remuneration
Fees 2,925,529 2,018,762
25. Contracted services
Specialist Services 15,883,633 11,747,604
Security services Contract 15,014,886 13,688,494
Facility Contracts 1,642,103 2,330,960
Utility Contracts 3,838,438 2,352,919
Local Economic Development & Growth Development Strategy Contracts 1,335,422 413,887
Other Contracts 5,008,595 6,539,045
42,723,077 37,072,909
26. Grants and subsidies paid
Other subsidies
Grants paid to Local Municipalities 250,000 84,710,637

Annual Report 2011/12
Sedibeng District MunicipalityAnnual Financial Statements for the year ended 30 June 2012
Notes to the Annual Financial StatementsFigures in Rand 2012 2011
147
27. Cash used in operations
Surplus (deficit) 4,425,113 (114,344,628)
Adjustments for:
Depreciation 23,602,041 17,198,678
Loss / (Gain) on sale of assets and liabilities (1,161,731) (107,092)
Debt impairment 93,999 37,761
Movements in provisions 784,800 143,816
Government grant reserve movement 128,889 240,036
Changes in working capital:
Inventories 62,491 (259,619)
Receivables from exchange transactions 17,455,064 (13,570,968)
Consumer debtors (93,999) (37,761)
Construction of Assets in Progress (32,053,089) 33,205,456
Payables from exchange transactions (11,268,265) 33,416,019
VAT 3,465,187 3,324,042
Unspent conditional grants and receipts (20,946,987) 901,604
(15,506,487) (39,852,656)
28 CommitmentsAuthorized capital and operating expenditure
Unspent conditional grants and receipts
Provincial Grants 9,723,103 10,322,119
National Grants 1,362,476 21,575,280
DLG Grants 1,707,487 1,842,654
12,793,066 33,740,053
The current unspent conditional grants are all committed funds which still need to be utilized in order to meet the conditions as stipulated in the various government gazettes.
Operating leases - as lessee (expense)
Minimum lease payments due
- Later than one year and not later than five years 7,171,424 7,323,949
- Later than 5 years - 1,120,720
Less: Future Finance charges 59,547 (21,031)
7,230,971 8,423,638
Operating lease payments represent rentals payable by the municipality for certain of its office properties. Leases are negotiated for an average term of seven years and rentals are fixed for an average of three years. No contingent rent is payable.
29. Contingencies
Contingent Liability
The Municipality may be liable for claims instituted against the Municipality by employees who have disputes against the Municipality. The amount is uncertain as an arbitration award has not yet being issued against those claims.
There is currently a dispute between Sedibeng District Municipality and the Gauteng Department of Transport relating to the treatment of VAT on agency services. Council may be liable for an amount of R 34,720,142.

Sedibeng District Municipality
Sedibeng District MunicipalityAnnual Financial Statements for the year ended 30 June 2012
Notes to the Annual Financial StatementsFigures in Rand 2012 2011
148
The 2006 financial year VAT review has not yet been finalized and an amount of R2,6 Million might be recovered from the South African Revenue Service.
Emergency Medical Services is the process of being transferred to the Department of Health whereby unfunded expenditure related to the previous year’s might be recoverable which amounts to R 43,694,068.
A change in legislation regarding the treatment of UIF payments relating to Councilors resulted in a possible refund to Council which amounts to R 83,823 for the period.
30. Prior period errors
The correction of the error(s) results in adjustments as follows:
The municipality has done a vat review exercise and revenue relating to prior period was discovered. Corrections in this regard were made which effect the prior periods. License fees were also recalculated based on a VAT ruling pending while previous year creditors were under and over stated and were rectified accordingly.
Statement of changes in net assets
Opening Balance 1 July 2010 247,411,977
License revenue understated 18,594,021
VAT recovery Prior periods 16,573,887
Restated Closing balance 1 July 2010 282,579,886
Surplus (Deficit) for the year 2011 -118,084,260
License revenue understated 6,055,598
Creditors under provided -2,660,989
Creditors over provided 345,023
Restated Surplus (deficit) for the year 2011 -114,344,628
31. Risk management
Financial risk management
Liquidity risk
The municipality’s risk to liquidity is a result of the funds available to cover future commitments. The municipality manages liquidity risk
through an ongoing review of future commitments and credit facilities.
Interest rate risk
Credit risk
Credit risk consists mainly of cash deposits, cash equivalents, derivative financial instruments and trade receivables. The municipality
only deposits cash with major banks with high quality credit standing and limits exposure to any one counter -party.
Trade receivables comprise a widespread customer base. Management evaluated credit risk relating to customers on an ongoing basis.
If customers are independently rated, these ratings are used. Otherwise, if there is no independent rating, risk control assesses the credit
quality of the customer, taking into account its financial position, past experience and other factors. Individual risk limits are set based
on internal or external ratings in accordance with limits set by the board. The utilisation of credit limits is regularly monitored. Sales to
retail customers are settled in cash or using major credit cards. Credit guarantee insurance is purchased when deemed appropriate.
32. Going concern
We draw attention to the fact that at 30 June 2012, the Municipality had accumulated surplus of R172,660,370 and that the Municipality's
current liabilities exceed its current assets by R10,804,637
In addition SDM has over the last two and a half years implemented a cost containment strategy which purported to place austerity
measures within the municipality to save costs. The process is ongoing and the fruits of the outcome has generated a substantial saving
in our budget.

Annual Report 2011/12
Sedibeng District MunicipalityAnnual Financial Statements for the year ended 30 June 2012
Notes to the Annual Financial StatementsFigures in Rand 2012 2011
149
The annual financial statements have been prepared on the basis of accounting policies applicable to a going concern. This basis
presumes that funds will be available to finance future operations and that the realisation of assets and settlement of liabilities,
contingent obligations and commitments will occur in the ordinary course of business
33. Events after the reporting date
A decision was made by the Provincial Department of Health that Emergency Medical Services will return to Province with the target
date being March 2012. Based on a consent order obtained from the high court the provincialisation has been re -scheduled to be
finalized by the end of August 2012. This will resolve the unfunded portion currently in dispute with the Department of Health.
It has been identified that land is incorrectly registered at the Deeds Office in the name of Sedibeng District Municipality. These
properties need to be transferred to their rightful owner, Emfuleni Local Municipality.
34. Unauthorised expenditure
None incurred in reporting period
35. Additional disclosure in terms of Municipal Finance Management Act
PAYE and UIF
Current year subscription / fee 32,104,375 32,270,670
Amount paid - current year (32,104,375) (32,270,670)
- -
Pension and Medical Aid Deductions
VAT
VAT receivable 1,125,614
4,590,801
All VAT returns have been submitted by the due date throughout the year.
36. Supply chain management regulations
In terms of section 36 of the Municipal Supply Chain Management Regulations any deviation from the Supply Chain Management Policy needs to be approved/condoned by the Municipal Manager and noted by Council. The expenses incurred as listed in the appendix “A” have been condoned.
36.1 Deviation from supply chain management regulations
Paragraph 12(1)(d)(i) of Government gazette No. 27636 issued on 30 May 2005 states that a supply chain management policy must pro -vide for the procurement of goods and services by way of a competitive bidding process.
Paragraph 36 of the same gazette states that the accounting officer may dispense with the official procurement process in certain cir -cumstances, provided that he records the reasons for any deviations and reports them to the next meeting of the accounting officer and includes a note to the annual financial statements.
The reasons for these deviations were documented and reported to the accounting officer who considered them and subsequently ap -proved the deviation from the normal supply chain management regulations. The expenses incurred as listed in the appendix “A” have been condoned.
36.2 Declaration of business conducted to close family members of persons in the service of the state
The below table list the awards to close family members of persons in the service of the state and awards to persons in the service of the state.

Sedibeng District Municipality
Sedibeng District MunicipalityAnnual Financial Statements for the year ended 30 June 2012
Notes to the Annual Financial StatementsFigures in Rand 2012 2011
150
1. Awards to close family members of persons in the service of the state
Company Name Initials Surname Designation andEmployee NO.
Relationship with the company
Amount Paid
Panorama Bloemiste CC CS HeunesSenior Accountant Ex-penditure17530
Spouse to the Director/Shareholder R 6,710.00
Servigyn 13 CC N Monga Senior Technician: IT Son to the Director/Share-holder R 31, 981.14
Company Name ID NO. Initials & Surname Current Employer Amount Paid
Vaal Community Radio NPC7304290329084 I Honoko Sedibeng District Municipality
R 20,143.805601017441080 MI Kolokoto Sedibeng District Municipality
Mahlake Kabamba Construc-tion and Projects CC 7204015500086 GM Mtembu Free State Department of Education R 79, 541.15
Bongani Makhunga Trading Enterprises CC 6705290400082 MM Kubekha Free State Department of Education R 12, 491.76
Lelwala Distributors CC 6701200271085 PI Mokoena Free State Department of Education R 18,339.45
Tiisetsoand Reuben Trading Enterprise CC 6501095399086 MR Mokele Free State Department of Education R 19,820.00
Tiaco Trading CC 72050606088080 PM Lethoba Free State Department of Education R 41,405.60
37. Television sets in terms of the Television License Regulations under the Broadcasting act no 4 of 1999, as amended
Description Number of sets Period that sets were in entity’s possession
Owned television sets 34 32 sets were used for the full year;2 set were added during the year
Rented or leased television sets -
Number of sets donated/ alienated -
TOTAL 34
38. Related party transactions
The Council is rendering information technology services to both Emfuleni and Midvaal local municipalities. Claims towards actual
salary expenses have been lodged on a monthly basis whereby the cost incurred for the year was as follow:
Emfuleni Local Municipality R 5,615,823
Midvaal Local Municipality R 1,347,542
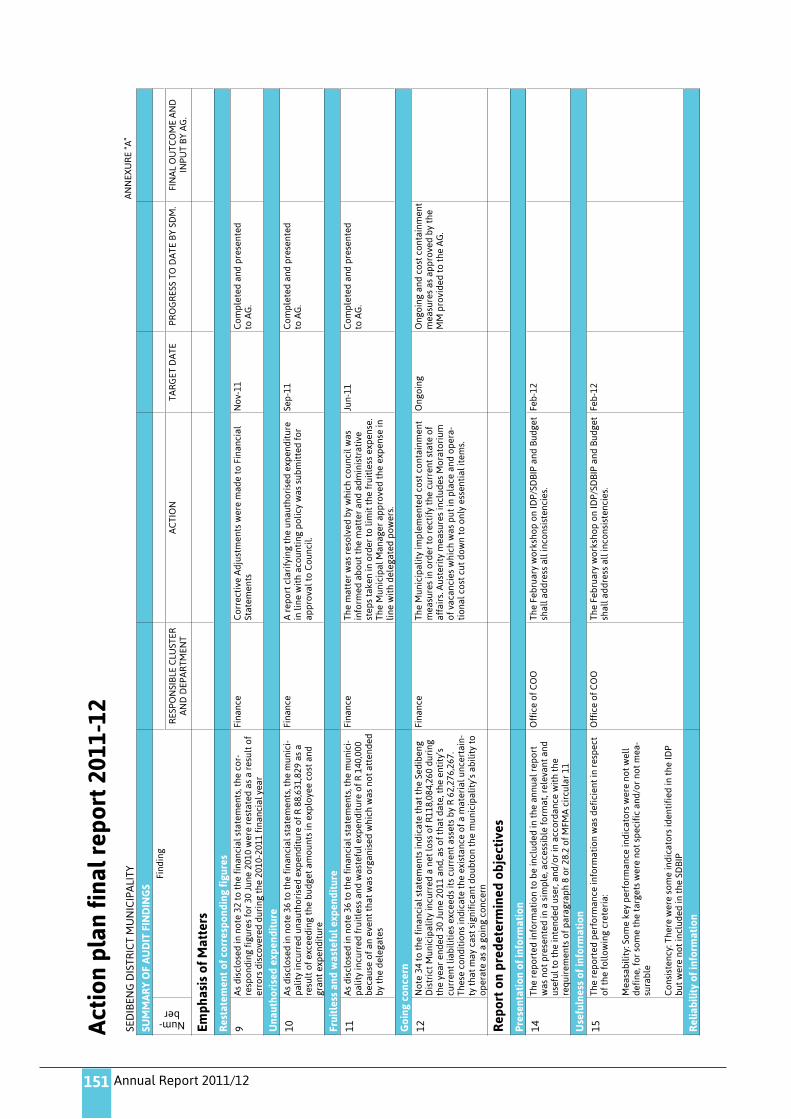
Annual Report 2011/12151
Act
ion
plan
fina
l rep
ort
2011
-12
SED
IBEN
G D
ISTR
ICT
MU
NIC
IPA
LITY
AN
NEX
UR
E “A
”
SUM
MA
RY
OF
AU
DIT
FIN
DIN
GS
Num -ber
Find
ing
RES
PON
SIB
LE C
LUST
ER
AN
D D
EPA
RTM
ENT
AC
TIO
NTA
RG
ET D
ATE
PRO
GR
ESS
TO D
ATE
BY
SDM
.FI
NA
L O
UTC
OM
E A
ND
IN
PUT
BY
AG
.
Emph
asis
of M
atte
rs
Res
tate
men
t of
cor
resp
ondi
ng fi
gure
s
9A
s di
sclo
sed
in n
ote
32 t
o th
e fi
nanc
ial s
tate
men
ts, t
he c
or -
resp
ondi
ng fi
gure
s fo
r 30
Jun
e 20
10 w
ere
rest
ated
as
a re
sult
of
erro
rs d
isco
vere
d du
ring
the
201
0 -20
11 fi
nanc
ial y
ear
Fina
nce
Cor
rect
ive
Adj
ustm
ents
wer
e m
ade
to F
inan
cial
St
atem
ents
Nov
-11
Com
ple
ted
and
pre
sent
ed
to A
G.
Una
utho
rise
d ex
pen
ditu
re
10A
s di
sclo
sed
in n
ote
36 t
o th
e fi
nanc
ial s
tate
men
ts, t
he m
unic
i -p
alit
y in
curr
ed u
naut
hori
sed
exp
endi
ture
of R
88,
631,
829
as a
re
sult
of e
xcee
ding
the
bud
get
amou
nts
in e
xplo
yee
cost
and
gr
ant
exp
endi
ture
Fina
nce
A r
epor
t cl
arif
ying
the
una
utho
rise
d ex
pen
ditu
re
in li
ne w
ith
acou
ntin
g p
olic
y w
as s
ubm
itte
d fo
r ap
pro
val t
o C
ounc
il.
Sep
-11
Com
ple
ted
and
pre
sent
ed
to A
G.
Frui
tles
s an
d w
aste
ful e
xpen
ditu
re
11A
s di
sclo
sed
in n
ote
36 t
o th
e fi
nanc
ial s
tate
men
ts, t
he m
unic
i -p
alit
y in
curr
ed fr
uitl
ess
and
was
tefu
l exp
endi
ture
of R
140
,000
be
caus
e of
an
even
t th
at w
as o
rgan
ised
whi
ch w
as n
ot a
tten
ded
by t
he d
eleg
ates
Fina
nce
The
mat
ter
was
res
olve
d by
whi
ch c
ounc
il w
as
info
rmed
abo
ut t
he m
atte
r an
d ad
min
istr
ativ
e st
eps
take
n in
ord
er t
o lim
it t
he fr
uitl
ess
exp
ense
. Th
e M
unic
ipal
Man
ager
ap
pro
ved
the
exp
ense
in
line
wit
h de
lega
ted
pow
ers.
Jun -
11C
omp
lete
d an
d p
rese
nted
to
AG
.
Goi
ng c
once
rn
12N
ote
34 t
o th
e fi
nanc
ial s
tate
men
ts in
dica
te t
hat
the
Sedi
beng
D
istr
ict
Mun
icip
alit
y in
curr
ed a
net
loss
of R
118,
084,
260
duri
ng
the
year
end
ed 3
0 Ju
ne 2
011
and,
as
of t
hat
date
, the
ent
ity’
s cu
rren
t lia
bilit
ies
exce
eds
its
curr
ent
asse
ts b
y R
62,
276,
267.
Th
ese
cond
itio
ns in
dica
te t
he e
xist
ance
of a
mat
eria
l unc
erta
in -
ty t
hat
may
cas
t si
gnif
ican
t do
ubto
n th
e m
unic
ipal
ity’
s ab
ility
to
oper
ate
as a
goi
ng c
once
rn
Fina
nce
The
Mun
icip
alit
y im
ple
men
ted
cost
con
tain
men
t m
easu
res
in o
rder
to
rect
ify
the
curr
ent
stat
e of
af
fair
s. A
uste
rity
mea
sure
s in
clud
es M
orat
oriu
m
of v
acan
cies
whi
ch w
as p
ut in
pla
ce a
nd o
per
a -ti
onal
cos
t cu
t do
wn
to o
nly
esse
ntia
l ite
ms.
Ong
oing
Ong
oing
and
cos
t co
ntai
nmen
t m
easu
res
as a
pp
rove
d by
the
M
M p
rovi
ded
to t
he A
G.
Rep
ort
on p
rede
term
ined
obj
ecti
ves
Pres
enta
tion
of i
nfor
mat
ion
14Th
e re
por
ted
info
rmat
ion
to b
e in
clud
ed in
the
ann
ual r
epor
t w
as n
ot p
rese
nted
in a
sim
ple
, acc
essi
ble
form
at, r
elev
ant
and
usef
ul t
o th
e in
tend
ed u
ser,
and/
or in
acc
orda
nce
wit
h th
e re
quir
emen
ts o
f par
agra
ph
8 or
28.
2 of
MFM
A c
ircu
lar
11
Off
ice
of C
OO
The
Febr
uary
wor
ksho
p o
n ID
P/SD
BIP
and
Bud
get
shal
l add
ress
all
inco
nsis
tenc
ies.
Fe
b -12
Use
fuln
ess
of in
form
atio
n
15Th
e re
por
ted
per
form
ance
info
rmat
ion
was
def
icie
nt in
res
pec
t of
the
foll
owin
g cr
eter
ia:
Mea
sabi
lity:
Som
e ke
y p
erfo
rman
ce in
dica
tors
wer
e no
t w
ell
defi
ne, f
or s
ome
the
targ
ets
wer
e no
t sp
ecif
ic a
nd/o
r no
t m
ea -
sura
ble
Con
sist
ency
: The
re w
ere
som
e in
dica
tors
iden
tifi
ed in
the
IDP
but
wer
e no
t in
clud
ed in
the
SD
BIP
Off
ice
of C
OO
The
Febr
uary
wor
ksho
p o
n ID
P/SD
BIP
and
Bud
get
shal
l add
ress
all
inco
nsis
tenc
ies.
Fe
b -12
Rel
iabi
lity
of in
form
atio
n
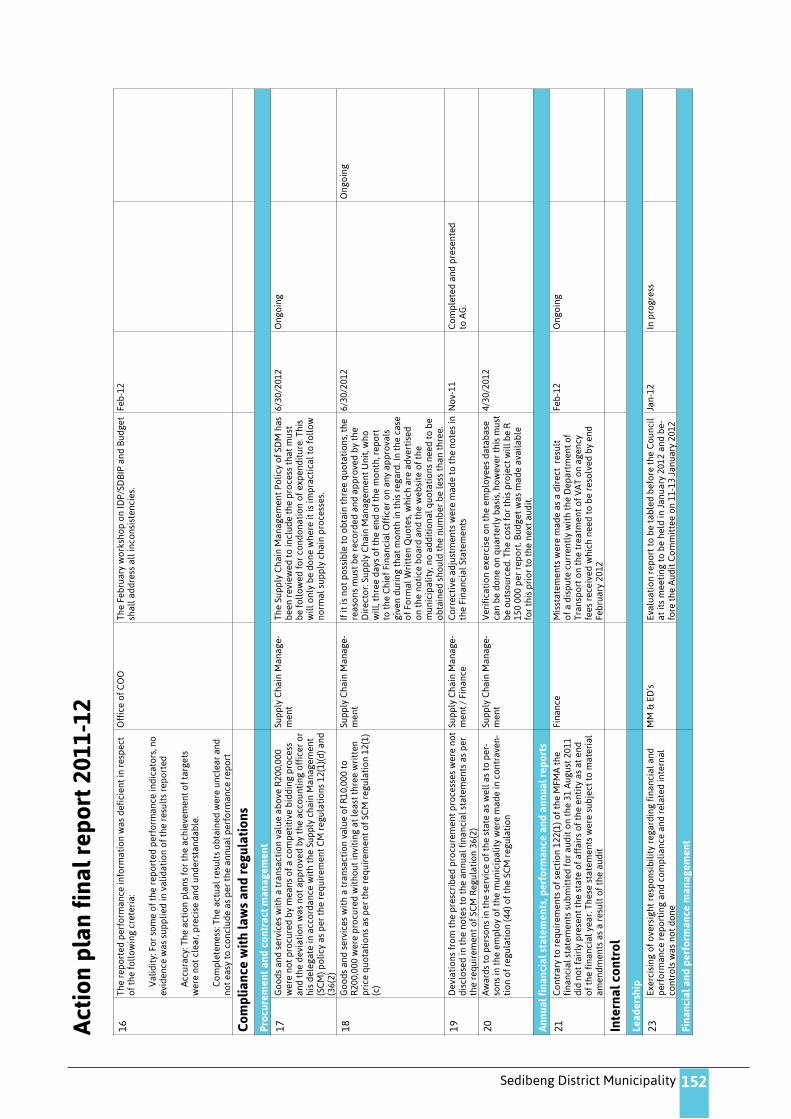
Sedibeng District Municipality 152
16Th
e re
por
ted
per
form
ance
info
rmat
ion
was
def
icie
nt in
res
pec
t of
the
foll
owin
g cr
eter
ia:
V
alid
ity:
For
som
e of
the
rep
orte
d p
erfo
rman
ce in
dica
tors
, no
evid
ence
was
sup
plie
d in
val
idat
ion
of t
he r
esul
ts r
epor
ted
A
ccur
acy:
The
act
ion
pla
ns fo
r th
e ac
hiev
emen
t of
tar
gets
w
ere
not
clea
r, p
reci
se a
nd u
nder
stan
dabl
e.
C
omp
lete
ness
: The
act
ual r
esul
ts o
btai
ned
wer
e un
clea
r an
d no
t ea
sy t
o co
nclu
de a
s p
er t
he a
nnua
l per
form
ance
rep
ort
Off
ice
of C
OO
The
Febr
uary
wor
ksho
p o
n ID
P/SD
BIP
and
Bud
get
shal
l add
ress
all
inco
nsis
tenc
ies.
Fe
b -12
Com
plia
nce
wit
h la
ws
and
regu
lati
ons
Proc
urem
ent
and
cont
ract
man
agem
ent
17G
oods
and
ser
vice
s w
ith
a tr
ansa
ctio
n va
lue
abov
e R
200,
000
wer
e no
t p
rocu
red
by m
eans
of a
com
pet
itiv
e bi
ddin
g p
roce
ss
and
the
devi
atio
n w
as n
ot a
pp
rove
d by
the
acc
ount
ing
offi
cer
or
his
dele
gate
in a
ccor
danc
e w
ith
the
Sup
ply
cha
in M
anag
emen
t (S
CM
) pol
icy
as p
er t
he r
equi
rem
ent
CM
reg
ulat
ions
12(
1)(d
) and
(3
6(2)
Sup
ply
Cha
in M
anag
e -m
ent
The
Sup
ply
Cha
in M
anag
emen
t Po
licy
of S
DM
has
be
en r
evie
wed
to
incl
ude
the
pro
cess
tha
t m
ust
be fo
llow
ed fo
r co
ndon
atio
n of
exp
endi
ture
. Thi
s w
ill o
nly
be d
one
whe
re it
is im
pra
ctic
al t
o fo
llow
no
rmal
sup
ply
cha
in p
roce
sses
.
6/30
/201
2O
ngoi
ng
18G
oods
and
ser
vice
s w
ith
a tr
ansa
ctio
n va
lue
of R
10,0
00 t
o R
200,
000
wer
e p
rocu
red
wit
hout
invi
ting
at
leas
t th
ree
wri
tten
p
rice
quo
tati
ons
as p
er t
he r
equi
rem
ent
of S
CM
reg
ulat
ion
12(1
)(c
)
Sup
ply
Cha
in M
anag
e -m
ent
If it
is n
ot p
ossi
ble
to o
btai
n th
ree
quot
atio
ns, t
he
reas
ons
mus
t be
rec
orde
d an
d ap
pro
ved
by t
he
Dir
ecto
r: Su
pp
ly C
hain
Man
agem
ent
Uni
t, w
ho
will
, thr
ee d
ays
of t
he e
nd o
f the
mon
th, r
epor
t to
the
Chi
ef F
inan
cial
Off
icer
on
any
app
rova
ls
give
n du
ring
tha
t m
onth
in t
his
rega
rd. I
n th
e ca
se
of F
orm
al W
ritt
en Q
uote
s, w
hich
are
adv
erti
sed
on t
he n
otic
e bo
ard
and
the
web
site
of t
he
mun
icip
alit
y, n
o ad
diti
onal
quo
tati
ons
need
to
be
obta
ined
sho
uld
the
num
ber
be le
ss t
han
thre
e.
6/30
/201
2O
ngoi
ng
19D
evia
tion
s fr
om t
he p
resc
ribe
d p
rocu
rem
ent
pro
cess
es w
ere
not
disc
lose
d in
the
not
es t
o th
e an
nual
fina
ncia
l sta
tem
ents
as
per
th
e re
quir
emen
t of
SC
M R
egul
atio
n 36
(2)
Sup
ply
Cha
in M
anag
e -m
ent
/ Fi
nanc
eC
orre
ctiv
e ad
just
men
ts w
ere
mad
e to
the
not
es in
th
e Fi
nanc
ial S
tate
men
tsN
ov -1
1C
omp
lete
d an
d p
rese
nted
to
AG
.
20A
war
ds t
o p
erso
ns in
the
ser
vice
of t
he s
tate
as
wel
l as
to p
er -
sons
in t
he e
mp
loy
of t
he m
unic
ipal
ity
wer
e m
ade
in c
ontr
aven
-ti
on o
f reg
ulat
ion
(44)
of t
he S
CM
reg
ulat
ion
Sup
ply
Cha
in M
anag
e -m
ent
Ver
ific
atio
n ex
erci
se o
n th
e em
plo
yees
dat
abas
e ca
n be
don
e on
qua
rter
ly b
asis
, how
ever
thi
s m
ust
be o
utso
urce
d. T
he c
ost
for
this
pro
ject
will
be
R
150
000
per
rep
ort.
Bud
get
was
mad
e av
aila
ble
for
this
pri
or t
o th
e ne
xt a
udit
.
4/30
/201
2
Ann
ual f
inan
cial
sta
tem
ents
, per
form
ance
and
ann
ual r
epor
ts
21C
ontr
ary
to r
equi
rem
ents
of s
ecti
on 1
22(1
) of t
he M
FMA
the
fi
nanc
ial s
tate
men
ts s
ubm
itte
d fo
r au
dit
on t
he 3
1 A
ugus
t 20
11
did
not
fair
ly p
rese
nt t
he s
tate
of a
ffai
rs o
f the
ent
ity
as a
t en
d of
the
fina
ncia
l yea
r. Th
ese
stat
emen
ts w
ere
subj
ect
to m
ater
ial
amen
dmen
ts a
s a
resu
lt o
f the
aud
it
Fina
nce
Mis
stat
emen
ts w
ere
mad
e as
a d
irec
t r
esul
t of
a d
isp
ute
curr
entl
y w
ith
the
Dep
artm
ent
of
Tran
spor
t on
the
tre
atm
ent
of V
AT
on a
genc
y fe
es r
ecei
ved
whi
ch n
eed
to b
e re
solv
ed b
y en
d Fe
brua
ry 2
012
Feb -
12O
ngoi
ng
Inte
rnal
con
trol
Lead
ersh
ip
23Ex
erci
sing
of o
vers
ight
res
pon
sibi
lity
rega
rdin
g fi
nanc
ial a
nd
per
form
ance
rep
orti
ng a
nd c
omp
lianc
e an
d re
late
d in
tern
al
cont
rols
was
not
don
e
MM
& E
D’s
Eval
uati
on r
epor
t to
be
tabl
ed b
efor
e th
e C
ounc
il at
its
mee
ting
to
be h
eld
in J
anua
ry 2
012
and
be -
fore
the
Aud
it C
omm
itte
e on
11 -
13 J
anua
ry 2
012
Jan -
12In
pro
gres
s
Fina
ncia
l and
per
form
ance
man
agem
ent
Act
ion
plan
fina
l rep
ort
2011
-12

Annual Report 2011/12153
Act
ion
plan
fina
l rep
ort
2011
-12
24N
o re
gula
r re
view
and
mon
itor
ing
wer
e do
ne o
n co
mp
lianc
e w
ith
law
s an
d re
gula
tion
sM
M &
ED
’sPl
an t
o be
dev
elop
ed fo
r en
dors
emen
t by
the
M
AN
CO
in J
anua
ry 2
012
23 -J
anIn
pro
gres
s
25N
o p
rop
er im
ple
men
tati
on o
f con
trol
s ov
er d
aily
and
mon
thly
p
roce
ssin
g of
tra
nsac
tion
and
rec
onci
ling
of t
rans
acti
ons
Fina
nce
Rec
onci
ling
of li
cens
ing
inco
me
are
done
on
a da
ily b
asis
whe
reby
dep
osit
s ou
tsta
ndin
g at
m
onth
-end
nee
d to
be
take
n in
to a
ccou
nt o
n th
e ge
nera
l led
ger.
Prev
ious
ly it
was
don
e on
rec
eip
t of
mon
ey in
the
ban
k ac
coun
t. N
o in
terf
ace
in
pla
ce b
etw
een
the
NA
TIS
(Lic
ensi
ng s
yste
m) a
nd
VEN
US
(Fin
anci
al s
yste
m)
Dec
-11
Ong
oing
Gov
erna
nce
26Th
e im
ple
men
tati
on o
f ap
pro
pri
ate
risk
man
agem
ent
acti
viti
es
to e
nsur
e th
at r
egul
ar r
isk
asse
smen
ts, i
nclu
ding
con
side
rati
on
of IT
ris
ks a
nd fr
aud
pre
vent
ion,
wer
e no
t co
nduc
ted
and
that
a
risk
str
ateg
y to
add
ress
the
ris
ks w
as n
ot d
evel
oped
and
m
onit
ored
CO
OTh
e fi
nal S
trat
egic
Ris
k R
egis
ter
was
fina
lised
on
11 J
anua
ry 2
012
Jan -
12C
omp
lete
d an
d p
rese
nted
to
AG
.

Sedibeng District Municipality 154
Progress Report on Action Plan on AG Report for 1011
HIGH LEVEL EXECUTIVE SUMMARY ON THE CONSOLIDATED ACTION PLANS ON
AUDITOR GENERAL’S REPORTS FOR THE FINANCIAL YEAR ENDED 30 JUNE 2011
5/16/1/2 Cluster: Finance
Portfolio: Financial Management
PURPOSE
The purpose of this report is to provide a consolidated update on the action plans for the financial year ended 30 June 2011, in relation to the Auditor General’s Reports on the Regularity Audit and Audit of Performance Information performed at Sedibeng District Municipality and the three Local Municipalities as received from the Auditor General’s Office.
BACKGROUND
The reports of the Auditor -General pertain to the Financial Statements and results of the Performance Measurement of Sedibeng District area for the year ended 30 June 2011. The reports are submitted in terms of section 21(1) of the Public Audit Act, 2004 (Act No. 25 of 2004) read in conjunction -with section 188 of the Constitution of the Republic of South Africa, 1996.
In terms of section 127 of the Municipal Finance Management Act, 2003 (Act No. 56 of 2003) (MFMA) the accounting officer of a municipality must within’ six months after the end of a financial year, or on such earlier date as may be agreed between the entity and its parent municipality, submit the entity’s annual report for that financial year to the Municipal Manager of the entity’s parent municipality. Section 127(2) of the MFMA requires that the Mayor of a municipality must, within seven months after the end of a financial year, table in the municipal council the annual report of the municipality and of any municipal entity under the municipality’s sole or shared control. If section 127(2) is not complied with cognicance should be taken of section 127(4) regarding the submission of the financial statements and audit report by the Auditor -General to the prescribed stakeholders.
In terms of section 121(3) and (4) of the MFMA Sedibeng District Municipality and its Locals must publish the attached audit report(s) as part of the annual report.
DISCUSSION
1. The audit opinions on the audits conducted over the past 5 financial periods in our region are stated as follow:
AuditeeAudit outcome 2010/2011
Audit outcome 2009/2010
Audit outcome 2008/2009
Audit outcome 2007/2008
Audit outcome 2006/2007
Sedibeng District Municipality
Financially unqualified with findings
Financially unqualified with findings
Financially unqualified with findings
Financially unqualified with findings
Financially unqualified with findings
Midvaal Local Municipality
Financially unqualified with findings
Financially unqualified with findings
Financially unqualified with findings
Financially unqualified with findings
Financially unqualified with findings
Emfuleni Local Municipality
Qualified Qualified Qualified Disclaimer Disclaimer
Lesedi Local Municipality
Financially unqualified with findings
Financially unqualified with findings
Financially unqualified with findings
Financially unqualified with findings
Financially unqualified with findings
2. Auditor General’s Dashboard Reports – Drivers of Internal Controls to achieve clean audit in the region. The following areas in the reports need to be addressed in order to improve on the internal controls:
a. Sedibeng District Municipality
i. Implement effective HR management to ensure that adequate and sufficiently skilled resources are in place and that performance is monitored.
Actions required/performed: The performance evaluation of section 57 and other staff should be available.
ii. Implement appropriate risk management activities to ensure that regular risk assessments, including consideration of IT risks and fraud prevention, are conducted and that a risk strategy to address the risk is developed and monitored
Actions required/performed: The risk Strategy Policy Framework was adopted by Council. Audit committee

Annual Report 2011/12155
charter amended to fulfill the role of the risk and Performance committee as a function of assessment.
b. Midvaal Local Municipality
i. Implement effective HR management to ensure that adequate and sufficiently skilled resources are in place and that performance is monitored
Actions required/performed: In progress to implement performance management for all staff
ii. Develop and monitor the implementation of action plans to address internal control deficiencies
Actions required/performed: 1. The following internal control deficiencies were noted during inventory count conducted.
1.1. The inventory count was not properly conducted by the management, no controls in place to ensure that the count was accurate
1.2 Not proper controls in place over the issuing of stock (cables)
1.3 No proper controls implemented over the sewer storage, as we have noted that it left unattended during the inventory count.
iii. Implement controls over daily and monthly processing and reconciling of transactions
Actions required/performed: 1. The following internal control deficiencies were noted during inventory count conducted.
1.1. The inventory count was not properly conducted by the management, no controls in place to ensure that the count was accurate
1.2 Not proper controls in place over the issuing of stock (cables)
1.3 No proper controls implemented over the sewer storage, as we have noted that it left unattended during the inventory count.
iv. Prepare regular, accurate and complete financial and performance reports that are supported and evidenced by reliable information
Actions required/performed: 1. The following internal control deficiencies were noted during inventory count conducted.
1.1. The inventory count was not properly conducted by the management, no controls in place to ensure that the count was accurate
1.2 Not proper controls in place over the issuing of stock (cables)
1.3 No proper controls implemented over the sewer storage, as we have noted that it left unattended during the inventory count.
v. Review and monitor compliance with applicable laws and regulations
Actions required/performed: There is no creditors ageing analyses in place , however upon the inspection we have noted that there is an excel spreadsheet prepared by the management that is used to record the date of the invoice received and the date of the invoice paid.
c Emfuleni Local Municipality
i.
ii.
d. Lesedi Local Municipality (3rd quarter review as 4th quarter not yet finalized)
i. Implement effective HR management to ensure that adequate and sufficiently skilled resources are in place and that performance is monitored
Actions required/performed: The municipal manager & 3 Executive mangers positions are already advertised with a possible date for filling them 30 June 2012
ii. Develop and monitor the implementation of action plans to address internal control deficiencies
Actions required/performed: No action specified
iii. Establish an IT governance framework that supports and enables the business, delivers value and improves performance
Actions required/performed: DRP in place but not tested. Test to be performed by end of May 2012
iv. Design and implement formal controls over IT systems to ensure the reliability of the systems and the availability, accuracy and protection of information
Actions required/performed: An update of the network policy and user management procedures to include the review and access rights. To be addressed end of May 2012
Progress Report on Action Plan on AG Report for 1011

Sedibeng District Municipality 156
Progress Report on Action Plan on AG Report for 1011
v. Implement appropriate risk management activities to ensure that regular risk assessments, including consideration of IT risks and fraud prevention, are conducted and that a risk strategy to address the risks is developed and monitored
Actions required/performed: Development of risk strategy has been an initiative between municipality and Treasury, that’s far a draft document is in place awaiting approval by council by end of May 2012. A review of the risk assessment by council to happen end of May 2012.
3. AG Progress action plans in the region
The attached Annexure “A” – Sedibeng District Municipality, Annexure “B” – Midvaal Local Municipality and Annexure “C” – Emfuleni Local Municipality provides a progress report on the actions taken to remedy the audit findings as indicated in the various audit reports.
Lesedi Local Municipality
No action plan was presented to the Department of Local Government from the Lesedi Local Municipality. Assistance is currently provided to Lesedi by Local Government in order to compile an action plan.
ALIGNMENT WITH COUNCIL STRATEGIES
Good Governance.
FINANCIAL IMPLICATIONS
None
LEGAL IMPLICATIONS
None
RECOMMENDATIONS
1. THAT the reports on the action plan relating to the Auditor General’s Audit Report on the Regularity Audit and Audit of Performance Information for the financial year ended 30 June 2011 performed at Sedibeng District Municipality, Emfuleni Local Municipality and Midvaal Local Municipality be noted for information purposes.
2. THAT it be noted that the Department of Local Government is currently assisting Lesedi Local Municipality in drawing up an action plan for execution.