complying with epa's guidance for so2 designations
TRANSCRIPT

www.cppwind.com www.cppwind.com
Complying with EPA’s Guidance for SO2 Designations
PNWIS
November 6, 2015
Sergio A. Guerra, PhD – CPP Inc.

www.cppwind.com www.cppwind.com
Outline
• Background and Overview and Options (To model or to monitor)
• Summary of SO2 Designation Schedule
• Advanced Modeling Techniques
– Equivalent Building Dimensions (EBD)
– Emission Variability Processor (EMVAP)
– 50th Percentile Background

www.cppwind.com www.cppwind.com
Background
• August 5, 2013- EPA issued first round of SO2 Designations.
• Three lawsuits were filed against EPA for not designating all portions of the country by the June 2013 deadline.
• March 2, 2015- Court ordered EPA to complete remaining SO2 designations.

www.cppwind.com www.cppwind.com
Background • March 20, 2015- The Updated Guidance for
SO2 Area Designations was released by EPA.
• August 10, 2015- EPA releases the Final Data Requirements Rule for 1-hr SO2 NAAQS.

www.cppwind.com www.cppwind.com
Round 1
Areas Associated with 2009-2011 Monitored Violations.
• 7/25/2013: EPA promulgates final SO2 area designations for 29 nonattainment areas.
• 10/04/2013: Effective Date.
www.cppwind.com www.cppwind.com
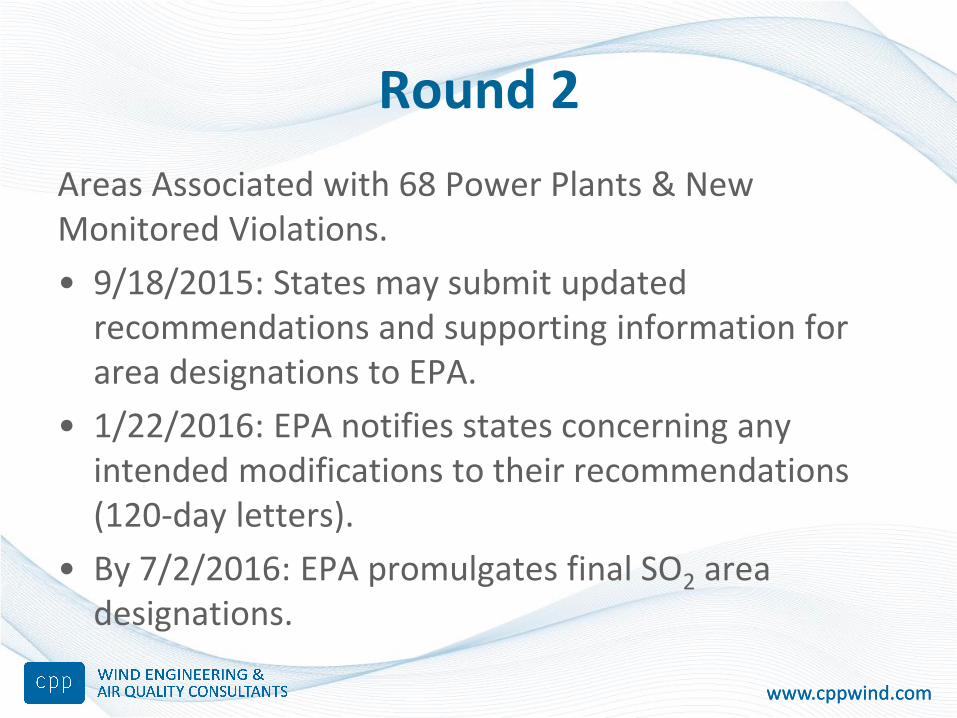
Round 2
Areas Associated with 68 Power Plants & New Monitored Violations.
• 9/18/2015: States may submit updated recommendations and supporting information for area designations to EPA.
• 1/22/2016: EPA notifies states concerning any intended modifications to their recommendations (120-day letters).
• By 7/2/2016: EPA promulgates final SO2 area designations.

www.cppwind.com www.cppwind.com
Round 3
Modeled Areas and Areas w/o Monitors
• 1/13/2017: States submit air quality modeling results for selected areas (per SO2 DRR).
• By 9/1/2017: EPA notifies states of any intended modification to their recommendations.
• By 12/31/2017: EPA promulgates final SO2 area designations.

www.cppwind.com www.cppwind.com
Round 4 New Monitored Areas/All Remaining Areas
• 1/1/2017: States begin to operate new monitoring network.
• 5/1/2020: States certify 2019 monitoring data to calculate the 2017-2019 design value.
• By 9/2/2020: EPA notifies states about any intended modification to their recommendation (120-day letters).
• 12/31/2020: EPA promulgates final SO2 area designations.

www.cppwind.com www.cppwind.com
What Does All This Mean?
Large SO2 sources have two options:
1) Dispersion Modeling
2) Ambient Monitoring
Preferred option is modeling however this can be challenging because of conservative nature of model.

www.cppwind.com www.cppwind.com
Modeling Softballs December 2013 Modeling TAD:
• Use of actual instead of allowable emissions (i.e., PTE) to assess violations of the standard.
• Use of 3 years of meteorological data instead of 5.
• Receptor placement only in locations where monitor could be placed.
• Use of actual stack height instead of GEP stack height.

www.cppwind.com www.cppwind.com
Advanced Modeling Techniques Areas Advanced Modeling
Techniques
Traditional Modeling
Technique
Building dimensions
used for downwash
Equivalent Building
Dimensions (EBD)
Use of Building Profile Input
Program for PRIME (BPIP-
PRM)
Variable emissions Use EMVAP to account
for variability
Assume continuous
maximum emissions
Background
Concentrations
Combine AERMOD’s
concentration with the
50th % observed
Tier 1: Combine AERMOD’s
concentration with max. or
design value (e.g., 99th %
observed for SO2)
Tier 2: Combine predicted
and observed values based
on temporal matching (e.g.,
by season or hour of day).

www.cppwind.com www.cppwind.com
Equivalent Building Dimensions

www.cppwind.com www.cppwind.com
Building Dimension Inputs & BPIP • BPIP uses building footprints and tier heights
• Combines building/structures
• All structures become one single rectangular solid for each wind direction and each source
• BPIP dimensions may not characterize the source accurately and may result in unreasonably high predictions

www.cppwind.com www.cppwind.com
PRIME AERMOD’s Building Downwash Algorithm
• Used EPA wind tunnel data base and past literature
• Developed analytical equations for cavity height, reattachment, streamline angle, wind speed and turbulence
• Developed for specific building dimensions
• When buildings outside of these dimensions, theory falls apart

www.cppwind.com www.cppwind.com
Refinery Structures Upwind
- Horizontal flow
Solid BPIP Structure Upwind
No Structures
Streamlines for Lattice Structures
Should be Horizontal

www.cppwind.com www.cppwind.com
BPIP Diagnostic Tool http://www.cppwind.com/what-we-do/air-permitting/bpip-diagnostic-tool
CPP determines Equivalent Building Dimensions (EBD) and provides them
to consultant for use in the dispersion modeling analysis.

www.cppwind.com www.cppwind.com
BPIP Diagnostic Tool http://www.cppwind.com/what-we-do/air-permitting/bpip-diagnostic-tool

www.cppwind.com www.cppwind.com
Long Buildings with Wind at an Angle
Figure created in BREEZE® Downwash Analyst
BREEZE is a registered trademark of Trinity Consultants, Inc.
www.cppwind.com www.cppwind.com
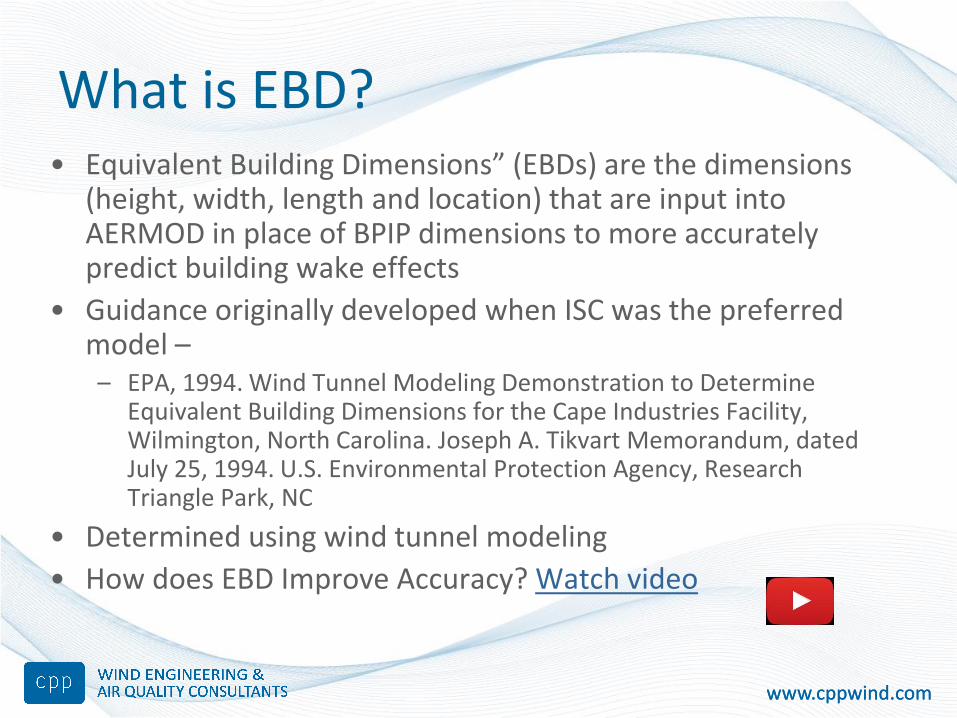
• Equivalent Building Dimensions” (EBDs) are the dimensions (height, width, length and location) that are input into AERMOD in place of BPIP dimensions to more accurately predict building wake effects
• Guidance originally developed when ISC was the preferred model – – EPA, 1994. Wind Tunnel Modeling Demonstration to Determine
Equivalent Building Dimensions for the Cape Industries Facility, Wilmington, North Carolina. Joseph A. Tikvart Memorandum, dated July 25, 1994. U.S. Environmental Protection Agency, Research Triangle Park, NC
• Determined using wind tunnel modeling
• How does EBD Improve Accuracy? Watch video
What is EBD?

www.cppwind.com www.cppwind.com
How to Use EBD for Regulatory Purposes? Step 1: Develop a protocol outlining the EBD study
Step 2: Submit EBD protocol for approval to regulatory agency. Also need to involve Model Clearinghouse
Step 3: Perform wind tunnel testing
Step 4: Use building geometry from EBD study in AERMOD
Step 5: Submit final report for agency review and approval

www.cppwind.com www.cppwind.com
Current Status Regulatory Status of EBD
From October 24, 2011 Model Clearinghouse Review of EBD for AERMOD
• “any EBD studies being considered should be discussed with the appropriate reviewing authority as early in the process as possible and that the Model Clearinghouse should also be engaged as early as possible.”
• Memo stressed that these wind tunnel studies are source characterization studies not subject to alternative modeling requirements
Other
• EPA has acknowledged the limitation of BPIPPRM derived parameters for some cases1,2
1. Roger Brode’s (EPA) comments at 9th Modeling Conference
http://www3.epa.gov/ttn/scram/9thmodconf/9thmc_bpip-prime_workgroup.pdf 2. Roger Brode’s (EPA) comments at 10th Modeling Conference
http://www3.epa.gov/ttn/scram/10thmodconf/presentations/1-9-Brode_10thMC_AERMIC_Update_03-13-2012.pdf

www.cppwind.com www.cppwind.com
Summary of Approved Projects • Studies conducted and approved using original guidance for ISC
applications – Amoco Whiting Refinery, Region 5, 1990
– Public Service Electric & Gas, Region 2, 1993
– Cape Industries, Region 4, 1993
– Cambridge Electric Plant, Region 1, 1993
– District Energy, Region 5, 1993
– Hoechst Celanese Celco Plant, Region 3, 1994
– Pleasants Power, Region 3, 2002
• Studies conducted using original guidance for AERMOD/PRIME applications
– Hawaiian Electric (Approved), Region 9, 1998
– Mirant Power Station (Approved), Region 3, 2006
– Cheswick Power Plant (Approved), Region 3, 2006
– Radback Energy (Protocol Approved), Region IX, 2010
– Chevron 1 (Approved), Region 4, 2012
– Chevron 2 (Approved), Region 4, 2013
– Chevron 3 (In process), Region 4, 2015

www.cppwind.com www.cppwind.com
Monte Carlo Approach
• Pioneered by the Manhattan Project scientists in 1940’s
• Technique is widely used in science and industry
• EPA has approved this technique for risk assessments
• Used by EPA in the Guidance for 1-hour SO2 Nonattainment Area SIP Submissions (2014)

www.cppwind.com www.cppwind.com
Emission Variability Processor
• Assuming fixed peak 1‐hour emissions on a continuous basis will result in unrealistic modeled results
• Better approach is to assume a prescribed distribution of emission rates
• EMVAP assigns emission rates at random over numerous iterations
• The resulting distribution from EMVAP yields a more representative approximation of actual impacts
• Incorporate transient and variable emissions in modeling analysis
• EMVAP uses this information to develop alternative ways to indicate modeled compliance using a range of emission rates instead of just one value

www.cppwind.com www.cppwind.com
Background Concentrations

www.cppwind.com www.cppwind.com
Siting of Ambient Monitors
According to the Ambient Monitoring Guidelines for Prevention of Significant Deterioration (PSD):
The existing monitoring data should be representative of three types of area:
1) The location(s) of maximum concentration increase from the proposed source or modification;
2) The location(s) of the maximum air pollutant concentration from existing sources; and
3) The location(s) of the maximum impact area, i.e., where the maximum pollutant concentration would hypothetically occur based on the combined effect of existing sources and the proposed source or modification. (EPA, 1987)
U.S. EPA. (1987). “Ambient Monitoring Guidelines for Prevention of Significant Deterioration (PSD).”EPA‐450/4‐87‐007, Research Triangle Park, NC.

www.cppwind.com www.cppwind.com
Wildfires in 2015
NASA’s Earth Observatory
http://earthobservatory.nasa.gov

www.cppwind.com www.cppwind.com
24-hr PM2.5 Santa Fe, NM Airport
Background Concentration and Methods to Establish Background Concentrations in Modeling.
Presented at the Guideline on Air Quality Models: The Path Forward. Raleigh, NC, 2013.
Bruce Nicholson

www.cppwind.com www.cppwind.com
Probability of Two Unusual Events Happening at the Same Time

www.cppwind.com www.cppwind.com
Combining 99th Percentile Pre and Bkg (1-hr SO2) 99th percentile is 1st rank out of 100 days = 0.01
P(Pre ∩ Bkg) = P(Pre) * P(Bkg)
= (1-0.99) * (1-0.99)
= (0.01) * (0.01)
= 0.0001 = 1 / 10,000 days
Equivalent to one exceedance every 27 years!
= 99.99th percentile of the combined distribution

www.cppwind.com www.cppwind.com
Proposed Approach to Combine Modeled and Monitored Values
• Combining the 99th %(for 1-hr SO2) monitored concentration with the 99th % predicted concentration is too conservative.
• A more reasonable approach is to use a monitored value closer to the main distribution (i.e., the median).
Evaluation of the SO2 and NOX offset ratio method to account for secondary PM2.5 formation
Sergio A. Guerra, Shannon R. Olsen, Jared J. Anderson
Journal of the Air & Waste Management Association
Vol. 64, Iss. 3, 2014

www.cppwind.com www.cppwind.com
Combining 99th Pre and 50th Bkg 50th Percentile is 50th rank out of 100 days = 0.50
P(Pre ∩ Bkg) = P(Pre) * P(Bkg)
= (1-0.99) * (1-0.50)
= (0.01) * (0.50)
= 0.005 = 1 / 200 days
Equivalent to 1.8 exceedances every year
= 99.5th percentile of the combined distribution
Evaluation of the SO2 and NOX offset ratio method to account for secondary PM2.5 formation
Sergio A. Guerra, Shannon R. Olsen, Jared J. Anderson
Journal of the Air & Waste Management Association
Vol. 64, Iss. 3, 2014

www.cppwind.com www.cppwind.com
Advanced Model Input Analysis Solutions
• Emission Variability Processor (EMVAP)
• Evaluation of background concentrations
EM Magazine, December 2014
Guerra, S.A. “Innovative Dispersion Modeling
Practices to Achieve a Reasonable Level
of Conservatism in AERMOD Modeling
Demonstrations.” EM Magazine, December 2014.

www.cppwind.com www.cppwind.com
Case Study: Three Cases Evaluated
1. Using AERMOD by assuming a constant maximum emission rate (current modeling practice)
2. Using AERMOD by assuming a variable emission rate
3. Using EMVAP to account for emission variability

www.cppwind.com www.cppwind.com

www.cppwind.com www.cppwind.com
Three Cases Used to Model Power Plant Input parameter Case 1 Case 2 Case 3
Description of
Dispersion
Modeling
Current
Modeling
Practices
AERMOD with
hourly
emission
EMVAP
(500 iterations)
SO2 Emission
rate (g/s) 478.7
Actual hourly
emission rates
from CEMS
data
Bin1: 478.7
(5.0% time)
Bin 2: 228.7
(95% time)
Stack height
(m) 122
Exit
temperature
(degrees K)
416
Diameter (m) 5.2
Exit velocity
(m/s) 23

www.cppwind.com www.cppwind.com
Results of 1-hour SO2 Concentrations
Case 1
(µg/m3)
Case 2
(µg/m3)
Case 3
(µg/m3)
Dispersion
Modeling
Current
Modeling
Practices
AERMOD
with hourly
emission
EMVAP
(500
iterations)
H4H 229.9 78.6 179.3
Percent of
NAAQS 117% 40% 92%

www.cppwind.com www.cppwind.com
St. Paul Park 436 Ambient Monitor

www.cppwind.com www.cppwind.com
Positively Skewed Distribution
http://www.agilegeoscience.com

www.cppwind.com www.cppwind.com
Histogram of 1-hr SO2 Observations
Innovative Dispersion Modeling Practices to Achieve a Reasonable Level of Conservatism in AERMOD Modeling Demonstrations.
Sergio A. Guerra
EM Magazine, December 2014.

www.cppwind.com www.cppwind.com
Concentrations at Different Percentiles St. Paul Park 436 monitor (2011-2013)
Percentile µg/m3
50th 2.6
60th 3.5
70th 5.2
80th 6.1
90th 9.6
95th 12.9
98th 20.1
99th 25.6
99.9th 69.5
99.99th 84.7
Max. 86.4

www.cppwind.com www.cppwind.com
Case 3 with Three Different Backgrounds
Case 3 with
Max. Bkg
(µg/m3)
Case 3 with
99th % Bkg
(µg/m3)
Case 3 with
50th % Bkg
(µg/m3)
H4H 179.3 179.3 179.3
Background 86.4 25.6 2.6
Total 265.7 204.9 181.9
Percent of
NAAQS 135.6% 104.5% 92.8%

www.cppwind.com www.cppwind.com
Conclusion Current regulatory practices in dispersion modeling lead to unrealistically high predicted concentrations.
• Source characterization techniques such as wind tunnel generated building dimensions can mitigate downwash overpredictions.
• Probabilistic methods to account for emission variability can help achieve more realistic concentrations.
• Use of 50th % monitored concentration is statistically conservative when pairing it with the 99th % predicted concentration.

www.cppwind.com www.cppwind.com
Conclusion These Advanced Modeling Techniques are:
• Protective of the NAAQS,
• Provide a reasonable level of conservatism,
• In harmony with probabilistic nature of 1-hr standards

www.cppwind.com www.cppwind.com
Thank You!
Ron Petersen, PhD, CCM Sergio Guerra, PhD
Cell: 970 690 1344 Cell: 612 584 9595 [email protected] [email protected]
CPP, Inc.
2400 Midpoint Drive, Suite 190
Fort Collins, CO 80525
www.cppwind.com @CPPWindExperts