compliance with eurepgap standards: …ageconsearch.umn.edu/bitstream/117712/2/beatrice muriithi...
TRANSCRIPT

COMPLIANCE WITH EUREPGAP STANDARDS: DETERMINANTS,
COSTS AND IMPLICATIONS ON PROFITABILITY AMONG SMALLHOLDER
FRENCH BEANS EXPORTERS IN KIRINYAGA DISTRICT, KENYA
BY
BEATRICE WAMBUI MURIITHI.
A Thesis Submitted to the Graduate School in partial fulfillment for the requirements
of the Collaborative Master of Science Degree in Agricultural and Applied Economics
(CMAAE) of Egerton University.
EGERTON UNIVERSITY
AUGUST, 2008
ii
DECLARATION AND RECOMMENDATION
Declaration
I hereby declare that this is my original work and has not been presented in this or any
other university for the award of a degree.
Beatrice Wambui Muriithi.
Sign: -------------------------------------
Date: -------------------------------------
Recommendation
This work has been submitted with our approval as supervisors.
Dr. Margaret Ngigi (Department of Agricultural Economics and Agribusiness
Management, Egerton University)
Sign: --------------------------------------
Date: -------------------------------------
Dr. John Mburu (Department of Agricultural Economics, University of Nairobi, and
International Livestock Research Institute (ILRI), Nairobi).
Sign: --------------------------------------
Date: ---------------------------------------

iii
COPYRIGHT
Copy© 2008 Beatrice Muriithi All rights Reserved

iv
DEDICATION
I dedicate this thesis to my parents Mr. and Mrs. Muriithi. It is through your
encouragement and sacrifices that I have made it this far. To my beloved son Collins
Muthuki for your inspiration, may God bless you all.

v
ACKNOWLEDGEMENTS
I cannot be able to individually thank all those who have contributed directly and
indirectly to this work but I take this chance to sincerely thank all of them for their support.
Due to the limitation of space, I mention a few of them for the special role they played in
this work.
First and foremost, I wish to express my gratitude to my supervisors Dr. Margaret
Ngigi and Dr. John Mburu for the advice, encouragement, and support they provided me
with during the whole period that the work was in development to the end. My deepest
gratitude goes to them. I would also like to appreciate effortless support from the
Department of AGEC/BAM, Egerton University and particularly Dr. Benjamin Mutai who
facilitated the whole process of proposal presentation. I also wish to acknowledge the
contribution of my colleagues, John Olwande, Vivian Busienei, Geophrey Sikei, Eliud
Mathu, Peter Musyoka, and Stephen Njogu who encouraged me with insights into my
work.
I want to thank Prof. Willis Kosura, and CMAAE secretariat as a whole for the
financial support which has been the key to the success of my research work. I also wish to
extend my gratitude to Mr. Wilfred Yako, Manager and Mr. Francis Makhoha, field
assistant both of Horticultural Crops Development Authority (HCDA), Mwea Division.
Appreciations are also extended to the research assistants; Caroline Nguru, Patrick
Musyoka and Helen Wairimu. Special thanks to Kirinyaga farmers who gave me an
opportunity to interview them, Mr. Apollo Owour of Kenya Horticultural Exporters
(KHE), Mr. Timothy Mwangi of Kenya Horticultural Development Program (KHDP,
USAID), Mr.Silveester of Woni Exporters, Mr.Cosmas Kyengo of Fresh Produce
Exporters Association of Kenya (FPEAK), and all others who saw the success of my field
work, I say thanks to you all.
Last but not least is to my family members and friends for their encouragements.
Most notably, I owe the greatest debt to my husband George Kihuria, my son Collins
Muthuki and sister Mary Wangari and sister-in-law Alice Gathoni for their strong moral
support and constant encouragements that were very crucial to the success of my work.
vi
ABSTRACT
Horticulture provides many developing countries with opportunities for export
diversification, poverty alleviation and rural development. However, stringent public and
private-sector food-safety standards, for example EurepGap, pose a challenge especially to
small export farmers. Compliance with these standards entails costly investments that may be
a burden to smallholder farmers, failure to which might lead to their exclusion in the global
market. A number of questions which require empirical research arise to confirm or refute
these concerns. The study assesses awareness of the EurepGap standards among smallholder
farmers and analyzes the critical factors influencing their compliance. It also identifies the
costs of complying with these standards and their implications on profitability of smallholder
French bean farming business in Kirinyaga District in Kenya. The study uses simple random
sampling technique to collect primary data from 103 respondents. Descriptive statistics, cost-
benefit accounting (partial budgeting) and binomial probit model are used to analyze the data.
The results show that an information gap exits as regards to awareness of EurepGap standards
especially among the non-compliant farmers. Compliance with the standards requires high
costs of investment and this is a major constraint to the smallholder farmers. Strategies such
as contract farming and collective action through group membership were found to enhance
compliance among smallholder farmers. Further, empirical analysis shows that compliance
with the standards is positively influenced by socio-economic and farm characteristics such as
area under French beans production, and availability of external support from extension
services, but negatively influenced by access to off-farm income. In addition to high cost of
compliance, farmers face other constraints such as high cost of recommended chemicals and
that of hiring extra personnel. Results also show that compliance is not for profit enhancement
but may be for market assurance. However, farmers are enjoying non-financial benefits from
compliance such as skills on good farm management and record keeping. Since the standards
require high cost of compliance with EurepGap standards, the study suggests that the
government and other stakeholders in this sub-sector should assist the smallholder farmers to
ensure their continued access to the lucrative markets. The government should lead in
disseminating information about the standards through extension training, besides
encouraging farmers to form groups to share the cost of compliance. A policy to ensure the
right prices translate to the farmers should be put in place. It is also worth exploring less strict
market where Kenyan products can be channeled to.
vii
TABLE OF CONTENTS
DECLARATION AND RECOMMENDATION ........................................................... ii
COPYRIGHT ................................................................................................................... iii
DEDICATION.................................................................................................................. iv
ACKNOWLEDGEMENTS.............................................................................................. v
ABSTRACT...................................................................................................................... vi
TABLE OF CONTENTS................................................................................................ vii
LIST OF TABLES ........................................................................................................... ix
LIST OF FIGURES .......................................................................................................... x
LIST OF ACRONYMS ................................................................................................... xi
CHAPTER ONE ............................................................................................................... 1
INTRODUCTION............................................................................................................. 1
1.1 Background information ......................................................................................... 1
1.2 Statement of the problem ........................................................................................ 5
1.3 Objectives of the study............................................................................................ 6
1.4 Hypothesis of the study........................................................................................... 6
1.5 Justification of the study ......................................................................................... 6
1.6 Scope and limitations ................................................................................................. 7
CHAPTER TWO .............................................................................................................. 8
LITERATURE REVIEW................................................................................................. 8
2.1 Introduction ............................................................................................................... 8
2.2 Cost of complying with EurepGap Requirements .................................................... 8
2.3 Factors affecting compliance with food safety standards ....................................... 14
2.4 Conceptual framework ............................................................................................ 15
2.4.1 Characterization of costs of compliance with EurepGap................................ 17
CHAPTER THREE ........................................................................................................ 19
RESEARCH METHODOLOGY .................................................................................. 19
3.1 The study area ......................................................................................................... 19

viii
3.2 Data collection and sampling procedures ............................................................... 20
3.3. Data analysis techniques ......................................................................................... 21
3.3.1 Descriptive methods........................................................................................ 21
3.3.2 Cost-benefit accounting .................................................................................. 22
3.3.3 Econometric model ......................................................................................... 23
CHAPTER FOUR........................................................................................................... 26
RESULTS AND DISCUSSIONS ................................................................................... 26
4.1 Descriptive statistics................................................................................................. 26
4.1.1 Awareness of EurepGap requirements............................................................ 30
4.1.2 Farmer’s views on EurepGap contributions.................................................... 31
4.1.3 Constraints encountered in compliance with EurepGap standards ................. 33
4.1.4 Cost of compliance with EurepGap requirements .......................................... 35
4.2 Effect of EurepGap standards on profitability ........................................................ 38
4.3 Assessment of factors influencing compliance ....................................................... 41
4.3.1 Choice of explanatory variables used in the model ........................................ 41
4.3.2 Binomial probit model results......................................................................... 44
4.3.3 Discussion of model results ............................................................................ 45
CHAPTER FIVE............................................................................................................. 48
CONCLUSIONS AND RECOMMEDATIONS........................................................... 48
5.1 Conclusions .............................................................................................................. 48
5.2 Recommendations and policy implications ............................................................. 49
5.3 Suggestions for further research............................................................................... 50
REFERENCES................................................................................................................ 51
APPENDICES ................................................................................................................. 55
Appendix 1: Cost of compliance with EurepGap Standards ..................................... 55
Appendix 2. Correlation Matrices ................................................................................. 56
Appendix 3: Research Survey Questionnaire............................................................... 60
ix
LIST OF TABLES
Table 1: Agro-Ecological Zones in Mwea Division ............................................................19
Table 2: Descriptive statistic s of selected variable .............................................................27
Table 3: Comparison of quantative variables between compliant and non-compliant
farmers...................................................................................................................28
Table 4: Comparison of qualitative variables between compliant and non-compliant
farmers...................................................................................................................29
Table 5: Awareness of EurepGap requirements..................................................................30
Table 6: Positive views of EurepGap standards...................................................................31
Table 7: Negative views of EurepGap standards ................................................................32
Table 8: Constraints encountered during EurepGap certification process...........................33
Table 9: Constraints encountered in maintaining EurepGap certification. ..........................34
Table 10: Constraints hindering complying with the EurepGap standards .........................34
Table 11: Distribution of the additional initial costs of compliance for independent
individual farmers ..............................................................................................35
Table 12: Distribution of the additional initial costs of compliance for a group of farmers36
Table 13: Partial buget describing the change in profitability with compliance of
EurepGap standards ..............................................................................................39
Table 14: Description of variables and their expected signs................................................43
Table 15: Maximum likelihood probit model estimates for EurepGap adoption in Kenya.44

x
LIST OF FIGURES
Figure 1: Factors affecting compliance with EurepGap standards and profitability of French bean (Phaseolus vulgaris) business. ............................................................... 16

xi
LIST OF ACRONYMS
CDA Community Development Agency
EU European Union
EPZA Export Processing Zones Authority
Eurep European Retail Produce Working Group
EurepGap European Retail Produce Working Group Good Agricultural Practices
FAO Food and Agriculture Organization
FAOSTAT Food and Agriculture Organization Statistics Division
FICCI Federation of Indian Chambers of Commerce and Industry
FPEAK Fresh Produce Exporters Association of Kenya
GAP Good Agricultural Practices
GOK Government of Kenya
HACCP Hazard Analysis and Critical Control Points
HCDA Horticultural Crop Development Authority
ISO International Organization for Standardization
KARI Kenya Agricultural Research Institute
KEPHIS Kenya Plant Health Inspectorate Service
KHDP Kenya Horticultural Development Program
KHE Kenya Horticultural Exporters
NGO Non Governmental Organization
NIB National Irrigation Board
PAPPA Policy Analysis for Participatory Poverty Alleviation
PMOs Production and Marketing Farmer Organizations
SPS Sanitary and Phytosanitary standards
UK United Kingdom
UNCTAD United Nations Conference on Trade and Development
USAID United States Agency for International Development
WTO World Trade Organization

1
CHAPTER ONE
INTRODUCTION 1.1 Background information Kenya's economy is heavily dependent on agriculture with nearly three quarters of
Kenyans deriving their livelihood from farming, producing both for local consumption and
for export (PAM, 1995). Agriculture’s contribution to rural employment, foreign exchange
earning and rural incomes are so important that any broad-based improvement in rural
living standards requires substantial productivity growth in agriculture (Nyoro and Jayne,
2005). Agriculture accounts for about 24% of Kenya’s Gross Domestic Product (GDP).
The horticulture sub-sector of the agriculture sector has in the last decade grown to
become a major foreign exchange earner, employer and contributor to food needs in the
country. Currently the horticulture industry is the fastest growing agricultural sub-sector in
the country and is ranked second to tea in terms of foreign exchange earnings. Fruits,
vegetable and cut flower production are the main aspects of Kenya’s horticultural
production. The sub-sector has undoubtedly contributed to increased rural incomes and
reduced rural poverty, through both direct production effects and linkage effects, as
horticultural incomes are re-spent in rural areas (Mutuku et al., 2004). The success of the
sub-sector has seen the export of horticultural produce rising from 1,480 tonnes in 1968 to
163,233 tonnes in 2006 fetching over US $600 million during this period. Exported
vegetables constitute only 4% of the total production, while 96% is consumed locally
(Mutuku et al., 2004). It is estimated that 70% of exported vegetables are grown by
smallholders, with up to 50,000 smallholders growing French beans (Minot and Ngigi,
2004). The major export market is the European Union countries taking 80% of the
exports; with the UK, Netherlands and France being the main markets. Other markets
include Middle East, South Africa, Norway, USA, Canada and Japan (HCDA 2007; Minot
and Ngigi, 2004).
Kenya, having an ideal climate for production of horticulture, produces a wide
range of vegetables, fruits and cut flower for both local and international markets. More
than 90% of Kenyan farmers are involved in horticultural production on an estimated

2
250,000 hectare (McCulloch and Ota, 2002; Mutuku et al., 2004). This sub-sector has
become a recommendable diversification strategy for farmers as horticultural crops often
generate higher returns per hectare than staple food crops. Even the poorest farmers market
a significant proportion of their produce (Minot and Ngigi, 2004). The main vegetable
crops grown for export in Kenya include; kales, cabbages, tomatoes, indigenous
vegetables, garden beans, onions, carrots, garden beans and French beans (HCDA 2002).
The other important export vegetable crops include; garden pea, sugar snap pea, mangetout
and baby corn.
The sub sector has shown a steady 10 – 20% annual increase in export earnings
over the last five years. The private sector has contributed largely to this steady growth
with the government providing structural and macroeconomic reforms including a
liberalized trading environment. There however exist several constraints, which deter the
industry’s steady growth. These include poor infrastructure and increasing market
regulations in the international market. To improve and sustain efficiency in production
and marketing processes and to maintain Kenya’s competitiveness, the industry needs to
enhance production, technology generation and dissemination as well as comply with
international market requirements (EPZA, 2005; HCDA, 2007).
While over 90% of Kenyan farmers in all but the arid regions of Kenya produce
horticultural products, the smallholder farmers who produce directly for export are fewer
than 2% of the total producers (Jaffee, 2003; Mutuku et al., 2004). Kenyan smallholders
who have succeeded in producing for the export market are now facing new challenges
related to changes in the structure of consumer demand for food quality and safety.
Another challenge is as a result of transformation of the food retail market in Europe
through consolidation which has led to increased market power, and much more control
over production practices. European Union (EU) retailers increasingly ask for produce
certified according to specific food safety and quality standards.
The European Retailer Produce Working Group Good Agricultural Practices
(EurepGap) is the most widely known example of a common EU retailers’ standard.
Though it is a private standard, it is regarded as a condition of entry to EU markets and
3
does not provide price premiums. Compliance to these standards for smallholders entails
costly investments in variable inputs (for example approved pesticides) and long term
structures (e.g. grading shed, disposal pit and pesticide store). These investments are
“lumpy” and mostly specific to the fresh export vegetable business. It is questionable
whether small-scale farmers have the resources and skills to comply with the standards.
The costs of implementing the standards may drive them out of lucrative export market for
horticultural produce. Researchers, development practitioners, and government are
concerned that these changes in requirements by the international supply chains for
horticultural and other high-value agricultural products will make it increasingly difficult
for smallholders to maintain their position in the export market trade (Dolan and
Humphrey, 2000; Dolan et al., 2002; Jaffee, 2003).
French beans production in Kenya
French beans are a highly specific vegetable. In Kenya they are mainly grown for
export. There is a large demand for this vegetable in both fresh and processed form in West
European countries. However, in the local markets, there is a limited but growing demand
(Tineke, 2003).
Production of French beans is labour intensive. They employ 3285 man-hours
(mhrs) per ha per year which is considerably high compared to other crop and animal
enterprises such as hybrid maize which employs 984 mhrs/ha/year, maize and beans
intercrop 1579 mhrs/ha/year, irish potatoes 1760 mhrs/ha/year, and milk production 380-
482 mhrs/ha/year (Salasya, 1989).
Exporters require French bean produce that has a specific size (not too large and
not too small), is not infected by insects and has a particular shape. The beans are packed
in boxes in extra-fine and fine grades and shipped by air to Europe. Both output per hectare
and the ratio of the two grades vary depending on the frequency of harvest. The beans are
not only picked and shipped, but also chopped, washed, combined into multi-product
packs, labeled and bar-coded. For the produce to be exported, the exporters must comply
with various local and international food safety and control laws and regulations (Tatter et
al., 2001).
4
French beans exports have grown steadily over the last decade. In 1998, they
accounted for 18 per cent or 13,765.14 tonnes of total volume of exported horticultural
products. This was equivalent to 44.6 per cent of total volume of vegetables exports and it
contributed to US $ 30.18 million in foreign exchange out of the US$ 48.45 million from
vegetables exports. In the year 2006, French beans increased to about 55.9% of total
volume of vegetables exported, weighing about 34.3 million tonnes. This contributed an
equivalent income of about US $ 151.88 million (HCDA, 2007).
French beans are grown by large scale as well as small scale farmers. Depending on
the total size of the farm, the French bean growers can be categorized as follows; small-
scale producers with less than 2.2 hectares, medium-scale producers with between 2.2 to
4.4 hectares, large-scale producers with between 4.4 and 44.0 hectares and plantations are
farmers with more than 44.0 hectares (Mausch et al., 2006).
The EurepGap protocol
The EurepGap¹ was originally initiated in 1997 by retailers belonging to the Euro-
Retailer Produce Working Group (EUREP) and developed into an equal partnership of
agricultural producers and their retail customers. The aim was to develop widely accepted
standards and procedures for the global certification of Good Agricultural Practices (GAP).
The development of EurepGap was driven by the desire by retailers and producers
to reassure their consumers of food safety following scares such as mad cow diseases
(BSE) and foot-and-mouth epidemic in U.K (Friedberg, 2004). Other concerns include
pesticide levels in food products and the rapid introduction of genetically modified (GM)
foods (EurepGap, 2004). The EurepGap protocol has 250 rules or control points. The goal
of this protocol is to provide the tools that objectively verify best good agricultural
practices to reduce the risk in agricultural production in a systematic and consistent way
throughout the world.
¹ Last year (2007), EurepGap was expanded to cover more countries and changed to Globalgap. However, this study maintains use of EurepGap since this was the standard analyzed during the fieldwork conducted in April 2007.
5
All farmers, retailers or trade operators who join the EurepGap protocol are
committed to five main principles (EurepGap, 2001):
♦ To maintain consumer’s confidence in the quality and safety of the EUREP certified
food.
♦ To practice good agricultural practices.
♦ To minimise the use of pesticides and other chemical inputs as much as possible.
♦ To use non renewable resources (as soil, water, etc.) efficiently.
♦ To be responsible for the occupational health and safety of their workers.
Consequently, it can be easily deduced that the EurepGap protocol is not only
limited to the implementation of integrated production in the fields, but it is also concerned
about the environment, even beyond the agricultural production process, or about socially
related issues, as worker’s health, safety and welfare.
1.2 Statement of the problem
Most of the fresh fruits and vegetables from Kenya target the European market.
However, the high cost of implementation of the private-sector food-safety standards set
by the European Union (EU) retailers, for example EurepGap, present a major challenge
especially to smallholder exporters. The standards have increasingly become a major
determinant of access to markets in the developed countries. Lack of implementation of
these standards might lead to the exclusion of smallholder farmers from the international
market and related market income-earning capabilities and hence worsening the welfare of
rural households. The cost elements that are mostly affected by these standards and their
implications on the farming business however are not known. Further, there is limited
research on factors affecting compliance with the EurepGap standards and their level of
awareness among the smallholder farmers. This makes it difficult to design tailored
policies to assist the farmers.

6
1.3 Objectives of the study
The overall objective of the study is to assess determinants and costs of compliance
with EurepGap requirements and their implications on profitability levels of smallholder
French bean production in Kirinyaga district in Kenya.
Specific objectives
(i). To identify and document the level of awareness of EurepGap requirements among
smallholder farmers.
(ii). To characterize the cost structure (types and magnitudes) associated with compliance
with EurepGap standards.
(iii). To identify the critical factors affecting compliance with EurepGap standards.
(iv). To determine the implications of compliance costs on profitability of French bean
production for smallholder farmers.
1.4 Hypothesis of the study
(i). Farm and household characteristics do not influence compliance with EurepGap
standards.
(ii). Compliance with EurepGap standards has no influence on the profitability of
smallholder horticultural farming.
1.5 Justification of the study
The EurepGap requirements pose a threat to the Kenyan horticultural production
and marketing, in essence they are likely to act as non-tariff barrier to the international
market. Lack of compliance will result to loss of Kenya’s market share and subsequent
substantial loss on foreign exchange earnings. This might further reduce the level of job
creation.
To sustain production and ensure that small-scale producers enjoy the benefits of
lucrative market, they need to comply with food safety standards such as EurepGap to
make them more competitive. High cost of compliance with these standards might depress
their marketed output, resulting in reduced farm income and reduced farm activities.
Compliance with these standards can therefore be useful in the country since this can

7
contribute to poverty reduction in the rural areas where most people face declining outputs,
low prices and imperfect factor prices.
It is therefore important to understand the implications of the EurepGap standards
on smallholder production. Are smallholder farmers able to maintain their position within
the chain? The understanding of these implications requires, assessing the level of
awareness, identification of the key cost components of the standards, their magnitude and
their effect on net income, which will guide policy makers in formulation of policies that
can reduce this burden for the smallholder farmers. Results are also likely to be useful to
stakeholders in the French beans supply chain in addressing this very sensitive part of the
country’s economy. Ways and means of assisting smallholder horticultural farmers in
meeting the required standards will be identified.
1.6 Scope and limitations
The study was confined to Mwea division within Kirinyaga district in Central
province. The results could not be generalized since this was a case study involving only
103 respondents and therefore could only find limited application to other French beans
producing districts in Kenya and especially those with similar socio-economic
characteristics as Kirinyaga district.

8
CHAPTER TWO
LITERATURE REVIEW
2.1 Introduction
Food safety and security issues are gaining more attention worldwide as a result of
emerging apprehensions by majority of consumers, especially in Europe. Emerging
concerns among others include: the negative perception on genetically modified food and
the recent emergence of mad cow disease in the United States and a few years ago in Great
Britain. As a result, consumers have lost confidence in food industries (Jaffee, 2003).
Further, the recent focus on liberalized market economies and globalization has brought
concerns of food quality and safety, sustainable production practices, workers welfare and
safety all aiming at putting in place good agricultural practices. EurepGap is one of the
many standards put in place in response to these consumer concerns (Dolan and
Humphrey, 2000).
The measures included in the EurepGap protocol may act as restrictions of trade of
agricultural and food products. The level of enforcing these measures is expected to
escalate as other trade barriers are reduced as a result of bilateral and unilateral freeing
trade agreements (Tatter et al., 2001). Studies worldwide have shown that abiding by
EurepGap measures will result in additional cost that will be incurred by exporting
countries in terms of new inspection and testing facilities and laboratories and certification
of inputs and outputs causing delays in shipping products to their final destinations. The
additional costs are expected to hinder exports to the EU region and may negatively impact
on employment in agricultural and export sectors in the developing countries (Muaz et al.,
2005).
2.2 Cost of complying with EurepGap Requirements
The cost of implementing the EurepGap can vary widely depending on the
technical competence of producers and the country of production. In developing nations,
much work on infrastructure need to be accomplished before EurepGap standards can be
efficiently implemented. By contrast, producers in developed countries have an advanced
infrastructure and possibly sets of national regulations or good agricultural practices (GAP)

9
which allow a quicker, cheaper and easier transition to EurepGap compliance (Thiagarajan
et al., 2005).
Limited research is available on the impact of EurepGap requirements on
smallholder horticultural production and marketing. Few researchers have tried to explore
the impact in terms of cost of compliance, and those who have done so have come up with
mixed observations. Some studies, such as Wechter and Grethe (2006), show that cost of
compliance is too high thus acting as a non-tariff barrier to trade, while others such as Giac
et al., (2006), show a positive response to compliance with EurepGap requirements. Most
of the studies however agree that cost of compliance is a burden to smallholder farmers
which threatens them of being excluded from the export market as will be shown in the
following literature.
EurepGap and the International Market
Wechter and Grethe (2006) in a study on EurepGap adoption by mango exporters
in Australia, note that there is a need to support poorer and smaller producers in adopting
of EurepGap standards. Smaller farmers may otherwise not make to comply to obtain
certification thereby running a risk of being excluded from the lucrative European markets.
Their study is based on a theoretical framework of a compliance process of three stages
(information stage, decision stage, implementation stage) adopted from Rogers (1995). In
each stage, they looked at factors influencing adoption of the standards. Using full cost
accounting method they determined the monetary cost of compliance at the
implementation stage. An inspection of the implementation stage showed that the costs of
compliance are at 9.51 US$/ton/year on average or 3.8% of the product price (ranging
between 0.3% and 15.2%). This meant that the costs of compliance are real costs which
can lead to reduction of returns especially to the small scale farmers.
Mauz et al., (2005) in a study on economic analysis of food safety in Jordon found
that exporters complying with the EurepGap standards have increased total cost of
exported products by 17%. However, some of them estimated the additional cost to be
approximately 50% of the total cost of production. They found that Sanitary and
Phytosanitary Standards (SPS) and EurepGap regulations create a bias in favour of large

10
scale farmers. This is simply because complying with these regulations requires high
amounts of fixed (investment) cost in terms of suitable infrastructure and operational costs
of employing new staff and procuring new materials, among others. Using a partial budget
analysis from one of the major strawberry producer/exporter in the Jordan Valley who has
been exporting fresh strawberries to the EU markets for the last ten years, they showed in
figures what it takes, in terms of new investment, to comply with the EurepGap
regulations. The additional costs of EurepGap certification were estimated to be about 22%
of the costs incurred using the traditional production system. Farmers face both technical
and financial constraints when complying with the standards. The technical impediments
are those related to: 1) lack of highly qualified labourers; 2) absence of modern and
efficient packing and grading facilities; and 3) absence of quality control laboratories in the
region especially for testing chemical residues. The commercial impediments: 1) high cost
of exported products from the sources of origin; 2) difficulties in shipping and forwarding
procedures to EU markets; and 3) difficulties in issuance of needed certificate.
In India, a survey conducted by Federation of Indian Chambers of Commerce and
Industry (FICCI, 2006), reveals that exporters to EU were finding it increasingly difficult
to comply with EurepGap standards set by EU. The survey found that in some cases the
cost of complying with EU standards could cost as high as 65% of the production cost.
Exporters of a wide variety of products like grapes, chillies, mango, papaya, pineapple and
other crops reported that high cost of certificates for complying with European standards
was making it difficult for them to export to EU.
In Vietnam, Giac et al., (2006) noted that, although obtaining EurepGap certificate
will have a positive impact not only on market access but environmental and social
aspects, smallholder farmers will face various constraints in adoption. These constraints
are associated with heavy book keeping, high cost of maintaining field hygiene and
sanitation facilities, mistrust among stakeholders in the value chain and lack of rewards for
application of EurepGap. The smallholder farmers need technical or financial support or
social recognition to facilitate quick compliance.

11
EurepGap status in developing countries Most of the developing countries market their horticultural produce to the European
Markets (Mutuku et al., 2005). Export of all horticulture products have boomed over the
last decade but changes around the world are causing concern, including the saturation of
the traditional European market and tightened controls by supermarkets. African growers
face increasing pressure from the set controls which leads to higher production costs and
political uncertainties following the demise of the Lome convention, leading to a new and
so called level playing field under the World Trade Organization (WTO) from 2007
onwards.
Graffham and Vorley (2005) noted that the impact of EurepGap in the Sub-Saharan
countries depends on scale and sophistication of operation. For large commercial
operations (44 hectares and above) finance, infrastructure and personnel are no problem.
For small-scale operations, there is a problem of lack finance and infrastructure, personnel
shortages and low capacity. Large farms have the necessary financial resources and can
usually complete the required facilities within six or seven months (a maximum of one
year). The same task would probably take smaller farms two to three years. They analyzed
the cost of compliance as a percentage of annual gross margins in some developing
countries. In Zambia for example, capital (investment) costs for small scale farmers
(owning between 0.3-1.8ha) averaged between 5-33% for donor supported farmers
compared to 26-160% for non supported farmers. Recurring (maintenance) costs averaged
between 1-8% and 9-53% for donor supported and non-supported farmers, respectively.
This shows the importance of support services in determining the decision to comply with
the EurepGap standards especially for the financially constrained smallholder farmers.
A study by Aloui and Kenny (2005) in Morocco revealed that compliance with
EurepGap standards poses several technical and financial problems for Moroccan
producers and exporters. The financial requirements are seen as the main limiting factor for
implementation. Using a microanalysis approach, for a medium-sized tomato farm of 10
ha, the cost of implementing the EurepGap standard is estimated at 8% of the total
accumulated farm gate costs. After post harvest, transport, and marketing costs are added,

12
compliance costs represent 3 % of the total cost. Recurring costs which include; training,
monitoring and surveillance, and certification are estimated at 2% of the farm gate costs.
The smallholder farmers cannot afford the additional costs of the investment in equipment
and infrastructure needed for compliance with traceability, record-keeping, waste and
pollution management, worker health, and environmental issues. For these reasons,
EurepGap is now implemented only in large farms that have more than 400 ha of citrus
and more than 100 ha of vegetables and tomatoes.
In Costa Rica, implementation of EurepGap increased cost of production by about
7.8% of total cost (Anderson and Somaribas, 2003). The extra cost however was incurred
by the exporters (buyers of the products) who catered for cost of training, certification and
laboratory analysis. Investment was made on infrastructure, including housing, toilet
facilities, and storerooms for machinery and agrochemicals. Farmers were required to
purchase pesticide application gears and apply newly recommended herbicide.
EurepGap in Kenya
Kenya is unique among developing countries in that the most significant player in
the agricultural export sector is the smallholder. In the recent past, only a few Kenyan
farmers were operating to international quality and safety standards. Export-bound produce
was being sold through informal networks of brokers, traders and resellers who had limited
understanding of international standards. From the first of January 2005, farmers who
export horticultural produce to the European Union were required to comply with the
EurepGap regulations including a sophisticated set of good agricultural practices (GAP).
These requirements cover among others agro-chemical use, record-keeping, farm
infrastructure, hygiene facilities and grading and packing processes (New, 2005).
To many farmers in Kenya the stringent non-legal requirements of EurepGap were
seen as yet another trade barrier. Many of them ask why European consumers are so
against products from Kenya with no realization that the same rules apply to producers
worldwide. Even for those farmers that understand the implications of traceability and
EurepGap, and are prepared to undertake the training and auditing procedures, there are
13
many who feel the information has come too late and they feel un-prepared for the
challenges that lay ahead (News Agriculturalist, 2005).
Kenya’s tropical climate demands the use of frequent applications of pesticides that
have over the years proved to be effective. EU regulation force Kenyan producers to
change these applications regimes and pesticide types. However, unless Kenyan
horticultural producers and exporters adapt rapidly to the new measures they will lose the
share of the market built up over the years (Mussa et al., 2004). Musaa et al., (2004) in
their study argue that the impact of stringent consumer health requirements on large
corporations and small-scale farmers will be quite different. Large corporations have much
better conditions than small-scale farmers to quickly adapt to new measures, such as
EurepGap. In fact, European markets have favoured larger producers and exporters since
they have the capacity to respond to new requirements leaving out smallholder farmers
who dominate most of the African agricultural sector.
New (2006) notes that exporters and their outgrowers in Kenya, big and small, have
responded well to market demands for food safety and traceability. EurepGap has
generally had a positive effect on production and marketing. Nevertheless, costs are going
up at a faster rate than the provision of support services and infrastructure for the industry.
Problems such as lack of rural infrastructure, high transportation cost and insufficient
support services hamper the performance of smallholders in the agricultural sector.
Smallholders also suffer from limited access to credit and technical information which is
often tied to contracts with particular exporters or embodied in costly, often expatriate
consultants (Minot and Ngigi, 2004). These constraints further limit the smallholder
farmer’s ability to adopt the market standards such as EurepGap.
Tineke (2003), in a study on export of french beans from Kenya notes that
exporters of this product prefer producers who are up to date concerning EurepGap
requirements and do keep records. Compliance with these requirements also determines the
price the farmers get for their produce. He also notes that exporters prefer large suppliers
because of lower transportation costs, lower production problems and low transaction
costs.
14
2.3 Factors affecting compliance with food safety standards
There are limited studies that look at factors affecting compliance of EurepGap.
However such factors can be related to studies related to other food safety standards such
as SPS, HACCP (Hazard Analysis and Critical Control Points), and others.
Farm and household specific characteristics have been cited as major barriers to
compliance with food safety standards. Charlotte and Fairman (2003) in their study
assessing the factors affecting food safety compliance within small and medium-sized
enterprises (SMEs) in UK, identified the major barriers as; lack of knowledge throughout
the compliance decision process, lack of support services, lack of money to cater for the
costs of compliance, and lack of information. Antle (1995) also agrees that size of the farm
could explain the importance of the cost of implementation as an incentive to adopt food
safety and quality practices.
Other household factors include social capital which is built up through group
membership. According to the theory of institutional economics, high social capital can
result to high gains from group membership (North, 1990). The farmers who are affiliated
to production and/or marketing groups are therefore likely to comply with the standards
than those who are not. Organized in groups, small and medium scale farmers reach the
critical mass that is necessary to become certified. Groups also facilitate exchange of
information, investment in infrastructure and bargaining is easier for favourable
certification deals (Guenther, 2006)
Support services provided to farmers highly influences their decision to comply
with the food safety standards. In Zambia for example, Graffiham (2006) notes that
smallholder farmers (owning between 2-6 hectares of land) who received support from
donors in implementation of the EurepGap standards incurred 2-5% capital cost of total
annual gross profit margin compared to those who were not donor supported who incurred
about 8-23% capital cost of total annual gross profit margin. As a result compliance was
high with farmers who received this support from donors than those who did not. The
support included training of workers, input supply, credit and financing certification and
auditing processes.
15
The market destinations of products are likely to influence the compliance decision.
Producers selling in the local market are not likely to comply while those selling
internationally especially in the European market are required to be certified for the
EurepGap standard. Costs elements involved in compliance are listed in Appendix I.
Government policies on farm land, infrastructure, information access, credit access
and marketing of horticultural products influence farmer’s decision on compliance. These
policies may depress or promote production and marketing products from smallholder
farmers. Jaffee (2003) in his study on transformation of the Kenyan fresh vegetable trade
in the context of emerging food safety argues that, prevailing government policies can be a
barrier towards adoption of safety standards. High levies charged in the markets can also
discourage compliance since they depress the profits realised by the farmers. Policies and
institutional environment that encourages horticultural production and marketing, act as a
catalyst towards complying with EurepGap and other food safety standards (Charlotte and
Fairman, 2003).
Cost of certification, which is a major element of the EurepGap standards, has been
cited as a major barrier to compliance. Graffham (2006), in his study on Zambian farmer’s
experience with the EurepGap standards, notes that some African certifiers charge up to
four times more than the European-based certification bodies. These high costs as well as
other recurring costs such as audit expenses, training and expensive pesticides, overburden
smallholder growers if no external support is provided to them (Graffham, 2006).
2.4 Conceptual framework
This study uses the theory of profit maximization to explain the behavior of
business owners (farmers). The theory of profit maximization is based on the reasonable
notion that people attempt to get highest utility given the constraints facing them. Business
owners will attempt to manage their businesses so as to improve their profit. In a situation
where competition is high (like in the horticulture export market), farmers (business
owners), will improve their profits by paying attention to revenues and costs. Their
objective therefore would be to maximize profits and minimize costs. To achieve this

16
objective, farmers will not only seek to increase their output but also try to enhance market
acceptability of their produce though compliance with the required food safety standards
such as EurepGap. However, compliance may of necessity increase cost of operation.
To maximize profit, farmers are faced with various constraints which influence
compliance with the EurepGap requirements. These constraints includes farm
characteristics and household attributes such as land size, production levels, farming
experience and others as given in Figure 1 below. Other factors include; access to market
for French beans, support services provided to the farmers and the current policies that
may affect both production and marketing of french beans. Compliance with the EurepGap
standards implies incurring additional costs which hence affect the profitability of french
production.
Figure 1: Factors affecting compliance with EurepGap standards and profitability of French bean (Phaseolus vulgaris) business.
Source: Author’s presentation
For French bean producers to realize high returns from the international market,
they must comply with the EurepGap standards. The decision to comply is influenced by
Markets Buyer of produce, Distance from farm to market / produce collection point.
Policy environment
Household characteristics Age of household head, Education, Gender, Household size, Off-farm income.
Compliance with EurepGap standards (Yes/No)
Support services Credit, supply of inputs, collection of output, extension contract, EurepGap training and certification
Profitability of french beans production.
Compliance Costs
Farm characteristics Total land size, Land under French bean, Endowment, Production levels, Farm enterprise mix, Farming experience, Land tenure, Availability of irrigation water

17
various factors as shown in Figure 1 above. The arrows show the source of the influence
and point the factor that is influenced. Farm characteristics such as production
levels/volumes, type of certification and farm enterprise mix may be influenced by the
market destination of the products. The market destination and availability of support
services such as credit and extension contract may also determine whether a farmer is
going to comply with the standards since not all markets demand compliance with these
standards. Household attributes such as age, access to off-farm income, gender, household
size, and education may also determine the decision of the farmer to comply with the
standards. Availability of support services may also determine compliance decision.
Provision of credit for example may provide the farmers with the necessary capital
required to set up the initial structures. Further credit can facilitate high levels of
production, high incomes and hence compliance with the standards. The policy
environment which includes aspects such as current state of the infrastructure, government
policies affecting the horticultural sector and other food safety standards in place may also
influence farmers’ compliance decision. This may further promote or depress the
profitability of the farming business. To comply with the EurepGap standards, farmers
must incur additional costs associated with initial investment and recurring/ maintenance
costs. These costs determine the profitability of the farming business.
2.4.1 Characterization of costs of compliance with EurepGap
Costs of complying with EurepGap requirements can be classified broadly into two
categories; transaction costs and production costs. To be able to characterize these costs, it
is necessary to distinguish transaction cost from production costs, which can be a difficult
task in French beans business. Production of French beans for international market
requires certain institutional arrangements that enhance compliance with EurepGap
standards. Costs associated with these institutional arrangements are mainly transaction
costs. Thus costs arising from implementing such standards such as set-up costs are
regarded as transaction costs.
Compliance with EurepGap standards requires taking various technical measures
such as use of specific chemicals. The costs arising from these technical measures may be

18
regarded as production costs but in reality they are transaction costs. One way of
categorizing such costs would be to consider the reason why the farmer is using the
chemical and whether he had been using it before complying with EurepGap requirement.
Farmers using any specific chemical for the purpose of complying would be regarded to
incur transaction costs. Thus all costs that are not associated with compliance of the
EurepGap requirements will be treated as production costs. In the characterization of the
costs, therefore, the study notes the difficulty of separating production and transaction
costs. However any additional production costs incurred as a way of complying with the
EurepGap standards will be regarded as transaction costs. This is also noted by other
authors in related studies such Aloui and Kenny (2005).
Transaction costs however do not only consist of tangible costs (buildings,
facilities, training, certification, auditing and other measurable costs) but also of non-
tangible costs such as delay of products, uncertainty and poor governance (Lutz, 1994).
These costs may be difficult to quantify hence will not be included in the study. Another
common cost in this category which will also not be included is the opportunity cost of
farmers’ participation in meetings and other activities associated EurepGap requirements.
Many authors have used case study approaches to study the cost of compliance
with the EurepGap due to complexity of both mandatory legal provisions and voluntary
codes of practice. Aloui and Kenny (2005) in their model subdivided the additional costs
of compliance into seven basic elements; building and facilities, equipments, technical
assistance, training, monitoring and surveillance, current input use and certification.
Larcher (2005) in her study on cost of compliance with agro-food safety categorizes cost of
EurepGap compliance into micro and macro costs. Micro costs are costs incurred by
producers themselves, while macro costs are costs incurred by regulatory institutions such
a ministry of agriculture. She goes further to subdivide the micro costs into set-up costs
and on-going costs. This study adapts the approaches used by Aloui and Kenny (2005) and
Larcher (2005) to categorize the tangible transaction costs. However, the macro costs will
not feature in the study since it is confined to costs of smallholder farmers.

19
CHAPTER THREE
RESEARCH METHODOLOGY
3.1 The study area
The study was conducted in Mwea Division of Kirinyaga district, located in Central
Province of Kenya. It lies in the mid-altitude range, 1489 to 2000 metres above sea level.
The division has an estimated population of 135,266 persons with a density of 236 persons
per square kilometers (District Agriculture Office, Kerugoya, 1996). The division is
divided into three agro-ecological zones as shown in Table 1. The zones are suitable for the
growing maize, cotton, and sunflower depending on rainfall levels and soil types. There are
several types of soils in the region; red soils, black cotton soils, sandy soils and loam soils.
Their fertility varies considerably from one area to another. Most of the division is covered
by black cotton soil which is suitable for rice production. Rice growing is the major
economic activity in the area. French beans are interplanted with maize on the red soils on
small hills, which cannot retain water and are unsuitable for rice growing. Horticulture is
emerging as an activity with high prospects in this district. The main horticulture crops in
the area are French beans and tomatoes.
Table 1: Agro-Ecological Zones in Mwea Division
Zone Altitude(m) Annual-Mean Temp (degrees)
Annual average rainfall (mm)
Sunflower, Maize-UM 1,280-1,340 20.9-20.4 950-1250
Cotton-MM 1,220-1,280 21.2-20.9 900-1100
Marginal Cotton-LM 1,090-1,220 22.0-21.2 800-950
Note: UM-Upper Midland Zone, MM-Midland Zone, LM-Lower Midland Zone
Source: District Agriculture Office, Kerugoya, 1996
This study area was purposively selected for its unique agricultural practices. First,
land in Mwea is utilized principally for rice production under the National Irrigation Board
(NIB) and horticulture is the main competitor for land use. Since rainfall in the area is low
and irregular, production is through irrigation, hence acute competition for water and land

20
use between rice and French beans (PAPPA, 2000, & 2001). Secondly French beans are
early maturing; this ensures that farmers get income faster compared with tomatoes and
rice, which take 4 and 12 months respectively. The area also grows large quantities of
French beans that are exported to international markets.
3.2 Data collection and sampling procedures
The study utilized primary data collected among smallholder farmers. They were
chosen since they are important actors in the export chain of vegetables and fruits within
the country. Apart from the short period of maturity, French beans were chosen for the
study because (1) it is one of the most important horticultural export crop in the country,
and (2) it is mainly grown by small-scale farmers.
The study adopted a survey design for collecting primary data among the Mwea
smallholder French bean producers in respect to farm and household characteristics,
marketing aspects, compliance with EurepGap standards and support services. A semi-
structured questionnaire was used to elicit data on total output, farm size, labour resources,
gender and education level of farmers, farming experience, enterprise mix, production
levels, fixed assets, type of certification, product prices, quality characteristics (storage
facilities, record keeping, input delivery by buyers), membership in local groups,
investments when adopting EurepGap requirements, training costs and other compliance
costs, benefits and constraints of compliance. Information such as general perceptions of
the requirements was obtained through informal discussions with the farmers and
exporters. Two locations were covered; Nyangati and Kangai locations. The two locations
fall in the same agro-ecological zone and therefore treated as one unit in this study.
Exporters and NGO’s who assisted the farmers in the compliance process gave information
mainly on initial cost of compliance.
The following sampling procedures used were: purposive, and random. Purposive
sampling was used to select the two locations in the division where French bean
production is dominant. Key informants such as Community Development Agencies
(CDA) were used to identify the farmers who grow French beans from the population. The
21
CDA were particularly useful because they are involved in registration of community
development groups with the Ministry of Gender, Culture, Sports and Social Services of
Kenya. A sampling frame consisting 3600 farmers who grow french beans from both
locations was then developed. Using the help of HCDA field assistant and exporter
representatives, farmers were selected using simple random sampling procedure. A total of
103 households were selected for the interview based on the formula given by Nassiuma
(2000) as below;
22
2
)1( eNC
NCn
−+=
Where: n = Sample size, N = Population, C = coefficient of variation and
e = Standard error
Nassiuma says that in most surveys or experiments, coefficient of variation of at
most 30% are usually acceptable. The study took a coefficient of variation of 21% and a
standard error of 0.02 to estimate a sample size of 103 as given below: -
22
2
)02.0)(13600(%)21(
%)21(3600
−+=n =103
Data collection was conducted in the month of April, 2007.
3.3. Data analysis techniques
Descriptive, cost-benefit accounting and econometric techniques were used to
analyze the data. Three computer packages; Statistical Package for Social Sciences (SPSS),
STATA and Ms Excel were used for data management and analysis.
3.3.1 Descriptive methods
Descriptive methods were used in this study to capture the qualitative and
quantative variables that are important in explaining the decision of farmers to comply
with the EurepGap standards. The mean, mode, standard deviation and medians of various
variables were obtained. T-test and Chi-square tests were used to compare selected
household and farm characteristics between the two categories of farmers (compliant and
non-compliant farmers).
22
3.3.2 Cost-benefit accounting
Cost-benefit accounting techniques including partial budgeting were used to
characterize the costs of complying with EurepGap standards and to determine the effect of
the standards on French bean farming business.
Cost elements of complying with EurepGap standards
In the study, the costs were divided into ex-ante or investment costs and ex-post or
recurring costs. Each of these two categories was further divided into seven sub-categories;
building and facilities, equipment, needs assessment, training, technical assistance, current
input use and certification.
Partial budgeting analysis
Partial budgets are costs and returns associated with some change in the business
operation. Partial budgeting estimates the economic effects of adjustments in the farm
business. With partial budgeting, we assume many aspects of the business are constant. We
are only interested in the parts of the business that will change due to the adjustment. The
basis of the concept is to analyze the impact of a proposed change in an already developed
plan. Partial budget show whether it pays for farmers to comply with the EurepGap
standards.
The partial budget is divided into three sections: added returns (added returns and
reduced costs annualized on a yearly basis); added costs (reduced returns and added costs
annualized on a yearly basis); and the analysis sections which include net change in return,
net rate of return and a breakeven analysis. Data needs required for partial budgeting
includes; production or yield levels, commodity prices, input prices and cost of production.
In this study, a partial budget was used to show the effects of adjustments made in
complying with EurepGap standards on farm profits. Thus added returns were taken as the
increase in returns as a result of increase in prices of French beans after complying with
EurepGap standards. Reduced costs were any cost reductions, for example through
reduction of inputs used in production of French beans. Added costs on the other hand
were taken as all additional costs incurred in compliance with EurepGap standards

23
including costs of buildings and facilities, equipment, technical assistance, monitoring and
surveillance and certification.
3.3.3 Econometric model
Econometric analysis was used to test the key factors influencing compliance with
EurepGap standards. The regression results indicates the degree to which specific farm and
household characteristics, market characteristics, support services and policy environment
variables influence compliance with these standards (see Figure 1). This involved
estimation of a binomial probit model. The dependent variable in this multiple regression
was a dummy variable of compliance with EurepGap requirements.
Model specification
This study hypothesizes that farm and farmer characteristics, alongside with
exogenous contextual variables influence the decision to comply with EurepGap standards.
It was assumed that the decision of the thi farmer to comply with the EurepGap
requirements or not depends on an unobservable variable iI that is determined by more
than one explanatory variable, represented by jX . The regression model can be illustrated
as follows;
iji XI 21 ββ += ………………………………………………. (3.1)
Where ijX represents a set of independent variables influencing the decision of thi
farmer. The unobservable variable iI (also known as a latent variable) is related to the
actual decision to comply with the EurepGap standards. Y=1 if the farmer comply and Y=0
otherwise, such that
Yi = 1 if iI >0
0 Otherwise
Assuming that the unobservable variable iI is normally distributed with the same
mean and variance, the probability that the farmer will decide to make any of the above
decision (to comply or not to comply) can be expressed as:
)()/1( 21 ijii XZPXYPP ββ +≤=== …………………………….(3.2)
24
)( 21 ijXF ββ += ………………………………………………….(3.3)
Where )/1( XYP = is the probability that a farmer will comply given the values of
the explanatory variables and iZ is the standard normal variable, ),0(~ 2σNZ . F is the
standard normal cumulative distribution function, while 1β is the constant term and 2β is
the coefficient to be estimated (Gurajarati, 2004).
If X represent a vector of determinants of the farmer’s decision then the basic form
of binomial probit model with I as the predictor variable is reduced to;
ijji XXXY εββββ +++++= ...........22110 ………………..(3.4)
Where 0β is the constant term, 1β ,….. jβ .are the coefficients to be estimated,
εi is the error term and 1X ,…. jX are the explanatory variables.
The decision to comply with the EurepGap standards varies across households
according to their farm and household factors. This decision is also influenced by other
exogenous variables such as support services, market destinations of the product, and
policies among others as illustrated in Figure 1. The compliance decision model to be
estimated is specified as follows;
iiiiii SUPSVSMKTHHFMCOMP εγβϕδα +++++= ∑∑∑ ∑0 ……(3.5)
Where;
iCOMP is the decision made by farmer i to comply or not, with the EurepGap standards.
This takes the binary probit expression, COMP=1 have complied 0=otherwise.
0α is the constant term, δ, φ, β, and γ are the coefficient to be estimated,
iFM is a vector of farm characteristics variables of farmer i,
iHH is a vector of household characteristics of farmer i,
iMKT is a vector of market characteristics variables such distance to the nearest market,
iSUPSVS is a vector of support services available to the farmer and
iε is the error term.

25
Further, since the above model is a binary response model, the marginal effects of each
independent variable on the probability of an event (compliance in this case) happening
can be computed (Long, 1997).
Let: )()/1Pr( βxFxy == …………………………………… (3.6)
Where F is the cumulative density function for the normal distribution.
The marginal effect is computed by taking derivative of equation 3.6 with respect to jX .
j
j
xx
xyββφ )(
)/1Pr(=
∂
=∂………………….. (3.7)
Assuming that the model is linear, the marginal effects will be computed at the mean of the
independent variables, such that;
j
j
xfx
xyββ )(
)/1Pr(=
∂
=∂……………………………… (3.8)
The sign of the marginal effects is determined by jβ , while the magnitude depends
on the values of the other variables and their coefficients. Thus in a case of binomial probit
model, one cannot confirm the sign of the relationship based on the estimated coefficients
until the marginal effects are computed. For this reason, the estimates are reported in
marginal effects in Section 4.3.2 (see Table 15), based on which the results are interpreted
and conclusions derived.

26
CHAPTER FOUR
RESULTS AND DISCUSSIONS
4.1 Descriptive statistics Out of the 103 respondents interviewed, 79% had complied with EurepGap while
the remainder had not. As presented in Table 2, the average age of household heads in the
study area was 40.3 years while the average household size measured in number counts
was 4.5 persons. The mean level of education of the household heads was 10.1 years while
the average highest education level acquired by the other members of the family living
permanently in the homestead was 12.2 years. This was an indication that most of the
farmers are literate. About 12% of the respondent households were female-headed. The
mean farming experience in years of all the farmers was 14.7 while the mean of those
adopting the standards was 15.6 years. The average farm size owned and total size of land
cultivated (including rented land) was 0.88 ha and 1.38 ha respectively. The sizes of land
indicate that all the farmers in the study area can be classified as small-scale farmers. The
average size of land under French beans was 0.69 ha while average amount of French
beans produced per hectare per year was 3781.82kg. The average price of French beans
was Ksh.46.20 per kilogram with maximum of Ksh.115 and minimum of Ksh.27 per
kilogram. The high price differentials are influenced by demand and supply of French
beans especially in the international market (Tineke, 2003).
With an average experience of 9.3 years, most of the respondents had been engaged
in French bean production for a long time. The farmers whose farms were certified had
longer experience in French bean production with an average of 10 years. About 64% of
the respondents were members of production and marketing farmer groups with an average
of 3.8 years of group membership. About 80.6% of respondents produced under market
contract. The exporters enter into contracts with the farmers to produce for them certain
quantities of French beans. Out of the 103 respondents, about 80% were contracted by
exporters to supply their produce for an agreed period of time and at an agreed price. The
average number of years of production under contract for the farmers engaging in such
kind of arrangement was 3 years. Most of the farmers had been producing French beans for
export with average of 7.5 years. About 47.8% of the farmers who had complied with the
27
EurepGap standards had actually received certificates. The average number of years these
farmers had been certified was about 1.5 years. Average distances from farm to market and
from farm to urban centre were 9.5km and 9.5km, respectively. About 80% of the
respondents delivered their produce to a common grading shed which was on average
1.3km from the farm. The average gross income obtained from French bean production
was Kshs.112, 336 while average net income was about Ksh. 40,624.
Table 2: Descriptive statistic s of selected variable
Variable n Mean Std.
Deviation Min. Max.
Age of household head (years) 103 40.34 10.367 19 70
Farming experience (years) 103 14.65 8.579 1 40.00
Level of education of household head (years)
103 10.14 3.742 3 20
Highest level of education of all members of the family living permanently in the homestead (years)
103 12.21 3.486 7 24
Total land owned (hectare) 103 0.88 1.28 0 10.37
Total land size (owned and rented, ha) 103 1.38 0.145 0.092 10.37
Total Household size in number counts 103 4.54 1.392 1.00 9.00
Area under French beans (ha) 103 0.69 0.950 0.092 4.81
Amount produced per hectare (Kgs) 103 3781.8 728.265 1362 9080
Average price of extra and fine beans (Ksh/Kg)
103 46.17 17.240 27 115
Experience in French bean production(years) 103 9.29 6.034 1 27
Years of group membership 66 3.85 3.07 1 15
Years of production under contract 83 3.04 2.4 1 12
Years of export production 103 7.47 5.357 1 27
Distance from the farm to grading shed (Km)
81 1.3 0.192 0.25 9.50
Distance from the farm to market (Km) 103 9.5 2.49 0.5 15
Distance from the farm to urban centre(Km)
103 9.5 2.49 0.5 15
Number of years certified 42 1.52 0.574 0.50 3.0
Gross income obtained from French bean production (Ksh)
103 11233
6 135617 12500 630000
Total cost of production (Ksh) 103 71711 101454.6 7451 489030
Net income obtained from french bean production (Ksh)
103 40624 52670.50 950.00 282300
Source: Author’s computation using the research survey data

28
Results of T-test and chi-square that show comparison of selected farmer and farm
characteristics between compliant and non-compliant farmers are represented in Table 3
and 4. Household sizes measured in number counts, farming experience in years, total
land size under cultivation, area under French beans, total number of farm enterprises,
gross income obtained from French beans production, net income and cost of production
were significantly different between the two categories. All these are related to gross
production of French beans. A large household for example, is expected to supply more
labour as demanded by French bean production while a large number of enterprises in the
farm can provide the required capital to comply with EurepGap standards.
Table 3: Comparison of quantative variables between compliant and non-compliant farmers.
Variable t-test Sig.(2-tailed)
Age of household head (years) 1.576 0.118* Farming experience (years) 2.118 0.037** Level of education of household head (years) -0.385 0.701 Highest level of education of all members of the family living permanently in the homestead including household head (years) 0.048 0.962 Total land owned (ha) -0.230 0.819 Total land size (owned and rented) (ha) 1.947 0.054** Total household size in number count 2.117 0.037** Area under French beans (ha) 2.504 0.014** Amount of French beans produced per acre (Kg) 2.512 0.546 Average price of extra and fine beans sold (Ksh) -2.569 0.12 Experience in French bean production (yrs) 2.098 0.038** Experience in export production (yrs) 1.501 0.136 Total distance from the farm to urban centre (KM) 1.019 0.31 Total distance from the farm to the nearest market (KM) 1.019 0.31 Total number of farm enterprises 3.368 0.001*** Gross income obtained from French bean production (Ksh) 2.374 0.019** Total cost of production (Ksh) 2.438 0.017** Net income obtained from French bean production (Ksh) 1.398 0.165
NOTE: *** Significant at the 0.01 level;** Significant at the 0.05 level; *Significance at 0.10 level. Data is coded 1-Compliant and 0-otherwise (non-compliant) Source: Author’s computation
The results suggested that EurepGap compliant farmers had significantly larger
sizes of land under French beans, more years of export production and higher levels of

29
gross and net incomes obtained from French beans production. High percentage of farmers
complying with EurepGap standards produced under contract and received constant prices
which are fixed at the beginning of each season. The non-certified farmers who sold their
produce mostly through brokers received higher or lower prices than the other farmers
depending on market forces.
Table 4: Comparison of qualitative variables between compliant and non-compliant farmers.
EurepGap standards compliant (n=81)
EurepGap standards non-compliant (n=22)
Chi-square
P-Value
Variable
% % Earning extra Income Yes 64.2 54.5 2.537* 0.111 No 35.8 45.5
Gender of household head Female 12.3 9.1 0.1781 0.673 Male 87.7 90.9
Extension Contract Yes 82.7 36.4 3.750 ** 0.053 No 17.3 63.6
PMOs Group membership Yes 81.5 0.0 49.902*** 0.000 No 18.5 100.0
EurepGap training Yes 100.0 13.6 85.778*** 0.000 No 0.0 86.4
Contract farming
Yes 98.8 13.6 80.130*** 0.000 No 1.2 86.4
Member of Water Organization
Yes 85.2 81.8 0.150 0.699 No 14.8 18.2
Buyer of the produce Exporter 97.5 13.6 75.020*** 0.000 Broker 2.5 86.4
Credit provision Yes 24.7 0.0 6.741** 0.009 No 75.3 100.0
***Significance at the 0.01 level;** Significance at the 0.05 level; *Significance at the 0.10 level.
Source: Author’s computation

30
From Table 4, it is evident that compliance with EurepGap was highly associated
with extension contract, membership of PMOs, EurepGap training, contract farming, and
access to credit. Out of the 81 respondents who had complied, 81.5% belonged to a group,
82.7% had received extension contract, 98.8% were producing under contract and 97.5%
were selling their produce directly to exporters. All the compliant farmers had received
training on EurepGap standards. Most farmers in the study area reported that they did not
have much access to financial credit but received credit mainly in form of inputs. The
source of credit was mainly from the exporters contracting the farmers or from input
suppliers from whom the farmers purchased their inputs. There was no significant
difference between compliant and non-compliant farmers in terms of access to extra
income, gender and membership of water organization.
4.1.1 Awareness of EurepGap requirements
Table 5: Awareness of EurepGap requirements
EurepGap item
% Sample aware (N=103)
% Compliant aware (n=81)
% Non-Compliant aware (n=22)
Traceability 78.6 97.5 9.1 Record keeping and internal inspection 86.4 100.0 36.4 Site management (soil maps for the farm) 76.7 96.3 4.5 Risk assessment 77.7 97.5 4.5 Laboratory analysis 77.7 97.5 4.5 Technical services 77.7 97.5 4.5 Soil and substrate management 79.6 98.8 9.1 Fertilizer use 84.5 100.0 27.3 Crop protection 88.3 100.0 45.5 Irrigation/ fertigation 84.5 100.0 27.3 Harvesting 85.4 100.0 31.8 Produce handling 86.4 100.0 36.4 Waste and pollution management, recycling and re-use 79.6 97.5 13.6 Worker health, safety and welfare 82.5 98.8 22.7 Environment issues 80.6 97.5 18.2 Certification 83.5 100.0 22.7
Source: Author’s computation
31
Table 5 shows the percentages of the respondents who were aware about different
aspects of EurepGap requirements. Further it distinguishes the respondents in categories of
those who were aware and had complied and those who were aware but had not complied.
For example, out of the 103 respondents, about 78.6% were aware about traceability
component of the standards. Out of 81 respondents who had complied, about 97.5% were
aware about this component while only 9.1% of the non-compliant respondents were aware
about the same item.
The results generally shows that majority of the respondents in the study area were
aware about the various aspects of the EurepGap standards. The analysis however shows
there is an information gap about the standards especially among the non-compliant
farmers. It is also evident that some compliant farmers were not informed about all the
aspects of these standards showing the complexity of these standards among the
smallholder farmers. Most of this information came from the exporters through training of
their contracted farmers. Others sources included: exporters, government extension
workers, Horticultural Crops Development Agency (HCDA) and Kenya Horticultural
Development Programme (KHDP).
4.1.2 Farmer’s views on EurepGap contributions
Benefits/positive views of EurepGap standards
Table 6: Positive views of EurepGap standards
% among the compliant (n=81)
Improved farm hygiene 70.4 Improved human hygiene and health of the farmer 38.3 Proper/safe chemical handling 37.0 Good farm management 27.2 Improved standards of working environment 14.8 Assured market of their produce 14.8 Proper record keeping 9.9 Rational use of inputs 2.5 Bulk purchasing of inputs and equipments 1.2 Correct produce weighing machines 1.2 Assured payment of produce 1.2 Assured produce collection 1.2 Job opportunities 2.5 Proper crop handling 3.7
Source: Author’s computation

32
Farmers noted that the EurepGap standards had contributed positively in various
aspects as illustrated in Table 6. From the results, it is clear that farmers are enjoying the
non-financial benefits associated with these standards. About 70.4% noted that the
standards had contributed to improved farm hygiene. About 37% were of the view that the
skills gained from training on the standards had contributed to safe handling of chemicals
as well as improved human hygiene and health of both the farmer and the workers. About
27.2% of the farmers complying with the EurepGap standards were of the view that their
farm management skills had improved. About 14% of the farmers pointed out that
compliance with EurepGap standards assured them of a ready market for their produce.
Other positive contributions of the standards included skills on proper record keeping,
rational use the farm inputs, bulk purchasing of inputs and equipments hence reducing per
unit cost incurred by each farmer, safe handling of crops leading to reduced product rejects
and improved quality of the produce. Indirectly, the standards also contributed to job
opportunities to field supervisors, graders, secretaries and other support personnel
employed to foresee the success of compliance process.
Negative views of EurepGap standards
Despite the positive contributions, the farmers also pointed out some negative
views on the standards as given in Table 7.
Table 7: Negative views of EurepGap standards
% among the compliant (n=81) High cost of implementation 44.4 No price premiums 28.4 Low returns due to high cost of maintenance 13.6 Low prices of produces 11.1 High produce rejects 6.2 High cost of farming inputs 4.9 Inefficient chemicals 8.6 Unrealistic conditions such as restriction on mixed cropping 4.9 High cost of labour involved 3.7 A lot of time required for training 8.6 Lack of consistency i.e. change with time 1.2
Source: Author’s computation

33
The results shown in Table 7 generally show that there were very few complaints
about the standards. The major complaint was high cost of implementation reported by
about 44% of the compliant farmers. In some cases some farmers were reported to have
dropped out from the farmer groups since they could not be able to raise the money
required for compliance. This was followed by lack of price premiums for compliance with
about 28%, low returns due to high cost of maintenance with about 13% and incidences of
reduced prices of produce with 11%. From key informants’ interviews, it was noted that
efforts of compliance were not rewarded. Other minor negative views about the standards
included high produce rejects, high cost of involved labour, inefficient farm chemicals and
non-consistency of the standards.
4.1.3 Constraints encountered in compliance with EurepGap standards
Farmers experienced various constraints at various stages of complying with the
standards. Table 8 shows the constraints encountered at the initial stages of compliance
while Table 9 shows constraints experienced in maintaining these standards. Constraints
that have lead to non- compliance are given in Table 10.
Table 8: Constraints encountered during EurepGap certification process.
Source: Author’s computation
As shown in Table 8, the major constraint encountered during certification process was
lack of finances in constructing the required buildings and facilities at the initial stages of
compliance reported by about 49% of those who had complied. This was followed by
complexity of the standards hence difficult to understand and to apply reported by about
22%. Other minor constraints included unrealistic requirements such as monocropping
especially because of the small sizes of their land, and lack of training time.
% among the compliant (n=81) Lack if finances/high cost of constructing buildings 49.4 Complex conditions which were difficult to understand 22.2 Unrealistic conditions 2.5 Lack of training time 8.6

34
Table 9: Constraints encountered in maintaining EurepGap certification.
% among the compliant (n=81) High cost of paying involved labour 19.8 Low prices that do not pay the cost of implementation 12.3 Time consuming 9.9 Poor quality of produce 8.6 High cost of farm inputs raising cost of production 7.4 Information barrier 2.5 Low production hence little returns 3.7 High rate of pests and diseases attack 4.9
Source: Author’s computation
As shown in Table 9, the major constraint of maintaining EurepGap standards was
pointed out as high cost of paying involved labour as reported by 19.8% of the compliant
farmers as shown in Table 9. The involved labour included produce graders, field
supervisors, chemical sprayers and clerks. About 12% complained that the prices of their
produce were still very low to pay for the cost of implementation. Other minor complaints
included poor quality of produce, high cost of recommended inputs, low production hence
little returns and high rate of pests and disease attacks. Some farmers complained that the
recommended chemicals were not as efficient as what they used before, this resulted to
high rates pest and disease attack leading to high levels of rejects or in some cases total
loss of the produce.
Table 10: Constraints hindering complying with the EurepGap standards
% among the non-compliant(n=21) Lack of finances for constructing required facilities 100.0 High cost of involved labour 66.7 Lack of information about the standards 66.7 High pest and diseases affecting returns 47.6 Lack of finances to carry out auditing and training 42.9 Complex conditions which are difficult to implement 47.6 Low prices of produce 33.3 Low production hence low returns 28.6 Lack of time required for trainings 14.3 Lack of technical assistance 9.5
Source: Author’s computation
Table 10 shows that, all the farmers who had not complied with the standards pointed
out lack of finances for constructing required facilities as the major constraint. Some
35
farmers had been forced to pull out from contract farming where they are required to
comply due to lack of finances. The other major constraints reported by about 66% of the
no-compliant farmers were high cost of involved labour which was difficult to raise and
lack of information about these standards. About 47% complained that the complexity of
the standards making them difficult to implement while a similar percent complained that
their returns had been affected by high pests and diseases attacks. Other constraints
reported included, low prices of the produce, low production, and lack of time to attend the
rigorous training.
4.1.4 Cost of compliance with EurepGap requirements
Tables 11 and 12 illustrate the additional cost of compliance incurred per year by
the farmers. Table 11 shows the costs incurred by an independent individual farmer while
Table 12 shows costs incurred by a farmer in a group of 30 members. The Tables show the
standard’s cost categories, total amount spent by the farmer on each category, percentage
of total cost of each cost item, and the cost distribution.
Table 11: Distribution of the additional costs of compliance for independent individual farmers
Contribution
Cost Category Total
cost/farmer
% of total cost
Farmer M
Others(Exporter(s) or NGO(s))
Buildings and facilities 85,375 44.1 34,150 51,225 Equipments (such as sprayers e.t.c) 2,660 1.4 2,660 - Needs assessment 2,715 1.4 - 2,715 Technical assistance/service 1,300 0.7 - 1,300 Protective gears 3,200 1.7 3,200 - Inputs used 4,500 2.3 4,500 - Initial auditing 3,810 2.0 - 3,810 Certification/external auditing 6,000 3.1 - 6,000 Record keeping 36,000 18.6 36,000 - Other additional costs 48,000 24.8 48,000 -
Total Cost (Ksh) 193,560 128,510.0 65,050 Total Cost (US$) 2,765.14 1,835.86 929.29
Source: Author’s computation

36
Table 12: Distribution of the additional costs of compliance for group of farmers
Contribution
Cost Category Total (30 farmers)
Total per farmer
% of total cost
By 30 Farmers
Contribution per farmer
Others (Exporter(s) or NGO(s))
Buildings and facilities 1,013,328 33,778 59.3 1,013,328 33,778 - Equipments (such as sprayers e.t.c) 80,280 2,676 4.7 80,280 2,676 -
Needs assessment 81,000 2,700 4.7 - - 81000 Technical assistance/service 33,000 1,100 1.9 - - 33000
Protective gears 52,540 1,751 3.1 52,540 1,751 -
Inputs used 90,000 3,000 5.3 90,000 3,000 - Initial auditing 94,654 3,155 5.5 - - 94,654 Certification/external auditing 71,192 2,373 4.2 - - 71,192
Record keeping 120,000 4,000 7 120,000 4,000 - Other additional costs 72,000 2,400 4.2 72,000 2,400 -
Total Cost (Ksh) 1,707,994 56,933 1,428,148 47,605 279846 Total Cost (US$) 24,399.91 813 20,402 680 3,997.80 Source: Author’s computation
From Table 11, a certified individual farmer used approximately Ksh.85, 375 to set
up required buildings and facilities. Farmers however contributed about 40% of the total
amount of setting up the structures while the rest was contributed by either the exporters or
NGO’s. Farmers using group facilities however incurred lower cost of approximately
Ksh.33, 778 per member in a group of about 30 members in buildings and facilities. The
buildings and facilities included grading shed, chemical and fertilizer stores, toilet
facilities, and irrigation station. The additional cost of compliance incurred in purchasing
additional equipments costed each farmer an approximate amount of Ksh. 2,700 in either
case of farmers’ category. These included spraying and irrigation equipments.
From Tables 11 and 12, needs assessment process costed Ksh. 2,700. Needs
assessment is a process done on the farm before the EurepGap certification process begins
in order to establish the suitability of the farm being certified with the EurepGap standards.
It involves a general view of the farm in terms of location, landscape, distance from water

37
source, farm management practices in place, type of enterprises present in the farm and
other important aspects of the farm. The cost of this process in both cases of an individual
or a group of farmers was paid for by other parties and not the farmer.
Another component of EurepGap compliance was the technical services such as
soil and water analysis. In the study area, this process was mainly paid for by other parties
and not the farmers and it costed about Ksh. 1,300 for an independent farmer and Ksh.1,
100 per farmer in an organized farmer group. To be certified with EurepGap standards, the
farmers were required to purchase protective gears. These gears which included; face
masks, gloves, aprons, and gumboots are meant to protect the farmers and their workers
during spraying of chemicals. Other protective clothes are used during harvesting and
packaging of the produce. From the study it costed each farmer an average of Ksh. 1,700 to
buy these protective clothes per year. Further, to be certified, the farmers were also
required to change some of the inputs from what they used before. These included;
insecticides, fungicides and fertilizers. Farmers in the study area noted that the current
recommended chemicals costed them much more than before, incurring an average of
Ksh.1000 more. However it’s not possible to conclude that this high cost has been
contributed by the standards alone. Other factors such as change in prices of chemicals
may have resulted to this incremental cost.
For a farm to be certified, it must undergo two major types of certification audits;
internal and external audits. Auditing process is quite expensive especially to smallholder
farmers. From the study, the auditing cost was paid by either the exporters or NGOs on
behalf of the farmers. The internal auditing process costed an individual independent
farmer about Ksh.3, 800 while external or certification audit costed about Ksh.6, 000 on a
yearly basis. Internal and external auditing costed each farmer in a group Ksh 3,155 Ksh.
2, 373 respectively. This cost however may be higher or lower across different farmers
contracted by different exporters or across different certification bodies.
To maintain the certificate, EurepGap standards requires that farmers should keep
records of all their activities involved from land preparation to harvesting and sale of the
French beans for easy traceability of the origin of the product. Such records includes; date

38
of planting, variety of beans planted, chemical applied, amount applied and date of
application, date of harvesting and amount harvested and many other aspects. From the
study area, it costed each farmer an average of Ksh.200 per year to buy the required
stationeries. Independent farmers in most cases were required to hire clerks to keep their
records while farmers organized in groups hired clerks jointly. The clerks hired by
individual farmers were paid an average wage of Ksh.3000 per month while those hired by
a group of farmers an average of Kshs.4000 per month. Farmers organized in a group
therefore incurred less cost of about Kshs.150 per farmer per month.
Other additional cost of compliance with EurepGap standards included cost of
hiring other staff members including graders and field supervisors. Each of these additional
staff members was paid an average of Ksh.4000 per month, costing each farmer Kshs.300
per month in a group of 30 members. In addition to the information provided in Tables 12
and 13, it was found out that every member of a farmers’ group was required to contribute
Kshs.3 per kilogram of French bean sold at any given time. This money was used for
maintenance of the buildings and other facilities, equipments, replacement of jointly
owned protective clothes and any other maintenance cost required to retain the certificate.
Further internal audits must be done on a yearly basis to ensure that farmers keep to the
required standards. The cost of this continuous auditing just like the initial auditing was
paid for by the exporters or other supporting NGOs.
The total additional costs of compliance as given in Tables 11 and 12 per year, for
an independent farmer and for a farmer in a group were Ksh.128, 510 and Ksh.47, 605
respectively. Independent farmers incurred about 162% more than farmers organized in a
group. From the above analysis, it can be concluded that smallholder farmers are well off
when organized in farmer groups in terms of complying with EurepGap standards.
4.2 Effect of EurepGap standards on profitability
Analysis of a partial budget was able to answer the second hypothesis of whether
compliance with EurepGap standards had any influence on the profitability of the farming
business. The analysis was done with the assumption that only the cost of compliance
influences profits of the business, holding all other factors constant.
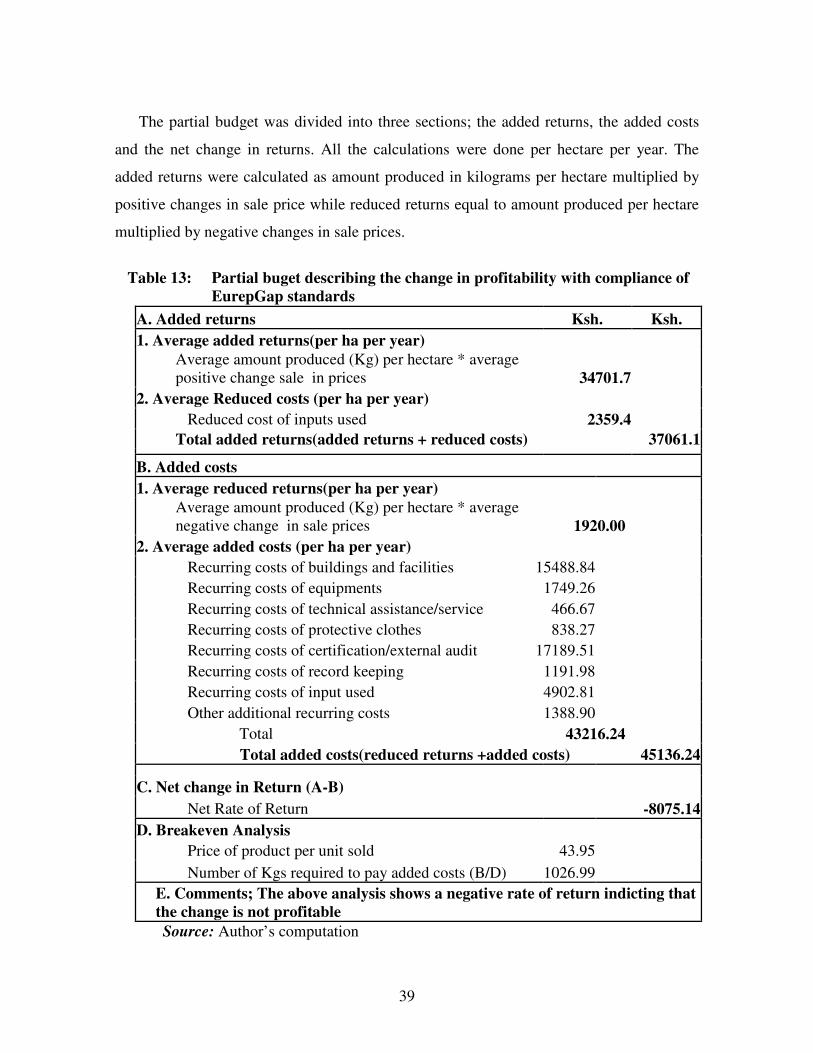
39
The partial budget was divided into three sections; the added returns, the added costs
and the net change in returns. All the calculations were done per hectare per year. The
added returns were calculated as amount produced in kilograms per hectare multiplied by
positive changes in sale price while reduced returns equal to amount produced per hectare
multiplied by negative changes in sale prices.
Table 13: Partial buget describing the change in profitability with compliance of
EurepGap standards
A. Added returns Ksh. Ksh.
1. Average added returns(per ha per year)
Average amount produced (Kg) per hectare * average positive change sale in prices 34701.7
2. Average Reduced costs (per ha per year)
Reduced cost of inputs used 2359.4
Total added returns(added returns + reduced costs) 37061.1
B. Added costs
1. Average reduced returns(per ha per year)
Average amount produced (Kg) per hectare * average negative change in sale prices 1920.00
2. Average added costs (per ha per year)
Recurring costs of buildings and facilities 15488.84
Recurring costs of equipments 1749.26
Recurring costs of technical assistance/service 466.67
Recurring costs of protective clothes 838.27
Recurring costs of certification/external audit 17189.51
Recurring costs of record keeping 1191.98
Recurring costs of input used 4902.81
Other additional recurring costs 1388.90
Total 43216.24
Total added costs(reduced returns +added costs) 45136.24
C. Net change in Return (A-B)
Net Rate of Return -8075.14
D. Breakeven Analysis
Price of product per unit sold 43.95
Number of Kgs required to pay added costs (B/D) 1026.99
E. Comments; The above analysis shows a negative rate of return indicting that the change is not profitable
Source: Author’s computation

40
In the costs section, reduced cost equal to the reduced costs as a result of compliance
divided by area under french beans. The reduced costs were mainly as a result of change of
inputs such as fertilizers and other chemicals. Added costs equal to recurring costs as a
result of compliance divided by the area under French beans. Recurring costs included cost
of maintaining buildings and facilities, equipments and protective clothes, recurring cost of
technical assistance, inputs, annual external auditing and record keeping.
From Table 13, average returns of Ksh.34701.70 were realized from compliance with
EurepGap standards. Some farmers reported that sale prices of their produce had increased
since they started complying with EurepGap standards. The differential increase in prices
multiplied by average amount of French beans produced per hectare resulted to added
returns. In some cases, though few cases, farmers reported that their costs had reduced
especially cost of the inputs (fertilizers, seeds, pesticides and other chemicals). On average
the total reduced costs were Ksh.2359.40. Reduced returns were reported in a few cases
where prices of the produce were reported to have dropped. Average reduced returns were
Ksh. 1920. Complying with EurepGap requirements required high cash outlays. On
average added costs incurred from compliance was given as Ksh. 43,216.24. Overall, there
was a negative change in returns which was calculated as the difference between total
added returns and total added costs amounting to Ksh. 8075.14.
Farmers adopt a technology in order to raise their profit or for easy access of market
for their products. Compliance with EurepGap standards requires high initial cash outlays
which is a major hurdle to the small scale farmers. It takes smallholder farmers some years
to recover this cost. In the study area it was noted that small scale farmers complying with
these standards had not started to realize the benefit of compliance. They complained that
the compliance efforts were not paying as they expected. Therefore in the short run, the
farmers did not earn any profit but rather recovering the cost they invested in setting up the
required structures. The observation was that the farmers are complying with these
standards to improve market access for their produce. Compliant farmers had higher
chances of being contracted than non-compliant farmers, as such they enjoyed constant
prices which are set at the beginning of the season and are assured of the market of their
produce throughout the year.

41
Analysis of the partial budget showed negative rate of return. From the findings, the
main aim of compliance was mainly market assurance and not improvement of profit.
However since this was a static study, a dynamic cost-benefit analysis is necessary to
determine whether compliance is related to profits. The observation made was that
compliant farmers may have a better bargaining position for the prices of their produce
than the non-compliant farmers, hence a possibility of earning profits after recovering the
initial costs of compliance.
4.3 Assessment of factors influencing compliance
4.3.1 Choice of explanatory variables used in the model
The variables used in model were generated from literature review, theoretical
information and through correlation matrices. The results of the correlation matrices
generated are given as Appendix 2, where correlation between two variables was above
0.6, one variable was dropped. This was not without considering the importance of a
variable in the context of the horticultural sub-sector as generated from literature, for
example, education of the household head and the highest education of other members
living permanently in the homestead. From literature, educated farmers are found to be
able to process information and search for appropriate technologies to alleviate their
production and marketing constraints than uneducated farmers (Feder and Slade, 1994). It
is believed that education gives farmers the ability to perceive, interpret and respond to
new information much faster than their counterparts without education. The highest
education of other household members living within the homestead is also expected to
influence the decision of a farmer or household head to adopt a new technology. A study
by Asfaw (2007) on EurepGap standard shows that more educated farmers are more likely
to adopt EurepGap standards than less educated ones. Education of household head as well
as the highest education of other household members living within the homestead does not
significantly differ between the compliant and non-complaint farmers. These two levels of
education had a high correlation; hence, the highest education of other household members
living within the homestead was dropped from the model though important in determining
the compliance decision of a farmer.

42
Total area under French beans was highly correlated to gross income obtained from
French beans production and also correlated to the total cost of production. It is expected
that the larger the area under French beans production, the higher the gross income as well
as the cost of production. As such gross income was dropped from the model and instead
area under french beans was used.
Gender of the household is an important variable in the horticultural industry. The
industry is mainly associated with women and children since it is labour intensive hence
inclusion of this variable in the model. Horticultural farming just like most of buyer-driven
commodity chains is labour-intensive, with women frequently comprising the majority of
these workers (Dolan and Sutherland, 2003). It was therefore expected that the female
headed household had high probability of complying with the standards than the male
headed households.
The size of the family was also included in the model as an important factor that
would positively influence labour supply required in French beans production. A large
family is expected to supply sufficient labour as demanded in the horticultural production
hence high probability of compliance.
Experience in French beans production is expected to influence farmers’ decision
to comply with EurepGap standards. It was expected that farmers who have long
experience in French bean production are willing to take risk by complying with food
standards such as EurepGap with an aim of improving their earnings from their business.
Contract farming is argued to be a key factor that contributes to adoption of
international food standards (Okello, 2005). The contractors who are usually the exporters
were noted to be contributing highly towards setting up the required facilities on behalf of
the farmers. Further the contractors hire the field supervisors/advisors, source chemicals on
behalf of the farmers, pay for farmer’s training, collect the produce from farmers and
extend other services that assist the farmers in compliance with the standards. From the
study, it was observed that almost all farmers who had adopted the standards were
contracted by exporters. Non-compliant farmers on the other hand sold their produce
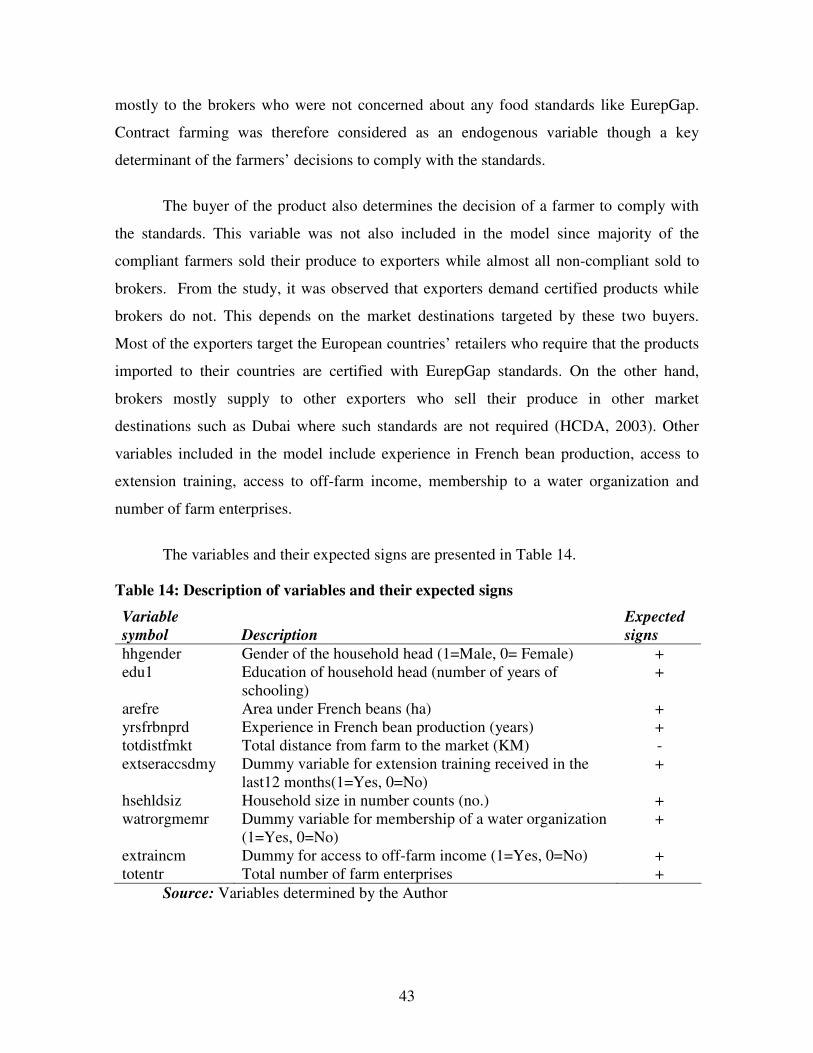
43
mostly to the brokers who were not concerned about any food standards like EurepGap.
Contract farming was therefore considered as an endogenous variable though a key
determinant of the farmers’ decisions to comply with the standards.
The buyer of the product also determines the decision of a farmer to comply with
the standards. This variable was not also included in the model since majority of the
compliant farmers sold their produce to exporters while almost all non-compliant sold to
brokers. From the study, it was observed that exporters demand certified products while
brokers do not. This depends on the market destinations targeted by these two buyers.
Most of the exporters target the European countries’ retailers who require that the products
imported to their countries are certified with EurepGap standards. On the other hand,
brokers mostly supply to other exporters who sell their produce in other market
destinations such as Dubai where such standards are not required (HCDA, 2003). Other
variables included in the model include experience in French bean production, access to
extension training, access to off-farm income, membership to a water organization and
number of farm enterprises.
The variables and their expected signs are presented in Table 14.
Table 14: Description of variables and their expected signs
Variable
symbol
Description
Expected
signs
hhgender Gender of the household head (1=Male, 0= Female) + edu1 Education of household head (number of years of
schooling) +
arefre Area under French beans (ha) + yrsfrbnprd Experience in French bean production (years) + totdistfmkt Total distance from farm to the market (KM) - extseraccsdmy Dummy variable for extension training received in the
last12 months(1=Yes, 0=No) +
hsehldsiz Household size in number counts (no.) + watrorgmemr Dummy variable for membership of a water organization
(1=Yes, 0=No) +
extraincm Dummy for access to off-farm income (1=Yes, 0=No) +
totentr Total number of farm enterprises +
Source: Variables determined by the Author

44
4.3.2 Binomial probit model results
A binomial probit model was estimated to investigate the factors that influence the
decision of the farmers to comply or not to comply with EurepGap standards. Hypothesis
testing was conducted and results presented.
The results of the binomial probit model are presented in Table 15. The dependent
variable is a dummy variable with two categories of choices, 1 if the farmer is compliant
with the EurepGap standards and 0 otherwise. The results show the marginal effects of the
independent variables, standard error, and Z and P values. `
Table 15: Maximum likelihood probit model estimates for EurepGap adoption in Kenya
Variable Marginal effects
Standard Error z P>|z|
hhgender (*) 0.056689 0.061655 1.1 0.273 edu1 0.0024278 0.005217 0.5 0.62 arefre 0.0480072* 0.022096 1.8 0.067 yrsfrbnprd 0.0009221 0.00288 0.32 0.752 totdistfmkt 0.0053916 0.004247 1.52 0.129 extseraccsdmy (*) 0.1689305** 0.126823 2.44 0.015 hsehldsiz 0.0144596 0.016775 1.12 0.264 watrorgmemr (*) -0.0174203 0.039436 -0.38 0.705 extraincm (*) -0.0782011* 0.062021 -1.83 0.067 totentr 0.0498692*** 0.03681 2.81 0.005 constant -2.72 0.007
LR chi² (10) = 40.53 Log likelihood = -33.157012 Prob > chi² = 0.0000 Pseudo R² = 0.3794 Observed Probability. 0.7864078 Predicted Probability. 0.9624919 (at x-bar) (*) dF/dx is for discrete change of dummy variable from 0 to 1 z and P>|z| correspond to the test of the underlying coefficient being 0
***Significance at the 0.01 level;** Significance at the 0.05 level; *Significance at the 0.10 level.
Source: Author’s computation
From Table 15, cultivated area under French beans, access to extension training,
access to off-farm income and total number of farm enterprises owned by the farmer had
significant influence on farmer decision to comply with the EurepGap standards. Other

45
variables such as gender and education of household head, household size, experience in
French bean production, distance to the nearest market and water organization membership
were not significant.
As expected gender and age of the household head, total area under french beans,
access to extension services, total number of farm enterprises owned by the farmer,
household size and experience in French bean production, were positively associated with
the decision of the farmer to comply with EurepGap standards. However, against the prior
expectation, access to off-farm income and water organization membership were
negatively associated with the compliance decision of the farmer. Total distance from farm
to the market was found to be positively associated with the decision of a farmer to comply
contrary to the expected outcome.
4.3.3 Discussion of model results
This sub-section discusses hypothesis 1 as stated in Section 1.4. The hypothesis
states that, “Farm and household characteristics do not influence compliance with
EurepGap standards”. Farm characteristics in this study included variables such as; area
under french beans, number of farm enterprises, access to off-farm income and experience
in French bean production. Household characteristics on the other hand included; age,
gender and education of the household head and household size.
Results of marginal effects in Table 15 show that, as total farm area under French
bean increases, the probability of compliance increases as prior predicted. Increase of land
by one hectare increases the probability of compliance by 5%. Farmers with large farms
under French beans production are likely to comply than those producing in small pieces
of land. The variable was significant at 95% confidence interval, therefore does not agree
with the null hypothesis.
Access to off-farm income, contrary to the priori expectation was found to be
negatively associated with decision of the farmer to comply. Access to off-farm income
reduces the probability of compliance by 7%. The variable was significant at 90%
confidence interval hence rejects the null hypothesis. This was contrary to Okello (2005)
46
findings that extra income should act as a catalyst to compliance where farmers can access
the capital required to set up the necessary facilities. From the study area, it was observed
that farmers engaged in other non-farm businesses did not pay much attention to the
farming business. They considered farming as a second alternative source of income and
hence unwilling to comply with the standards.
Access to extension training had a positive influence on the decision of the farmer
to comply with EurepGap standards and significant at 95% confidence interval. Exposure
to information reduces subjective uncertainty and therefore increases the likelihood of
adoption of a new technology. One approach used to capture the impact of information was
to determine whether a farmer had access to extension training in a given time. Access to
extension training increased the probability of complying with the standards by 16%. It is
most likely that farmers who had received extension services were more informed and
hence had higher chances of complying with EurepGap standards than their counterparts.
The results agree with Okello (2005), who found out that access to extension services
increases the likelihood of adoption of international food standards among small-scale
farmers. The null hypothesis was therefore rejected at 5% level of significance.
Increase in the number of farm enterprises by one increased the probability of
compliance by 4%. The results show a positive influence to the decision of the farmer as
prior expected and the variable was significant at 99% confidence. To spread the
uncertainties and risks involved in the agricultural industry, farmers invest in more than
one enterprise. In the study area for example, other crops such as tomatoes, rice, maize,
bananas, and beans and livestock were common. This variable does not agree with the null
hypothesis.
The study identified other important factors that influence compliance in the study
area which were not however tested in the model. These factors included; availability of
support services such as capital to set-up the required structures and the total cost of
compliance. Most of the farmers in the study area complained that the initial cost of
compliance was too high. They noted that some farmers had to drop from group
membership due to lack of money required to start the initial process of certification. Other
47
farmers complained that the certification process had drained all their savings to the extent
that they had to sell-off their assets to raise the required cash for the compliance process. It
was therefore evident that the total cost of compliance is a key determinant of the
probability of compliance with EurepGap standards. It was found out that all the farmers
who had complied with the standards had received support through various ways including
trainings, advice, finances among others.

48
CHAPTER FIVE
CONCLUSIONS AND RECOMMEDATIONS 5.1 Conclusions
The study assessed the level of awareness of the EurepGap among the smallholder
farmers, identified the costs associated with compliance with these standards, determined
the implications of these costs on profitability of French bean production and also
identified the critical factors affecting compliance. Further, the study identified positive
and negative contributions of these standards and the constraints associated with
compliance.
It was evident that most of the farmers are aware of the standards. Most of this
information however comes from the exporters through training of their contracted
farmers. It was also evident that majority of the farmers who have not complied with the
standards are not informed about the standards. Results also show that though some
farmers have complied with the standards, they do not know all their requirements.
The results of the study reveal that certification with EurepGap standards require
high cost of investment in buildings and facilities as well as high cost of maintenance.
These costs are a major hurdle to the smallholder farmers who cannot afford to pay from
their own savings unless they are assisted to do so by other parties such as NGO’s,
exporters, among others.
The empirical analysis of factors influencing compliance revealed that compliance
with the standards is positively influenced by farm and household characteristics such as
area under french beans, total number of farm enterprises and availability of external
support from extension services, but negatively influenced by access to off-farm income.
Availability of capital required for the high cost of compliance was pointed out as the
major constraint of compliance. In some cases some farmers were reported to have
dropped out of farmer groups since they could not be able to raise the money required for
compliance. It was noted that cost sharing in groups through construction of common
facilities such as grading sheds, chemical stores, offices and hiring of common personnel
such as graders, clerks, field supervisors and spraying team reduces the cost of compliance

49
making it easy for the smallholder farmers. This shows the importance of group
membership in determining compliance with the standards.
Apart from the cost hurdle, the farmers pointed out other constraints such as;
complex and unrealistic requirements, increased cost of hiring extra personnel, low prices
of produce despite the tedious efforts of compliance, high cost of the recommended
chemicals and fertilizers and reduced quality of produce and high attack of pests and
diseases. The farmers however noted that the EurepGap standards had contributed to non-
financial benefits such as; improved farm and human hygiene, good farm management
skills, and knowledge on record keeping. Particularly, the skills on record keeping were
recognized because they could help them keep track of their farming business hence
making rational decisions on where or whom to sell their produce.
Compliance with EurepGap standards in the short run is not triggered by profit but
by product acceptance in the market. Most farmers noted that despite the compliance
efforts, prices of their produce had not changed. Most of them expected that certification
with the standards would result to high prices and hence high profits. For assured and
continued market, the farmers had to comply with the standards. In the long run however,
the farmers might be able to earn high profit after recovering the initial cost of compliance.
5.2 Recommendations and policy implications
If small-scale farmers want to stay in business, they must comply with the
EurepGap standards and any other required standards to continue exporting in the lucrative
markets. Certain things however need to be improved for the smallholder farmers to adopt
these standards. For example, since extension training plays an important role to
compliance, the government should lead in dissemination of information on the existence
and importance of the EurepGap standards. Besides, farmers should be encouraged and
organized to form groups to be able to comply. They should also be assisted financially at
the initial stages in setting up the required structures and facilities. Most of the farmers
have been assisted by the exporters and NGOs to attain certification levels and to maintain
the standards. The question is, if the exporters and the NGOs withdraw their assistance,
can the farmers maintain their current status of certification? The stakeholders in French

50
bean sub-sector should come up with a policy that would help farmers to maintain this
status and also assist those who have not been able to comply.
Most farmers complained that the prices of their produce remained the same even
after certification. This calls for the need of a policy that would ensure that the right market
prices are translated to the farmers who put tireless efforts in the compliance process.
5.3 Suggestions for further research
The study focused on the profitability impacts of compliance with EurepGap
standards among other objectives without looking at the possibility of exploring other less
strict market for small holder farmers. There is a need to explore other market destinations
which do not require strict requirements such as EurepGap that are very expensive to meet
for the small holder farmers. There is also a need to explore the possibility of linking
farmers directly to the wholesalers in the importing countries. By elimination of the
exporter or any other middlemen, the prices received by the farmers would improve. There
is a need to explore whether compliance is really for market assurance or for profits
enhancement. Finally, there is a need for a dynamic study to analyze the effect of
EurepGap standards on profitability of the French bean farming.
51
REFERENCES
Andersen, M. and Somaribas, O., (2003). Producers' experiences of standard implementation and cost-benefits of certification. Case-study with the Del Oro Group, Costa Rica. Presentation given at the Third Expert Meeting on socially and Environmentally Responsible Horticulture Production and Trade. Nüremberg, Germany, 16 February 2003. Available at: http://www.fao.org/organicag/doc/meeting160203.htm
Antle, J. M., (1995), Choice and Efficiency in Food Safety Policy. Washington, DC:
American Enterprise Institute. Aloui, O., and Kenny, L., (2005). The Cost of Compliance with SPS standards for Moroccan
Exports: A case Study. The International Bank for Reconstruction and Development /The World Bank.
Asfew, S., (2006), Economic Impact of Food Safety Standards on Smallholder Fresh Export Produce in Kenya: Linking Contract Farming, Farmer Health and Rural Poverty. PhD thesis, Development and Agricultural Economics, University of Hannover, Germany.
Charlotte, Y. and Fairman, R., (2003). Factors affecting food safety compliance within small and medium-sized enterprises: Implications for regulatory and enforcement strategies. Centre for Risk Management, King’sCollege London, London WC2 2LS, UK.
District Agricultural Officer (DAO), Kerugoya, (1996).
Discussion articles posted on “www.maison-de-stuff.net/archives” on Supermarkets FKAB feldt Consulting. (2001), “Sector Study of the Horticultural Export Sector in Kenya”, A Study made on behalf of USAID, Kenya.
Dolan, C., Humprey, J. and Harris-Pascal, C. (2002). “Horticulture Commodity Chains: The Impact of the UK Market on the African Fresh Vegetable Industry”. IDS Working Paper 96.
Dolan, C. and Humphrey, J., (2000). Governance and trade in fresh vegetables: The impact of UK supermarkets on the African horticultural industry. Journal of Development Studies 37 (2): 147-176
Dolan, C., and Sutherland, K., (2003), Gender and Employment in the Kenya Horticulture Value Chain. Discussion Paper 8. Department for International Development’s Globalization and Poverty Research Programme. University of East Anglia, U.K.
Export Processing Zone Authority (EPZA) report on Horticulture Industry in Kenya, (2005).Report prepared by International Research Network(Nairobi, Kenya) and PKF Consulting Ltd (Nairobi, Kenya)

52
EUREPGAP –General Regulations Fruits and Vegetables. Version 1.1 and Version 2 .1 –Jan 2004. http://www.eurep.org. November 1, 2006
EUREPGAP Protocal for Fresh Fruit and Vegetables Version Sep 2001. http://www.eurep.org. November 1, 2006.
Feder, G., Slade, R., (1994). The acquisition of information and the adoption of new technology. American Journal of Agricultural Economics 66 (2):312-320.
Freidberg, S., (2004), French Beans and Food Scares: Culture and Commerce in an Anxious Age. New York: Oxford University Press.
FICCI (Federation of Indian Chambers of Commerce and Industry), (2006),Survey report on ‘High Cost of Standard Compliance Making Exports to EU Difficult, NEW DELHI.
Giac,T.P, T., Thanh, G.L., and Thuc, T., (2006). Reflecting National Conditions and Development Priorities under the Benchmarking option – Results of country on Vietnam Nong Lam University – Vietnam.
Graffham, A., and Vorley, B., (2005), Standard Compliance, “Experience of impact of EU private and public sector standards, on fresh produce growers and exporters in Sub-Saharan Africa”.Informal Seminar, EU-Brassels, December, 7th, 2005.
Graffham, A. (2006). “European Standards affect African growers”. Developing country Initiative, Pesticide News 71 March 2006. Contributed paper for Fresh Insights on Small-scale producers and standards in agrifood supply chains.
Greene, H.W., (2004) Econometric Analysis 5th Edition. McGraw-Hill, New York University
Guenther, D., (2006). Building up an Internal Control System (ICS)for Certification to EUREPGAP Option 2 in the Horticultural Sector. Trade Standards Working Group Meeting March 2-3, 2006- Washington.
Gurajarati, D.N., (2004), Basic Econometrics, 4th Edition. McGraw-Hill, New York, U.K.
HCDA-Horticultural Crops Development Authority- “Export statistics in volumes and values for fresh fruits, flowers and vegetables for the year 2007 in Kenya.
HCDA - Horticultural Crops Development Authority - "Horticulture export performance, 2002." Horticultural News, Issue No. 28: p. 5-6 (2003).
Jaffee, S., (2003). From challenge to opportunity: “The transformation of the Kenyan fresh vegetable trade in the context of emerging food safety and other standards”. PREM Trade Unit. Washington, D.C.: World Bank

53
Larcher, A., (2005). “Cost of Agro-food Safety and SPS compliance: United Republic of Tanzania, Mozambique and Guinea Tropical fruit”. United Nations Conference on Trade and Development, Geneva, February, 2005.
Long, J. S. (1997), Regression Models for Categorical and Limited Dependent Variables. New Delhi: Sage Publications, Inc.
Lutz, C.H.M. (1994). The functioning of the maize market in Benin: spatial and temporal arbitrage on the market of a staple food crop, PhD Thesis, Amsterdam, University of Amsterdam.
McCulloch, N. and Ota, M., (2002). Export horticulture and poverty in Kenya. Working Paper 174. Sussex, U.K.: Institute for Development Studies.
Mutuku, M., Tschirley, D., and Michel, T.W., (2004). “Improving Kenya’s Domestic Horticultural Production and Marketing Systems: Current Competitiveness, Forces of Change, and Challenges for the future.” Volume II. Horticultural Marketing. Tegemeo Institute of Agrictural Policy and Development, Working Paper No. 08B/2004
Mausch. K, Dagmar, M., D., Asfaw, S. and Waibel, H., (2006). Impact of EurepGap Standard in Kenya: Comparing Smallholders to Large-scale Vegetable Producers . University of Bonn, October 11-13, 2006 Conference on International Agricultural Research for Development.
Minot, N., and Ngigi, M., (2004). “Are horticultural Exports a Replicable Success Story?” Evidence from Kenya and Cote’devoire’. EPTD Discussion Paper No. 120, and MTID Discussion Paper No. 73.International Food Policy Research Institute, U.S.A.
Mussa, Vossenaar, and Waniala, (2003). Strengthening Developing Countries’ Capacities to Respond to Health, Sanitary and Environmental Requirements. The Experience of Kenya, Mozambique, Tanzania and Uganda. Paper No.4. United Nations Conference on Trade and Development.
Muaz, S., Jabarin, A., Assaf, L., Sahawneh, M., AL-Rwadan, O., Allam, H., Assi, N., Hamdam, M., and Al-Hindi, A., (2005), An Economic Analysis of Food Safety Standards and Its Implication on Agricultural Trade in the Context of EU-MED Partnership “The Case of SPS Standards and EUREPGAP Requirements” Femise Research Programme, Royal Scientific Society, Jordan.
Nassiuma, D.K. (2000). Survey Sampling: Theory and Methods. Nairobi: Nairobi University Press.
New Agriculturist, (2005). “Bridging the EurepGap” Contibution paper to reporting Agriculture for the 21st Centaury, January 2 2005. Available at: http://www.new-ag.nfo/05-1/develop/devol.html.
54
News S., KHDP (Kenya Horticultural Development Program), Monthly updates- February 2005 and March, 2006.
North, D.C., (1990). Institutions, Institutional Change and Economic Performance. Cambridge, Cambridge University Press.
Nyoro, J. and Jayne, T.S. (2005). Trends in regional agricultural productivity in Kenya. Kenya agricultural marketing and policy analysis project. Tegemeo institute of agricultural policy and development/ Egerton university, Kenya Agricultural Research Institute (KARI) and Michigan state university, Nairobi.
Ota, M., and Lenne, J.M., (2003). ‘The Vegetable Export system- A role model of local
Vegetable production in Kenya’. Outlook on AGRICULTURE Vol 34, No.4, 2005. pp 225-232.
Okello J. J., 2005. Compliance with International Food Safety Standards: The Case of Green Bean Production in Kenyan Family Farms. PhD Dissertation, Michigan State University.
PAPPA, (Policy Analysis for Participatory Poverty Alleviation), 2000 & 2001.Proceedings
of a Seminar on Looking at Poverty through the PAPPA Approach. Egerton University
PAM. (1995). Proceeding on the Conference on Towards 2000: Improving Agricultural Performance. Nairobi, Tegemeo Institute of Agricultural Policy and Development.
Rogers, E.M., (1995). Diffusion of innovations, Fouth Edition, New York.
Salasya, B.S., (1989), Economic analysis of the major factors influencing exports of French beans from Kenya, MSc thesis in Agricultural Economics, University of Nairobi, Kenya.
Tatter, J., Harris, C., Hegarty, P. V., Kherallah, M. X., Mukindia, C. A., Ngige, J. A., and Aust Sterns,P., (2001). “The Impacts of Standards on the Food Sector of Kenya”. Michigan State University and U.S. Agency for International Development. United Nations Conference on Trade and Development
Thiagargen, D., Bush, D.L., and Frahm. M., (2006), “The relationship of Third party
certification (TPC) TO Sanitary and Phytosanitary (SPS) Measures and the International Agrifood Trade”: Case study EurepGap: Raise SPS Project USAID.
Tineke,V. D. (2003). “Export Chain of French Beans from Kenya.” Msc. Thesis, Wageningen University.
Wechter, K., and Grethe,H.G., (2006), “The adoption of the Eurepgap standards by mango
exporters in Piura, Peru, Australia”. University of Berlin Germany, Berlin

55
APPENDICES
Appendix 1: Cost of compliance with EurepGap Standards
INVESTMENT
COSTS(KHS)
RECURRING COSTS
(KHS)
COST COMPONENT UNITS COST/HA/YEAR UNITS COST/HA/YEAR
1. Buildings and facilities
� Storage room for pesticides
� Storage room for fertilizers
� Packing houses
� Toilet facilities
� Fertigation station
2. Equipments
� For pesticide delivery
� Equipment for fertigation
3. Needs assessment
4. Technical assistance/services
� Laboratory analysis
5. Training
� Initial
� Follow up training
6. Current input use
� Sanitary equipments for
workers (masks, clothes,
gloves, shoes)
� Superior chemicals and
fertilizer use
7. Other cost of certification
� Initial auditing
� External/ certification auditing
� Record keeping and self-inspection
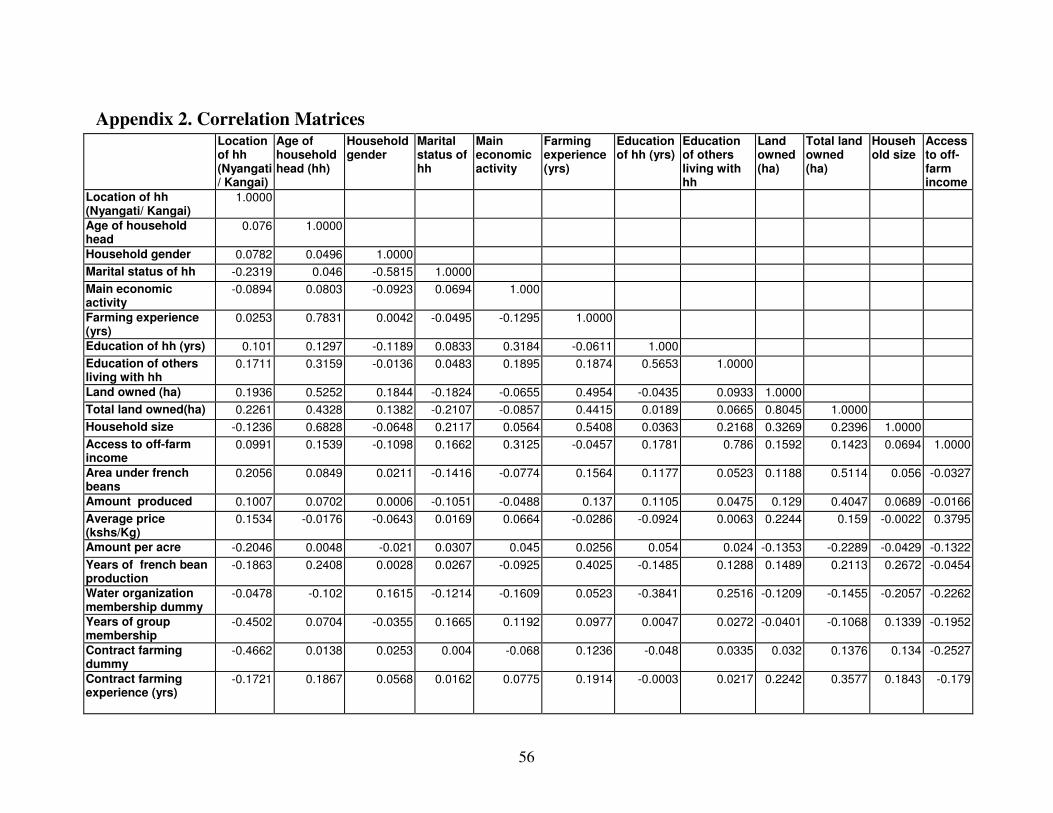
56
Appendix 2. Correlation Matrices Location of hh (Nyangati/ Kangai)
Age of household head (hh)
Household gender
Marital status of hh
Main economic activity
Farming experience (yrs)
Education of hh (yrs)
Education of others living with hh
Land owned (ha)
Total land owned (ha)
Household size
Access to off-farm income
Location of hh (Nyangati/ Kangai)
1.0000
Age of household head
0.076 1.0000
Household gender 0.0782 0.0496 1.0000
Marital status of hh -0.2319 0.046 -0.5815 1.0000
Main economic activity
-0.0894 0.0803 -0.0923 0.0694 1.000
Farming experience (yrs)
0.0253 0.7831 0.0042 -0.0495 -0.1295 1.0000
Education of hh (yrs) 0.101 0.1297 -0.1189 0.0833 0.3184 -0.0611 1.000
Education of others living with hh
0.1711 0.3159 -0.0136 0.0483 0.1895 0.1874 0.5653 1.0000
Land owned (ha) 0.1936 0.5252 0.1844 -0.1824 -0.0655 0.4954 -0.0435 0.0933 1.0000
Total land owned(ha) 0.2261 0.4328 0.1382 -0.2107 -0.0857 0.4415 0.0189 0.0665 0.8045 1.0000
Household size -0.1236 0.6828 -0.0648 0.2117 0.0564 0.5408 0.0363 0.2168 0.3269 0.2396 1.0000
Access to off-farm income
0.0991 0.1539 -0.1098 0.1662 0.3125 -0.0457 0.1781 0.786 0.1592 0.1423 0.0694 1.0000
Area under french beans
0.2056 0.0849 0.0211 -0.1416 -0.0774 0.1564 0.1177 0.0523 0.1188 0.5114 0.056 -0.0327
Amount produced 0.1007 0.0702 0.0006 -0.1051 -0.0488 0.137 0.1105 0.0475 0.129 0.4047 0.0689 -0.0166
Average price (kshs/Kg)
0.1534 -0.0176 -0.0643 0.0169 0.0664 -0.0286 -0.0924 0.0063 0.2244 0.159 -0.0022 0.3795
Amount per acre -0.2046 0.0048 -0.021 0.0307 0.045 0.0256 0.054 0.024 -0.1353 -0.2289 -0.0429 -0.1322
Years of french bean production
-0.1863 0.2408 0.0028 0.0267 -0.0925 0.4025 -0.1485 0.1288 0.1489 0.2113 0.2672 -0.0454
Water organization membership dummy
-0.0478 -0.102 0.1615 -0.1214 -0.1609 0.0523 -0.3841 0.2516 -0.1209 -0.1455 -0.2057 -0.2262
Years of group membership
-0.4502 0.0704 -0.0355 0.1665 0.1192 0.0977 0.0047 0.0272 -0.0401 -0.1068 0.1339 -0.1952
Contract farming dummy
-0.4662 0.0138 0.0253 0.004 -0.068 0.1236 -0.048 0.0335 0.032 0.1376 0.134 -0.2527
Contract farming experience (yrs)
-0.1721 0.1867 0.0568 0.0162 0.0775 0.1914 -0.0003 0.0217 0.2242 0.3577 0.1843 -0.179
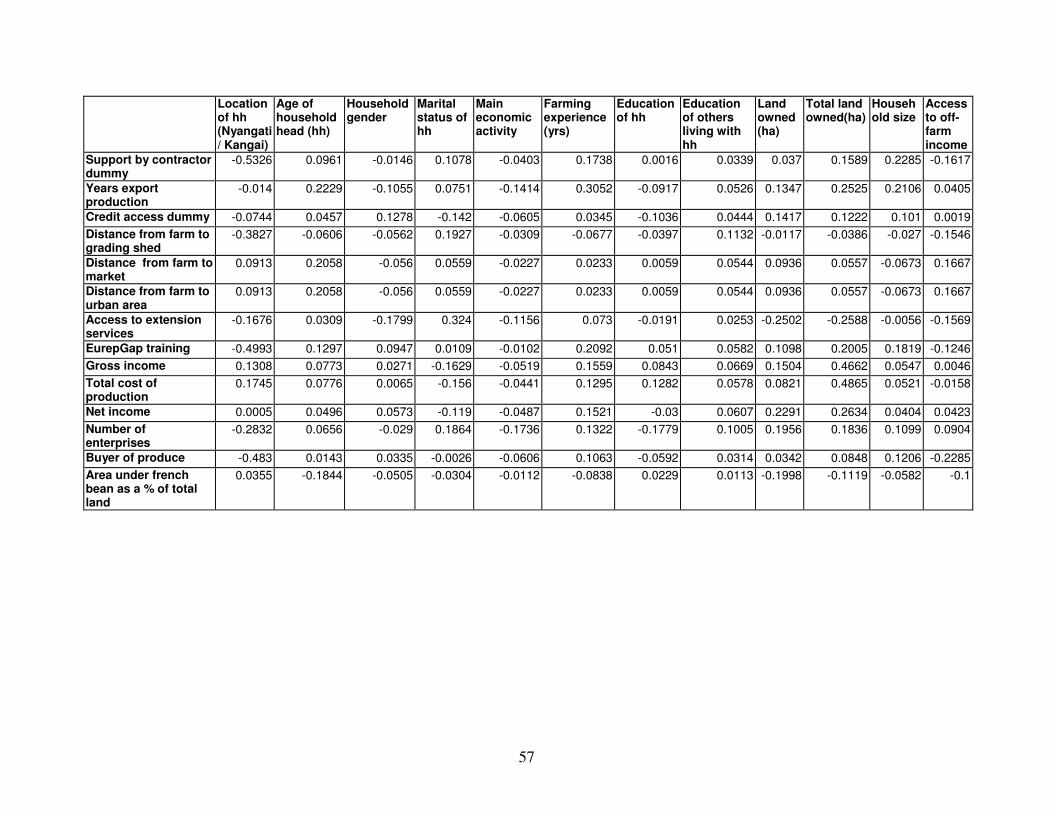
57
Location of hh (Nyangati/ Kangai)
Age of household head (hh)
Household gender
Marital status of hh
Main economic activity
Farming experience (yrs)
Education of hh
Education of others living with hh
Land owned (ha)
Total land owned(ha)
Household size
Access to off-farm income
Support by contractor dummy
-0.5326 0.0961 -0.0146 0.1078 -0.0403 0.1738 0.0016 0.0339 0.037 0.1589 0.2285 -0.1617
Years export production
-0.014 0.2229 -0.1055 0.0751 -0.1414 0.3052 -0.0917 0.0526 0.1347 0.2525 0.2106 0.0405
Credit access dummy -0.0744 0.0457 0.1278 -0.142 -0.0605 0.0345 -0.1036 0.0444 0.1417 0.1222 0.101 0.0019
Distance from farm to grading shed
-0.3827 -0.0606 -0.0562 0.1927 -0.0309 -0.0677 -0.0397 0.1132 -0.0117 -0.0386 -0.027 -0.1546
Distance from farm to market
0.0913 0.2058 -0.056 0.0559 -0.0227 0.0233 0.0059 0.0544 0.0936 0.0557 -0.0673 0.1667
Distance from farm to urban area
0.0913 0.2058 -0.056 0.0559 -0.0227 0.0233 0.0059 0.0544 0.0936 0.0557 -0.0673 0.1667
Access to extension services
-0.1676 0.0309 -0.1799 0.324 -0.1156 0.073 -0.0191 0.0253 -0.2502 -0.2588 -0.0056 -0.1569
EurepGap training -0.4993 0.1297 0.0947 0.0109 -0.0102 0.2092 0.051 0.0582 0.1098 0.2005 0.1819 -0.1246
Gross income 0.1308 0.0773 0.0271 -0.1629 -0.0519 0.1559 0.0843 0.0669 0.1504 0.4662 0.0547 0.0046
Total cost of production
0.1745 0.0776 0.0065 -0.156 -0.0441 0.1295 0.1282 0.0578 0.0821 0.4865 0.0521 -0.0158
Net income 0.0005 0.0496 0.0573 -0.119 -0.0487 0.1521 -0.03 0.0607 0.2291 0.2634 0.0404 0.0423
Number of enterprises
-0.2832 0.0656 -0.029 0.1864 -0.1736 0.1322 -0.1779 0.1005 0.1956 0.1836 0.1099 0.0904
Buyer of produce -0.483 0.0143 0.0335 -0.0026 -0.0606 0.1063 -0.0592 0.0314 0.0342 0.0848 0.1206 -0.2285
Area under french bean as a % of total land
0.0355 -0.1844 -0.0505 -0.0304 -0.0112 -0.0838 0.0229 0.0113 -0.1998 -0.1119 -0.0582 -0.1
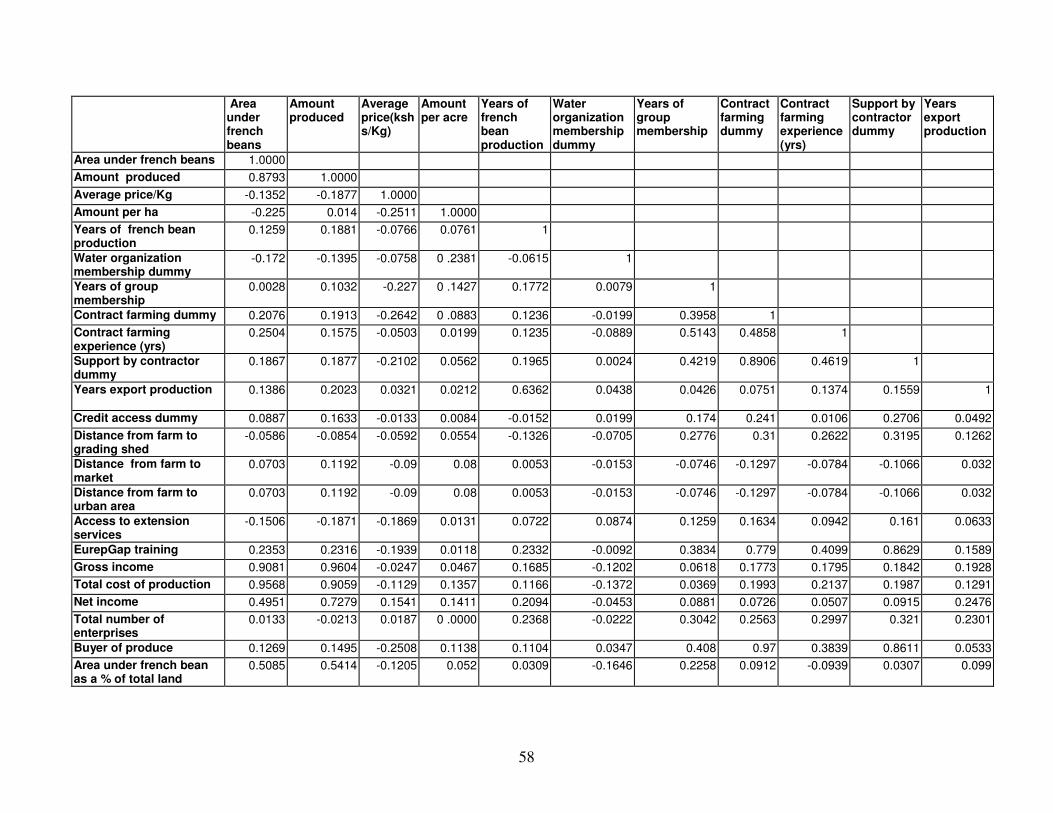
58
Area under french beans
Amount produced
Average price(kshs/Kg)
Amount per acre
Years of french bean production
Water organization membership dummy
Years of group membership
Contract farming dummy
Contract farming experience (yrs)
Support by contractor dummy
Years export production
Area under french beans 1.0000
Amount produced 0.8793 1.0000
Average price/Kg -0.1352 -0.1877 1.0000
Amount per ha -0.225 0.014 -0.2511 1.0000
Years of french bean production
0.1259 0.1881 -0.0766 0.0761 1
Water organization membership dummy
-0.172 -0.1395 -0.0758 0 .2381 -0.0615 1
Years of group membership
0.0028 0.1032 -0.227 0 .1427 0.1772 0.0079 1
Contract farming dummy 0.2076 0.1913 -0.2642 0 .0883 0.1236 -0.0199 0.3958 1
Contract farming experience (yrs)
0.2504 0.1575 -0.0503 0.0199 0.1235 -0.0889 0.5143 0.4858 1
Support by contractor dummy
0.1867 0.1877 -0.2102 0.0562 0.1965 0.0024 0.4219 0.8906 0.4619 1
Years export production
0.1386 0.2023 0.0321 0.0212 0.6362 0.0438 0.0426 0.0751 0.1374 0.1559 1
Credit access dummy 0.0887 0.1633 -0.0133 0.0084 -0.0152 0.0199 0.174 0.241 0.0106 0.2706 0.0492
Distance from farm to grading shed
-0.0586 -0.0854 -0.0592 0.0554 -0.1326 -0.0705 0.2776 0.31 0.2622 0.3195 0.1262
Distance from farm to market
0.0703 0.1192 -0.09 0.08 0.0053 -0.0153 -0.0746 -0.1297 -0.0784 -0.1066 0.032
Distance from farm to urban area
0.0703 0.1192 -0.09 0.08 0.0053 -0.0153 -0.0746 -0.1297 -0.0784 -0.1066 0.032
Access to extension services
-0.1506 -0.1871 -0.1869 0.0131 0.0722 0.0874 0.1259 0.1634 0.0942 0.161 0.0633
EurepGap training 0.2353 0.2316 -0.1939 0.0118 0.2332 -0.0092 0.3834 0.779 0.4099 0.8629 0.1589
Gross income 0.9081 0.9604 -0.0247 0.0467 0.1685 -0.1202 0.0618 0.1773 0.1795 0.1842 0.1928
Total cost of production 0.9568 0.9059 -0.1129 0.1357 0.1166 -0.1372 0.0369 0.1993 0.2137 0.1987 0.1291
Net income 0.4951 0.7279 0.1541 0.1411 0.2094 -0.0453 0.0881 0.0726 0.0507 0.0915 0.2476
Total number of enterprises
0.0133 -0.0213 0.0187 0 .0000 0.2368 -0.0222 0.3042 0.2563 0.2997 0.321 0.2301
Buyer of produce 0.1269 0.1495 -0.2508 0.1138 0.1104 0.0347 0.408 0.97 0.3839 0.8611 0.0533
Area under french bean as a % of total land
0.5085 0.5414 -0.1205 0.052 0.0309 -0.1646 0.2258 0.0912 -0.0939 0.0307 0.099

59
Credit access dummy
Distance from farm to grading shed
Distance from farm to market
Distance from farm to urban area
Access to extension services
EurepGap training
Gross income
Total cost of production
Net income
Number of enterprises
Buyer of produce
Area under french bean as a % of total land
Credit access dummy 1.0000 Distance from farm to grading shed -0.0612 1.0000
Distance from farm to market -0.0607 -0.0441 1.0000
Distance from farm to urban area -0.0607 -0.0441 1.0000 1.0000 Access to extension services -0.1634 0.1405 0.0777 0.0777 1.000
EurepGap training 0.2335 0.2847 0.096 0.096 0.1797
1.0000
Gross income 0.1479 -0.0849 0.103 0.103 -0.1872 0.2271 1.000 Total cost of production 0.148 -0.0697 0.0728 0.0728 -0.1674 0.2246 0.9416 1.000 Net income 0.0957 -0.0843 0.125 0.125 -0.1595 0.1522 0.7611 0.4982 1.0000
Number of enterprises 0.0594 0.1962 0.0083 0.0083 -0.063 0.3147 -0.0122 0.0241 0.0151 1.0000 Buyer of produce 0.2484 0.2746 -0.1316 -0.1316 0.1479 0.7534 0.1334 0.1384 0.0769 0.2778 1.0000
Area under french bean as a % of total land 0.1214 -0.0355 0.0114 0.0114 0.0582 0.0211 0.5619 0.5207 0.4438 -0.132 0.0763 1.0000
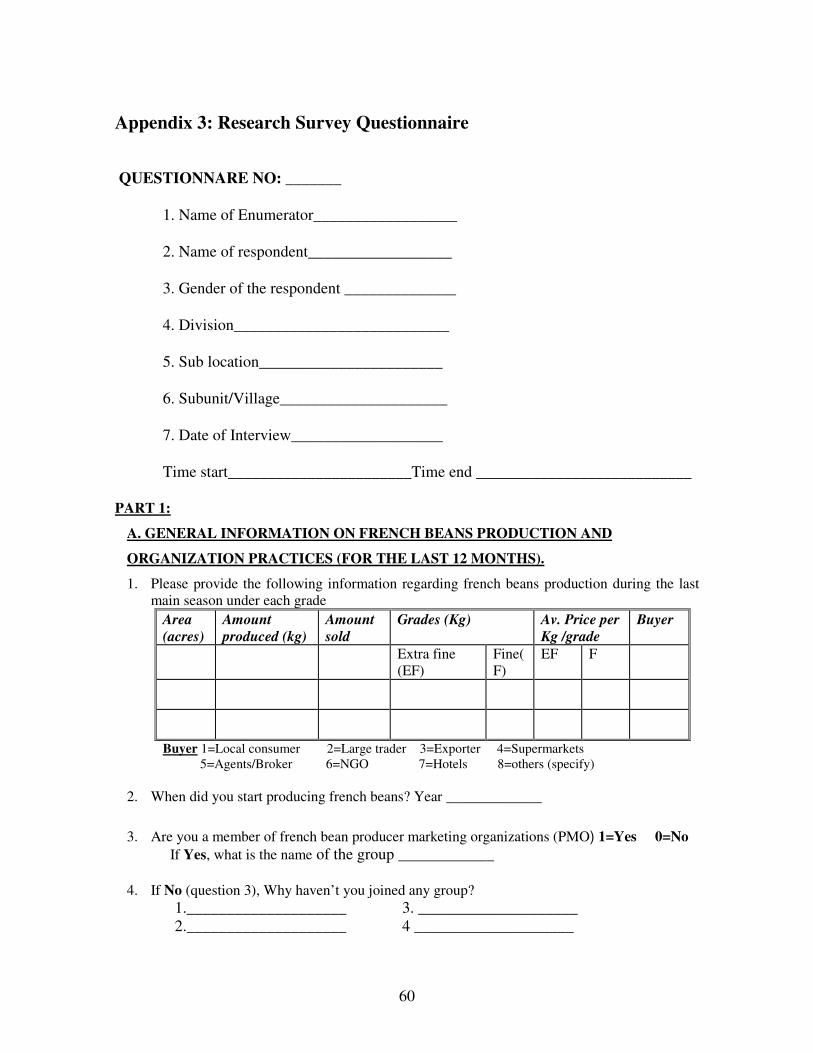
60
Appendix 3: Research Survey Questionnaire
QUESTIONNARE NO: _______
1. Name of Enumerator__________________
2. Name of respondent__________________
3. Gender of the respondent ______________
4. Division___________________________
5. Sub location_______________________
6. Subunit/Village_____________________
7. Date of Interview___________________
Time start_______________________Time end ___________________________
PART 1:
A. GENERAL INFORMATION ON FRENCH BEANS PRODUCTION AND
ORGANIZATION PRACTICES (FOR THE LAST 12 MONTHS).
1. Please provide the following information regarding french beans production during the last main season under each grade
Area
(acres)
Amount
produced (kg)
Amount
sold
Grades (Kg) Av. Price per
Kg /grade
Buyer
Extra fine (EF)
Fine(F)
EF F
Buyer 1=Local consumer 2=Large trader 3=Exporter 4=Supermarkets 5=Agents/Broker 6=NGO 7=Hotels 8=others (specify)
2. When did you start producing french beans? Year ____________
3. Are you a member of french bean producer marketing organizations (PMO) 1=Yes 0=No
If Yes, what is the name of the group ____________
4. If No (question 3), Why haven’t you joined any group?
1.____________________ 3. ____________________
2.____________________ 4 ____________________
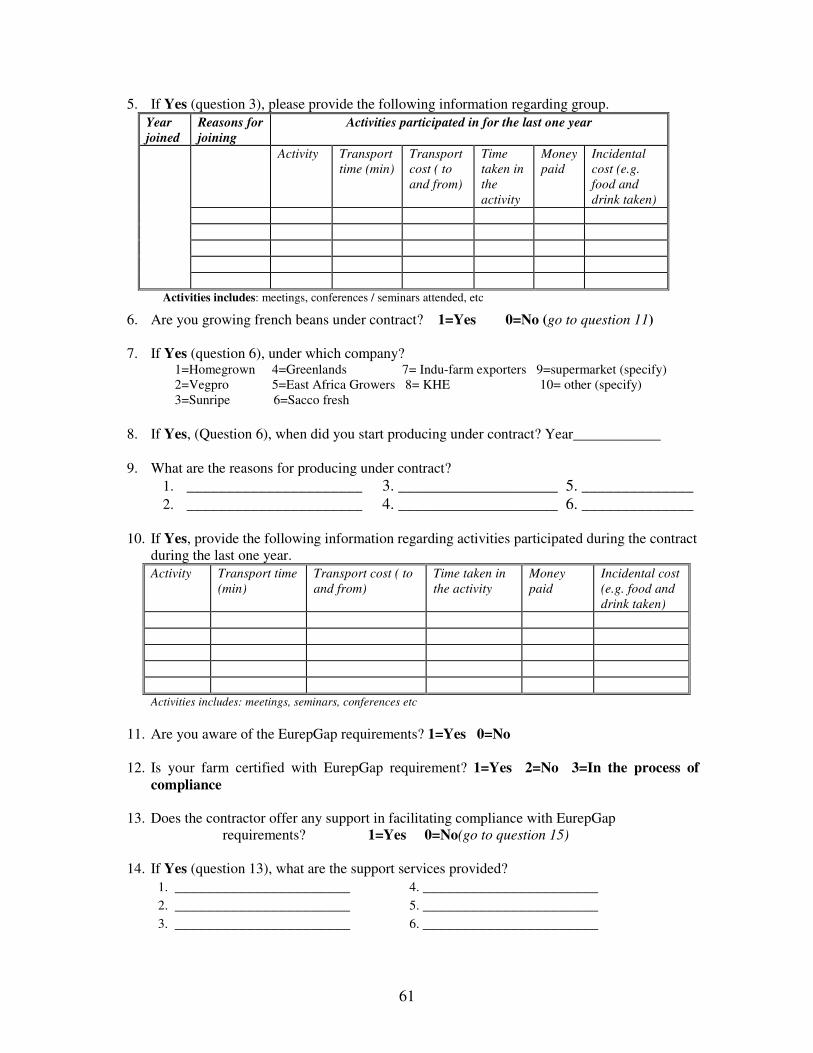
61
5. If Yes (question 3), please provide the following information regarding group.
Year
joined
Reasons for
joining
Activities participated in for the last one year
Activity Transport
time (min)
Transport
cost ( to
and from)
Time
taken in
the
activity
Money
paid
Incidental
cost (e.g.
food and
drink taken)
Activities includes: meetings, conferences / seminars attended, etc
6. Are you growing french beans under contract? 1=Yes 0=No (go to question 11) 7. If Yes (question 6), under which company?
1=Homegrown 4=Greenlands 7= Indu-farm exporters 9=supermarket (specify) 2=Vegpro 5=East Africa Growers 8= KHE 10= other (specify) 3=Sunripe 6=Sacco fresh
8. If Yes, (Question 6), when did you start producing under contract? Year___________ 9. What are the reasons for producing under contract?
1. ______________________ 3. ____________________ 5. ______________ 2. ______________________ 4. ____________________ 6. ______________
10. If Yes, provide the following information regarding activities participated during the contract
during the last one year.
Activity Transport time
(min)
Transport cost ( to
and from)
Time taken in
the activity
Money
paid
Incidental cost
(e.g. food and
drink taken)
Activities includes: meetings, seminars, conferences etc
11. Are you aware of the EurepGap requirements? 1=Yes 0=No 12. Is your farm certified with EurepGap requirement? 1=Yes 2=No 3=In the process of
compliance
13. Does the contractor offer any support in facilitating compliance with EurepGap requirements? 1=Yes 0=No(go to question 15)
14. If Yes (question 13), what are the support services provided?
1. ______________________ 4. ______________________
2. ______________________ 5. ______________________
3. ______________________ 6. ______________________
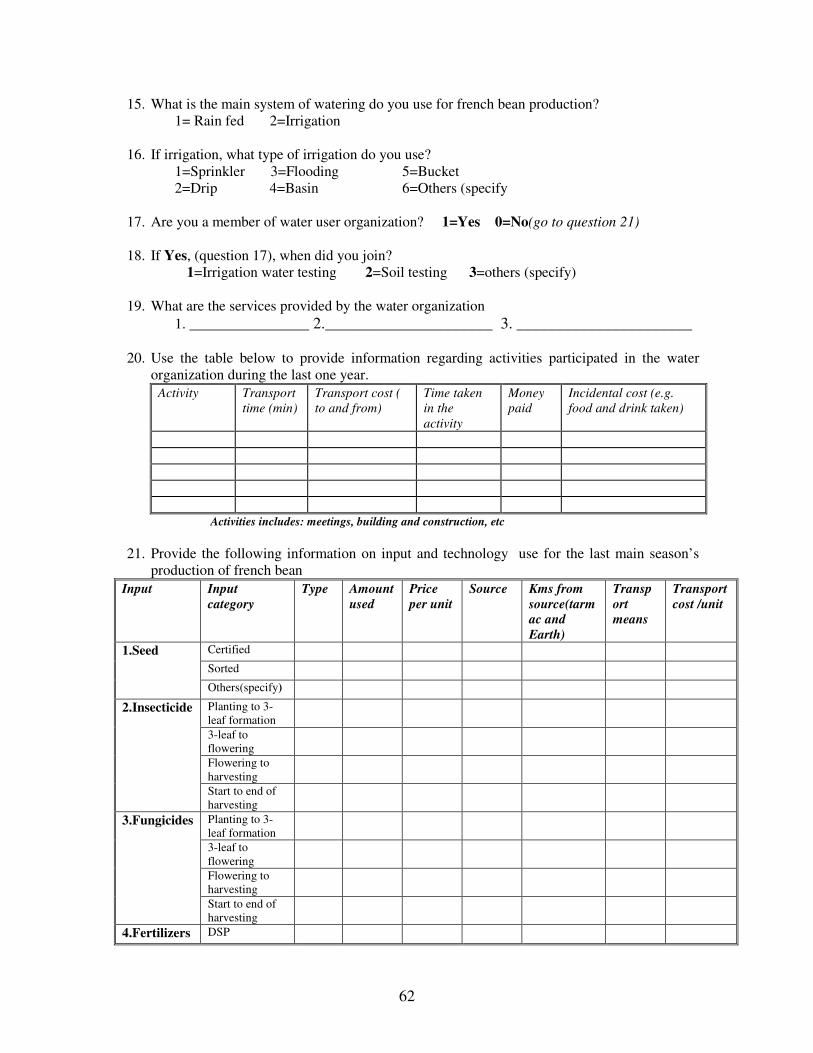
62
15. What is the main system of watering do you use for french bean production? 1= Rain fed 2=Irrigation
16. If irrigation, what type of irrigation do you use?
1=Sprinkler 3=Flooding 5=Bucket 2=Drip 4=Basin 6=Others (specify
17. Are you a member of water user organization? 1=Yes 0=No(go to question 21)
18. If Yes, (question 17), when did you join? 1=Irrigation water testing 2=Soil testing 3=others (specify)
19. What are the services provided by the water organization
1. _______________ 2._____________________ 3. ______________________
20. Use the table below to provide information regarding activities participated in the water organization during the last one year.
Activity Transport
time (min)
Transport cost (
to and from)
Time taken
in the
activity
Money
paid
Incidental cost (e.g.
food and drink taken)
Activities includes: meetings, building and construction, etc
21. Provide the following information on input and technology use for the last main season’s
production of french bean
Input Input
category
Type Amount
used
Price
per unit
Source Kms from
source(tarm
ac and
Earth)
Transp
ort
means
Transport
cost /unit
Certified Sorted
1.Seed
Others(specify) Planting to 3-leaf formation
3-leaf to flowering
Flowering to harvesting
2.Insecticide
Start to end of harvesting
Planting to 3-leaf formation
3-leaf to flowering
Flowering to harvesting
3.Fungicides
Start to end of harvesting
4.Fertilizers DSP
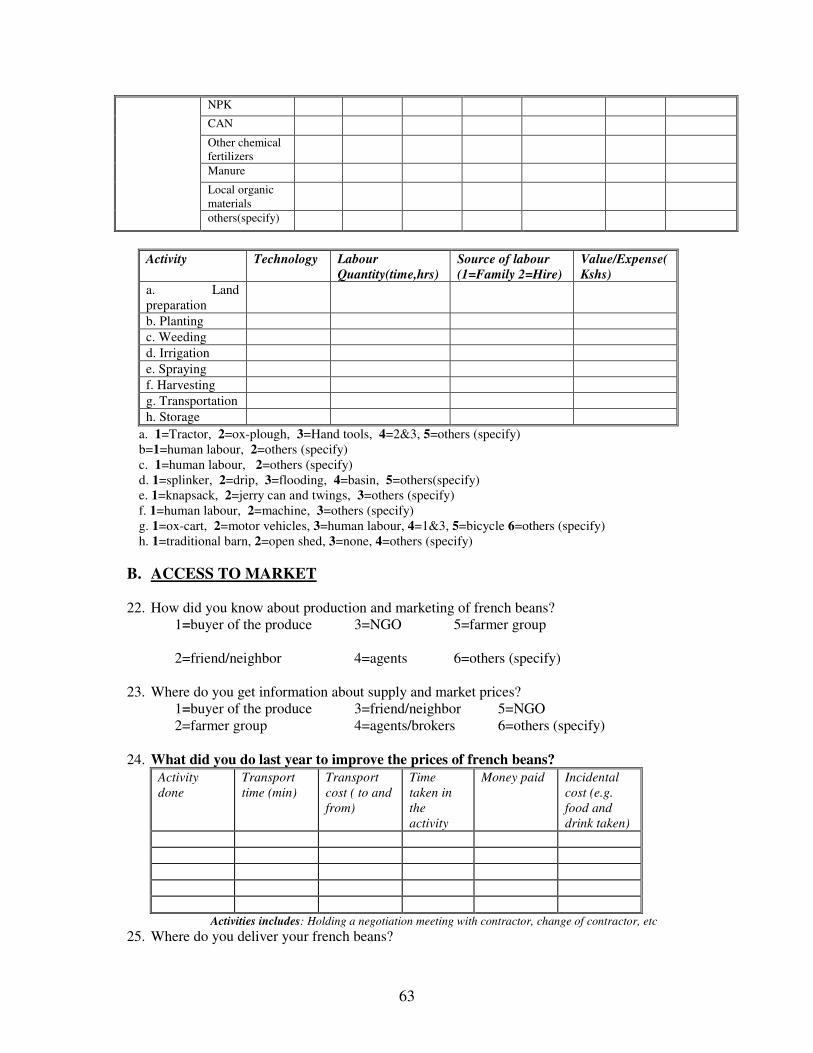
63
NPK CAN Other chemical fertilizers
Manure Local organic materials
others(specify)
Activity Technology Labour
Quantity(time,hrs)
Source of labour
(1=Family 2=Hire)
Value/Expense(
Kshs)
a. Land preparation
b. Planting
c. Weeding
d. Irrigation
e. Spraying
f. Harvesting
g. Transportation
h. Storage
a. 1=Tractor, 2=ox-plough, 3=Hand tools, 4=2&3, 5=others (specify) b=1=human labour, 2=others (specify) c. 1=human labour, 2=others (specify) d. 1=splinker, 2=drip, 3=flooding, 4=basin, 5=others(specify) e. 1=knapsack, 2=jerry can and twings, 3=others (specify) f. 1=human labour, 2=machine, 3=others (specify) g. 1=ox-cart, 2=motor vehicles, 3=human labour, 4=1&3, 5=bicycle 6=others (specify) h. 1=traditional barn, 2=open shed, 3=none, 4=others (specify)
B. ACCESS TO MARKET 22. How did you know about production and marketing of french beans?
1=buyer of the produce 3=NGO 5=farmer group 2=friend/neighbor 4=agents 6=others (specify)
23. Where do you get information about supply and market prices?
1=buyer of the produce 3=friend/neighbor 5=NGO 2=farmer group 4=agents/brokers 6=others (specify)
24. What did you do last year to improve the prices of french beans? Activity
done
Transport
time (min)
Transport
cost ( to and
from)
Time
taken in
the
activity
Money paid Incidental
cost (e.g.
food and
drink taken)
Activities includes: Holding a negotiation meeting with contractor, change of contractor, etc
25. Where do you deliver your french beans?

64
1=collected at farm gate 3=to a town market center (specify the town) 2=to a group’s collection shed 4=other (specify)
26. Why do you sell to the selected buyer (in question 1)? 1. ____________________ 3. ____________________ 5.___________________ 2. ____________________ 4. ____________________ 6. ___________________
27. If selling to an exporter, when did you start participating in export production? Year______
28. What is done to your product once its delivered at the collection point? 1. ____________________ 3. ____________________ 5. ____________________
2. ____________________ 4. ____________________ 6. ____________________
29. Infrastructure: State the approximate distance of the farm from
Walking
time in
minutes
KM
(Tarma
c)
KM
(Earth)
Transport
per Kg of
beans
Fare (Kshs)
Bean collection shed
Market center (specified in 25)
Most important urban center/town
30. Did you receive credit or grant to use in french beans in the last 12 months? 1=Yes 0=No
31. If Yes (Question 30), please indicate the amount of credit (in Kshs) received and what you
used it for.( In kind credits should be converted into money-value prices that prevailed when credit was received) NOTE: CREDIT FOR FRENCH BEANS ONLY
Source Borrowed
0-No
1-Yes
Credit type
1-Money In kind-2
Amount
(Kshs/
unit
What was the cash
used for?(use codes
below)
1.Commercial banks
2.AFC
3.SACCO(specify)
4. Micro-Finance (specify)
5.Local NGO
6.Local trader (specify)
7.Input-store
8.Farmer group (PMOs)
9. Money lenders
10.Friends /family
11..Product buyer
12. Merry-go round
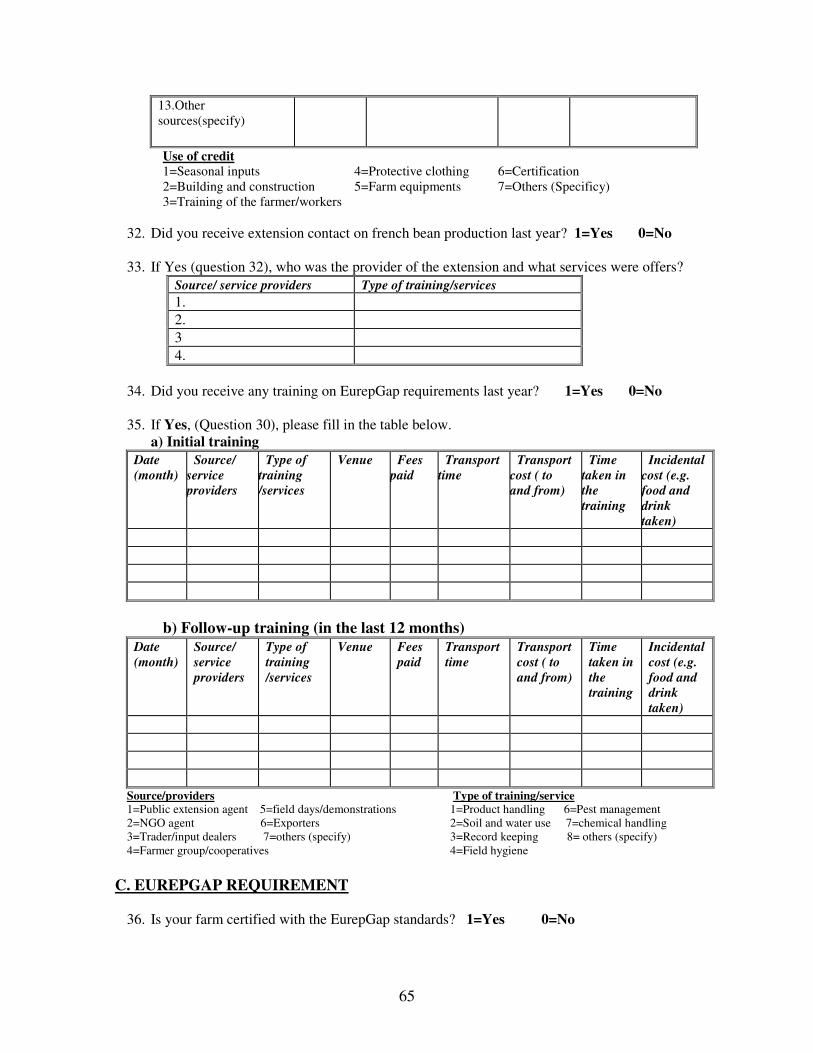
65
Use of credit 1=Seasonal inputs 4=Protective clothing 6=Certification 2=Building and construction 5=Farm equipments 7=Others (Specificy) 3=Training of the farmer/workers
32. Did you receive extension contact on french bean production last year? 1=Yes 0=No
33. If Yes (question 32), who was the provider of the extension and what services were offers?
Source/ service providers Type of training/services
1.
2.
3
4.
34. Did you receive any training on EurepGap requirements last year? 1=Yes 0=No 35. If Yes, (Question 30), please fill in the table below.
a) Initial training
Date
(month)
Source/
service
providers
Type of
training
/services
Venue Fees
paid
Transport
time
Transport
cost ( to
and from)
Time
taken in
the
training
Incidental
cost (e.g.
food and
drink
taken)
b) Follow-up training (in the last 12 months) Date
(month)
Source/
service
providers
Type of
training
/services
Venue Fees
paid
Transport
time
Transport
cost ( to
and from)
Time
taken in
the
training
Incidental
cost (e.g.
food and
drink
taken)
Source/providers Type of training/service 1=Public extension agent 5=field days/demonstrations 1=Product handling 6=Pest management 2=NGO agent 6=Exporters 2=Soil and water use 7=chemical handling 3=Trader/input dealers 7=others (specify) 3=Record keeping 8= others (specify) 4=Farmer group/cooperatives 4=Field hygiene
C. EUREPGAP REQUIREMENT
36. Is your farm certified with the EurepGap standards? 1=Yes 0=No
13.Other sources(specify)
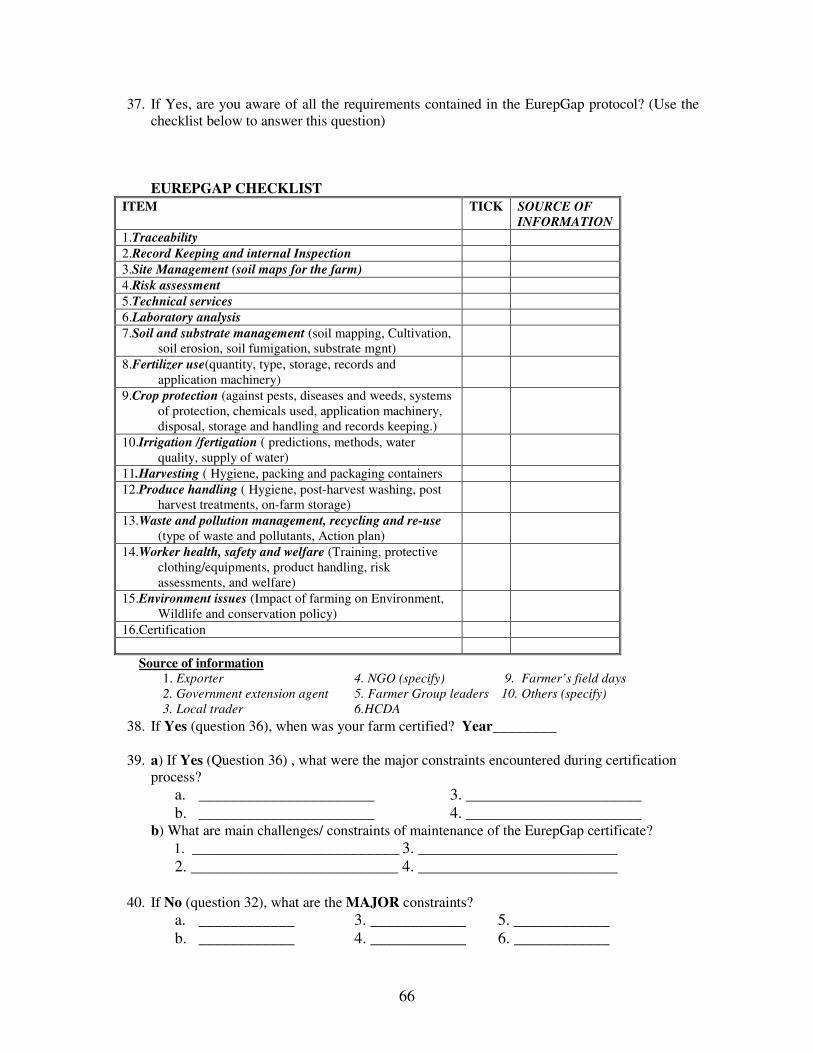
66
37. If Yes, are you aware of all the requirements contained in the EurepGap protocol? (Use the checklist below to answer this question) EUREPGAP CHECKLIST
ITEM TICK SOURCE OF
INFORMATION
1.Traceability
2.Record Keeping and internal Inspection
3.Site Management (soil maps for the farm)
4.Risk assessment
5.Technical services
6.Laboratory analysis
7.Soil and substrate management (soil mapping, Cultivation, soil erosion, soil fumigation, substrate mgnt)
8.Fertilizer use(quantity, type, storage, records and application machinery)
9.Crop protection (against pests, diseases and weeds, systems of protection, chemicals used, application machinery, disposal, storage and handling and records keeping.)
10.Irrigation /fertigation ( predictions, methods, water quality, supply of water)
11.Harvesting ( Hygiene, packing and packaging containers
12.Produce handling ( Hygiene, post-harvest washing, post harvest treatments, on-farm storage)
13.Waste and pollution management, recycling and re-use (type of waste and pollutants, Action plan)
14.Worker health, safety and welfare (Training, protective clothing/equipments, product handling, risk assessments, and welfare)
15.Environment issues (Impact of farming on Environment, Wildlife and conservation policy)
16.Certification
Source of information 1. Exporter 4. NGO (specify) 9. Farmer’s field days
2. Government extension agent 5. Farmer Group leaders 10. Others (specify)
3. Local trader 6.HCDA
38. If Yes (question 36), when was your farm certified? Year________
39. a) If Yes (Question 36) , what were the major constraints encountered during certification process?
a. ______________________ 3. ______________________ b. ______________________ 4. ______________________
b) What are main challenges/ constraints of maintenance of the EurepGap certificate?
1. __________________________ 3. _________________________ 2. __________________________ 4. _________________________
40. If No (question 32), what are the MAJOR constraints?
a. ____________ 3. ____________ 5. ____________ b. ____________ 4. ____________ 6. ____________

67
41. What type of certification do you hold?
1=Individual certification 2=Bench marking 3=Group certification
42. If Yes (Question 36), what additional cost have you incurred as an individual in complying with these standards? (use the table below to guide you)
Set-up cost (Kshs) Ongoing cots(Kshs)
Cost
category
Cost component Value/ cost
of formerly
used item/
input/
activity
Value/ cost of
newly used
item / input /
activity
Value/ cost of newly
used item /input
/activity
(maintenance cost)
Storage room for pesticides
Storage room for fertilizers
Packing houses
Toilet facilities
Irrigation station
1.Building and facilities
Grading shed
For pesticide delivery
For irrigation
For water and soil analysis
2.Equipments
Other Equipments
3.Needs assessment
Water analysis 4.Technical assistance / services
Soil , MRL/Plant tissue analysis
Masks
Gloves
Other protective clothes
Insectides
Fungicides
Fertilizers
5. Input use and protective clothes
Other inputs
Initial auditing
Certification audit
Record keeping
Consultation
Other costs
6.other cost of certification
43. Is there a difference between average price of french beans before adoption of EurepGap standards?
1=Yes No = 0
44. If yes(question 38) state the average prices before and after
1=Average price before adoption________
2=Average price after adoption ________
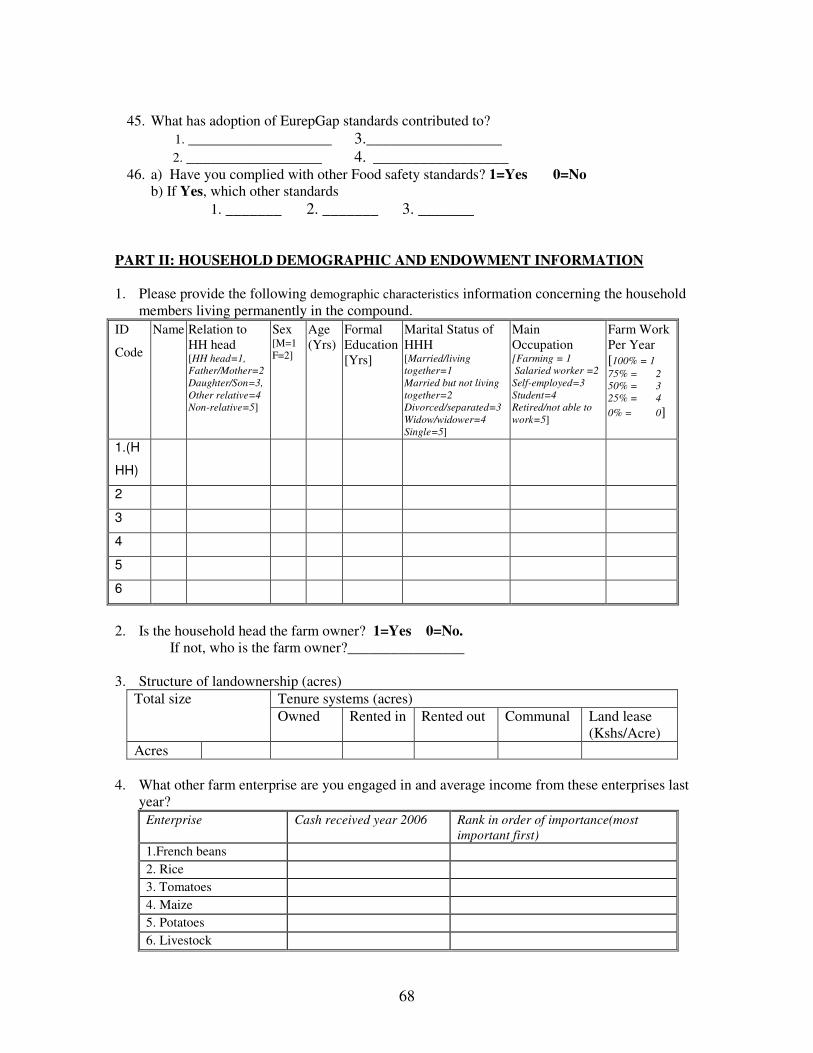
68
45. What has adoption of EurepGap standards contributed to?
1. __________________ 3._________________
2. _________________ 4. _________________
46. a) Have you complied with other Food safety standards? 1=Yes 0=No b) If Yes, which other standards
1. _______ 2. _______ 3. _______
PART II: HOUSEHOLD DEMOGRAPHIC AND ENDOWMENT INFORMATION 1. Please provide the following demographic characteristics information concerning the household
members living permanently in the compound.
ID
Code
Name Relation to HH head [HH head=1,
Father/Mother=2
Daughter/Son=3,
Other relative=4
Non-relative=5]
Sex [M=1 F=2]
Age (Yrs)
Formal Education [Yrs]
Marital Status of HHH [Married/living
together=1
Married but not living
together=2
Divorced/separated=3
Widow/widower=4
Single=5]
Main Occupation [Farming = 1
Salaried worker =2
Self-employed=3
Student=4
Retired/not able to
work=5]
Farm Work Per Year [100% = 1
75% = 2
50% = 3
25% = 4
0% = 0]
1.(H
HH)
2
3
4
5
6
2. Is the household head the farm owner? 1=Yes 0=No. If not, who is the farm owner?________________ 3. Structure of landownership (acres)
Tenure systems (acres) Total size
Owned Rented in Rented out Communal Land lease (Kshs/Acre)
Acres
4. What other farm enterprise are you engaged in and average income from these enterprises last
year?
Enterprise Cash received year 2006 Rank in order of importance(most
important first)
1.French beans 2. Rice 3. Tomatoes 4. Maize 5. Potatoes 6. Livestock

69
7.other cash crops
5. Do you have extra income apart from farm enterprises? 1=Yes 2=No 6. If yes (question 6), state the activity, income range and number of months worked last year
Activity Type Income per month No. months in the year 2006
Type of employment Income per month Activities 1=(Semi) permanent 1=less than Kshs500 1=Teaching 6=NGO job 2=Casual 2=Kshs.500 to 1500 2=Tea plucking 7=Salon 3=Self employed 3=more than Kshs1500 3=Tomato weeding 8=shop 4=Domestic labour 4=Rice harvesting 9=other 5=others 5=Government job