compliance, safety, accountability: analyzing the ... sms … · manager, quality, safety &...
TRANSCRIPT

October 2012
Compliance, Safety, Accountability: Analyzing the Relationship of
Scores to Crash Risk

Compliance, Safety, Accountability:
Analyzing the Relationship of Scores to Crash Risk
October 2012
Micah D. Lueck
Research Associate
American Transportation Research Institute
Saint Paul, MN
950 N. Glebe Road, Suite 210
Arlington, Virginia 22203
www.atri-online.org
ATRI BOARD OF DIRECTORS
Mr. Steve Williams Chairman of the ATRI Board Chairman & CEO Maverick USA, Inc. Little Rock, AR Mr. Michael S. Card President Combined Transport, Inc. Central Point, OR Mr. Edward Crowell President & CEO Georgia Motor Trucking Association Atlanta, GA Mr. Rich Freeland President – Engine Business Cummins Inc. Columbus, IN Mr. Hugh H. Fugleberg President & COO Great West Casualty Company South Sioux City, NE Mr. Jack Holmes President UPS Freight Richmond, VA Mr. Ludvik F. Koci Director Penske Transportation Components Bloomfield Hills, MI Mr. Chris Lofgren President & CEO Schneider National, Inc. Green Bay, WI
Mr. William J. Logue President & CEO FedEx Freight Memphis, TN Ms. Judy McReynolds President & CEO Arkansas Best Corporation Fort Smith, AR Mr. Jeffrey J. McCaig President & CEO Trimac Transportation, Inc. Houston, TX Mr. Gregory L. Owen Head Coach & CEO Ability/ Tri-Modal Transportation Services Carson, CA Mr. Douglas W. Stotlar President & CEO Con-way Inc. Ann Arbor, MI Ms. Rebecca M. Brewster President & COO American Transportation Research Institute Atlanta, GA Honorable Bill Graves President & CEO American Trucking Associations Arlington, VA

ATRI RESEARCH ADVISORY COMMITTEE
Mr. Philip L. Byrd, Sr., RAC Chairman President & CEO Bulldog Hiway Express
Ms. Kendra Adams Executive Director New York State Motor Truck Association
Dr. Teresa M. Adams Director of CFIRE University of Wisconsin
Ms. Susan Alt VP, Industry Relations and Public Affairs Volvo Group
Ms. Cheryl Bynum Manager, SmartWay Transport Partnership U.S. Environmental Protection Agency
Mr. LaMont Byrd Director, Safety & Health Department International Brotherhood of Teamsters
Mr. Terry Croslow Chief Financial Officer Bestway Express, Inc.
Mr. Ted Dahlburg Manager, Office of Freight Planning Delaware Valley Regional Planning Commission
Mr. Tom DiSalvi Director of Loss Prevention Schneider National, Inc.
Mr. Chad England Chief Operating Officer C.R. England, Inc.
Mr. John Flanagan Manager, Quality, Safety & Fleet Services Stevens Van Lines
Mr. Tom Flies Senior Director, Product Management Qualcomm
Mr. Bryan Foe Vice President, Transportation C.H. Robinson Worldwide
Mr. David Foster Vice President of Fleet Services Southeastern Freight Lines
Ms. Patti Gillette Safety Director Colorado Motor Carriers Association
Mr. John Hancock Director Prime, Inc.
Mr. Steve A. Keppler Executive Director Commercial Vehicle Safety Alliance
Mr. Alan Korn Chief Engineer Apps & Customer Support Meritor Wabco
Ms. Jennifer Morrison Vehicle Factors Engineer National Transportation Safety Board
Mr. Dean Newell Vice President, Safety Maverick USA, Inc.
Mr. Steve L. Niswander VP, Safety Policy & Regulatory Relations Groendyke Transport, Inc.
Mr. Deane H. Sager Director-Transportation Industry Practices The Northland Group
Mr. Brett A. Sant VP, Safety & Risk Management Knight Transportation, Inc.
Mr. Jim Schultz ITS Program Manager Michigan Department of Transportation
Ms. Nanci Tellam Group Director, Environmental Services & Sustainability Ryder System, Inc.
Ms. Tom Weakley Director of Operations Owner-Operator Independent Drivers Association Foundation
Mr. Scott Wombold Vice President, National Accounts & Wholesale Fuel Pilot Travel Centers
Mr. Greer Woodruff Senior Vice President of Corporate Safety & Security J.B. Hunt Transport Services, Inc.
Compliance, Safety, Accountability: Analyzing the Relationship of Scores to Crash Risk – October 2012 i
TABLE OF CONTENTS
Table of Contents ........................................................................................................... i
List of Figures ............................................................................................................... ii
List of Tables ................................................................................................................ iii
List of Acronyms ........................................................................................................... v
Executive Summary ..................................................................................................... vi
Key Findings ................................................................................................................ xii
1.0 Introduction ............................................................................................................. 1
Previous Research: Initial Evaluation of CSA ......................................................... 2
Research Since UMTRI’s CSA Evaluation ............................................................. 4
Transforming Non-Normal Data .............................................................................. 6
Count Data and Negative Binomial Regression ...................................................... 8
2.0 Current Research Methodology ........................................................................... 10
3.0 Research Findings ................................................................................................ 11
Relationships Between Percentile Scores and Crash Rates ................................ 13
Comparing Above vs. Below Threshold Carriers .................................................. 18
Available Data and Safety .................................................................................... 26
4.0 Supplementary Analyses ...................................................................................... 27
Quantity of SMS Data and Safety ......................................................................... 27
Quantity of Negative SMS Data and Safety .......................................................... 29
Making Safety Inferences from CSA: Recommendations ..................................... 31
5.0 Caveats .................................................................................................................. 34
6.0 Conclusion ............................................................................................................. 35
References ................................................................................................................... 37
Appendix A .................................................................................................................. 38
Appendix B .................................................................................................................. 39
Compliance, Safety, Accountability: Analyzing the Relationship of Scores to Crash Risk – October 2012 ii
LIST OF FIGURES
Figure ES1. Relationship Between Unsafe Driving Scores and Crash Rates ........ vii
Figure ES2. Relationship Between Driver Fitness Scores and Crash Rates ........ viii
Figure ES3. Relative Crash Risk by Proposed Safety Category ............................... x
Figure 1. Scatter Plot of Unsafe Driving BASIC Scores and Crash Rates ................ 5
Figure 2. Histogram of Residuals ................................................................................ 6
Figure 3. Normal P-P Plot of Residuals ....................................................................... 6
Figure 4. Histogram of Carrier Crash Rates (Per 100 Power Units) .......................... 7
Figure 5. Scatter Plot of Unsafe Driving BASIC Scores and Log-Transformed
Crash Rates ................................................................................................................... 8
Figure 6. New Histogram of Residuals ....................................................................... 8
Figure 7. New P-P Plot of Residuals ............................................................................ 8
Figure 8. Relationship Between Unsafe Driving Scores and Crash Rates ............. 14
Figure 9. Relationship Between Vehicle Maintenance Scores and Crash Rates ... 15
Figure 10. Relationship Between Fatigued Driving Scores and Crash Rates ........ 15
Figure 11. Relationship Between Driver Fitness Scores and Crash Rates ............ 16
Figure 12. Relationship Between Controlled Substances and Alcohol Scores and
Crash Rates ................................................................................................................. 17
Figure 13. Safety Differences Between Unsafe Driving Categories ........................ 20
Figure 14. Safety Differences Between Vehicle Maintenance Categories .............. 21
Figure 15. Safety Differences Between Fatigued Driving Categories ..................... 22
Figure 16. Safety Differences Between Controlled Substance/Alcohol Categories
...................................................................................................................................... 23
Figure 17. Safety Differences Between Driver Fitness Categories ......................... 24
Figure 18. Relative Crash Risk As Number of Scores or “Alerts” Increases ......... 30
Figure 19. Relative Crash Risk by Proposed Safety Category ................................ 33
Compliance, Safety, Accountability: Analyzing the Relationship of Scores to Crash Risk – October 2012 iii
LIST OF TABLES
Table ES1. Relative Crash Risk Among Carriers Above Vs. Below Threshold ....... ix
Table ES2. Empirically Determined Continuum of Safety Risk ................................ xi
Table 1. SMS Summer Release Schedule ................................................................. 10
Table 2. Overview of Database Utilized by ATRI....................................................... 11
Table 3. Breakdown of Carriers with At Least One Assigned BASIC Score .......... 12
Table 4. Negative Binomial Regression Model for Unsafe Driving ......................... 13
Table 5. Negative Binomial Regression Model for Vehicle Maintenance ............... 14
Table 6. Negative Binomial Regression Model for Fatigued Driving ...................... 15
Table 7. Negative Binomial Regression Model for Driver Fitness........................... 16
Table 8. Negative Binomial Regression Model for Controlled Substances and
Alcohol ......................................................................................................................... 17
Table 9. Description of Variables Entered into ATRI’s Unsafe Driving Model ....... 19
Table 10. Negative Binomial Regression Model for Differences in Crash Rates –
Unsafe Driving ............................................................................................................. 19
Table 11. Description of Variables Entered into ATRI’s Vehicle Maintenance Model
...................................................................................................................................... 20
Table 12. Negative Binomial Regression Model for Differences in Crash Rates –
Vehicle Maintenance ................................................................................................... 21
Table 13. Description of Variables Entered into ATRI’s Fatigued Driving Model .. 21
Table 14. Negative Binomial Regression Model for Differences in Crash Rates –
Fatigued Driving .......................................................................................................... 22
Table 15. Description of Variables Entered into ATRI’s Substance/Alcohol Model
...................................................................................................................................... 22
Table 16. Negative Binomial Regression Model for Differences in Crash Rates –
Substance/Alcohol ...................................................................................................... 23
Table 17. Description of Variables Entered into ATRI’s Driver Fitness Model ....... 24
Table 18. Negative Binomial Regression Model for Differences in Crash Rates –
Driver Fitness .............................................................................................................. 24
Table 19. Absolute Crash Risk Compared to Carriers With Data But No “Alerts” 25
Table 20. Description of Variables Entered into ATRI’s Model for Number of
BASIC Scores .............................................................................................................. 27
Compliance, Safety, Accountability: Analyzing the Relationship of Scores to Crash Risk – October 2012 iv
Table 21. Negative Binomial Regression Model for Number of BASIC Scores ..... 28
Table 22. Description of Variables Entered into ATRI’s Model for Number of
“Alerts” ........................................................................................................................ 29
Table 23. Negative Binomial Regression Model for Number of “Alerts” ................ 30
Table 24. Description of Variables Entered into ATRI’s Model for Proposed Safety
Categories .................................................................................................................... 32
Table 25. Negative Binomial Regression Model for Proposed Safety Categories . 32
Table 26. Empirically Determined Continuum of Safety Risk .................................. 36
Compliance, Safety, Accountability: Analyzing the Relationship of Scores to Crash Risk – October 2012 v
LIST OF ACRONYMS
ATRI American Transportation Research Institute
BASIC Behavior Analysis Safety Improvement Category
CMV Commercial Motor Vehicle
CSA Compliance, Safety, Accountability
FMCSA Federal Motor Carrier Safety Administration
Hazmat Hazardous Material
ISS Inspection Selection System
MCMIS Motor Carrier Management Information System
OLS Ordinary Least Squares
PU Power Unit
SMS Safety Measurement System
UMTRI University of Michigan Transportation Research Institute
WRI Wireless Roadside Inspection
Compliance, Safety, Accountability: Analyzing the Relationship of Scores to Crash Risk – October 2012 vi
EXECUTIVE SUMMARY
Since the national launch of the Federal Motor Carrier Safety Administration’s (FMCSA)
Compliance, Safety, Accountability (CSA) initiative, a handful of studies have attempted
to study the degree to which motor carrier safety scores are related to actual carrier
crash involvement. While each study offered numerous insights, the American
Transportation Research Institute (ATRI) sought to expand on previous findings by
utilizing a more targeted statistical analysis to answer two related research questions:
RQ1: Are percentile scores related to actual safety (i.e. crash involvement)?
RQ2: Does CSA properly classify carriers according to crash risk (i.e. do carriers with “Alerts” have higher crash rates than carriers without “Alerts”)?
According to FMCSA, high percentile scores in a Behavior Analysis Safety Improvement
Category (BASIC) indicate a lack of compliance and greater exposure to potential safety
problems, including crash involvement. That is, as scores go up, it is expected that
crash involvement will also increase. However, previous researchers searched for, and
failed to find, clear linear relationships between BASIC percentile scores and carrier
crash rates.
This study proposes that a simple correlational approach may simply be unable to
detect the existence of a relationship due to the nature of the data under consideration.1
Crashes are infrequent events, and therefore special tools are required to model their
occurrence.2 Relying on best practices in the field of statistics, ATRI’s analysis uses a
rigorous statistical approach to provide a more accurate description of the relationship
(or lack thereof) between BASIC scores and crash involvement.
ATRI analyzed Safety Measurement System (SMS) and crash data for a sample of
471,306 motor carriers with evidence of recent activity in the past 24 months.3 Analyses
focused on the five BASICs that are available to the general public.4
1 Authors relied upon simple correlations and Ordinary Least Squares (OLS) regression. This type of
parametric analysis is subject to numerous statistical assumptions, nearly all of which were violated, raising questions about the studies’ conclusions. 2 Crash data follow a negative binomial distribution, as opposed to a normal bell-shaped distribution.
3 This subset of carriers were selected from a sample of 772,281 registered interstate and intrastate
hazardous material carriers. 4 Unsafe Driving, Fatigued Driving, Driver Fitness, Vehicle Maintenance and Controlled Substances and
Alcohol; the Crash Indicator and Cargo-Related BASICs are not public at the time of this publication.
Compliance, Safety, Accountability: Analyzing the Relationship of Scores to Crash Risk – October 2012 vii
Relationships Between Percentile Scores and Crash Rates
After explaining the rationale for choosing negative binomial regression modeling,
ATRI’s first set of analyses searched for (non-linear) relationships between percentile
scores and crash rates in each public BASIC. The analysis showed with high levels of
confidence that BASIC scores are positively related to crashes in the Unsafe Driving,
Fatigued Driving and Vehicle Maintenance BASICs, with the strongest relationship
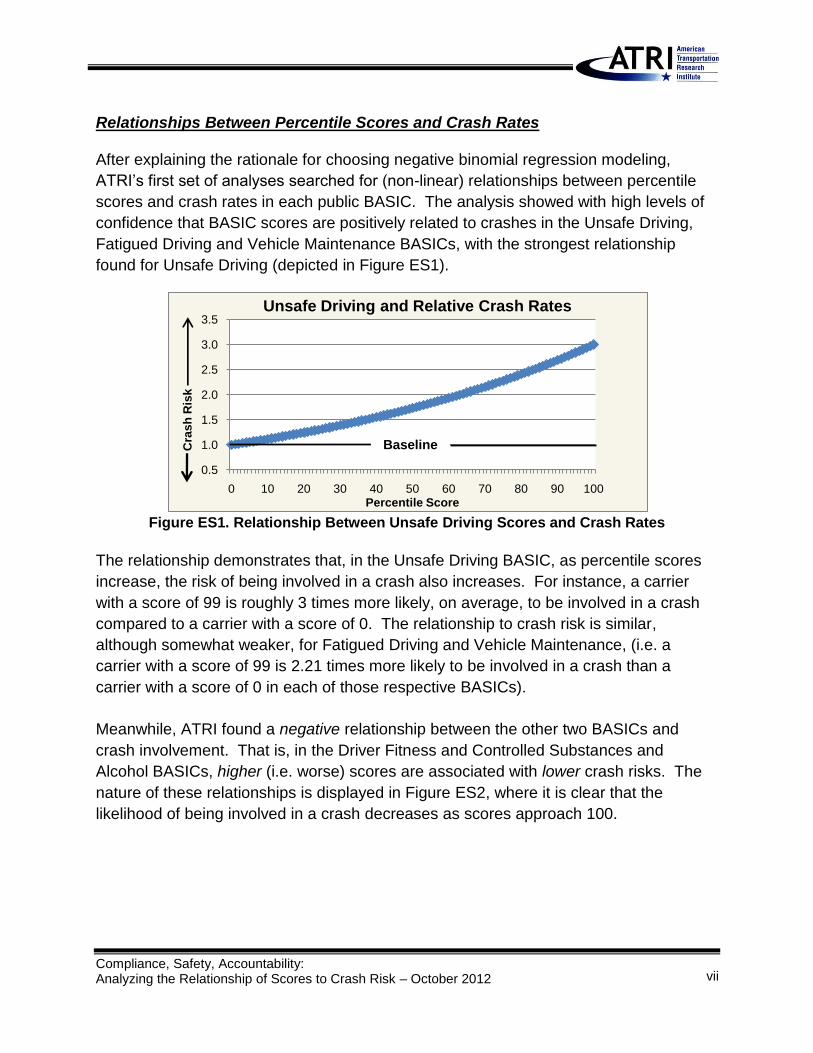
found for Unsafe Driving (depicted in Figure ES1).
Figure ES1. Relationship Between Unsafe Driving Scores and Crash Rates
The relationship demonstrates that, in the Unsafe Driving BASIC, as percentile scores
increase, the risk of being involved in a crash also increases. For instance, a carrier
with a score of 99 is roughly 3 times more likely, on average, to be involved in a crash
compared to a carrier with a score of 0. The relationship to crash risk is similar,
although somewhat weaker, for Fatigued Driving and Vehicle Maintenance, (i.e. a
carrier with a score of 99 is 2.21 times more likely to be involved in a crash than a
carrier with a score of 0 in each of those respective BASICs).
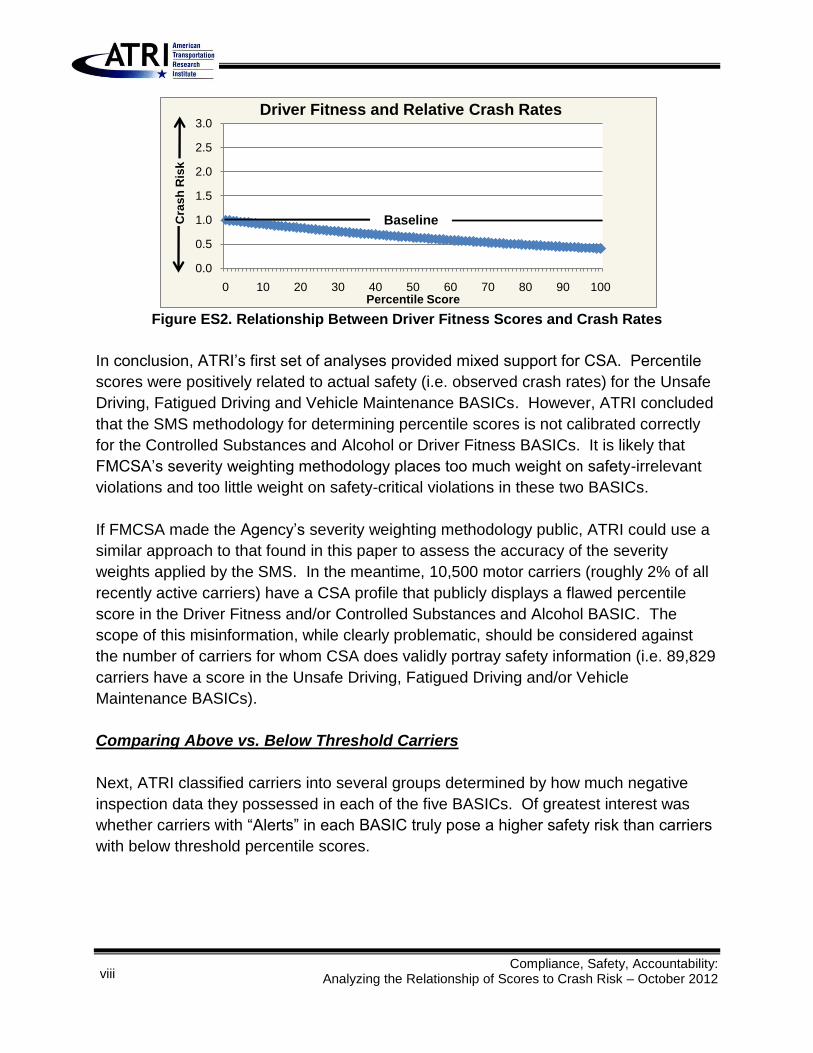
Meanwhile, ATRI found a negative relationship between the other two BASICs and
crash involvement. That is, in the Driver Fitness and Controlled Substances and
Alcohol BASICs, higher (i.e. worse) scores are associated with lower crash risks. The
nature of these relationships is displayed in Figure ES2, where it is clear that the
likelihood of being involved in a crash decreases as scores approach 100.
0.5
1.0
1.5
2.0
2.5
3.0
3.5
0 10 20 30 40 50 60 70 80 90 100
Cra
sh
Ris
k
Percentile Score
Unsafe Driving and Relative Crash Rates
Baseline
Compliance, Safety, Accountability: Analyzing the Relationship of Scores to Crash Risk – October 2012 viii
Figure ES2. Relationship Between Driver Fitness Scores and Crash Rates
In conclusion, ATRI’s first set of analyses provided mixed support for CSA. Percentile
scores were positively related to actual safety (i.e. observed crash rates) for the Unsafe
Driving, Fatigued Driving and Vehicle Maintenance BASICs. However, ATRI concluded
that the SMS methodology for determining percentile scores is not calibrated correctly
for the Controlled Substances and Alcohol or Driver Fitness BASICs. It is likely that
FMCSA’s severity weighting methodology places too much weight on safety-irrelevant
violations and too little weight on safety-critical violations in these two BASICs.
If FMCSA made the Agency’s severity weighting methodology public, ATRI could use a
similar approach to that found in this paper to assess the accuracy of the severity
weights applied by the SMS. In the meantime, 10,500 motor carriers (roughly 2% of all
recently active carriers) have a CSA profile that publicly displays a flawed percentile
score in the Driver Fitness and/or Controlled Substances and Alcohol BASIC. The
scope of this misinformation, while clearly problematic, should be considered against
the number of carriers for whom CSA does validly portray safety information (i.e. 89,829
carriers have a score in the Unsafe Driving, Fatigued Driving and/or Vehicle
Maintenance BASICs).
Comparing Above vs. Below Threshold Carriers
Next, ATRI classified carriers into several groups determined by how much negative
inspection data they possessed in each of the five BASICs. Of greatest interest was
whether carriers with “Alerts” in each BASIC truly pose a higher safety risk than carriers
with below threshold percentile scores.
0.0
0.5
1.0
1.5
2.0
2.5
3.0
0 10 20 30 40 50 60 70 80 90 100
Cra
sh
Ris
k
Percentile Score
Driver Fitness and Relative Crash Rates
Baseline

Compliance, Safety, Accountability: Analyzing the Relationship of Scores to Crash Risk – October 2012 ix
The analysis revealed that carriers with an “Alert”5 indeed demonstrated higher crash
rates than carriers without “Alerts” in four of the five public BASICs: Unsafe Driving,
Fatigued Driving, Vehicle Maintenance and Controlled Substances and Alcohol. In
contrast, in the Driver Fitness BASIC, ATRI found that carriers with an “Alert” actually
had lower crash rates than those without an “Alert” status.
Table ES1 reveals how much higher or lower crash rates are for carriers above
threshold compared to carriers below threshold. Values greater than 1.0 imply a higher
rate of crash involvement, whereas values less than 1.0 imply a lower risk of crashes.
For instance, carriers with an “Alert” in Unsafe Driving, on average, have an expected
crash rate 1.74 times higher than a carrier with an Unsafe Driving score below
threshold. Conversely, carriers with an “Alert” in Driver Fitness, on average, have an
expected crash rate .87 times lower than a carrier with a Driver Fitness score below
threshold.
Table ES1. Relative Crash Risk Among Carriers Above Vs. Below Threshold
BASIC Crash Risk
Unsafe Driving 1.74
Vehicle Maintenance 1.42
Fatigued Driving 1.34
Substance/Alcohol 1.32
Driver Fitness 0.87
In conclusion, “Alerts,” which incorporate carriers with Severe Violations in addition to
high percentile scores, are reasonable safety indicators for four of the five BASICs. In
the Driver Fitness BASIC, however, the SMS methodology for assigning carriers with an
“Alert” status seems to target carriers with lower crash risk than those without an “Alert.”
Again, it is suspected that the severity weighting methodology needs to be reevaluated
to properly categorize high risk carriers into the Driver Fitness “Alert” group.
On the other hand, Appendix B explains why the Controlled Substances and Alcohol
BASIC, which had a flawed percentile ranking system, still manages to properly classify
the correct subset of high-risk carriers into the “Alert” group. Essentially, it is the Severe
Violations in that BASIC that identify carriers with frequent safety incidents; these
Severe Violations are therefore better indicators of crash risk than is the methodology
for calculating Controlled Substances and Alcohol percentile scores.
5 Received as a result of possessing a percentile score above FMCSA’s cutoff and/or a Severe Violation.
Compliance, Safety, Accountability: Analyzing the Relationship of Scores to Crash Risk – October 2012 x
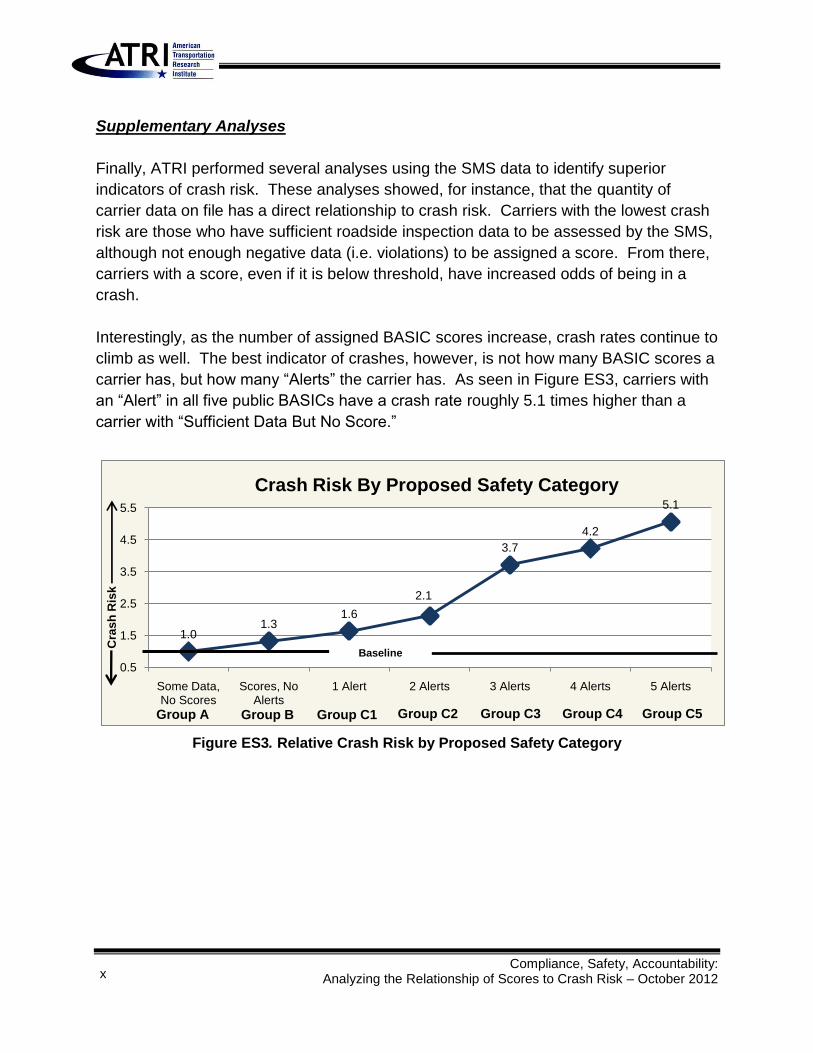
Supplementary Analyses
Finally, ATRI performed several analyses using the SMS data to identify superior
indicators of crash risk. These analyses showed, for instance, that the quantity of
carrier data on file has a direct relationship to crash risk. Carriers with the lowest crash
risk are those who have sufficient roadside inspection data to be assessed by the SMS,
although not enough negative data (i.e. violations) to be assigned a score. From there,
carriers with a score, even if it is below threshold, have increased odds of being in a
crash.
Interestingly, as the number of assigned BASIC scores increase, crash rates continue to
climb as well. The best indicator of crashes, however, is not how many BASIC scores a
carrier has, but how many “Alerts” the carrier has. As seen in Figure ES3, carriers with
an “Alert” in all five public BASICs have a crash rate roughly 5.1 times higher than a
carrier with “Sufficient Data But No Score.”
Figure ES3. Relative Crash Risk by Proposed Safety Category
1.01.3
1.6
2.1
3.7
4.2
5.1
0.5
1.5
2.5
3.5
4.5
5.5
Some Data, No Scores
Scores, No Alerts
1 Alert 2 Alerts 3 Alerts 4 Alerts 5 Alerts
Cra
sh
Ris
k
Crash Risk By Proposed Safety Category
Baseline
Group A Group B Group C1 Group C2 Group C3 Group C4 Group C5

Compliance, Safety, Accountability: Analyzing the Relationship of Scores to Crash Risk – October 2012 xi
Recommendations for an Alternative Scoring Mechanism
In conclusion, as it is currently designed, CSA has a number of defects that still need to
be addressed. While it may be helpful for FMCSA to continue using specific BASIC
percentile scores for internal purposes, ATRI proposes several alternative scenarios for
relaying safety and compliance information to the public. Since many stakeholders (e.g.
shippers, insurers, litigants) assume CSA profiles reflect safety status, steps should be
taken to provide to the public only information that can be reliably tied to safety.
ATRI found that percentile scores are flawed in two BASICs and even “Alerts” do not
consistently identify the riskiest carriers within all five BASICs. The researchers proffer
several new CSA approaches for categorizing carrier safety. One approach is reflected
in Figure ES3, which could allow trucking stakeholders to better gauge fleet safety by
classifying carriers into groups based on where they fall in the following chart (see Table
ES2).
Table ES2. Empirically Determined Continuum of Safety Risk
Classification Group Description Level of Safety Risk
Low High
Group A Sufficient data in at least one BASIC, but no scores
Group B Scores in at least one BASIC, but no "Alerts"
Group C-1 1 "Alert"
Group C-2 2 "Alerts"
Group C-3 3 "Alerts"
Group C-4 4 "Alerts"
Group C-5 5 "Alerts"

Compliance, Safety, Accountability: Analyzing the Relationship of Scores to Crash Risk – October 2012 xii
KEY FINDINGS
Impetus for Research:
Previous investigations of the link between CSA rankings and actual fleet safety
did not adequately assess statistical assumptions.
Negative binomial modeling is the preferred choice for analyzing crash data.
Relationships between Percentile Scores and Crash Rates:
Higher percentile scores in the Unsafe Driving, Fatigued Driving and Vehicle
Maintenance BASICs reflect increased crash risk, as intended by the SMS.
o 89,829 motor carriers have a score in one or more of these BASICs.
In the Driver Fitness and Controlled Substances/Alcohol BASICs, carriers with
higher percentile scores are involved in fewer accidents.
o 10,500 motor carriers have a score in one or both of these BASICs.
There is likely a problem with how the violations in the Driver Fitness and
Controlled Substances/Alcohol BASICs are weighted.
Comparing Above vs. Below Threshold Carriers:
“Alerts” are more valid indicators of safety than raw percentile scores in the
Controlled Substances and Alcohol BASIC (see Appendix B).
Carriers with “Alerts” in the Unsafe Driving, Fatigued Driving, Vehicle
Maintenance and Controlled Substances/Alcohol BASICs have significantly
higher crash rates than carriers with “below threshold” scores in those BASICs.
In the Driver Fitness BASIC, “Alerts” are assigned to carriers that have
significantly lower crash rates than “below threshold” carriers.
Supplementary Analyses:
Having a percentile score (above or below threshold) is associated with higher
crash rates than possessing no BASIC scores.
o This is logical as percentile scores are based on negative roadside
inspection data (i.e. violations).
Similarly, carriers who have data populated in multiple BASICs have higher crash
rates than carriers that are assigned only one BASIC score.
However, the number of “Alerts” a carrier possesses is the most indicative of
crash risk, with a greater number of “Alerts” signaling significantly higher risk.
Recommendations for an Alternative Scoring Mechanism:
New carrier classifications can be used to present more valid fleet safety profiles
to the public (compared to the current CSA information that is publicly displayed).
Carriers can also view the information to gauge safety impacts associated with
possessing certain attributes (e.g. having two “Alerts” versus three “Alerts”).
Compliance, Safety, Accountability: Analyzing the Relationship of Scores to Crash Risk – October 2012 1
1.0 INTRODUCTION
In December 2010, the Federal Motor Carrier Safety Administration (FMCSA) initiated a
new safety measurement program titled Compliance, Safety, Accountability (CSA).
CSA relies upon a Safety Measurement System (SMS) which ranks motor carrier safety
performance relative to other carriers that have similar levels of on-road exposure.
These carrier SMS scores are issued in seven Behavior Analysis Safety Improvement
Categories (BASICs): Unsafe Driving; Fatigued Driving; Driver Fitness; Controlled
Substances/Alcohol; Vehicle Maintenance; Cargo-Related; and Crash Indicator. Scores
in five of the seven BASICs are publicly available online at www.ai.fmcsa.dot.gov/sms.6
As part of the SMS methodology, 24 months of crash, roadside inspection and
enforcement case data are gathered from the Motor Carrier Management Information
System (MCMIS) and sorted into the respective BASIC(s).7 Roadside inspection
violations are weighted according to their individual relationships to crash risk as well as
according to how much time has elapsed since the event occurred, with more weight
attributed to the most recent and severe safety-related events.8 Once these raw data
are sorted, normative scores from 0-100 are assigned to carriers for each individual
BASIC, with lower scores indicating better performance relative to other carriers.
The overall purpose of CSA is to “improve large truck and bus safety to achieve a
greater reduction in commercial motor vehicle (CMV) crashes, injuries and fatalities.”9
And while a 2012 survey of motor carriers by the American Transportation Research
Institute (ATRI) revealed that most fleets do not oppose CSA being used for
enforcement purposes, it also showed that more than half of carriers oppose BASIC
scores being publicized to other stakeholders who may interpret the scores as reflecting
company safety performance.10
With that in mind, the research question of whether the FMCSA-assigned carrier BASIC
scores truly relate to crash risk has taken center stage. Numerous researchers have
attempted to answer the question; however, each approach has been associated with
critical flaws that prevent a definitive conclusion from being drawn.
6 Excluding the Cargo-Related and Crash Indicator BASICs
7 John A. Volpe National Transportation Systems Center. (2012). Safety Measurement System (SMS)
Methodology, Version 2.2. Washington, DC: Federal Motor Carrier Safety Administration. Available Online: https://csa.fmcsa.dot.gov/Documents/SMSMethodology.pdf 8 John A. Volpe National Transportation Systems Center. (2009). Comprehensive Safety Analysis 2010:
Carrier Safety Measurement System Violation Severity Weights. Washington, DC: Federal Motor Carrier Safety Administration. Available Online: http://www.regulations.gov/#!documentDetail;D=FMCSA-2004-18898-0161 9 Federal Motor Carrier Safety Administration. Compliance, Safety, Accountability (CSA). Available
Online: http://csa.fmcsa.dot.gov/default.aspx 10
American Transportation Research Institute. Compliance, Safety, Accountability: Evaluating A New Safety Measurement System And Its Implications. (Unpublished manuscript)

Compliance, Safety, Accountability: Analyzing the Relationship of Scores to Crash Risk – October 2012 2
Previous Research: Initial Evaluation of CSA
FMCSA contracted with the University of Michigan Transportation Research Institute
(UMTRI) to complete an evaluation of CSA. In August 2011, UMTRI published a
thorough report11 evaluating many components of the program, including meaningful
comparisons to SafeStat.12 Key findings indicated that CSA was generally more cost-
effective than SafeStat, while simultaneously better at targeting carriers, and identifying
and correcting safety problems.
On the issue of whether the SMS validly rates carriers according to crash risk, UMTRI
presented a range of analyses. Preliminary findings demonstrated that carriers that
exceed any of the seven BASIC thresholds have higher crash rates, on average, than
carriers who exceed no BASIC thresholds. However, further analyses began revealing
certain problems inherent in the SMS.
First, the correlational analyses performed by UMTRI displayed only partial support for
the idea that, as BASIC percentile scores increase (and therefore suggest greater
safety concerns), so do actual crash rates. In five of the seven BASICs, a positive
association was found, while the remaining two BASICs appeared to function differently.
The Cargo-Related BASIC displayed a curvilinear relationship with crash rates, whereas
the Driver Fitness BASIC was actually found to have a negative relationship to crashes,
indicating that worse scores in that BASIC are associated with better crash outcomes.
Subsequently, the authors of the UMTRI report concluded their chapter on the
associations between BASIC scores and crash rates with a more sophisticated analysis.
The authors utilized negative binomial regression modeling, the approach that will be
used in this paper, to evaluate differences in crash rates between three groups:
(1) carriers with no percentile score;
(2) carriers with a below threshold score; and
(3) carriers with an above threshold score.13
Unfortunately, although the majority of stakeholders are presumably most interested in
safety differences between above and below threshold carriers (i.e. Group 2 vs. 3), the
authors chose to explain only the differences between above threshold carriers and
those with insufficient data to generate a score (Group 1 vs. 3). However, an ATRI
11
Green, P. E. & Blower, D. (2011). Evaluation of the CSA 2010 Operational Model Test. (Report No. FMCSA-RRA-11-019). Washington, DC: Federal Motor Carrier Safety Administration. 12
SafeStat measured motor carrier safety performance and compliance prior to CSA 13
The authors correctly omitted the Crash Indicator BASIC from the analysis, since crashes were the variable being predicted by the model

Compliance, Safety, Accountability: Analyzing the Relationship of Scores to Crash Risk – October 2012 3
review of UMTRI’s findings14 also allows for a comparison of crash rates between below
threshold carriers and those with insufficient data (Group 1 vs. 2). Interestingly, the
UMTRI statistics revealed that carriers with below threshold scores in the Unsafe
Driving, Fatigued Driving, Vehicle Maintenance and Cargo-Related BASICs also had
higher crash rates than carriers with insufficient data in those BASICs.
The comparison of most value (i.e. above vs. below threshold) can only be performed
manually, using the parameter estimates found in the table15 and the following formula:
e(b3-b
2). Had the UMTRI authors fully interpreted these findings from their negative
binomial model, they would have revealed that the only BASICs where above threshold
carriers had higher crash rates than carriers with below threshold BASICs are:
Unsafe Driving: the crash rate for a carrier that exceeds the Unsafe Driving
threshold is 1.83 times the rate of a carrier whose percentile score is below
threshold (statistically significant)
Vehicle Maintenance: the crash rate for a carrier that exceeds the Vehicle
Maintenance threshold is 1.11 times the rate of a carrier whose percentile
score is below threshold (statistically significant)
Fatigued Driving: the crash rate for a carrier that exceeds the Fatigued
Driving threshold is 1.05 times the rate of a carrier whose percentile score is
below threshold (likely not statistically significant)
Controlled Substance/Alcohol: the crash rate for a carrier that exceeds the
Substance/Alcohol threshold is 1.03 times the rate of a carrier whose
percentile score is below threshold (likely not statistically significant).
Conversely, according to UMTRI’s statistical model, the two BASICs that displayed
unexpected correlations earlier in the report again presented unusual problems:
Driver Fitness: the crash rate for a carrier whose percentile score is below
the Driver Fitness threshold is 1.18 times the rate of a carrier whose score
exceeds the threshold (statistically significant)
Cargo-Related: the crash rate for a carrier whose percentile score is below
the Cargo-Related threshold is 1.10 times the rate of a carrier whose score
exceeds the threshold (likely statistically significant).
Finally, in addition to the fact that UMTRI’s analysis lacked explanations for the
differences in crash rates between above and below threshold carriers, the data used in
the study are now somewhat outdated. UMTRI’s analysis relied upon carrier SMS
scores calculated for February 2008 and crash data between February 2008 and July
2009. While these were reasonable and purposeful decisions, updated data are now
available and deserve attention. 14 Table 36, p. 47 15 Table 36, p. 47

Compliance, Safety, Accountability: Analyzing the Relationship of Scores to Crash Risk – October 2012 4
Research Since UMTRI’s CSA Evaluation
More recently, a series of independent analyses have been released with the general
consensus that BASIC scores are weakly, or not at all, related to actual crash rates.
Among the most notable of these studies are papers by Wells Fargo,16 Transplace17 and
the University of Maryland.18
In addition to challenging the existence of an SMS-crash relationship, these studies
raise a number of concerns questioning the general validity of the SMS. The various
authors argue, and ATRI agrees, that the SMS suffers from selection bias, introducing
systematic error into the measurement system. For instance, large carriers are much
more likely to have one or more BASIC scores than small or midsized carriers, and are
therefore overrepresented in the SMS. Nonetheless, FMCSA assumes this
measurement program, although primarily based on large carriers, is suitable for all
carriers (despite meaningful differences in operations between small and large firms).
Similarly, the authors correctly argue that the region of the country where a carrier runs
the most miles introduces other artificial explanations for differences in BASIC scores.
That is, there are meaningful discrepancies in both the sheer number of violations and
the type of violations that are emphasized depending on where a roadside inspection is
conducted. One paper states that just five states account for 45 percent of all Unsafe
Driving violations.19 Again, this raises a reasonable question of whether measured
carriers are representative of all carriers, which has implications for whether trucking
stakeholders can validly draw safety inferences from SMS scores.
Finally, in addition to pointing out issues with validity, the Wells Fargo, Transplace and
Maryland researchers also question how reliable the assigned percentile scores are,
particularly for small carriers. In statistics, scores that are based on few observations
(e.g. less than 20 roadside inspections) are typically more prone to error and subject to
change dramatically from additional data. As a result, spurious conclusions can be
drawn if scores are not, in fact, reliably measured.
16
Gallo, A. P. & Busche, M. CSA: Another look with similar conclusions. Wells Fargo Securities Equity Research. July 12, 2012. 17
Iyoob, I. SMS BASIC scores are not valid predictors of crash frequency. Alliance for Safe, Efficient and Competitive Truck Transportation. June 25, 2012. Available Online: http://asectt.blogspot.com/2012/06/sms-basic-scores-are-not-valid.html 18
Gimpel, J. Statistical issues in the safety measurement and inspection of motor carriers. Alliance for Safe, Efficient and Competitive Truck Transportation. July 10, 2012. Available Online: http://asectt.blogspot.com/2012/07/news-brief-university-of-maryland-study.html 19
Gimpel, J. Statistical issues in the safety measurement and inspection of motor carriers. Alliance for Safe, Efficient and Competitive Truck Transportation. July 10, 2012. Available Online: http://asectt.blogspot.com/2012/07/news-brief-university-of-maryland-study.html
Compliance, Safety, Accountability: Analyzing the Relationship of Scores to Crash Risk – October 2012 5
These critiques each deserve serious consideration from FMCSA. However, the
purpose of this paper is not to examine issues of reliability and validity within the SMS,
but to evaluate the statistical association between BASIC scores and crash rates as
they currently stand. To that effect, ATRI will first conduct a comparative analysis of the
statistical tools used by previous researchers and those utilized in this paper.
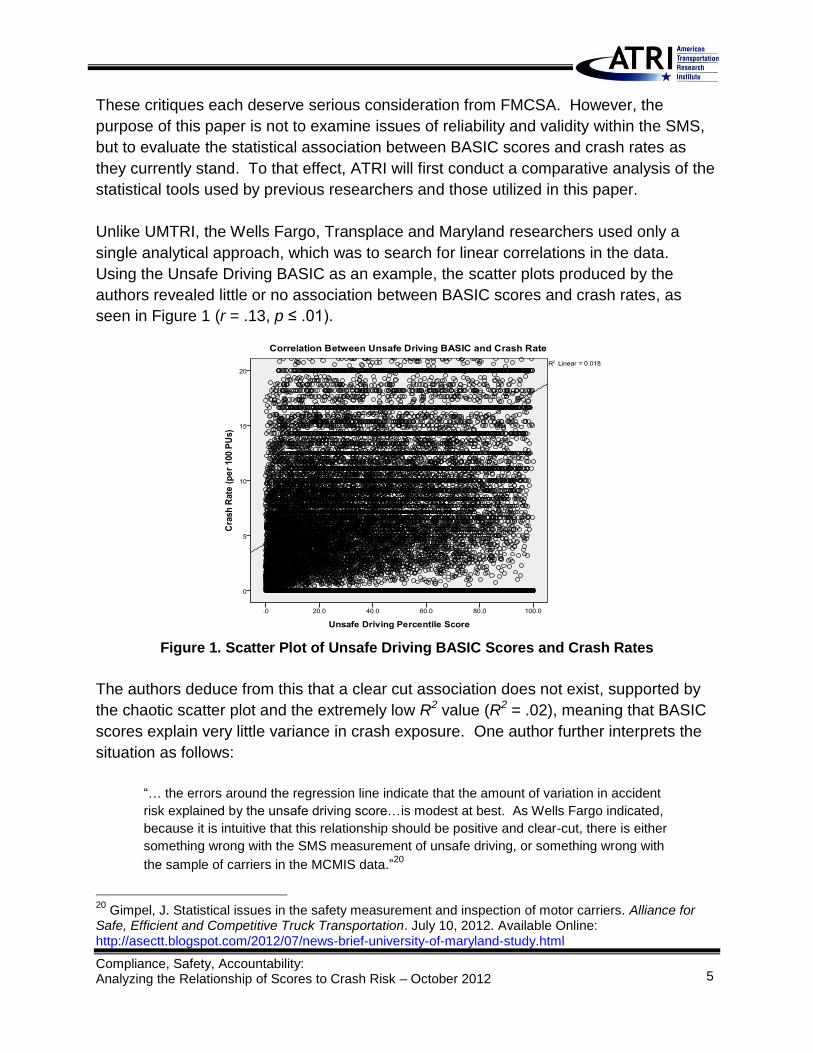
Unlike UMTRI, the Wells Fargo, Transplace and Maryland researchers used only a
single analytical approach, which was to search for linear correlations in the data.
Using the Unsafe Driving BASIC as an example, the scatter plots produced by the
authors revealed little or no association between BASIC scores and crash rates, as
seen in Figure 1 (r = .13, p ≤ .01).
Figure 1. Scatter Plot of Unsafe Driving BASIC Scores and Crash Rates
The authors deduce from this that a clear cut association does not exist, supported by
the chaotic scatter plot and the extremely low R2 value (R2 = .02), meaning that BASIC
scores explain very little variance in crash exposure. One author further interprets the
situation as follows:
“… the errors around the regression line indicate that the amount of variation in accident
risk explained by the unsafe driving score…is modest at best. As Wells Fargo indicated,
because it is intuitive that this relationship should be positive and clear-cut, there is either
something wrong with the SMS measurement of unsafe driving, or something wrong with
the sample of carriers in the MCMIS data.”20
20
Gimpel, J. Statistical issues in the safety measurement and inspection of motor carriers. Alliance for Safe, Efficient and Competitive Truck Transportation. July 10, 2012. Available Online: http://asectt.blogspot.com/2012/07/news-brief-university-of-maryland-study.html
Compliance, Safety, Accountability: Analyzing the Relationship of Scores to Crash Risk – October 2012 6
It is true that the absence of a clear relationship could mean that the two variables
(carrier BASIC scores and crash rates) are truly unrelated or improperly measured;
however, a third option is overlooked by the authors. Simply put, the failure to detect a
relationship may be the result of choosing an incorrect statistical analysis. A primary
duty of running statistical tests, and determining that relationships exist as specified in
the model, involves checking statistical assumptions and model diagnostics. For
Ordinary Least Squares (OLS) regression analyses (which include correlations and
linear regressions), checking assumptions includes plotting the model’s error terms.
The error terms should follow close to a normal distribution if the correct analysis is
being applied for the variables under consideration.
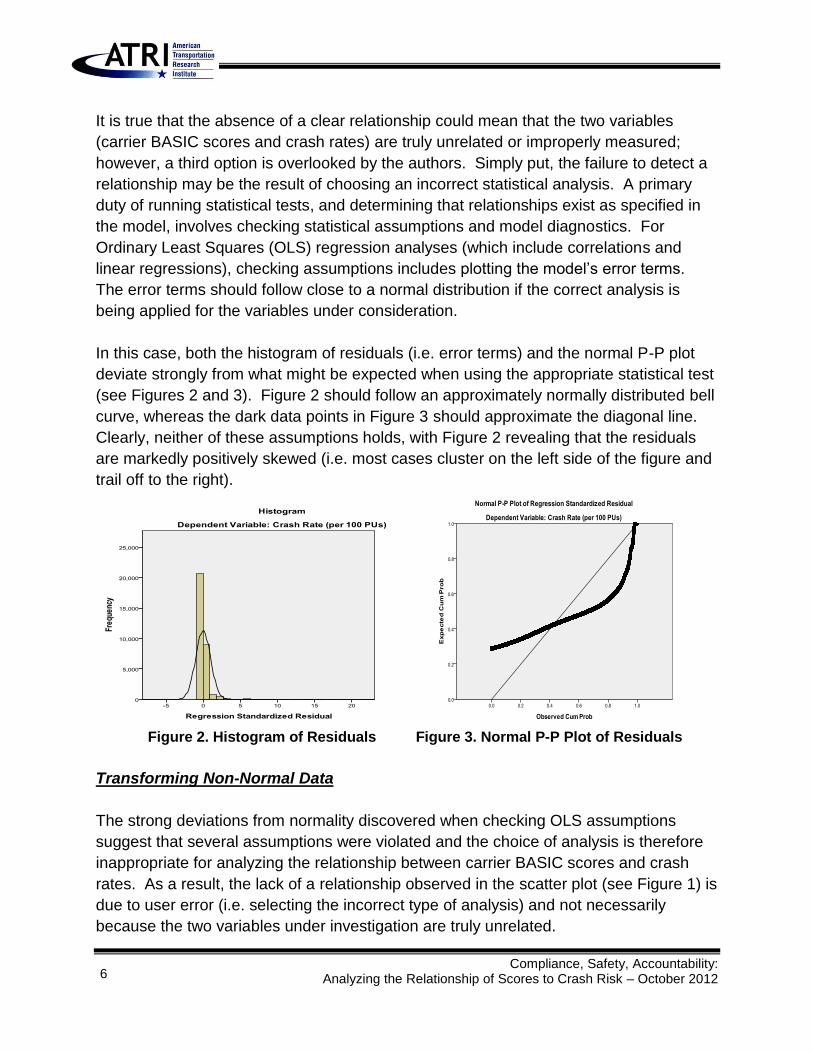
In this case, both the histogram of residuals (i.e. error terms) and the normal P-P plot
deviate strongly from what might be expected when using the appropriate statistical test
(see Figures 2 and 3). Figure 2 should follow an approximately normally distributed bell
curve, whereas the dark data points in Figure 3 should approximate the diagonal line.
Clearly, neither of these assumptions holds, with Figure 2 revealing that the residuals
are markedly positively skewed (i.e. most cases cluster on the left side of the figure and
trail off to the right).
Figure 2. Histogram of Residuals Figure 3. Normal P-P Plot of Residuals
Transforming Non-Normal Data
The strong deviations from normality discovered when checking OLS assumptions
suggest that several assumptions were violated and the choice of analysis is therefore
inappropriate for analyzing the relationship between carrier BASIC scores and crash
rates. As a result, the lack of a relationship observed in the scatter plot (see Figure 1) is
due to user error (i.e. selecting the incorrect type of analysis) and not necessarily
because the two variables under investigation are truly unrelated.
Compliance, Safety, Accountability: Analyzing the Relationship of Scores to Crash Risk – October 2012 7
Since conclusions cannot be drawn from the simple linear regression used by the Wells
Fargo, Transplace and Maryland authors, there are several alternative approaches
available to answer the research question. Statisticians often choose to handle non-
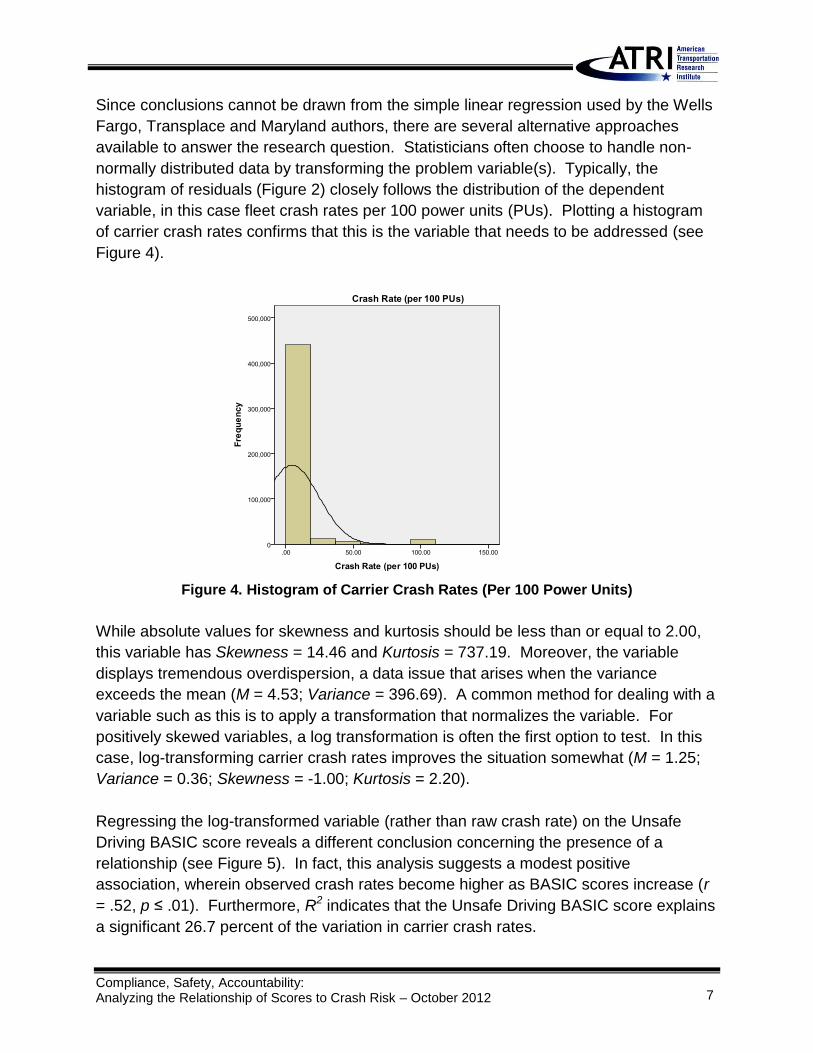
normally distributed data by transforming the problem variable(s). Typically, the
histogram of residuals (Figure 2) closely follows the distribution of the dependent
variable, in this case fleet crash rates per 100 power units (PUs). Plotting a histogram
of carrier crash rates confirms that this is the variable that needs to be addressed (see
Figure 4).
Figure 4. Histogram of Carrier Crash Rates (Per 100 Power Units)
While absolute values for skewness and kurtosis should be less than or equal to 2.00,
this variable has Skewness = 14.46 and Kurtosis = 737.19. Moreover, the variable
displays tremendous overdispersion, a data issue that arises when the variance
exceeds the mean (M = 4.53; Variance = 396.69). A common method for dealing with a
variable such as this is to apply a transformation that normalizes the variable. For
positively skewed variables, a log transformation is often the first option to test. In this
case, log-transforming carrier crash rates improves the situation somewhat (M = 1.25;
Variance = 0.36; Skewness = -1.00; Kurtosis = 2.20).
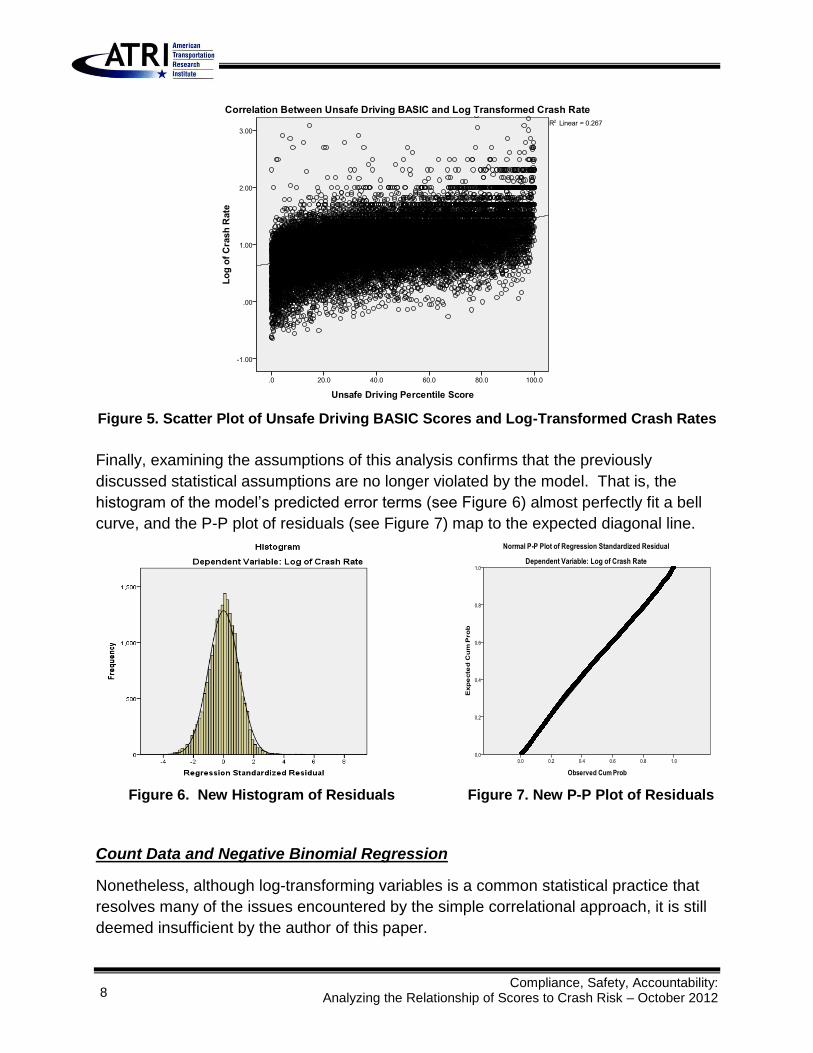
Regressing the log-transformed variable (rather than raw crash rate) on the Unsafe
Driving BASIC score reveals a different conclusion concerning the presence of a
relationship (see Figure 5). In fact, this analysis suggests a modest positive
association, wherein observed crash rates become higher as BASIC scores increase (r
= .52, p ≤ .01). Furthermore, R2 indicates that the Unsafe Driving BASIC score explains
a significant 26.7 percent of the variation in carrier crash rates.
Compliance, Safety, Accountability: Analyzing the Relationship of Scores to Crash Risk – October 2012 8
Figure 5. Scatter Plot of Unsafe Driving BASIC Scores and Log-Transformed Crash Rates
Finally, examining the assumptions of this analysis confirms that the previously
discussed statistical assumptions are no longer violated by the model. That is, the
histogram of the model’s predicted error terms (see Figure 6) almost perfectly fit a bell
curve, and the P-P plot of residuals (see Figure 7) map to the expected diagonal line.
Figure 6. New Histogram of Residuals Figure 7. New P-P Plot of Residuals
Count Data and Negative Binomial Regression
Nonetheless, although log-transforming variables is a common statistical practice that
resolves many of the issues encountered by the simple correlational approach, it is still
deemed insufficient by the author of this paper.

Compliance, Safety, Accountability: Analyzing the Relationship of Scores to Crash Risk – October 2012 9
Principally, this is because crash data (the dependent variable under consideration) are
considered count data, a statistical data type in which observations can take only non-
negative integer values (e.g. 0, 1, 2, 3 …). Specifically, the count data in this study are
the number of crash occurrences a motor carrier experiences over a 24-month period.
As this paper has demonstrated, simple OLS regression (including raw correlations) are
inappropriate in this context.21 Further, data transformations (such as the log
transformation used in the previous section) appear on the surface to be valid, but also
have drawbacks. The main purpose of applying transformations is to correct for non-
normality and/or heteroscedasticity22 so that the sample data do not violate the
assumptions of parametric statistics (e.g. OLS regression).
However, this approach is simply an adaptation of OLS, which may still produce biased,
inefficient and inconsistent parameter estimates.23 Thus, researchers have developed
superior analyses intended specifically for count-type data, the most popular of which
are Poisson regression and negative binomial regression.24 Poisson models assume
the mean and variance of the response variable are equal, which is known to be untrue
in this case (i.e. the variance of crash events is more than 10 times larger than the
mean). Negative binomial models, on the other hand, allow for an extra parameter to
model this overdispersion, rather than restricting the mean and variance to be equal.
The negative binomial model has the following form:
where is the expected number of events per period
is a vector of parameters which will be estimated
is a vector of explanatory variables, and
EXP ( ) is a gamma distributed error term with mean 1 and variance .
Since this analysis is based on the negative binomial distribution (rather than a normal
distribution), it is not sensitive to the same types of statistical assumptions as OLS
regression.
21
Atkins, D. C. & Gallop, R. J. (2007). Rethinking how family researchers model infrequent outcomes: A tutorial on count regression and zero-inflated models. Journal of Family Psychology, 21(4), 726-735. 22
Non-uniform error variance 23
Long, J. S. (1997). Regression models for categorical and limited dependent variables. Thousand Oaks, CA: Sage Publications. 24
These are known within the statistical community as Generalized Linear Models
)( iii XEXP
i
iX
i2

Compliance, Safety, Accountability: Analyzing the Relationship of Scores to Crash Risk – October 2012 10
2.0 CURRENT RESEARCH METHODOLOGY
This paper relies upon statistical best practices for analyzing crash data (i.e. negative
binomial modeling). Data used for these analyses were taken from three publicly
available sources; the MCMIS crash file, carrier census file and carrier SMS file
extracts.25
Census and SMS data were downloaded August 20, 2012, providing July 2012 data for
the analysis (see Table 1 for FMCSA’s SMS summer release schedule).26,27 At the
same time, ATRI ordered a MCMIS crash file extract from FMCSA, which was current
as of July 12, 2012. Since all crashes are required to be uploaded by the States within
3 months, this paper incorporates the 24 months of crash data entered in MCMIS
between April 12, 2010 and April 11, 2012.28
Table 1. SMS Summer Release Schedule
Release Month Data Snapshot Date Approximate Release Date
July 2012 Friday, 06/22/2012 Week of 07/02/2012
August 2012 Friday, 07/27/2012 Week of 08/06/2012
September 2012 Friday, 08/24/2012 Week of 09/03/2012
Although data were available for interstate motor carriers, intrastate hazardous material
(hazmat) carriers and intrastate non-hazmat carriers, the latter group of carriers was
excluded from this study.29 Additionally, the researchers made an effort to reduce the
data file from 772,281 registered motor carriers to include only active carriers. The
rationale for this was that non-active carriers would, by default, have zero crashes on
record and therefore artificially lower carrier crash rates, biasing subsequent analyses.
Therefore, the criteria used to establish recent carrier activity included only the 471,306
carriers possessing at least one of the following attributes:
(1) a MCS-150 form that has been updated in the past two years;
(2) one or more inspections or violations reported in the past two years; and/or
(3) one or more crashes occurring in the past two years.
25
The SMS data included only five of the seven BASICs, as data for the Cargo-Related and Crash Indicator BASICs are not available to the public. 26
SMS results are updated monthly. A snapshot of the data is taken on the 3rd or 4th Friday of each month and then it takes approximately 10 days to process and validate the data. Once validated, the results are uploaded to the SMS Website. 27 For a complete list of variables included in these files, please visit FMCSA’s CSA website:
http://ai.fmcsa.dot.gov/sms/Data/Downloads.aspx 28
The most recent 24 months of crash data that can be considered reliable. 29
SMS data for intrastate non-hazmat carriers are handled on a state-by-state basis and differ meaningfully from the carriers subject to federal regulations (i.e. interstate and intrastate hazmat carriers).
Compliance, Safety, Accountability: Analyzing the Relationship of Scores to Crash Risk – October 2012 11
3.0 RESEARCH FINDINGS
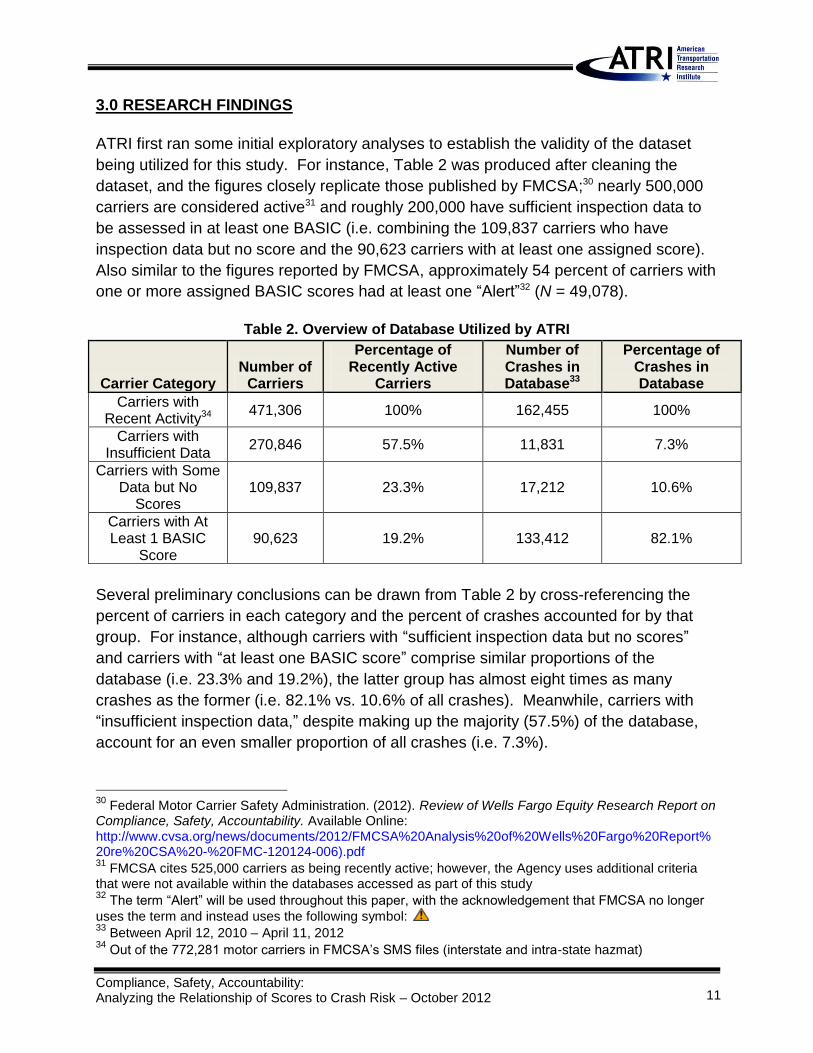
ATRI first ran some initial exploratory analyses to establish the validity of the dataset
being utilized for this study. For instance, Table 2 was produced after cleaning the
dataset, and the figures closely replicate those published by FMCSA;30 nearly 500,000
carriers are considered active31 and roughly 200,000 have sufficient inspection data to
be assessed in at least one BASIC (i.e. combining the 109,837 carriers who have
inspection data but no score and the 90,623 carriers with at least one assigned score).
Also similar to the figures reported by FMCSA, approximately 54 percent of carriers with
one or more assigned BASIC scores had at least one “Alert”32 (N = 49,078).
Table 2. Overview of Database Utilized by ATRI
Carrier Category Number of
Carriers
Percentage of Recently Active
Carriers
Number of Crashes in Database33
Percentage of Crashes in Database
Carriers with Recent Activity34
471,306 100% 162,455 100%
Carriers with Insufficient Data
270,846 57.5% 11,831 7.3%
Carriers with Some Data but No
Scores 109,837 23.3% 17,212 10.6%
Carriers with At Least 1 BASIC
Score 90,623 19.2% 133,412 82.1%
Several preliminary conclusions can be drawn from Table 2 by cross-referencing the
percent of carriers in each category and the percent of crashes accounted for by that
group. For instance, although carriers with “sufficient inspection data but no scores”
and carriers with “at least one BASIC score” comprise similar proportions of the
database (i.e. 23.3% and 19.2%), the latter group has almost eight times as many
crashes as the former (i.e. 82.1% vs. 10.6% of all crashes). Meanwhile, carriers with
“insufficient inspection data,” despite making up the majority (57.5%) of the database,
account for an even smaller proportion of all crashes (i.e. 7.3%).
30
Federal Motor Carrier Safety Administration. (2012). Review of Wells Fargo Equity Research Report on Compliance, Safety, Accountability. Available Online: http://www.cvsa.org/news/documents/2012/FMCSA%20Analysis%20of%20Wells%20Fargo%20Report%20re%20CSA%20-%20FMC-120124-006).pdf 31
FMCSA cites 525,000 carriers as being recently active; however, the Agency uses additional criteria that were not available within the databases accessed as part of this study 32
The term “Alert” will be used throughout this paper, with the acknowledgement that FMCSA no longer
uses the term and instead uses the following symbol: 33
Between April 12, 2010 – April 11, 2012 34
Out of the 772,281 motor carriers in FMCSA’s SMS files (interstate and intra-state hazmat)
Compliance, Safety, Accountability: Analyzing the Relationship of Scores to Crash Risk – October 2012 12
This suggests that the SMS is correctly targeting the carriers that account for most of
the industry’s safety incidents. That is, the 270,846 carriers that are not assessed by
the SMS are the least crash-involved group (i.e. “insufficient data” carriers). Similarly,
the 109,837 carriers with “sufficient data but no scores” have limited crash exposure,
whereas the carriers accounting for the largest share of crashes (82.1%) have already
been assigned at least one BASIC score.
Within the group of carriers that have a score (and account for 82.1% of all crashes),
however, the issue that arises is whether these carriers are assigned scores that reflect
the degree of safety risk presented by each fleet. It appears on the surface as though
simply possessing a score is associated with higher crash risk, perhaps regardless of
whether a carrier is assigned an above or below threshold score. Of the roughly 90,000
carriers with a score, close to 55 percent have at least one BASIC above threshold
while approximately 45 percent do not. Nonetheless, the share of crashes belonging to
these two groups are almost perfectly reversed (i.e. the 55% of above threshold carriers
are responsible for 43.1% of crashes while the 45% of below threshold carriers are
responsible for 56.9% of the crashes in Table 3).
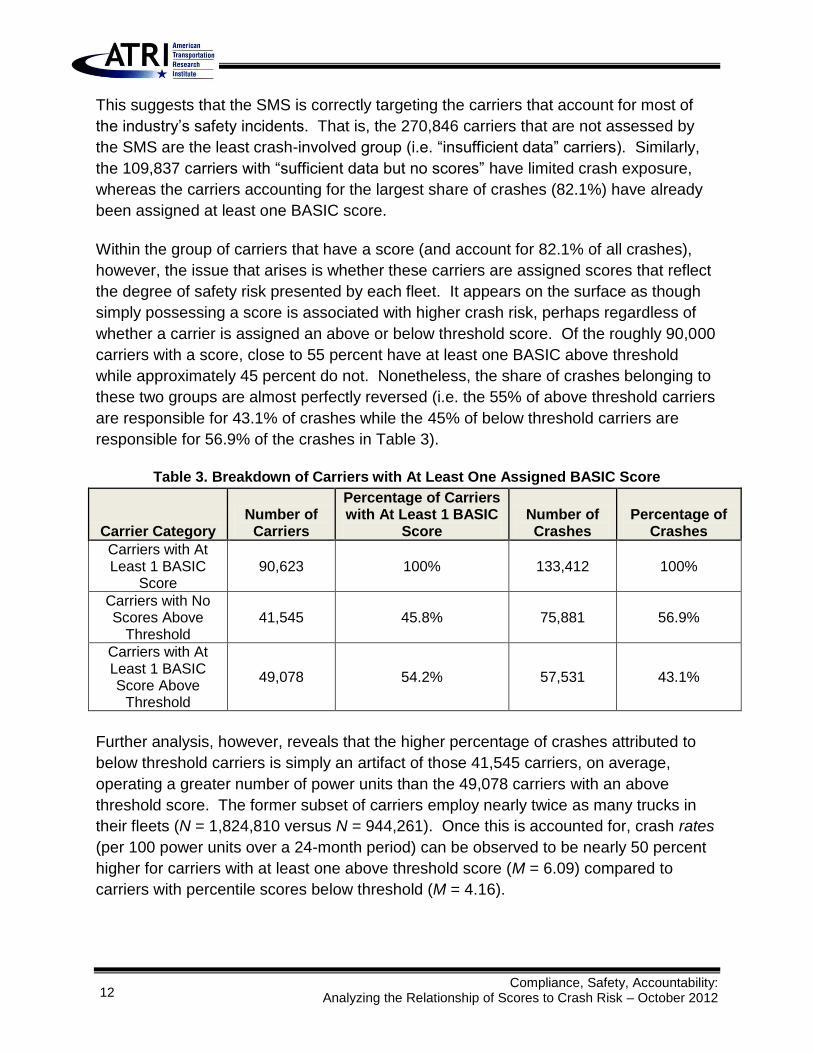
Table 3. Breakdown of Carriers with At Least One Assigned BASIC Score
Carrier Category Number of
Carriers
Percentage of Carriers with At Least 1 BASIC
Score Number of Crashes
Percentage of Crashes
Carriers with At Least 1 BASIC
Score 90,623 100% 133,412 100%
Carriers with No Scores Above
Threshold 41,545 45.8% 75,881 56.9%
Carriers with At Least 1 BASIC Score Above
Threshold
49,078 54.2% 57,531 43.1%
Further analysis, however, reveals that the higher percentage of crashes attributed to
below threshold carriers is simply an artifact of those 41,545 carriers, on average,
operating a greater number of power units than the 49,078 carriers with an above
threshold score. The former subset of carriers employ nearly twice as many trucks in
their fleets (N = 1,824,810 versus N = 944,261). Once this is accounted for, crash rates
(per 100 power units over a 24-month period) can be observed to be nearly 50 percent
higher for carriers with at least one above threshold score (M = 6.09) compared to
carriers with percentile scores below threshold (M = 4.16).
Compliance, Safety, Accountability: Analyzing the Relationship of Scores to Crash Risk – October 2012 13
Relationships Between Percentile Scores and Crash Rates To further examine which specific BASICs, if any, are functioning as intended (i.e. with
higher scores implying greater crash risk), several statistical models were developed.
First, ATRI used a log-linear negative binomial regression model to measure the
association between BASIC percentile scores and observed crash involvement over a
24-month interval. Each BASIC was analyzed individually to allow for the largest
sample size.
Unsafe Driving
Beginning with the Unsafe Driving BASIC, 31,168 motor carriers (6.6% of active
carriers) were identified in the database as having sufficient data to calculate a
percentile score and crash rate. Using these data, a negative binomial regression
analysis was run to examine whether Unsafe Driving BASIC scores have a significant
relationship to crash involvement and, if so, whether that relationship is positive or
negative.
Table 4 reveals the nature of the relationship between these two variables. It can be
interpreted by viewing the row labeled “Unsafe Driving Score,” which is comprised of the
percentile ranks given to the 31,168 carriers in the analysis. The parameter estimate
associated with this variable (B = 0.011) describes the direction of the relationship;
positive values imply the variable is positively related to crash rates, while negative
values suggest an inverse relationship. Since the estimate is statistically significantly
positive in this case (χ2 = 3,112.43, p ≤ .001),35 it can be concluded that, as Unsafe
Driving BASIC scores increase, so do crash rates.
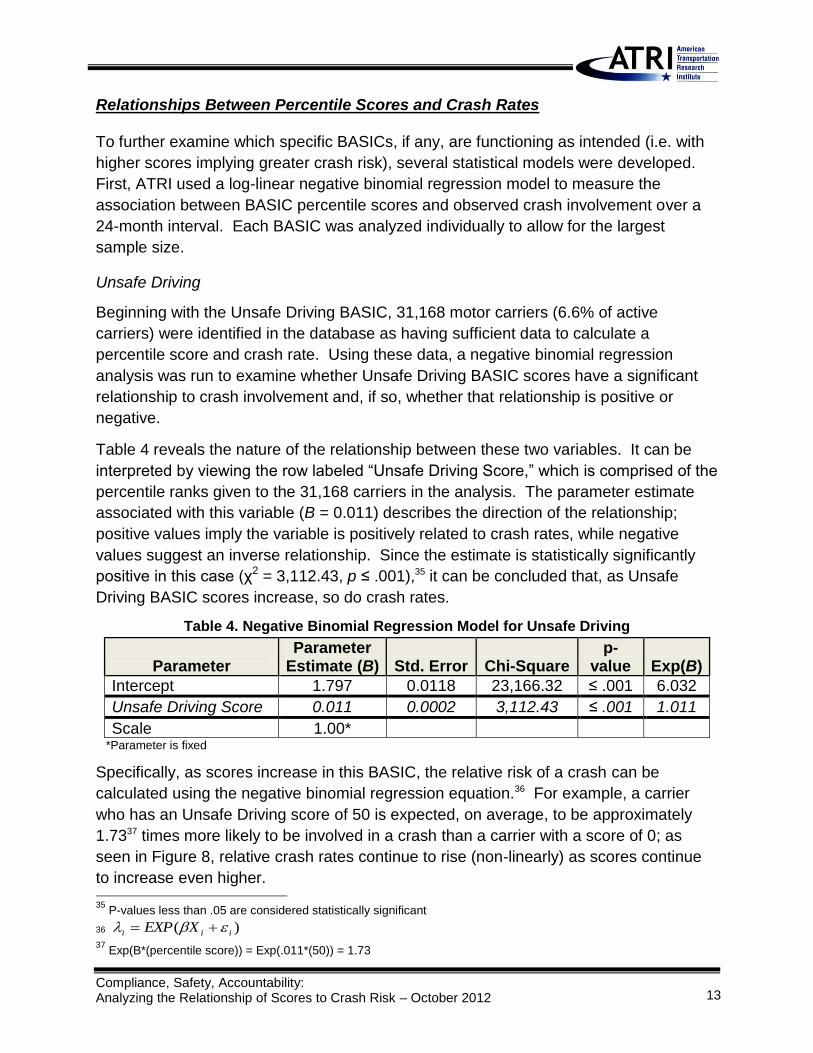
Table 4. Negative Binomial Regression Model for Unsafe Driving
Parameter Parameter
Estimate (B) Std. Error Chi-Square p-
value Exp(B)
Intercept 1.797 0.0118 23,166.32 ≤ .001 6.032
Unsafe Driving Score 0.011 0.0002 3,112.43 ≤ .001 1.011
Scale 1.00* *Parameter is fixed
Specifically, as scores increase in this BASIC, the relative risk of a crash can be
calculated using the negative binomial regression equation.36 For example, a carrier
who has an Unsafe Driving score of 50 is expected, on average, to be approximately
1.7337 times more likely to be involved in a crash than a carrier with a score of 0; as
seen in Figure 8, relative crash rates continue to rise (non-linearly) as scores continue
to increase even higher. 35
P-values less than .05 are considered statistically significant
36
37 Exp(B*(percentile score)) = Exp(.011*(50)) = 1.73
)( iii XEXP

Compliance, Safety, Accountability: Analyzing the Relationship of Scores to Crash Risk – October 2012 14
Figure 8. Relationship Between Unsafe Driving Scores and Crash Rates
Vehicle Maintenance
Next, ATRI used data from the 72,885 motor carriers with a Vehicle Maintenance
percentile score (15.5% of active carriers) to create another negative binomial
regression model. As seen in Table 5, percentile scores in this BASIC demonstrated an
almost equally strong positive association with crash rates as did scores in the Unsafe
Driving BASIC, considering the size of the B coefficient and the corresponding chi
square and p-value (B = 0.008, χ2 = 3,239.88, p ≤ .001).
Table 5. Negative Binomial Regression Model for Vehicle Maintenance
Parameter Parameter
Estimate (B) Std.
Error Chi-Square p-
value Exp(B)
Intercept 1.779 0.0095 35,166.07 ≤ .001 5.925
Vehicle Maintenance Score 0.008 0.0001 3,239.88 ≤ .001 1.008
Scale 1.00* *Parameter is fixed
As scores increase in this BASIC, the relative risk of a crash rises by a factor of the B
coefficient.38 For example, a carrier with a Vehicle Maintenance score of 50 is
expected, on average, to be approximately 1.4939 times more likely to be involved in a
crash than a carrier with a score of 0; if the assigned score is 99, the carrier is 2.2340
times more likely to be involved in a crash compared to a carrier with a score of 0.
Figure 9 reveals that this relationship, despite being statistically significant, is not as
strong as that found between Unsafe Driving percentile scores and crash rates
(compare Figure 8 and Figure 9).
38
Exp(0.008*(percentile score)) 39
Exp(B*(percentile score)) = Exp(.008*(50)) = 1.49 40
Exp(B*(percentile score)) = Exp(.008*(99)) = 2.23
0.5
1.0
1.5
2.0
2.5
3.0
3.5
0 10 20 30 40 50 60 70 80 90 100
Cra
sh
Ris
k
Percentile Score
Unsafe Driving and Relative Crash Rates
Baseline

Compliance, Safety, Accountability: Analyzing the Relationship of Scores to Crash Risk – October 2012 15
Figure 9. Relationship Between Vehicle Maintenance Scores and Crash Rates
Fatigued Driving
Third, 48,884 motor carriers in the database (10.4% of active carriers) were included in
the negative binomial regression analysis for the Fatigued Driving BASIC. As seen in
Table 6, this BASIC also demonstrated a statistically significant positive association with
crash rates (B = 0.008, χ2 = 1,754.87, p ≤ .001). Again, as scores increase in this
BASIC, the relative risk of a crash is expected to rise (non-linearly) by a factor of 0.008,
similar to Vehicle Maintenance (see Figure 10).
Table 6. Negative Binomial Regression Model for Fatigued Driving
Parameter Parameter
Estimate (B) Std.
Error Chi-Square p-
value Exp(B)
Intercept 1.876 0.0136 18,938.24 ≤ .001 6.524
Fatigued Driving Score 0.008 0.0002 1,754.87 ≤ .001 1.008
Scale 1.00* *Parameter is fixed
Figure 10. Relationship Between Fatigued Driving Scores and Crash Rates
0.5
1.0
1.5
2.0
2.5
3.0
3.5
0 10 20 30 40 50 60 70 80 90 100
Cra
sh
Ris
k
Percentile Score
Vehicle Maintenance and Relative Crash Rates
Baseline
0.5
1.0
1.5
2.0
2.5
3.0
3.5
0 10 20 30 40 50 60 70 80 90 100
Cra
sh
Ris
k
Percentile Score
Fatigued Driving and Relative Crash Rates
Baseline

Compliance, Safety, Accountability: Analyzing the Relationship of Scores to Crash Risk – October 2012 16
Driver Fitness
Finally, ATRI examined the two BASICs that are least likely to be scored, Driver Fitness
(N = 8,680; 1.8% of active carriers) and Controlled Substances and Alcohol (N = 2,247;
0.5% of active carriers). Unlike the findings for the previously discussed BASICs, these
two BASICs appear to demonstrate negative relationships to crash involvement,
meaning higher (i.e. worse) BASIC scores are associated with lower crash risk. Table 7
shows the results for the Driver Fitness BASIC, where the parameter estimate is
accompanied by a negative sign (B = -0.009, χ2 = 236.95, p ≤ .001). Therefore, for a
percentage point increase in this BASIC, crash rates can be expected to decrease by a
factor of 0.991 (see Figure 11).
Table 7. Negative Binomial Regression Model for Driver Fitness
Parameter Parameter
Estimate (B) Std.
Error Chi-Square p-
value Exp(B)
Intercept 2.970 0.0488 3,705.03 ≤ .001 19.501
Driver Fitness Score -0.009 0.0006 236.95 ≤ .001 0.991
Scale 1.00* *Parameter is fixed
Figure 11. Relationship Between Driver Fitness Scores and Crash Rates
Controlled Substances and Alcohol
Similarly, Table 8 reveals the significantly negative association between the percentile
score assigned to the Controlled Substances and Alcohol BASIC and crash involvement
(B = -0.010, χ2 = 145.80, p ≤ .001). For a percentage point increase in this BASIC,
crash rates can be expected to decrease by a factor of exp(-0.010) = 0.990.
Use of the negative binomial regression equation allows for additional examples. For
instance, a carrier with a Controlled Substances and Alcohol score of 50 is expected, on
average, to have a lower crash rate than a carrier with a score of 0 by a factor of 0.61; if
the score increases to 99, the carrier is further expected to have a lower crash rate by a
factor of exp(-.01*(99)) = 0.37 compared to a carrier with a score of 0 (see Figure 12).
0.0
0.5
1.0
1.5
2.0
2.5
3.0
0 10 20 30 40 50 60 70 80 90 100
Cra
sh
Ris
k
Percentile Score
Driver Fitness and Relative Crash Rates
Baseline

Compliance, Safety, Accountability: Analyzing the Relationship of Scores to Crash Risk – October 2012 17
Table 8. Negative Binomial Regression Model for Controlled Substances and Alcohol
Parameter Parameter
Estimate (B) Std.
Error Chi-Square p-
value Exp(B)
Intercept 2.869 0.0498 3,320.48 ≤ .001 17.624
Substance/Alcohol Score -0.010 0.0008 145.80 ≤ .001 0.990
Scale 1.00* *Parameter is fixed
Figure 12. Relationship Between Controlled Substances and Alcohol Scores and
Crash Rates
Section Summary
Based on the findings in this section, there is ample evidence to support the SMS
methodology for assigning percentile scores to the Unsafe Driving, Fatigued Driving and
Vehicle Maintenance BASICs. Percentile scores in these three BASICs accurately
reflect relative crash risk, on average. In contrast, there is no statistical support for
making intended safety inferences based upon the Driver Fitness or Controlled
Substances and Alcohol percentile rankings. In fact, carriers with higher scores in these
two BASICs seem to present lower crash risks.
To add perspective, the BASICs that function appropriately capture 99.1 percent of all
carriers with at least one assigned BASIC score (i.e. 89,829 carriers have a score in
either the Unsafe Driving, Fatigued Driving or Vehicle Maintenance BASIC). On the
other hand, the two dysfunctional BASICs apply to just 11.6 percent of carriers who
have at least one BASIC score (i.e. 10,500 carriers have a score in either the Driver
Fitness or Controlled Substances and Alcohol BASIC).
As a fraction of all recently active carriers, roughly one in five carriers has been
assigned a score in one of the three BASICs that works as intended, compared to one
in fifty possessing one or both of the dysfunctional BASIC scores. Therefore, while the
number of carriers adversely affected by flaws in CSA’s percentile scoring mechanism
is substantially smaller than the number of carriers receiving valid scores, it is not
negligible and must be addressed.
0.0
0.5
1.0
1.5
2.0
2.5
3.0
0 10 20 30 40 50 60 70 80 90 100
Cra
sh
Ris
k
Percentile Score
Substance/Alcohol and Relative Crash Rates
Baseline
Compliance, Safety, Accountability: Analyzing the Relationship of Scores to Crash Risk – October 2012 18
Comparing Above vs. Below Threshold Carriers
Next, ATRI developed a series of negative binomial regression models to compare
levels of crash risk for carriers above and below threshold in each of the five public
BASICs. For these analyses, “Above Threshold” includes carriers who have percentile
scores higher than FMCSA’s designated cutoff(s) and/or Severe Violation(s) that
constitute an “Alert” status.41 A categorical variable was created for each BASIC as
follows:
1 = Sufficient Roadside Inspection Data But No Score
2 = “Alert” (due to Percentile Score and/or a Severe Violation)
3 = Score Below Threshold (reference group)
For ease of comparison, Group 3 (Score Below Threshold) was made the reference
group in the analyses, meaning that all findings will be interpreted as having higher or
lower crash rates than carriers with percentile scores below threshold.42 Again, positive
parameter estimates signify increased risk while negative estimates signify decreased
risk (relative to the reference group), with p-values less than .05 indicating statistical
significance.
Also added to each model was a description of each carrier’s operation type:
1 = Passenger Carrier
2 = Hazardous Material Carrier
3 = General Carrier (reference group)
A carrier’s classification affects which percentile cutoff is used, with passenger carriers
having the most strict (i.e. lowest) thresholds. Since most carriers (93.2%) fall into
Group 3 (General Carriers), that group was chosen as the reference group for all
analyses.
Carriers with insufficient roadside inspection data are excluded from all analyses due to
the fact that these carriers possess artificially low crash rates and were therefore not
considered a viable reference group. Nonetheless, interested readers may look to
Appendix A for a breakdown of how many carriers fall into this category within each
BASIC (N = 470,849).
41
Consequently, the terms “Above Threshold” and “Alert” will be used interchangeably hereafter. 42
When variables are categorical (e.g. comparing crash rates between groups), one level of each
variable is chosen as a reference group (e.g. carriers with below threshold scores). Subsequently, the reference group is not displayed in the table of results; instead, all other levels are fit in the model to show differences in crash rates between each group and the “silent” reference group.

Compliance, Safety, Accountability: Analyzing the Relationship of Scores to Crash Risk – October 2012 19
Unsafe Driving
Beginning with the Unsafe Driving BASIC, 31,170 carriers had sufficient data to be
included in the model, and Table 9 breaks down the sample size for each variable
considered in the analysis. Notably, the Unsafe Driving BASIC does not allow for
carriers to have “Sufficient Roadside Inspection Data But No Score” since violations in
this BASIC trigger roadside inspections and not vice versa. As a result, this model
simply compares crash rates between above and below threshold carriers.43
Table 9. Description of Variables Entered into ATRI’s Unsafe Driving Model
Variable Level N Percent
Operation Type
1 - (Passenger Carrier) 361 1.2%
2 - (HazMat Carrier) 5,194 16.7%
3 - (General Carrier) 25,615 82.2%
Unsafe Driving
1 - (Data, No Score) N/A N/A
2 - (Score Above Threshold) 11,279 36.2%
3 - (Score Below Threshold) 19,891 63.8%
Table 10 displays the results from the negative binomial regression analysis. Since the
model analyzes multiple variables simultaneously, each parameter can be interpreted
as holding all other measures constant (rather than treating each variable as existing in
its own independent universe). That is, controlling for operation type, a carrier above
threshold in the Unsafe Driving BASIC has a crash rate approximately exp(0.554) =
1.74 times the rate of a carrier with a below threshold Unsafe Driving score, on average
(B = 0.554, χ2 = 2,012.85, p ≤ .001). This relationship can be seen in Figure 13.
Table 10. Negative Binomial Regression Model for Differences in Crash Rates – Unsafe
Driving
Parameter Level Parameter
Estimate (B) Std.
Error Chi-Square p-
value Exp(B) Intercept - 2.211 .0082 73,219.41 ≤ .001 9.124
Operation Type 1 -.876 .0587 222.50 ≤ .001 .417
2 -.213 .0162 173.13 ≤ .001 .808
Unsafe Driving 144 - - - - -
2 .554 .0124 2,012.85 ≤ .001 1.741
Scale - 1.00* *Parameter is fixed
43
The model also compares safety levels between operation types – revealing that crash rates are lowest for passenger carriers, followed by hazardous material carriers and finally general carriers – although this comparison is not of particular importance in this research paper. 44
This category does not exist for the Unsafe Driving BASIC, since violations in that BASIC trigger roadside inspections and not vice versa.
Compliance, Safety, Accountability: Analyzing the Relationship of Scores to Crash Risk – October 2012 20
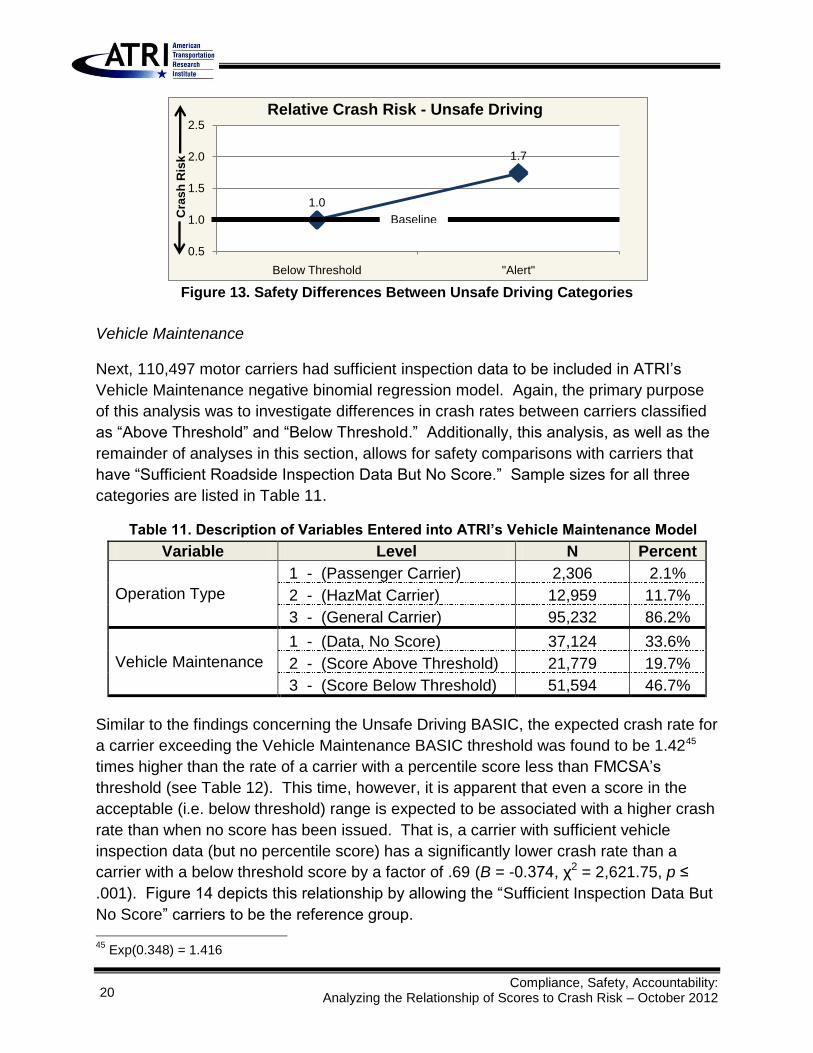
Figure 13. Safety Differences Between Unsafe Driving Categories
Vehicle Maintenance
Next, 110,497 motor carriers had sufficient inspection data to be included in ATRI’s
Vehicle Maintenance negative binomial regression model. Again, the primary purpose
of this analysis was to investigate differences in crash rates between carriers classified
as “Above Threshold” and “Below Threshold.” Additionally, this analysis, as well as the
remainder of analyses in this section, allows for safety comparisons with carriers that
have “Sufficient Roadside Inspection Data But No Score.” Sample sizes for all three
categories are listed in Table 11.
Table 11. Description of Variables Entered into ATRI’s Vehicle Maintenance Model
Variable Level N Percent
Operation Type
1 - (Passenger Carrier) 2,306 2.1%
2 - (HazMat Carrier) 12,959 11.7%
3 - (General Carrier) 95,232 86.2%
Vehicle Maintenance
1 - (Data, No Score) 37,124 33.6%
2 - (Score Above Threshold) 21,779 19.7%
3 - (Score Below Threshold) 51,594 46.7%
Similar to the findings concerning the Unsafe Driving BASIC, the expected crash rate for
a carrier exceeding the Vehicle Maintenance BASIC threshold was found to be 1.4245
times higher than the rate of a carrier with a percentile score less than FMCSA’s
threshold (see Table 12). This time, however, it is apparent that even a score in the
acceptable (i.e. below threshold) range is expected to be associated with a higher crash
rate than when no score has been issued. That is, a carrier with sufficient vehicle
inspection data (but no percentile score) has a significantly lower crash rate than a
carrier with a below threshold score by a factor of .69 (B = -0.374, χ2 = 2,621.75, p ≤
.001). Figure 14 depicts this relationship by allowing the “Sufficient Inspection Data But
No Score” carriers to be the reference group.
45
Exp(0.348) = 1.416
1.0
1.7
0.5
1.0
1.5
2.0
2.5
Below Threshold "Alert"
Cra
sh
Ris
k
Relative Crash Risk - Unsafe Driving
Baseline

Compliance, Safety, Accountability: Analyzing the Relationship of Scores to Crash Risk – October 2012 21
Table 12. Negative Binomial Regression Model for Differences in Crash Rates –
Vehicle Maintenance
Parameter Level Parameter
Estimate (B) Std.
Error Chi-Square p-
value Exp(B)
Intercept - 2.215 .0049 204,695.33 ≤ .001 9.159
Operation Type 1 -.572 .0233 602.87 ≤ .001 .564
2 -.299 .0101 880.11 ≤ .001 .741
Vehicle Maintenance 1 -.374 .0073 2,621.75 ≤ .001 .688
2 .348 .0085 1,692.15 ≤ .001 1.416
Scale - 1.00* *Parameter is fixed
Figure 14. Safety Differences Between Vehicle Maintenance Categories
Fatigued Driving
The BASIC with the next strongest relationship to crashes was Fatigued Driving. Here,
ATRI’s model incorporated 199,137 motor carriers with sufficient data (see Table 13).
Table 13. Description of Variables Entered into ATRI’s Fatigued Driving Model
Variable Level N Percent
Operation Type
1 - (Passenger Carrier) 2,784 1.4%
2 - (HazMat Carrier) 16,446 8.3%
3 - (General Carrier) 179,907 90.3%
Fatigued Driving
1 - (Data, No Score) 149,455 75.1%
2 - (Score Above Threshold) 27,721 13.9%
3 - (Score Below Threshold) 21,961 11.0%
ATRI again found above threshold carriers to have the highest crash rates. Specifically,
carriers with an “Alert,” on average, had approximately 1.34 times higher crash rates
than below threshold carriers (see Table 14). Also consistent with previous findings,
having a score above or below threshold was indicative of greater crash risk than
1.0
1.5
2.1
0.5
1.0
1.5
2.0
2.5
Data (no score) Below Threshold "Alert"
Cra
sh
Ris
k
Relative Crash Risk - Vehicle Maintenance
Baseline
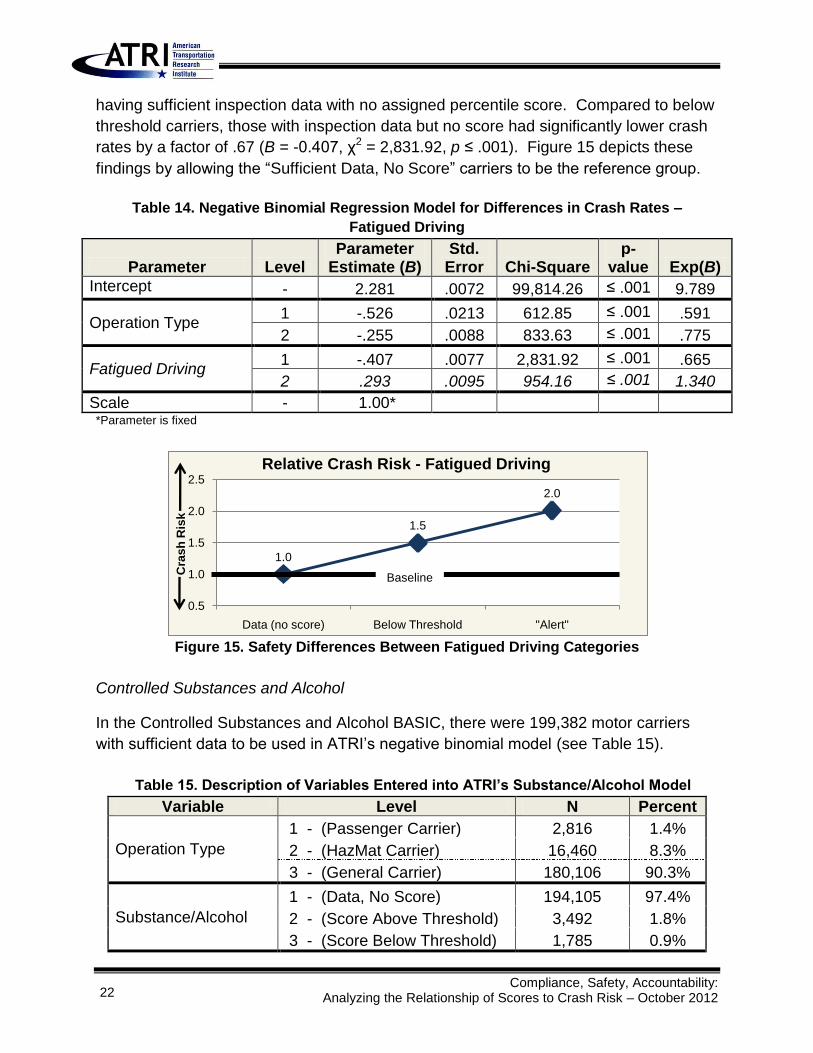
Compliance, Safety, Accountability: Analyzing the Relationship of Scores to Crash Risk – October 2012 22
having sufficient inspection data with no assigned percentile score. Compared to below
threshold carriers, those with inspection data but no score had significantly lower crash
rates by a factor of .67 (B = -0.407, χ2 = 2,831.92, p ≤ .001). Figure 15 depicts these
findings by allowing the “Sufficient Data, No Score” carriers to be the reference group.
Table 14. Negative Binomial Regression Model for Differences in Crash Rates –
Fatigued Driving
Parameter Level Parameter
Estimate (B) Std.
Error Chi-Square p-
value Exp(B)
Intercept - 2.281 .0072 99,814.26 ≤ .001 9.789
Operation Type 1 -.526 .0213 612.85 ≤ .001 .591
2 -.255 .0088 833.63 ≤ .001 .775
Fatigued Driving 1 -.407 .0077 2,831.92 ≤ .001 .665
2 .293 .0095 954.16 ≤ .001 1.340
Scale - 1.00* *Parameter is fixed
Figure 15. Safety Differences Between Fatigued Driving Categories
Controlled Substances and Alcohol
In the Controlled Substances and Alcohol BASIC, there were 199,382 motor carriers
with sufficient data to be used in ATRI’s negative binomial model (see Table 15).
Table 15. Description of Variables Entered into ATRI’s Substance/Alcohol Model
Variable Level N Percent
Operation Type
1 - (Passenger Carrier) 2,816 1.4%
2 - (HazMat Carrier) 16,460 8.3%
3 - (General Carrier) 180,106 90.3%
Substance/Alcohol
1 - (Data, No Score) 194,105 97.4%
2 - (Score Above Threshold) 3,492 1.8%
3 - (Score Below Threshold) 1,785 0.9%
1.0
1.5
2.0
0.5
1.0
1.5
2.0
2.5
Data (no score) Below Threshold "Alert"
Cra
sh
Ris
k
Relative Crash Risk - Fatigued Driving
Baseline

Compliance, Safety, Accountability: Analyzing the Relationship of Scores to Crash Risk – October 2012 23
On average, above threshold carriers were found to have approximately 1.32 times
higher crash rates than carriers with below threshold scores. Additionally, carriers with
any score (above or below threshold) in the Substance/ Alcohol BASIC were found to
have significantly higher crash rates than carriers not assigned a score (see Table 16).
Figure 16 depicts this relationship by allowing the “Sufficient Data, No Score” carriers to
be the reference group.
Table 16. Negative Binomial Regression Model for Differences in Crash Rates –
Substance/Alcohol
Parameter Level Parameter
Estimate (B) Std.
Error Chi-Square p-
value Exp(B)
Intercept - 2.480 .0247 10,058.34 ≤ .001 11.944
Operation Type 1 -.582 .0211 764.44 ≤ .001 .559
2 -.233 .0088 706.70 ≤ .001 .792
Substance/Alcohol 1 -.452 .0248 331.38 ≤ .001 .637
2 .276 .0303 83.33 ≤ .001 1.318
Scale - 1.00* *Parameter is fixed
Figure 16. Safety Differences Between Controlled Substance/Alcohol Categories
Based on the previous set of analyses, which showed a negative relationship between
carrier Substance/Alcohol percentile scores and crash rates, it was expected that below
threshold carriers would have a higher crash rate than above threshold carriers. Further
analyses, however, uncovered a simple explanation for the contradictory findings (see
Appendix B). Essentially, carriers with an “Alert” in this BASIC primarily receive that
status as a result of a Severe Violation rather than due to high percentile scores.
Subsequently, carriers with Severe Violations elevated the crash rate for the entire
“Alert” group compared to what the group’s crash rate would have been had the
analysis only considered carriers above threshold due to high percentile scores.
1.0
1.6
2.1
0.5
1.0
1.5
2.0
2.5
Data (no score) Below Threshold "Alert"
Cra
sh
Ris
k
Relative Crash Risk - Substance/Alcohol
Baseline

Compliance, Safety, Accountability: Analyzing the Relationship of Scores to Crash Risk – October 2012 24
Driver Fitness
Finally, the Driver Fitness negative binomial regression analysis was based on data
from 143,358 motor carriers (see Table 17).
Table 17. Description of Variables Entered into ATRI’s Driver Fitness Model
Variable Level N Percent
Operation Type
1 - (Passenger Carrier) 2,170 1.5%
2 - (HazMat Carrier) 13,933 9.7%
3 - (General Carrier) 127,255 88.8%
Driver Fitness
1 - (Data, No Score) 132,867 92.7%
2 - (Score Above Threshold) 7,422 5.2%
3 - (Score Below Threshold) 3,069 2.1%
In contrast to the other four BASICs, which each found above threshold carriers having
significantly higher crash rates than below threshold carriers, the Driver Fitness BASIC
revealed unusual findings. In this BASIC, above threshold carriers had a crash rate .87
times lower than below threshold carriers. Furthermore, carriers with sufficient roadside
inspection information but no score had crash rates .71 times lower than below
threshold carriers (see Table 18). Figure 17 depicts this relationship by allowing the
“Sufficient Data, No Score” carriers to be the reference group.
Table 18. Negative Binomial Regression Model for Differences in Crash Rates – Driver Fitness
Parameter Level Parameter
Estimate (B) Std.
Error Chi-Square p-
value Exp(B)
Intercept - 2.491 .0192 16,896.00 ≤ .001 12.08
Operation Type 1 -.580 .0237 597.50 ≤ .001 .560
2 -.313 .0097 1,050.86 ≤ .001 .731
Driver Fitness 1 -.338 .0193 308.56 ≤ .001 .713
2 -.140 .0226 38.48 ≤ .001 .869
Scale - 1.00* *Parameter is fixed
Figure 17. Safety Differences Between Driver Fitness Categories
1.0
1.41.2
0.5
1.0
1.5
2.0
2.5
Data (no score) Below Threshold "Alert"
Cra
sh
Ris
k
Relative Crash Risk - Driver Fitness
Baseline

Compliance, Safety, Accountability: Analyzing the Relationship of Scores to Crash Risk – October 2012 25
Section Summary
In conclusion, in four of the five public BASICs, carriers with an “Alert” had crash rates
exceeding those of carriers in all other groups. The one exception was Driver Fitness,
where below threshold carriers posed greater safety risks. A graphical depiction of
these findings can be seen in Figures 13 through 17. As noted, these figures present
the same statistical models as in the respective tables for each BASIC, with the single
change of making the “Sufficient Inspection Data But No Score” carriers the reference
group.46 Changing the reference group does not alter any relationships; it simply
presents the same set of statistics in a different way.
The figures each compare crash rates within each BASIC, meaning the findings are
relative. For instance, Figure 15 compares the 21,961 carriers with an “Alert” in the
Fatigued Driving BASIC to the 149,455 carriers with “Sufficient Inspection Data But No
Score” in the Fatigued Driving BASIC. Alternatively, Figure 17 compares the 3,069
carriers with an “Alert” in the Driver Fitness BASIC to the 132,867 carriers with
“Sufficient Inspection Data But No Score” in the Driver Fitness BASIC, and so forth.
While this is informative, it does not reveal which BASICs are most strongly related to
safety in absolute terms. To do that, ATRI compared carriers with “Alerts” in each
BASIC to a common reference group, carriers with “Sufficient Data But No Alerts.” As
revealed in Table 19, the BASICs with the strongest relationship to crashes were the
Unsafe Driving and Controlled Substances and Alcohol BASICs; carriers with “Alerts” in
these BASICs had 2.45 and 2.41 times higher crash rates than carriers with “No Alerts,”
respectively. The next strongest associations were found for the Fatigued Driving and
Vehicle Maintenance BASICs; carriers with “Alerts” in these BASICs had 2.02 and 1.99
times higher crash rates than carriers with “No Alerts,” respectively. Lastly, Driver
Fitness had the weakest relationship to crashes; yet carriers with an “Alert” in this
BASIC still had 1.60 times higher crash rates than carriers with no “Alerts” despite
sufficient inspection data.
Table 19. Absolute Crash Risk Compared to Carriers With Data But No “Alerts”
“Alert” in: Crash Risk
Unsafe Driving 2.45
Substance/Alcohol 2.41
Fatigued Driving 2.02
Vehicle Maintenance 1.99
Driver Fitness 1.60
46
Except for Unsafe Driving, which does not have a “Sufficient Data, No Score” group
Compliance, Safety, Accountability: Analyzing the Relationship of Scores to Crash Risk – October 2012 26
Available Data and Safety
Generally speaking, it appears from ATRI’s analyses that simply possessing a BASIC
score (above or below threshold) implies a carrier has a higher risk of being in a crash
than a carrier with no percentile score, regardless of the BASIC. ATRI’s analysis seems
to suggest that carriers with “sufficient inspection data but no BASIC scores” generally
present the lowest safety risk in terms of crash involvement. Comparatively, carriers
with below threshold scores have the next lowest crash rates, followed by carriers with
“Alerts.”
At the highest level, this research creates a clear challenge to industry and government
in that it documents how a carrier’s observed safety risk can be influenced by the
amount of available data for the carrier. For instance, it would be specious to conclude
that carriers with insufficient roadside inspection data truly have the safest operations of
all motor carriers simply because they are absent from both the SMS and MCMIS crash
databases. It is more likely that these “insufficient data” carriers have limited operations
and/or exposure and therefore no inspections or crashes; once inspections are
performed, the carrier may be found to have one or several “Alerts.”
A first step toward correcting this situation is to increase the availability of information
for all motor carriers. Currently, FMCSA and its State Partners conduct roughly three
million CMV inspections per year (one-third of which discover no driver- or vehicle-
based violations). However, a Proof-of-Concept Test for Wireless Roadside Inspections
(WRIs) found that the wireless technology is capable of increasing the number of annual
CMV inspections to approximately 80 million.47 This would be a significant gain toward
increasing the validity of CSA-driven safety inferences.
In particular, expanding the universe of carriers with sufficient inspection data would
make it easier to more reliably compare safety differences between fleets. That is, the
roughly 270,000 “insufficient data” carriers would transition into another group based on
their ratio of “good” to “bad” inspections (i.e. violation-free or not). Meanwhile, carriers
that already possess sufficient data will benefit from having a greater number of
opportunities to refine their standing within CSA. Receiving exclusively “good”
inspections means a carrier will remain among other carriers with very low crash rates
(i.e. sufficient data but no score). Conversely, if negative information is present and/or
the carrier has one or more BASIC scores, the additional inspections will allow the
carrier to amass enough positive data to keep (or shift) those scores below the “Alert”
threshold.
47
Capps, G., Franzese, O., Knee, B., Plate, R. & Lascurain, M. B. (2009). Wireless Roadside Inspection Proof-of-
Concept Test. Washington, DC: Federal Motor Carrier Safety Administration. Available Online:
http://www.fmcsa.dot.gov/facts-research/research-technology/report/FMCSA-RRA-09-007_WRI-POC.pdf

Compliance, Safety, Accountability: Analyzing the Relationship of Scores to Crash Risk – October 2012 27
4.0 SUPPLEMENTARY ANALYSES
Quantity of SMS Data and Safety
Considering only the motor carriers with at least one BASIC score, a statistical model
was created to examine whether how much SMS data a scored carrier has presents
implications for safety. This model controls for carrier operation type and also for
whether a carrier has any “Alerts.” The categories entered into the model are shown
below and descriptive statistics for each variable are found in Table 20. The total
sample size in this model was 90,603 carriers.
Operation Type:
1 = Passenger Carrier (reference group)
2 = Hazardous Material Carrier
3 = General Carrier
Presence of an “Alert”:
0 = No “Alerts” (reference group)
1 = At Least One “Alert”
Number of Assigned BASIC Scores:
1 = One BASIC Score (reference group)
2 = Two BASIC Scores
3 = Three BASIC Scores
4 = Four BASIC Scores
5 = Five BASIC Scores
Table 20. Description of Variables Entered into ATRI’s Model for Number of BASIC
Scores
Variable Level N Percent
Operation Type
1 - (Passenger Carrier) 1,433 1.6%
2 - (HazMat Carrier) 9,757 10.8%
3 - (General Carrier) 79,413 87.6%
Presence of an “Alert” 0 - (No “Alerts”) 41,533 45.8%
1 - (At Least One “Alert”) 49,070 54.2%
Number of Assigned BASIC Scores
1 - (One BASIC Score) 43,058 47.5%
2 - (Two BASIC Scores) 26,598 29.4%
3 - (Three BASIC Scores) 16,526 18.2%
4 - (Four BASIC Scores) 3,893 4.3%
5 - (Five BASIC Scores) 528 0.6%

Compliance, Safety, Accountability: Analyzing the Relationship of Scores to Crash Risk – October 2012 28
As a result of controlling for whether a carrier has any “Alerts,” this model examines
whether crash rates are higher for carriers with multiple BASIC scores, even when all of
those scores are below threshold. It also reveals the extent to which carriers with an
“Alert” have higher crash rates, holding the total number of assigned scores constant.
As seen in Table 21, compared to a carrier with at least one BASIC score and no
“Alerts,” a carrier with one or more “Alerts” would be expected to have a crash rate 1.35
times higher. This again supports FMCSA’s contention that “Alerts” generally do
capture the carriers with the highest crash rates, while below threshold carriers are
typically safer.
Table 21. Negative Binomial Regression Model for Number of BASIC Scores
Parameter Level Parameter
Estimate (B) Std.
Error Chi-Square p-
value Exp(B)
Intercept - 1.477 .0290 2,586.55 ≤ .001 4.381
Operation Type 2 .191 .0310 38.08 ≤ .001 1.211
Operation Type 3 .497 .0293 287.93 ≤ .001 1.643
Presence of an “Alert” 1 .299 .0074 1,631.09 ≤ .001 1.348
Number of Scores 2 .154 .0084 336.75 ≤ .001 1.166
Number of Scores 3 .333 .0099 1,142.35 ≤ .001 1.396
Number of Scores 4 .514 .0178 829.88 ≤ .001 1.671
Number of Scores 5 .602 .0455 175.23 ≤ .001 1.825
Scale - 1.00* *Parameter is fixed
Despite lower crash rates among below threshold carriers, however, there is still a clear
trend that crash rates increase as the number of assigned BASIC scores increases. In
other words, a carrier with two BASIC scores has a 1.17 times higher crash rate than a
carrier with only one BASIC score, even when those scores are in the acceptable
(below threshold) range. Moreover, the crash rate differential rises to 1.40 when a
carrier has scores assigned in three BASICs; to 1.67 when a carrier has scores in four
BASICs; and to 1.83 when a carrier has scores assigned in all five public BASICs.
These findings present an interesting issue. From this analysis alone, it would appear
that the quantity of SMS data a carrier has may be a better predictor of crashes than
whether those data include above threshold scores. After all, possessing five BASIC
scores is associated with a 1.83 times higher crash rate, which exceeds the 1.35 times
higher crash rate associated with having an “Alert.” To address this possibility, ATRI’s
next statistical model examines the relationship between crash rates and the quantity of
specifically negative SMS data (i.e. “Alerts”).

Compliance, Safety, Accountability: Analyzing the Relationship of Scores to Crash Risk – October 2012 29
Quantity of Negative SMS Data and Safety
Since a positive association was found between the number of assigned BASIC scores
and safety, ATRI examined whether the number of Above Threshold BASIC scores was
an even better predictor of crash rates. The results of this analysis are critically
important. If the sheer number of (above or below threshold) BASIC scores says as
much about safety as the number of “Alerts,” then the rationale behind SMS thresholds
would be seriously challenged. Conversely, if the number of “Alerts” is more strongly
related to crashes, then there would be additional support for FMCSA’s methodology.
The number of “Alerts” assigned to a carrier was entered into the model, with operation
type included as a control variable. All categories in the model are described below,
with descriptive statistics for each variable found in Table 22. The total sample size in
this model was 91,848 carriers.
Operation Type:
1 = Passenger Carrier (reference group)
2 = Hazardous Material Carrier
3 = General Carrier
Number of “Alerts”:
0 = At Least One BASIC Score but Zero “Alerts” (reference group)
1 = One “Alert”
2 = Two “Alerts”
3 = Three “Alerts”
4 = Four “Alerts”
5 = Five “Alerts”
Table 22. Description of Variables Entered into ATRI’s Model for Number of “Alerts”
Variable Level N Percent
Operation Type
1 - (Passenger Carrier) 1,643 1.8%
2 - (HazMat Carrier) 9,904 10.8%
3 - (General Carrier) 80,301 87.4%
Number of “Alerts”
0 - (Scores But No “Alerts”) 41,533 45.2%
1 - (One “Alert”) 34,346 37.4%
2 - (Two “Alerts”) 11,812 12.9%
3 - (Three “Alerts”) 3,058 3.3%
4 - (Four “Alerts”) 946 1.0%
5 - (Five “Alerts”) 153 0.2%

Compliance, Safety, Accountability: Analyzing the Relationship of Scores to Crash Risk – October 2012 30
Reviewing Table 23, it is clear that the number of “Alerts” a carrier has is indeed the
better predictor of crash involvement. Compared to a carrier with at least one BASIC
score and no “Alerts,” a carrier with a single “Alert” is expected to have a crash rate 1.24
times higher; a carrier with two “Alerts” is expected to have a crash rate 1.61 times
higher; a carrier with three “Alerts” is expected to have a crash rate 2.81 times higher; a
carrier with four “Alerts” is expected to have a crash rate 3.20 times higher; and a carrier
with an “Alert” in all five public BASICs has a crash rate nearly four times higher. Figure
18 presents the findings from Table 23 alongside those from Table 21.
Table 23. Negative Binomial Regression Model for Number of “Alerts”
Parameter Level Parameter
Estimate (B) Std.
Error Chi-Square p-
value Exp(B) Intercept - 1.490 .0272 3,007.95 ≤ .001 4.438
Operation Type 2 .332 .0291 130.06 ≤ .001 1.394
Operation Type 3 .573 .0274 438.84 ≤ .001 1.774
Number of “Alerts” 1 .215 .0078 769.70 ≤ .001 1.240
Number of “Alerts” 2 .475 .0109 1,886.40 ≤ .001 1.608
Number of “Alerts” 3 1.035 .0192 2,894.15 ≤ .001 2.814
Number of “Alerts” 4 1.164 .0336 1,200.61 ≤ .001 3.202
Number of “Alerts” 5 1.344 .0824 265.98 ≤ .001 3.833
Scale - 1.00* *Parameter is fixed
Figure 18. Relative Crash Risk as the Number of Scores or “Alerts” Increases
The above findings compare carriers with “Alerts” to carriers with scores and no “Alerts.”
When the model is run to compare carriers with “Alerts” against the 108,540 carriers
with “sufficient inspection data but no percentile scores,” the figures are even more
compelling. In fact, piecing together all groups of carriers examined within the SMS,
ATRI presents a final statistical model that contains recommendations for how safety
information could be portrayed to the public to better describe carrier safety levels.
1.0 1.2
1.41.7 1.8
1.01.2
1.6
2.83.2
3.8
0.5
1.5
2.5
3.5
4.5
5.5
0 1 2 3 4 5
Cra
sh
Ris
k
Crash Risk As Number of Scores or "Alerts" Increases
Number of Scores Number of "Alerts"
Baseline

Compliance, Safety, Accountability: Analyzing the Relationship of Scores to Crash Risk – October 2012 31
Making Safety Inferences from CSA: Recommendations
Thus far, ATRI has demonstrated that several individual BASICs function well while
issues persist in the Controlled Substance/Alcohol and especially Driver Fitness
BASICs. Essentially, each BASIC allows carriers to be classified into four distinct
groups:
Insufficient Roadside Inspection Data
Sufficient Inspection Data But No Score
Percentile Score Below Threshold
“Alert” (due to Percentile Score and/or a Severe Violation)
While carriers with “insufficient data” typically have the lowest crash rates, this is an
artifact of there being very few observations among these carriers, 96 percent of whom
are not found in the MCMIS crash file. More is known concerning the other three
groups of carriers, with “sufficient data but no score” carriers maintaining better safety
records, on average, than carriers with one or more BASIC scores assigned. This is not
surprising considering that a carrier that only receives violation-free inspections will not
receive a BASIC score until an inspection uncovers driver- or vehicle-based violations.
Finally, among carriers with scores, it is true that the number of “Alerts” reveals more
about fleet safety than the number of below threshold scores. It is with this
understanding that ATRI proposes an alternative scoring mechanism be used to display
a carrier’s relative safety status.
The SMS could be redesigned to create multiple safety classifications (e.g. A, B, C
series) to indicate the level of crash risk presented by carriers, rather than relying on a
flawed percentile scoring system. While FMCSA and motor carriers could continue
utilizing targeted BASIC information as an internal compliance tool, creating new safety
classifications for carriers, as suggested below, would allow for the public to view a
profile of carriers that provides more reliable indications of fleet safety.
To that effect, a final negative binomial regression model was run using the following
classifications, with the “Sufficient Data, No Score” carriers chosen as the reference
group:
A = Sufficient Inspection Data But No Score in Any BASIC (reference group)
B = At Least One Assigned BASIC Score (but no “Alerts”)
C-1 = One “Alert”
C-2 = Two “Alerts”
C-3 = One “Alerts”
C-4 = One “Alerts”
C-5 = One “Alerts”
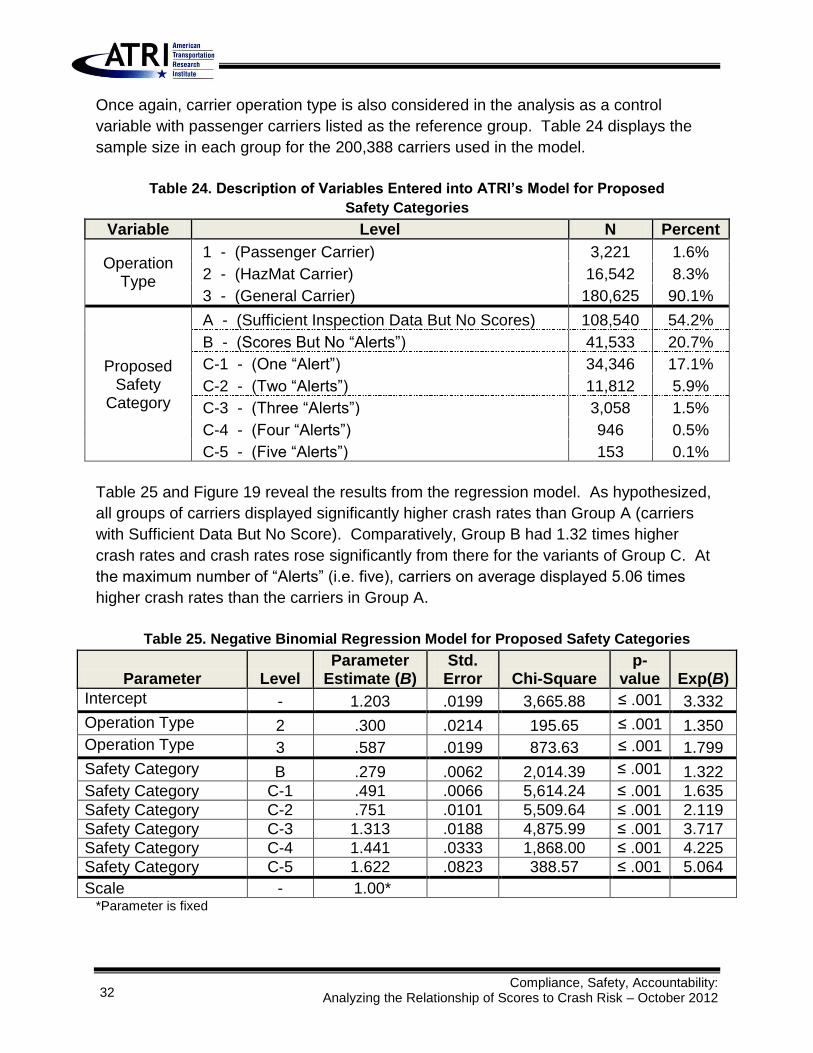
Compliance, Safety, Accountability: Analyzing the Relationship of Scores to Crash Risk – October 2012 32
Once again, carrier operation type is also considered in the analysis as a control
variable with passenger carriers listed as the reference group. Table 24 displays the
sample size in each group for the 200,388 carriers used in the model.
Table 24. Description of Variables Entered into ATRI’s Model for Proposed
Safety Categories
Variable Level N Percent
Operation Type
1 - (Passenger Carrier) 3,221 1.6%
2 - (HazMat Carrier) 16,542 8.3%
3 - (General Carrier) 180,625 90.1%
Proposed Safety
Category
A - (Sufficient Inspection Data But No Scores) 108,540 54.2%
B - (Scores But No “Alerts”) 41,533 20.7%
C-1 - (One “Alert”) 34,346 17.1%
C-2 - (Two “Alerts”) 11,812 5.9%
C-3 - (Three “Alerts”) 3,058 1.5%
C-4 - (Four “Alerts”) 946 0.5%
C-5 - (Five “Alerts”) 153 0.1%
Table 25 and Figure 19 reveal the results from the regression model. As hypothesized,
all groups of carriers displayed significantly higher crash rates than Group A (carriers
with Sufficient Data But No Score). Comparatively, Group B had 1.32 times higher
crash rates and crash rates rose significantly from there for the variants of Group C. At
the maximum number of “Alerts” (i.e. five), carriers on average displayed 5.06 times
higher crash rates than the carriers in Group A.
Table 25. Negative Binomial Regression Model for Proposed Safety Categories
Parameter Level Parameter
Estimate (B) Std.
Error Chi-Square p-
value Exp(B)
Intercept - 1.203 .0199 3,665.88 ≤ .001 3.332
Operation Type 2 .300 .0214 195.65 ≤ .001 1.350
Operation Type 3 .587 .0199 873.63 ≤ .001 1.799
Safety Category B .279 .0062 2,014.39 ≤ .001 1.322
Safety Category C-1 .491 .0066 5,614.24 ≤ .001 1.635
Safety Category C-2 .751 .0101 5,509.64 ≤ .001 2.119
Safety Category C-3 1.313 .0188 4,875.99 ≤ .001 3.717
Safety Category C-4 1.441 .0333 1,868.00 ≤ .001 4.225
Safety Category C-5 1.622 .0823 388.57 ≤ .001 5.064
Scale - 1.00* *Parameter is fixed

Compliance, Safety, Accountability: Analyzing the Relationship of Scores to Crash Risk – October 2012 33
Figure 19. Relative Crash Risk by Proposed Safety Category
ATRI concludes that assigning motor carriers into the seven categories found in Figure
19 presents far more logical and reliable information about fleet safety than the currently
published SMS percentile scores.
Group A is comprised of fleets that have sufficient inspection data, yet not enough
negative data to generate a BASIC score. ATRI’s analysis suggests these carriers
present the lowest crash risk. Carriers in Group B, who have percentile scores but no
“Alerts” also have very low crash rates. Crash risk increases dramatically only after a
carrier has been assigned multiple “Alerts,” with risk nearly doubling between having
two versus three “Alerts.” This is likely reflective of pervasive safety problems that are
reflected both in poor SMS scores and high crash frequencies.
Chief among the key findings from this model is that the carriers with sufficient roadside
inspection data, but no BASIC scores, are just as safe, and even present slightly less
crash risk than carriers with assigned percentile scores below FMCSA’s thresholds.
This is particularly important since many shippers, brokers and other trucking
stakeholders currently perceive the SMS to only indicate safety when a carrier
possesses a below threshold score. While below threshold carriers do indeed have
significantly lower crash rates than carriers with “Alerts,” this analysis confirms that
carriers who have sufficient roadside inspection data but have not generated a score
should also be construed as safe.48
48
“A lack of a ranking for smaller carriers due to lack of exposure, or inspections, or simply by having only perfect
clean inspections means they are overlooked by brokers or shippers for potential freight business – even if a
particular carrier is actually a safe operator with a perfect safety record.” Source: Kilcarr, S. Committee hearing
illuminates growing tension over CSA. Fleet Owner. September 14, 2012. Available Online:
http://fleetowner.com/regulations/committee-hearing-illuminates-growing-tension-over-csa
1.01.3
1.6
2.1
3.7
4.2
5.1
0.5
1.5
2.5
3.5
4.5
5.5
Some Data, No Scores
Scores, No Alerts
1 Alert 2 Alerts 3 Alerts 4 Alerts 5 Alerts
Cra
sh
Ris
k
Crash Risk By Proposed Safety Category
Baseline
Group A Group B Group C1 Group C2 Group C3 Group C4 Group C5

Compliance, Safety, Accountability: Analyzing the Relationship of Scores to Crash Risk – October 2012 34
Motor carriers should examine their place within Figure 19. This figure describes
estimates of crash risk calculated from hundreds of thousands of carriers presently in
each of the seven categories. Presumably, then, there is something about the specific
categories that influences crash risk. As a fleet adopts new strategies to alter roadside
performance, and therefore transitions into a new group, the carrier can reasonably
expect to resemble the characteristics of that new group, including experiencing a
change in relative crash risk.
5.0 CAVEATS
Negative binomial modeling is typically used to predict future events. However, in this
analysis, the SMS and crash data used were both taken from the same historical period,
as opposed to using crash data from a two-year period after SMS profiles. Therefore,
the findings herein should not be interpreted as predicting future crashes based on
BASIC measures; rather, the findings are descriptive in nature, examining current safety
risk differences according to the previous two years of crash and SMS information.
Furthermore, the analyses in this paper consider only crash frequency as a dependent
variable and not crash severity, which is also a factor in determining BASIC percentile
rankings. As an example, a seatbelt violation may not be a good indicator of crash
involvement, yet may still be a reasonably good predictor of crash severity. It is
therefore possible that incorporating crash severity (i.e. number of injuries and/or
fatalities) into the analyses could alter the findings and conclusions presented in this
report.
Finally, as with any statistical analysis, it should be understood that not all individual
circumstances can be accurately described by a regression model. In other words,
ATRI’s findings may not be true for every individual motor carrier; however, they do
describe statistically significant trends based on data from hundreds of thousands of
motor carriers.

Compliance, Safety, Accountability: Analyzing the Relationship of Scores to Crash Risk – October 2012 35
6.0 CONCLUSION
This paper has examined which of CSA’s five public BASICs can be used for assessing
fleet safety in terms of crash involvement. As it is currently designed, CSA has a
number of defects that still need to be addressed. Most notably, the Driver Fitness
BASIC demonstrates several poor qualities – percentile scores in this BASIC are
negatively related to crash rates and carriers with an “Alert” in this BASIC have lower
crash rates than carriers with below threshold Driver Fitness scores. Although not as
comprehensively flawed, ATRI also found problems suggesting that FMCSA’s severity
weighting methodology is not functioning properly in the Controlled Substances and
Alcohol BASIC.
Nonetheless, ATRI found that “Alerts” (which include high percentile scores and Severe
Violations) are generally good indicators of safety. This is true in the Unsafe Driving,
Fatigued Driving, Vehicle Maintenance and Controlled Substances and Alcohol BASICs.
Like UMTRI, ATRI’s analysis also revealed that carriers with any percentile score
(above or below threshold) tend to have higher crash rates than carriers that have not
been issued BASIC scores. This is somewhat intuitive since CSA essentially tracks
negative data (i.e. violations); therefore, ATRI used what is known about different carrier
classifications to identify new approaches for categorizing safety. Essentially, carriers
may have:
Insufficient roadside inspection data to be evaluated
Sufficient roadside inspection data but not enough violations to be assigned a
BASIC score
Sufficient roadside inspection violations to be assigned a BASIC score but
enough violation-free inspections to keep that score below threshold
Sufficient roadside inspection violations to outweigh clean inspections and be
issued one or more “Alerts.”
FMCSA even acknowledges differences in safety between these types of carriers,
granting lower Inspection Selection System (ISS) and e-clearance values to the first two
groups while targeting carriers with “Insufficient Roadside Inspection Data” or “Alerts.” It
is disconcerting then, that other trucking industry stakeholders (e.g. shippers and
brokers) misperceive carriers without scores as unsafe, even if it is due to having
exclusively clean inspections.49
49
Kilcarr, S. Committee hearing illuminates growing tension over CSA. Fleet Owner. September 14, 2012. Available
Online: http://fleetowner.com/regulations/committee-hearing-illuminates-growing-tension-over-csa

Compliance, Safety, Accountability: Analyzing the Relationship of Scores to Crash Risk – October 2012 36
To better clarify precisely which carriers have what extent of crash risk, ATRI developed
a final statistical model capable of reliably communicating safety information to the
public. While FMCSA and motor carriers may continue using current CSA profiles to
identify specific areas where regulatory compliance can be improved, ATRI’s model
does a superior job demonstrating a link to actual safety.
In conclusion, ATRI found that percentile scores are defective in two BASICs and even
“Alerts” do not consistently identify the riskiest carriers within all five BASICs. On the
other hand, a new classification system could be designed that allows trucking
stakeholders to better gauge fleet safety by classifying carriers into groups based on
where they fall in the following chart (see Table 26).
Table 26. Empirically Determined Continuum of Safety Risk
Classification Group Description Level of Safety Risk
Low High
Group A Sufficient data in at least one BASIC, but no scores
Group B Scores in at least one BASIC, but no "Alerts"
Group C-1 1 "Alert"
Group C-2 2 "Alerts"
Group C-3 3 "Alerts"
Group C-4 4 "Alerts"
Group C-5 5 "Alerts"
Compliance, Safety, Accountability: Analyzing the Relationship of Scores to Crash Risk – October 2012 37
REFERENCES
American Transportation Research Institute. Compliance, Safety, Accountability: Evaluating A New
Safety Measurement System And Its Implications. (Unpublished manuscript)
Atkins, D. C. & Gallop, R. J. (2007). Rethinking how family researchers model infrequent outcomes: A
tutorial on count regression and zero-inflated models. Journal of Family Psychology, 21(4), 726-735.
Capps, G., Franzese, O., Knee, B., Plate, R. & Lascurain, M. B. (2009). Wireless Roadside Inspection
Proof-of-Concept Test. Washington, DC: Federal Motor Carrier Safety Administration. Available Online:
http://www.fmcsa.dot.gov/facts-research/research-technology/report/FMCSA-RRA-09-007_WRI-POC.pdf
Federal Motor Carrier Safety Administration. Compliance, Safety, Accountability (CSA). Available Online:
http://csa.fmcsa.dot.gov/default.aspx
Federal Motor Carrier Safety Administration. (2012). Review of Wells Fargo Equity Research Report on
Compliance, Safety, Accountability. Available Online:
http://www.cvsa.org/news/documents/2012/FMCSA%20Analysis%20of%20Wells%20Fargo%20Report%
20re%20CSA%20-%20FMC-120124-006).pdf
Gallo, A. P. & Busche, M. CSA: Another look with similar conclusions. Wells Fargo Securities Equity
Research. July 12, 2012.
Gimpel, J. Statistical issues in the safety measurement and inspection of motor carriers. Alliance for Safe,
Efficient and Competitive Truck Transportation. July 10, 2012. Available Online:
http://asectt.blogspot.com/2012/07/news-brief-university-of-maryland-study.html
Green, P. E. & Blower, D. (2011). Evaluation of the CSA 2010 Operational Model Test. (Report No.
FMCSA-RRA-11-019). Washington, DC: Federal Motor Carrier Safety Administration.
Iyoob, I. SMS BASIC scores are not valid predictors of crash frequency. Alliance for Safe, Efficient and
Competitive Truck Transportation. June 25, 2012. Available Online:
http://asectt.blogspot.com/2012/06/sms-basic-scores-are-not-valid.html
John A. Volpe National Transportation Systems Center. (2009). Comprehensive Safety Analysis 2010:
Carrier Safety Measurement System Violation Severity Weights. Washington, DC: Federal Motor Carrier
Safety Administration. Available Online: http://www.regulations.gov/#!documentDetail;D=FMCSA-2004-
18898-0161
John A. Volpe National Transportation Systems Center. (2012). Safety Measurement System (SMS)
Methodology, Version 2.2. Washington, DC: Federal Motor Carrier Safety Administration. Available
Online: https://csa.fmcsa.dot.gov/Documents/SMSMethodology.pdf
Kilcarr, S. Committee hearing illuminates growing tension over CSA. Fleet Owner. September 14, 2012.
Available Online: http://fleetowner.com/regulations/committee-hearing-illuminates-growing-tension-over-
csa
Long, J. S. (1997). Regression models for categorical and limited dependent variables. Thousand Oaks,
CA: Sage Publications.
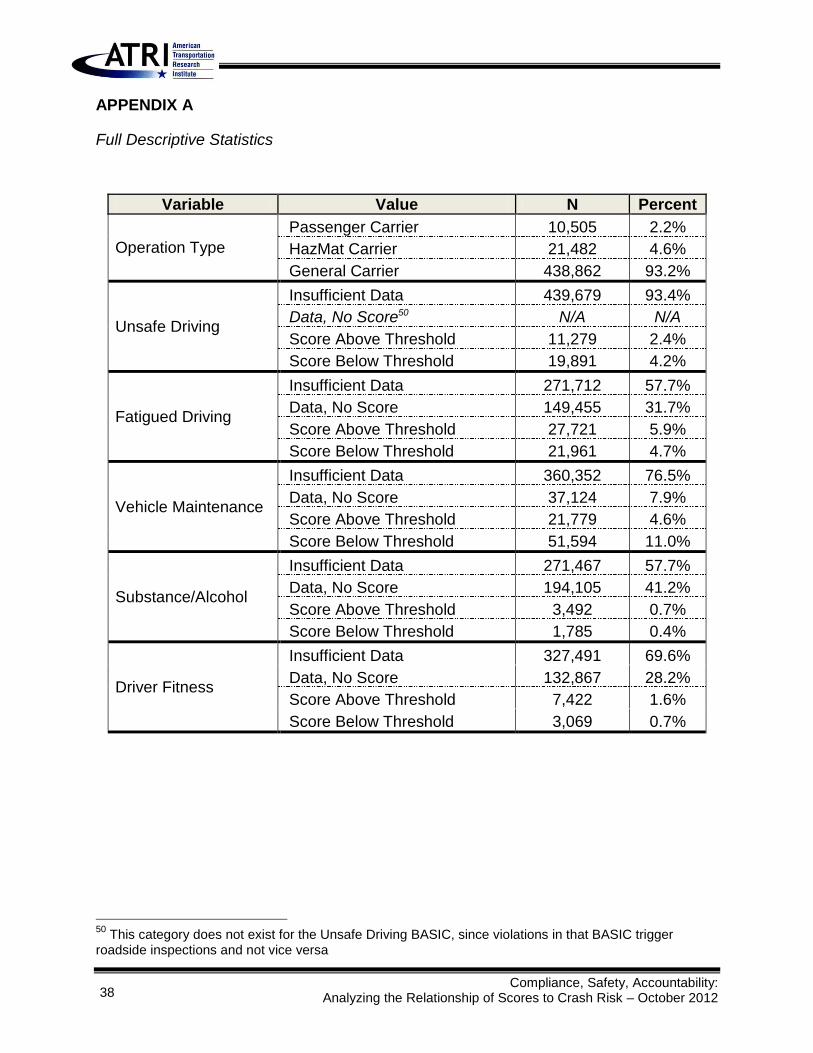
Compliance, Safety, Accountability: Analyzing the Relationship of Scores to Crash Risk – October 2012 38
APPENDIX A
Full Descriptive Statistics
Variable Value N Percent
Operation Type
Passenger Carrier 10,505 2.2%
HazMat Carrier 21,482 4.6%
General Carrier 438,862 93.2%
Unsafe Driving
Insufficient Data 439,679 93.4%
Data, No Score50 N/A N/A
Score Above Threshold 11,279 2.4%
Score Below Threshold 19,891 4.2%
Fatigued Driving
Insufficient Data 271,712 57.7%
Data, No Score 149,455 31.7%
Score Above Threshold 27,721 5.9%
Score Below Threshold 21,961 4.7%
Vehicle Maintenance
Insufficient Data 360,352 76.5%
Data, No Score 37,124 7.9%
Score Above Threshold 21,779 4.6%
Score Below Threshold 51,594 11.0%
Substance/Alcohol
Insufficient Data 271,467 57.7%
Data, No Score 194,105 41.2%
Score Above Threshold 3,492 0.7%
Score Below Threshold 1,785 0.4%
Driver Fitness
Insufficient Data 327,491 69.6%
Data, No Score 132,867 28.2%
Score Above Threshold 7,422 1.6%
Score Below Threshold 3,069 0.7%
50
This category does not exist for the Unsafe Driving BASIC, since violations in that BASIC trigger roadside inspections and not vice versa
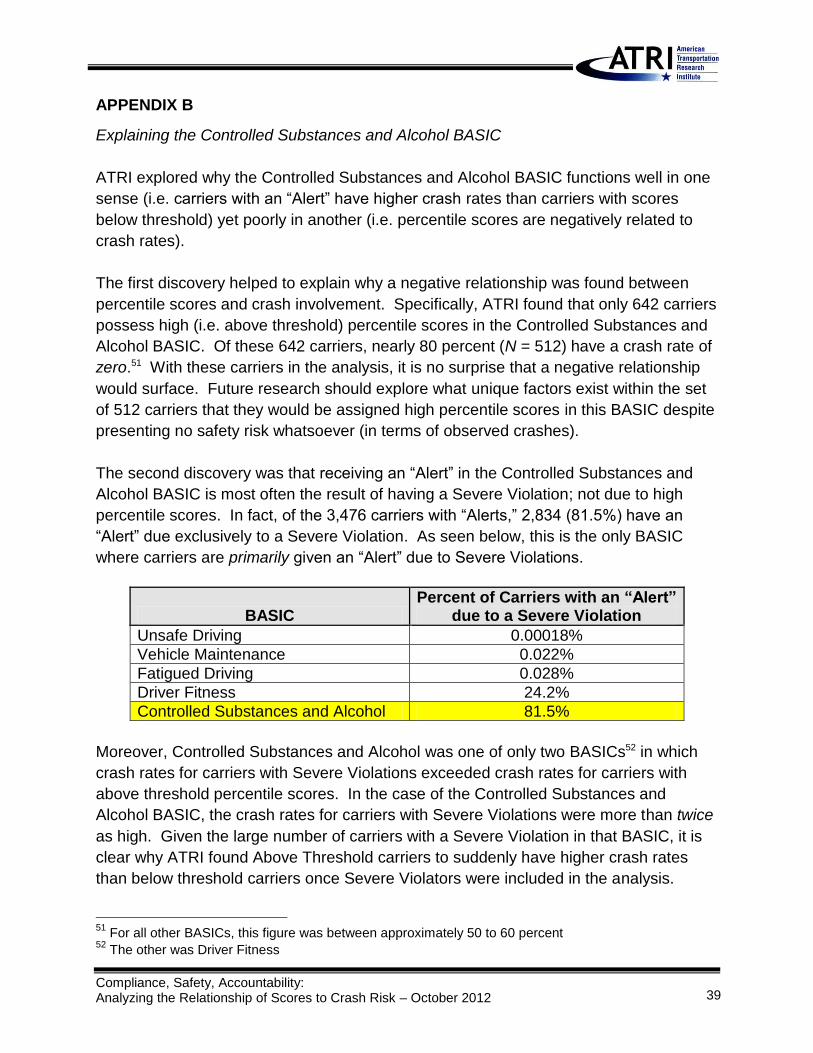
Compliance, Safety, Accountability: Analyzing the Relationship of Scores to Crash Risk – October 2012 39
APPENDIX B Explaining the Controlled Substances and Alcohol BASIC
ATRI explored why the Controlled Substances and Alcohol BASIC functions well in one
sense (i.e. carriers with an “Alert” have higher crash rates than carriers with scores
below threshold) yet poorly in another (i.e. percentile scores are negatively related to
crash rates).
The first discovery helped to explain why a negative relationship was found between
percentile scores and crash involvement. Specifically, ATRI found that only 642 carriers
possess high (i.e. above threshold) percentile scores in the Controlled Substances and
Alcohol BASIC. Of these 642 carriers, nearly 80 percent (N = 512) have a crash rate of
zero.51 With these carriers in the analysis, it is no surprise that a negative relationship
would surface. Future research should explore what unique factors exist within the set
of 512 carriers that they would be assigned high percentile scores in this BASIC despite
presenting no safety risk whatsoever (in terms of observed crashes).
The second discovery was that receiving an “Alert” in the Controlled Substances and
Alcohol BASIC is most often the result of having a Severe Violation; not due to high
percentile scores. In fact, of the 3,476 carriers with “Alerts,” 2,834 (81.5%) have an
“Alert” due exclusively to a Severe Violation. As seen below, this is the only BASIC
where carriers are primarily given an “Alert” due to Severe Violations.
BASIC Percent of Carriers with an “Alert”
due to a Severe Violation
Unsafe Driving 0.00018%
Vehicle Maintenance 0.022%
Fatigued Driving 0.028%
Driver Fitness 24.2%
Controlled Substances and Alcohol 81.5%
Moreover, Controlled Substances and Alcohol was one of only two BASICs52 in which
crash rates for carriers with Severe Violations exceeded crash rates for carriers with
above threshold percentile scores. In the case of the Controlled Substances and
Alcohol BASIC, the crash rates for carriers with Severe Violations were more than twice
as high. Given the large number of carriers with a Severe Violation in that BASIC, it is
clear why ATRI found Above Threshold carriers to suddenly have higher crash rates
than below threshold carriers once Severe Violators were included in the analysis.
51
For all other BASICs, this figure was between approximately 50 to 60 percent 52
The other was Driver Fitness

Compliance, Safety, Accountability: Analyzing the Relationship of Scores to Crash Risk – October 2012 40
In conclusion, the Controlled Substances and Alcohol BASIC has the fewest percentile
scores issued and the greatest number of Severe Violations. What ATRI discovered is
that Severe Violations are better indicators of crash risk in this BASIC than is the
methodology for calculating percentile scores. Similar to the Driver Fitness BASIC, it is
likely that FMCSA’s severity weighting methodology places too much weight on safety-
unrelated violations and too little weight on safety-critical violations.
Overall, findings show that, in the Controlled Substances and Alcohol BASIC, carriers
“below threshold” (Group 1) have higher crash rates than carriers “above threshold due
to percentile scores” (Group 2). Meanwhile, carriers “above threshold due to a Severe
Violation” have markedly higher crash rates than both Groups 1 and 2. This is why
carriers with an “Alert” (which includes carriers with a Severe Violation OR a high
percentile score) have higher crash rates than carriers with a score below threshold.

October 2012
Compliance, Safety, Accountability: Analyzing the Relationship of
Scores to Crash Risk