complex queries in businessobjects
DESCRIPTION
BusinessObjectsTRANSCRIPT

Complex Queries in BusinessObjects

2 Complex Queries in BusinessObjects
Appropriate Use And Security Of Confidential And Sensitive Information Due to the integrated nature of the various Human Resources, Finance and Student modules in Banner and the reporting information in the Enterprise Data Warehouse (EDW), you may have access to information beyond what you need to perform your assigned duties. Your access to Banner and the EDW has been granted based on business need, and it is your responsibility to ensure the information you access is used appropriately. Here are some reminders of good data stewardship to help you carry out your responsibility: • Do not share your passwords or store them in an unsecured manner. Do not leave
your workstation unattended while logged on to administrative information systems. You are responsible for any activity that occurs using your logon id.
• Do not share confidential and sensitive information with anyone, including colleagues, unless there is a business reason.
• Retrieve printed reports quickly, and do not leave the reports lying around in plain view.
• Secure reports containing confidential and sensitive information (e.g., FERPA, EEO or HIPAA protected data).
• When disposing of reports containing confidential or sensitive information, shred the documents in a timely manner.
Your responsibilities regarding the protection and security of administrative information are outlined in the University of Illinois Information Security Policy posted at http://www.obfs.uillinois.edu/manual/central_p/sec19-5.htm. Any violation could subject you to disciplinary action, which could include dismissal or, in those cases where laws have been broken, legal action. You should have signed a compliance form that indicates you have read, understand and agree to comply with the University's Information Security Policy for Administrative Information. If you have not already signed the compliance form, please see your Unit Security Contact, who is responsible for maintaining these forms.
File: e:\trainingdevelopment\businessobjects\businessobjects6 - complex queries\complex queries in businessobjects v3.doc Last Printed: 3/14/2006 8:47 AM

Complex Queries in BusinessObjects 3
Complex Queries in BusinessObjects
Table of Contents Appropriate Use And Security Of Confidential And Sensitive Information............................................ 2
About this Course........................................................................................................................................ 5 Objective............................................................................................................................................ 5 Instructor Led Course ........................................................................................................................ 5 Training Data ..................................................................................................................................... 5 Practice.............................................................................................................................................. 5 Files ................................................................................................................................................... 5 Demos ............................................................................................................................................... 5
Chapter 1..................................................................................................................................................... 7 Formulas and Variables ....................................................................................................................... 7
Formulas............................................................................................................................................ 7 Resetting the RunningSum ...............................................................................................................10
Variables .............................................................................................................................................10 Creating a Variable ...........................................................................................................................10 Exercise 1 – Formulas and Variables ...............................................................................................13
Chapter 2....................................................................................................................................................15 Grouping Values .................................................................................................................................15
Using the Group Option ....................................................................................................................15 Using the Groups..............................................................................................................................18 Exercise 2 – Grouping Values ..........................................................................................................19
Chapter 3....................................................................................................................................................21 Grouping Measure Objects .................................................................................................................21
Sales Grouping .................................................................................................................................21 Exercise 3 – Grouping Measure Objects ..........................................................................................24
Chapter 4....................................................................................................................................................25 Calculation Contexts ...........................................................................................................................25
Input and Output Contexts ................................................................................................................25 Calculation Context Operators..........................................................................................................25 Calculation Context Keywords ..........................................................................................................26 Calculation Context Example............................................................................................................26 Viewing Calculation Contexts ...........................................................................................................27 Changing the Calculation Context.....................................................................................................28 Exercise 4 – Calculation Contexts ....................................................................................................29
Chapter 5....................................................................................................................................................31 Subqueries ..........................................................................................................................................31
Multiple Data Providers.....................................................................................................................32 Verifying the Results .........................................................................................................................33 Managing Data Providers .................................................................................................................35 Renaming Data Providers.................................................................................................................35 Purging vs Deleting a Data Provider .................................................................................................36 Exercise 5 – Subqueries ...................................................................................................................38
Chapter 6....................................................................................................................................................39 Using Personal Data Files...................................................................................................................39
File Types Available..........................................................................................................................39 Options with .XLS Files.....................................................................................................................39 Creating a Report from an XLS File ..................................................................................................39 Options with Text Files......................................................................................................................41 Create a table from a .CSV personal data file...................................................................................41 Create a Second Data Provider ........................................................................................................43 Exercise 6 – Using Personal Data Files............................................................................................46
Chapter 7....................................................................................................................................................47 Combining Data from Different Data Providers ...................................................................................47
Linking Data Providers......................................................................................................................47 Incompatible Objects ........................................................................................................................48 Combining Data in the Table ............................................................................................................49 Exercise 7 – Combining Data from Different Sources.......................................................................51
Appendix A –Review Answers....................................................................................................................53

4 Complex Queries in BusinessObjects
Appendix B.................................................................................................................................................55 User Objects .......................................................................................................................................55
User Objects .....................................................................................................................................55 Creating a User Object .....................................................................................................................56 Using a User Object..........................................................................................................................59 Removing a User Object...................................................................................................................60
Appendix C – Combined Queries...............................................................................................................61 Combined Queries............................................................................................................................61 Restrictions.......................................................................................................................................61 Building a Combined Query..............................................................................................................61
Appendix D –Using an XML Data Provider ................................................................................................63 Appendix E – ASCII character codes .........................................................................................................67

Complex Queries in BusinessObjects 5
About this Course Objective The objective of this course is to teach the advanced functionality of the BusinessObjects editor for creating complex reports from the Enterprise Data Warehouse. Instructor Led Course This course is presented in a computer lab with an instructor. The instructor presents the information by completing the examples in each chapter on the screen. The students in the class follow by doing the same steps as the instructor. At the end of each chapter the students complete an exercise, which is similar to the example. Training Data Two generic universe/databases are used in the course. The eFashion universe is used for all the examples. This universe is very small and easy to use. The EDW R&A Training universe is used for all the exercises. While this is still generic data, it is more like the production universes. The data was used as test data for Recruiting and Admissions. Practice To repeat the examples and exercises on your own, you can use “play” accounts which have access to the training data. These accounts have the same access as the accounts used during the class. The play accounts are: dsplay1, dsplay2, …, dsplay10. The password for all these accounts is 1234. Files Completed versions of the examples an exercises are available in a zip file at the following location: http://www.ds.uillinois.edu/training/complex_files.zip Demos For a list of demos on a variety of topics related to using the BusinessObjects editor see: http://www.ds.uillinois.edu/how_to.asp

6 Complex Queries in BusinessObjects

Chapter 1: 7
Chapter 1 Formulas and Variables BusinessObjects allows you to create formulas and variables to manipulate the data after it has been retrieved from the database. You can do projections, change the format of the data, combine objects, or anything else you can think of. While user objects operate at the database level through the SQL query, formulas and variables act on data that has already been retrieved and stored in a data provider. Formulas and variables are stored in the document where they are created. They are available to any user of the document and can be refreshed or edited. Formulas Formulas are unnamed, which can cause some confusion when there are many formulas within one report or document. If a formula is changed, the previous version of the formula is kept and the new version of the formula is added. These unused versions should be removed to prevent them from slowing the display of the report. Formula Rules There is certain syntax that needs to be followed when entering a formula: • Must begin with an equal sign (=). Without an = the formula is displayed as a
constant or text. • Variables included in formulas must be enclosed in a less than (<) and a greater
than sign (>). For example: <Sales revenue>. • Text included in formulas must be enclosed in double-quotes (“”). Creating and Entering a Formula There are three methods to create a formula: • enter a formula directly into the cell • enter a formula into the Formula Bar • use the Formula Editor In the next example we will use the Formula Editor to enter a formula showing the running total of Sales Revenue from month to month.
1. Create a standard report using the e-Fashion universe.
2. Add the following objects: Store name Month Name Sales revenue
3. Run the query.
4. Create sections for each Store name value.
5. Add a custom sort on Month Name in chronological order.

8 • Complex Queries in BusinessObjects
The report should look like:
6. f the Sales Revenue column. Insert a column to the right o
7. Click on a cell in the newly inserted column.
8. Click the Formula Editor button in the Formula toolbar.
The Formula Editor will appear.

Chapter 1: 9
The Formula Editor is very similar to user object editor and the variable editor, except the Formula Editor does not have a Definition tab. A formula remains unnamed and so has no need for a Definition tab.
9. Click the + to display the Aggregates functions.
10. Double-click the RunningSum function.
Notice that when the RunningSum() is added to the formula, the cursor is placed in the location for the first argument.
11. Double-click Sales revenue to insert it as the first argument.
12. Click the OK button to close the Formula Editor.
The values for the running sum of Sales revenue are added to the blank column.

10 • Complex Queries in BusinessObjects
There is no text in the column heading because the formula has no name associated with it.
13. Double-click the column heading for the last column.
14. Enter Total.
Resetting the RunningSum The value for RunningSum needs to be reset to zero for each store. Otherwise value for January of the second store is added to the sales of the first store.
1. Click on any value in the Total column.
2. In the Formula Bar, change the formula to: =RunningSum(<Sales revenue>;<Store name>)
This tells the function to reset the value to zero when there is a change in the value of the Store name object
Variables A variable is a named formula. They can be used in the same way as variables in the data provider. Variables are stored in the document . Variables have some advantages over formulas. • You can use variables in alerters, filters, sorts, breaks, master/detail reports, and in
drill hierarchies. • Since a variable has a unique name, they are easier to work with. • Variables can be used in other formulas. So, a complex formula can be simplified
by using variables to create the formula in pieces. • If the formula for a variable is changed, the original is updated and there is still only
one copy of the variable. Creating a Variable Creating a variable is a very similar process to that of creating a formula. The major difference between the two is that the Variable Editor has a Definition tab, where the name and variable type are specified. We will create a variable that concatenates the Address, City, State, and Zip Code variables into one variable named Location.
1. Edit the data provider and add the following objects:
Address City State Zip Code 2. Run the query.
3. Select Data Variables….
The Variables window will appear.
4. Click the Add… button to bring up the Variable Editor.

Chapter 1: 11
5. Select the Definition tab.
6. Name the new variable Location.
7. Select Dimension as the qualification type.
8. Select the Formula tab
9. Enter the following formula: =<Address> & Char(13) & <City> & ", " & <State> & " " & <Zip Code>
Note: The Char(13) is a carriage return character. This forces the value for City to start on a second line.
10. Click OK to save the new variable named Location.
The new variable will now appear in the Variables window:
11. Click the Close button to close the Variables dialog box.
12. Drag and drop Location to the right of the Store name.
The report should look like:

12 • Complex Queries in BusinessObjects
Sections were created for the Location variable.
13. Drag and drop the cell for the Location variable to the right of the Store name cell.
Because the Location variable is being moved into another section you will be asked whether you want to remove the section for Location.
14. Click the Yes button to remove the sections for Location.
15. Resize the cell to handle the widest text and two lines.
16. Remove the columns for Address, City, State, and Zip Code.
The report should look like:

Chapter 1: 13
Exercise 1 – Formulas and Variables Note: • Answers to all Reviews questions are provided in Appendix A. Review 1. A variable can be used in many ways that a formula cannot: True or False? 2. A formula is not sharable among different users: True or False? Exercise Create a report using the EDW R&A Training universe. Objects: First Name, Middle Name, Last Name, Degree1 Name, ACT Composite Score Conditions: (Predefined) Springfield. Add a variable, Full Name, which concatenates First Name, Middle Name and Last Name. Add the Full Name variable to the table and remove First Name, Middle Name, and Last Name.
Note: If a student does not have a middle name, it is stored as one space. The Full Name variable will then have three spaces between the first and last names. This is ok for this exercise. In the next exercise you will fix the problem with the extra spaces.
Save the document as CQ Exercise 1. This will be used in the next exercise. Completed Exercise

14 • Complex Queries in BusinessObjects

Chapter 2: 15
Chapter 2 Grouping Values Sometimes you will want to create new variables by grouping distinct values or a range of values of existing variables for analysis purposes. There are two methods to accomplish this within BusinessObjects : • Use the Group option to group values of dimension or detail objects. • Use If…Then…Else logic to group values of any objects. The Group option is easier to use than If…Then…Else, but it can be used only with dimension or detail variables. Using the Group Option To see how the Group option works, we will create a column called Region by grouping states into regions. We can then see the sales revenue for each region.
1. Create a standard report using the e-Fashion universe.
2. Add the following objects: State Store name Sales Revenue
3. Create a condition of Year Equal to 2001
4. Run the query.
5. Select the State column.
6. Click the down arrow for the structure button in the Report toolbar.
7. Click the Insert Column Before button from the menu.
8. Right-click on the new blank column
9. Select Variables… from the pop-up menu.
The Variables window appears.

16 • Complex Queries in BusinessObjects
10. Select the State object in the Variables window.
11. Click the Group button.
The Create a New Variable from State dialog box appears.
12. Enter the name Region in the Name of the Variable text box.
First, we will group the states that will go into the East region. The states will be groups in the following categories: East Central West DC Colorado California Florida Illinois Massachusetts Texas New York
13. Click the New button to create a new group.
14. Enter East to rename the group.
15. While holding down the CTRL key, click on each state that will be included in the East region,
16. Click the Add button to add them to the East folder.

Chapter 2: 17
The dialog box should now look like:
17. Repeat steps to create groups for Central and West.
The dialog box should now look like:
18. Click OK.
19. On the Variables window, click Insert and the new grouped field will be inserted into the selected empty column.

18 • Complex Queries in BusinessObjects
Note: Groups can also be created by selecting values within a column and then clicking
the Group Values button in the Report toolbar.
Using the Groups he Region column.
e Sales Revenue column to complete the
ort should look like:
3. Save the document as Grouping.rep.
1. Apply a break on t
2. Add Sum and Count calculations to threport.
The rep
4. Close the document.

Chapter 2: 19
Exercise 2 – Grouping Values Note: • Answers to all Reviews questions are provided in Appendix A. Review 1. The Group function works only with which Object types?
Exercise Create a report using the EDW R&A Training universe. Objects: Last Name, First Name, Decision Desc Conditions: (Predefined) Chicago Create a variable named Attending with the values of Yes, No, and Unknown according to the values of Decision Desc as shown below.
Yes No Unknown Admit Admission Rescinded Wait List Admit – Applicant Accepts Applicant Rejects Offer Admit – Limited Status Deny Admit/Accept Limited Status SI/GPA too low for transfer Applicant Accepts Offer
Save the document as CQ Exercise 2. Completed Exercise

20 • Complex Queries in BusinessObjects

Chapter 3: 21
Chapter 3 Grouping Measure Objects When possible, it’s easier to use the Group option discussed above to group values. But, the group option is not available for measure objects. So, for measure objects it’s necessary to create a new variable and use If…Then…Else code in its formula.
1. Open the document Grouping.rep.
2. Click any value in the Region column.
3. Select Data Edit Formula….
The formulas for the Region variable is displayed: = If (<State> InList( "DC" , "Florida" , "Massachussetts" , "New York") ) Then("East") Else If (<State> InList( "Colorado" , "Illinois" , "Texas") ) Then("Central") Else If (<State> InList( "California") ) Then("West") Else <State>
4. Click Cancel to close the Formula Editor.
Sales Grouping We will add a column indicating whether the sales are Low, Medium or High based on the following:
Low: $0 – $999,9999 Medium: $1,000,000 - $1,499,999 High: $1,500,000 and above
1. Right-click in the Report Manager on an existing variable.
2. Select New Variable… from the pop-up menu.
The Variable Editor window will appear.

22 • Complex Queries in BusinessObjects
3. On the Definition tab enter the name of Revenue Group.
4. Click the Formula tab.
5. Enter the following formula:
= If (<Sales revenue> < 1000000) Then "Low” Else If (<Sales revenue> < 1500000) Then "Medium" Else "High" The If statement will continue through the conditions until it finds a condition that is true. So, if the value for Sales revenue is not less than 1 million it will continue to the next condition and check if the Sales revenue value is less than 1.5 million. If both conditions are false it will continue to the Else, which always “true”, and assign the value “High”.
6. Click OK.
The Revenue Group variable should appear in the Variables list.

Chapter 3: 23
7. Add the Revenue Group as a new column to the right of Sales revenue.
Your report should now look like:
8. Close the report and save the changes.

24 • Complex Queries in BusinessObjects
Exercise 3 – Grouping Measure Objects Note: • Answers to all Reviews questions are provided in Appendix A. Review 1. To group Measure Objects you must use If…Then…Else code: True or False?
Exercises Open the CQ Exercise 1 document.
1. Add a variable named ACT Group with values based on the ACT Composite Score as follows:
Good < 25 Better < 30 Best >= 30
2. Edit the formula for the Full Name variable. Remove the extra spaces if the Middle Name is equal to a space.
Save the changes as CQ Exercise 3. Completed Exercise

Chapter 4: 25
Chapter 4 Calculation Contexts By default, BusinessObjects determines the result of a measure based on the dimensions in the part of the report in which the measure is inserted. These sets of dimensions are called calculation contexts. For example, the tables below all include the Sales revenue object, but the values displayed are different due to the context of the table.
Input and Output Contexts Calculation contexts are determined by both input and output contexts. • Input context determine what dimensions go into the calculation to produce values.
The calculation produces values based on the input context. • Output context determine how the values of the calculation are combined. It is
governed by the cell location within the report. Calculation Context Operators When creating a calculation context there are operators and keywords that are available to create formulas and variables. Definitions for context operators are: ForAll Specifies the dimensions you want to include in the calculation.
Syntax: measure ForAll dimensions Example: <Sales revenue>/(<Sales revenue> ForAll <State>) Divides the sales revenue by the revenue generated by all states.
ForEach Adds a dimension to the calculation environment.
Syntax: measure ForEach dimensions Example: Max(<Sales revenue> ForEach <Year>) Returns the maximum annual revenue, for example for each store in the report.

26 • Complex Queries in BusinessObjects
In Uses a keyword to define the calculation environment (syntax 2 below), or specifies the dimensions included in the calculation environment (syntax 1 below).
Syntax 1: measure In dimensions Example: <Sales revenue> In (<State>,<City>) The revenue for state and city. Syntax 2: measure In keyword Example: In (<State>) The revenue for the state.
Calculation Context Keywords Keywords available for creating formulas are: • Body: Corresponds to dimensions in the current block and dimensions in the
current section. It can be used inside the block for dimensions in the current block, and outside the block for dimensions in the current section.
• Block: Corresponds to dimensions in the current section. It can be used for dimensions inside the current block.
• Report: Corresponds to all dimensions in the document. It can be used for dimensions anywhere in the report.
• CurrentPage: Corresponds to all dimensions in the current page. It can be used for dimensions inside the current page.
Calculation Context Example Let’s look at an example of calculation contexts.
1. Open the CQ Calculation Context Example document in the Complex folder.
The report should look like:

Chapter 4: 27
2. Add a Sum calculation to Sales revenue.
3. Select the cell with the sum value.
4. Press Ctrl+c to copy the contents of the cell.
5. Paste the cell contents into the 1999 California Sales cell.
The value should be the same as at the bottom of the table because the output context has not changed. The cell is still within the Year and State sections.
6. Paste the cell contents into the 1999 Sales cell.
7. Paste the cell contents into the Total Sales for all years cell.
The report should look like:
The values in the cells are different because of the output context. Next we will display the context.
Viewing Calculation Contexts One method to learn more about Calculation Context operators is to view existing formulas. There are two methods to view formulas:
Using the Formula Bar: 1. Click the cell containing the calculation.
2. Rest the cursor over the Formula Bar.
The extended syntax of the formula appears in a tooltip. Using the Define As Variable command: 1. Click the cell containing the calculation.
2. Select Data Define As Variable.
The Define as Variable dialog box will appear.
3. Click Evaluate the formula in its context.
The extended syntax of the formula will appear in the dialog box.

28 • Complex Queries in BusinessObjects
The extended syntax for the three Total Sales cells are, from top down: =Sum(<Sales revenue> In Body) In Report =Sum(<Sales revenue> In Body) In <Year> =Sum(<Sales revenue> In Body) In (<Year>, <State>)
Changing the Calculation Context 1. Copy the contents of the cell with the 1999 California Sales value ($1,704,211).
2. Paste the cell contents into the Percent of 1999 Sales cell.
3. Change the formula for the cell to: =Sum(<Sales revenue>) In (<Year> ,<State>) / Sum(<Sales revenue>) In (<Year>)
This divides the sum for the Year/State combination by the sum for the Year. The report should look like:
4. Copy and paste the formula into the Percent of Total Sales cell directly below.
5. Change the formula to: =<Sales revenue>/Sum(<Sales revenue>) In Report.
This divides the sales for the Year/State by the sales for all state for all years. The cell should now display 4.68%.
6. Copy and paste the formula into the Percent of Total Sales cell for the year.
This divides the sales for the Year by the sales for all state for all years. The cell should now display 22.25%. The finished report should look like:

Chapter 4: 29
Exercise 4 – Calculation Contexts Note: • Answers to all Review questions are provided in Appendix A. Review 1. The Output Context keyword for all values is ______________.
2. What are two methods for viewing Calculation Context formulas?
Exercises Create a standard report using the EDW R&A Training universe. Objects: Last Name, First Name, UIN, ACT Composite Score Conditions: (Predefined) Springfield Create a variable that calculates the average ACT score. Create an Alerter that displays red text for any ACT score less than the average score. Save the report as CQ Exercise 4
Completed Exercise

30 • Complex Queries in BusinessObjects

Chapter 5: 31
Chapter 5 Subqueries A subquery is a query within a query. The subquery usually returns a single column of data which is used in a condition of the main query. The subquery uses the same data source. Subqueries are created using operand options with a condition. Depending on the operator used in the condition, you will see one or both operand options: Create a subquery (ALL) This operand compares the object with all the values returned by the subquery. For example: Sales revenue Greater than (all items of the query 1.1). Create a subquery (ANY) This operand compares the object with any values returned by the subquery. For example: Sales revenue Equal to (one item of the query 1.1). Let’s create a report that requires a subquery. We want the stores that sold at least 100 of a particular item in the month of June, 2000. The stores must have also sold at least 1000 of these items for the year. We can’t do this with one query because there are different time periods and different amounts for the number sold.
1. Create the following query with: City Store name Quantity sold
2. Create the following conditions: Year Equal to 2000 Month Equal to 6 SKU desc Equal to ‘E-Watch’ Quantity sold Greater than or equal to 100
3. Add a new condition for the Store name object.
4. Select Equal to for the operator.
5. Select Create a subquery (ANY) for the operand.
A new query tab appears, Subquery 1.1.
The subquery needs to produce the list of Store names that sold at least 1000 of theses watches for the year 2000.
6. Add Store name in the results of the subquery.
7. Add the following conditions: Year Equal to 2000 SKU desc Equal to ‘E-Watch’ Quantity sold Greater than or equal to 1000

32 • Complex Queries in BusinessObjects
The table should look like:
query 1.1 returns the list of stores that had sales of at least $1 million
• query returned in the stores that sold at least 100 E-Watches in June
ultiple Data Providers
esults of running a query. This data is then used to create
ou don’t have to create a new document every time you want to see new data in a to
The subquery should look like:
8. Run the query.
To review: • The Sub
in 2000. The main2000 as long as the store was in the list produced by the subquery.
MA data provider contains the rreports. Building a data provider when you create a new document is a typical way of using BusinessObjects. You create the document in order to see your data - and to do that, you have to build a data provider to access data from a data source. Yreport. You can add data providers to existing documents. This feature enables youcombine data from different sources in the same report.

Chapter 5: 33
Document 1A document can contain multiple data providers and multiple reports. Each report can contain blocks that pull data from one or more data providers, or combine data from different data providers in the same block. Data
Provider 1
Report 2
Report 3
Report 1
Data Provider 2
The figure to the right shows a document with two data providers and three reports. Report 1 has a single table with data from Data Provider 1. Report 2 has two blocks with data from different data providers. Report 3 has one block, which combines data from two different data providers. Verifying the Results Although it’s not necessary we will display additional tables to verify the results we obtained are correct.
1. Click the Insert Table button in the Report toolbar
2. Click below the existing table to place the upper-left corner of the new table.
The New Table Wizard starts.
3. Select Use an existing query to build a new one from the list.

34 • Complex Queries in BusinessObjects
n list (query 1.1)
sold at least 100 E-Watches in June, 2000
7. Insert Table
4. Select the first query from the list.
5. Delete the condition: Store name I
6. Run the query.
The second table displays the stores thatregardless of the sales for the year. Note there is an additional store, Colorado Springs.
Click the button in the Report toolbar
erse currently in use from the list.
’ 12.
8. Click to the right of the bottom table.
9. Select Build a new query on the univ
10. Add the Store name and Quantity sold objects to the Result Objects.
11. Add the following conditions: Year Equal to 2000 SKU desc Equal to ‘E-Watch Run the query.

Chapter 5: 35
13. Sort the new table by Quantity sold in descending order.
The bottom table shows the number of e-Watches sold in 2000. As you can see, Colorado Springs did not sell at least 1000.
Managing Data Providers You can manage the data providers in BusinessObjects documents in the following ways: • Rename data providers • Get statistics such as the date and time a data provider was last refreshed, and how
many rows of data were returned • Empty data providers of their data (called purging) • Delete data providers you no longer need
Renaming Data Providers BusinessObjects assigns names to all data providers. The names of the data provider can be changed using the Definition tab of the View Data dialog box. Renaming data providers is by no means required. You can work with the default names of the data providers. If objects with the same name exist in multiple data providers, the name of the data provider is added to the object name. For example, Sales revenue (Query 2 with EFASHION). We will rename the data providers to make them easier to work with.

36 • Complex Queries in BusinessObjects
1. Select the View Data button in the Standard toolbar.
The Data Manager appears. 2. Click the Query 1 with EFASHION data provider from the list on the left.
3. Click the Definition tab.
4. Type the new name, Bonus Stores, in the Name box. Don’t press Enter.
5. Click Query 2 with EFASHION.
6. Change the name to June Sales.
7. Click Query 3 with EFASHION.
8. Change the name to 2000 Sales.
9. Click the OK button.
Purging vs Deleting a Data Provider What’s the difference between purging and deleting a data provider? Purging removes the data, but keeps the structure. Deleting removes the data and the structure - an action which cannot be undone. So, why purge or delete a data provider? If you want to share the report with other users who have different security access, you can purge the data before sending the document. Purging also reduces the size of a document, so is saves disk space. You can populate a purged data provider by selecting the Refresh Data command on the Data menu. This command refreshes all the data providers in the document. You should only delete a data provider, however, if you are certain it is no longer needed. We don’t need the last two data providers, June Sales and 2000 Sales. We will delete them from the document.
1. Select View Data.
2. Click the 2000 Sales data provider.
3. Click the Delete button.
4. Click Yes in the confirmation box that appears
5. Delete the June Sales data provider in the same way.
6. Click OK to close the Data Manager.
The bottom two tables will now be empty since the data providers used to create the tables have been deleted.

Chapter 5: 37
7. Delete the two empty cells.
8. Save the document as Subquery.rep.

38 • Complex Queries in BusinessObjects
Exercise 5 – Subqueries Note: • Answers to all Reviews/Exercises are provided in Appendix A. Review 1. A subquery can use a different data source. True or False?
2. A _____________________ is the data returned by running a query.
3. Can there be multiple data providers in the same document?
Exercises Create a table with all applicants to the Chicago campus that have applied to both the colleges of Liberal Arts and Sciences and Business Administration. The table should include the applicant’s UIN, First Name, and Last Name.
Save the report as CQ Exercise 5
Completed Exercise

Chapter 6: 39
Chapter 6 Using Personal Data Files Personal data files can be used as a source for a data provider. This enables you to access data in text files, Excel spreadsheets, dBase files, and XML files. Using personal data files allows you to use BusinessObjects to create reports from departmental data, or combine that data with data from the EDW. Creating a report from a personal data file is a two-stage procedure. First you specify the personal data file you want to use for the report and then you set the options for the type of file selected. File Types Available The types of files that can be used as a personal data file are: • Microsoft Excel spreadsheet (*.xls) • DBASE files (*.dbf) • Text files (*.txt, *.asc, *.prn, *.csv) • XML files (*.xml) Options with .XLS Files First Row Contains Column Names This option indicates the file’s first row of data contains the names to be used as column headings in the BusinessObjects report. Sheet Name This option lists the worksheets in the file you selected, and lets you select the worksheet to import. Field Selection This option lets you select the fields from the spreadsheet to be included in the report. You have the following options: • All Fields
Retrieves all the data from the worksheet. • Range Definition
Retrieves the data from specified range of cells (e.g. A1:Z20) • Range Name
Retrieves the data from a named range defined in the worksheet. Creating a Report from an XLS File The xls file used in this example contains data about a resort’s customers.
1. Select the New Report Wizard button on the Standard toolbar.
2. Choose to Generate a standard report.

40 • Complex Queries in BusinessObjects
3. Select Others on the Specify Data Access screen.
The Access Personal Data window is displayed.
4. Select Microsoft Excel 97 Files (*.xls) from the Format listbox.
Note: The Microsoft Excel Files format is for Excel 95 files.
5. Click the Browse button.
6. Select Customers.xls from the files in the Complex folder.
7. Check the checkbox for First row contains column names.
8. Click the Run button.
The report based on the data from the Customers.xls file will be displayed.
9. Close the document without saving the changes.

Chapter 7: 41
Options with Text Files The text file option includes four types of files: asc, prn, txt, and csv. The file type determines the delimiter used in the file. You can also use the Delimiter option to indicate the character used to delimit the data in the file. The default settings per file type are as follows:
Tabulation: tab (.txt) Space: space (.prn) Character: semi-colon (.csv) | (.asc)
Create a table from a .CSV personal data file 1. Select the New Report Wizard button in the Standard toolbar.
2. Choose to Generate a standard report.
3. Select Others on the Specify Data Access screen.
The Access Personal Data window is displayed.
4. Make sure Text Files (*.asc, *.prn, *.txt, *.csv) is selected as the format.
5. Click on the Browse button.
6. Select Recall List.csv from the Complex folder.
7. Check the checkbox for First row contains column names.
8. Click on the View button.

42 • Complex Queries in BusinessObjects
The data file is read and then the Data Manager dialog box is displayed.
9. Click on the SKU variable in the Data Providers panel on the left.
10. Select the Definition tab.
11. Click on the Dimension radio button to change the SKU object’s qualification to dimension.
12. Click on the OK button to close the Data Manager dialog box.
The data from the Recall List.csv file will be displayed in a table.

Chapter 7: 43
13. Adjust the column widths.
14. Remove the decimal places from the SKU column.
Create a Second Data Provider We will now add data from the eFashion universe as a second data provider in the same document. We will create a condition that limits the products in the second query to just the ones in the results of the first query.
1. Click the Insert Table button on the Report toolbar.
2. Click to the right of the existing table to establish the location of the upper-left corner of the new table.
The New Table Wizard will display.
3. Select the Access new data in a different way option and click Begin.
4. Click the Next button to use a Universe as the data source.

44 • Complex Queries in BusinessObjects
5. Select the eFashion universe from the list and click the Finish button.
6. Select the following objects in the order shown:
Store name SKU number SKU desc Quantity sold 7. Create the following conditions:
Year equal to ‘2001’ 8. Drag the SKU number object to the conditions panel to create a new condition.
9. Select In list as the operator.
10. Select Select Query Results as the operand.
The List of Data Providers is displayed. From the list you want to select the query and object that contains the values you want.
11. Click the + to expand the query.
12. Click the SKU object.
13. Click OK to close the dialog box.
The new condition should look like:

Chapter 7: 45
Note: This condition has a limit of 1000 items in the list.
14. Click the Run button.
The new table is displayed. This table contains the data from the universe, but only for the items in the list in the CSV file.
The objects for the second data provider will be added to the variables list. When there are multiple data providers in the document, it is usually better to display the variable list divided by data provider.
15. Click the By Data Provider radio button at the bottom of the Report Manager.
Now the variables are listed by data provider.
16. Save the document as Recall.rep.
17. Close the document.

46 • Complex Queries in BusinessObjects
rsonal Data Files
universe. age 53.
vn Access database be used as personal data files?
xercise ble with the information from the csv file: Problem Applicants.csv. Add a
e document as CQ Exercise 6.rep.
ompleted Exercise
Exercise 6 – Using PeNote:
exercises use the EDW R&A Training• All• Answers Reviews questions are provided, starting on p
Re iew
1. Can a
ECreate a tasecond table with the following data from the EDW R&A Training universe for the applicants listed in the first table. UIN
Name FirstLast Name City
State
ave thS C

Chapter 7: 47
Chapter 7 Combining Data from Different Data Providers We will now combine data from two data providers in the same table. The source for the first data provider is a CSV file in the userDocs folder named Recall List.csv. This file contains the SKU numbers and associated problems of the items being recalled by the eFashion stores. Linking Data Providers Linking data providers enables data from different data providers to be combined in a table, crosstab, or chart. Dimension objects from one data provider are linked to dimension objects that contain the same values in a different data provider. BusinessObjects then finds the corresponding rows from the two data providers Only dimension objects can be linked. In this example, the SKU object in the first data provider must be linked to the corresponding object in the second data provider.
1. Open the Recall.rep document.
2. Delete the table on the left with the data from the csv file.
3. Move the remaining table to the left margin.
4. Click the View Data button in the Standard toolbar.
5. Click on the + next to each data provider to expand the lists of objects for each.
The SKU object for the first data provider is a measure. We have to change this to a dimension object so it can be linked to the SKU number object in the second data provider.
6. Select the SKU object in the first data provider.
7. Click the Definition tab.
8. Change the Qualification for the variable to Dimension.
9. Click on the Link to… button.
10. Select the SKU number object from the second data provider.
11. Click the OK button to close the View Data dialog box.
Arrows, , indicating the link will appear in the data provider list.

48 • Complex Queries in BusinessObjects
12. Click OK to close the View Data dialog box.
Incompatible Objects There is one very important rule about combining data from different data provider in the same table. There can only be unlinked dimension objects from one data provider. If there are dimension objects from both data providers that you want in the table, but these objects are not linked, they cannot be appear in the table at the same time.
1. Click on the Problem object in the first data provider.
Notice the SKU desc and Store name objects in the second data provider are grayed out. This means these are “incompatible objects”. The Problem object is an unlinked dimension object. SKU desc and Store name are also unlinked dimension objects. They cannot appear in the table at the same time. To get around this restriction we will create a detail variable that contains the same data as Problem. Since we want two unlinked dimension objects from the second data provider and only one from the first data provider, it’s easier to create one variable for the Problem object rather than two variables for SKU desc and Store name.
2. Right-click on the Problem variable in the Report Manager.
3. Select New Variable… from the pop-up menu.
4. Enter Problem desc as the name of the new variable.
5. Change the Qualification to Detail.
6. For the Associated Dimension, select SKU.
The detail variable must me associated to a linked dimension object.

Chapter 7: 49
7. Select the Formula tab.
8. Double-click the Problem object to enter it into the formula.
This means the new variable will have the same data as the Problem object. But, because it is a detail variable it can be added to the table while the Problem object cannot.
9. Click OK to close the Variable Editor.
Combining Data in the Table 1. Drag and drop the Problem desc variable onto the table between SKU desc and
Quantity sold.
Problem desc can be added to the table because it is not an unlinked dimension object.

50 • Complex Queries in BusinessObjects
The table should now look like:
2. Close the document and save the changes.

Chapter 7: 51
Exercise 7 – Combining Data from Different Sources Note: • All exercises use the EDW R&A Training universe. • Answers Reviews questions are provided, starting on page 53.
Review 1. What has to be done to combine data from different data providers into the same
table?
2. What type of objects can be linked?
3. What are “incompatible objects”?
Exercise Open the CQ Exercise 6.rep document. Combing the data from both data providers into one table. Completed Exercise

52 • Complex Queries in BusinessObjects

Appendix A: 53
Appendix A –Review Answers Exercise 1 – Formulas and Variables 1. A variable can be used in many ways that a formula cannot:
True 2. A formula is not sharable among different users:
False, a formula is stored in the document and is available to any user. Exercise 2 – Grouping Values 1. The Group function works only with what Object types?
Dimension and Detail Exercise 3 – Grouping Measure Objects 1. To group Measure Objects together you must use If…Then…Else code:
True Exercise 4 – Calculation Contexts 1. The Output Context keyword for all values is In Report.
2. What are two methods for viewing Calculation Context formulas? The tool tip in the Formula Bar or Data Define as Variable
Exercise 5 – Subqueries 1. A subquery can use a different data source.
False 2. A data provider is the data returned by running a query.
3. Can there be multiple data providers in the same document? Yes
Exercise 6 – Using Personal Data Files 1. Can an Access database be used as personal data files?
No, only “flat” files can be used as personal data files (asc,prn,txt,csv,xls,dbf,xml)
Exercise 7 – Combining Data from Different Sources 1. What has to be done to combine data from different data providers into the same
table? One or more dimension objects must be linked.
2. What type of objects can be linked? Dimension
3. What are “incompatible objects”? Unlinked dimension objects from different data providers. They cannot be included in the same table. The work-around is to create a Detail variable with the same data.


Appendix B: 55
Appendix B User Objects It is often necessary for a report developer to add data to a report that is not present in the universe. BusinessObjects provides three ways to add data to the report: • User Objects • Formulas • Variables They all make use of the Formula window, and so may seem similar at first. But, there are some important differences. One major difference is that user objects are associated with a specific universe, while formulas and variables are associated with a single document. Also, formulas and variables are stored in the document and are available to any user refreshing or modifying the document. User objects are stored on the author’s hard drive and are not available to other users. Another difference is that user objects are written in SQL code, but formulas and variables are written in BusinessObjects code. User Objects A user can create objects that appear to be part of the universe. These objects will appear in the User Objects class when the universe is displayed in the Query Panel. The user objects can be used in reports just like any other object in the universe. The advantage of user objects is that they don’t have to be recreated for each new document. User objects are personal objects that are not shared with other end-users. They are stored in a local file in the \Universe folder. The file will have the same name as the universe. User Objects Restrictions Some restrictions placed upon user objects are: • User objects are available only in the universe in which they were created. • User objects are not shared. Reports that include user objects can only be viewed
by other end-users. This is because user objects are stored locally in a user object definition file. Other end-users, who do not have the same user object definition file, are not able to access the user object definitions. If an end-user tries to refresh or edit a query that contains another user’s user objects, BusinessObjects removes the objects from the query and report. If a user object is meant to be widely shared, then we would recommend contacting Decision Support to inquire as to the possibility of having that user object added to the universe.

56 • Complex Queries in BusinessObjects
Creating a User Object There are two ways to create a user object: • using the User Objects button, , found on the toolbar of the Query Panel. • using the Tools Universes menu option. This method permits you to select the
universe the user object will be created for. Both methods display the User Object dialog box to create the formula for the user object. We will use the Tools menu to create our user object. We want to project next year’s revenue based on a 3% increase in sales. We will do that by adding a user object.
4. Click Tools Universes….
The Universes panel will appear, showing all universes to which you have access.
5. Select the eFashion universe.
6. Click the User Objects… button.
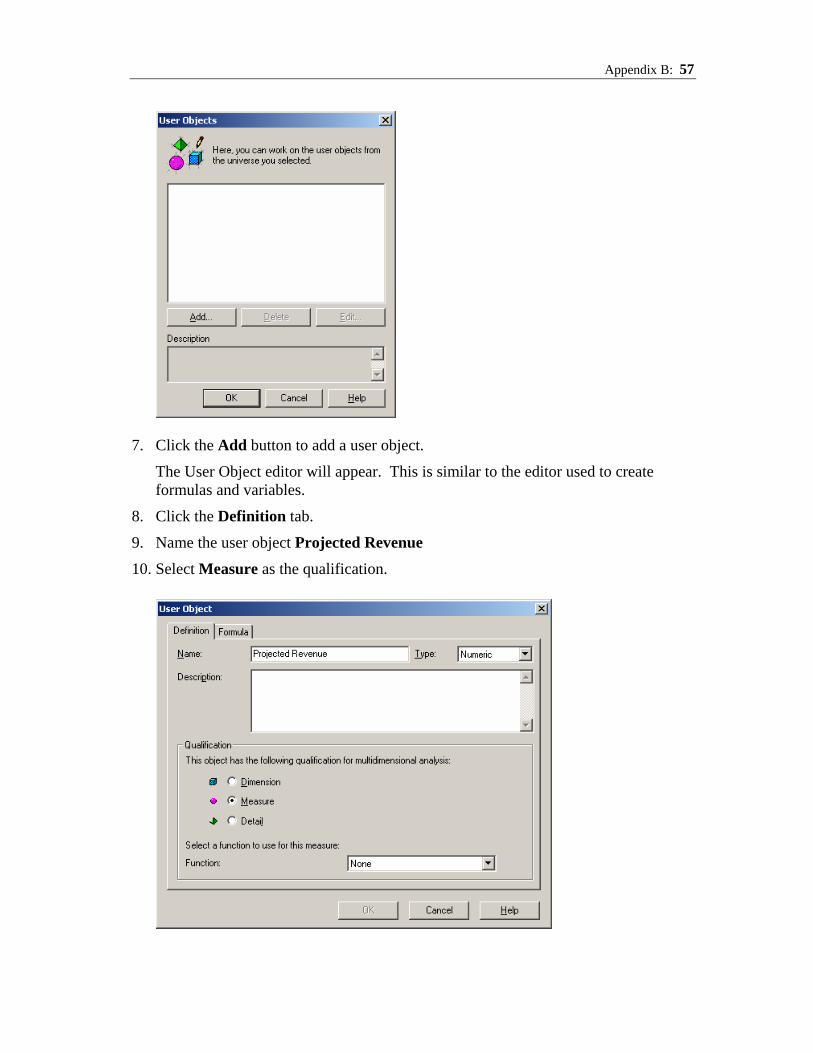
The User Objects panel will appear. Any existing user objects associated with the eFashion universe would appear in this window.
Appendix B: 57
7. Click the Add button to add a user object.
The User Object editor will appear. This is similar to the editor used to create formulas and variables.
8. Click the Definition tab.
9. Name the user object Projected Revenue
10. Select Measure as the qualification.

58 • Complex Queries in BusinessObjects
11. Select Sum as the function.
This means that when the values for the Projected Revenue object are aggregated due to the context of the report, the sum of the values will be used.
12. Click the Formula tab.
13. Click the Measures class to display the list of measure objects.
14. Double-click Sales revenue to add it to the formula.
At this point Measures\Sales revenue should appear in the top pane of the Formula tab.
15. Add the multiplication operator, *.
16. Enter 1.03 to the right of the * to calculate a 3% increase in sales revenue.
The completed formula will look like: Measures\Sales revenue *1.03
17. Click the Test button to check for syntax errors.
18. If there are no errors, click OK.
Projected Revenue will now appear in the User Objects window. (Insert Picture)
19. Click OK on the User Objects window to close it.
20. Click Close on the Universes window to close that window also.

Appendix B: 59
Using a User Object We will now use the newly created user object in a report.
1. Create a new document using the eFashion universe.
The User Objects class has been added at the bottom of the universe. The Projected Revenue object is now ready to be used along with permanent eFashion Universe objects.
2. Select the following objects:
Store name Sales Revenue Projected Revenue The Query Panel should look like:
3. Add the following condition to the Query Panel:
Year Equal to ‘2001’ 4. Run the query.

60 • Complex Queries in BusinessObjects
The table should look like:
5. Save the document as Projected Revenue.
6. Close the document.
Keep in mind, if you send this report to another user and that user tries to refresh or edit the query, the user object, Projected Revenue, will be removed from the query.
Removing a User Object 1. Click Tools Universes.
2. Select Universes….
The Universes dialog box will appear displaying a list of available universes.
3. Select the eFashion universe.
4. Click the User Objects button.
The User Objects window will appear with a list of current user objects associated with the eFashion universe.
5. Select the Projected Revenue object.
6. Click the Delete button, and confirm your action to delete the user object.

Appendix C: 61
Appendix C – Combined Queries Combined Queries Combined queries are very much like subqueries. Subqueries compare a single object with the results of the subquery. Combined queries compare the rows of one query with the rows of the other. You can display the union, intersection, or the difference of the two queries.
Union (default): includes the rows from both queries
Intersection: includes the rows common to both queries
Minus: includes the rows from the first query minus the rows from the second query
Restrictions The major restrictions in combining queries are: • the queries must contain the same number of objects • the objects must be of the same type (i.e. character, date, number) • there can be up to eight queries in a combined query • when using MINUS, the second query is subtracted from the first Building a Combined Query We will create a table containing the categories that were sold in the 2001 that weren’t sold in 2000. We will use a combined query to subtract the rows for 2000 from the rows for 2001.
1. Use the new document using the New Report Wizard and the e-Fashion universe.
2. Add Category object to the Result Objects.
3. Add the condition: Year Equal to 2001.
4. Click the Combine Queries button to add a second query.
A second query will appear with a ‘U’, for Union, between the tabs. The Results Objects panel is automatically populated with the Category object from Query 1.
5. Add a condition to this second query of Year Equal to 2000.
6. Right-click the Query 2 tab.
The pop-up menu of combined query types is displayed

62 • Complex Queries in BusinessObjects
7. Select Minus.
8. Run the query.
A table should appear with the two rows, Samples and Skirts, that are in the query results for 2001 but not in the results for 2000.

Appendix C: 63
Appendix D –Using an XML Data Provider Using an XML file as a Personal Data File is a little different than the other types. First you create an XML Filter and then use the filter to retrieve data from the file. When you build an XML filter you choose the elements in the XML file that you want to be available for inclusion in your report. To build a filter:
1. Use the New Report Wizard to create a new document.
2. Select to Generate a Standard Report.
3. Click the down arrow for the Others option.
4. Select XML Data Provider from the list.
The XML Filter list is displayed.
5. Click the New… button to create a new filter.

64 • Complex Queries in BusinessObjects
The XML Filter editor is displayed.
6. Click the Load button.
7. Open the My Documents\My Business Objects Documents\userDocs folder.
8. Select the Class Schedule.xml file.
The structure of the XML file is displayed in the Structure panel.

Appendix C: 65
The XML Query Panel is displayed.
Some XML elements do not contain data; they act as a container for other elements. DATA_RECORD is an example of such an element in this file. It is not meaningful to include such elements in a report.
9. Uncheck the Audience and Notes fields to not include them.
10. Click the Save button.
The Save XML Filter As dialog box is displayed.
11. Enter Schedule for the filter name.
12. Select the Finish button to use the new XML filter.

66 • Complex Queries in BusinessObjects
13. Double-click the following objects to select them: CLS_SCHED_ID FROM_DT TO_DT SITE_ID INSTR_ID
14. Click the Run button.
The table should look like:

Appendix C: 67
Appendix E – ASCII character codes 0 Null char. 43 + 86 V 1 Start of Header 44 , 87 W 2 Start of Text 45 - 88 X 3 End of Text 46 .(dot) 89 Y 4 End of Transmission 47 / 90 Z 5 Enquiry 48 0 91 [ 6 Acknowledgment 49 1 92 \ 7 Bell 50 2 93 ] 8 Backspace 51 3 94 ^ 9 Horizontal Tab 52 4 95 _
10 Line Feed 53 5 96 ` 11 Vertical Tab 54 6 97 a 12 Form Feed 55 7 98 b 13 Carriage Return 56 8 99 c 14 Shift Out 57 9 100 d 15 Shift In 58 : 101 e 16 Data Link Escape 59 ; 102 f 17 Device Control 1 60 < 103 g 18 Device Control 2 61 = 104 h 19 Device Control 3 62 > 105 i 20 Device Control 4 63 ? 106 j 21 Negative Acknowledg. 64 @ 107 k 22 Synchronous Idle 65 A 108 l 23 End of Trans. Block 66 B 109 m 24 Cancel 67 C 110 n 25 End of Medium 68 D 111 o 26 Substitute 69 E 112 p 27 Escape 70 F 113 q 28 File Separator 71 G 114 r 29 Group Separator 72 H 115 s 30 Record Separator 73 I 116 t 31 Unit Separator 74 J 117 u 32 Space 75 K 118 v 33 ! 76 L 119 w 34 “ 77 M 120 x 35 # 78 N 121 y 36 $ 79 O 122 z 37 % 80 P 123 38 & 81 Q 124 | 39 ‘ 82 R 125 40 ( 83 S 126 ~ 41 ) 84 T 127 delete 42 * 85 U

68 • Complex Queries in BusinessObjects
128 Ç 171 ½ 214 129 ü 172 ¼ 215 130 é 173 ¡ 216 131 â 174 « 217 132 ä 175 » 218 133 à 176 219 134 å 177 220 135 ç 178 221 136 ê 179 222 137 ë 180 223 138 è 181 224 α 139 ï 182 225 ß 140 î 183 226 Γ 141 ì 184 227 π 142 Ä 185 228 Σ 143 Å 186 229 σ 144 É 187 230 µ 145 æ 188 231 τ 146 Æ 189 232 Φ 147 ô 190 233 Θ 148 ö 191 234 Ω 149 ò 192 235 δ 150 û 193 236 ∞ 151 ù 194 237 φ 152 ÿ 195 238 ε 153 Ö 196 239 ∩ 154 Ü 197 240 ≡ 155 ¢ 198 241 ± 156 £ 199 242 ≥ 157 ¥ 200 243 ≤ 158 ₧ 201 244 ⌠ 159 ƒ 202 245 ⌡ 160 á 203 246 ÷ 161 í 204 247 ≈ 162 ó 205 248 ° 163 ú 206 249 · 164 ñ 207 250 · 165 Ñ 208 251 √ 166 ª 209 252 ⁿ 167 º 210 253 ² 168 ¿ 211 254 169 212 255 170 ¬ 213