complex adaptive systems and human health: statistical approaches in pharmacogenomics
DESCRIPTION
Complex Adaptive Systems and Human Health: Statistical Approaches in Pharmacogenomics. Kim E. Zerba, Ph.D. Bristol-Myers Squibb FDA/Industry Statistics Workshop Statistics: From Theory to Regulatory Acceptance 18-19 September 2003 Bethesda, Maryland. Disclaimer - PowerPoint PPT PresentationTRANSCRIPT

Complex Adaptive Systems and Human Health: Complex Adaptive Systems and Human Health: Statistical Approaches in PharmacogenomicsStatistical Approaches in Pharmacogenomics
Kim E. Zerba, Ph.D.Kim E. Zerba, Ph.D.
Bristol-Myers SquibbBristol-Myers Squibb
FDA/Industry Statistics WorkshopFDA/Industry Statistics Workshop
Statistics: From Theory to Statistics: From Theory to Regulatory AcceptanceRegulatory Acceptance
18-19 September 200318-19 September 2003
Bethesda, MarylandBethesda, Maryland
Disclaimer Disclaimer The views presented are my own and do not necessarily represent those of Bristol-Myers SquibbThe views presented are my own and do not necessarily represent those of Bristol-Myers Squibb
OutlineOutline
Complex Adaptive Systems and Human HealthComplex Adaptive Systems and Human Health Approach and Some Key Statistical Issues with Approach and Some Key Statistical Issues with
Genetic Polymorphisms in PharmacogenomicsGenetic Polymorphisms in Pharmacogenomics Where Do We Go from Here?Where Do We Go from Here?

The Genetic Paradigm
DNA
RNA
Protein
Gene
Phenotype
Gene
Disease
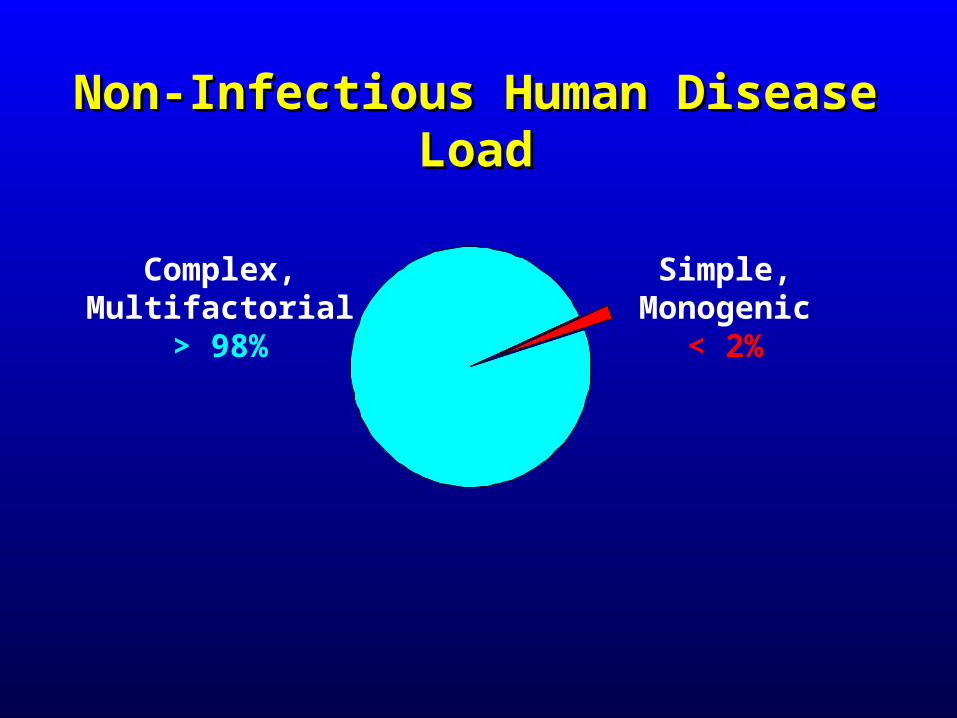
Simple,Monogenic
< 2%
Complex,Multifactorial
> 98%
Non-Infectious Human Disease LoadNon-Infectious Human Disease Load

GENOME TYPEGENOME TYPEUNIQUEUNIQUE
(Initial Conditions)(Initial Conditions)
UNIQUEUNIQUEENVIRONMENTALENVIRONMENTAL
HISTORYHISTORY
FUTUREFUTURE NORM OFNORM OFREACTIONREACTION
PH
YS
IOL
OG
ICA
L
PH
YS
IOL
OG
ICA
L
FIT
NE
SS
, HE
AL
TH
FIT
NE
SS
, HE
AL
TH
--
++TIME-SPACE CONTINUUMTIME-SPACE CONTINUUM
INDIVIDUALINDIVIDUAL
NOWNOW
BLOODBLOOD
PRESSUREPRESSURE
REGULATIONREGULATION
LIPID LIPID
METABOLISMMETABOLISMCARBOHYDRATECARBOHYDRATE
METABOLISMMETABOLISM
HAEMOSTASISHAEMOSTASIS
Risk of DiseaseRisk of Disease
• Agents Agents participateparticipate in dynamic in dynamic network and are network and are notnot directdirect causescauses
• Each individual is a complexEach individual is a complex adaptive system and the adaptive system and the fundamental unit of organization fundamental unit of organization
See : Zerba and Sing, 1993, Current Opinion in Lipidology 4: 152-162, Zerba et al. 2000, Human Genetics 107: 466-475 for more detail
• Network organized hierarchicallyNetwork organized hierarchically and heterarchically into fieldsand heterarchically into fields
• Health or disease isHealth or disease is an emergent feature based on an emergent feature based on interactions among many interactions among many agents, including genes and agents, including genes and environmentsenvironments
• Fields are domains of relationalFields are domains of relational order among agentsorder among agents
• Stronger relationships within fields,Stronger relationships within fields, weaker relationships among fields weaker relationships among fields
• Unique genome type provides initial Unique genome type provides initial conditions and capacity for changeconditions and capacity for change
• Context and time are key to understanding influence of genetic variationContext and time are key to understanding influence of genetic variation
Complex Adaptive Systems and Human HealthComplex Adaptive Systems and Human Health

Genes
Biomarkers
Endpoints
1
3
2 ?
?
?
Complex Adaptive Systems Approach to PGx Complex Adaptive Systems Approach to PGx

Some Key Statistical Issues for Some Key Statistical Issues for Pharmacogenomics Studies Using Genetic Pharmacogenomics Studies Using Genetic
PolymorphismsPolymorphisms
Gene/Polymorphism SelectionGene/Polymorphism Selection Linkage Disequilibrium Linkage Disequilibrium Admixture and Population Stratification Admixture and Population Stratification InvarianceInvariance Context DependenceContext Dependence TimeTime

Gene/Polymorphism SelectionGene/Polymorphism Selection
Genome ScanGenome Scan– Genes not identified Genes not identified a prioria priori – Genotyping Genotyping
– 25K - 500K polymorphisms genotyped25K - 500K polymorphisms genotyped forfor eacheach subjectsubject (not practical yet) (not practical yet)
– DNA Pooling DNA Pooling – 25K - 1.5 million polymorphisms 25K - 1.5 million polymorphisms – Case-control allele frequency differences Case-control allele frequency differences for each polymorphismfor each polymorphism
Candidate GenesCandidate Genes

FF SSii
Candidate GenesCandidate Genes
UnknownUnknownand unmeasuredand unmeasuredfunctionalfunctionalpolymorphismpolymorphism
One of numerousOne of numerousnon-functionalnon-functionalpolymorphismspolymorphisms
Assume that any association of SAssume that any association of Sii with phenotype, P, with phenotype, P,
is because of linkage disequilibrium between F and Sis because of linkage disequilibrium between F and Sii
PPFSFS = p = pFFppSS + + DDFSFS
FF
PP CandidateCandidateGeneGene
RegionRegion

AdmixtureAdmixture
++
++
++++
++
++++
++--
--++
++
----
--
--
--
--
--
--
++
++
++
++
----
------++
SNPSNP
++
--
pp++ = 0.8 = 0.8 pp++ = 0.2 = 0.2
pp++ = 0.5 = 0.5
PopulationPopulation II
PopulationPopulation IIII
AdmixedAdmixedPopulationPopulation
= proportion= proportionof population Iof population I= 0.5= 0.5

Consider two subpopulations, I and II:Consider two subpopulations, I and II:
For each subpopulation, there is linkage equilibrium For each subpopulation, there is linkage equilibrium between a disease allele, F, and a marker allele, S,between a disease allele, F, and a marker allele, S,
PPFFIISSII = p = pFFII
ppSSII; P; PFFIIIISSIIII
= p = pFFIIIIppSSIIII
; D; DFFIISSII = D = DFFIIIISSIIII
= 0. = 0.
In the admixed population (I + II), there is linkage In the admixed population (I + II), there is linkage disequilibrium between F and S,disequilibrium between F and S,
PPFSFS = p = pFFppSS + + ppFFII - p - pFFIIII
)(p)(pSSI I - p- pSSIIII
))
SubpopulationsSubpopulationsProportionsProportions
Disease AlleleDisease AlleleFrequencyFrequencyDifferenceDifference
Marker AlleleMarker AlleleFrequencyFrequencyDifferenceDifference
AdmixtureAdmixtureLinkage Linkage DisequilibriumDisequilibrium
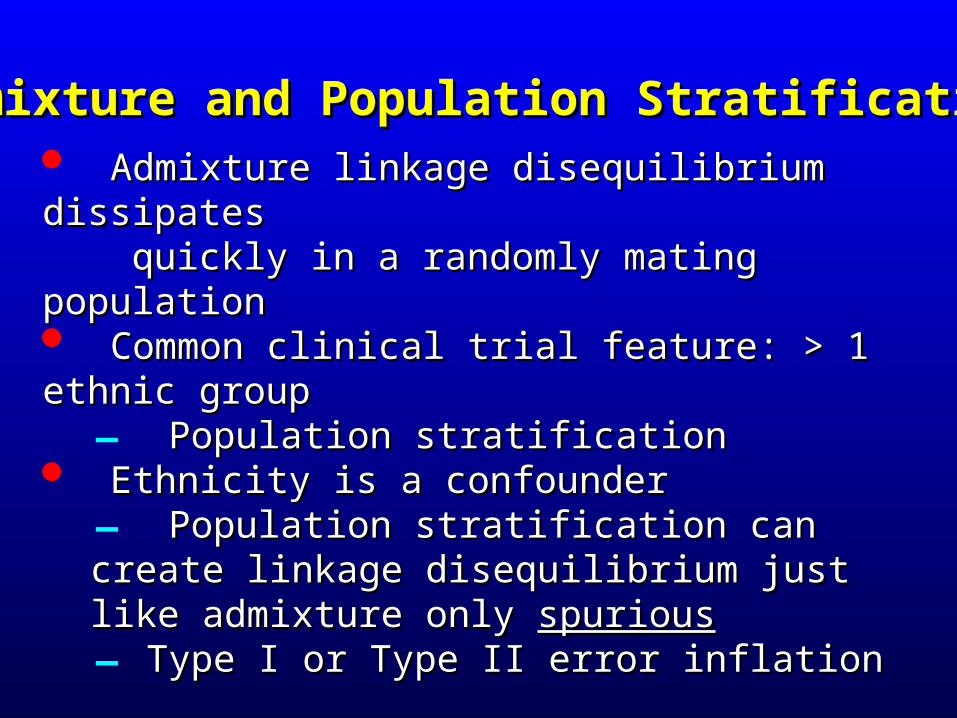
Admixture and Population StratificationAdmixture and Population Stratification Admixture linkage disequilibrium dissipates Admixture linkage disequilibrium dissipates quickly in a randomly mating populationquickly in a randomly mating population Common clinical trial feature: > 1 ethnic groupCommon clinical trial feature: > 1 ethnic group
– Population stratificationPopulation stratification Ethnicity is a confounderEthnicity is a confounder
– Population stratification can create linkage Population stratification can create linkage disequilibrium just like admixture only disequilibrium just like admixture only spuriousspurious– Type I or Type II error inflationType I or Type II error inflation
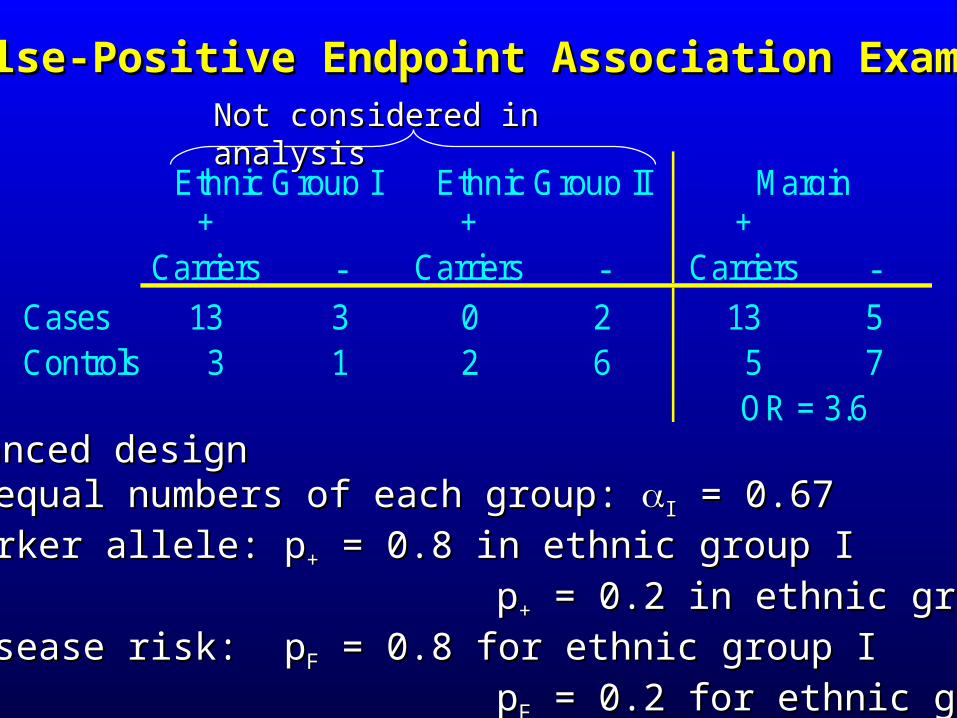
False-Positive Endpoint Association ExampleFalse-Positive Endpoint Association Example
Unbalanced designUnbalanced design
– Unequal numbers of each group: Unequal numbers of each group: II = 0.67 = 0.67
– Marker allele: pMarker allele: p++ = 0.8 in ethnic group I = 0.8 in ethnic group I
pp++ = 0.2 in ethnic group II = 0.2 in ethnic group II
– Disease risk: pDisease risk: pFF = 0.8 for ethnic group I = 0.8 for ethnic group I
ppFF = 0.2 for ethnic group II = 0.2 for ethnic group II
Not considered in analysisNot considered in analysis
+ Carriers -
+ Carriers -
+ Carriers -
Cases 13 3 0 2 13 5Controls 3 1 2 6 5 7
Ethnic Group I Ethnic Group II Margin
OR = 3.6

Population Genetic Structure and Population Genetic Structure and the Search for Functional Mutations:the Search for Functional Mutations:
Quantitative TraitsQuantitative Traits
FREQUENCYFREQUENCY andand SCALESCALE contribute to inferences about SNP-contribute to inferences about SNP-phenotype associations:phenotype associations:
SCALESCALE
GenotypeGenotype
PhenotypePhenotype(Biomarker)(Biomarker)
??
SNPSNP
FR
EQ
UE
NC
YF
RE
QU
EN
CY
AAAA AaAa aaaa
FunctionalFunctionalMutation?Mutation?
SSR = SSR = ffii (Y(Yii - Y) - Y)22
Analysis of VarianceAnalysis of VarianceApproachApproach
??

ppaa ppAA
AAAA
AaAa
aaaa
PPAaAa
AA
aaSNPSNP
Population Stratification andPopulation Stratification andGenotype FrequenciesGenotype Frequencies
Stratification can result inStratification can result in decreased heterozygotedecreased heterozygote frequencies relative to frequencies relative to expectation:expectation:
Ethnic Group IIEthnic Group IIEthnic Group IEthnic Group IAverageAverageGenotypeGenotypeFrequenciesFrequencies
PPaaaaPPAAAA
PPAaAa = 2p = 2pAAppaa - 2D - 2DAA
(D(DA A positive in example)positive in example)

DDAA
++-- 00
00
Sum
of
Squ
ares
Bia
sS
um o
f S
quar
es B
ias ++
--
Population stratification can result in Population stratification can result in overestimation of quantitative phenotypic overestimation of quantitative phenotypic variation associated with genetic variation relativevariation associated with genetic variation relative to Hardy-Weinberg equilibrium expectationto Hardy-Weinberg equilibrium expectation
DDAA --> + --> +

An example from Apolipoprotein E Biology Molecular weight: 34 kD
Synthesized in most organs– liver, brain, gonads, kidney, spleen, muscle
Key physiological role in lipid transport– ligand for the LDL (ApoB-E) receptor
Structural gene on chromosome 19– polymorphic with three common alleles 2 3 4
AA 112 Cys Cys ArgAA 158 Cys Arg Arg
SNPSNPSNPSNP
Invariance, Context and TimeInvariance, Context and Time
5’5’
3’3’
Note: combination of SNPs involvedNote: combination of SNPs involved
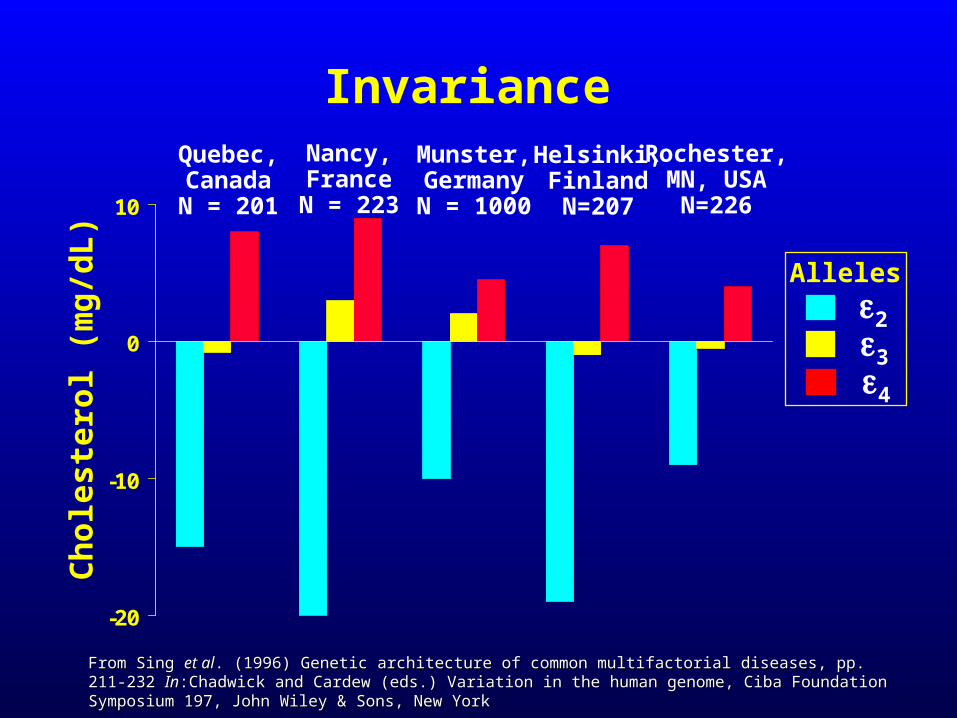
-20
-10
0
10
Quebec,CanadaN = 201
Nancy,FranceN = 223
Munster,GermanyN = 1000
Helsinki,FinlandN=207
Rochester,MN, USA
N=226
Ch
ole
ster
ol
(mg
/dL
)
234
Invariance
Alleles
From Sing From Sing et alet al. (1996) Genetic architecture of common multifactorial diseases, pp. 211-232 . (1996) Genetic architecture of common multifactorial diseases, pp. 211-232 InIn:Chadwick and :Chadwick and Cardew (eds.) Variation in the human genome, Ciba Foundation Symposium 197, John Wiley & Sons, New YorkCardew (eds.) Variation in the human genome, Ciba Foundation Symposium 197, John Wiley & Sons, New York
1010 2020 3030 4040 5050 6060 707000
44
88
1212
1616
1010 2020 3030 4040 5050 6060 70701010
2020
3030
4040
5050
6060
7070
Var
ian
ce x
10
Var
ian
ce x
10-
4-4
Ag
e W
ind
ow
Mid
po
int
Ag
e W
ind
ow
Mid
po
int
(yea
rs)
(yea
rs)
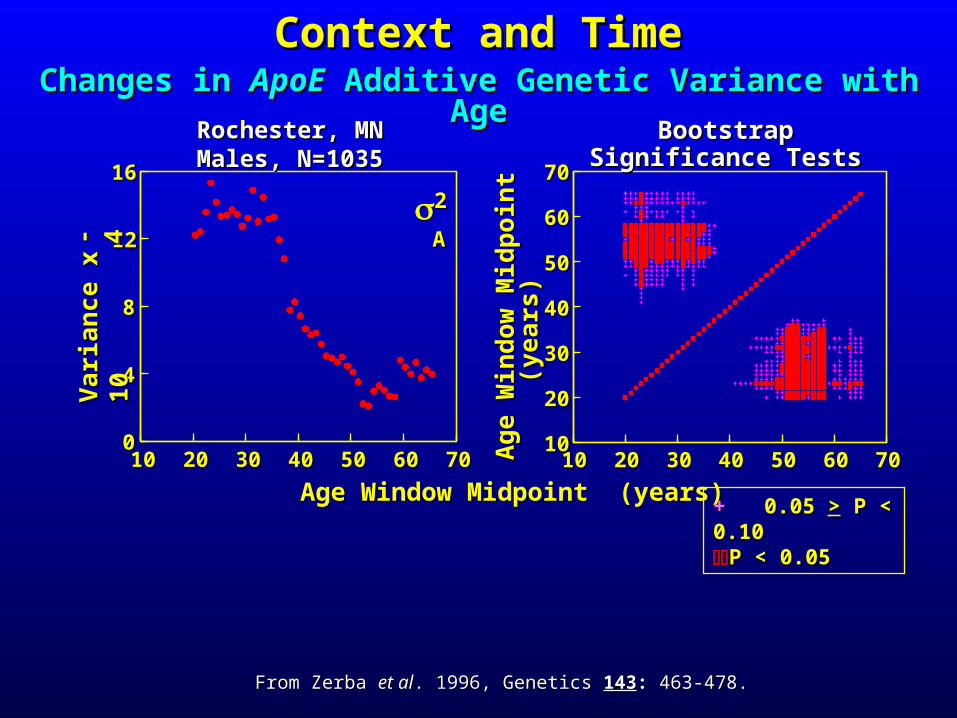
Age Window Midpoint (years)Age Window Midpoint (years)
BootstrapBootstrapSignificance TestsSignificance Tests
22
AA
+ + 0.05 0.05 >> P < P < 0.100.10P < 0.05P < 0.05
Changes in Changes in ApoEApoE Additive Genetic Variance with Age Additive Genetic Variance with AgeContext and TimeContext and Time
Rochester, MN Rochester, MN Males, N=1035Males, N=1035
From Zerba From Zerba et alet al. 1996, Genetics . 1996, Genetics 143143:: 463-478. 463-478.

Where Do We Go From Here?Where Do We Go From Here?
Study design in genetic settingStudy design in genetic setting Genetic stratificationGenetic stratification Genomic controlGenomic control
Ascertainment bias correction in choice of which Ascertainment bias correction in choice of which polymorphisms to studypolymorphisms to study
Contexts/Interactions-- which ones are important?Contexts/Interactions-- which ones are important? New analytical methods needed New analytical methods needed
– Combinations of SNPs within and among genes and environmentsCombinations of SNPs within and among genes and environments
may be involvedmay be involved– Haplotype ReconstructionHaplotype Reconstruction– Combinatorial PartitioningCombinatorial Partitioning
Missing genotypes for individual polymorphismsMissing genotypes for individual polymorphisms Sampling vs technical variability in DNA pooling studiesSampling vs technical variability in DNA pooling studies Multiplicity-- p-value adjustment not a trivial problemMultiplicity-- p-value adjustment not a trivial problem
Some Additional Statistical ChallengesSome Additional Statistical Challenges