completion report of project - african … report of project a. project data and key dates i. basic...
TRANSCRIPT

1
COMPLETION REPORT of PROJECT
A. PROJECT DATA AND KEY DATES I. BASIC INFORMATION
Project Number Project Name Country (ies)
2100150006676 (P-GH-AAO-025)
Livestock Development Project
Republic of Ghana
ID Number of all Lending Instrument(s) Department Environmental Classification
2100150006676 OSAN Category II
Original Commitment Amount Amount Cancelled Amount Disbursed Percent Disbursed
UA 19.58 million 0 UA 17.961.753,92 91,74%
Borrower
Government of Ghana
Executing Agency(ies) [List the main Ministries, Project Implementation Units, Agencies and civil society organizations responsible for implementing project activities.]
The Ministry of Food and Agriculture acting through the Animal Production Directorate and Veterinary Services Directorate
Co-financers and other External Partners [List all other sources and amounts of financing, technical assistance or other resources used in this project]
Government of Ghana (UA 2.31 million); Project Beneficiaries (UA 0.04 million)
II. KEY DATES
Project Concept Note Cleared by Ops. Com.
Appraisal Report Cleared Board Approval
NA NA September 2001
Restructuring(s)
The project remained with the same overall and specific objectives and structured around the same components. At mid-term review in 2005, the cash credit activity was changed to credit in-kind scheme.
Original Date MM/DD/YY
Actual Date MM/DD/YY
Difference in months
EFFECTIVENESS February 2002 June 2003 16 months
MID-TERM REVIEW 2005 May 2008 > 36 months
CLOSING
31 December 2010 For ongoing projects enter date of 98% disb. rate
8 months 92.36% at September 1st 2011
III. RATINGS SUMMARY
Insert notes from the relevant tables in the different sections of the PCR. For example, please insert the “Overall Output

2
score” in Section D.I. in the “Achievement of Outputs” box below.
CRITERIA SUB-CRITERIA RATING
PROJECT OUTCOME
Achievement of Outputs (insert score from Section D.I.) 3
Achievement of Outcomes (insert score from Section D.II) 3
Timeliness (insert score from Section F.4) 2
OVERALL PROJECT OUTCOME [Score is calculated as an average of the ratings]
3
BANK PERFORMANCE
Design and Readiness (insert score from Section I.I) 3
Supervision (insert score from Section I.I) 3
OVERALL BANK PERFORMANCE [Score is calculated as an average of the ratings]
3
BORROWER PERFORMANCE
Design and Readiness (insert score from Section I.I) 3
Implementation (insert score from Section I.I) 2
OVERALL BORROWER PERFORMANCE [Score is calculated as an average of the ratings]
3
IV. RESPONSIBLE BANK STAFF
POSITIONS AT APPROVAL AT COMPLETION
Regional Director NA J. LITSE
Sector Director E.G. TAYLOR-LEWIS A. BEILEH
Sector Manager C.R. SPENCER
D. KEITA
Task Manager M. M. SABRI (Socio-Economist)
B. BOULANOUAR, OSAN.2
PCR Team Leader B. BOUALNOUAR (Livestock Specialist), OSAN.2
PCR Team Members S. DELAHAYE (Agricultural Economist), OSAN.2
T. KARIKARI (Agricultural Specialist), OSAN.2 (Located in GHFO)
B. PROJECT CONTEXT
Summarize the rationale for Bank assistance. State: -what development challenge the project addresses, -the Borrower's overall strategy for addressing it,

3
-Bank activities in this country (ies) and sector over the past year and how they performed, and -ongoing Bank and other externally financed activities that complement, overlap with or relate to this project. Please cite relevant sources. Comment on the strength and coherence of the rationale. [250 words maximum. Any additional narrative about the project's origins and history, if needed, must be placed in Annex 6: Project Narrative]
An estimated 58% of persons identified as poor are in the agricultural sector, a good number of whom keep livestock, in particular small ruminants. The livestock sub-sector has suffered years of neglect with no substantial investment made except towards the mid 70s to early 80s (1974-1981) where some efforts were made, with limited success/impact. Since then the only known major investment in the sub-sector which made some significant achievement was the World Bank/GoG financed National Livestock Services Project (NLSP), implemented between 1993 and 1999. To consolidate these investments, ADF/GoG funded Livestock Development Project (LDP) came on stream with focus on poverty reduction and food security to be achieved through smallholder income generating activities-such as small ruminant/dairy production, processing (meat and milk) and marketing. The Bank Group, between 1973 and 2000, approved a total of 25 projects within the agricultural sector alone. Prior to implementation of the LDP 15 of such interventions had been completed whilst the rest were still on-going. The Bank’s performance was rated satisfactory, given the significant improvements achieved, regarding the pace of implementation. A supervision mission of agriculture portfolio in the country (June-July 2010) revealed that implementation of the portfolio has significantly improved since undertaking the Sector Portfolio Improvement Plan (SPIP) in April 2009. The improvement is mainly attributed to the fact that all projects overcame the civil works procurement challenges. The improvement has been mainly enabled by Bank’s field presence (GHFO). The World Bank funded a) National Agricultural Extension Project (NAEP), b) National Agricultural Research Project (NARP) and c) National Livestock Services Project (NLSP); ii) DFID sponsored a) Role of Livestock in Rural Livelihoods, iii) IFAD funded Roots and Tubers Improvement Project and; iv) Agence Française de Développment (AFD) financed Lowland Rice Development in the Northern Region. All of these projects had a link to livestock sector development and therefore consolidated efforts made under the NLSP umbrella. Development Aid has provided an important source of financing for Ghana's development. Development assistance is estimated to provide over $650 million annually, accounting for 10% of GDP. Donor coordination within the strategy period has been very vibrant and forms an integral part of the Donor and Government of Ghana relations.
C. PROJECT OBJECTIVES AND LOGICAL FRAMEWORK
1. State the Project Development Objective(s) (as set out in the appraisal report)
The sector goal is to contribute to the reduction of poverty, improve food security and reduce imports of livestock and livestock products, to be achieved in an environmentally sustainable manner. Specifically, the project aims at increasing the income of smallholder livestock and dairy farmers, processors and traders in the project area.
2. Describe the major project components and indicate how each will contribute to achieving the Project Development Objective(s).
The project is structured in five components: Component 1: Development of animal production : (a) Breed Improvement; (b) Dairy Improvement; (c) Improvement in Animal Feed and Water Resources and (d) Rehabilitation of Breeding Station. Animal Production Directorate of the Ministry of Food and Agriculture provided technical backstopping for the implementation of this component. Component 2: Development of animal health: (a) Disease control and preventive measures constituted the main focus for implementation under this component. The Veterinary Services Directorate was mandated to oversee the implementation of this component; (b) Strengthen the effectiveness of disease surveillance. Provision was made for the rehabilitation of the Accra and Kumasi laboratories and some selected quarantine stations in the two Upper Regions (East and West).

4
Institutional capacity of the Epidemiology and Emergency Preparedness Units were also identified for improvement; (c) The Tsetse Unit also received limited support under the project to improve upon their logistical situation and performance. Component 3: Credit provision: (a) The credit facility was to enable livestock farmers, processors and traders along with Community Animal Health Workers access short – term loans (6-12 months) for animal feed, drugs and veterinary services. Additionally, the project made available medium term loans (up to 3 years) for the construction of storage facilities for animal feed, animal housing, purchase of livestock, purchase of milk processing equipment or marketing activities; (b) At the community level, provision was made for the extension of medium term credit to support various activities seeking to improve upon the livelihoods of members residing in the project communities. Typically, procurement related activities intended to bring about reduction in domestic labour such as means for transporting animals and crop residues (e.g. small trailers and bicycles with large carrying boxes) and grain grinding mills were earmarked to benefit from the facility. A minimum of 30% of credit funds were to be set aside for women activities; (c) The Agricultural Development Bank (ADB) was assigned management responsibility of the credit fund under an on-lending agreement with the Government of Ghana (GoG) and which was acceptable to the ADF. Following mid term review a credit in kind scheme was proposed for implementation. Component 4: Capacity Building: This component sought to deepen the knowledge and sharpen the skills of stakeholders in ensuring the availability of the requisite competences at various levels. The trainees included farmers, traders, processors and MoFA staff. Component 5: Project Management : Until the mid-term review the Project Management Unit (PMU) was subsumed under the Agricultural Subsector Investment Program (AgSSIP) secretariat with the responsibility of the AgSSIP Coordinator extending to the LDP. The mid-term review identified this setback and thereafter a substantive coordinator of the LDP with full authority to take necessary decisions regarding project implementation was appointed.
3. Provide a brief assessment (up to two sentences) of the project objectives along the following 3 dimensions. Insert a working score, using the scoring scale provided in Appendix 1.
PROJECT OBJECTIVES DIMENSIONS ASSESSMENT WORKING SCORE
RELEVANT a) Relevant to the country's development priorities
a) Project objective is relevant to the development priorities of Ghana where poverty reduction is emphasized, as stipulated in the Accelerated Agricultural Growth and Development Strategy (AAGDS) / Ghana Poverty Reduction Strategy I (GPRSI) / Food and Agricultural Sector Development Policy I (FASDEP 1).
4
ACHIEVABLE
b) Objectives could in principle be achieved with the project inputs and in the expected time frame
b) Within the limitations of the underlying risks and assumptions the project objectives were largely achieved within the project timeframe (including the 2.5 years extension of the disbursement deadline).
3
CONSISTENT
c) Consistent with the Bank's country or regional strategy
c) The project’s emphasis on poverty reduction and food security is consistent with ADB Group vision and strategy for the Ghanaian Agricultural sector as stipulated in the Country Strategy Paper (2005-09).
4
d) Consistent with the Bank's corporate priorities
d) Part of the Bank’s corporate priority as enshrined in its MTS 2008-12 , is to offer financial assistance to non-governmental organizations that are involved in efforts aimed at eradicating poverty and this is consistent with overall project goals while building capacity of public institutions.
4

5
4. Summarize the log. frame1. If a log. frame does not exist, complete the table below, indicating the overall project development objective, the major components of the project, the major activities of each component and their expected outputs, outcomes, and indicators for measuring the achievement of outcomes. Add additional rows for components, activities, outputs or outcomes if needed.
COMPONENTS ACTIVITIES OUTPUTS EXPECTED OUTCOMES
INDICATORS TO BE MEASURED
Component 1 : Development of Animal Production
1.1.1. Restock 6 Breeding Stations (BS) with replacement stock
1.1. Livestock
Breed
Improvement
1.2 Productivity of indigenous breeds increased by 20%
1.2 Percentage change in livestock productivity parameters (average birth, weaning and yearling weights per species) 1.1.2. Rehabilitate farm
structures (at BS)
1.1.3. Select and train 1400 participating breeders (PBs)
1.2.1. Train 477 farmers (in péri-urban areas) in the management of dairy cows under zero grazing systems.
1.2. Dairy
Improvement
2.1 Peri-urban /intensive Milk production systems increased to 3.5kg/cow/day 2.2 Milk production in extensive systems increased from 0.5kg/day to 1kg/day 2.3/2.4 1200 crossbred cows produced by end of project (2010)
2.1 Daily milk yield (production per cow per day) in intensive systems 2.2 Daily milk yield (production per cow per day) in extensive systems 2.3 Number of AI Technicians trained 2.4 Number of crossbred heifers produced/Number and success rate of inseminations (AI’s) carried out.
1.2.2. Promote (inform, educate) hygienic milk production and collection from indigenous cattle
1.2.3. Train 10 MoFA staff as AI technicians
1.2.4. Inseminate Sanga cows (Amrahia BS and farmers herds)
1.3.1. Provide dug outs and boreholes (water points)
1.3. Improved Animal Feed and Water Resource
3.1. Livestock access to water (year round) enhanced 3.2. /3.3. Livestock access to improved quality fodder enhanced 3.4. / 3.5. Livestock access to quality feed enhanced as a result of over sowing 3000ha of communal grazing land with improved seeds
3.1.1 Number of watering points 3.1.2 Number of farmers trained in forage establishment and management in seed production 3.1.3 Total area (Ha) of fodder banks established in project area
3.1.4 Total area (Ha) of communal land in project districts over-sown with stylosanthes/improved seeds.
1.3.2. Train livestock farmers in forage establishment and management and in seed production
1.3.3. Establish fodder bank /forage plots
1.3.4. Form farmer/grazer groups and associations
1.3.5. Over-sow communal grazing areas
Component 2 : 2.1. Adopt new disease 2. Control of 2.1.1. Control 2.1.1. Mortality rate in poultry

6
Development of animal health
control technologies Major Diseases
measures for NCD developed and implemented resulting in reduced poultry mortalities from 55% to 15% 2.1.2. Control measures for Peste des Petits Ruminants (PPR), developed and implemented resulting in reduced mortalities from 45% in unvaccinated to 15% in vaccinated animals 2.1.3. Control measures for CBPP developed and implemented resulting in 10% reduction in mortalities in vaccinated animals 2.1.4. 10% increase in small ruminant population (over base period figure) 2.1.5. 3% increase in cattle population over base period figure.
due to NCD, PPR and CBPP in small ruminants 2.2.1. Number of animals vaccinated against endemic diseases 2.2.2. Mortality rate due to PPR 2.2.3. Livestock (cattle, small ruminants etc.) growth rate (%)
2.3.1. Outbreaks of PPR reported annually 2.3.2. Outbreaks of CBPP reported annually 2.3.3. Outbreaks of NCD reported annually 2.4.1. Number of check points rehabilitated
2.2.Vaccinate livestock against endemic diseases (CBPP, PPR, NCD) annually
2.3. Carry out disease surveillance (all year round)
2.4. Rehabilitate veterinary check points / quarantine stations
Component 3 :
Credit Provision
3.1. Facilitate farmer access to credit from ADB
3.1. Provide Cash Credit to LDP Beneficiaries
3.2. Provide credit in kind (45,000 small ruminants) to LDP beneficiaries
3.1./3.2. Productivity of various categories of beneficiaries (producers, processors, traders etc) increased due to enhanced access to LDP credit
3.1.1. Number of credit beneficiaries 3.1.2. Size of credit and time of receipt of credit 3.1.3. Recovery rate (%) 3.2.1. Number of farmers benefiting from credit in kind scheme 3.2.2. Number of animals (credit in kind) received per farmer 3.2.3. Estimate productivity parameters (mortality, birth rate,
3.2. Train livestock farmers in savings mobilization, loan recovery and management
3.3. Utilize undisbursed credit (funds) at AfDB to procure small ruminants for farmers for breeding

7
etc) of credit in kind animals 3.2.4. Number of beneficiaries paying back in kind (no. of animals) and period of repayment
Component 4 : Capacity building
4.1. Train livestock farmers and farmer groups
4.Capacity (Knowledge base) of beneficiaries (livestock farmers, processors, traders, MoFA staff etc) enhanced
4.1 Increased beneficiary (livestock farmers, processors, traders) performance (output) due to increased knowledge-base (Capacity)
4.2. Capacity of 300 MOFA staff strengthened leading to improved effectiveness and efficiency in performing assigned responsibilities
4.1.1. Number of farmers trained 4.1.2. Adoption rate (%) 4.2.1./4.3.1 Number of MoFA staff Processors, and Traders trained
4.2. Train processors and traders
4.3. Train Agricultural Extension Agents (AEAs) and Livestock specialists (LS’s)
4.4. Conduct workshops/seminars
Component 5 : Project management
5.1. Conduct national and district project management workshops
5.1. 834 Management workshops organized at both national and district levels 5.2. 19 SCMs organized 5.3. Eight annual work plan and budget prepared and submitted to the Bank
5.1./5.2./5.3. Significant improvement /progress achieved in project implementation as a result of improved effectiveness and efficiency in management performance (arising largely from incorporating SCM recommendations into management decisions)
5.1. Number of management workshops (National /District) organized 5.2. Number of SC meetings held 5.3. Number of annual work plan and budget prepared and submitted (incl. timeliness of submission)
5.2. Hold steering committee meetings (SCM)
5.3. Prepare and submit annual work plan and budget
Component 6 : Cross Cutting Issues
6.1. Embark on guinea worm/malaria eradication campaign
6.1. Farmer Education on Guinea worm and Malaria eradication undertaken 6.2. HIV/AIDS awareness campaign undertaken
6.1 Reduced incidence of Guinea worm and malaria reported cases in project area 6.2 HIV/AIDS prevalence rate reduced to 2% or less
6.1 Number of Malaria and Guinea worm reported cases 6.2 Number of HIV/AIDS reported cases
6.2. Embark on HIV/AIDS awareness campaign

8
5. For each dimension of the log. frame, provide a brief assessment (up to two sentences) of the extent to which the log. frame achieved the following. Insert a working score, using the scoring scale provided in Appendix 1. If no log. frame exists, score this section as a 1 (one).
LOG. FRAME DIMENSIONS ASSESSMENT WORKING SCORE
LOGICAL
a) Presents a logical causal chain for achieving the project development objectives
Generally speaking, the log frame was not explicit in articulating the causal relationships existing between inputs, activities and outputs and their linkage with the project objectives. Outcomes are missing from the matrix.
2
MEASURABLE
b) Expresses objectives and outcomes in a way that is measurable and quantifiable
Although target values for the retained indicators were usually indicated, baseline values were almost always missing and this made measurability of outputs very difficult.
2
THOROUGH c) States the risks and key assumptions
Potential risks and their mitigation measures are not articulated. Among others, the cash credit, the low performance of contractors, the low counterpart funding were not foreseen as potential risk areas and that proved wrong during implementation.
1
D. OUTPUTS AND OUTCOMES
I. ACHIEVEMENT OF OUTPUTS
In the table below, assess the achievement of actual vs. expected outputs for each major activity. Import the expected outputs from the log. frame in Section C. Score the extent to which the expected outputs were achieved. Weight the scores by the activities' approximate share of project costs. Weighted scores are auto-calculated by the computer. The overall output score must be calculated as the sum of the weighted scores. Override the calculated score, if desired, and provide justification.
MAJOR ACTIVITIES Working Score
Share of Project Costs in percentage
(as stated in Appraisal Report)
Weighted Score
Expected Outputs Actual Outputs
1. Livestock Breed Improvement
1.1 Restocking of all the six (6) breeding stations (BS) completed (100% achieved)
1.2 Rehabilitation of 65 farm structures in APD breeding stations 92.3% completed
1.3 1400 participating breeders (PBs) trained (100% achieved)
4
3
4
1.92%
3.02%
0.64%
0.077
0.091
0.026
2. Dairy Improvement 2.1 477 farmers (in peri-urban areas) have 3 0.02% 0.001

9
established zero grazing units after receiving training (100% adoption) 2.2 887 farmers trained in milk collection, processing and marketing techniques (50% achieved) 2.3 9 MoFA staff trained as AI technicians (70% achieved)
2
3
0.03%
0.18%
0.001
0.005
3. Improved Animal Feed and Water Resources
3.1 307 ha of fodder banks established 3.2 162 ha of communal lands over sown with improved seeds 3.3 20 boreholes and 33 dugouts constructed
2
1
3
0.22%
0.002%
13.20%
0.004
0.00002
0.396
4. Control of major diseases
4.1 Disease surveillance was carried out throughout the project span leading to significant improvement in reported cases of disease outbreaks. It also resulted in early detection and as a sequel to this effective disease control measures developed 4.2 143,142 (55%) cattle were vaccinated annually against CBPP 4.3 332,282 (38%) sheep and goats vaccinated annually against PPR 4.4 One (1) new Veterinary quarantine station constructed
3
2
2
3
0.48%
0.26%
0.33%
0.36%
0.15
0.005
0.007
0.011
5.1 Provide cash credit to LDP Beneficiaries 5.2 Provide credit in Kind to LDP beneficiaries (following restructuring in MTR)
5.1 5.1 An amount of GH¢1,906,155.59 disbursed to farmers as credit ((LDP) 5.2 45,000 animals supplied to beneficiaries
2
3
6.62%
43.96%
0.132
1.319
6.1 The capacity (Knowledge base) of beneficiaries (livestock farmers, processors, traders) improved
6.1.1 185,339 (115,212M, 70,127F) Number of farmers trained (in various livestock related activities)
4
4.60%
0.184
6.2 The capacity (knowledge base) of 300 MoFA staff (250 AEA’s, 50 LS’s) enhanced
6.2.1 712 MoFA staff variously trained (237% achievement)
4 0.25% 0.010
7.1 24 Management workshops organized at
7.1.1 18 National Management workshops organized by end 2010
3 2.75 0.083

10
national level
7.2 816 Management workshops organized at the level of project districts
7.2.1 816 District Management workshops organized by end 2010
4 0.32% 0.013
7.3 Annual work plans and budget for LDP prepared and submitted
7.3.1 PMU prepared and submitted 8 annual work plans and budget to Bank
4 0.08% 0.003
7.4 19 PSC meetings held
7.4.1 Project Steering Committee held 19 meetings
3 0.93% 0.028
7.5 Project Activities Monitored and Evaluated
Monitoring and Evaluation of project activities conducted at various levels of implementation
3
1.68%
0.050
8.1 Farmer Education on Guinea worm and Malaria eradication undertaken
8.1.1 The capacity (knowledge base) of farmers at all the project districts enhanced through appropriate training on guinea worm and malaria eradication
3
0.38%
0.011
8.2 HIV/AIDS awareness campaign undertaken
8.2.1 Farmer awareness (project area) heightened on HIV/AIDS related issues
3 0.41% 0.012
OVERALL OUTPUT SCORE [Score is calculated as the sum of weighted scores]
3
Check here to override the calculated score
Provide justification for over-riding the calculated score
Insert the new score or re-enter the calculated score 3
II. ACHIEVEMENT OF OUTCOMES
1. Using available monitoring data, assess the achievement of expected outcomes. Import the expected outcomes from the log. frame in Section C. Score the extent to which the expected outcomes were achieved. The overall outcome score must be calculated as an average of the working scores. Override the calculated score, if desired, and provide justification.
OUTCOMES Working Score Expected Actual
1. Increased incomes of smallholder livestock farmers
1.1) Average annual revenue2 (gross) / holder a. Cattle =GH¢25,939.94 b. Sheep = GH¢1,144.41 c. Goat = GH¢1,144.41 d. Pig Holder = GH¢12,817.38
1.2) 13%-16% Increase in smallholder stock
size due to increased knowledge base
1.1) Average annual revenue (gross) / holder
a. Cattle = GH¢49,700 (96% increase compared to baseline)
b. Sheep = GH¢3,420.00 (199% increase) c. Goat = 2,100.00 (84% increase) d. Pig = GH¢10,400.00 (-19% less target)
1.2) % Change in stock sizes over base period (2003)3:
a. Cattle = 196% (24)
3
2 Annual revenue was computed using a discount rate of 30% (opportunity cost of capital) 3 Base value inserted in parenthesis; Cattle (no.) =71 (24); Sheep = 38 (17); Goat = 35 (28); Pig = 65 (17); Poultry = 65 (33). Please note that where date is indicated it implies the reference point used is not 2003 due to lack of data then; otherwise the baseline is 2003.
11
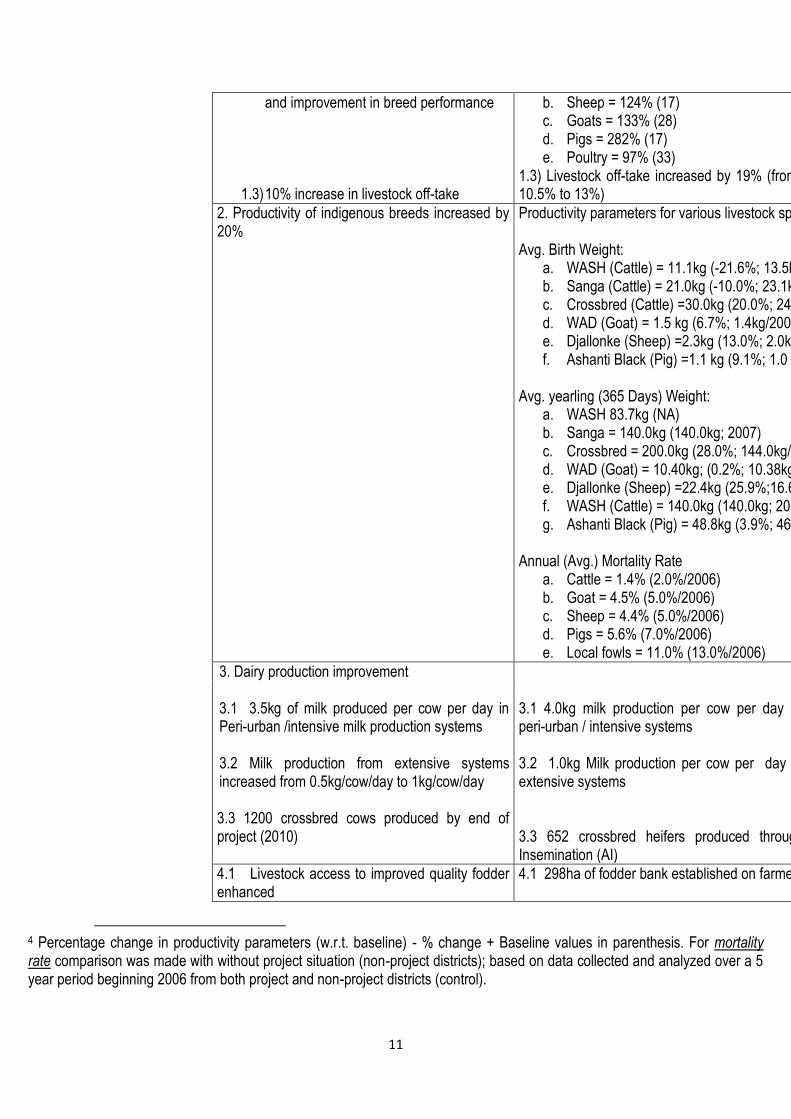
and improvement in breed performance
1.3) 10% increase in livestock off-take
b. Sheep = 124% (17) c. Goats = 133% (28) d. Pigs = 282% (17) e. Poultry = 97% (33)
1.3) Livestock off-take increased by 19% (from a base of 10.5% to 13%)
2. Productivity of indigenous breeds increased by 20%
Productivity parameters for various livestock species4 Avg. Birth Weight:
a. WASH (Cattle) = 11.1kg (-21.6%; 13.5kg/2005) b. Sanga (Cattle) = 21.0kg (-10.0%; 23.1kg/2005) c. Crossbred (Cattle) =30.0kg (20.0%; 24.0kg 2005) d. WAD (Goat) = 1.5 kg (6.7%; 1.4kg/2005) e. Djallonke (Sheep) =2.3kg (13.0%; 2.0kg/2005) f. Ashanti Black (Pig) =1.1 kg (9.1%; 1.0 kg/2005)
Avg. yearling (365 Days) Weight:
a. WASH 83.7kg (NA) b. Sanga = 140.0kg (140.0kg; 2007) c. Crossbred = 200.0kg (28.0%; 144.0kg/2005) d. WAD (Goat) = 10.40kg; (0.2%; 10.38kg/2005) e. Djallonke (Sheep) =22.4kg (25.9%;16.6kg) f. WASH (Cattle) = 140.0kg (140.0kg; 2007) g. Ashanti Black (Pig) = 48.8kg (3.9%; 46.9kg/2005)
Annual (Avg.) Mortality Rate
a. Cattle = 1.4% (2.0%/2006) b. Goat = 4.5% (5.0%/2006) c. Sheep = 4.4% (5.0%/2006) d. Pigs = 5.6% (7.0%/2006) e. Local fowls = 11.0% (13.0%/2006)
3
3. Dairy production improvement 3.1 3.5kg of milk produced per cow per day in Peri-urban /intensive milk production systems
3.2 3.2 Milk production from extensive systems
increased from 0.5kg/cow/day to 1kg/cow/day 3.3 1200 crossbred cows produced by end of project (2010)
3.1 4.0kg milk production per cow per day recorded in peri-urban / intensive systems 3.2 1.0kg Milk production per cow per day recorded in extensive systems 3.3 652 crossbred heifers produced through Artificial Insemination (AI)
3
3
2
4.1 Livestock access to improved quality fodder enhanced
4.1 298ha of fodder bank established on farmer’s farm
3
4 Percentage change in productivity parameters (w.r.t. baseline) - % change + Baseline values in parenthesis. For mortality rate comparison was made with without project situation (non-project districts); based on data collected and analyzed over a 5 year period beginning 2006 from both project and non-project districts (control).

12
4.2 3000ha of communal grazing land over sown with improved seeds 4.3 Livestock access to water (year round) enhanced as a result of the construction of 28 boreholes and 36 dugouts in project area
4.2 162ha of communal grazing land over sown with improved (stylo) seeds. 4.3 20 boreholes and 33 dugouts constructed
1
3
5.1 Control measures for Newcastle Disease (ND) developed and implemented resulting in reduced poultry mortalities from 55% in unvaccinated to 15% vaccinated birds 5.2 Control measures for Peste des Petits Ruminants (PPR), developed and implemented resulting in reduced mortalities from 45% in unvaccinated to 15% in vaccinated animals 5.3 Control measures for Contagious Bovine Pleuro- Pneumonia (CBPP) developed and implemented resulting in 10% reduction in mortalities in vaccinated animals 5.4 Number of reported PPR outbreaks dropped
below 27 (2006)
5.5 Number of reported CBPP outbreaks dropped below 23 (2006)
5.1 Mortality rate due to ND reduced from 55% (base, 2003) to 3.1% (end, 2010) 5.2 Mortality rate due to PPR reduced from 45% (base, 2003) to 8.2% (end, 2010) 5.3 CBPP mortality dropped to 4.1% from (a high of) 10% in 2003 (base) 5.4 PPR outbreaks reported by end 2010 was 75
5.5 Number of reported CBPP outbreaks as at end 2010
was 35
4
4
4
2
2
6.1 Productive capacity of various categories of beneficiaries (producers, processors, traders, etc) improved due to enhanced access to credit (LDP credit facility) 6.2 100% Recovery Rate Achieved
6.3 45,000 animals distributed under the credit
in kind scheme
6.4 4,500 ruminant farmers benefitted from the
6.1.1 4,514 (2998M, 1516F) Livestock Farmers accessed LDP credit to the tune of GH¢1.9 million (GH¢1,905,615) to improve their livestock enterprises 6.1.2 210 Cattle and Dairy Farmers (from 14 groups) have benefitted from LDP credit facility totaling GH¢60,060.00 6.1.3 502 Small ruminant and pig farmers (from 502 groups) benefitted from the LDP credit facility totaling GH¢1,819,555.00 6.1.4 300 Processors and Marketers (from 20 groups) have benefitted from the LDP credit facility to the tune of GH¢26,000.00 6.2 66.75% recovery rate achieved 6.3 45,000 small ruminants distributed to beneficiary farmers in the LDP project area under the credit in kind scheme
2
2
3
3
4

13
credit in kind scheme 6.5 GH¢11,469,074 amount spent in procuring animals under the credit in kind scheme
6.4 4,500 ruminant farmers benefitted from the credit in kind scheme5 6.5 As at end December 2010 GH¢ 11,469,074 had been spent in procuring small ruminants under the credit in kind scheme
7.1 Improved beneficiary (19,000 livestock farmers, processors, traders) performance due to increased knowledge base (arising from the receipt of relevant training) 7.2 Capacity of 300 MoFA staff strengthened leading to improved effectiveness and efficiency in performing assigned duties
7.1.1 185,339 (875% achieved) of farmers have strengthened their capacity through training 7.1.2 71% Adoption rate achieved 7.2.1 712 (137% achieved) MoFA staff have deepened their knowledge and sharpened their skills through relevant training programmes.
4
4
8.1 Significant improvement/progress achieved in project implementation as a result of improved effectiveness and efficiency in management performance
8.1.1 30 quarterly progress reports on project implementation and 8 annual work plan and budget prepared according to bank prescribed format and submitted to Bank within agreed deadlines 8.1.2 Recommendations from PSC meetings and Bank missions implemented 8.1.3 Auditing timeliness met and reports regularly submitted
3
4
4
9.1 HIV/AIDS prevalence rate reduced from 4.6% (National) to 2% or less
9.1.1 Farmer understanding about the effects of HIV/AIDS on their productive capacity (and overall livelihoods) has been deepened in all the project districts through series of awareness creation campaigns funded by the project. Reported HIV/AIDS prevalence rate in Ghana is 1.9%. (Source GNA/GHS)
3
10.1 Reduced incidence of malaria and Guinea worm reported cases in project area
10.1.1 Through education/sensitization, communities in the project area are now better informed about the causes of Malaria and Guinea worm and their effects on their economic activities and have therefore, instituted the necessary preventive measures. Ghana is reported to be near total Guinea worm eradication, the country has so far achieved 99.99% reduction of the disease (GNA/GHS, 2010)
3
OVERALL OUTCOME SCORE [Score is calculated as an average of the working scores]
3
Check here to override the calculated score
5 Credit in Kind Scheme: Though the number targeted was fully met, the sustainability of the scheme is not yet fully achieved partly due to the late start of the scheme – first batch received their animals in December 2009 and are expected to pay back in December 2011 - hence the score of 3.

14
Provide justification for over-riding the calculated score
Insert the new score or re-enter the calculated score 3
2. Additional outcomes. Comment on the project's additional outcomes not captured in the log. frame, including cross-cutting issues (e.g., gender).
Following the stalemate of the cash credit component and upon recommendation from the MTR mission in 2005, a credit in kind scheme proposal was formulated and submitted to Banks approval. A total of 45,000 (1,500 goats, 43,500 sheep) small ruminants were supplied under the credit in kind scheme to 4,500 beneficiaries in all the 35 project districts. Data on the beneficiaries, including the GPS location of their houses were recorded and the beneficiaries would be giving out the same number of animals they received to be passed on to new beneficiaries (ie. 2 years after receiving the animals). The initial passing-on of the animals is due to start from mid December 2011. From the discussions held with both Government officials and beneficiaries about the credit in kind, the mission gathered that this activity was a success story as it helped in stocking areas considered under-stocked by MoFA and was instrumental in initiating or consolidating small ruminant enterprises in the project area. The PMU, the Government and the Bank worked diligently to implement this activity in a record time despite the large batches of animals involved, their procurement from abroad and their quarantine and delivery to different districts. The mission recommended that this experience should be duly documented to advocate for future similar actions if deemed necessary. In order to do so, an accurate inventory of the distributed animals and their locations along with a survey on the degree of satisfaction and compliance of the in kind borrowers with the rule set out initially in the credit in kind must be done in order to promote sustainability of such scheme. In this survey the benefits derived by women livestock keepers should be assessed as women were intended to be a primary target of this operation. The mission underscores the many lessons that can be learned from this first hand experience by the planners in terms of the choice / adaptation of exotic genetic resources, health issues in quarantine and the proper logistics of handling large flocks in order to minimize animal stress and losses.
3. Risks to sustained achievement of outcomes. State the factors that affect, or could affect, the long-run or sustained achievement of project outcomes. Indicate if any new activity or institutional change is recommended to help sustain outcomes. The analysis should draw upon the sensitivity analysis in Annex 3, where appropriate.
The overriding concern in the choice of target communities (project area) was concentration of poverty and suitability for livestock production. Demand driven participatory approach was emphasized in the design with the intent to increase beneficiary ownership of activities and as a consequence sustainability of project gains, beyond its lifetime. To further consolidate sustainability of expected gains to be made, long after project implementation, capacity building of project beneficiaries, in all aspects of the production process (e.g. good husbandry practices, fodder establishment, disease recognition, etc.), formed an integral component of project design. Training of farmers in group formation and entrepreneurship were also enshrined in the design. To test the earning capacity of the project and to establish how responsive the economic and financial rates of returns are to changing circumstances; for instance drop in project benefits, increases in project costs and delays in benefit streams, a sensitivity analysis was carried out. The results for the various scenarios are: a) The sheep, goat and pig enterprises are sensitive to changes in project benefits as a 10% decrease in the project benefit streams will affect the financial attractiveness of these enterprises; b) When aggregated however, the financial attractiveness of the intervention appeared to be fairly robust to changes in the fall of revenue (benefit streams) and expenditure increases up to a point. As indicated, a 10 percent drop in project benefits jointly with 20% rise in expenditure could not undermine the financial viability of the project; c) The economic rate of return of the aggregate enterprise however, exhibited sensitivity to the combined decrease in benefits and increase in costs of 20% each. The test showed that at such percentage change, the FIRR (6%) was significantly lower than the opportunity cost of capital (30%); d) 20% decrease in the benefit streams would also render the aggregate enterprise financially unattractive. The financial rate of return generated for such a change at the 30% opportunity cost of capital was 27%; e) The cattle enterprise showed significant resilience as it remained financially very attractive. At a combined rise in costs and decline in benefits of 20% each the enterprise remained viable. The FIRR (41%) was significantly higher than the opportunity cost of capital (30%). This could partly be attributed to the fact that investments into this enterprise are relatively low in Ghana, compared to the huge benefits to be derived, and this was further boosted by the project intervention which emphasized disease control - leading to reductions in disease outbreaks and mortalities; and f) The economic sensitivity analysis shows that economic benefits arising from investing in animal health provision (vaccination of animals) are so large that not even a combined drop in project benefits and rise in project expenditure (costs) of 20% each

15
could affect the attractiveness of the project (at 30% DR). This could be attributed, in part, to the large amounts of benefits generated from the vaccinations. It is also indicated that it is only when benefits are delayed by 3 years that the project interventions are rendered economically unattractive at 30% opportunity cost of capital. Though the macro-economic environment that prevailed during implementation was generally satisfactory, government overall commitment was low particularly when it came to release of counterpart funding, and this in many ways delayed implementation such as the civil works component as release of funds for consultancy services was not forthcoming. There is a real concern that low commitment or the lack of it, to consolidate the gains made during implementation could threaten sustainability, with the withdrawal of project support.
E. PROJECT DESIGN AND READINESS FOR IMPLEMENTATION
1. State the extent to which the Bank and the Borrower ensured the project was commensurate with the Borrower’s capacity to implement by designing the project appropriately and by putting in place the necessary implementation arrangements. Consider all major design aspects, such as extent to which project design took into account lessons learned from previous PCRs in the sector or the country (please cite key PCRs); whether the project was informed by robust analytical work (please cite key documents); how well Bank and Borrower assessed the capacity of the implementing agencies and/or Project Implementation Unit; scope of consultations and partnerships; economic rationale of project; and provisions made for technical assistance. [200 words maximum. Any additional narrative about implementation should be included at Annex 6: Project Narrative]
The design of the LDP drew extensively on the lessons learnt from the NLSP and the former sought to consolidate and extend the gains made under the NLSP. For implementation effectiveness the existing institutional framework and professionals within MoFA, with relevant expertise, were incorporated into the design. For instance the key implementers of the NLSP; APD and VSD, were maintained and engaged in the implementation of key project components - Development of Animal Production and Animal Health respectively. The existing Agriculture Sector Strategy Investment Program (AgSSIP) secretariat was assigned coordinating responsibility. To ensure effectiveness and efficiency in the day to day administrative management of the project provision was made for a well qualified person to be engaged as project manager (PM), after competitive interview. The Livestock Planning and Information Unit (LIPU), responsible for NLSP Monitoring and Evaluation (M&E), was assigned same responsibility under the LDP. To further strengthen the devolution of authority and deepen good governance, the design of the project emphasized the use of the decentralized structure. To create the necessary platform for the project to get wider publicity, provision was made in the design for national and regional launching of the project to be made, and this was duly complied with. Economic and financial analysis was done, prior to implementation, and this largely informed the indicators established for project monitoring and evaluation. The economic analysis concluded that the project was feasible and would generate economic rate of return (EIRR) of 35% at 12% opportunity cost of capital - for an assumed net benefit stream of 30 years. Environmental concerns were articulated, at the design stage, knowing the close association between livestock production and its impact on the environment. The project appropriately assigned responsibility here to the Environmental Protection Agency (EPA). Implementation however, suffered a setback as EPA, appeared to have reneged on its mandate as a result of resources constraints since no funds were allocated in the cost tables for this activity. There were limited interactions, if any, between EPA and key project stakeholders, in particular Project Management and the Bank Missions, to ensure that guidelines, among other environmental issues, stressed in the design were adhered to. Credit provision (cash) formed an integral component (as stated elsewhere) of project design. Implementation of this component however, suffered serious setbacks (demand was low and recovery rate was low for the disbursed loans) resulting in a collective decision by the key stakeholders; Government of Ghana (represented by MOFA and MOFEP), AgDB (managers of the cash credit scheme) and the AfDB (Donor) to convert the remaining amount of the cash credit facility into a credit in kind scheme - where animals (small ruminants) replaced the conventional cash credit. The attrition of cash credit component underscores the low capacity of commercial banks in Ghana in handling credit in livestock operation.
2. For each dimension of project design and readiness for implementation, provide a brief assessment (up to two sentences). Insert a working score, using the scoring scale provided in Appendix 1.
PROJECT DESIGN AND READINESS FOR IMPLEMENTATION DIMENSIONS
ASSESSMENT WORKING
SCORE

16
REALISM
a) Project complexity is matched with country capacity and political commitment.
Ghana has the institutional framework and the relevant professional expertise to implement the LDP. The initial commitment of government towards the project was variously demonstrated including the financial contribution towards project implementation (e.g. launching of project at the national, regional and district levels. However, this could not be sustained during implementation as shown by delays in the release of counterpart funds. This, variously, held back project implementation. The Agric. Development Bank in Ghana showed major capacity limits in handling the cash credit component.
2
RISK ASSESSMENT AND MITIGATION
b) Project design includes adequate risk analysis.
The overall assumption at appraisal on the satability of macro-economic environment and the absence of major disease outbreaks held true during project implementation. . Some risks were adequately addressed during project formulation. These are: insufficient counterpart funding inflow, failure to implement the cash credit in part due to low capacity of AgDB and the low capacity of the participating contractors and supervisors. The threat to sustainability of gains made however, is how government could sustain its current prudent fiscal policies and in a manner that would be favorable to agriculture and also demonstrate sustained commitment to ensure the consolidation of the gains made, with the withdrawal of project support.
2
USE OF COUNTRY SYSTEMS
c) Project procurement, financial management, monitoring and/or other systems are based on those already in use by government and/or other partners.
The Bank reviewed existing procurement laws and regulations, financial management systems, monitoring systems, among others, and found them to be acceptable and used them during implementation.
4
For the following dimensions, provide separate working scores for Bank performance and Borrower performance:
WORKING SCORE
Bank Borrower
CLARITY d) Responsibilities for project implementation were clearly defined.
Project design was explicit about the roles and responsibilities of key implementers
4
4
PROCUREMENT READINESS
e) Necessary implementation documents (e.g. specifications, design, procurement
Relevant implementation documents were not ready at appraisal. However, before implementation, they (i.e. documents) were elaborated and subjected to Bank review and approval
2
2

17
documents) were ready at appraisal.
MONITORING READINESS
f) Monitoring indicators and monitoring plan were agreed upon before project launch.
Project monitoring and evaluation suffered initial implementation setback. Project design lacked clarity in how M&E was to be done and baseline data was not available. The MTR identified the inherent weaknesses of the project M&E and recommended its restructuring with the engagement of an M&E specialist.
2
2
BASELINE DATA
h) Baseline data were available or were collected during project design.
No baseline data existed or were collected at the time of project design. Baseline data were collected, belatedly, three (3) years (2006) into implementation.
2 2
F. IMPLEMENTATION
1. State the major characteristics of project implementation with reference to: adherence to schedules, quality of construction or other work, performance of consultants, effectiveness of Bank supervision, and effectiveness of Borrower oversight. Assess how well the Bank and the Borrower ensured compliance with safeguards. [200 words maximum. [Any additional narrative about implementation should be included at Annex 6: Project Narrative.]
It was not until August 2002 that the loan was signed and the project became effective in June 2003. The long list of conditions preceding effectiveness soon became a hurdle to project implementationIn general, most of the activities earmarked for implementation under the project have largely been completed. The credit component also suffered low recovery rate of disbursed loans which led to the conversion of the remaining amount of monies to a credit in - kind scheme. The absence of substantive procurement specialist assigned to the project at commencement, constituted a huge setback to implementation. It was not until mid-2008 when the project temporarily engaged the services of a procurement specialist to assist streamline and fast track procurement procedures that the sub component began to see improvement. However, the performance of some of the consultants and contractors engaged on the civil works, particularly construction of dug outs in the Northern region, were unsatisfactory leading to further delays in implementation and sub-optimal quality of the works. In order to remedy this weakness, the PMU assigned experts from the Ghana Irrigation Development Authority (GIDA) oversight responsibilities over all the civil works. Among others, they were tasked to provide PMU with frequent updates on the status of work done; including quality and adherence to schedules at every stage of implementation. To ensure that Bank procedures and implementation deadlines were adhered to, a number of fact finding missions were embarked upon by the Bank to the country. During such Missions regular consultations were held between the mission team and PMU and with other key stakeholders. Complementary to this, field visits were often performed by the team to project locations to apprise themselves of progress of implementation. The project was originally planned to close by December 31, 2008. However, upon recommendations by the mid-term review team and an official request submitted by the Government of Ghana, the deadline for last disbursement was extended to end December, 2010 – a two-year (24 months) slippage. The recommendation was largely predicated on the challenges to implementation on key aspects of project components, in particular credit and civil works (civil work constitutes about 17% of total project cost) which resulted in significantly low disbursement rate (34.52%) as at end 2008. An additional extension of six months was requested, and granted by the Bank, to allow payments of works that went beyond 31 December 2010 bringing the new closing date to June 30, 2011.
2. Comment on the role of other partners (e.g. donors, NGOs, contractors, etc.). Assess the effectiveness of co-financing arrangements and of donor coordination, if applicable.
No co-financing with other partners took place in the project. However, the Government of Ghana had a quarterly portfolio review aimed at assessing the performance of operations funded by donors. This event proved to be a good practice and is welcomed by the PTFs.
3. Harmonization. State whether the Bank made explicit efforts to harmonize instruments, systems and/or approaches with
18
other partners.
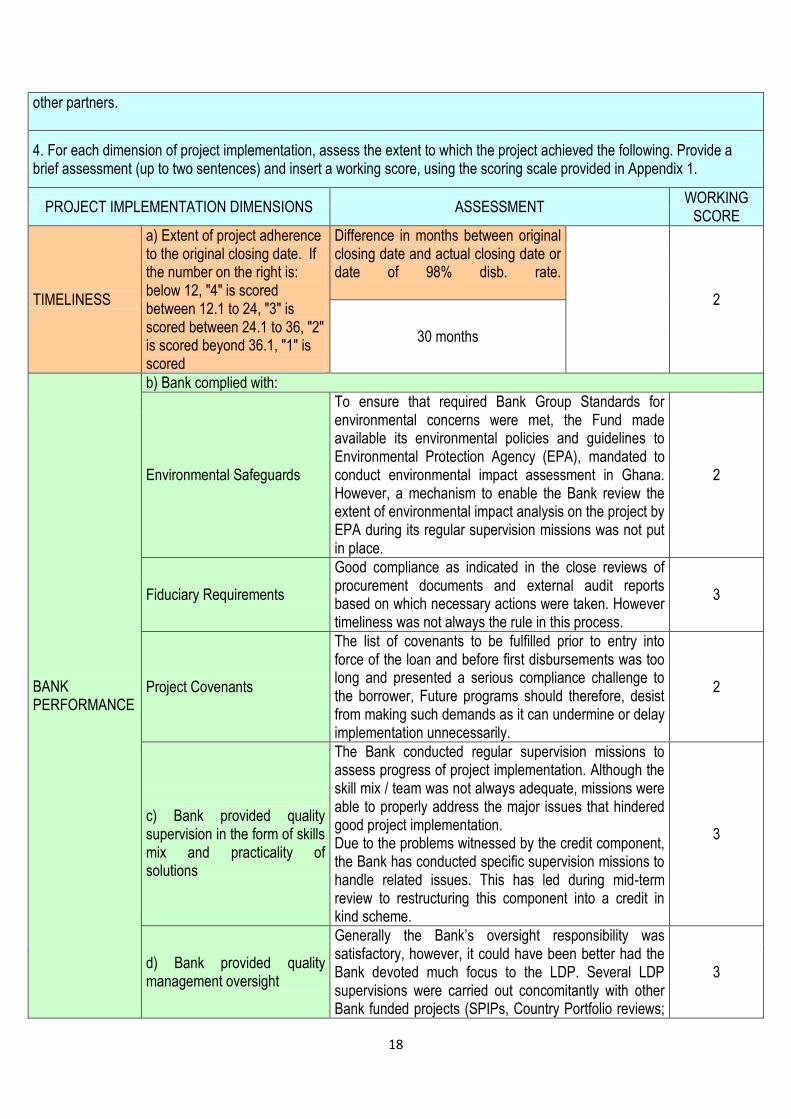
4. For each dimension of project implementation, assess the extent to which the project achieved the following. Provide a brief assessment (up to two sentences) and insert a working score, using the scoring scale provided in Appendix 1.
PROJECT IMPLEMENTATION DIMENSIONS ASSESSMENT WORKING
SCORE
TIMELINESS
a) Extent of project adherence to the original closing date. If the number on the right is: below 12, "4" is scored between 12.1 to 24, "3" is scored between 24.1 to 36, "2" is scored beyond 36.1, "1" is scored
Difference in months between original closing date and actual closing date or date of 98% disb. rate.
2
30 months
BANK PERFORMANCE
b) Bank complied with:
Environmental Safeguards
To ensure that required Bank Group Standards for environmental concerns were met, the Fund made available its environmental policies and guidelines to Environmental Protection Agency (EPA), mandated to conduct environmental impact assessment in Ghana. However, a mechanism to enable the Bank review the extent of environmental impact analysis on the project by EPA during its regular supervision missions was not put in place.
2
Fiduciary Requirements
Good compliance as indicated in the close reviews of procurement documents and external audit reports based on which necessary actions were taken. However timeliness was not always the rule in this process.
3
Project Covenants
The list of covenants to be fulfilled prior to entry into force of the loan and before first disbursements was too long and presented a serious compliance challenge to the borrower, Future programs should therefore, desist from making such demands as it can undermine or delay implementation unnecessarily.
2
c) Bank provided quality supervision in the form of skills mix and practicality of solutions
The Bank conducted regular supervision missions to assess progress of project implementation. Although the skill mix / team was not always adequate, missions were able to properly address the major issues that hindered good project implementation. Due to the problems witnessed by the credit component, the Bank has conducted specific supervision missions to handle related issues. This has led during mid-term review to restructuring this component into a credit in kind scheme.
3
d) Bank provided quality management oversight
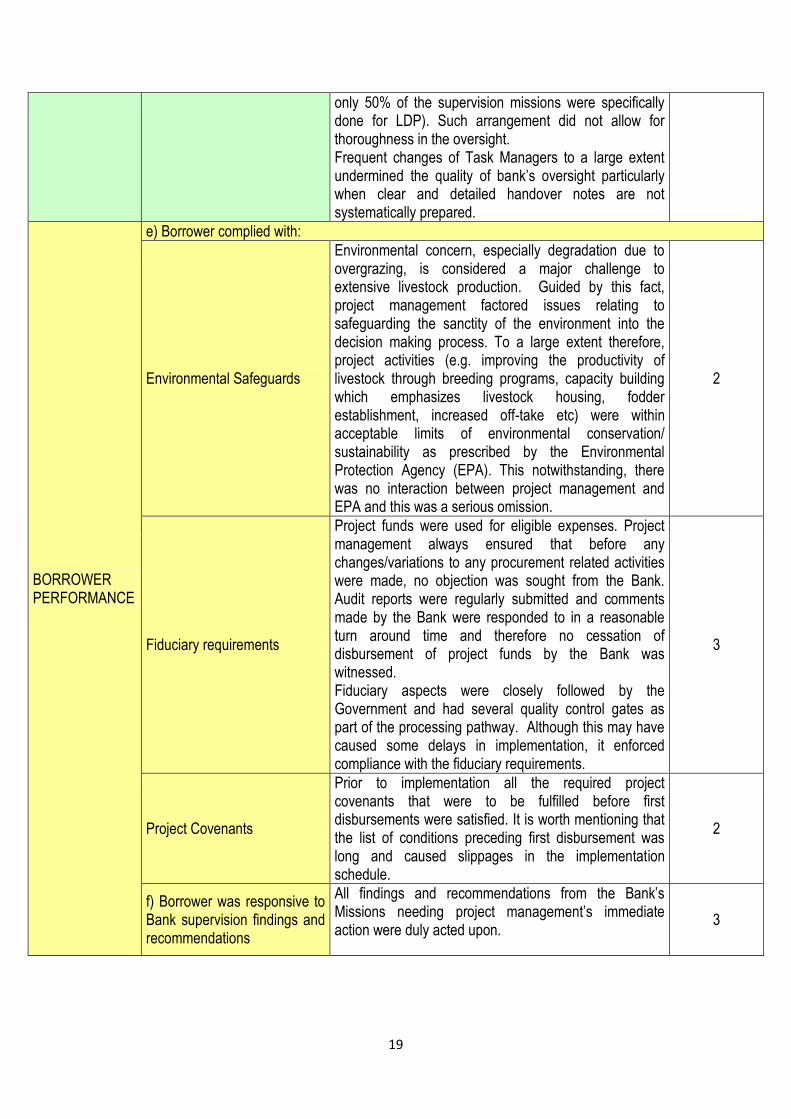
Generally the Bank’s oversight responsibility was satisfactory, however, it could have been better had the Bank devoted much focus to the LDP. Several LDP supervisions were carried out concomitantly with other Bank funded projects (SPIPs, Country Portfolio reviews;
3
19
only 50% of the supervision missions were specifically done for LDP). Such arrangement did not allow for thoroughness in the oversight. Frequent changes of Task Managers to a large extent undermined the quality of bank’s oversight particularly when clear and detailed handover notes are not systematically prepared.
BORROWER PERFORMANCE
e) Borrower complied with:
Environmental Safeguards
Environmental concern, especially degradation due to overgrazing, is considered a major challenge to extensive livestock production. Guided by this fact, project management factored issues relating to safeguarding the sanctity of the environment into the decision making process. To a large extent therefore, project activities (e.g. improving the productivity of livestock through breeding programs, capacity building which emphasizes livestock housing, fodder establishment, increased off-take etc) were within acceptable limits of environmental conservation/ sustainability as prescribed by the Environmental Protection Agency (EPA). This notwithstanding, there was no interaction between project management and EPA and this was a serious omission.
2
Fiduciary requirements
Project funds were used for eligible expenses. Project management always ensured that before any changes/variations to any procurement related activities were made, no objection was sought from the Bank. Audit reports were regularly submitted and comments made by the Bank were responded to in a reasonable turn around time and therefore no cessation of disbursement of project funds by the Bank was witnessed. Fiduciary aspects were closely followed by the Government and had several quality control gates as part of the processing pathway. Although this may have caused some delays in implementation, it enforced compliance with the fiduciary requirements.
3
Project Covenants
Prior to implementation all the required project covenants that were to be fulfilled before first disbursements were satisfied. It is worth mentioning that the list of conditions preceding first disbursement was long and caused slippages in the implementation schedule.
2
f) Borrower was responsive to Bank supervision findings and recommendations
All findings and recommendations from the Bank’s Missions needing project management’s immediate action were duly acted upon.
3

20
The Government of Ghana instituted an ADB Desk in the External Resources Mobilization (Multilateral) Directorate within the Ministry of Finance and Economic Planning) and this has contributed to improving the communication between the Bank and the Government.
g) Borrower collected and used monitoring information for decision making
Project design lacked clarity in how M&E was to be done. There was no M&E plan at project outset. The MTR identified the inherent weaknesses of the project M&E and recommended its restructuring with the engagement of an M&E specialist. This resulted in significant improvement in project M&E. M&E plan was prepared and an effective M&E system put in place. The lack of good quality supervision of civil works (engaged by the Government) was another setback.
2
G. COMPLETION
1. IS THE PCR DELIVERED ON A TIMELY BASIS, IN COMPLIANCE WITH BANK POLICY?
Date project reached 98% disb. Rate (or closing date if applicable)
Date PCR was sent to [email protected] MM/DD/YY
Difference in months
WORKING SCORE if the difference is 6 months or less, a 4 is scored. If the difference is 6.1 or more, a 1 is scored
June 30 2011 November 1st 2011
4 months
4
2. Briefly describe the PCR Process. Describe the Borrower’s and co-financers' involvement in producing the document. Highlight any major differences of opinion concerning the assessments made in this PCR. Describe the team composition and confirm whether a site visit was undertaken. Mention any major collaboration from other development partners. State the extent of field office involvement in producing the report. Indicate whether comments from Peer Reviewers were received on time (provide names and positions of Peer Reviewers). [100 words maximum]
A working group (WG) comprising members of the PMU and representatives from the key implementing agencies (APD and VSD) was put together to prepare the PCR. The produced draft report was widely circulated for comments from key stakeholders; including the PSC and implementing districts. The relevant comments received from the various sources have been incorporated into the final report, to further enrich it. Additionally, other gaps identified were accounted for by visits to the field to gather relevant information and, where necessary, this was complemented with secondary sources. The Bank’s mission in June 2011 reviewed the draft PCR, conducted field visits and held extensive discussions with various stakeholders. It examined previous supervision missions’ aide memoires and progress reports. These activities were carried out to enable evidence based assessment/validation of the report and information cross-checks to be made. The mission team had an OSAN.2 PL located at the GHFO and consulted with CPO from GHFO at the onset and during the mission. Both the Bank and the Government reviewed and validated the analysis made and the conclusions drawn by the mission.
H. LESSONS LEARNED
Summarize key lessons for the Bank and the Borrower suggested by the project’s outcomes [250 words maximum. Any additional narrative about lessons learned, if needed, must be placed in Annex 6: Project Narrative]
Participatory Approach to Project implementation with beneficiaries both at national and district levels deepened ownership and ensured continuous community support and commitment to implementation of most project activities. The inclusion of capacity building as a key project component was very appropriate. The participatory approach employed in

21
training, engendered increased commitment, interest and ownership, as manifested in the generally high recorded uptake of the various newly introduced innovations/technologies. These good practices need to be promoted through up- and out-scaling using public resources. As indicated in the Loan Agreement, the list of conditions preceding the first disbursement was long (6 conditions). Therefore projects first disbursement was significantly delayed (23 months after approval and 14 months after Loan signature) which subsequently penalized project implementation. Conditions preceding first disbursement should be few, simple, implementable and relevant to avoid project start up delays. Procurement. The LDP utilized the existing Ag. Sector Services Investment Program (AgSSIP) procurement arrangements. Submerging the LDP procurement activities under the AgSSIP implied overburdening its experts to the extent that attention had to be diluted and largely accounted for the serious procurement challenges encountered, in particular those relating to civil works. Consequently, brining more delegation of authority to the executing agencies and the PMUs should be the rule in future operations. Task managers play essential role in project implementation as they form a critical link between the borrower (implementing agency) and the Bank / Fund. Frequent changes of task managers, as was the case of this project, therefore, have the propensity to disrupt project implementation and as a consequence undermine the adherence to deadlines and ultimately the timely achievement of project objectives. The Bank should then refrain from such practice unless highly justified and should enforce the practice of leaving clear handover notes by the outgoing TM. Implementation arrangements with national partners. The Monitoring and Evaluation dimension of the LDP could have been better structured and made more effective if the responsibilities of the Livestock Planning and Information Unit (LPIU) tasked with such assignment had been clearly articulated in the design and adequately resourced to undertake its mandate. Likewise, this was the case for GIGA (for the supervision of civil works) and EPA (for the implementation of the assessment of the environmental impact). This underscores the vital importance of clearly articulating the content, the implementation modalities and responsibilities and the dedicated resources in the Implementation Agreements between projects and other national implementing agencies. Cash Credit provision constituted an important component of the Livestock project. However, the performance of the credit component was unsatisfactory and was therefore converted to in kind credit; the latter enjoyed a good success rating by the Government and the beneficiaries. The lack of success in implementing an activity should not be detrimental to the whole project. Exploring other alternatives and back up plans should always be sought by the Borrower and the Bank. The analytical work during or prior to appraisal did not seem to have been thoroughly done leading to lack of data on the situation prior to project implementation. The baseline study along with the monitoring and evaluation system was launched only three years after the project had started leading to some difficulties in accurately assessing the actual achievements in terms of outputs and outcomes due to project activities. Analytical and sector work before project appraisal is key to successful implementation and M&E efforts. No baseline data existed or were collected prior or at the time of project design. This was done, belatedly, three (3) years (2006) during implementation. This bad practice was overlooked by the Bank and the borrower hampering the setting up of a good M&E system. Baseline data collection, usually postponed to beyond project start up should be a high priority activity during implementation. On the sector side, proximity to market appeared to have a positive correlation to off-take rate (15% in herds closer to urban centers / markets vs 10% in outlying communities). This implies that connecting livestock producers to market is of paramount importance and should therefore be promoted in Bank’s operations. This has positive effect on production efficiency and natural resources management.
I. PROJECT RATINGS SUMMARY
All working scores and ratings must be found in the relevant section in the PCR. For example, please insert the “Overall Output score” in Section D.I. in the “Achievement of Outputs” box below.
CRITERIA SUB-CRITERIA WORKING SCORE
PROJECT OUTCOME
Achievement of outputs (insert score from Section D.I.) 3
Achievement of outcomes (insert score from Section D.I.) 3
Timeliness (insert score from Section F.4.) 2

22
OVERALL PROJECT OUTCOME SCORE (score average) 3
BANK PERFORMANCE
Design and Readiness
Project Objectives were relevant to country development priorities. (insert score from Section C.3.)
4
Project Objectives could in principle be achieved with the project inputs and in the expected time frame. (insert score from Section C.3.)
3
Project Objectives were consistent with the Bank’s country or regional strategy (insert score from Section C.3.)
4
Project Objectives were consistent with the Bank’s corporate priorities (insert score from Section C.3.) 4
The log frame presents a logical causal chain for achieving the project development objectives. (insert score from Section C.5.) 2
The log frame expresses objectives and outcomes in a way that is measurable and quantifiable. (insert score from Section C.5.) 3
The log frame states the risks and key assumptions. (insert score from Section C.5.) 2
Project complexity was matched with country capacity and political commitment. (insert score from Section E.2.) 3
Project design includes adequate risk analysis. (insert score from Section E.2.) 3
Project procurement, financial management, monitoring and/or other systems were based on those already in use by government and/or other partners. (insert score from Section E.2.) 4
Responsibilities for project implementation were clearly defined. (insert score from Section E.2.) 4
Necessary implementation documents (e.g. specifications, design, procurement documents) were ready at appraisal. (insert score from Section E.2.) 2
Monitoring indicators and monitoring plan were agreed upon during design. (insert score from Section E.2.) 2
Baseline data was available or were collected during design. (insert score from Section E.2.) 2
PROJECT DESIGN AND READINESS SUB-SCORE (score average) 3
Supervision:
Bank complied with:
Environmental Safeguards (insert score from Section F.4.) 2
Fiduciary Requirements (insert score from Section F.4.) 3
Project Covenants (insert score from Section F.4.) 2
Bank provided quality supervision in the form of skills mix provided and practicality of solutions. (insert score from Section F.4.)
3
Bank provided quality management oversight. (insert score from Section F.4.)
3
PCR was delivered on a timely basis (insert score from Section G) 4
SUPERVISION SUB-SCORE (score average) 3
OVERALL BANK PERFORMANCE SCORE (score average) 3
BORROWER PERFORMANCE
Design and Readiness
Responsibilities for project implementation are clearly defined. (insert 4

23
score from Section E.2)
Necessary implementation documents (e.g. specifications, design, procurement documents) are ready at appraisal. (insert score from Section E.2)
2
Monitoring indicators and monitoring plan are agreed upon and baseline data are available or are being collected. (insert score from Section E.2)
2
Baseline data was available or were collected during design. (insert score from Section E.2.)
2
PROJECT DESIGN AND READINESS SCORE (score average) 3
Implementation
Borrower complied with:
Environmental Safeguards (insert score from Section F.4) 2
Fiduciary Requirements (insert score from Section F.4) 3
Project Covenants (insert score from Section F.4) 2
Borrower was responsive to Bank supervision findings and recommendations. (insert score from Section F.4)
3
Borrower collected and used of monitoring information for decision-making. (insert score from Section F.4)
2
IMPLEMENTATION SUB-SCORE (score average) 2
OVERALL BORROWER PERFORMANCE SCORE (score average) 3
J. PROCESSING
STEP SIGNATURE AND COMMENTS DATE
Sector Manager Clearance
Regional Director Clearance
Sector Director Approval

24
LIST OF APPENDICES
APPENDIX 1. Scale of Working Score and Ratings
APPENDIX 2. Project Cost and Financing
APPENDIX 3. Bank Inputs
APPENDIX 4. Economic and Financial Analysis
APPENDIX 5. Procurement Contracts
Appendix 6. List of Supporting Documents
Project Narrative. Project Logical Framework

25
APPENDIX 1 : Scale for Working Scores and Ratings
SCORE EXPLANATION
4 Very Good- Fully achieved with no shortcomings
3 Good- Mostly achieved despite a few shortcomings
2 Fair- Partially achieved. Shortcomings and achievements are roughly balanced
1 Poor- Very limited achievement with extensive shortcomings
NA Non Applicable
Note: The formulas round up or down for decimal points. Only whole numbers are computed.

26
APPENDIX 2: Project Costs and Financing
APPENDIX 2a: Project costs (summary) by component
Project components (Cedis Million) (UA ‘000)
Local Foreign Total Local Foreign Total % Foreign
Exchange
1 Animal Production 19,638.61 46,096.45 65,735.07 2,180.94 5,119.19 7,300.13 70
2 Animal Health 3474.75 17,206.80 20,681.55 385.88 1,910.88 2,296.77 83
3 Credit - 37,322.00 37,322.00 - 4,144.75 4,144.75 100
4 Capacity Building 2505.99 40,056.95 42,562.94 278.30 4,448.48 4,726.78 94
5 Project Management 5,060.45 12,622.23 17,682.78 561.98 1,401.76 1,963.74 71
Total baseline cost 30,679.80 153,304.54 183,984.33 3,407.11 17,025.06 20,432.17 83
Physical contingencies 607.08 6,876.40 7,483.48 67.42 763.65 831.07 92
Price contingencies 2,595.61 4,708.33 7,303.94 288.25 522.88 811.13 64
Total project cost 33,882.49 164,889.26 198,771.75 3,762.78 18,311.59 22,074.37 83
APPENDIX 2b: Financing by source of funds (UA ‘000,000)
Sources Foreign Exchange Local Costs Total Costs % of Total Cost
ADF 18.17 1.41 19.58 88.7
Government 0.14 2.31 2.45 11.1
Beneficiaries 0.00 0.04 0.04 0.2
TOTAL 18.31 3.76 22.07 100

27
APPENDIX 3 : Bank Inputs BANK'S CONTRIBUTION
No. Date Mission Type No. of mission
members
Composition PERFORMANCE RATING
1 26 Apr-15 May, 2001 Appraisal 3 M. M. Sabri, Principal Socio-Economist (Team Leader)
NA E. Kasalu-Coffin, Snr. Agricultural Economist
D. Bucher, Snr. Gender Specialist
2 12-29 Nov., 2002 Launching 3 E. Kasalu-Coffin, Snr. Agricultural Economist (Team Leader)
NA E. Mohammed, Principal Agricultural Economist
H. Dosso, Senior Agronomist
3 12-26 July, 2003 Supervision 2 E. Kasalu-Coffin, Snr. Agricultural Economist (Team Leader) 2,3
8 Non
PP/PPP J. Mensah-Quainoo, Chief Procurement Specialist
4 14-21 Nov., 2003 Supervision 1 E. Kasalu-Coffin (Snr. Agricultural Economist
2,07
Non PP/PPP
5 30 Aug-17 Sept., 2004
Internal Audit 2 F. L. Bishota-Folquet NA
R. Mammah
6 26 Sept-15 Oct., 2004 Supervision 2 A. Gombe, Principal Agronomist 2,18
Non PP/PPP H. Dosso, Senior Agronomist
7 25-29 April, 2005 Supervision 1 E. Mohammed, Principal Agricultural Economist (Mission Leader)
2,13
Non PP/PPP
8 9-20 May, 2005 Financial Supervision & General Loan Administration
1 D. Kishosha, Disbursement Officer
NA
9 3-21 Oct., 2005 Country Porfolio Review and Supervision
4 A. Jeng, Division Manager, (Team Leader)
Not rated in SAP J. Ndenzako, Senior Country Economist
R. Sherman, Transport Engineer
N. Okagbue, Principal Health Expert
10 9-25 June, 2006 Supervision 3 A. Khumbanyiwa, Forestry Officer 2,19
Non PP/PPP
O. Oladapo, Agricultural Economist
R. Lubunga, Irrigation Engineer
11 13 - 27 Nov., 2006 Supervision 3 A. Khumbanyiwa, Forestry Officer 2,06
Non PP/PPP
O. Oladapo, Agricultural Economist
R. Lubunga, Irrigation Engineer
12 3-21 Dec. 2005 Agricultural Sector 2 R. Lubunga, Irrigation Engineer 2,0 Non

28
Portfolio Imporvement
Mission
H. Minaar, Ag. Economist 6 PP/PPP
13 9 - 25 June, 2006 Aide mémoire not found in project file 2.19
Non PP/PPP
14 08 - 25 Nov., 2006 Agricultural Sector Portfolio
Imporvement Mission
3 A. Khumbanyiawa (Forestry Specialist) 1,80
Non PP/PPP
O. Oladapo ( Ag. Economist)
R. Lubunga (Irrigation Rngineer)
15 16 Sep. - 8 Oct. 2007 Joint supervision nmission
3 H. Dosso (Agronomist) 1,80
Non PP/PPP
E. Mohamed (Ag. Economist)
R. Lubunga (Irrigation Rngineer)
16 21 April- 11 May 2008 Agricultural Sector Portfolio
Imporvement Mission
7 D. Keita, Ag. Manager of OSAN 2
1,65
Non PP/PPP
E. Mohammed, Agricultural Economist (Mission Leader)
Rogers Lubunga, Irrigation Engineer
Vincent Castel. Livestock Officer
Wael Soliman, Hydrologist
Moses Ayiemba Banda Ngenge, Procurement Officer
I. Brefo-Sekyere, Procurement Officer
17 9-19 Dec. 2008 Supervision Mission
4 P. Agboma, Country Programme Officer
1,72
PP P. Boahen, Agriculture Expert
N. Derby, Private Sector Specialist
I. Brefo-Sekyere, procurement Assistant
18 04-18 April, 2009 Agricultural Sector Portfolio
Improvement Mission
7 E. Mohammed, Agricultural Economist (Mission Leader)
2,06
Non PP/PPP
R. Lubunga, Irrigation Engineer
B. Boulanour, Livestock Officer
U. Boysen, Agro-Industry Specialist
P. Boahen, Agricultural Expert
A. Mwangi, Forestry Officer
M. Kurzweil, Agricultural Economist
19 1-12 December, 2009 Supervision Mission
5 H. Dosso, Agronomist (Mission Leader)
2,13
Non PP/PPP
P. Boahen, Agricultural Expert
M. Kurzweil, Agricultural Economist
A. Owusu-Mensah, Financial Management Specialist
D. Osei-Boakye, Procurement Assistant
20 14 June-02 July 2010 Agricultural Sector Portfolio
Improvement Mission
6 R. Lubunga, Principal Irrigation Engineer (Team Leader) 2,1
1 Non
PP/PPP B. Boulanour, Livestock Officer
P. Boahen, Agricultural Expert
29
M. Kurzweil, Agricultural Economist
A. Owusu-Mensah, Financial Management Specialist
I. Brefo-Sekyere, Procurement Officer
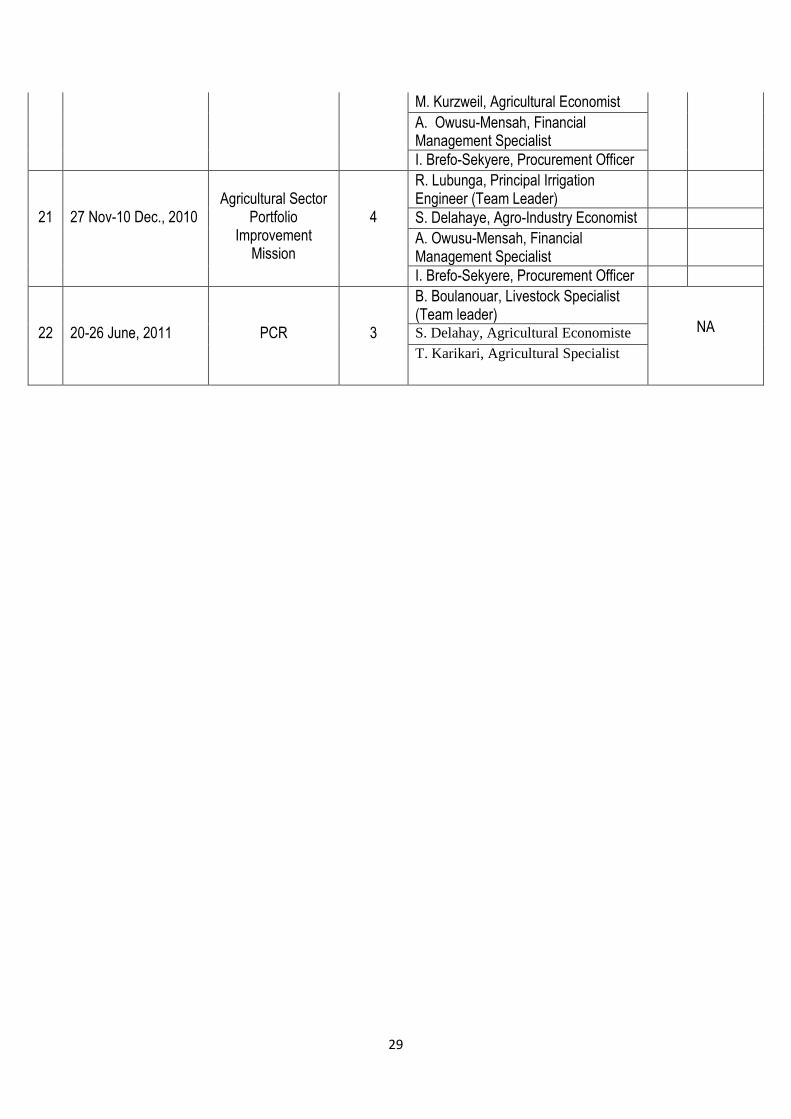
21
27 Nov-10 Dec., 2010
Agricultural Sector
Portfolio Improvement
Mission
4
R. Lubunga, Principal Irrigation Engineer (Team Leader)
S. Delahaye, Agro-Industry Economist
A. Owusu-Mensah, Financial Management Specialist
I. Brefo-Sekyere, Procurement Officer
22
20-26 June, 2011
PCR
3
B. Boulanouar, Livestock Specialist (Team leader)
NA
S. Delahay, Agricultural Economiste
T. Karikari, Agricultural Specialist

30
APPENDIX 4: Economic and Financial Analysis
Re-estimate the economic rates of return based on costs and benefits at completion, and compare with apprailsal estimates. Break down by components as appropriate. Analyze the sensitivity of the ERR to key assumptions. Present a financial analysis for project beneficiary entities. 3.1 Financial Analysis The financial analysis presented in this report is predicated on livestock data collected continuously (on quarterly bases) over a five–year period (2006-2010), during project implementation, from both project beneficiaries (with project) and non-project beneficiaries (without project/intervention). The variables of interest included: livestock numbers (open and closing stocks); births; mortalities, off-take (off-take components include: sales, consumption, gifts), livestock purchases and prices, among others. Average annual stock size (number of animals) per farmer was then derived for both “with” (project beneficiary) and “without” project (non beneficiary). This was then monetized (monetary value of livestock derived) using the prevailing market prices of livestock, over the project years. This then constituted the streams of benefits that accrued to both the “with” and “without” project participants. Data was also collected on expenditure patterns of livestock farmers, in particular, on medication, feeding, labour (hired and family), housing etc. The cost streams utilized in the financial analysis thus, derived from these. Derivation of Incremental Net Benefit (Incremental Cash Flow) The residual value arising from the deduction of “with” project cost streams from project earnings (benefit streams) is the net benefit streams (NBS). Deducting the “without” project net benefits from this gives the incremental net benefit streams (INBS) commonly referred to as cash flows. Presented below (section 3.1.1) are the cash flows for the various livestock enterprises covered in this report; goat, sheep, pig and cattle. The analysis shows that at the opportunity cost of capital of 30%, adopting project interventions is attractive at financial rates of return (FIRR) of 53.3%, 80.5%, and 61% respectively to goats, sheep and pigs. For cattle holders, the benefits arising from the intervention are so huge that even at FIRR of 216% the enterprise remained significantly attractive. The analysis also covered the overall livestock situation (aggregate cash flow). Both the benefit and cost streams of the different livestock enterprises (i.e. cattle, sheep, goats and pigs) were aggregated and discounted (at 30% Discount rate). The aggregate financial benefits from the overall livestock production system computed against total costs generated a financial rate of return (FIRR) of 180% - representing 253% change over project target of FIRR 51%. Table 3.1 summarizes the financial analysis. Analytical results of the financial analysis (financial rates of return computation) are also presented in section 3.11
Table 3.1 Summary of Financial Analysis
Species Type FIRR NPV at 30% opportunity cost of capital (GH¢)
Project target (Global)* 51%
Aggregate Cash Flow (Global
Achievement -all species)
180% 38,556.47
Goat 53.3% 205.07
Sheep 80.5% 1073.2
Pig 61% 555.80
Cattle 216% 36,692.3
*Project target used 12% discount rate

31
3.1.1 Project Cash Flows (financial Analysis)
3.1.1.1 GOAT ENTERPRISE
Table 3.2 Cash Flow for Goat Enterprise ((Assume project life of 30 years)
(With and Without Project)
PJ YEAR
0 1 2 3 4 5 6 7-29
Stock Size (No.) WP 15 22 30 35 35 35 35 35
Value (Market Price of Goat) GH¢60
Revenue
975.00
1,430.00
1,950.00
2,275.00
2,275.00
2,275.00
2,275.00
2,275.00
Expenditure
2,488.00
1,488.00
1,488.00
1,488.00
1,538.00
1,488.00
1,488.00
1,488.00
(1,513.00)
(58.00)
462.00
787.00
737.00
787.00
787.00
787.00
Stock Size (No.) WOP 15 20 25 30 30 30 30 30
Price of goat (GH¢60)
Revenue
975.00
1,300.00
1,625.00
1,950.00
1,950.00
1,950.00
1,950.00
1,950.00
Expenditure 2,320.00 1,320.00 1,320.00 1,320.00 1,370.00 1,320.00 1,320.00 1,320.00
(1,345.00)
(20.00)
305.00
630.00
580.00
630.00
630.00
630.00
Incremental Net Benefit (INB)
(168.00)
(38.00)
157.00
157.00
157.00
157.00
157.00
157.00
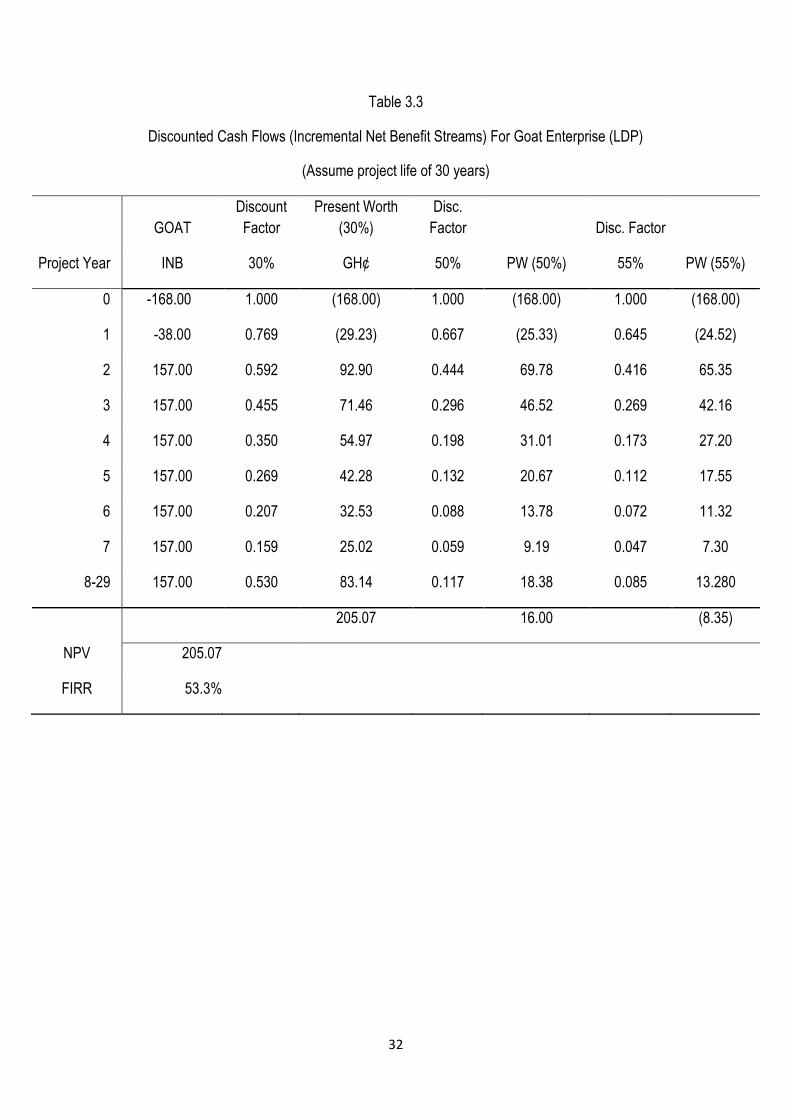
32
Table 3.3
Discounted Cash Flows (Incremental Net Benefit Streams) For Goat Enterprise (LDP)
(Assume project life of 30 years)
GOAT
Discount
Factor
Present Worth
(30%)
Disc.
Factor Disc. Factor
Project Year INB 30% GH¢ 50% PW (50%) 55% PW (55%)
0 -168.00 1.000 (168.00) 1.000 (168.00) 1.000 (168.00)
1 -38.00 0.769 (29.23) 0.667 (25.33) 0.645 (24.52)
2 157.00 0.592 92.90 0.444 69.78 0.416 65.35
3 157.00 0.455 71.46 0.296 46.52 0.269 42.16
4 157.00 0.350 54.97 0.198 31.01 0.173 27.20
5 157.00 0.269 42.28 0.132 20.67 0.112 17.55
6 157.00 0.207 32.53 0.088 13.78 0.072 11.32
7 157.00 0.159 25.02 0.059 9.19 0.047 7.30
8-29 157.00 0.530 83.14 0.117 18.38 0.085 13.280
205.07 16.00 (8.35)
NPV 205.07
FIRR 53.3%
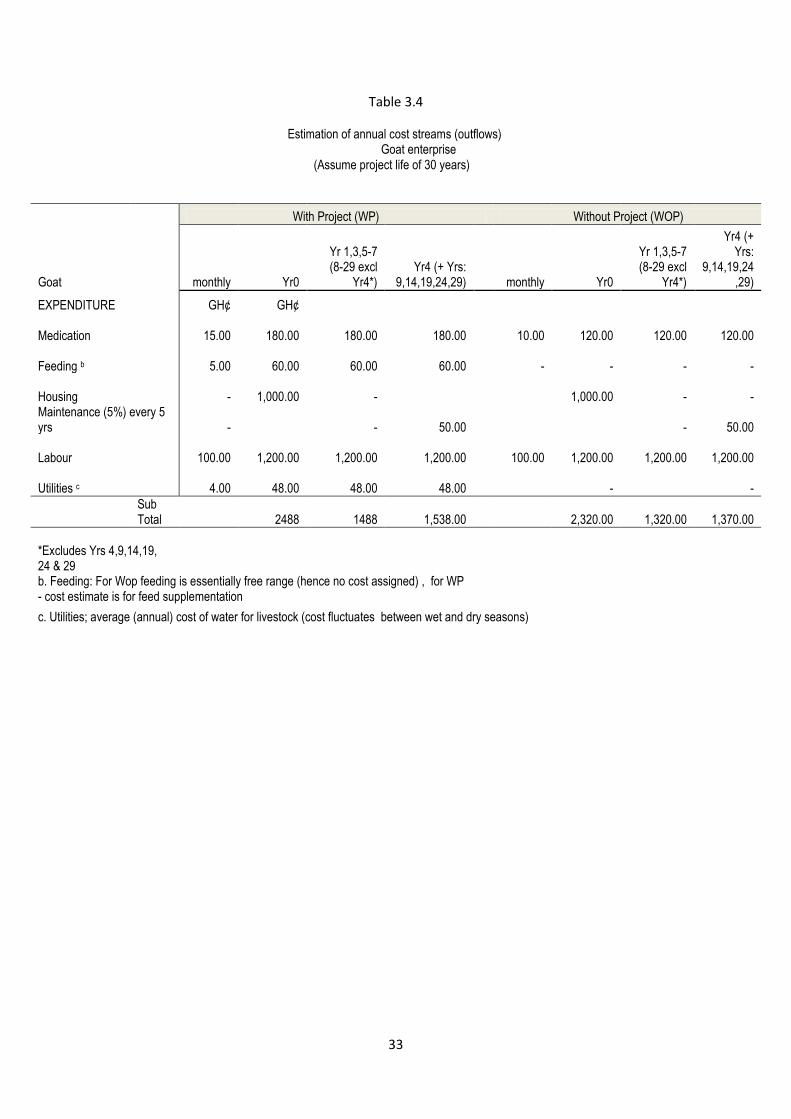
33
Table 3.4
Estimation of annual cost streams (outflows)
Goat enterprise
(Assume project life of 30 years)
With Project (WP) Without Project (WOP)
Goat monthly Yr0
Yr 1,3,5-7 (8-29 excl
Yr4*) Yr4 (+ Yrs:
9,14,19,24,29) monthly Yr0
Yr 1,3,5-7 (8-29 excl
Yr4*)
Yr4 (+ Yrs:
9,14,19,24,29)
EXPENDITURE GH¢ GH¢
Medication
15.00
180.00
180.00
180.00
10.00
120.00
120.00
120.00
Feeding b
5.00
60.00
60.00
60.00
-
-
-
-
Housing
-
1,000.00
-
1,000.00
-
- Maintenance (5%) every 5 yrs
-
-
50.00
-
50.00
Labour
100.00
1,200.00
1,200.00 1,200.00
100.00
1,200.00
1,200.00
1,200.00
Utilities c
4.00
48.00
48.00
48.00
-
-
Sub Total 2488 1488 1,538.00
2,320.00
1,320.00
1,370.00
*Excludes Yrs 4,9,14,19, 24 & 29 b. Feeding: For Wop feeding is essentially free range (hence no cost assigned) , for WP - cost estimate is for feed supplementation
c. Utilities; average (annual) cost of water for livestock (cost fluctuates between wet and dry seasons)

34
3.1.1.2 SHEEP ENTERPRISE
Table 3.5 Cash Flow for Sheep Enterprise (Assume project life of 30 years)
(With and Without Project)
Project Year 0 1 2 3 4 5 6 7 8-29
Stock size (No.) WP 17 17 35 38 38 38 38 38 38 Price of sheep (GH¢90) Revenue
1,530.00
1,530.00
3,150.00
3,420.00
3,420.00
3,420.00
3,420.00
3,420.00
3,420.00
Expenditure
3,012.00
1,812.00
1,812.00
1,812.00
1,872.00
1,812.00
1,812.00
1,812.00
1,812.00
net benefit
(1,482.00)
(282.00)
1,338.00
1,608.00
1,548.00
1,608.00
1,608.00
1,608.00
1,608.00
Stock size (No.) WOP 17 17 27 30 30 30 30 30 30
Revenue
1,530.00
1,530.00
2,430.00
2,700.00
2,700.00
2,700.00
2,700.00
2,700.00
2,700.00
Expenditure
2,680.00
1,680.00
1,680.00
1,680.00
1,730.00
1,680.00
1,680.00
1,680.00
1,680.00
Net benefit
(1,150.00)
(150.00)
750.00
1,020.00
970.00
1,020.00
1,020.00
1,020.00
1,020.00
INB
(332.00)
(132.00)
588.00
588.00
578.00
588.00
588.00
588.00
588.00

35
Table 3.6 Discounted Cash Flows (Incremental Net Benefit Streams); Sheep Enterprise
(Assume project life of 30 years)
Pj Yr. Discount
Factor Present Worth
(30%) Discount
Factor Present Worth
(78%) Discount
Factor Present Worth
(82%)
INB (GH¢) 30% GH¢ 78% GH¢ 82% GH¢
0 -332.00 1.000 (332.00) 1.000 (332.00) 1.000 (332.000)
1 -132.00 0.769 (101.54) 0.562 (74.16) 0.549 (72.527)
2 588.00 0.592 347.93 0.316 185.58 0.302 177.515
3 588.00 0.455 267.64 0.177 104.26 0.166 97.536
4 588.00 0.350 205.88 0.100 58.57 0.091 53.591
5 588.00 0.269 158.37 0.056 32.91 0.050 29.446
6 588.00 0.207 121.82 0.031 18.49 0.028 16.179
7 588.00 0.159 93.71 0.018 10.39 0.015 8.890
8-29 588.00 0.530 311.39 0.0226 13.315 0.01844 10.841
1073.18 17.35 (10.53)
NPV (30%) 1073.18
Financial Rate of Return (FIRR) 80.5%

36
Table 3.7
Estimation of annual cost streams (outflows); sheep enterprise
(Assume project life of 30 years)
WITH PROJECT (WP) WITHOUT PROJECT (WOP)
Monthly Yr. 0 Yr (1-3,5-7 8-28) Yr. 4*
Monthly Yr. 0 Yr.1-3,5-7,8-28} Yr. 4 *
EXPENDITURE Ghana Cedis (GH¢) Ghana Cedis (GH¢)
MEDICATION
20.00
240.00 240.00
240.00 20.00
240.00 240.00
240.00
FEEDING
6.00
72.00 72.00
72.00
-
-
HOUSING (yr 0)
-
1,200.00 -
1,000.00 -
- Maintenance (5%) every 5 yrs
- -
60.00
- -
50.00
LABOUR
120.00
1,440.00 1,440.00
1,440.00 120
1,440.00 1,440.00
1,440.00
UTILITIES
5.00
60.00 60.00
60.00
-
Sub Total 150 30012 1812
1,872.00
2,680.00 1,680.00
1,730.00
*Yrs 4,9,14, 19, 24 & 29

37
3.1.1.3 PIG ENTERPRISE
Table 3.8
Cash Flow for Pig Enterprise (Assume project life of 30 years) (With and Without Project)
Project Year
a) With Project
Expenditure 0 1 2 3 4 5 6 7 8-29
Feeding
1,377.00
2,025.00
4,455.00
5,265.00
5,265.00
5,265.00
5,265.00
5,265.00
5,265.00
Medication (@ 5% Feed cost)
68.85
101.25
222.75
263.25
263.25
263.25
263.25
263.25
263.25
Housing
2,500.00
-
-
-
-
-
-
- Maintenance (every 5 years, @ 5% Cost of Housing)
125.00
Labour (hired) 1440.00 1440.00 2880.00 2880.00 2880.00 2880.00 2880.00 2880.00
2,880.00
Cost Streams
5,385.85
3,566.25
7,557.75
8,408.25
8,533.25
8,408.25
8,408.25
8,408.25
8,408.25
Revenue
Number of Pigs 17 27 55 65 65 65 65 65 65
Sale (GH¢150) 2,550.00 4,080.00 8,250.00 9,750.00 9,750.00 9,750.00 9,750.00 9,750.00 9,750.00
Residual value (assume 10% cost of construction; GH¢250 - at yr 29)
Net Benefit Streams (WP)
(2,835.85)
513.75
692.25
1,341.75
1,216.75
1,341.75
1,341.75
1,341.75
1,341.75
b) Without Project
Project Year
Expenditure 0 1 2 3 4 5 6 7 8-29
Feeding
1,606.50
2,490.08
3,307.50
4,063.50
4,063.50
4,063.50
4,063.50
4,063.50
4,063.50 Medication (@ 5% Feed cost)
80.33
124.50
165.38
203.18
203.18
203.18
203.18
203.18
203.18
Housing 2,000.00 - - - - - - - -
Maintenance (every 5 years, @ 5% Cost of Housing)
100.00 Labour (family/notional estimates)
1,200.00
1,200.00
1,200.00
1,200.00
1,200.00
1,200.00
1,200.00
1,200.00
1,200.00
4,886.83 3,814.58 4,672.88 5,466.68 5,566.68 5,466.68 5,466.68 5,466.68 5,466.68
Revenue
Number of Pigs
17
26
35
43
43
43
43
43
43
Sale (GH¢150)
2,550.00
3,952.50
5,250.00
6,450.00
6,450.00
6,450.00
6,450.00
6,450.00
6,450.00
Net Benefit Streams (WOP)

38
(2,336.83) 137.92 577.13 983.33 883.33 983.33 983.33 983.33 983.33
Incremental Net Benefit
(499.03)
375.83
115.13
358.43
333.43
358.43
358.43
358.43
358.43
Notes:
Feeding cost computation is based on several factors; including
Birth rates for both WP (60%) and without project (55%)
Composition of piglets and mature pigs in the flock (holding), varied for both with and without project situation, because of varying birth rates and size of holdings
Different feeding regimen for both pigs (mature) and piglets, hence initial feeding cost higher for WOP than WP (more matured pigs in years 0 to 1 for WOP than is the case for WP)
Characteristics of Without Project Investment
Relatively limited/low investments
Labour; Family labour largely used (notional estimates)
Mode of Feeding; Usually mix - some operators allow their animals to scavenge while others confine their stocks, therefore in aggregate terms investment in feed is relatively low compared to WP actors (raised under confinement, due largely to project intervention)
Housing; local materials constitute significant proportion; cost of construction therefore tends to be lower than that used by WP (construction is predominantly done to meet standard specification)

39
Computing for Financial Rate of Return (FIRR): Pig Enterprise
Table 3.9
Discounted Cash Flows (Incremental Net Benefit Streams)
(Assume project life of 30 years)
Discount
Factor Present Worth
(30%) Disc. Factor (DF) PW (60%) DF PW (65%) Pj Yr. INB 30% GH¢ 60% GH¢ 65% GH¢
0 499.03 1.000 (499.03) 1.000 (499.03) 1.000 (499.03)
1 375.83 0.769 289.10 0.625 234.89 0.606 227.78
2 115.13 0.592 68.12 0.391 44.97 0.367 42.29
3 358.43 0.455 163.14 0.244 87.51 0.223 79.79
4 333.43 0.350 116.74 0.153 50.88 0.135 44.98
5 358.43 0.269 96.53 0.095 34.18 0.082 29.31
6 358.43 0.207 74.26 0.060 21.36 0.050 17.76
7 358.43 0.159 57.12 0.037 13.35 0.030 10.76
8-29 358.43 0.530 189.81 0.062 22.25 0.046 16.561
555.80 10.37 (29.79)
NPV (30%) 555.80
FIRR 61%

40
Table 3.10
Estimation of annual cost streams (outflows); Pig Enterprise
(Assume project life of 30 years)
a) Estimation of Feeding Cost
WP WOP
Yr 0 Yr1. Yr2 Yr3 Yr4-29 Yr 0 Yr1. Yr2 Yr3 Yr4-29
Stock size (no.) 17 25 55 65 65 17
26
35
43
43
Feed (kg):
Pigs (mature) 1836.00 2700.00 5940.00 7020.00 7020.00 2524.50 3912.98 5197.50 6385.50 6385.50
piglets 918 1350 2970 3510 3510 689 1067.18 1417.50 1741.50 1741.50
Total feed (kg) 2754 4050 8910 10530 10530 3213.00 4980.15 6615.00 8127.00 8127.00
50 kg bag (nos) 55 81 178 211 211 64 100 132 163 163
unit cost (GH¢) 25.00 25.00 25.00 25.00 25.00 25.00 25.00 25.00 25.00 25.00
Total Feed Cost (GH¢)
1,377.00
2,025.00
4,455.00
5,265.00
5,265.00 1606.50 2490.08 3307.50 4063.50 4063.50
Total Expenditure (Pig)
5,385.85
3,566.25
7,557.75
8,408.25
8,408.25 4886.83 3814.58 4672.88 5466.68 5466.68
b) Other costs
With Project (WP)
Without Project (WOP)
monthly (GH¢) Yr 0 Yr1. Yr2 Yr3-29
Monthly (GH¢) Yr 0 Yr1. Yr2 Yr3-29
Housing (Pig sty)
2,500.00 2000.00 Medication (@ 5% cost of feed)
68.85
101.25
222.75
263.25 80.33
124.50
165.38
203.18
*Labour 120.00
1,440.00
1,440.00
2,880.00
2,880.00 100 1200.00 1200.00 1200.00 1200.00
Sub Total
120.00
4,008.85
1,541.25
3,102.75
3,143.25
100.00
3,280.33
1,324.50
1,365.38
1,403.18
*Labour: hired labour usually used by WP and family labour (notional estimate) usually used by WOP (hence variation in monthly wages)

41
3.1.1.3 CATTLE ENTERPRISE
Table 3.11
Cash Flow for Cattle Enterprise (Assume project life of 30 years) (With and Without Project)
Project Year
WP 0 1 2 3 4 5 6 7
8-29
Cattle (No.) 24 24 59 71 71 71 71 71
71
Revenue Sale
16,800 16,800 41,300 49,700 49,700 49,700 49,700 49,700
49,700 Price of Cattle; (GH¢700 ) Expenditure 4,548.84 1,548.84 1,848.84 1,548.84 1,548.84 1,848.84 1,548.84 1,548.84 1878.84
NBS
12,251.16
15,251.16
39,451.16
48,151.16
48,151.16
47,851.16 48,151.16
48,151.16
47,821.16
WOP Cattle (No.)
24 24 40 47 47 47 47 47
47
Sale 16,800 16,800
28,000 32,900
32,900 32,900 32,900
32,900
32,900
Expenditure 2,820.32
820.32
1,120.30
820.32
820.32
1,120.32 820.32
820.32
1,120.32
NBS
13,979.68
15,979.68
26,879.68
32,079.68 32,079.68
31,779.68 32,079.68
32,079.68,
31,779.68
INBS
(1,758.52)
(758.52)
12,541.48
16,041.48
16,041.48
16,041.48 16,041.48
16,041.48
16,041.48

42
Computing for Financial Rate of Return (FIRR): Cattle Enterprise
Table 3.12 Discounted Cash Flows (Incremental Net Benefit Streams)
(Assume project life of 30 years)
Discount Factor Present Worth
(30%) DF Present Worth
(215%) DF Present Worth
(220%) Pj. Yr. INB 30% GH¢ 215% GH¢ 220% GH¢
0
(1,758.52) 1.00 (1,758.52) 1.000 (1,758.52) 1.000 (1,758.52)
1
(758.52) 0.77 (583.48) 0.317 (240.80) 0.313 (237.04)
2 12,541.48 0.59 7,420.99 0.101 1,263.94 0.098 1,224.75
3 16,041.48 0.46 7,301.54 0.032 513.23 0.031 489.55
4 16,041.48 0.35 5,616.57 0.010 162.93 0.010 152.98
5 16,041.48 0.27 4,320.44 0.003 51.72 0.003 47.81
6 16,041.48 0.21 3,323.41 0.001 16.42 0.001 14.94
7 16,041.48 0.16 2,556.47 0.000 5.21 0.000 4.67
8-29 16,041.48 0.53 8,495.04 0.000 2.425 0.000 2.12
NPV 36,692.47
36,692.47
16.57
(58.74)
FIRR 216%

43
Table 3.13 Estimation of annual cost streams (outflows); Cattle Enterprise
(assume project life of 30 years)
with project
Cattle Yr 0 (GH¢) Yrs. 1,3-29 Yrs. 5,8 -26
Medication 1,428.84 1,428.84 1,428.84
labour (hired) 1 120.00 120.00 120.00
housing (Kraal) Lump sum
- 3,000.00 - -
maintenance every 3 years (@10% cost of housing structure)*
- - 300.00
feeding (negligible)
- - - -
sub total - 4,548.84 1,548.84 1,848.84
without project
Cattle Yr 0 (GH¢) Yrs. 1,3-29 Yrs. 5,8 -26
Medication 786.84 786.84 786.84
labour (hired) 1 120.00 120.00 120.00
housing (Kraal) Lump sum
- 2,000.00 maintenance every 3 years (@10% cost of housing structure)*
- 300.00
feeding (negligible)
- - - -
sub total - 2,906.84 906.84 1,206.84
* Cost may vary every 3 years due to maintenance, effective year 2 then 5,8 , 11 through to 26 (for both WP & WOP)

44
Table 3.14 LIVESTOCK DEVELOPMENT PROJECT
Derivation of Aggregate Cash Flow (All Livestock species)
(Assume 30-year project life)
Project Year
0 1 2 3 4 5 6 7 8-29
With Project (WP)
Average stock size by type of species (no.)
Cattle 24 24 59 71 71 71 71 71 71
Goat 15 22 30 35 35 35 35 35 35
Pig 17 27 55 65 65 65 65 65 65
Sheep (no.) 17 17 35 38 38 38 38 38 38 Price of livestock by type –(GH¢)
Revenue (Monetary value)
700 Cattle
16,800.00
16,800.00
41,300.00
49,700.00
49,700.00
49,700.00 49,700.00
49,700.00
49,700.00
65 Goats
975.00
1,430.00
1,950.00
2,275.00
2,275.00
2,275.00 2,275.00
2,275.00
2,275.00
150 Pigs
2,550.00
4,080.00
8,250.00
9,750.00
9,750.00
9,750.00 9,750.00
9,750.00
9,750.00
90 Sheep
1,530.00
1,530.00
3,150.00
3,420.00
3,420.00
3,420.00 3,420.00
3,420.00
3,420.00
Total Inflow (WP)
21,855.00
23,840.00
54,650.00
65,145.00
65,145.00
65,145.00 65,145.00
65,145.00
65,145.00
Expenditure (GH¢)
Cattle
4,578.84
1,578.84
1,878.84
1,578.84
1,578.84
1,878.84 1,578.84
1,578.84
1,878.84
Goats
2,488.00
1,488.00
1,488.00
1,488.00
1,538.00
1,488.00 1,488.00
1,488.00
1,488.00
Pigs
5,385.85
3,566.25
7,557.75
8,408.25
8,533.25
8,408.25 8,408.25
8,408.25
8,408.25
Sheep
3,000.00
1,800.00
1,800.00
1,800.00
1,860.00
1,800.00 1,800.00
1,800.00
1,800.00
Total Outflow (WP)
15,452.69
8,433.09
12,724.59
13,275.09
13,510.09
13,575.09 13,275.09
13,275.09
13,575.09
Net Benefit Stream (WP)
6,402.31
15,406.91
41,925.41
51,869.91
51,634.91
51,569.91 51,869.91
51,869.91
51,569.91
Without Project (WOP)
Average stock size by type of species (no.)
Cattle
24
24
40
47
47
47
47
47
47
Goat
15
20
25
30
30
30
30
30
30
Pig
17
26
35
43
43
43
43
43
43
Sheep (no.)
17
17
27
30
30
30
30
30
30
700 Cattle
16,800
16,800
28,000
32,900
32,900
32,900
32,900
32,900
32,900

45
65 Goats
975
1,300
1,625
1,950
1,950
1,950
1,950
1,950
1,950 150
Pigs
2,550
3,953
5,250
6,450
6,450
6,450
6,450
6,450
6,450
90 Sheep
1,530
1,530
2,430
2,700
2,700
2,700
2,700
2,700
2,700
Total Inflow (WOP)
21,855
23,583
37,305
44,000
44,000
44,000
44,000
44,000
44,000
Expenditure (GH¢)
Cattle
2,820.32
820.32
1,120.32
820.32
820.32
1,120.32
820.32
820.32
1,120.32
Goats
2,320.00
1,320.00
1,320.00
1,320.00
1,370.00
1,320.00 1,320.00
1,320.00
1,320.00
Pigs
4,886.83
3,814.58
4,672.88
5,466.68
5,566.68
5,466.68 5,466.68
5,466.68
5,466.68
Sheep
2,680.00
1,680.00
1,680.00
1,680.00
1,730.00
1,680.00 1,680.00
1,680.00
1,680.00
Total Outflow 12,707.15
7,634.90
8,793.20
9,287.00
9,487.00
9,587.00 9,287.00
9,287.00
9,587.00
Net Benefit Stream (WOP)
9,148
15,948
28,512
34,713
34,513
34,413
34,713
34,713
34,413
Incremental Net Benefit (INB)
(2,745.55) (540.69) 13,413.61 17,156.91 17,121.91
17,156.91 17,156.91 17,156.91 17,156.91
Pj Yr. Discount
Factor Present
Worth (30%) Discount
Factor Present
Worth (170%) Discount Factor Present Worth
(180%)
INB (GH¢) 30% GH¢ 170% GH¢ 180% GH¢
0 -2745.55 1.000 (2,745.55) 1.000 (2,745.55) 1.000 (2,745.55)
1 -540.69 0.769 (415.92) 0.370 (200.26) 0.357 (193.10)
2 13413.61 0.592 7,937.04 0.137 1,840.00 0.128 1,710.92
3 17156.91 0.455 7,809.24 0.051 871.66 0.046 781.57
4 17121.91 0.350 5,994.85 0.019 322.18 0.016 278.56
5 17156.91 0.269 4,620.85 0.007 119.57 0.006 99.69
6 17156.91 0.207 3,554.50 0.003 44.28 0.002 35.60
7 17156.91 0.159 2,734.23 0.001 16.40 0.001 12.72
8-29 17121.91 a 0.530 b 9,067.20 0.0006 9.628 0.00041 7.05
38,556.47 277.92 (12.55)
NPV (30%) 38,556.47
Financial Rate of Return (FIRR) 180%
a: annual amounts for years 8 through 29. To get the total for the entire column, this amount must be multiplied by 22 or included 22 times b: 0.53 (8-29 years ) represents present value of an annuity factor for years 8 through 29 inclusive.

46
Notes Characteristics of Livestock Production in Ghana
Industry usually characterized by low investment
Feeding: Generally free range therefore cost of feeding usually negligible except for the monogastrics (pigs, poultry) and fatteners (those who fatten animals to sell; they zero grazed)
Investment usually goes into housing, medication
Labour Use (limited) -usually family labour used (commercial poultry production - beyond the scope of this report - and to some extent exotic pig production, however, may be produced under intensive systems therefore may require additional hired labour (besides family) - investment here tend to be relatively high especially with regard to cost of feeding)
o For cattle Fulani's may be used; cost components of labour may come either as cash or in kind (medical bills, accommodation, milk from cow etc.)
o Commercialization of livestock production – training of farmers in entrepreneurial skills pursued under the project; encouraged the growing use of hired labour by beneficiaries to improve upon the efficiency and effectiveness of the production process)
The reportedly low investment in livestock and the generally attractive market prices for livestock and livestock products, due in part to the growing demand for meat and meat products (especially during festive occasions), tend to make livestock rearing highly profitable, once the key challenges such as low productivity, diseases (including outbreaks) and dry season watering and feeding are brought under manageable levels/control
The interventions put in place by the LDP (including breed improvement, disease control, capacity building, good husbandry practices, commercialization of livestock production, etc.) to a large extent enabled most of the identifiable challenges to be addressed. This largely accounted for the high FIRR generated, especially for cattle. 3.2 Economic Analysis
Economic benefits accruing to the project are derived from the combined effect of animal production and veterinary
service provision. From the perspective of animal production, breed improvement programs, increased beneficiary
uptake of good husbandry practices, among others, resulted in increased livestock production and productivity.
Investments in veterinary services activities, in particular, improvement in disease control mechanisms, on the other-
hand, ensured that the gains made through the animal production interventions are deepened and sustained, by bringing
livestock disease outbreaks under control and reducing mortality rates, among others.
The economic analysis was thus based on animals saved as a result of effective disease control measures. Benefits
emanating from veterinary service provision (vaccination against scheduled diseases of various livestock species) were
thus quantified as the value of livestock saved due to reduced mortalities in vaccinated animals. Economic prices used
in estimating livestock value were derived from prevailing market prices, excluding taxes, in particular market levies
(charged by district/municipal assemblies at the various livestock markets) and transport charges. Where livestock prices
were collected from the farm gate (at the producer level) farm gate prices were used, since they approximate to shadow
prices6.
At an opportunity cost of capital of 30%, the analysis generated an Economic Rate of Return (EIRR) of 43%. The Net
Present Value (NPV) at 30% DF worked out to GH¢8,043,715.76. The estimation of the EIRR is based on the
assumption that the project will span for a 30-year period.
The section that follows (3.2.1) presents details of the estimation of the EIRR
6 Shadow price in the strictest sense is any price that is not a market price (Gittinger, J.P. 1982; Economic Analysis of Agricultural Projects, second edition, completely revised and expanded, p243)

47
3.2.1 Project Cash Flow (Economic Analysis)
1.0 VACCINATION AGAINST CBPP:
Cattle project year
0 1 2 3 4 5 6 7
8-29
Animals Vaccinated
33,504
81,205
79,118
83,863
69,100
602,560
66,379
116,460
143,142.13 Incremental animals (10%)
3,350
8,121
7,912
8,386
6,910
60,256
6,638
11,646
14,314
Monetary Value 2,010,240.00 4,872,300.00 4,747,080.00 5,031,780.00 4,146,000.00 36,153,600.00 3,982,740.00 7,764,480.00 8,588,527.00
(Average price per cattle (GH¢600))
1.0 VACCINATION AGAINST PPR: SMALL RUMINANTS
Small ruminant population
2,500,000
Incidence of disease 20%
Mortality Rate WOP Mortality Rate WP
45% 8%
Project Year
Animals Vaccinated: 0 1 2 3 4 5 6 7
8-29
SHEEP 35,055 73,037 17,193 103,594 145,639 438,026 146,547 17,0283 153,672
GOATS 45,701 89,680 127,175 121,344 177,474 545,514 166,033 155,962 178,610
Total (Small ruminants)
80,756 162,717 244,368 224,938 323,113 983,540 312,580 326,245
332,282

48
wop
0 1 2 3 4 5 6 7 8-29
Number of Animals Vaccinated
80,756
162,717
244,368
224,938
323,113
983,540 312,580 326,245 332,282
Number of animals not vaccinated
2,500,000
2,419,244
2,337,283
2,255,632
2,275,062
2,176,887
1,516,460 2,187,420 2,173,755 2,167,718
225,000
219,056
213,024
207,015
208,445
201,219
152,611 201,994 200,988 200,544
Incremental No. of animals saved
5,944 11,976 17,985 16,555 23,781 72,389 23,006 24,012 24,456
Monetary value (@GH¢50)
297,182.08 598,798.56 899,274.24 827,771.84 1,189,055.84 3,619,427.20 1,150,294.40 1,200,581.60 1,222,798.22
3.0 VACCINATION AGAINST NEWCASTLE DISEASE (using I-2 Vaccine)
Bird Population 10,000,000
Incidence of disease 50%
mortality rate wop 55%
mortality rate wp 3.1%
wop 0
1
2
3
4
5
6
7 8-29 Number of Animals Vaccinated
-
195,050
702,482
1,019,903
707,150
507,646
532,180
212,284
553,813.57
Number of Animals not Vaccinated 10,000,000
10,000,000
9,804,950
9,297,518
8,980,097
9,292,850
9,492,354
9,467,820
9,787,716
9,515,413.1
3
Total Mortality 2,750,000
2,750,000
2,699,380
2,567,688
2,485,310
2,566,477
2,618,253
2,611,886
2,694,907
2,625,308.8
7 Incremental No. of Animals saved
-
50,620
182,312
264,690
183,523
131,747
138,114
55,093
124,691.13
Monetary value (GH¢8.00):
- 404,962.81 1,458,493.13 2,117,522.61 1,468,184.83 1,053,974.63 1,104,912.12 440,744.04 997,529.00
0
1
2
3
4
5
6
7 8-29 Total Incremental Benefits
2,307,422.08 5,876,061.37
7,104,847.37 7,977,074.45
6,803,240.67
40,827,001.83
6,237,946.52 1,641,325.64
2,220,327.22
Expenditure Streams
22,024,827.60
6,696.00
838,800.00
117,020.04
32,785.00
31,428.60
76,439.45
31,745.80
162,130.70
Net Economic Benefit
(19,717,405.52) 5,869,365.37
6,266,047.37 7,860,054.41
6,770,455.67
40,795,573.23
6,161,507.06 1,609,579.84
2,058,196.53

49
3.2.2 Computing for Economic rate of Return (ERR)
Discounted Benefit Streams (Cash Flows)
(Vaccinations against Scheduled Diseases)
Discount
factor Discount
factor
Project
Year incremental
cost incremental
benefit
incremental net benefit (cash
flow) 30% Present Worth
(30%) - GH¢ 40% Present Worth (40%) -
GH¢ 45% Present Worth
(45%) - GH¢
0
22,024,827.60
2,307,422.08
(19,717,405.52) 1.000 (19,717,405.52) 1.000 (19,717,405.52) 1.000 (19,717,405.52)
1
6,696.00
5,876,061.37
5,843,276.37 0.769 4,494,827.98 0.714 4,173,768.84 0.690 4,029,845.77
2
838,800.00
7,104,847.37
6,266,047.37 0.592 3,707,720.34 0.510 3,196,962.94 0.476 2,980,284.12
3
117,020.04
7,977,074.45
7,860,054.41 0.455 3,577,630.59 0.364 2,864,451.32 0.328 2,578,229.34
4
32,785.00
6,803,240.67
6,770,455.67 0.350 2,370,524.73 0.260 1,762,405.16 0.226 1,531,601.88
5
31,428.60
40,827,001.83
40,795,573.23 0.269 10,987,433.97 0.186 7,585,301.74 0.156 6,364,628.05
6
76,439.45
6,237,946.52
6,161,507.06 0.207 1,276,517.69 0.133 818,311.65 0.108 662,947.19
7
31,745.80
1,641,325.64
1,609,579.84 0.159 256,512.81 0.095 152,692.00 0.074 119,436.35
8-29
162,130.70
2,220,327.22
2,058,196.53 0.530 1,089,953.18 0.237 487,826.84 0.165 339,293.80
8,043,715.76 1,324,314.96 (1,111,139.02) NPV (30%)
8,043,715.76
EIRR 43%
3.3 Sensitivity Analysis (30% Opportunity cost of capital)
To test the earning capacity of the project, in other words to establish how responsive the economic and financial rates of returns are to changing circumstances; for instance drop in project benefits, increases in project costs and delays in benefit streams,, a sensitivity analysis was carried out. The results for the various scenarios are presented in Tables 3.3.1 and 3.3.2 respectively for the FIRR and EIRR.
3.3.1 Sensitivity Analysis (SA): (@ 30% Cost of Capital)
Table 3.3.1
SA (Financial Analysis)
Aggregate
Cash
Flow
GOAT SHEEP PIG CATTLE
FIRR FIRR FIRR FIRR FIRR
At Current Benefits
(@30% cost of capital)
180% 53% 81% 61% 216%
10% decrease in project
benefits
80% 12% (at 0% cost of
capital and negative
NPV (-GH¢566.15)
28% 11% (0% cost of capital and
negative NPV (-GH¢2,422.67)
103%

50
20% decrease in project
benefits
27% 8% (at 0% cost of
capital and negative
NPV (-GH¢1337.00)
13.8% (at zero cost of
capital and negative NPV
(-GH¢1192.50)
7% (0% cost of capital and
NPV ( -GH¢5401.15)
47%
10% decrease in project
benefits +20% increase in
project cost
44% 8% (at 0% cost of
capital and a negative
NPV (-GH¢2849.00)
15% (NPV = -
GH¢1865.64)
7% (0% cost of capital and
NPV ( -GH¢8265.74)
47%
20% increase in project
cost
94% 8% (at 0% cost of
capital and a negative
NPV (-GH¢2078.00)
16.6% (NPV =-
GH¢617.44)
8% (0% cost of capital and
negative NPV (-GH¢5287.27)
86%
20% increase in cost +
20% decrease in project
benefits
6% 8% (at 0% cost of
capital and negative
NPV (-GH¢2830.00)
12% (0% cost of capital
and negative NPV (-
GH¢2996.71)
7% (0% cost of capital and
negative NPV (-GH¢11,244.00)
41%
As summarized above (Table 3.3.1)
The sheep, goat and pig enterprises are sensitive to changes in project benefits as a 10% decrease in the project
benefit streams will affect the financial attractiveness of these enterprises.
When aggregated however, the financial attractiveness of the intervention appeared to be fairly robust to changes in
the fall of revenue (benefit streams) and expenditure increases up to a point. As indicated, a 10 percent drop in project
benefits jointly with 20% rise in expenditure (project costs) could not undermine the financial viability of the project
The economic rate of return of the aggregate enterprise however, exhibited sensitivity to the combined decrease in
benefits and increase in costs of 20% each. The test showed that at such percentage change, the FIRR returned (6%)
was significantly lower than the opportunity cost of capital (30%)
20% decrease in the benefit streams would also render the aggregate enterprise financially unattractive. The financial
rate of return generated for such a change at the 30% opportunity cost of capital was 27%.
The cattle enterprise showed significant resilience as it remained financially very attractive. At a combined rise in costs
and decline in benefits of 20% each the enterprise remained viable. The FIRR (41%) returned was significantly higher
than the opportunity cost of capital (30%). This could partly be attributed to the fact that investments into this enterprise
is relatively low in Ghana, compared to the huge benefits to be derived, and this was further boosted by the project
intervention which emphasized disease control - leading to reductions in disease outbreaks and mortalities..
Table 3.3.2
SA (Economic Analysis)
Scenario EIRR
1. At Current benefits (@ 30% cost of capital) 43%
2. 10% decrease in project benefits 42%
3. 20% decrease in project benefits 38%
4 20% decrease in project benefits + 20% increase in project
expenditure (cost)
32%

51
5 20% increase in project expenditure (cost) 35%
6 Delaying project benefits by 1 year 38%
7 Delaying project benefits by 2 years 32%
8 Delaying project benefits by 3 years 26%
(NPV –GH¢2,987,805.22)
The economic sensitivity analysis shows that economic benefits arising from investing in animal health
provision(vaccination of animals) are so large that not even a combined drop in project benefits and rise in project
expenditure (costs) of 20% each could affect the attractiveness of the project (at 30% DR). This could be attributed, in
part, to the large amounts of benefits generated from the vaccinations. As indicated in Table 3.3.2 above, it is only when
benefits are delayed by 3years that the project interventions are rendered economically unattractive at 30% opportunity
cost of capital.

52
APPENDIX 5: Procurement Contracts Contract Sum Procurement
DATE Contract No Description Beneficiary Curr Contract Sum UA Mode
14/3/2005 MOFA/LDP/ICB/03/2004 Laboratory Equipments Geest Overseas Ltd. Pounds 77 497,63 98 287,73 ICB
14/3/2005 MOFA/LDP/ICB/01/2003
305 Hyundai Motorcycles EAU Trading Co. (Gh) Ltd. Dollars 211 975,00 144 037,94 ICB
14/3/2005 MOFA/LDP/ICB/03/2004
Laboratory,Veterinary Equip. & vaccines Agrovets Limited Dollars 1 048 500,00 739 761,98 ICB
15/102005 MOFA/LDP/ICB/02/2004
43 Computers & Accessories Fairgreen Limited Dollars 63 068,00 44 167,06 ICB
14/3/2005 MOFA/LDP/ICB/01/2003
454 sets of Bicycles EAU Trading Co. (Gh) Ltd. Dollars 18 614,00 11 805,94 ICB
14/3/2005 MOFA/LDP/ICB/05/2004
Field and Cold Chain Equipments
Kwaplah International Inc Dollars 183 584,00 127 044,67 ICB
14/3/2005 MOFA/LDP/ICB/02/2004
Training Equipments, Air Conditoners and Generators
Kwaplah International Inc Dollars 106 791,00 73 340,67 ICB
23/5/2005 MOFA/LDP/ICB/01/2003
5 Nissan Hardbody Pick Ups Auto Parts Limited Dollars 88 140,00 59 044,66 ICB
20/11/2005 MOFA/LDP/NS/2005/01
12 Doses of Holstein Semen Agrovets Limited Euro 222 000,00 189 822,06 ICB
15/4/2005 MOFA/LDP/ICB/02/2004
Office Equipments Kumesh Ghana Limited Dollar 31 048,00 20 941,60 ICB
06/01/2007
14/3/2005 MOFA/LDP/ICB/02/2004
5 80KVA Electric Generators
FG Wilson (Engineering) Ltd Dollar 74 300,00 50 070,57 ICB
23/5/2005 MOFA/LDP/NS/2005/01
220 West African Shorthorn cattle Agrovets Limited Cedis 1 377 000 000,00 100 389,21 NS
03/09/2005 MOFA/LDP/ICB/01/2003
6 Toyota Dyna Trucks Toyota Ghana Company Ltd Dollar 202 968,00 135 232,30 ICB
17/3/2005 MOFA/LDP/ICB/01/2003
Laboratory and veterinary Equipments
MLW Intermed Handels Euro 18 996,25 16 932,75 ICB
23/11/2005 //MOFA/LDP/NS/2005/01
36 Ashanti Black Forest Pigs
Visege Trading Enterprise Cedis 25 200 000,00 1 875,73 NS
26/6/2006 MOFA/LDP/LIB/01/2004 70 Large White Pigs Amycorp LLC Ltd Dollars 253 000,00 166 674,84 IS
30/11/2005 MOFA/LDP/NS/2005/01 110 Sahelian Sheep Kaskari Enterprise Cedis 115 500 000,00 8 405,92 NS
22/11/2005 MOFA/LDP/NS/2005/01
420 West African Dwarf Goats Atecosa Limited Cedis 253 200 000,00 17 911,31 NS
22/11/2005 MOFA/LDP/NS/2005/01
315 Sahalian Goats Pan African Dev. & Trad. Co. Cedis 223 500 000,00 15 236,90 NS
30/11/2005 MOFA/LDP/NS/2005/01 200 Sanga cows Agrovets Limited Cedis 808 500 000,00 55 582,07 NS
30/11/2005 MOFA/LDP/NS/2005/01 441 Djalonke sheep Kaskari Enterprise GHc 53 490,00 20 366,92 NS
31/03/2008 Contract of 31st March 2008
Audit of years 2007,2008 and 2009 financial statements
Benning, Anang & Partners Dollar 21 630,00 14 045,45 SL
16/03/2009 MOFA/LDP/ICB/2008/03
Various quantities of traps and screens
Innovative Thinking Co. Ltd. Dollars 423 600,00 276 862,75 ICB
09/06/2008 MOFA/LDP/ICB/2007/01 Pasture Seed Marivet Services Dollar 38 240,00 24 993,46 ICB
19/02/2009 MOFA/LDP/NCB/2008/BAR-01
Rehabilitation of Kintampo Breeding Station Nashcom Ghana GHc 189 154,20 82 240,96 NCB
19/02/2009 MOFA/LDP/NCB/2008/NBAR-12
Construction of 11 boreholes in NR & BAR Sabailo Co. Ltd GHc 143 702,50 62 479,35 NCB
19/02/2009 MOFA/LDP/NCB/2008/NR-03 Dugouts at Zoasili, Sab-sul Ventures GHc 903 779,25 392 947,50 NCB

53
Yikpani etc in NR
19/02/2009 MOFA/LDP/NCB/2008/NR-05
Dugouts at Jamangu, Kpegu etc in NR Lasiq Ghana Ltd GHc 598 115,00 260 050,00 NCB
19/02/2009 MOFA/LDP/NCB/2008/NR-06
Dugouts at Wundua, Dagboridoari etc in NR U=Comm Co. Ltd GHc 528 246,52 229 672,40 NCB
19/02/2009 MOFA/LDP/NCB/2008/NR-02
Dugouts at Tugu, Yipala etc in NR Mawums Ltd GHc 343 736,84 149 450,80 NCB
19/02/2009 MOFA/LDP/NCB/2008/NR-07
Dugouts at Singa, Kulli, Wantugu etc in NR Saudira Ghana Ltd GHc 460 847,32 200 368,40 NCB
19/02/2009 MOFA/LDP/NCB/2008/NR-08
Dugouts at Kokolombo, Kpalbusi, Kinkin etc in NR
Shiraco Investment Cp. Ltd GHc 462 227,32 200 968,40 NCB
19/02/2009 MOFA/LDP/NCB/2008/NR-09
Dugouts at Simakuma, Lingbisi, Galishegu etc in NR
Kantan Engineering Ltd GHc 690 100,00 300 043,48 NCB
19/02/2009 MOFA/LDP/NCB/2008/NR-10
Rehabilitation of Pong Tamale Breeding Station Habib Enterprise GHc 195 659,16 85 069,20 NCB
19/02/2009 MOFA/LDP/NCB/2008/NR-11
Construction of 11 boreholes in NR Sabailo Co. Ltd GHc 135 564,00 58 940,87 NCB
19/02/2009 MOFA/LDP/NCB/2008/NR-04
Dugouts at Tabli, Adayili-Kukpang etc in NR Mawums Ltd GHc 389 852,76 169 501,20 NCB
19/02/2009 MOFA/LDP/NCB/2008/NR-04
Rehab. Office/residential/animal housing at Ktpo Station
Abraham Co. & Elec. Co. Ltd GHc 200 356,13 87 111,36 NCB
19/02/2009 MOFA/LDP/NCB/2008/NR-01
Hotel facility/water resevouir/sheep pen at Pong Tamale Suabira Co. Ltd GHc 160 675,33 69 858,84 NCB
26/03/2009 MOFA/LDP/ICB/2008/03
Field camping equipment, traps etc for tsetse control Lamsikany Ltd GHc 55 741,50 24 235,43 ICB
26/03/2009 MOFA/LDP/ICB/2008/01
Lab. & field equipments & suppliers
Innovative Thinking Co. Ltd. Dollars 264 300,00 172 745,10 ICB
26/03/2009 MOFA/LDP/ICB/2008/01
Lab. & field equipments & suppliers Frankatson Ltd. GHc 108 520,00 47 182,61 ICB
14/04/2009 MOFA/LDP/ICB/2008/01
Supply of various vaccines Agrovets Limited Dollars 1 248 000,00 815 686,27 ICB
14/04/2009 MOFA/LDP/ICB/2008/01
11 motorcycles and crash helmets
Nodeco International Ltd GHc 39 600,00 17 217,39 ICB
14/04/2009 MOFA/LDP/ICB/2008/02
2 Ford Ranger Double Carbin Pickup
Mechanical Lloyd Co. Ltd Dollars 52 400,00 34 248,37 ICB
14/04/2009 MOFA/LDP/ICB/2008/02
1 Ford Everest Station Wagon
Mechanical Lloyd Co. Ltd Dollars 34 000,00 22 222,22 ICB
06/11/2009 MOFA/LDP/NCB/2008/GAR-09
Rehab. Staff/farm structures at Nungua Station Prodel Ltd. GHc 295 000,00 128 260,87 NCB
06/03/2009 MOFA/LDP/NCB/2008/GAR-05
Rehab. APD/VSD headquarters and Lab. Complex in Accra
Still Goodwill Construction GHc 105 499,90 45 869,52 NCB
06/11/2009 MOFA/LDP/NCB/2008/GAR-07
Rehab. Farm structures at Amrahia Dairy Farm Stefat Ent. Ltd. GHc 445 000,01 193 478,27 NCB
14/04/2009 MOFA/LDP/ICB/2008/01
Lab. & field equipments & cattle screening equipments T. Mark Ltd. (Gh) GHc 64 500,00 28 043,48 ICB
14/04/2009 MOFA/LDP/NCB/2008/AS-1
Rehab. Farm structures at Ejura Sheep Station
S.Y. Dwomoh Memorial Ltd GHc 69 000,00 30 000,00 NCB
13/7/2009 MOFA/LDP/NS/2009/02
230 djallonke sheep gimmers & 19 young rams F.A. Bawuah Ltd GHc 57 270,00 24 900,00 NS
19/10/2009 MOFA/LDP/PCMU/NS/2009/07 (Lot 2)
180 rams & 3320 gimmers of djalloke sheep Chen Overseas Ltd Dollars 560 000,00 366 013,07 NS
19/10/2009 MOFA/LDP/PCMU/NS/2009/07 (Lot 3)
180 rams & 3320 gimmers of djalloke sheep Chen Overseas Ltd Dollars 560 000,00 366 013,07 NS
MOFA/LDP/PCMU/NS/2009/09
Ear tags, ear tag applicators and indelible tag marking pens Danach Company Ltd. Dollars 684 200,00 447 189,54 NS
MOFA/LDP/ICB/2008/02
Field camping equipment, traps and screens for tsetse Agrovets Ltd. Pounds 52 440,00 54 061,86 ICB
04/02/2009 MOFA/LDP/ICB/2008/02
Desktop computers, printers, toners and UPS
Perfect Business Systems GHc 31 030,00 14 776,19 ICB
21/04/2009 MOFA/LDP/ICB/2008/02
Photocopiers, fax machines, projector and
Perfect Business Systems GHc 53 700,00 25 571,43 ICB

54
binding machine
13/10/2009 MOFA/LDP/PCMU/NS/2009/06
180 rams & 3320 gimmers of djalloke sheep Y.N.O. Enterprise Ltd. Dollars 553 180,00 361 555,56 NS
15/02/2010 MOFA/LDP/ICB/2009/UWR-02
Dugouts at Sakalu and Pina in the Upper West Region SEAS (GH) Ltd. GHc 205 131,65 92 401,64 NCB
15/02/2010 MOFA/LDP/ICB/2009/UER-01
Dugouts at Dominga and Nyansa in the Upper East Region F. M. Maiga Co. Ltd GHc 191 762,00 86 379,28 NCB
25/02/2010 MOFA/LDP/ICB/2009/UER-02
Dugouts at Tampelim and Duuri in the Upper East Region Intra Grid Systems GHc 208 022,64 93 703,89 NCB
15/02/2010 MOFA/LDP/ICB/2009/UER-03
Dugouts at Sambrungu and Tongo in the Upper East Region Dyget (Gh) Ltd GHc 181 133,52 81 591,68 NCB
15/02/2010 MOFA/LDP/ICB/2009/UWR-05
Rehab of livestock housing, staff housing etc at Babile Malsons Ltd. GHc 196 566,23 88 543,35 NCB
15/02/2010 MOFA/LDP/ICB/2009/UWR-01
Dugouts at Tissa and Wechiau in the upper West Region Wass (Gh) Ltd. GHc 263 477,09 118 683,37 NCB
15/02/2010 MOFA/LDP/ICB/2009/UER-04
Boreholes in the Upper East Region T.B.L. Resources Ltd. GHc 25 970,51 11 698,43 NCB
22/02/2010 MOFA/LDP/ICB/2009/01
Artificial insemination equipment
Innovative Thinking Co. Ltd Dollar 175 107,00 112 972,26 ICB
10/08/2009 MOFA/LDP/PCMU/NS/2009/08
3,500 West Africa Dwarf Goats
Wulugu Livestock Company GHc 804 250,00 348 160,17 NS
10/08/2009 MOFA/LDP/PCMU/NS/2009/03 3,500 Djallonke Sheep Agrovets Ltd. GHc 834 200,00 361 125,54 NS
10/08/2009 MOFA/LDP/PCMU/NS/2009/04 (Lot 2) 3,500 Djallonke Sheep Agrovets Ltd. GHc 834 200,00 361 125,54 NS
16/02/2010 MOFA/LDP/ICB/2009/01
300 GPS Navigation Equipment Greem Summer Ltd. Pounds 99 000,00 102 061,86 ICB
25/02/2010 MOFA/LDP/ICB/2009/UER-05
Rehab of quarantine stations at Paga, Zebilla, Mognori etc
Chen Overseas Limited GHc 104 297,88 46 981,03 NCB
06/12/2009 MOFA/LDP/ARI/NCB/2008/01
Dismantling and relocation of feed testing equipment (ARI) Fredalkon Enterprise GHc 45 000,00 19 823,79 NCB
15/02/2010 MOFA/LDP/NCB/2009/UWR-03
Dugouts at Samoa and Pieng in the upper West Region Nashcon Ghana Ltd GHc 167 586,19 75 489,27 NCB
29/06/2010 MOFA/LDP/PCMU/NS/2010/03 (Lot 3) 2,500 Djallonke Sheep Agrovets Ltd. GHc 591 250,00 276 285,05 NS
28/06/2010 MOFA/LDP/PCMU/NS/2010/01 (Lot 1)
3,250 Djallonke Sheep Chen Overseas Limited Dollar 594 750,00 386 201,30 NS
25/02/2010 MOFA/LDP/NCB/2009/UWR-04
3 Boreholes in Upper West Region Resources Access Ltd. GHc 89 031,25 40 104,17 NCB
28/06/2010 Second Batch (Lot 2) 3,250 Djallonke Sheep Royal Suppliers Ltd. Dollar 575 250,00 373 538,96 NS
28/06/2010 MOFA/LDP/PCMU/NS/2010/03 (Lot 3) 5,000 Djallonke Sheep Agrovets Ltd. Dollar 915 000,00 594 155,84 NS
23/08/2010 MOFA/LDP/PCMU/IS/2010/-01
6 Zetor Tractors and accessories
Ghana Heavy Equipment Ltd. Euro 222 222,60 196 657,17 IS
29/10/2010 MOFA/LDP/PCMU/NS/BATCH-3/2010/01 (Lot 1)
5,000 Djallonke Sheep Agrovets Ltd. Dollar 915 000,00 598 039,22 NS
29/10/2010 MOFA/LDP/PCMU/NS/BATCH-3/2010/02 (Lot 2)
5,000 Djallonke Sheep Agrovets Ltd. Dollar 930 000,00 607 843,14 NS
29/10/2010 MOFA/LDP/PCMU/NS/BATCH-3/2010/03 (Lot 3)
5,000 Djallonke Sheep Chen Overseas Ltd Dollar 925 000,00 604 575,16 NS
29/10/2010 MOFA/LDP/PCMU/NS/BATCH-3/2010/04 (Lot 4)
10 Sheep/Goat weighing crate, 10 pharmaweigh indicator etc City-Plus Limited Pounds 80 000,00 80 808,08 NS
13/01/2011 Contract of 13th January 2011
Audit of 2010 and 2011 Financial Statements Global Auditors Dollars 12 000,00 7 894,74 SL

55
APPENDIX 6: List of Supporting Documents
Appraisal Report (2001). Livestock Development Project, Republic of Ghana Bruno B. Dery, Dr Kwame Boa-Amponsem, Marbel Cudjoe, Satchmo Atongo and Godfred Alufar Bopkin (2008). Livestock Development Project (LDP) Ministry of Food and Agriculture, Mid-Term Review. Food and Agricultural Sector Development Policy – FASDEP II (2008). Revised Policy Document, Ghana Ministry of Food and Agriculture. Ghana Statistical Service (2000). Ghana Living Standard Survey. Report of the Fourth Round (GLSS 4). GPRS II (2005). Growth and Poverty Reduction Strategy (2006-2009), Republic of Ghana. Oporhu Agricultural and Rural Development Consultancy Ltd. (2008). Livestock Growth Trend, Ghana Ministry of Food and Agriculture, p1. Price Gittinger, J. (1982). Economic Analysis of Agricultural Projects, Second Edition, Completely Revised and Expanded, EDI Series in Economic Development. Project Economic and Evaluation Division (1997). Guidelines for Economic Analysis of Projects, Economics and Development Resource Centre, Asian Development Bank Optimal Consultancy Services Ltd. (2002). The Role of Livestock in Rural Livelihoods in Ghana; MoFA/DFID. The World Bank (1992). Staff Appraisal Report, National Livestock Services Project (NLSP), Republic of Ghana, p6 Yaron, J. Rural Finance in Developing Countries

56
Optional
a. Project Narrative. Key factors not covered in the main template that affected the design and implementation of the project. Such factors, both positive and negative, could include: climate and weather, political changes, contractual or personnel matters, technical issues, procurement processes, and interactions with other partners. If any of these factors is significant enough to affect the evaluation ratings, it should be noted in the template with a reference to this annex.

57