completed geo101 assignment
TRANSCRIPT

8/8/2019 Completed GEO101 Assignment
http://slidepdf.com/reader/full/completed-geo101-assignment 1/57
Prepared for
Moushumi Zahur
Course instructor
BRAC University
Prepared by:
Name Student ID
Rafi Uddin Sharik 09104040 Priyanka Das Katha 09104033
Tanvir Ahasan 09104092 Md. Saleh-Ibne-Rashid 09104117
FALL 2009
Section: 001
BRAC University
Date of Submission: 10th December, 2009
Course Name:
Introduction to Economic Geography
(Comparison of Economic Development of Developed, Developing andUnderdeveloped Countries 2008)

8/8/2019 Completed GEO101 Assignment
http://slidepdf.com/reader/full/completed-geo101-assignment 2/57
Table of Contents
Chapter Section Topics Page
1 Introduction
.1 Economic Geography
.2 Contribution of Different Sectors to GDP
.3 Trading Features
.4 Developed, Developing and Underdeveloped Countries
2 Information (2008)
.1
.2
.3
.4
.5

8/8/2019 Completed GEO101 Assignment
http://slidepdf.com/reader/full/completed-geo101-assignment 3/57
10th December, 2009
Moushumi Zahur
Course Instructor
BRAC University
66, Mohakhali
Subject: Submission of assignment for completion of course.
Dear Madam,
This is to inform you that we have completed the Assignment. This assignment focuses
on the comparison of economic development of different regions of the world. The
report, titled ³Comparison of Economic Development of Developed, Developing and
Underdeveloped Countries´ has been prepared for the completion of the course,
Introduction to Economic Geography (GEO101)
In the making of this assignment, we have followed all your specific instructions
involving report writing so as to present our views and in the easiest manner. However,
we will be glad to clarify any discrepancy that may arise.
Thank you.
Sincerely yours,
Name STD ID. Signature
Md. Saleh-Ibne-Rashid 09104117 ««««..
Tanvir Ahasan 09104092 «««««
Priyanka Das Katha 09104033 «««««
Rafi Uddin Sharik 09104040 ..................

8/8/2019 Completed GEO101 Assignment
http://slidepdf.com/reader/full/completed-geo101-assignment 4/57
Chapter 1
Introduction

8/8/2019 Completed GEO101 Assignment
http://slidepdf.com/reader/full/completed-geo101-assignment 5/57
1.1 :Economic Geography
Economic geography is concerned with the location and distribution of economic
activity. It focuses on the location of industries and retail and wholesale businesses, on
transportation and trade, and on the changing value of real estate. Courses in economicgeography may cover such topics as transportation, agriculture, industrial location,
world trade, and the spatial organization and function of business activity. Economic
geographers study the principles governing the spatial allocation of resources and the
resulting consequences In Broader terms, economic geography can be defined as
"In Economic Geography, we study the (locational, organizational and
behavioral) principles and processes associated with the spatial allocation
of scarce (human, man-made and natural) resources (which are also
distributed spatially) and the spatial patterns and (direct and indirect,
social, environmental and economic) consequences resulting from such
allocations."
Considering all of the above information and definition we can state that "the study of
the way in which society organizes itself in space".
1.2 :Contribution of Different Sectors to GDP
GDP contribution on a given country¶s economy can be divided into 3 sectors:
i. Primary sector
ii. Secondary sector
iii. Tertiary sector
i. Primary Sector
The primary sector of the economy extracts or harvests products from the earth. The
primary sector includes the production of raw material and basic foods. Activitiesassociated with the primary sector include agriculture (both subsistence and
commercial), mining, forestry, farming, grazing, hunting and gathering, fishing, and
quarrying. The packaging and processing of the raw material associated with this sector
is also considered to be part of this sector. In developed and developing countries, a
decreasing proportion of workers are involved in the primary sector.

8/8/2019 Completed GEO101 Assignment
http://slidepdf.com/reader/full/completed-geo101-assignment 6/57

8/8/2019 Completed GEO101 Assignment
http://slidepdf.com/reader/full/completed-geo101-assignment 7/57
1.4 :Developed, Developing and Underdeveloped Countries
Developed Countries
Country in which there is widespread industry and in which the average standard of
living is high compared with world standards, progressive countries and moderncountries. Countries which have per capita income of 2500 dollars and more are
considered as developed countries.
Developing Countries
A broad range of countries that generally lack a high degree of industrialization,
infrastructure, and other capital investment, sophisticated technology, widespread
literacy, and advanced living standards among their populations as a whole. Countries
which have per capita income between $1500 and 2500$ are considered as developing
countries.
Underdeveloped Countries
Country in which there is low per capita incomes, low literacy levels and medical
standards, subsistence agriculture, and a lack of exploitable minerals and competitive
industries. Countries which have per capita income of less than $1500 are considered
as underdeveloped countries.

8/8/2019 Completed GEO101 Assignment
http://slidepdf.com/reader/full/completed-geo101-assignment 8/57
Chapter 2
Information (2008)

8/8/2019 Completed GEO101 Assignment
http://slidepdf.com/reader/full/completed-geo101-assignment 9/57
Section 1: Developed Countries
Among the developed countries of the world we have chosen three countries from three
different regions of the world. The countries that we have chosen are- Japan, Germany
and the United States of America (USA).
Japan
Basic Information
Official Name: Japan
Capital: Tokyo
Total area:
Total: 377,915 sq km
Land: 364,485 sq km
Water: 13,430 sq km
Geographical boundary: Located in the pacific coast of Asia. No Land boundary.
Total population: 127,078,679
Population density in per square: 337.574/km2
Natural increase rate of population: 0.191%
Per capita income of population (avg.): $38,210
Literacy rate:
Total: 99%
Male: 99%
Female: 99%

8/8/2019 Completed GEO101 Assignment
http://slidepdf.com/reader/full/completed-geo101-assignment 10/57
Urban-rural population:
Urban population: 66% of total population
Rural population: 34% of total population
Political Map

8/8/2019 Completed GEO101 Assignment
http://slidepdf.com/reader/full/completed-geo101-assignment 11/57

8/8/2019 Completed GEO101 Assignment
http://slidepdf.com/reader/full/completed-geo101-assignment 12/57
Economic Features
Gross Domestic Product (GDP): $4.34 tri l l ion
GDP Growth Rate: -0.7%
Contribution of Different Sectors to GDP:
Sector Subsector Contribution to GDPPrimary Agriculture 1.5%Secondary Industry 26.3%Tertiary Services 72.3%
2%
26%
72%
Contribution of Different Sectors to GDP
Agriculture
Industry
Services

8/8/2019 Completed GEO101 Assignment
http://slidepdf.com/reader/full/completed-geo101-assignment 13/57
Germany
Basic Information
Official Name: Federal Republic of Germany
Capital: Berlin
Total area:
Total: 357,022 sq km
Land: 348,672 sq km
Water: 8,350 sq km
Geographical boundary: Situated in Central Europe. Total border of 3,621km. Border
countries include Austria 784 km, Belgium 167 km, Czech Republic 646 km, Denmark
68 km, France 451 km, Luxembourg 138 km, Netherlands 577 km, Poland 456 km, and
Switzerland 334 km
Total population: 82,329,758
Population density in per square: 229.348/km2
Natural increase rate of population: 0.053%
Per capita income of population (avg.): $42,440
Literacy rate:
Total: 99%
Males: 99%Female: 99%

8/8/2019 Completed GEO101 Assignment
http://slidepdf.com/reader/full/completed-geo101-assignment 14/57
Urban-rural population:
Urban population: 74% of total population
Rural population: 26% of total population
Political Map

8/8/2019 Completed GEO101 Assignment
http://slidepdf.com/reader/full/completed-geo101-assignment 15/57
Economic Features and Trading Features
Trading Features
Export and import commodities:
Export commodities: Machinery, vehicles, chemicals, metals and manufactures,
foodstuffs, textiles
Import commodities: Machinery, vehicles, chemicals, foodstuffs, textiles, metals
Relation of export and import trade:
Import Partners: Netherlands 12.5%, France 8.3%, Belgium 7.5%, China 6.2%,
Italy 5.7%, UK 5.4%, Austria 4.3%, Russia 4.2%, US 4.2%
Export Partners: France 9.7%, US 7.1%, UK 6.7%, Netherlands 6.6%, Italy 6.4%,
Austria 5.4%, Belgium 5.2%, Spain 4.4%, Poland 4%
Important places related with trade: Berlin, Hamburg, Cologne, and Munich
Export: $1.498 trillion
Import: $1.232 trillion
Balance: $266 billion (Trade Surplus)
The exports of Germany are greater than its imports. For that reason, the balance of
trade is showing positive value which indicates trade surplus.

8/8/2019 Completed GEO101 Assignment
http://slidepdf.com/reader/full/completed-geo101-assignment 16/57
Economic Features
Gross Domestic Product (GDP): $2.925 tri l l ion
GDP Growth Rate: 1 .3%
Contribution of different sectors to GDP:
Sector Subsector Contribution to GDPPrimary Agriculture 0.9%Secondary Industry 30.1%Tertiary Services 69.1%
1%
30%
69%
Contribution of Different Sectors to GDP
Primary
Secondary
Tertiary

8/8/2019 Completed GEO101 Assignment
http://slidepdf.com/reader/full/completed-geo101-assignment 17/57
United States of America (USA)
Basic Information
Official Name: United States of America
Capital: Washington, DC
Total area:
Total: 9,826,675 sq km
Land: 9,161,966 sq km
Water: 664,709 sq km
Geographical boundary: Situated in central North America. Total border of 12,034 sq
km. Border countries include Canada 8,893 km (including 2,477 km with Alaska),
Mexico 3,141 km
Total population: 307,212,123
Population density in per square: 31.998/km2
Natural increase rate of population: 0.975%
Per capita income of population (avg.): $47,580
Literacy rate:
Total: 99%
Male: 99%
Female: 99%
Urban-rural population:
Urban population: 82% of total population

8/8/2019 Completed GEO101 Assignment
http://slidepdf.com/reader/full/completed-geo101-assignment 18/57
Rural population: 18% of total population
Political Map

8/8/2019 Completed GEO101 Assignment
http://slidepdf.com/reader/full/completed-geo101-assignment 19/57
Economic Features and Trading Features
Trading Features
Export and import commodities:
Export commodities: Soybeans, fruit, corn, organic chemicals, transistors, aircraft,
motor vehicle parts, computers, telecommunications equipment automobiles,
medicines
Import commodities: Crude oil, computers, telecommunications equipment, motor
vehicle parts, office machines, electric power machinery, automobiles, clothing,medicines, furniture, and toys
Relation of export and import trade:
Import Partners: China 16.5%, Canada 15.7%, Mexico 10.1%, Japan 6.6%,
Germany 4.6%
Export Partners: Canada 20.1%, Mexico 11.7%, China 5.5%, Japan 5.1%,
Germany 4.2%, UK 4.1%
Important places related with trade: New York, Los Angeles, and Philadelphia
Export: $1.277 trillion
Import: $2.117 trillion
Balance: -$840 billion (Trade Deficiency)
The imports of the United States are greater than its export. For that reason, the
balance of trade is showing positive value which indicates trade deficiency.

8/8/2019 Completed GEO101 Assignment
http://slidepdf.com/reader/full/completed-geo101-assignment 20/57
Economic Features
Gross Domestic Product (GDP): $14.44 tril l ion
GDP Growth Rate: 0.4%
Contribution of different sectors to GDP:
Sector Subsector Contribution to GDPPrimary Agriculture 1.2%Secondary Industry 19.2%Tertiary Services 79.6%
1%
19%
80%
Contribution of Different Sectors to GDP
Primary
Secondary
Tertiary

8/8/2019 Completed GEO101 Assignment
http://slidepdf.com/reader/full/completed-geo101-assignment 21/57
Section 2: Developing Countries
Among the developing countries of the world we have chosen three countries. The
countries that we have chosen are- Egypt, Indonesia and Philippines.
Egypt
Basic Information
Official Name: Arab Republic of Egypt
Name: Japan
Capital: Tokyo
Total area:
Total: 1,001,450 sq km
Land: 995,450 sq km
Water: 6,000 sq km
Geographical boundary: Located mainly in North Africa, with the Sinai Peninsula
forming a land bridge in the Middle East. Total border of 2,665 km. Border countries
include Gaza Strip 11 km, Israel 266 km, Libya 1,115 km, Sudan 1,273 km
Total population: 83,082,869
Population density in per square: 77.453/km2
Natural increase rate of population: 0.053%
Per capita income of population (avg.): $1,800

8/8/2019 Completed GEO101 Assignment
http://slidepdf.com/reader/full/completed-geo101-assignment 22/57
Literacy rate:
Total: 71.4%
Male: 83%
Female: 59.4%
Urban-rural population:
Urban population: 43% of total population
Rural population: 57% of total population
Political Map

8/8/2019 Completed GEO101 Assignment
http://slidepdf.com/reader/full/completed-geo101-assignment 23/57
Economic Features and Trading Features
Trading Features
Export and import commodities:
Export commodities: Crude oil and petroleum products, cotton, textiles, metal
products, chemicals
Import commodities: Machinery and equipment, foodstuffs, chemicals, wood
products, fuels
Relation of export and import trade:
Import Partners: US 10.3%, China 9.9%, Italy 7.3%, Germany 6.8%, Saudi
Arabia 4.9%
Export Partners: Italy 9.4%, US 7.1%, India 6.2%, Spain 6.1%, Syria 4.7%, Saudi
Arabia 4.6%, Japan 4.5%, Germany 4.5%
Important places related with trade:
Export: $29.85 billion
Import: $56.62 billion
Balance: -$26.77 billion (Trade Deficiency)
The imports of Egypt are greater than its exports. For that reason, the balance of trade
is showing negative value which indicates trade deficiency.

8/8/2019 Completed GEO101 Assignment
http://slidepdf.com/reader/full/completed-geo101-assignment 24/57
Economic Features
Gross Domestic Product (GDP): $444.8 bil l ion
GDP Growth Rate: 7 .2%
Contribution of different sectors to GDP:
Sector Subsector Contribution to GDPPrimary Agriculture 13.2%Secondary Industry 38.7%Tertiary Services 48.1%
13%
39%
48%
Contribution of Different Sectors to GDP
Primary
Secondary
Tertiary

8/8/2019 Completed GEO101 Assignment
http://slidepdf.com/reader/full/completed-geo101-assignment 25/57
Indonesia
Basic Information
Official Name: Republic of Indonesia
Capital: Jakarta
Total area:
Total: 1,904,569 sq km
Land: 1,811,569 sq km
Water: 93,000 sq km
Geographical boundary: Situated in Southeast Asia and Oceania. Total border of
2,830 km. Border countries include Timor-Leste 228 km, Malaysia 1,782 km, Papua
New Guinea 820 km
Total population:
Population density in per square: 121.481/km2
Natural increase rate of population: 1.136%
Per capita income of population (avg.): $2,010
Literacy rate:
Total: 90.4%
Male: 94%
Female: 86.8%
Urban-rural population:
Urban population: 52% of total population
Rural population: 48% of total population

8/8/2019 Completed GEO101 Assignment
http://slidepdf.com/reader/full/completed-geo101-assignment 26/57
Political Map

8/8/2019 Completed GEO101 Assignment
http://slidepdf.com/reader/full/completed-geo101-assignment 27/57
Economic Features and Trading Features
Trading Features
Export and import commodities:
Export commodities: Oil and gas, electrical appliances, plywood, textiles, rubber
Import commodities: Machinery and equipment, chemicals, fuels, foodstuffs
Relation of export and import trade:
Import Partners: Singapore 16.9%, China 11.8%, Japan 11.7%, Malaysia 6.9%,
US 6.1%, South Korea 5.4%, Thailand 4.9%
Export Partners: Japan 20.2%, US 9.5%, Singapore 9.4%, China 8.5%, South
Korea 6.7%, India 5.2%, Malaysia 4.7%
Important places related with trade: Jakarta, Java, and Bali
Export: $139.3 billion
Import: $116 billion
Balance: $23.3 billion (Trade Surplus)
The exports of Indonesia are greater than its imports. For that reason, the balance of
trade is showing negative value which indicates trade surplus.

8/8/2019 Completed GEO101 Assignment
http://slidepdf.com/reader/full/completed-geo101-assignment 28/57
Economic Features
Gross Domestic Product (GDP): $916.7 bil l ion
GDP Growth Rate: 6.1%
Contribution of different sectors to GDP:
Sector Subsector Contribution to GDPPrimary Agriculture 14.4%Secondary Industry 48.1%Tertiary Services 37.5%
14%
48%
38%
Contribution to Different Sectors of GDP
Primary
Secondary
Tertiary

8/8/2019 Completed GEO101 Assignment
http://slidepdf.com/reader/full/completed-geo101-assignment 29/57
Philippines
Basic Information
Official Name: Republic of the Philippines
Capital: Manila
Total area:
Total: 300,000 sq km
Land: 298,170 sq km
Water: 1,830 sq km
Geographical boundary: Situated in is a country in Southeast Asia in the western
Pacific Ocean.
Total population: 97,976,603
Population density in per square: 307.344/km2
Natural increase rate of population: 1.957%
Per capita income of population (avg.): $1890
Literacy rate:
Total: 92.6%
Male: 92.5%
Female: 92.7%
Urban-rural population:
Urban population: 65% of total population
Rural population: 35% of total population

8/8/2019 Completed GEO101 Assignment
http://slidepdf.com/reader/full/completed-geo101-assignment 30/57
Political Map

8/8/2019 Completed GEO101 Assignment
http://slidepdf.com/reader/full/completed-geo101-assignment 31/57
Economic Features and Trading Features
Trading Features
Export and import commodities:
Export commodities: Semiconductors and electronic products, transport
equipment, garments, copper products, petroleum products, coconut oil, fruits
Import commodities: Electronic products, mineral fuels, machinery and transport
equipment, iron and steel, textile fabrics, grains, chemicals, plastic
Relation of export and import trade:
Import Partners: US 12.8%, Japan 11.8%, Singapore 10.3%, Saudi Arabia 8.5%,
China 7.5%, South Korea 5.2%, Thailand 5%, Malaysia 4.3%
Export Partners: US 16.7%, Japan 15.7%, China 11.1%, Hong Kong 10.1%,
Netherlands 7.5%, Singapore 5.3%, South Korea 5.1%, Germany 5%
Important places related with trade:
Export: $48.2 billion
Import: $60.78 billion
Balance: -$12.58 billion (Trade Deficiency)
The imports of Philippines are greater than its exports. For that reason, the balance of
trade is showing negative value which indicates trade deficiency.

8/8/2019 Completed GEO101 Assignment
http://slidepdf.com/reader/full/completed-geo101-assignment 32/57
Economic Features
Gross Domestic Product (GDP): 318.2 bil l ion
GDP Growth Rate: 3.8%
Contribution of different sectors to GDP:
Sector Subsector Contribution to GDPPrimary Agriculture 14.7%Secondary Industry 31.6%%Tertiary Services 53.7% %
14%
48%
38%
Contribution of Different Sectors to GDP
Primary
Secondary
Tertiary

8/8/2019 Completed GEO101 Assignment
http://slidepdf.com/reader/full/completed-geo101-assignment 33/57
Section 3: Underdeveloped Countries
Among the Underdeveloped countries of the world we have chosen three countries from
two different regions of the world. The countries that we have chosen are- Bangladesh,
Nepal and Kenya.
Bangladesh
Basic Information
Official Name: People's Republic of Bangladesh
Capital: Dhaka
Total area:
Total: 143,998 sq km
Land: 130,168 sq km
Water: 13,830 sq km
Geographical boundary: Situated in South Asia. Total border of 4,246 km. Border
countries include Burma 193 km, India 4,053 km
Total population: 156,050,883
Population density in per square: 1,123.50 per sq km
Natural increase rate of population: 1.292%
Per capita income of population (avg.): $520
Literacy rate:
Total: 47.9%
Males: 54%
Female: 41.4
8/8/2019 Completed GEO101 Assignment
http://slidepdf.com/reader/full/completed-geo101-assignment 34/57
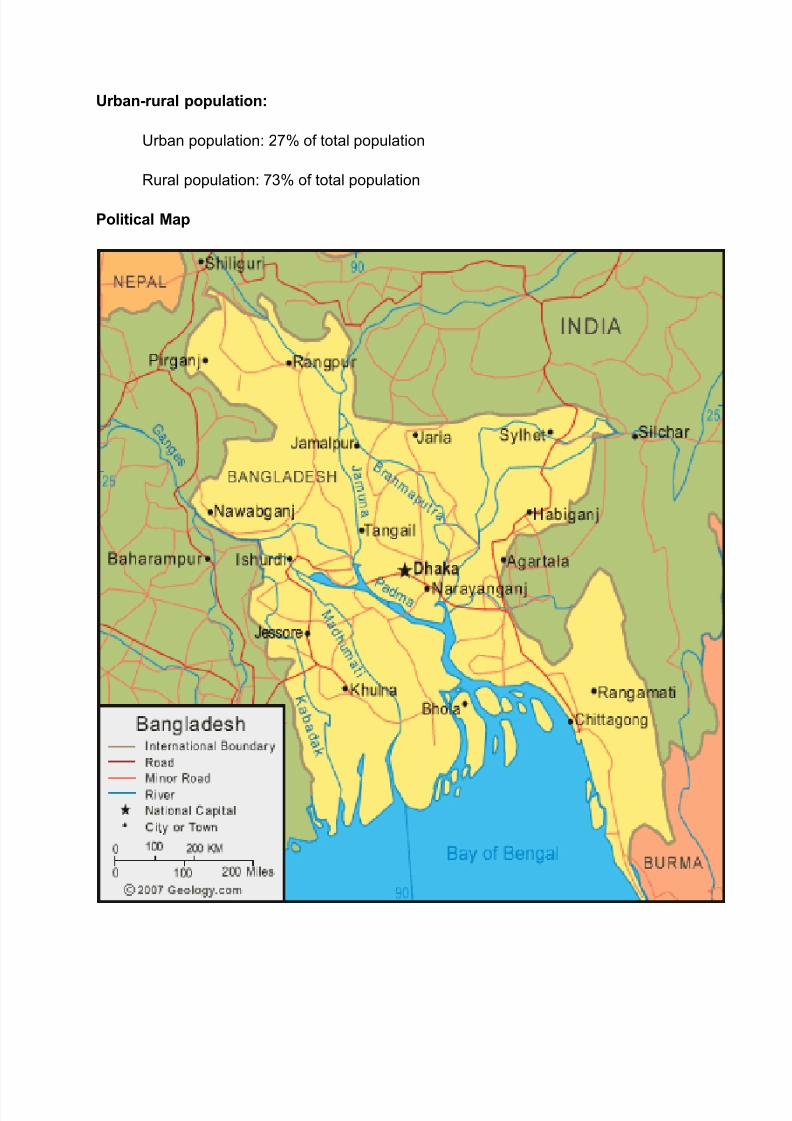
Urban-rural population:
Urban population: 27% of total population
Rural population: 73% of total population
Political Map
8/8/2019 Completed GEO101 Assignment
http://slidepdf.com/reader/full/completed-geo101-assignment 35/57
Economic Features and Trading Features
Trading Features
Export and import commodities:
Export Commodities: Garments, Jute and Jute Goods, Leather, Frozen fish and
Seafood.
Import Commodities: Machinery and Equipments, Chemicals, iron and Steel,
Textiles, Foodstuffs, Petroleum products and Cement.
Relation of export and import trade:
Export trade: US 21%, Germany 13.2%, UK 8.6%, France 6.3%, Netherlands
4.7%
Import trade: China 14.7%, India 14.7%, Kuwait 7.5%, Singapore 7.1%, and
Japan 4.1%
Important places related with trade: Dhaka, Chittagong.
Export: $15.44 billion
Import: $21.51 billion
Balance: -$6.079 billion (Trade Deficiency)
The imports of Bangladesh are greater than its exports. For that reason, the balance of
trade is showing negative value which indicates trade deficiency.
8/8/2019 Completed GEO101 Assignment
http://slidepdf.com/reader/full/completed-geo101-assignment 36/57
Economic Features
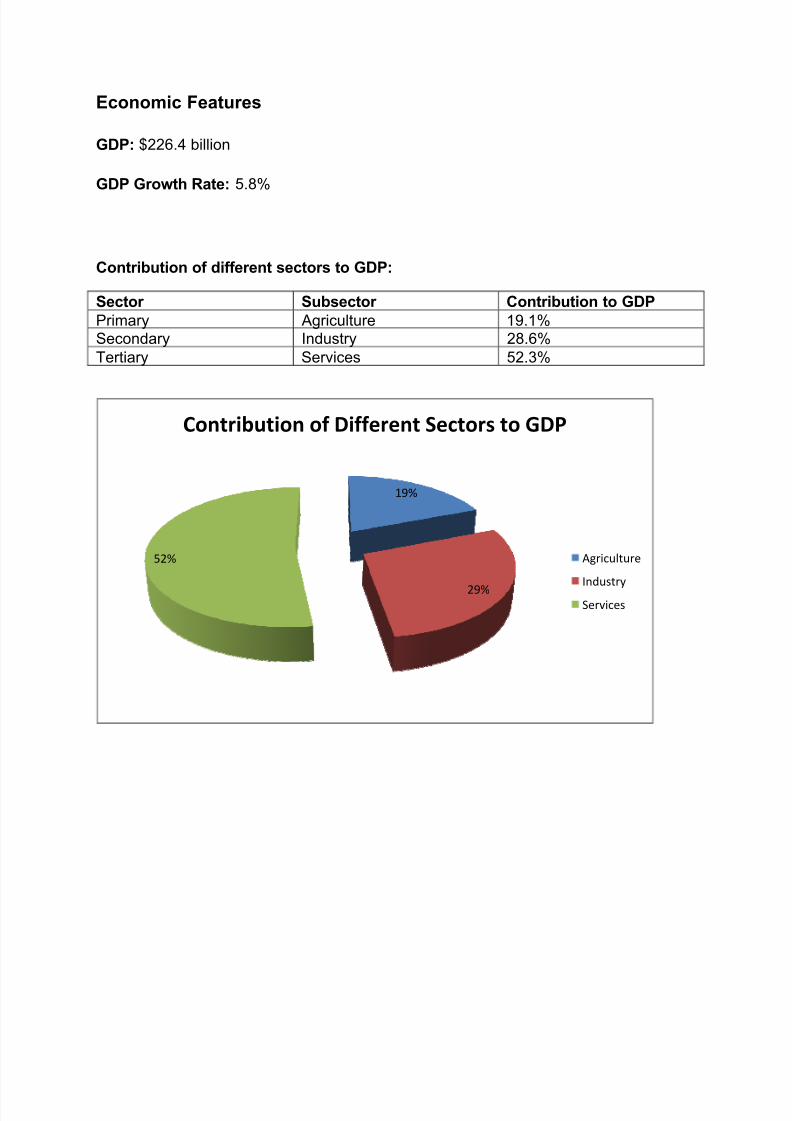
GDP: $226.4 billion
GDP Growth Rate: 5.8%
Contribution of different sectors to GDP:
Sector Subsector Contribution to GDPPrimary Agriculture 19.1%Secondary Industry 28.6%Tertiary Services 52.3%
19%
29%
52%
Contribution of Different Sectors to GDP
Agriculture
Industry
Services

8/8/2019 Completed GEO101 Assignment
http://slidepdf.com/reader/full/completed-geo101-assignment 37/57
Nepal
Basic Information
Official Name: Federal Democratic Republic of Nepal
Capital: Kathmandu
Total area:
Total: 147,181 sq km
Land: 143,351 sq km
Water: 3,830 sq km
Geographical boundary: Nepal is a landlocked country in South Asia. Total border of
2,926 km. Border countries include China 1,236 km, India 1,690 km
Total population: 28,563,377
Population density in per square: 192 per sq km.
Natural increase rate of population: 1.281%
Per capita income of population (avg.): $400
Literacy rate:
Total: 48.6%
Males: 62.7%
Female: 34.9%
Urban-rural population:
Urban population: 17% of total population
Rural population: 83% of total population

8/8/2019 Completed GEO101 Assignment
http://slidepdf.com/reader/full/completed-geo101-assignment 38/57
Political Map

8/8/2019 Completed GEO101 Assignment
http://slidepdf.com/reader/full/completed-geo101-assignment 39/57
Economic Features and Trading Features
Trading Features
Export and import commodities:
Export commodities: Clothing, Carpets, Leather goods, Jute goods, Pulses,
grain.
Import commodities: Petroleum products, Machinery and Equipment, Electrical
goods.
Relation of export and import trade:
Export trade: India 59.2%, US 8.7%, Bangladesh 8.3%, Germany 4.3%
Import trade: India 55.4%, China 13.3%, and Singapore 2%
Important places related with trade: Kathmandu, Nepalganj.
Export: $868 million
Import: $3.229 billion
Balance: -$2.361 billion (Trade Deficiency)
The imports of Nepal are greater than its exports. For that ground, the balance of
trade is showing negative value which indicates trade deficiency.

8/8/2019 Completed GEO101 Assignment
http://slidepdf.com/reader/full/completed-geo101-assignment 40/57
Economic Features
GDP: $31.39 billion
GDP Growth Rate: 5.3%
Contribution of different sectors to GDP:
Sector Subsector Contribution to GDPPrimary Agriculture 32.5%Secondary Industry 16.6%Tertiary Services 50.9%
32%
17%
51%
Contribution of Different Sectors to GDP
Agriculture
Industry
Services

8/8/2019 Completed GEO101 Assignment
http://slidepdf.com/reader/full/completed-geo101-assignment 41/57
Kenya
Basic Information
Official Name: Republic of Kenya
Capital: Nairobi
Total area:
Total: 580,367 sq km
Land: 569,140 sq km
Water: 11,227 sq km
Geographical boundary: Situated along the Indian Ocean, at the equator . Total border
of 3,477 km. Border countries include Ethiopia 861 km, Somalia 682 km, Sudan 232
km, Tanzania 769 km, Uganda 933 km
Total population: 39,002,772
Population density in per square: 59/km2
Natural increase rate of population: 2.691%
Per capita income of population (avg.): $770
Literacy rate
Total: 85.1%
Males: 90.6%
Female: 79.7%

8/8/2019 Completed GEO101 Assignment
http://slidepdf.com/reader/full/completed-geo101-assignment 42/57
Urban-rural population:
Urban population: 22% of total population
Rural population: 78% of total population
Political Map

8/8/2019 Completed GEO101 Assignment
http://slidepdf.com/reader/full/completed-geo101-assignment 43/57
Economic Features and Trading Features
Trading Features
Export and import commodities:
Export Commodities: Tea, Horticultural products, Petroleum products, Fish and
Cement
Import Commodities: Machinery, Transportation equipments, Petroleum
products, Motor Vehicles, Steel, Resins and Plastic
Quantity of export and import commodities:
Relation of export and import trade:
Export Partners: UK 10%, Netherlands 9.2%, Uganda 9%, Tanzania 8.7%, US
6.3%, Pakistan 5.6%
Import Partners: India 14.1%, UAE 11.5%, China 10%, Saudi Arabia 8%, South
Africa 5.7%, Japan 5.1%
Important places related with trade: Nairobi, Mombasa.
Export: $5.04 billion
Import: $10.69 billion
Balance: -$5.65 billion (Trade Deficiency)
The imports of Kenya are greater than its exports. For that explanation, the balance of
trade is showing negative value which indicates trade deficiency.

8/8/2019 Completed GEO101 Assignment
http://slidepdf.com/reader/full/completed-geo101-assignment 44/57
Economic Features
GDP: $61.65 billion
GDP Growth Rate: 1.7%
Contribution of different sectors to GDP:
Sector Subsector Contribution to GDPPrimary Agriculture 23.8Secondary Industry 16.7 Tertiary Services 59.5
24%
17%59%
Contribution of Different Sectors to GDP
Primary
Secondary
Tertiary

8/8/2019 Completed GEO101 Assignment
http://slidepdf.com/reader/full/completed-geo101-assignment 45/57
Chapter 3
Comparison of Three Different Regions of the World

8/8/2019 Completed GEO101 Assignment
http://slidepdf.com/reader/full/completed-geo101-assignment 46/57
Comparison of GDP Contribution
Developed Countries
Country Primary(Agriculture) Secondary(Industry) Tertiary(Services)Japan 1.5% 26.3% 72.3%Germany 0.9% 30.1% 69.1%USA 1.2 19.2% 79.6%
Source: CIA fact book.
If we observe the above diagram of GDP contribution of three developed countries, we
can see that the United States is the most developed in service sector than the other
two developed counties named Japan and Germany. That proves they emphasize more
on tertiary sector comparison to other two developed countries. However another
developed country Japan has the highest GDP contribution on agriculture that indicates
they are developed in primary sector compare to other two developed countries. Yet if
we observe the GDP contribution of Germany, we can see that the Germans give more
emphasize on secondary sectors compare to other two developed countries. That
indicates they emphasize on Tertiary sector.
JapanGermany
USA
1.50.9
1.2
26.3 30.1
19.2
72.369.1
79.6
Contribution of Different Sectors to GDP
Primary Secondary Tertiary

8/8/2019 Completed GEO101 Assignment
http://slidepdf.com/reader/full/completed-geo101-assignment 47/57
Developing Countries
Country Primary(Agriculture) Secondary(Industry) Tertiary(Services)Egypt 13.2% 38.7% 48.1%Indonesia 14.4% 48.1% 37.5%
Philippines 14.7% 31.6% 53.7%
Source: CIA fact book.If we observe the diagram we can see that developing country Indonesia contribute
more on industry sector compare to other two developing countries. That indicates they
are developed in secondary sector. However if we observe the condition of Philippines
we can see that they emphasize on agriculture and service sector compare to other two
which indicates they are developed in primary and tertiary sectors. In the case of GDP
contribution, Egypt is developed in secondary sector compare to Philippines and tertiary
sector compare to Indonesia.
EgyptIndonesia
Philippines
13.214.4
14.7
38.748.1
31.6
48.1
37.5
53.7
Contribution of Different Sectors to GDP
Primary Secondary Tertiary

8/8/2019 Completed GEO101 Assignment
http://slidepdf.com/reader/full/completed-geo101-assignment 48/57
8/8/2019 Completed GEO101 Assignment
http://slidepdf.com/reader/full/completed-geo101-assignment 49/57
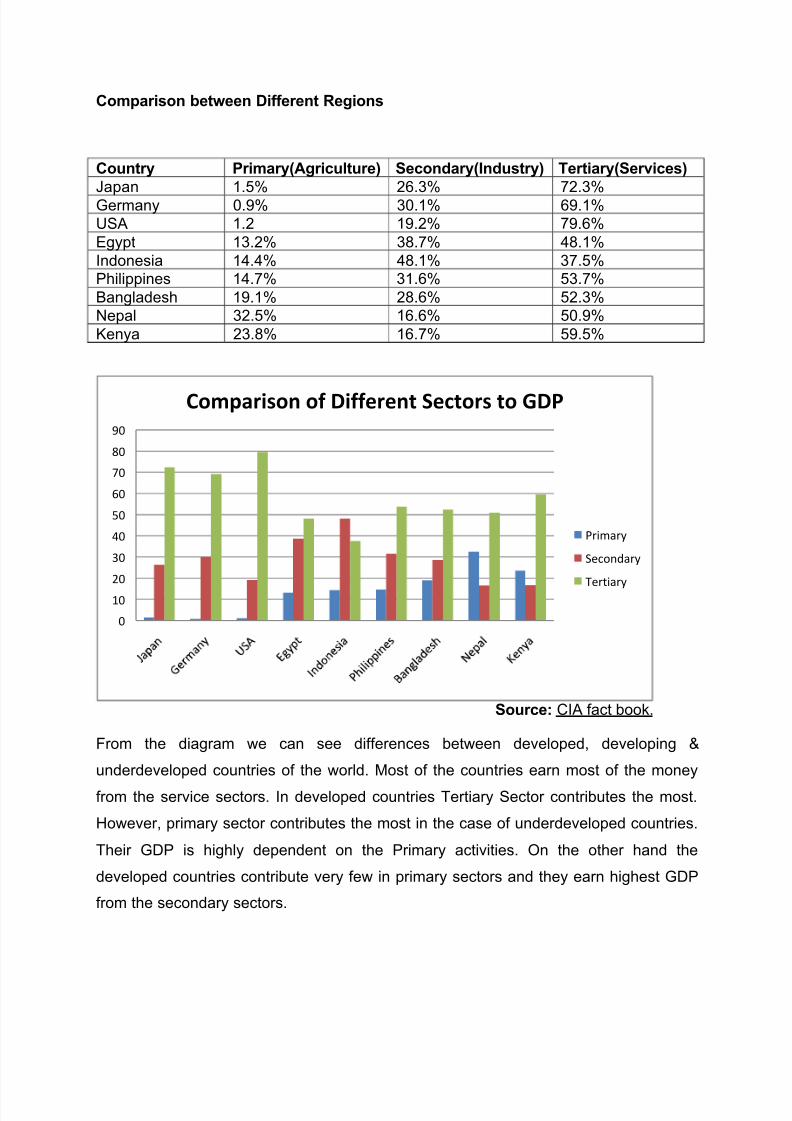
Comparison between Different Regions
Country Primary(Agriculture) Secondary(Industry) Tertiary(Services)Japan 1.5% 26.3% 72.3%Germany 0.9% 30.1% 69.1%USA 1.2 19.2% 79.6%Egypt 13.2% 38.7% 48.1%Indonesia 14.4% 48.1% 37.5%Philippines 14.7% 31.6% 53.7%Bangladesh 19.1% 28.6% 52.3%Nepal 32.5% 16.6% 50.9%Kenya 23.8% 16.7% 59.5%
Source: CIA fact book.
From the diagram we can see differences between developed, developing &
underdeveloped countries of the world. Most of the countries earn most of the money
from the service sectors. In developed countries Tertiary Sector contributes the most.
However, primary sector contributes the most in the case of underdeveloped countries.
Their GDP is highly dependent on the Primary activities. On the other hand the
developed countries contribute very few in primary sectors and they earn highest GDP
from the secondary sectors.
0
10
20
30
40
50
60
70
80
90
Comparison of Different Sectors to GDP
Primary
Secondary
Tertiary

8/8/2019 Completed GEO101 Assignment
http://slidepdf.com/reader/full/completed-geo101-assignment 50/57
Per Capita Income
Developed Countries
Country Per Capita Income
Japan $38,210
Germany $42,440
USA $47,580
Source: CIA fact book.
If we see the previous figure we can see that per capita income of the United States is
higher than Japan and Germany. After USA, Germany and Japan come respectively.
That indicates the standard of living of the people of the United States is better than
Japan and Germany.
$0
$5,000
$10,000
$15,000
$20,000
$25,000
$30,000
$35,000
$40,000
$45,000
$50,000
Japan
Germany
USA
8/8/2019 Completed GEO101 Assignment
http://slidepdf.com/reader/full/completed-geo101-assignment 51/57
Developing Countries
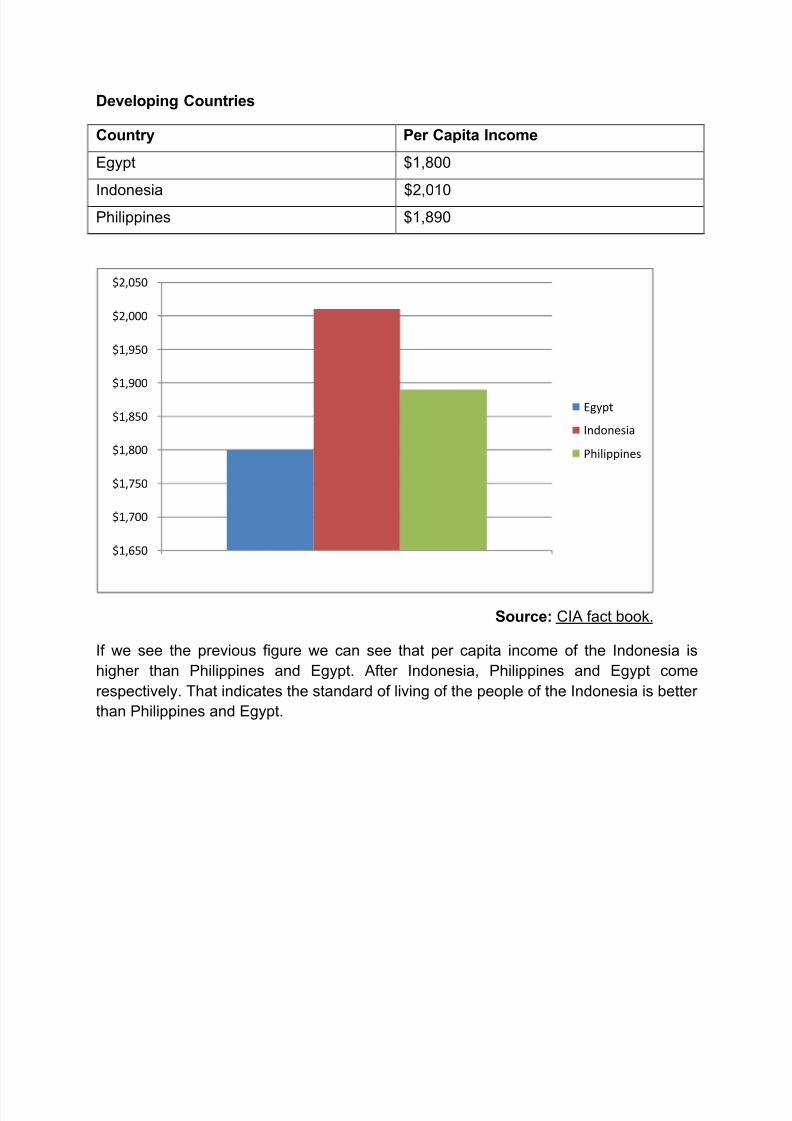
Country Per Capita Income
Egypt $1,800
Indonesia $2,010 Philippines $1,890
Source: CIA fact book.
If we see the previous figure we can see that per capita income of the Indonesia is
higher than Philippines and Egypt. After Indonesia, Philippines and Egypt come
respectively. That indicates the standard of living of the people of the Indonesia is better
than Philippines and Egypt.
$1,650
$1,700
$1,750
$1,800
$1,850
$1,900
$1,950
$2,000
$2,050
Egypt
Indonesia
Philippines

8/8/2019 Completed GEO101 Assignment
http://slidepdf.com/reader/full/completed-geo101-assignment 52/57
Underdeveloped Countries
Country Per Capita Income
Bangladesh $520
Nepal $400 Kenya $770
Source: CIA fact book.
If we witness the previous figure we can see that per capita income of the Kenya is
higher than Bangladesh and Nepal. After Kenya, Bangladesh and Nepal come
respectively. That indicates the standard of living of the people of the Kenya is better
than Bangladesh and Nepal.
$0
$100
$200
$300
$400
$500
$600
$700
$800
$900
Bangladesh
Nepal
Kenya

8/8/2019 Completed GEO101 Assignment
http://slidepdf.com/reader/full/completed-geo101-assignment 53/57
Comparison of Per Capita Income of Different Regions
Countries Per Capita IncomeJapan $38,210
Germany $42,440
USA $47,580
Egypt $1,800
Indonesia $2,010
Philippines $1,890
Bangladesh $520
Nepal $400
Kenya $770
Source: CIA fact book.
If compare between three regions such as developed, underdeveloped and developing
countries we can observe that the per capita income of developed countries is higher
than under developed and developing countries which indicates the standard of living of
the people of developed countries are better than the standard of living of the people of
developing and under developed countries.
$0
$5,000
$10,000
$15,000
$20,000
$25,000
$30,000
$35,000
$40,000
$45,000
$50,000
Japan
Germany
USA
Egypt
IndonesiaPhillipines
Bangladesh
Nepal
Kenya
8/8/2019 Completed GEO101 Assignment
http://slidepdf.com/reader/full/completed-geo101-assignment 54/57
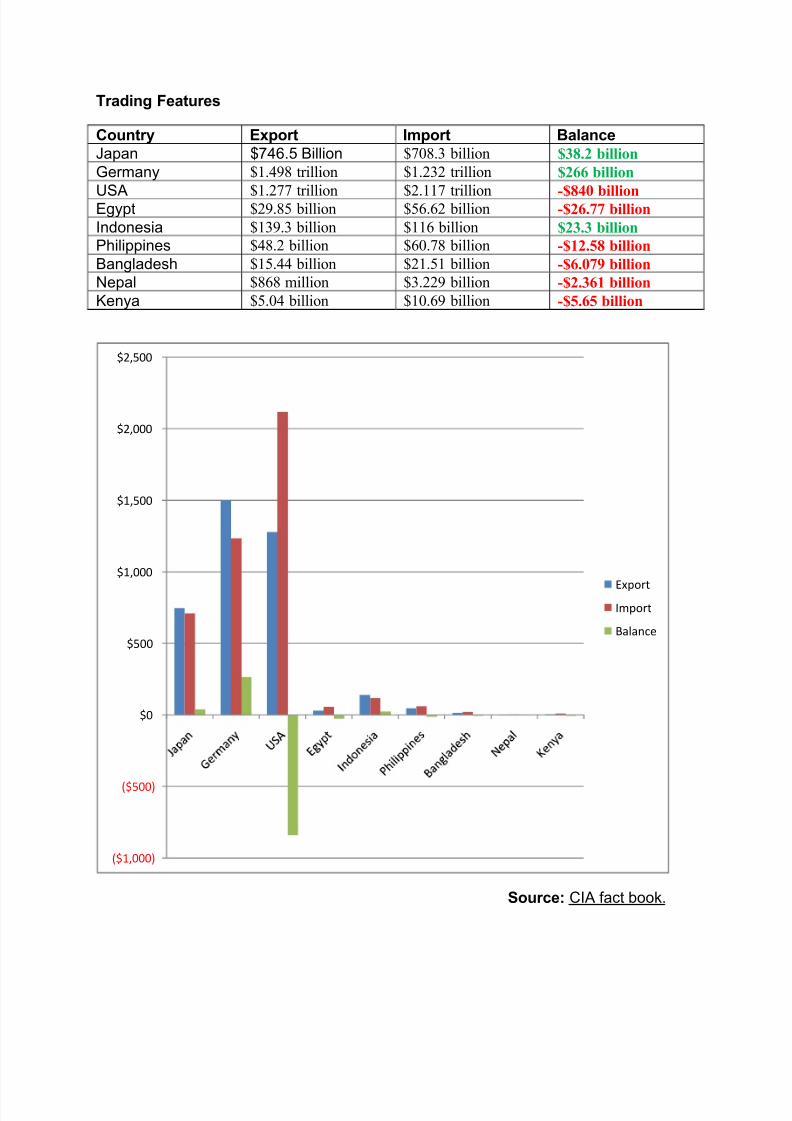
Trading Features
Country Export Import BalanceJapan $746.5 Billion $708.3 billion $38.2 billion Germany $1.498 trillion $1.232 trillion $266 billion
USA $1.277 trillion $2.117 trillion -
$840 billion Egypt $29.85 billion $56.62 billion -$26.77 billion Indonesia $139.3 billion $116 billion $23.3 billion Philippines $48.2 billion $60.78 billion -$12.58 billion Bangladesh $15.44 billion $21.51 billion -$6.079 billion Nepal $868 million $3.229 billion -$2.361 billion Kenya $5.04 billion $10.69 billion -$5.65 billion
Source: CIA fact book.
($1,000)
($500)
$0
$500
$1,000
$1,500
$2,000
$2,500
ExportImport
Balance

8/8/2019 Completed GEO101 Assignment
http://slidepdf.com/reader/full/completed-geo101-assignment 55/57
If we perceive the trading feature diagram, we can observe that the trading condition of
developed countries is better than the trading condition of under developed and
developing countries. At first we can come to the point of developed countries. The
balance of trade of Japan and Germany are positive. Although the balance of trade of
the United States is negative, but their export and import is very high. If we see the
condition of developing countries named Indonesia, we can observe that their export
and import are lower than developed countries although the balance of trade of
Indonesia is positive. Other two developing countries named Philippines and Egypt is in
a very bad condition in the case of trade. The under developed countries are in a great
trouble in the case of trade. They have very poor quantities of exports and imports and
their balance of trade is negative.
Conclusion
Finally, if we analyze the whole stuff of three regions we can find that the developed
countries are in the most advantaged and tenable position in the case of economic
development. They have the capacity to face any kinds of financial crisis if they
countenance because of the strong position of their economy. On the other hand
developing and under developed countries are in a worst position comparing to
developed countries because they do not have enough economical power or strong
economy. Their trading feature, per capita income and economical features are too
much lower than the developed countries. If anyone observes this whole report
properly, I believe it will be possible to understand the factual condition of the economy
of the entire world with no trouble. Moreover we have also mentioned that how can we
identify that a country is developed, developing and underdeveloped on the basis of per
capita income. Because of per capita income people of developed countries are
enjoying high standard of living compare to other regions¶ countries. Another important
fact is that the developing and underdeveloped countries can follow developed
countries to make their economy strong enough. They can more focus on the industrial
development like the developed.

8/8/2019 Completed GEO101 Assignment
http://slidepdf.com/reader/full/completed-geo101-assignment 56/57
References
1. CIA: The World Fact Book, Bangladesh
https://www.cia.gov/library/publications/the-world-factbook/geos/bg.html
2. CIA: The World Fact Book, Nepal
https://www.cia.gov/library/publications/the-world-factbook/geos/np.html
3. CIA: The World Fact Book, Kenya
https://www.cia.gov/library/publications/the-world-factbook/geos/ke.html
4. CIA: The World Fact Book, Indonesiahttps://www.cia.gov/library/publications/the-world-factbook/geos/id.html
5. CIA: The World Fact Book, Philippines
https://www.cia.gov/library/publications/the-world-factbook/geos/rp.html
6. CIA: The World Fact Book, Egypt
https://www.cia.gov/library/publications/the-world-factbook/geos/eg.html
7. CIA: The World Fact Book, USA
https://www.cia.gov/library/publications/the-world-factbook/geos/us.html
8. CIA: The World Fact Book, Japan
https://www.cia.gov/library/publications/the-world-factbook/geos/ja.html
9. CIA: The World Fact Book, Germany
https://www.cia.gov/library/publications/the-world-factbook/geos/gm.html

8/8/2019 Completed GEO101 Assignment
http://slidepdf.com/reader/full/completed-geo101-assignment 57/57