complete pack of working for the future fact sheets
TRANSCRIPT

WWW.WORKINGFORTHEFUTURE.COM.AU
AUSTRALIA’S FUTURE LABOUR MARKET MYTHS AND REALITIES
FACTSHEET CURRENT ECONOMIC REALITIES
WWW.WORKINGFORTHEFUTURE.COM.AU

WWW.WORKINGFORTHEFUTURE.COM.AU
1
AUSTRALIA’S ECONOMIC CHALLENGESAustralians have not experienced the effects of a major economic downturn or a catastrophic rise in the unemployment rate for 27 years. The economy has greatly benefited from the extensive reforms to the economy in the 1980s and 1990s as well as one of the largest and most sustained commodity price booms in our history in the 2000s. But the adjustment to the end of the mining investment boom has not been easy and a number of economic challenges have emerged.
Looking at the unemployment rate over the past 40 years illustrates the remarkable achievements of the Australian economy (Figure 1). For almost all of the 1980s and 1990s, the unemployment rate was between 6 per cent and 11 per cent. Since 2003, the unemployment rate has remained between 4 per cent and 6 per cent almost entirely. This considerably lower unemployment rate over the last 15 years has occurred at the same time as participation in the labour force has increased dramatically. Notably, a larger proportion of women are working or looking for jobs than ever before.
INCOMES AND WAGES GROWTH HAS BEEN WEAK AS INVESTMENT AND PRODUCTIVITY GROWTH HAVE LANGUISHEDAustralia’s main economic challenge is weak wages and incomes growth. This is fundamentally linked to underwhelming rates of investment and low productivity growth.
Real per capita incomes have gone sideways for six years, and are still slightly below the peak in 2011-12 (Figure 2). While nominal wages (wage price index) growth has improved by a very small amount this year, it is still near the slowest it has been in over 20 years.1 Real wages have barely grown over the past six years.2
Incomes can be driven by external factors that aren’t always in our control (like international commodity prices) or productivity growth. Productivity (innovation and investment) has historically been the main driver of real income growth (Figure 3, overleaf).
CURRENT ECONOMIC REALITIES
AUSTRALIA’S FUTURE LABOUR MARKET MYTHS AND REALITIESCURRENT ECONOMIC REALITIES
1 ABS cat. no. 6345.02 ABS cat. no. 5206.0
Figure 1Australia’s unemployment rate is low by historical standards
Bariol 12/12pt -10Bariol 12/12pt -10Bariol 12/12pt -10
Nimbus Sans 9/11pt -20Nimbus Sans 9/11pt -20
Nimbus Sans 7/9pt -20Nimbus Sans 7/9pt -20
Source: ABS cat. no. 6202.0
Nimbus Sans 8/10pt -20Nimbus Sans 8/10pt -20
Xxxxxxx
Xxxxxxxx
80%
75
70
65
600
2
4
6
8
10
12
Sep-2018Sep-2008Sep-1998Sep-1988Sep-1978
Unemployment rate
20-year averages
Sep-1978 Sep-1988 Sep-1998 Sep-2008 Sep-2018
%
Figure 2Real income per person grew dramatically for 20 years and then stalled
Bariol 12/12pt -10Bariol 12/12pt -10Bariol 12/12pt -10
Nimbus Sans 9/11pt -20Nimbus Sans 9/11pt -20
Nimbus Sans 7/9pt -20Nimbus Sans 7/9pt -20
Source: ABS cat. no. 5206.0
Nimbus Sans 8/10pt -20Nimbus Sans 8/10pt -20
Xxxxxxx
$ (2015-16 dollars)
2017-181988-891959-60
Xxxxxxxx
80%
75
70
65
600
10,000
20,000
30,000
40,000
50,000
60,000
70,000
1959-60 1988-89 2017-18
Real net national disposable income per person

WWW.WORKINGFORTHEFUTURE.COM.AU
2
AUSTRALIA’S FUTURE LABOUR MARKET MYTHS AND REALITIESCURRENT ECONOMIC REALITIES
THE LABOUR MARKET HAS WORKED FAIRLY WELL IN ENSURING MORE PEOPLE HAVE JOBSThe unemployment rate has slowly been falling over the past four years and employment growth has strengthened after close to a decade of weaker growth following the GFC (Figure 5, above).
There were 280,000 people who found jobs over the past year and in almost 80 per cent of cases, these were full-time jobs. The participation rate has been bouncing around a record high level for most of 2018 after rising through 2017.3 This indicates that people are being encouraged to start looking for a job due to the good labour market conditions and, for many, they are successful in their search.
In the 1990s, productivity growth ran at an average 2.2 per cent a year. That was also the pace of real income growth. In the 2000s, real income growth also ran at about the same rate, but slower productivity growth was offset by the record terms of trade boom.
With the terms of trade boom now over and productivity growth remaining weak, real income growth has slowed.
Business investment (capital deepening) typically drives productivity growth. But new business investment is now 12.3% of GDP – as low as it was coming out of the 1990s recession (Figure 4, below). Faster productivity growth therefore requires a pick-up in investment.
Figure 4New business investment as a share of the economy is low
Bariol 12/12pt -10Bariol 12/12pt -10Bariol 12/12pt -10
Nimbus Sans 9/11pt -20Nimbus Sans 9/11pt -20
Nimbus Sans 7/9pt -20Nimbus Sans 7/9pt -20
Nimbus Sans 8/10pt -20Nimbus Sans 8/10pt -20
Xxxxxxx
Xxxxxxxx
80%
75
70
65
60
Source: ABS cat. no. 5206.0
10
12
14
16
18
20% of GDP
New business investment
Historical average
Jun-18
Jun-18
Dec-03Jun-89Dec-74Jun-6010
12
14
16
18
20
Jun-2018Mar-2018Dec-2017Sep-2017Jun-2017Mar-2017Dec-2016Sep-2016Jun-2016Mar-2016Dec-2015Sep-2015Jun-2015Mar-2015Dec-2014Sep-2014Jun-2014Mar-2014Dec-2013Sep-2013Jun-2013Mar-2013Dec-2012Sep-2012Jun-2012Mar-2012Dec-2011Sep-2011Jun-2011Mar-2011Dec-2010Sep-2010Jun-2010Mar-2010Dec-2009Sep-2009Jun-2009Mar-2009Dec-2008Sep-2008Jun-2008Mar-2008Dec-2007Sep-2007Jun-2007Mar-2007Dec-2006Sep-2006Jun-2006Mar-2006Dec-2005Sep-2005Jun-2005Mar-2005Dec-2004Sep-2004Jun-2004Mar-2004Dec-2003Sep-2003Jun-2003Mar-2003Dec-2002Sep-2002Jun-2002Mar-2002Dec-2001Sep-2001Jun-2001Mar-2001Dec-2000Sep-2000Jun-2000Mar-2000Dec-1999Sep-1999Jun-1999Mar-1999Dec-1998Sep-1998Jun-1998Mar-1998Dec-1997Sep-1997Jun-1997Mar-1997Dec-1996Sep-1996Jun-1996Mar-1996Dec-1995Sep-1995Jun-1995Mar-1995Dec-1994Sep-1994Jun-1994Mar-1994Dec-1993Sep-1993Jun-1993Mar-1993Dec-1992Sep-1992Jun-1992Mar-1992Dec-1991Sep-1991Jun-1991Mar-1991Dec-1990Sep-1990Jun-1990Mar-1990Dec-1989Sep-1989Jun-1989Mar-1989Dec-1988Sep-1988Jun-1988Mar-1988Dec-1987Sep-1987Jun-1987Mar-1987Dec-1986Sep-1986Jun-1986Mar-1986Dec-1985Sep-1985Jun-1985Mar-1985Dec-1984Sep-1984Jun-1984Mar-1984Dec-1983Sep-1983Jun-1983Mar-1983Dec-1982Sep-1982Jun-1982Mar-1982Dec-1981Sep-1981Jun-1981Mar-1981Dec-1980Sep-1980Jun-1980Mar-1980Dec-1979Sep-1979Jun-1979Mar-1979Dec-1978Sep-1978Jun-1978Mar-1978Dec-1977Sep-1977Jun-1977Mar-1977Dec-1976Sep-1976Jun-1976Mar-1976Dec-1975Sep-1975Jun-1975Mar-1975Dec-1974Sep-1974Jun-1974Mar-1974Dec-1973Sep-1973Jun-1973Mar-1973Dec-1972Sep-1972Jun-1972Mar-1972Dec-1971Sep-1971Jun-1971Mar-1971Dec-1970Sep-1970Jun-1970Mar-1970Dec-1969Sep-1969Jun-1969Mar-1969Dec-1968Sep-1968Jun-1968Mar-1968Dec-1967Sep-1967Jun-1967Mar-1967Dec-1966Sep-1966Jun-1966Mar-1966Dec-1965Sep-1965Jun-1965Mar-1965Dec-1964Sep-1964Jun-1964Mar-1964Dec-1963Sep-1963Jun-1963Mar-1963Dec-1962Sep-1962Jun-1962Mar-1962Dec-1961Sep-1961Jun-1961Mar-1961Dec-1960Sep-1960Jun-1960
Jun-1960 Dec-1974 Jun-1989 Dec-2003 Jun-2018
Historical average
Source: ABS cat. no. 5206.0
Figure 3Productivity has historically been the main driver of real income growth3.0
2.5
2.0
1.5
1.0
0.5
0
-0.5
Foreign income flows
1980s 1990s
percentage point contribution to growth
2000s 2010 to 2018
Terms of trade Labour utilisationLabour productivityAverage real income
Figure 5Employment growth has strengthened after a decade of weaker growth
Bariol 12/12pt -10Bariol 12/12pt -10Bariol 12/12pt -10
Nimbus Sans 9/11pt -20Nimbus Sans 9/11pt -20
Nimbus Sans 7/9pt -20Nimbus Sans 7/9pt -20
Source: ABS cat. no. 6202.0
Nimbus Sans 8/10pt -20Nimbus Sans 8/10pt -20
Xxxxxxx
% growth through the year % growth through the year
Xxxxxxxx
80%
75
70
65
60 0
1
2
3
4
5
Employment growth
10-yearaverages
Sep-1998 Sep-2003 Sep-2008 Sep-2013 Sep-2018
Sep-1998 Sep-2003 Sep-2008 Sep-2013 Sep-2018
ABS cat. no. 6202.0
WWW.WORKINGFORTHEFUTURE.COM.AU
3
AUSTRALIA’S FUTURE LABOUR MARKET MYTHS AND REALITIESCURRENT ECONOMIC REALITIES
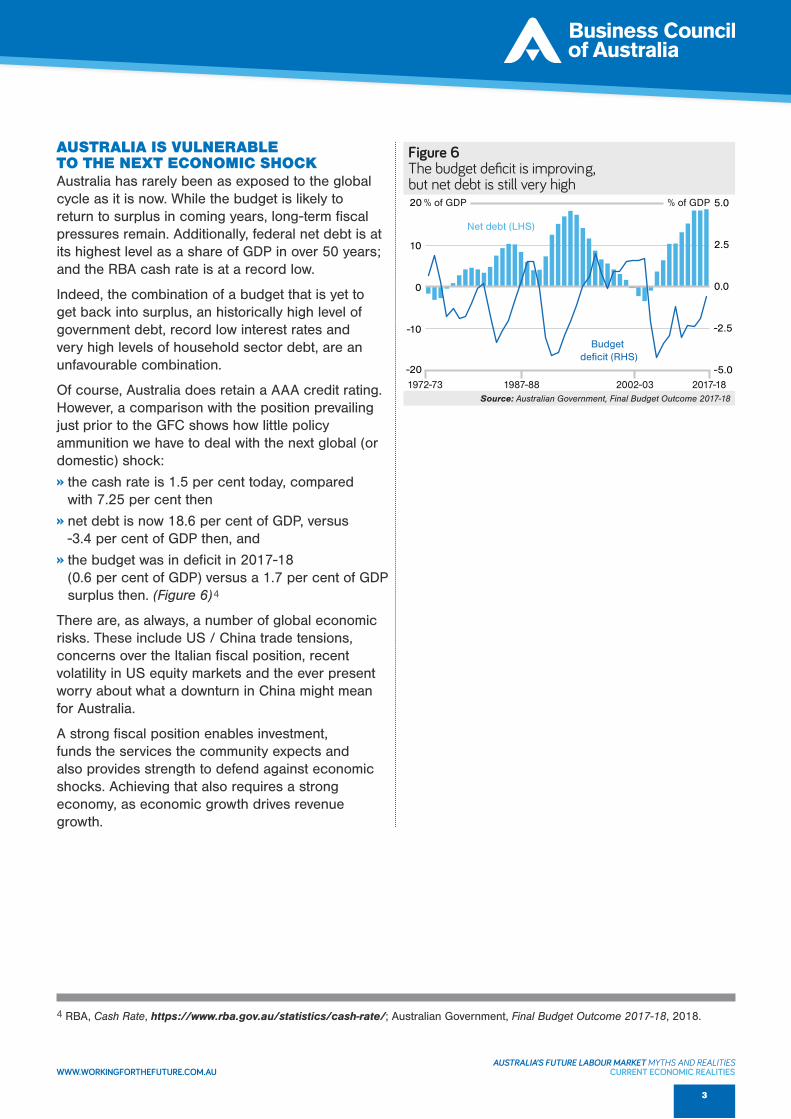
AUSTRALIA IS VULNERABLE TO THE NEXT ECONOMIC SHOCKAustralia has rarely been as exposed to the global cycle as it is now. While the budget is likely to return to surplus in coming years, long-term fiscal pressures remain. Additionally, federal net debt is at its highest level as a share of GDP in over 50 years; and the RBA cash rate is at a record low.
Indeed, the combination of a budget that is yet to get back into surplus, an historically high level of government debt, record low interest rates and very high levels of household sector debt, are an unfavourable combination.
Of course, Australia does retain a AAA credit rating. However, a comparison with the position prevailing just prior to the GFC shows how little policy ammunition we have to deal with the next global (or domestic) shock:
» the cash rate is 1.5 per cent today, compared with 7.25 per cent then
» net debt is now 18.6 per cent of GDP, versus -3.4 per cent of GDP then, and
» the budget was in deficit in 2017-18 (0.6 per cent of GDP) versus a 1.7 per cent of GDP surplus then. (Figure 6)4
There are, as always, a number of global economic risks. These include US / China trade tensions, concerns over the Italian fiscal position, recent volatility in US equity markets and the ever present worry about what a downturn in China might mean for Australia.
A strong fiscal position enables investment, funds the services the community expects and also provides strength to defend against economic shocks. Achieving that also requires a strong economy, as economic growth drives revenue growth.
Figure 6The budget deficit is improving, but net debt is still very high
Bariol 12/12pt -10Bariol 12/12pt -10Bariol 12/12pt -10
Nimbus Sans 9/11pt -20Nimbus Sans 9/11pt -20
Nimbus Sans 7/9pt -20Nimbus Sans 7/9pt -20
Source: Australian Government, Final Budget Outcome 2017-18
Nimbus Sans 8/10pt -20Nimbus Sans 8/10pt -20
Xxxxxxx
Xxxxxxxx
80%
75
70
65
60
Real consumer wage
Net debt (LHS)
% of GDP % of GDP
% of GDP
Budget deficit (RHS)
Real consumer wage +20%Real consumer wage +1%
1972-73 1987-88 2002-03 2017-18
-20
-10
0
10
20
-5.0
-2.5
0.0
2.5
5.0
2017-182016-172015-162014-152013-142012-132011-122010-112009-102008-092007-082006-072005-062004-052003-042002-032001-022000-011999-001998-991997-981996-971995-961994-951993-941992-931991-921990-911989-901988-891987-881986-871985-861984-851983-841982-831981-821980-811979-801978-791977-781976-771975-761974-751973-741972-73
4 RBA, Cash Rate, https://www.rba.gov.au/statistics/cash-rate/; Australian Government, Final Budget Outcome 2017-18, 2018.
WWW.WORKINGFORTHEFUTURE.COM.AU
AUSTRALIA’S FUTURE LABOUR MARKET MYTHS AND REALITIES
FACTSHEET WILL TECHNOLOGY DESTROY JOBS?
WWW.WORKINGFORTHEFUTURE.COM.AU

WWW.WORKINGFORTHEFUTURE.COM.AU
1 Refer to the glossary at the back of this fact sheet for more detail on these technologies.
1
DISCUSSION More Australians today have a job than at any other time in history (12.6 million working Australians).
The current wave of emerging technologies (like artificial intelligence, robotics and automation1) produces a number of new policy challenges, including the impact on Australian workers.
Technological change has been occurring in Australia for decades. Many technologies have taken over tasks that were previously done by people:
from the loom and the harvester, to mass textile production and automatic supermarket checkouts.
The introduction and adoption of information and communication technologies over the last three decades is a good example. The computer and the internet have fundamentally changed the nature of work, jobs and workplaces. However, following the widespread adoption of information and communication technologies, there was no discernible negative impact on employment across
WILL TECHNOLOGY DESTROY JOBS?
AUSTRALIA’S FUTURE LABOUR MARKET MYTHS AND REALITIESWILL TECHNOLOGY DESTROY JOBS?
KEY POINTS Over the past five years, a number of reports have predicted that automation could lead to large-scale destruction of jobs, with estimates reaching as high as more than 40 per cent of Australian jobs over the next decade.
No one can predict the future with certainty, but these estimates appear overblown. They seem to overstate possible job losses and do not capture the full range of impacts of technology:
– The greatest impact of technology will be task change within existing jobs.
Every single job can expect some change in its tasks over the next decade. Research by AlphaBeta suggests that, on average, 9.3 per cent of tasks changed in occupations over the last five years.
Task change is an essential part of adapting to change. Our research suggests jobs that experience more task change have less incidence of job loss.
– A small number of jobs will be entirely substituted. The most credible estimates suggest 5 to 10 per cent of jobs could be entirely substituted by technology over the next decade.
The loss of any job has a personal, emotional and financial cost for the individual involved. Even if future job losses are much smaller than estimated, there is still an overwhelming imperative to assist those individuals to get back into work.
– Technology will also create jobs. Technology can create jobs directly by generating the creation of new roles needed to develop or maintain the technology, or indirectly by enabling productivity improvements that enable jobs growth in other areas.
However, the rate of change will vary across different sectors, and it is possible that some change may be more severe in some sectors and occupations that have been relatively immune in the past.
Australia has been adapting to technology change relatively well for decades. Rather than stoking fear about the impact of technology, we should:
– support all workers to update their skills in the face of task change; and
– provide more intensive support to individuals who may lose their job.
WWW.WORKINGFORTHEFUTURE.COM.AU
2
AUSTRALIA’S FUTURE LABOUR MARKET MYTHS AND REALITIESWILL TECHNOLOGY DESTROY JOBS?
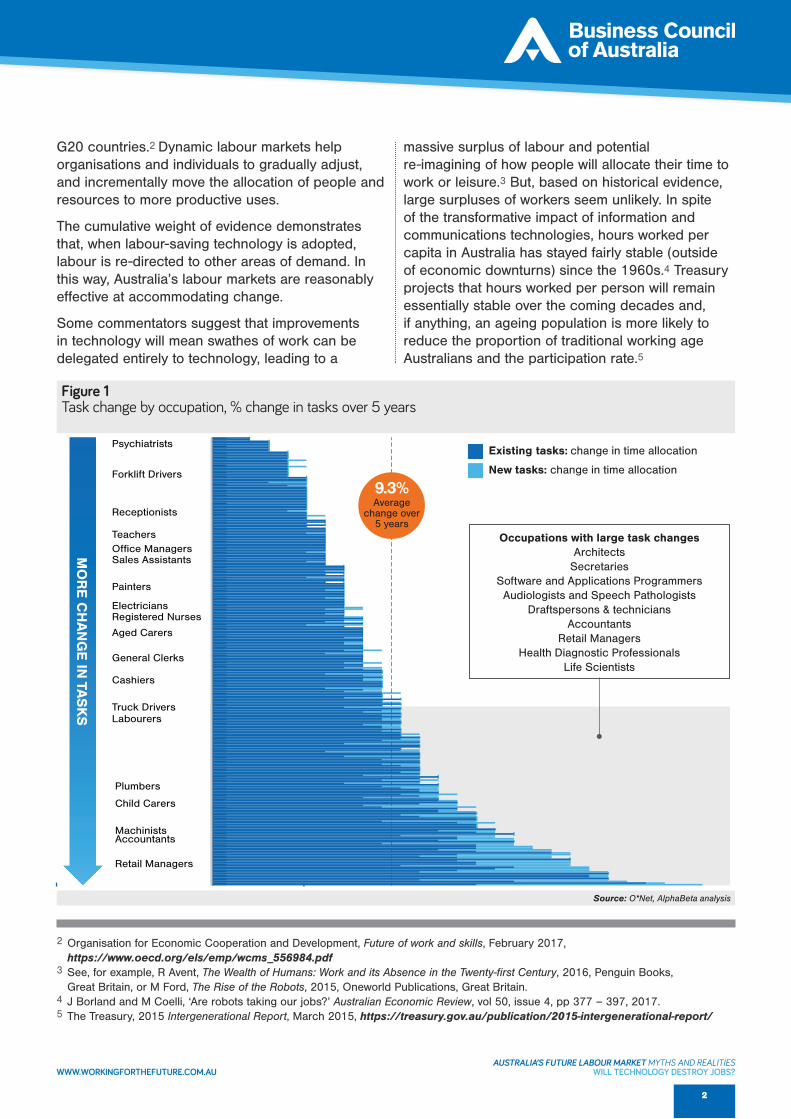
G20 countries.2 Dynamic labour markets help organisations and individuals to gradually adjust, and incrementally move the allocation of people and resources to more productive uses.
The cumulative weight of evidence demonstrates that, when labour-saving technology is adopted, labour is re-directed to other areas of demand. In this way, Australia’s labour markets are reasonably effective at accommodating change.
Some commentators suggest that improvements in technology will mean swathes of work can be delegated entirely to technology, leading to a
massive surplus of labour and potential re-imagining of how people will allocate their time to work or leisure.3 But, based on historical evidence, large surpluses of workers seem unlikely. In spite of the transformative impact of information and communications technologies, hours worked per capita in Australia has stayed fairly stable (outside of economic downturns) since the 1960s.4 Treasury projects that hours worked per person will remain essentially stable over the coming decades and, if anything, an ageing population is more likely to reduce the proportion of traditional working age Australians and the participation rate.5
Figure 1Task change by occupation, % change in tasks over 5 years
Bariol 12/12pt -10Bariol 12/12pt -10Bariol 12/12pt -10
Nimbus Sans 9/11pt -20Nimbus Sans 9/11pt -20
Nimbus Sans 7/9pt -20Nimbus Sans 7/9pt -20
Nimbus Sans 8/10pt -20Nimbus Sans 8/10pt -20
Xxxxxxx
Xxxxxxxx
Xxxxxxxx
80%
75
70
65
60
Forklift Drivers
Receptionists
TeachersOffice ManagersSales Assistants
Painters
Electricians
Registered Nurses
Aged CarersGeneral Clerks
Cashiers
Truck Drivers
Garden and Nursery Labourers
Other Miscellaneous LabourersBuilding and Plumbing Labourers
Labourers
Retail Managers
Accountants
Psychiatrists
Plumbers
Child Carers
Machinists
Existing tasks: change in time allocation
New tasks: change in time allocation
Occupations with large task changesArchitects
SecretariesSoftware and Applications ProgrammersAudiologists and Speech Pathologists
Draftspersons & techniciansAccountants
Retail ManagersHealth Diagnostic Professionals
Life Scientists
MO
RE
CH
AN
GE
IN TA
SK
S
average change over 5 years
Occupations with large task changesArchitects SecretariesSoftware and Applications ProgrammersAudiologists and Speech Pathologists Draftspersons & techniciansAccountantsRetail ManagersHealth Diagnostic ProfessionalsLife Scientists
2014 (Q2-Q4)
2015 (Q1-Q4)
9.3%
43
Average change over
5 years
Source: O*Net, AlphaBeta analysis
Labourers
Plumbers
Truck Drivers
Psychiatrists
Forklift Drivers
Receptionists
TeachersOffice ManagersSales Assistants
Painters
Registered NursesElectricians
Aged Carers
General Clerks
Cashiers
Retail Managers
Child Carers
AccountantsMachinists
2 Organisation for Economic Cooperation and Development, Future of work and skills, February 2017, https://www.oecd.org/els/emp/wcms_556984.pdf
3 See, for example, R Avent, The Wealth of Humans: Work and its Absence in the Twenty-first Century, 2016, Penguin Books, Great Britain, or M Ford, The Rise of the Robots, 2015, Oneworld Publications, Great Britain.
4 J Borland and M Coelli, ‘Are robots taking our jobs?’ Australian Economic Review, vol 50, issue 4, pp 377 – 397, 2017.5 The Treasury, 2015 Intergenerational Report, March 2015, https://treasury.gov.au/publication/2015-intergenerational-report/
WWW.WORKINGFORTHEFUTURE.COM.AU
3
AUSTRALIA’S FUTURE LABOUR MARKET MYTHS AND REALITIESWILL TECHNOLOGY DESTROY JOBS?
Although the overall, aggregate amount of work is unlikely to change, selected cohorts of workers may be disadvantaged by developments in technology. To understand the full impact of technological change, we need to consider:
1 jobs that will remain but will change;
2 jobs that will be entirely substituted by technology; and
3 new jobs that will be created by technology.
TECHNOLOGY WILL RESULT IN CHANGES IN TASKSEvery single job in Australia will likely experience some change in tasks over the next decade.
This is not a new phenomenon. Almost every working Australian gradually adapts to change in their job as a matter of course. It is very difficult to imagine any job in Australia that does not involve a computer, a smartphone, the internet or some form of software at some stage.
Analysis by AlphaBeta suggests that, between 2011 and 2016, the average level of task change within occupations was around 9.3 per cent (Figure 1, previous page). In other words, Australian workers now spend about half a day a week doing tasks that people in the same job were not doing five years ago.
Here are some examples of the task changes that have already occurred:
» Accountants are spending less time computing data and more time resolving clients’ problems.
» Registered nurses are spending less time recording patient histories, and more time monitoring patients.
» Product assemblers are spending less time assembling machinery and more time reviewing and learning.
Many of the tasks that shift from being performed by people to technology will be risky, routine or repetitive. Workers currently performing these tasks have the lowest reported levels of job satisfaction.6
The remaining tasks that will experience greater demand are likely to be tasks that are not well performed by technology, such as solving problems, generating creative ideas and uniquely human interactions. Tasks less likely to be automated and therefore may experience higher demand include:
» perception and manipulation tasks (such as identifying objects and moving them in an unstructured or cluttered working space, or personal services like beauty therapy, or fine motor functions that require detail [like the work of an electrician])
» creative intelligence tasks (such as artistic design, musical composition and cheffing)
» social intelligence tasks (such as negotiation, persuasion and care), and
» problem solving tasks.7
Considering the significant impact technology could have on every single job, an ability to adapt to changing tasks will be essential for every working Australian.
There are many benefits to Australians from adapting to task change: AlphaBeta’s research finds that jobs that experience more task change have less incidence of job losses.
But, we also need to be alert to jobs where the task change may be so great that existing workers are at risk of involuntary transition (job loss).
The education and training system has an important role to play (especially when tasks are changing more rapidly), but the incremental change in tasks also highlights the critical importance of on-the-job learning.
6 AlphaBeta, The Automation Advantage, August 2017, http://www.alphabeta.com/wp-content/uploads/2017/08-/The-Automation-Advantage.pdf
7 C Frey and M Osborne, The future of employment: How susceptible are jobs to computerization?, working paper, September 2013.
WWW.WORKINGFORTHEFUTURE.COM.AU
4
AUSTRALIA’S FUTURE LABOUR MARKET MYTHS AND REALITIESWILL TECHNOLOGY DESTROY JOBS?
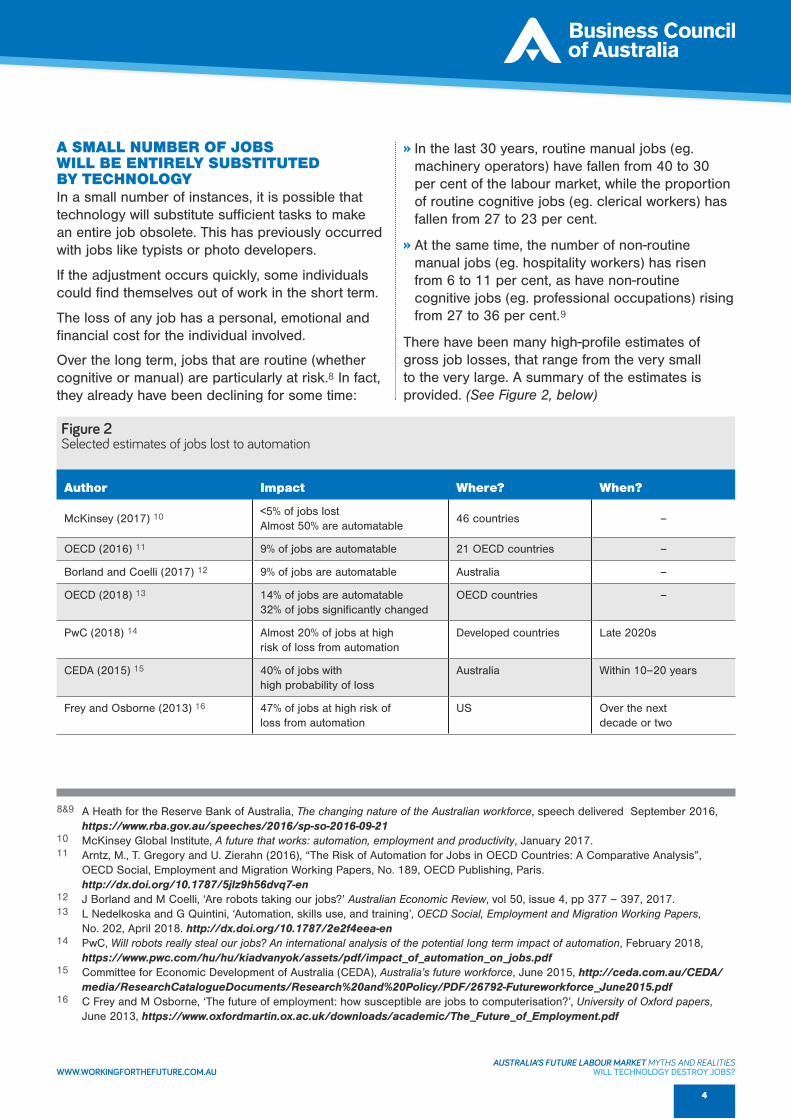
A SMALL NUMBER OF JOBS WILL BE ENTIRELY SUBSTITUTED BY TECHNOLOGYIn a small number of instances, it is possible that technology will substitute sufficient tasks to make an entire job obsolete. This has previously occurred with jobs like typists or photo developers.
If the adjustment occurs quickly, some individuals could find themselves out of work in the short term.
The loss of any job has a personal, emotional and financial cost for the individual involved.
Over the long term, jobs that are routine (whether cognitive or manual) are particularly at risk.8 In fact, they already have been declining for some time:
» In the last 30 years, routine manual jobs (eg. machinery operators) have fallen from 40 to 30 per cent of the labour market, while the proportion of routine cognitive jobs (eg. clerical workers) has fallen from 27 to 23 per cent.
» At the same time, the number of non-routine manual jobs (eg. hospitality workers) has risen from 6 to 11 per cent, as have non-routine cognitive jobs (eg. professional occupations) rising from 27 to 36 per cent.9
There have been many high-profile estimates of gross job losses, that range from the very small to the very large. A summary of the estimates is provided. (See Figure 2, below)
8&9 A Heath for the Reserve Bank of Australia, The changing nature of the Australian workforce, speech delivered September 2016, https://www.rba.gov.au/speeches/2016/sp-so-2016-09-21
10 McKinsey Global Institute, A future that works: automation, employment and productivity, January 2017.11 Arntz, M., T. Gregory and U. Zierahn (2016), “The Risk of Automation for Jobs in OECD Countries: A Comparative Analysis”,
OECD Social, Employment and Migration Working Papers, No. 189, OECD Publishing, Paris. http://dx.doi.org/10.1787/5jlz9h56dvq7-en
12 J Borland and M Coelli, ‘Are robots taking our jobs?’ Australian Economic Review, vol 50, issue 4, pp 377 – 397, 2017.13 L Nedelkoska and G Quintini, ‘Automation, skills use, and training’, OECD Social, Employment and Migration Working Papers,
No. 202, April 2018. http://dx.doi.org/10.1787/2e2f4eea-en14 PwC, Will robots really steal our jobs? An international analysis of the potential long term impact of automation, February 2018,
https://www.pwc.com/hu/hu/kiadvanyok/assets/pdf/impact_of_automation_on_jobs.pdf15 Committee for Economic Development of Australia (CEDA), Australia’s future workforce, June 2015, http://ceda.com.au/CEDA/
media/ResearchCatalogueDocuments/Research%20and%20Policy/PDF/26792-Futureworkforce_June2015.pdf16 C Frey and M Osborne, ‘The future of employment: how susceptible are jobs to computerisation?’, University of Oxford papers,
June 2013, https://www.oxfordmartin.ox.ac.uk/downloads/academic/The_Future_of_Employment.pdf
Author Impact Where? When?
McKinsey (2017) 10 <5% of jobs lost Almost 50% are automatable
46 countries –
OECD (2016) 11 9% of jobs are automatable 21 OECD countries –
Borland and Coelli (2017) 12 9% of jobs are automatable Australia –
OECD (2018) 13 14% of jobs are automatable32% of jobs significantly changed
OECD countries –
PwC (2018) 14 Almost 20% of jobs at high risk of loss from automation
Developed countries Late 2020s
CEDA (2015) 15 40% of jobs with high probability of loss
Australia Within 10–20 years
Frey and Osborne (2013) 16 47% of jobs at high risk of loss from automation
US Over the next decade or two
Figure 2Selected estimates of jobs lost to automation
WWW.WORKINGFORTHEFUTURE.COM.AU
5
AUSTRALIA’S FUTURE LABOUR MARKET MYTHS AND REALITIESWILL TECHNOLOGY DESTROY JOBS?
17 J Borland and M Coelli, ‘Are robots taking our jobs?’ Australian Economic Review, vol 50, issue 4, pp 377–397, 2017.18 H Wilson, P Daugherty and N Morini-Bianzano, ‘The jobs that artificial intelligence will create’,
MIT Management Review, March 2017.19 CSIRO, Tomorrow’s Digitally Enabled Workforce, January 2016.20 D Acemoglu and P Restrepo, ‘Artificial Intelligence, Automation and Work’, Economics of Artificial Intelligence, December 2017.21 McKinsey, Digital Australia: Seizing the opportunity from the Fourth Industrial Revolution, May 2017.
TECHNOLOGY WILL ALSO CREATE JOBSWe can also expect that technology will directly and indirectly create jobs.
Some of the jobs that would be directly created would likely include those that:
» develop, maintain and propagate the technology. For example, greater use of artificial intelligence will necessitate jobs for people who are ‘trainers’ (who teach artificial intelligence systems how to act), ‘explainers’ (who translate artificial intelligence results into language for people to understand) and ‘sustainers’ (who maintain artificial intelligence systems and ensure ethical use)18, and
» use or complement the technology: for example, in Australia, there has been a rise in demand for photographers at the same time there has been a decline in photo developers and printers.19
Technology also indirectly creates jobs, primarily through improving productivity. Productivity is important because it is the key determinant of Australia’s long-run living standards. Increasing productivity is critical to increasing real incomes over time.
As technology improves productivity, the resulting higher incomes create new or increased demand for goods and services generally, and free up resources to be used for more productive purposes.
The displacement effect from technology in the past has been offset by improvements in productivity.20
There are many estimates about the potentially large productivity benefits to be gained from deployment of technology. For example, McKinsey embracing digital technologies could add between $140 billion and $250 billion to the Australian economy by 2025.21
The direct and indirect creation of jobs by technology is likely to lead to net jobs growth, even as jobs may be displaced by technology over the long term. (Figure 3, ‘Glossary’ overleaf)
Some of these estimates overstate the potential job losses. For example, one critique suggests the methodology in Frey and Osborne (2013) – among other things – assumes that, if one task in a job can be automated, the entire job will be substituted.17 We believe it is much more credible to expect that, if one task within a job is automated, the job will likely remain and the worker’s time will be devoted to a different, more productive task.
For this reason, the most credible estimates seem to suggest the job displacement will be at the smaller end (between 5 and 10 per cent over the next decade).
Even if future job losses are much smaller than estimated, this does not diminish the need for a proper discussion on what we need to do to prepare. There is still an overwhelming imperative to assist those individuals to get back into work. The personal, emotional and financial cost for the individual can be so significant that, even if the aggregate numbers are smaller than expected, there is still more that can be done to assist those individuals.
The timing and location of job substitution can be difficult to predict. The speed at which labour-saving technology is adopted will depend on a range of factors (including cost, social acceptance and regulatory requirements) – not just the availability of the technology. The rate of change will differ across different sectors, and it is possible that some change may be more severe in some sectors and occupations that have been relatively immune in the past.

WWW.WORKINGFORTHEFUTURE.COM.AU
6
AUSTRALIA’S FUTURE LABOUR MARKET MYTHS AND REALITIESWILL TECHNOLOGY DESTROY JOBS?
Term Meaning
Artificial intelligenceTechnologies that analyse data and language in new ways to recognise complex patterns and improve their own analysis.
AutomationAutomation could extend to any technology that allows a task to be completed without a human performing it. Robotic process automation is a type of software that can complete a task without a human performing it.
Internet of ThingsThe connection of physical objects to the Internet (potentially through sensors or other technologies), allowing objects to communicate data, and be controlled remotely.
Robotics The development of physical machines that can replicate human actions.
Figure 3Glossary
WWW.WORKINGFORTHEFUTURE.COM.AU
AUSTRALIA’S FUTURE LABOUR MARKET MYTHS AND REALITIES
FACTSHEET WILL ALL NEW JOBS BE HIGH-TECH, HIGHLY SKILLED JOBS?
WWW.WORKINGFORTHEFUTURE.COM.AU

WWW.WORKINGFORTHEFUTURE.COM.AU
KEY POINTS Much of the public discussion of work in the future focusses on the new jobs that will be created by technologies like artificial intelligence, robotics, cyber security and data. While these types of jobs hold exciting potential, they are likely to represent a relatively small proportion of the Australian labour market.
Jobs growth is likely to occur in many industries and parts of the labour market, but the health, aged and child care sectors are projected to experience the most growth over the next five years.
Technology will require a higher level of skill and knowledge generally across the labour market. However, in the short term, Australia is expected to experience jobs growth at all skill levels.
1
T he skills needs of the Australian labour market have progressively been increasing for some time.1
The average increasing level of skill has been driven by multiple factors:
» Higher levels of skill have been required in sectors to operate and manipulate new technology. For example, in mining, as processes become increasingly automated.
» Advances in technology are biased towards skills. Over the 20th century, technological development raised demand for skilled workers, resulting in more jobs and wage premiums.2
» Shifts in the industry composition of employment has led to stronger growth in higher-skilled jobs in industries like professional services and lowest growth in lower-skilled jobs, such as machinery operators, labourers, and clerical workers.
The services sectors dominates the Australian labour market and this is projected to continue. The number of workers in these sectors is already a sizeable proportion of the labour force and the Department of Jobs and Small Business projects these sectors will continue to grow at a faster rate than other sectors. Over the next five years, the fastest-growing sectors are projected to be health, aged care and child care (14.9 per cent), education (11.2 per cent) and professional, scientific and technical services (10.2 per cent) (Figure 1, overleaf).
WILL ALL NEW JOBS BE HIGH-TECH, HIGHLY SKILLED JOBS?
AUSTRALIA’S FUTURE LABOUR MARKET MYTHS AND REALITIESWILL ALL NEW JOBS BE HIGH-TECH, HIGHLY SKILLED JOBS?
1 R Adeney for the Reserve Bank of Australia, Structural Change in the Australian Economy, RBA Bulletin, 15 March 2018, https://www.rba.gov.au/publications/bulletin/2018/mar/structural-change-in-the-australian-economy.html
2 There is some evidence that technological change in the 19th century was in fact biased against skills. See D Acemoglu, ‘Technical Change, Inequality and the Labor Market’, Journal of Economic Literature, vol 40, no 1, March 2002.

WWW.WORKINGFORTHEFUTURE.COM.AU
2
AUSTRALIA’S FUTURE LABOUR MARKET MYTHS AND REALITIESWILL ALL NEW JOBS BE HIGH-TECH, HIGHLY SKILLED JOBS?
Health, aged and child care
Retail trade
Construction
Professional, scientific and technical Services
Education and training
Manufacturing
Accommodation and food
Public administration and safety
Transport and storage
Other services
Finance and insurance
Administrative and support services
Wholesale trade
Agriculture
Arts and recreation
Mining
Information media and telecommunications
Real estate and leasing
Utilities
Figure 1Current employment levels by sector, and projected growth 2018 - 2023 (seasonally adjusted)
Source: Department of Jobs and Small Business, Industry employment projections for the five years to May 2023
Current employment level (‘000s)
-500 0 500 1000
-9.7
-1.4
+22.0
+27.9
+14.2
+6.9
+26.9
+37.7
+81.4
+8.5
+113
+106.6
+118.8
+47.6
+5.6
+10.8
+13.1
+6.1
1500 2000
Projected employment growth 2018-2023 (‘000s)
+250.3
The projected growth in the health care and social assistance sector alone (an additional 250,000 people over five years) outnumbers the current size of some industries.
When we examine the projections by skill level, it is clear that there will continue to be strong growth at all skill levels – but especially the highest skill level (refer Figure 2, opposite).
Every one of the top 20 highest-employing occupations are projected to need more workers in five years’ time than they employ today, even though the rates of growth will vary (see Figure 3 overleaf).
Figure 2 Projected employment growth 2018-23, by skill level (seasonally adjusted)
Bariol 12/12pt -10Bariol 12/12pt -10Bariol 12/12pt -10
Nimbus Sans 9/11pt -20Nimbus Sans 9/11pt -20
Nimbus Sans 7/9pt -20Nimbus Sans 7/9pt -20
Source: Department of Jobs and Small Business
Nimbus Sans 8/10pt -20Nimbus Sans 8/10pt -20
Xxxxxxx
Xxxxxxx
Xxxxxxxx
80%
75
70
65
60 0 500 1000 1500 2000 2500 3000 3500 4000 4500 5000
Skill Level 5
Skill Level 4
Skill Level 3
Skill Level 2
Skill Level 1
Projected growth 2018-2023
Employment as at May 2018
3
Notes: Jobs that require the highest amount of skill are Skill Level 1, the lowest Skill Level 5. See the final page for a detailed description of skill levels.
3 Department of Jobs and Small Business, Skill employment projections for the five years to May 2023

WWW.WORKINGFORTHEFUTURE.COM.AU
3
AUSTRALIA’S FUTURE LABOUR MARKET MYTHS AND REALITIESWILL ALL NEW JOBS BE HIGH-TECH, HIGHLY SKILLED JOBS?
TOP 20 OCCUPATIONS IN 2018 IN 2023
Occupation # of workers
1 Sales assistants 711,700 +11,900
2 School teachers 426,100 +45,900
3 Midwifery and nursing professionals 326 200 +59,900
4 Personal carers and assistants 301,700 +82,500
5 Accounting clerks and bookkeepers 297,200 +40,100
6 Hospitality workers 290,200 +2,900
7 Cleaners and laundry workers 281,800 +11,400
8 Managers (construction, distribution and production) 266,000 +26,900
9 Managers (retail) 233,300 +11,300
10 General clerks 231,500 +4,300
11 Accountants, auditors and company secretaries 217,900 +28,300
12 Truck drivers 209,300 +10,000
13 Food trades workers 200,000 +13,800
14 Construction and mining labourers 191,500 +18,200
15 Food preparation assistants 188,600 +20,800
16 Receptionists 182,400 +31,400
17 Managers (business administration) 179,900 +16,800
18 Managers (miscellaneous hospitality, retail and service) 176,300 +30,800
19 Social and welfare professionals 167,500 +8,600
20 Bricklayers, carpenters and joiners 165,100 + 26,400
– Business and systems analysts, and programmers 160,200 +13,300
– Information and organisation professionals 164,200 +6,300
Source: Department of Jobs and Small Business, Occupation employment projections for the five years to May 2023
Figure 3 Top 20 highest employing occupations in Australia, 2018 and official projected highest employing occupations, 2023 (seasonally adjusted)
The Department of Jobs and Small Business projects the greatest growth in occupation between 2018 and 2023 will be in the following minor occupational groups:
– aged and disabled care workers (net job growth of 69,200)
– registered nurses (51,400)– child carers (27,600)– software and application
programmers (25,500), and– waiters (21,800).
Sales and hospitality occupations employ many people, including a large share of new entrants to the labour market. There are also large ‘outflows’ in workers from these industries, suggesting that many young workers begin their working lives in these industries before moving to other occupations.4
The strong growth in sales assistants and hospitality workers suggests there will continue to be entry-level opportunities in the labour market.
4 P D’Arcy, et al. for the Reserve Bank of Australia, ‘Labour Market Turnover and Mobility’, RBA Bulletin, December Quarter 2012.

WWW.WORKINGFORTHEFUTURE.COM.AU
WHAT ARE SKILLS LEVELS 1 TO 5?
The Australian Bureau of Statistics has assigned every job in Australia a ‘Skill Level’, the level of skills required to perform that job. Skill Level 1 is the highest, Skill Level 5 is the lowest.
The majority of occupations at Skill Level 1 are in the managers and professionals occupational groups. Examples of specific jobs include: economists, dentists, production managers and livestock farmers.
The majority of occupations at Skill Level 2 are spread across the managers, technicians and trades workers, community and personal service worker occupational groups. Examples of specific jobs include: retail managers, safety inspectors and ICT support technicians and paramedics.
The majority of occupations at Skill Level 3 are in the technicians and trades workers occupational groups. Examples of specific jobs include: florists, cooks and plumbers.
The majority of occupations at Skill Level 4 are in the sales workers, machinery operators and drivers, and labourers occupational groups. Examples of specific jobs include: visual merchandisers, delivery drivers and product quality controllers.
A small subset of roles can also be found in the community and personal service workers and clerical and administrative workers occupational groups. Examples of specific jobs include: dental assistants and bank workers.
The majority of occupations at Skill Level 5 are in the sales workers, machinery operators and drivers, and labourers occupational groups. For example, sales assistants, concreters and packers are skill level five occupations.
4
AUSTRALIA’S FUTURE LABOUR MARKET MYTHS AND REALITIESWILL ALL NEW JOBS BE HIGH-TECH, HIGHLY SKILLED JOBS?

WWW.WORKINGFORTHEFUTURE.COM.AU
AUSTRALIA’S FUTURE LABOUR MARKET MYTHS AND REALITIES
FACTSHEET WILL WEAK WAGES GROWTH CONTINUE?
WWW.WORKINGFORTHEFUTURE.COM.AU

WWW.WORKINGFORTHEFUTURE.COM.AU
1
BY ANY MEASURE, WAGES GROWTH HAS BEEN DISAPPOINTING FOR SEVERAL YEARSSince 2012, all measures of national wages growth have slowed (Figure 1).
The real consumer wage is arguably the most insightful measure from a national perspective, as it captures changes in total labour remuneration paid and hours worked. It is also adjusted for changes in the cost of living. Workers are more interested in what their total pay packet buys than the nominal dollar amount.
Real wages have stagnated in recent years as nominal wages increases have not, in many cases, been enough to exceed cost of living increases.
People understandably are frustrated when they see their incomes stagnate or even decline, at the same time as prices for many essential services, such as energy and health care, rise faster than headline inflation. It is small wonder that cost of living pressures top community concerns.
More recently there has been some improvement in real consumer wages, largely reflecting an increase in hours worked rather than stronger growth in wage rates (nominal wages growth is a little over 2 per cent).
WILL WEAK WAGES GROWTH CONTINUE?
AUSTRALIA’S FUTURE LABOUR MARKET MYTHS AND REALITIESWILL WEAK WAGES GROWTH CONTINUE?
KEY POINTS Since 2012, all measures of wages growth have slowed. Real wages have stagnated in recent years as nominal wages increases have not, in many cases, been enough to exceed cost of living increases.
People understandably are frustrated when they see their incomes stagnate or even decline, at the same time as prices for many essential services, such as energy and health care, rise faster than headline inflation.
But the link between productivity growth and wages growth is not broken. Since the last recession, real consumer wages have increased by 54 per cent while labour productivity rose by 51 per cent.
Labour is not missing out on productivity gains: the main problem is that recently productivity growth has been relatively weak.
Below par labour productivity growth, reflecting lacklustre investment and multifactor productivity growth (more effectively using people’s skills and physical capital), has also coincided with the adjustment of the economy to the end of one of the largest and most sustained commodity price booms Australia has seen.
Policies and interventions that undermine or ignore productivity growth, such as arbitrary wage increases or increased regulation, will only hamper future income growth.
Competitive tax and regulatory settings that encourage dynamic, competitive businesses and stronger investment and innovation, will be vital for strengthening productivity and wages growth across the board.
Figure 1Wages growth has stalled but is starting to show signs of improvement
Bariol 12/12pt -10Bariol 12/12pt -10Bariol 12/12pt -10
Nimbus Sans 9/11pt -20Nimbus Sans 9/11pt -20
Nimbus Sans 7/9pt -20Nimbus Sans 7/9pt -20
Sources: ABS cat. no. 5206.0, 6302.0 and 6345.0
Nimbus Sans 8/10pt -20Nimbus Sans 8/10pt -20
Xxxxxxx
% growth 3-year rolling average
Xxxxxxxx
80%
75
70
65
60
Low-inflation environment
Jun-81 Jun-18Jun-81 Jun-18
-4
-2
0
2
4
6
8
10
12
14
16Real consumer wages
Average Earnings in the National Accounts
Average Weekly Ordinary Time Earnings
Wage Price Index
Jun-18Mar-18Dec-17Sep-17Jun-17Mar-17Dec-16Sep-16Jun-16Mar-16Dec-15Sep-15Jun-15Mar-15Dec-14Sep-14Jun-14Mar-14Dec-13Sep-13Jun-13Mar-13Dec-12Sep-12Jun-12Mar-12Dec-11Sep-11Jun-11Mar-11Dec-10Sep-10Jun-10Mar-10Dec-09Sep-09Jun-09Mar-09Dec-08Sep-08Jun-08Mar-08Dec-07Sep-07Jun-07Mar-07Dec-06Sep-06Jun-06Mar-06Dec-05Sep-05Jun-05Mar-05Dec-04Sep-04Jun-04Mar-04Dec-03Sep-03Jun-03Mar-03Dec-02Sep-02Jun-02Mar-02Dec-01Sep-01Jun-01Mar-01Dec-00Sep-00Jun-00Mar-00Dec-99Sep-99Jun-99Mar-99Dec-98Sep-98Jun-98Mar-98Dec-97Sep-97Jun-97Mar-97Dec-96Sep-96Jun-96Mar-96Dec-95Sep-95Jun-95Mar-95Dec-94Sep-94Jun-94Mar-94Dec-93Sep-93Jun-93Mar-93Dec-92Sep-92Jun-92Mar-92Dec-91Sep-91Jun-91Mar-91Dec-90Sep-90Jun-90Mar-90Dec-89Sep-89Jun-89Mar-89Dec-88Sep-88Jun-88Mar-88Dec-87Sep-87Jun-87Mar-87Dec-86Sep-86Jun-86Mar-86Dec-85Sep-85Jun-85Mar-85Dec-84Sep-84Jun-84Mar-84Dec-83Sep-83Jun-83Mar-83Dec-82Sep-82Jun-82Mar-82Dec-81Sep-81Jun-81
Wage Price IndexAverage Weekly Ordinary Time EarningsAverage Earnings in the National AccountsReal consumer wages
Jun-81 Sep-90 Dec-99 Mar-09 Jun-18
Note: AWOTE data are bi-annual.
WWW.WORKINGFORTHEFUTURE.COM.AU
2
AUSTRALIA’S FUTURE LABOUR MARKET MYTHS AND REALITIESWILL WEAK WAGES GROWTH CONTINUE?
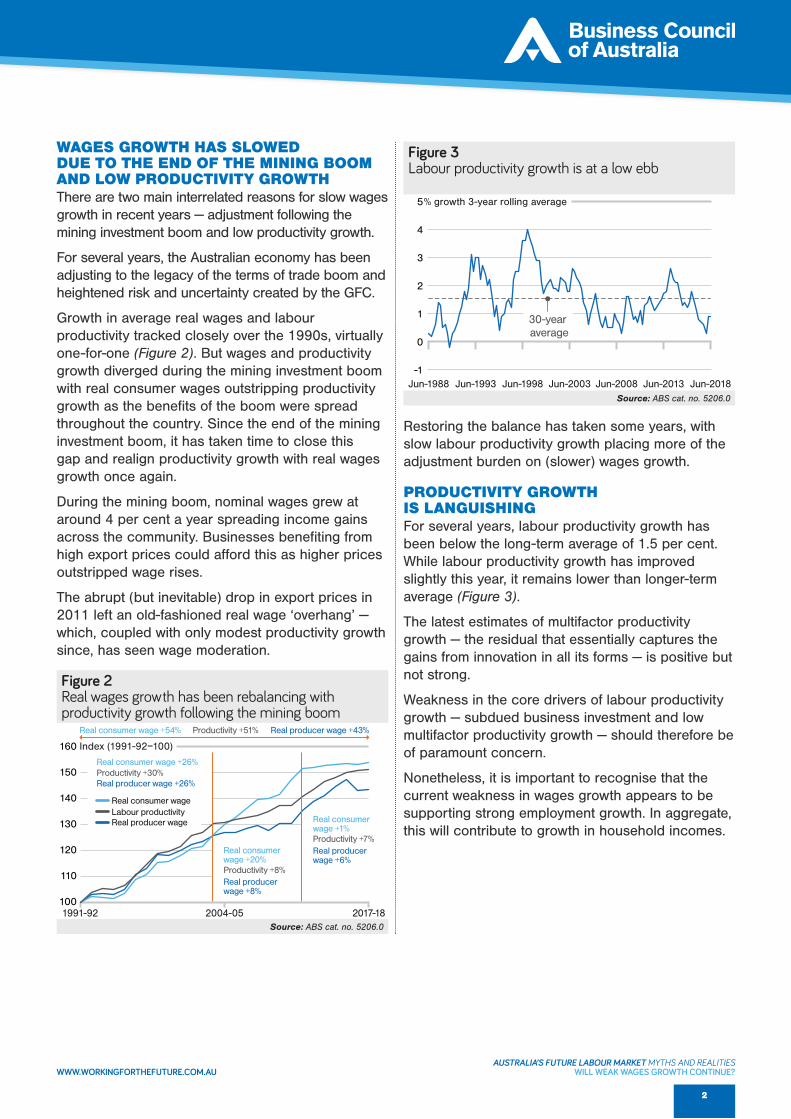
WAGES GROWTH HAS SLOWED DUE TO THE END OF THE MINING BOOM AND LOW PRODUCTIVITY GROWTHThere are two main interrelated reasons for slow wages growth in recent years — adjustment following the mining investment boom and low productivity growth.
For several years, the Australian economy has been adjusting to the legacy of the terms of trade boom and heightened risk and uncertainty created by the GFC.
Growth in average real wages and labour productivity tracked closely over the 1990s, virtually one-for-one (Figure 2). But wages and productivity growth diverged during the mining investment boom with real consumer wages outstripping productivity growth as the benefits of the boom were spread throughout the country. Since the end of the mining investment boom, it has taken time to close this gap and realign productivity growth with real wages growth once again.
During the mining boom, nominal wages grew at around 4 per cent a year spreading income gains across the community. Businesses benefiting from high export prices could afford this as higher prices outstripped wage rises.
The abrupt (but inevitable) drop in export prices in 2011 left an old-fashioned real wage ‘overhang’ — which, coupled with only modest productivity growth since, has seen wage moderation.
Restoring the balance has taken some years, with slow labour productivity growth placing more of the adjustment burden on (slower) wages growth.
PRODUCTIVITY GROWTH IS LANGUISHING For several years, labour productivity growth has been below the long-term average of 1.5 per cent. While labour productivity growth has improved slightly this year, it remains lower than longer-term average (Figure 3).
The latest estimates of multifactor productivity growth — the residual that essentially captures the gains from innovation in all its forms — is positive but not strong.
Weakness in the core drivers of labour productivity growth — subdued business investment and low multifactor productivity growth — should therefore be of paramount concern.
Nonetheless, it is important to recognise that the current weakness in wages growth appears to be supporting strong employment growth. In aggregate, this will contribute to growth in household incomes.
Figure 2Real wages growth has been rebalancing with productivity growth following the mining boom
Bariol 12/12pt -10Bariol 12/12pt -10Bariol 12/12pt -10
Nimbus Sans 9/11pt -20Nimbus Sans 9/11pt -20
Nimbus Sans 7/9pt -20Nimbus Sans 7/9pt -20
Source: ABS cat. no. 5206.0
Nimbus Sans 8/10pt -20Nimbus Sans 8/10pt -20
Xxxxxxx
Index (1991-92=100)
Xxxxxxxx
80%
75
70
65
60
Real consumer wage
Real consumer wage +20%
Real consumer wage +1%
100
110
120
130
140
150
160Real producer wage
Real consumer wage
Labour productivity
2017-182016-172015-162014-152013-142012-132011-122010-112009-102008-092007-082006-072005-062004-052003-042002-032001-022000-011999-001998-991997-981996-971995-961994-951993-941992-931991-921991-92
1991-92 2004-05 2017-18
Real consumer wage +54% Productivity +51% Real producer wage +43%
Real consumer wage +26%Productivity +30%Real producer wage +26%
Real consumer wage +20%Productivity +8%Real producer wage +8%
Real consumer wage +1%Productivity +7%Real producer wage +6%
Real producer wageLabour productivityReal consumer wage
Figure 3Labour productivity growth is at a low ebb
Bariol 12/12pt -10Bariol 12/12pt -10Bariol 12/12pt -10
Nimbus Sans 9/11pt -20Nimbus Sans 9/11pt -20
Nimbus Sans 7/9pt -20Nimbus Sans 7/9pt -20
Source: ABS cat. no. 5206.0
Nimbus Sans 8/10pt -20Nimbus Sans 8/10pt -20
Xxxxxxx
% growth 3-year rolling average
Xxxxxxxx
80%
75
70
65
60-1
0
1
2
3
4
5
Jun-2018Mar-2018Dec-2017Sep-2017Jun-2017Mar-2017Dec-2016Sep-2016Jun-2016Mar-2016Dec-2015Sep-2015Jun-2015Mar-2015Dec-2014Sep-2014Jun-2014Mar-2014Dec-2013Sep-2013Jun-2013Mar-2013Dec-2012Sep-2012Jun-2012Mar-2012Dec-2011Sep-2011Jun-2011Mar-2011Dec-2010Sep-2010Jun-2010Mar-2010Dec-2009Sep-2009Jun-2009Mar-2009Dec-2008Sep-2008Jun-2008Mar-2008Dec-2007Sep-2007Jun-2007Mar-2007Dec-2006Sep-2006Jun-2006Mar-2006Dec-2005Sep-2005Jun-2005Mar-2005Dec-2004Sep-2004Jun-2004Mar-2004Dec-2003Sep-2003Jun-2003Mar-2003Dec-2002Sep-2002Jun-2002Mar-2002Dec-2001Sep-2001Jun-2001Mar-2001Dec-2000Sep-2000Jun-2000Mar-2000Dec-1999Sep-1999Jun-1999Mar-1999Dec-1998Sep-1998Jun-1998Mar-1998Dec-1997Sep-1997Jun-1997Mar-1997Dec-1996Sep-1996Jun-1996Mar-1996Dec-1995Sep-1995Jun-1995Mar-1995Dec-1994Sep-1994Jun-1994Mar-1994Dec-1993Sep-1993Jun-1993Mar-1993Dec-1992Sep-1992Jun-1992Mar-1992Dec-1991Sep-1991Jun-1991Mar-1991Dec-1990Sep-1990Jun-1990Mar-1990Dec-1989Sep-1989Jun-1989Mar-1989Dec-1988Sep-1988Jun-1988
Jun-2018Jun-1998
30-year average
Jun-1988 Jun-1993 Jun-1998 Jun-2003 Jun-2008 Jun-2013 Jun-2018

WWW.WORKINGFORTHEFUTURE.COM.AU
3
AUSTRALIA’S FUTURE LABOUR MARKET MYTHS AND REALITIESWILL WEAK WAGES GROWTH CONTINUE?
THE LINK BETWEEN WAGES AND PRODUCTIVITY GROWTH REMAINS CLEARWhile there will be difference between sectors and some businesses will take different adjustment paths, the aggregate, economy-wide link between labour productivity and wages is clear. Since the last recession, real consumer wages have increased by 54 per cent while labour productivity rose by 51 per cent (Figure 2).
Economy-wide wages growth is likely to increase as spare capacity in the labour market continues to fall and (if) productivity growth strengthens.
Policies and interventions that undermine or ignore productivity growth, such as arbitrary wage increases or increased regulation, will only hamper future incomes growth.
Competitive tax and regulatory settings that encourage dynamic, competitive businesses and stronger investment and innovation, will be vital for strengthening productivity and wages growth across the board.
Figure 2Real wages growth has been rebalancing with productivity growth following the mining boom
Bariol 12/12pt -10Bariol 12/12pt -10Bariol 12/12pt -10
Nimbus Sans 9/11pt -20Nimbus Sans 9/11pt -20
Nimbus Sans 7/9pt -20Nimbus Sans 7/9pt -20
Source: ABS cat. no. 5206.0
Nimbus Sans 8/10pt -20Nimbus Sans 8/10pt -20
Xxxxxxx
Index (1991-92=100)
Xxxxxxxx
80%
75
70
65
60
Real consumer wage
Real consumer wage +20%
Real consumer wage +1%
100
110
120
130
140
150
160Real producer wage
Real consumer wage
Labour productivity
2017-182016-172015-162014-152013-142012-132011-122010-112009-102008-092007-082006-072005-062004-052003-042002-032001-022000-011999-001998-991997-981996-971995-961994-951993-941992-931991-921991-92
1991-92 2004-05 2017-18
Real consumer wage +54% Productivity +51% Real producer wage +43%
Real consumer wage +26%Productivity +30%Real producer wage +26%
Real consumer wage +20%Productivity +8%Real producer wage +8%
Real consumer wage +1%Productivity +7%Real producer wage +6%
Real producer wageLabour productivityReal consumer wage

WWW.WORKINGFORTHEFUTURE.COM.AU
AUSTRALIA’S FUTURE LABOUR MARKET MYTHS AND REALITIES
FACTSHEET WILL THERE BE A SURPLUS OF WORKERS IN THE FUTURE?
WWW.WORKINGFORTHEFUTURE.COM.AU

WWW.WORKINGFORTHEFUTURE.COM.AU
1
S ome commentators suggest that improvements in technology will mean swathes of work can be delegated entirely to
machines, leading to a massive surplus of labour and potential re-imagining of how people will allocate their time to work or leisure.1
Historical evidence suggests a surplus of workers is unlikely. The introduction of information and communication technologies has significantly changed labour markets, but the working week has not changed much:
» Since the 1960s, hours worked per capita in Australia has stayed fairly stable (outside of economic downturns).2
» Following the widespread adoption of information and communication technologies, there was no discernible negative impact on employment across G20 countries.3
» Treasury projects that hours worked per person will remain essentially stable over the coming decades.4
The historic evidence demonstrates that, when labour-saving technology is adopted, labour is re-directed to other areas of demand. Australia’s labour markets are reasonably effective at accommodating change. Throughout history, many technologies have taken over tasks that were previously done by people: from the loom and the harvester, to mass textile production and automatic teller machines.
While there will always be some friction in how work is allocated to labour, concerns about large-scale labour surpluses appear unfounded.
Indeed, as the former Reserve Bank Governor, Glenn Stevens noted in 2015:
“It may be that jobs will be ‘robotised’. But on the other hand, in the long run, we may need that to some extent. Demographic factors suggest strongly that, all other things equal, the problem isn’t going to be a shortage of jobs, but instead a shortage of workers.”4
A SHORTAGE OF WORKERS IS MORE LIKELYWhile no one can predict the future, well-respected economic agencies like the Treasury or Reserve Bank of Australia suggest a shortage of workers is more likely.
Along with other developed economies, Australia’s population is becoming older, and our working age population will become smaller relative to the overall population.
Potential shortages of workers would be exacerbated without a well-managed skilled migration program.
According to the Australian Government’s intergenerational report, in 2014-15, around 15 per cent of the Australian population was 65 or older. By 2054-55, this is projected to increase to almost 25 per cent of the population, as a large portion of Australians reach retirement age and as the life expectancies of older Australians increase.
The ratio of working age Australians to Australians over 65 is projected to decrease from 4.5 in 2014-15 to 2.7 in 2054-55.
WILL THERE BE A SURPLUS OF WORKERS IN THE FUTURE OF WORK?
AUSTRALIA’S FUTURE LABOUR MARKET MYTHS AND REALITIESWILL THERE BE A SURPLUS OF WORKERS IN THE FUTURE?
KEY POINT Despite some of the alarmist predictions that there will be a surplus of workers in the future, a shortage of workers may be more likely.
1 See, for example, R Avent, The Wealth of Humans: Work and its Absence in the Twenty-first Century, 2016, Penguin Books, Great Britain, or M Ford, The Rise of the Robots, 2015, Oneworld Publications, Great Britain.
2 J Borland and M Coelli, ‘Are robots taking our jobs?’ Australian Economic Review, vol 50, issue 4, pp 377 – 397, 2017.3 Organisation for Economic Cooperation and Development, Future of work and skills, February 2017,
https://www.oecd.org/els/emp/wcms_556984.pdf4 The Treasury, 2015 Intergenerational Report, March 2015, https://treasury.gov.au/publication/2015-intergenerational-report/5 G Stevens, The Long Run, speech delivered 24 November 2015.
WWW.WORKINGFORTHEFUTURE.COM.AU
2
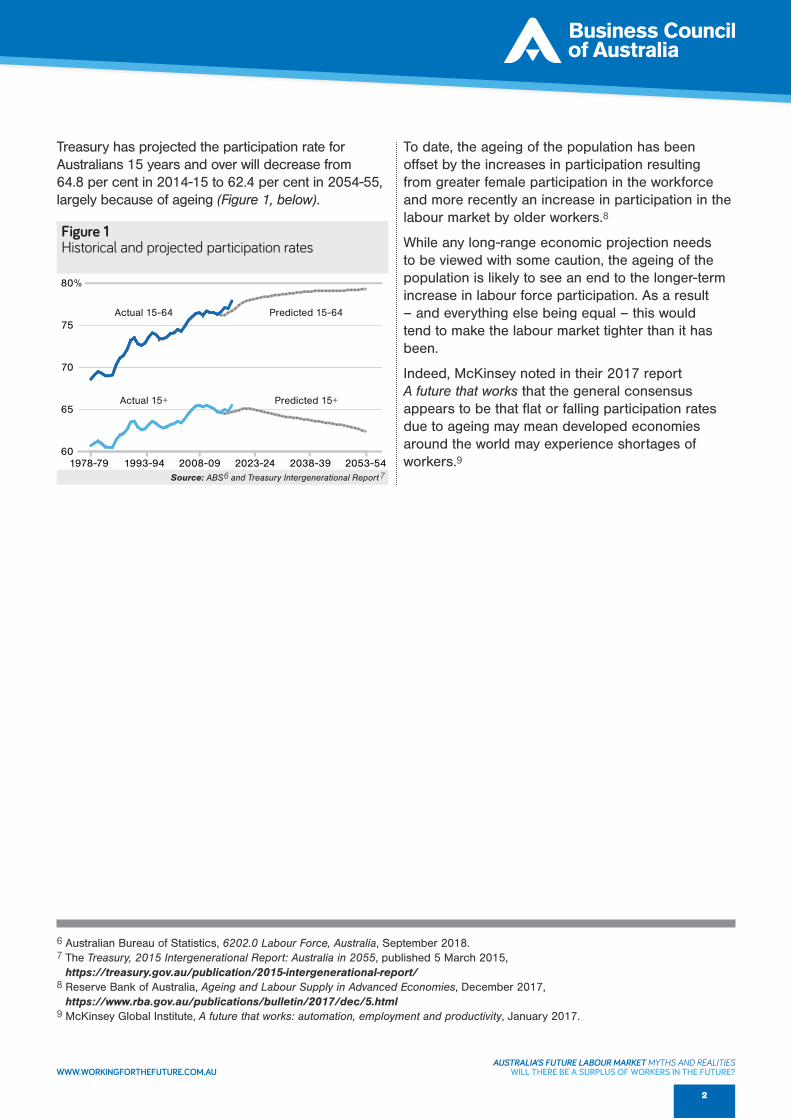
To date, the ageing of the population has been offset by the increases in participation resulting from greater female participation in the workforce and more recently an increase in participation in the labour market by older workers.8
While any long-range economic projection needs to be viewed with some caution, the ageing of the population is likely to see an end to the longer-term increase in labour force participation. As a result – and everything else being equal – this would tend to make the labour market tighter than it has been.
Indeed, McKinsey noted in their 2017 report A future that works that the general consensus appears to be that flat or falling participation rates due to ageing may mean developed economies around the world may experience shortages of workers.9
Figure 1Historical and projected participation rates
Bariol 12/12pt -10Bariol 12/12pt -10Bariol 12/12pt -10
Nimbus Sans 9/11pt -20Nimbus Sans 9/11pt -20
Nimbus Sans 7/9pt -20Nimbus Sans 7/9pt -20
Source: ABS and Treasury Intergenerational Report
Nimbus Sans 8/10pt -20Nimbus Sans 8/10pt -20
Nimbus Sans 7/9pt -20Nimbus Sans 7/9pt -20
Nimbus Sans 8/10pt -20Nimbus Sans 8/10pt -20
15 and over (actual)
15-64 (actual)
15 and over (IGR)
15-64 (IGR)
60
65
70
75
80
Actual 15+ Predicted 15+
Actual 15-64 Predicted 15-64
1978-79 1993-94 2008-09 2023-24 2038-39 2053-54
%
6 7
6 Australian Bureau of Statistics, 6202.0 Labour Force, Australia, September 2018.7 The Treasury, 2015 Intergenerational Report: Australia in 2055, published 5 March 2015,
https://treasury.gov.au/publication/2015-intergenerational-report/8 Reserve Bank of Australia, Ageing and Labour Supply in Advanced Economies, December 2017,
https://www.rba.gov.au/publications/bulletin/2017/dec/5.html 9 McKinsey Global Institute, A future that works: automation, employment and productivity, January 2017.
Treasury has projected the participation rate for Australians 15 years and over will decrease from 64.8 per cent in 2014-15 to 62.4 per cent in 2054-55, largely because of ageing (Figure 1, below).
AUSTRALIA’S FUTURE LABOUR MARKET MYTHS AND REALITIESWILL THERE BE A SURPLUS OF WORKERS IN THE FUTURE?

WWW.WORKINGFORTHEFUTURE.COM.AU
AUSTRALIA’S FUTURE LABOUR MARKET MYTHS AND REALITIES
FACTSHEET WHICH GROUPS COULD BE LEFT BEHIND BY FUTURE CHANGES IN THE LABOUR FORCE?
WWW.WORKINGFORTHEFUTURE.COM.AU

WWW.WORKINGFORTHEFUTURE.COM.AU
1
A n accompanying document discusses the impact of technology on the labour market, and possible jobs that could be displaced
(Fact-sheet: Will technology destroy jobs?).
The most important impact of technology is the tasks within existing jobs, which will require every Australian worker to adapt. Technology will also directly and indirectly create jobs.
However, it’s important to recognise that a small number of jobs will certainly be substituted by technology. Although no one can predict the future, estimates of large-scale job losses are probably unfounded. The most credible estimates suggest 5 to 10 per cent of jobs could be entirely substituted by technology over the next decade.
The loss of any job has a personal, emotional and financial cost for the individual involved. It is critical to examine the groups of people who may be at most risk of job losses, to ensure that government support is available for them.
SOME GROUPS HAVE A HIGHER RISK OF JOB LOSSES THAN OTHERSThe number of voluntary job changes in the labour force is much higher than the number of involuntary transitions. In 2017, 2.6 per cent of the Australian labour force experienced a job loss, compared to 10.7 per cent who experienced a voluntary job change.
The number of job losses is also smaller, as a proportion of the Australian labour force, compared to 20 years ago: currently 2.6 per cent, down from 4.2 per cent 20 years ago.1
Involuntary job losses can arise from a number of circumstances where a worker may be:
» laid off or retrenched» made redundant» dismissed (for reasons of
performance or conduct), or» out of work because their employer
had to close for economic reasons.
WHICH GROUPS COULD BE LEFT BEHIND BY FUTURE CHANGES IN THE LABOUR FORCE?
AUSTRALIA’S FUTURE LABOUR MARKET MYTHS AND REALITIESWHICH GROUPS COULD BE LEFT BEHIND BY FUTURE CHANGES IN THE LABOUR FORCE?
1 AlphaBeta, Mapping Australian workforce change, October 2018.
KEY POINTS The most credible estimates suggest 5 to 10 per cent of jobs could be displaced by technology over the next 10 years.
Many of the people in these jobs will be able to successfully adapt (in some cases, after re skilling) and will return to the workforce. However, some groups are at a higher risk than others of job losses. Research undertaken by AlphaBeta shows that men are at more risk than women; low-skilled workers are at more risk than high-skilled workers; and workers in regional areas are at more risk than those in urban areas.
It is also possible that the forces of change in the future of work may exacerbate disadvantage already faced by some groups of Australians, such as those people in long-term joblessness, many of who receive Newstart Allowance.
Government efforts to prepare for the future of work should be calibrated to ensure that support is available for groups who are most at risk of being left behind.
WWW.WORKINGFORTHEFUTURE.COM.AU
2
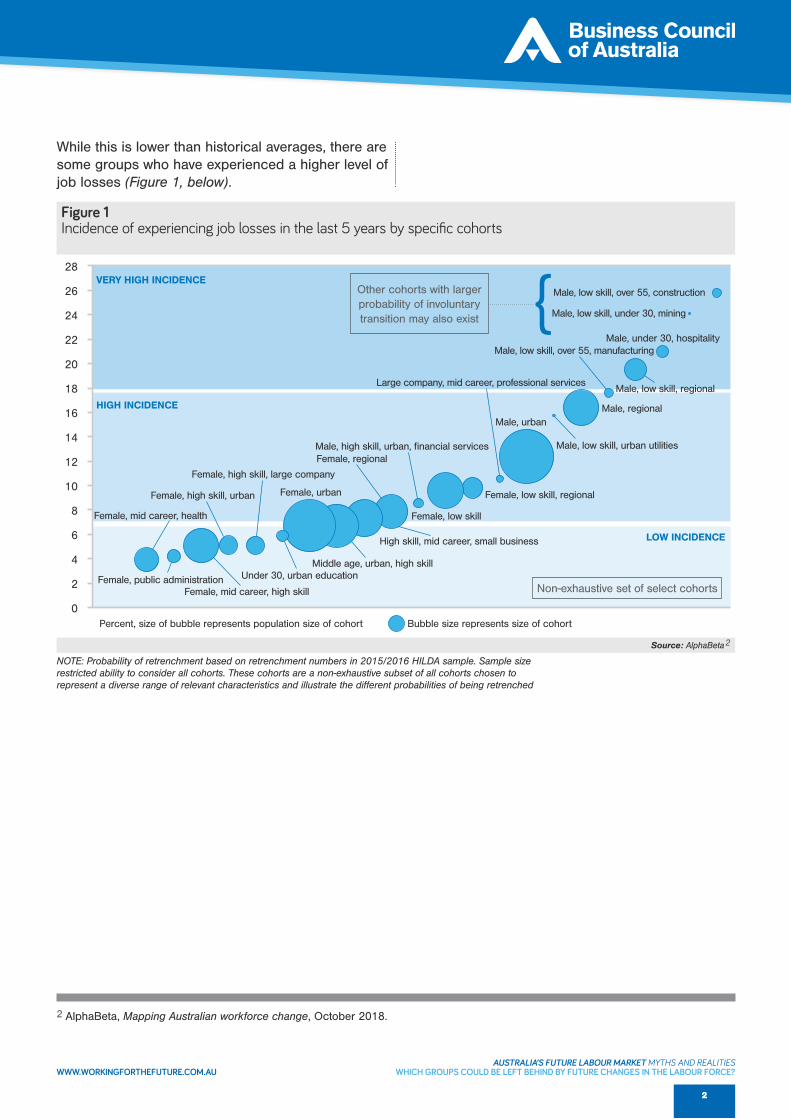
While this is lower than historical averages, there are some groups who have experienced a higher level of job losses (Figure 1, below).
AUSTRALIA’S FUTURE LABOUR MARKET MYTHS AND REALITIESWHICH GROUPS COULD BE LEFT BEHIND BY FUTURE CHANGES IN THE LABOUR FORCE?
NOTE: Probability of retrenchment based on retrenchment numbers in 2015/2016 HILDA sample. Sample size restricted ability to consider all cohorts. These cohorts are a non-exhaustive subset of all cohorts chosen to represent a diverse range of relevant characteristics and illustrate the different probabilities of being retrenched
Figure 1Incidence of experiencing job losses in the last 5 years by specific cohorts
HIGH INCIDENCE
Other cohorts with larger probability of involuntary transition may also exist
Non-exhaustive set of select cohorts
VERY HIGH INCIDENCE
Bubble size represents size of cohort
Female, low skill, regional
Female, regional
Male, regional
Male, low skill, urban utilitiesMale, high skill, urban, financial services
Male, low skill, regional
Male, under 30, hospitality
Male, low skill, under 30, mining
Male, low skill, over 55, construction
Male, low skill, over 55, manufacturing
Large company, mid career, professional services
Male, urban
Female, low skill
Percent, size of bubble represents population size of cohort
Source: AlphaBeta2
28
26
24
22
20
18
16
14
12
10
8
6
4
2
0
Female, urbanFemale, high skill, urban
Female, mid career, health
Female, public administrationFemale, mid career, high skill
Under 30, urban educationMiddle age, urban, high skill
High skill, mid career, small business
Female, high skill, large company
LOW INCIDENCE
2 AlphaBeta, Mapping Australian workforce change, October 2018.
WWW.WORKINGFORTHEFUTURE.COM.AU
3
AUSTRALIA’S FUTURE LABOUR MARKET MYTHS AND REALITIESWHICH GROUPS COULD BE LEFT BEHIND BY FUTURE CHANGES IN THE LABOUR FORCE?
Average
12%
Male
Female
<30 yo
30-55
>55 yo
High
Medium
Low
Regional
Urban
Large
Medium
Small
7%
7%
9%
8%
8%
14%
11%
Figure 2Incidence of job losses by personal characteristicsAverage incidence of experiencing job losses in a five year period
Source: AlphaBeta
Gender
Location
Age
Skill
Company size
9%
12%
13%
11%
13%
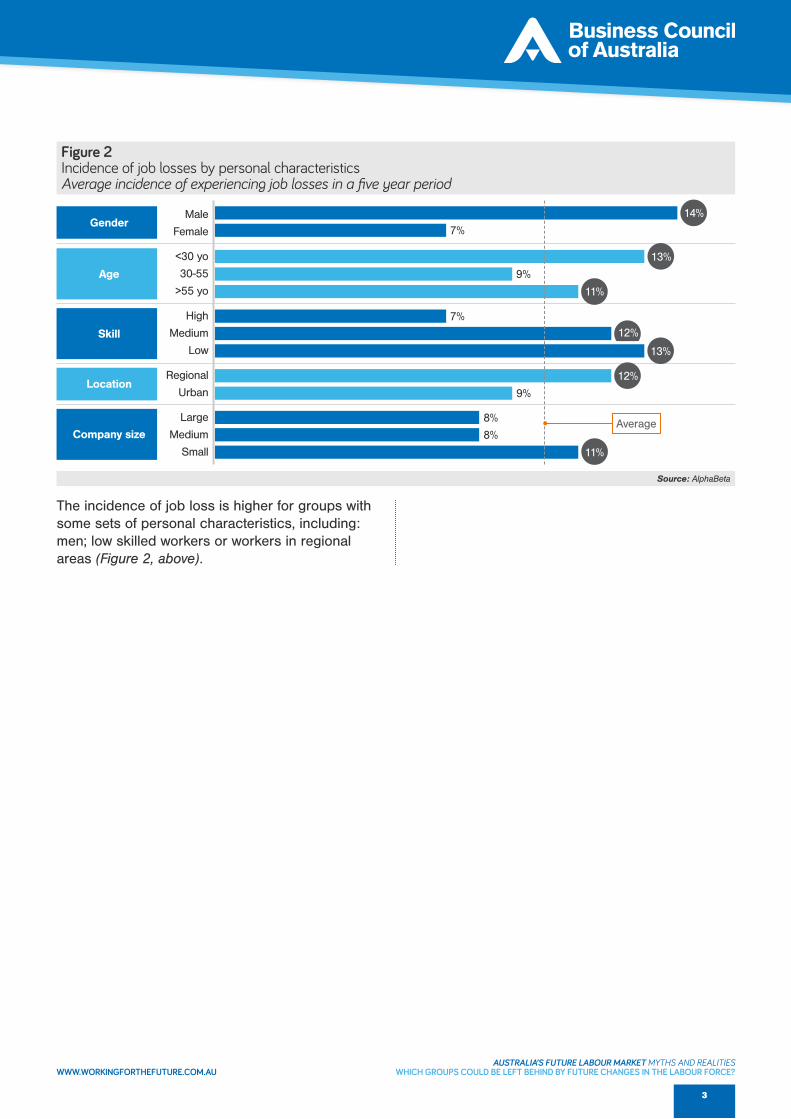
The incidence of job loss is higher for groups with some sets of personal characteristics, including: men; low skilled workers or workers in regional areas (Figure 2, above).

WWW.WORKINGFORTHEFUTURE.COM.AU
4
AUSTRALIA’S FUTURE LABOUR MARKET MYTHS AND REALITIESWHICH GROUPS COULD BE LEFT BEHIND BY FUTURE CHANGES IN THE LABOUR FORCE?
Figure 3Incidence of job losses by industry% incidence of job losses in the last five years
Bariol 12/12pt -10Bariol 12/12pt -10Bariol 12/12pt -10
Nimbus Sans 9/11pt -20Nimbus Sans 9/11pt -20
Nimbus Sans 7/9pt -20Nimbus Sans 7/9pt -20
Source: HILDA 2015/2016 wave (n=10,000, AlphaBeta analysis
Nimbus Sans 8/10pt -20Nimbus Sans 8/10pt -20
Xxxxxxx
Xxxxxxxx
80%
75
70
65
60
0 5 10 15 20 25
Public Administration and Safety
Health Care and Social Assistance
Education and Training
Financial Services
Arts and Recreation Services
Media and Telecommunications
Administrative Services
Other Services
Transport, Postal and Warehousing
Retail Trade
Professional Services
Real Estate / Rentals
Wholesale Trade
Agriculture
Manufacturing
Hospitality
Utilities
Mining
Construction 23.9%
19.7%
18.7%
18.6%
17.2%
16.8%
16.8%
16.5%
12.9%
13.2%
13.4%
12.8%
12.4%
12.3%
12.0%
8.9%
6.3%
6.9%
6.0%
However, AlphaBeta find that the factor with the biggest impact on job losses is the industry that a worker belongs to (Figure 3, above).
As Figure 3 represents the incidence of job losses by industry over the last five years, it will reflect the economic and business cycles in those industries at that time. Different industries will experience different business conditions at different times.
In some cases, the rate of job losses is determined by the dynamics within an industry. Some industries have more job change than others, due to the nature of the work.
It is critically important to understand the areas where people regularly go through transitions – even if they often secure employment shortly thereafter. Government needs to provide a different set of support services for people who regularly go through change.
The analysis undertaken by AlphaBeta is only an initial piece of work; it is not an exhaustive analysis of every possible cohort. But we believe government should undertake a comprehensive cohort analysis to make sure that employment and welfare services are tailored for the particular circumstances of high-risk cohorts.

WWW.WORKINGFORTHEFUTURE.COM.AU
5
AUSTRALIA’S FUTURE LABOUR MARKET MYTHS AND REALITIESWHICH GROUPS COULD BE LEFT BEHIND BY FUTURE CHANGES IN THE LABOUR FORCE?
THE FORCES OF CHANGE CAN EXACERBATE EXISTING DISADVANTAGE AND BARRIERS TO WORKWhile these cohorts may be most likely to experience retrenchment in coming decades, other cohorts will continue to face complex barriers to work (such as people with disability).
One critical cohort that could be further disadvantaged in the future of work are those Australians in entrenched joblessness. Of those people who receive the Australian Government’s Newstart Allowance (the primary unemployment
payment), over 45% (340,000 people) have been on the payment between one to five years. Around 20% (over 145,000 people) have been on the payment for five years or more and this includes almost 25,000 people who have been on Newstart for 10 years or more.3 The circumstances of Newstart recipients are discussed further in Box 1 (below).
The future of work will sharpen the need to assist disadvantaged people to enter or remain in the workforce, and make support available for those who may lose their jobs over the short to medium term.
PEOPLE WHO ARE ON NEWSTART FOR MANY YEARS ARE AMONG THE MORE VULNERABLE MEMBERS OF OUR COMMUNITYLong periods of unemployment can make it difficult for people to move back into steady work and may put people at risk of relying on income support for much of their lives. Such entrenched disadvantage can and, too often, does reach across generations.
We are particularly concerned for the wellbeing of people who are already at risk of being left behind and who may face further challenges in a changing labour market.
The adequacy of income support payments should be reviewed as part of a broader package to improve the ability of long-term employed Australians to return to work.
We believe that income support for those out of work should not be punitive. Income support should not act as a disincentive to working, but nor should it diminish the capacity of people to get a job. Job seeking is not costless and should be accessible. If a bus fare or a collared shirt become unaffordable, then getting to job interviews and presenting as a credible employee may move out of reach.
Steady work is the best way out of hardship and disadvantage. Changes to the welfare system alone – be they small or wholesale – will not be enough. Improving the welfare system must be
combined with policies that reduce disincentives to work, improve employment services and lift the competitiveness of business taxes and regulation to create jobs and stronger wages growth.
The welfare system also needs to be fiscally sustainable over the long term to prevent the need for sudden and blunt cuts in spending. This challenge will increase, not lessen, over the coming decades as the population ages. Getting people into jobs thus delivers a double dividend.
DESPITE RECENT IMPROVEMENTS, A LARGE AND GROWING PROPORTION OF PEOPLE STAY ON NEWSTART LONG-TERM Almost 730,000 people were receiving Newstart at the end of June 2018.4 Over time the number of people on Newstart has closely followed the number of people who are unemployed.
There is a substantial group of people who are new to the welfare system and only need Newstart for a reasonably short time. Over 60 per cent of people who begin Newstart payments (who haven’t been on another form of income support before starting Newstart) leave the payment within a year – or roughly 255,000 people.5
While there is no publicly available data on the proportions of people who stop receiving Newstart because they have found a job compared to people moving to another payment, it is likely that this group of people is largely accessing Newstart
3 Department of Social Services, DSS Payment Demographic Data, June 2018.4 Department of Social Services, DSS Payment Demographic Data, June 2018.5 Department of Social Services, DSS Payment Demographic Data, June 2018.

WWW.WORKINGFORTHEFUTURE.COM.AU
6
AUSTRALIA’S FUTURE LABOUR MARKET MYTHS AND REALITIESWHICH GROUPS COULD BE LEFT BEHIND BY FUTURE CHANGES IN THE LABOUR FORCE?
as it is primarily intended – as a short-term stop-gap while they search for a new job.
But despite recent improvements, there is a large and growing proportion of people who have been on Newstart for years (Figure 4). Around 52 per cent of Newstart recipients, or almost 380,000 people, have been on the payment for less than two years. But a growing number of people are receiving Newstart for two years or more. In 2014, only a third of people on Newstart had been receiving the payment for two years or more (or about 230,000 people). That figure is now 48 per cent or about 350,000 people.
The average amount of time a person on Newstart has spent in the welfare system has almost doubled over the past 16 years. In June 2002, people who were receiving Newstart had been
on some form of income support for an average of 141 weeks (more than two and a half years), by June 2010 this average had risen to 165 weeks (more than three years). By June 2018, the average duration had doubled to 285 weeks (five and a half years).6
Further work should be done to understand the skill level of people who have been on Newstart for years and the barriers they face to gaining and maintaining employment. It is likely that a larger investment in building skills and work readiness, as well as more intensive support to seek and maintain employment, will be needed for this group of people to move into sustained employment and less reliance on welfare.
Figure 4A large and growing number of people have been on Newstart for years
Bariol 12/12pt -10Bariol 12/12pt -10Bariol 12/12pt -10
Nimbus Sans 9/11pt -20Nimbus Sans 9/11pt -20
Nimbus Sans 7/9pt -20Nimbus Sans 7/9pt -20
Source: Department of Social Services, DSS Payment Demographic Data, June 2014 through to June 2018
Nimbus Sans 8/10pt -20Nimbus Sans 8/10pt -20
Xxxxxxx
Number of people (000’s)
DURATION ON NEWSTART
Xxxxxxxx
80%
75
70
65
60
0
50
100
150
200
250
300
Jun-18
Mar-18
Dec-17
Sep-17
Jun-17
Mar-17
Dec-16
Sep-16
Jun-16
Mar-16
Dec-15
Sep-15
Jun-15
Mar-15
Dec-14
Sep-14
Jun-14
10 years+5-<10 years2-<5 years1-<2 yearsUnder 1 year
2014 (Q2-Q4)
2015 (Q1-Q4)
2016 (Q1-Q4)
2017 (Q1-Q4)
2018 (Q1-Q2)
6 Department of Social Services, Income support customers: statistical overviews, various papers published from 2002 to 2013; Department of Social Services, DSS Payment Demographic Data, June 2014 through to June 2018.

WWW.WORKINGFORTHEFUTURE.COM.AU
AUSTRALIA’S FUTURE LABOUR MARKET MYTHS AND REALITIES
FACTSHEET WILL PEOPLE HAVE LESS SECURITY IN THEIR JOBS IN FUTURE?
WWW.WORKINGFORTHEFUTURE.COM.AU

WWW.WORKINGFORTHEFUTURE.COM.AU
1
S ome suggest the nature of workplaces and employment relationships is currently undergoing change. There is anxiety within
some parts of the community that jobs will be increasingly volatile, insecure or precarious.
Some level of mobility and re-allocation is essential for a dynamic labour market, however, we are conscious that each instance of unemployment – especially involuntary retrenchment – can be financially and emotionally difficult for each individual and their family. For that reason, change will often involve some cost.
We have approached the question by examining:» the emergence of the “gig economy”,
as a form of work» whether the prevalent forms of work have
moved away from permanent employment, and» whether people are changing jobs
(whether by choice or not) more often.
THE GIG ECONOMY IS A SMALL, BUT LEGITIMATE, FORM OF WORKThe gig economy involves an independent contractor receiving an on-demand stream of work from a digital platform. The gig economy provides participation opportunities for people on a short-term basis that gives them some autonomy around scheduling work. Examples of gig work include driving, household tasks or one-off professional services like graphic design.
It appears that most people who engage in gig work do so to supplement their primary income.1
Although the gig economy is certainly a new phenomenon, it appears to be relatively small in Australia. Estimating the size of the gig economy is challenging. Gig economy workers are not explicitly measured by official statistics, but would be categorised as independent workers or contractors.
WILL PEOPLE HAVE LESS SECURITY IN THEIR JOBS IN FUTURE?
AUSTRALIA’S FUTURE LABOUR MARKET MYTHS AND REALITIESWILL PEOPLE HAVE LESS SECURITY IN THEIR JOBS IN FUTURE?
1 McKinsey Global Institute, Independent work: choice, necessity and the gig economy, October 2016, https://www.mckinsey.com/featured-insights/employment-and-growth/independent-work-choice-necessity-and-the-gig-economy
KEY POINTS Some claim the Australian labour market is increasingly volatile, insecure and precarious. Some reports on the future of work claim that permanent employment will decrease, that changing jobs regularly will become essential to advancement, or that individuals will need to be part of the “gig economy”.
There is no evidence to suggest the current labour market is less secure than in the past.
Technology is enabling new ways of working, such as gig economy work, but these represent a small portion of the workforce.
Forms of work have not significantly changed: casual employment and independent contractors remain at much the same level as in the past. The most significant change is the rise of permanent part-time employment, which reflects a cultural
change in allowing people greater choice and control over how they structure their work.
Finally, it does not appear that people are changing employers more frequently. The number of job losses (involuntary transitions) is over a third lower now than 20 years ago If anything, data suggest that people are moving slightly less, and staying with their employers slightly longer.
Although the data indicates the labour market is no less secure than in the recent past, many Australians genuinely feel anxious and under pressure. We understand that many working Australians are concerned about coping with the cost of living and their capacity to provide a good life for themselves and their families – and, even in good economic times, some Australians will struggle to find and maintain a job.

WWW.WORKINGFORTHEFUTURE.COM.AU
2
AUSTRALIA’S FUTURE LABOUR MARKET MYTHS AND REALITIESWILL PEOPLE HAVE LESS SECURITY IN THEIR JOBS IN FUTURE?
The Household, Income and Labour Dynamics in Australia survey data suggest that there is no evidence of any rise over time in independent work (as a primary source of income) and, if it is increasing as a source of secondary income, it is being offset by declines in other forms of secondary work.2
The best estimates suggest the gig economy comprises as low as one to four per cent of the current workforce (although these estimates are not without their own imperfections).3
Some predict substantial future growth in the gig economy.4 Estimates are made on the basis that many workers prefer the choice and autonomy of gig economy work over permanent employment.
There could be limits to growth in the gig economy, including that:
» it is not necessarily in an employer’s interest to parcel work into ‘gigs’ and maintain a vast network of possible workers.5 Permanent employment contains many advantages for some employers, including the reduction of transaction costs associated with recruiting staff, ease of instructing staff, and the ability to train or deepen the knowledge of a workforce, and
» some individuals may value the permanency of employment (and other benefits of employment) over the benefits of gig work.
For these reasons, we expect the gig economy may continue to grow in specific areas that are suitable for gig work, but is unlikely to be the dominant form of work in most parts of the labour market.
A MAJORITY OF AUSTRALIANS WILL STILL BE IN FULL- OR PERMANENT PART-TIME EMPLOYMENTMuch commentary on the future suggests that the nature of an individual’s form of work is undergoing significant change. Change often appears to be overstated.
The most dominant form of work in the labour force is full-time permanent employment (Figure 1).
The primary change has been a slight increase in the proportion of the workforce who are employed on a permanent part-time basis and a slight decrease in the proportion of those who are permanent full-time (Figure 2).
2 M Cowling and M Wooden, ‘Self-employment and independent workers’, The Household, Income and Labour Dynamics in Australia Survey: Selected Findings from Waves 1 to 16, released August 2018, University of Melbourne.
3 Grattan Institute, Peer-to-peer pressure: policy for the sharing economy, April 2016, https://grattan.edu.au/report/peer-to-peer/ ; McKinsey Global Institute, Independent work: choice, necessity and the gig economy, October 2016, https://www.mckinsey.com/featured-insights/employment-and-growth/independent-work-choice-necessity-and-the-gig-economy
4 See, for example, Deloitte Human Capital trends 2018; https://www2.deloitte.com/au/en/pages/human-capital/articles/human-capital-trends.html; Intuit, Intuit 2020 report, https://http-download.intuit.com/http.intuit/CMO/intuit/futureofsmallbusiness/intuit_2020_report.pdf
5 Refer to, for example, Coase’s theory of the firm in explaining how organisations structure themselves and their work.6 Business Council calculation drawn from Australian Bureau of Statistics, 6333.0 Characteristics of Employment, August 2017.
Figure 1Number of people in forms of work in the Australian labour force in 2017
Bariol 12/12pt -10Bariol 12/12pt -10Bariol 12/12pt -10
Nimbus Sans 9/11pt -20Nimbus Sans 9/11pt -20
Nimbus Sans 7/9pt -20Nimbus Sans 7/9pt -20
Source: ABS determined by using receipt of paid leave entitlements as a proxy
Nimbus Sans 8/10pt -20Nimbus Sans 8/10pt -20
Xxxxxxx
(People (000’s)
Other business operatorsCasual employeesIndependent contractorsPermanent employees
Xxxxxxxx
80%
75
70
65
60 0
1000
2000
3000
4000
5000
6000
7000
8000
9000Other business operators
Casual employees
Casual employees
Permanent employees
Part-timeFull-time
6,020
1,520
1,725
380 395
790630810
6
Figure 2Number of Australians in full-time or part-time forms of work
Bariol 12/12pt -10Bariol 12/12pt -10Bariol 12/12pt -10
Nimbus Sans 9/11pt -20Nimbus Sans 9/11pt -20
Nimbus Sans 7/9pt -20Nimbus Sans 7/9pt -20
Source: ABS, determined by using receipt of paid leave entitlements as a proxy
Nimbus Sans 8/10pt -20Nimbus Sans 8/10pt -20
Xxxxxxx
Xxxxxxxx
80%
75
70
65
600
1000
2000
3000
4000
5000
6000
7000Part-time casual or contract workers
Part-time permanent employees
Full-time casual or contract workers
Full-time permanent employees
2016201420122010200820062004
Other business operatorsCasual employeesIndependent contractorsPermanent employees
Full-time casual employeesPart-time permanent employeesPart-time casual employeesFull-time permanent employees
(People (000’s)
Note: this chart is limited to employees and does not include members of the workforce who are contractors or small business owners.
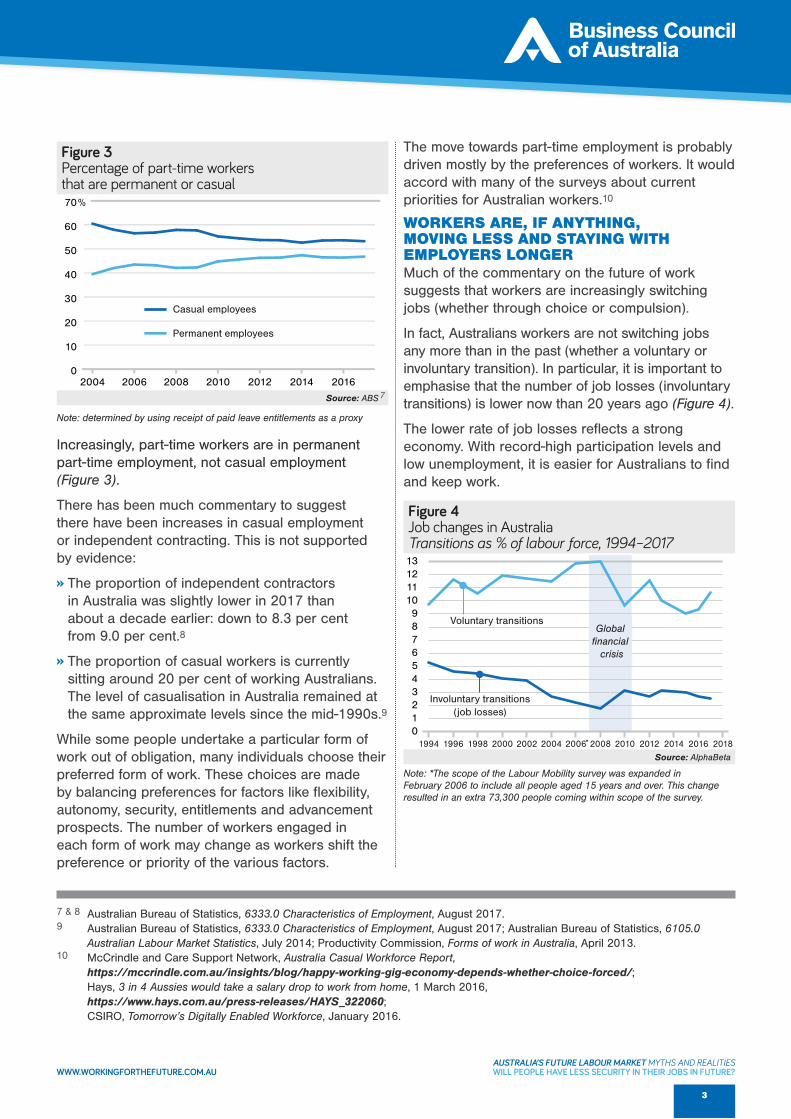
WWW.WORKINGFORTHEFUTURE.COM.AU
3
AUSTRALIA’S FUTURE LABOUR MARKET MYTHS AND REALITIESWILL PEOPLE HAVE LESS SECURITY IN THEIR JOBS IN FUTURE?
The move towards part-time employment is probably driven mostly by the preferences of workers. It would accord with many of the surveys about current priorities for Australian workers.10
WORKERS ARE, IF ANYTHING, MOVING LESS AND STAYING WITH EMPLOYERS LONGERMuch of the commentary on the future of work suggests that workers are increasingly switching jobs (whether through choice or compulsion).
In fact, Australians workers are not switching jobs any more than in the past (whether a voluntary or involuntary transition). In particular, it is important to emphasise that the number of job losses (involuntary transitions) is lower now than 20 years ago (Figure 4).
The lower rate of job losses reflects a strong economy. With record-high participation levels and low unemployment, it is easier for Australians to find and keep work.
Figure 3Percentage of part-time workers that are permanent or casual
Bariol 12/12pt -10Bariol 12/12pt -10Bariol 12/12pt -10
Nimbus Sans 9/11pt -20Nimbus Sans 9/11pt -20
Nimbus Sans 7/9pt -20Nimbus Sans 7/9pt -20
Source: ABS
Nimbus Sans 8/10pt -20Nimbus Sans 8/10pt -20
Nimbus Sans 7/9pt -20Nimbus Sans 7/9pt -20
Nimbus Sans 8/10pt -20Nimbus Sans 8/10pt -20
15 and over (actual)
15-64 (actual)
15 and over (IGR)
15-64 (IGR)
%
80%
75
70
65
60
Actual 15+ Predicted 15+
Actual 15-64 Predicted 15-64
1978-79 1993-94 2008-09 2023-24 2038-39 2053-54
0
10
20
30
40
50
60
70Casuals and contractors
Permanent employees
2016201420122010200820062004
80%
Casual employees
Permanent employees
%
7
Figure 4Job changes in AustraliaTransitions as % of labour force, 1994–2017
Bariol 12/12pt -10Bariol 12/12pt -10Bariol 12/12pt -10
Nimbus Sans 9/11pt -20Nimbus Sans 9/11pt -20
Nimbus Sans 7/9pt -20Nimbus Sans 7/9pt -20
Source: AlphaBeta
Nimbus Sans 8/10pt -20Nimbus Sans 8/10pt -20
Xxxxxxx
Voluntary transitions
Involuntary transitions(job losses)
Voluntary transitions
Xxxxxxxx
80%
75
70
65
60 0123456789
10111213
Voluntary transitions
Involuntary transitions
2018201620142012201020082006200420022000199819961994
Global financial
crisis
*
Note: *The scope of the Labour Mobility survey was expanded in February 2006 to include all people aged 15 years and over. This change resulted in an extra 73,300 people coming within scope of the survey.
Note: determined by using receipt of paid leave entitlements as a proxy
Increasingly, part-time workers are in permanent part-time employment, not casual employment (Figure 3).
There has been much commentary to suggest there have been increases in casual employment or independent contracting. This is not supported by evidence:
» The proportion of independent contractors in Australia was slightly lower in 2017 than about a decade earlier: down to 8.3 per cent from 9.0 per cent.8
» The proportion of casual workers is currently sitting around 20 per cent of working Australians. The level of casualisation in Australia remained at the same approximate levels since the mid-1990s.9
While some people undertake a particular form of work out of obligation, many individuals choose their preferred form of work. These choices are made by balancing preferences for factors like flexibility, autonomy, security, entitlements and advancement prospects. The number of workers engaged in each form of work may change as workers shift the preference or priority of the various factors.
7 & 8 Australian Bureau of Statistics, 6333.0 Characteristics of Employment, August 2017.9 Australian Bureau of Statistics, 6333.0 Characteristics of Employment, August 2017; Australian Bureau of Statistics, 6105.0
Australian Labour Market Statistics, July 2014; Productivity Commission, Forms of work in Australia, April 2013.10 McCrindle and Care Support Network, Australia Casual Workforce Report,
https://mccrindle.com.au/insights/blog/happy-working-gig-economy-depends-whether-choice-forced/; Hays, 3 in 4 Aussies would take a salary drop to work from home, 1 March 2016, https://www.hays.com.au/press-releases/HAYS_322060; CSIRO, Tomorrow’s Digitally Enabled Workforce, January 2016.

WWW.WORKINGFORTHEFUTURE.COM.AU
4
AUSTRALIA’S FUTURE LABOUR MARKET MYTHS AND REALITIESWILL PEOPLE HAVE LESS SECURITY IN THEIR JOBS IN FUTURE?
Evidence does not support the idea that workers are switching employers more often. Although levels of staff turnover in the workforce can fluctuate year-to-year,11 the amount of time that Australians spend with one employer (their job tenure) has remained much the same since the mid-1990s (Figure 5). If anything, the average job tenure has risen a little.
Workers’ job tenure may remain relatively high for many reasons, including the costs of changing jobs, friction in the labour market, workers wanting the security that comes with continuity of employment, the higher average age of the workforce, companies taking greater efforts to retain their workers, or the potential increased prevalence of an individual regularly changing jobs within a single employer.
Different surveys reach different conclusions about whether younger workers (“millennials”) are currently preferring longer job tenure, or the flexibility and autonomy of gig economy work. While it seems
accepted wisdom that millennials prefer mobility and advancement, some surveys suggest that millennials express feelings of concern about competing in the job market and prefer to remain with a single employer. For example, the proportion of surveyed millennials who would like to stay with their employer for more than five years was 28 per cent in 2018.12
The level of future job turnover is difficult to predict. It is entirely possible an unexpected event may significantly increase job churn in the short-term. However, there is no evidence currently available to suggest job tenure will be any shorter or less certain – or that there are greater job losses in the labour market – than has occurred in the recent past.
11 Australian Human Resources Institute, AHRI Pulse Survey, 2015, https://www.ahri.com.au/__data/assets/pdf_file/0018/52344/PULSE_retention-and-turnover-2015.pdf
12 Deloitte, The 2017 Deloitte Millennial Survey, 2017; Deloitte, The 2018 Deloitte Millennial Survey, 2018.
Figure 5Proportion of the Australian workforce, by amount of time spent with current employer, five yearly average
Bariol 12/12pt -10Bariol 12/12pt -10Bariol 12/12pt -10
Nimbus Sans 9/11pt -20Nimbus Sans 9/11pt -20
Nimbus Sans 7/9pt -20Nimbus Sans 7/9pt -20
Source: ABS
Nimbus Sans 8/10pt -20Nimbus Sans 8/10pt -20
Xxxxxxx
%
Xxxxxxxx
80%
75
70
65
60
0
5
10
15
20
25
30
35
40
2013 - 2018
2008 - 2012
2003 - 2008
1998 - 2002
1994 - 1997
1988 - 1992
1988 - 1992
1972 - 198320 years +10 - 20 years5 - 10 years1 - 5 years<1 year
1972 – 1983
1983 – 1987
1988 – 1992
1994 – 1997
1998 – 2002
2003 – 2008
2008 – 2012
2013 – 2018
0
5
10
15
20
25
30
35
40
2013 - 2018
2008 - 2012
2003 - 2007
1998 - 2002
1994 - 1997
1988 - 1992
1983 - 198720 years +10 - 20 years5 - 10 years1 - 5 years<1 year
%
1972 – 1983
1983 – 1987
1988 – 1992
1994 – 1997
1998 – 2002
2003 – 2007
2008 – 2012
2013 – 2018
Note: data are not available for 1993 or 2014. Hence, one category (1994 – 1997) contains only four years of data.

WWW.WORKINGFORTHEFUTURE.COM.AU
AUSTRALIA’S FUTURE LABOUR MARKET MYTHS AND REALITIES
FACTSHEET HOW WELL HAVE WE DEALT WITH LABOUR MARKET CHANGE IN THE PAST?
WWW.WORKINGFORTHEFUTURE.COM.AU

WWW.WORKINGFORTHEFUTURE.COM.AU
1
T he Australian labour market has seen significant change over the past 30 years. These changes include a large rise in the
share of Australians in the labour force; and also shifts in the share of employment across industries and sectors of the economy.
As well as these structural changes, the economic cycle has also had a big impact on the labour market – most notably the recession of the early 1990s and also the slowdown during the global financial crisis (GFC). It has ultimately been these slowdowns and recessions that have had the largest observable impact on the overall health of the labour market. (Figure 1)
The weakness in the jobs market during these slowdowns has been dramatic, and vast numbers of Australians have been adversely affected.
» For example, in the early 1990s recession the unemployment rate increased from 5.8 per cent to 11.2 per cent over three years. In today’s labour market, an unemployment rate of 11.2 per cent would correspond to 1.5 million people out of work.
» It then took over a decade to return the unemployment rate to the low seen just prior to the 1990s recession.
» During the GFC, the unemployment rate increased from 4 per cent to 5.9 per cent in less than a year, with the number of unemployed Australians increasing by 219,000.1
The personal toll of labour market weakness during recessions and economy slowdowns underscores the importance of a strong economy. It is only through a strong economy that we can, ultimately, keep the unemployment rate low and Australians in jobs.
Conversely, the general robustness of the Australian economy over the past 27 years is reflected in our current unemployment rate of 5 per cent – a low rate by long-run standards.
HOW WELL HAVE WE DEALT WITH LABOUR MARKET CHANGE IN THE PAST?
AUSTRALIA’S FUTURE LABOUR MARKET MYTHS AND REALITIESHOW WELL HAVE WE DEALT WITH LABOUR MARKET CHANGE IN THE PAST?
1 ABS cat. no. 6202.0
KEY POINTS Australia has dealt well with labour market change in the past. Ultimately it has been the economic cycle (recessions and slowdowns), not structural change that has had the largest observable impact on the labour market.
This underscores the need to keep the economy strong.
Figure 1The unemployment rate rises quickly when there is an economic shock
Bariol 12/12pt -10Bariol 12/12pt -10Bariol 12/12pt -10
Nimbus Sans 9/11pt -20Nimbus Sans 9/11pt -20
Nimbus Sans 7/9pt -20Nimbus Sans 7/9pt -20
Nimbus Sans 8/10pt -20Nimbus Sans 8/10pt -20
Xxxxxxx
Xxxxxxxx
80%
75
70
65
60
Source: ABS cat. no. 6202.0
0
2
4
6
8
10
12 %%
Sep-1985 Sep-1996 Sep-2007 Sep-20180
2
4
6
8
10
12
Sep-1985 Sep-1996 Sep-2007 Sep-2018
Sep-1985 Sep-1996 Sep-2007 Sep-2018

WWW.WORKINGFORTHEFUTURE.COM.AU
There have also been significant changes in the shares of employment across broad sectors of the economy over the past 30 years. The share of Australian employment in both market and non-market services has risen since the mid-1980s. Being a services economy is not a new development for Australia, with the services sector (market and non-market) comprising a majority of employment in the mid-1980s.
There has, however, also been a significant fall in the share of employment in the goods production sector.
While the absolute number of those employed in the goods production sector has not fallen by much (there are 160,000 fewer people employed in this sector than 30 years ago), the reduction in the share of employment in the sector is stark.
In fact, if the share of employment in the goods production sector had remained the same over the past 30 years then there would be 1.6 million more people employed in that sector today (and fewer people employed in other sectors).
The ability of the Australian economy to accommodate such a shift in employment between sectors – in effect, re-distributing over one and a half million jobs in the goods production sector for jobs in services – suggests that we have been able to deal with labour market change in the past.
» Of course, for the individual workers involved, the adjustment described above is likely to have been quite dislocating. The experience of the economy in aggregate is unlikely to reflect the experience of every individual within it. As a result, there is a role for government to play in smoothing the adjustment process for individual workers through ensuring, for example, access to education and training.
It is also important to note that the period we have considered (post 1985-86) generally corresponded with an opening up of the Australian economy and (until recently) increases in labour market flexibility.
A less flexible labour market is likely to have been less successful in accommodating such a degree of change.
Figure 2The labour market has adjusted and become more services orientated
Bariol 12/12pt -10Bariol 12/12pt -10Bariol 12/12pt -10
Nimbus Sans 9/11pt -20Nimbus Sans 9/11pt -20
Nimbus Sans 7/9pt -20Nimbus Sans 7/9pt -20
Source: ABS cat. no. 6291.0.55.003
Nimbus Sans 8/10pt -20Nimbus Sans 8/10pt -20
Xxxxxxx
million
Marketservices
Non-market services
Xxxxxxx
Construction Goods distribution
Goods production
Xxxxxxxx
80%
75
70
65
60
-0.5
0.0
0.5
1.0
1.5
2.0
2.5
3.0Goods production
Goods distribution
Construction
Non-market services
Market services
-0.2m
0.2m0.7m
2.0m
2.8mNew (net) jobs created since 1985-86
Notes: Market services includes retail, accom. & food, profess. & scientific services, rental & hiring services, IT & communications, finance, admin. services, arts & rec., other services. Non-market includes health, aged & child care; education & training; public admin. & safety.Goods distribution includes wholesale trade, transport & storage. Goods production includes agriculture, mining, manufacturing, utilities.
AUSTRALIA’S FUTURE LABOUR MARKET MYTHS AND REALITIESHOW WELL HAVE WE DEALT WITH LABOUR MARKET CHANGE IN THE PAST?
2

WWW.WORKINGFORTHEFUTURE.COM.AU
AUSTRALIA’S FUTURE LABOUR MARKET MYTHS AND REALITIES
FACTSHEET THE ROLES AND RESPONSIBILITIES OF BUSINESS
WWW.WORKINGFORTHEFUTURE.COM.AU

WWW.WORKINGFORTHEFUTURE.COM.AU
1
BE PROFITABLE AND CREATE JOBSWell-managed, profitable businesses plan for and adapt to change. Successful businesses generate new and better jobs, better wages and better working experiences.
Being profitable is the only way businesses can achieve their purpose, invest in innovation, expand, employ more people, increase wages, pay dividends to people who have put their own money at risk and generate tax revenue.
CREATE A DIVERSE AND INCLUSIVE WORKPLACE Australian businesses have an important role to play in fostering community wellbeing and promoting social and economic inclusion.
Businesses have a responsibility to establish a workplace culture where all individuals are respected, included and enabled to succeed.
Businesses should consider how changes in technology and the labour force can foster a more diverse and inclusive workforce. Innovative job design has the potential to make roles accessible to a more diverse range of candidates, which connects businesses to a broader pool of talent.
Adopting opportunities to implement flexible working arrangements enhances the ability to attract and retain talent, through accommodating individual working styles and needs (such as carer responsibilities).
Businesses should also be mindful of the needs of members of the community who experience greater barriers to obtaining and maintaining employment. Business should work with government on practical programs that can cater for the needs of disadvantaged cohorts like long-term unemployed people. Change should be managed in a way to do what is possible to ensure these members of the community are not adversely impacted by the future of work.
THE ROLES AND RESPONSIBILITIES OF BUSINESS
AUSTRALIA’S FUTURE LABOUR MARKET MYTHS AND REALITIESTHE ROLES AND RESPONSIBILITIES OF BUSINESS
The following sets out the roles and responsibilities of businesses in preparing for work of the future.
Businesses should:
ACT LAWFULLY, ETHICALLY AND RESPONSIBLY In all respects, businesses must act lawfully. They should act ethically and responsibly, according to their best judgement.
In relation to their workforce, businesses must operate in line with workplace relations legislation (and any other legal requirements). However, striving for best practice, beyond minimum legal requirements, enhances the ability to attract, retain and reward workers.
O ur ability to ensure people can access good work and good jobs is a critical part of the implicit social contract in Australian society.
The nature of work should be a constant interest for anyone seeking to improve Australia’s prosperity.
The challenges in the future can only be met through a collective effort from all parties. Everyone has a part to play in improving our preparedness for the future world of work: businesses, governments, unions, not-for-profits and individuals.
Members of the Business Council take their responsibilities seriously. They understand that their people are critical to success. When our workforces need to adapt or transition in the future of work, our members are committed to helping them.
This guidance sets out the ideal roles and responsibilities for businesses. Some of the roles and responsibilities are essential (such as acting lawfully) but others may not always be possible for companies to implement because of particular circumstances. Nonetheless, we believe it remains helpful to articulate the goals that businesses should work towards.

WWW.WORKINGFORTHEFUTURE.COM.AU
PLAN FOR THEIR FUTURE WORKFORCEJust as businesses prepare a strategy for their business, they should be strategically planning their future workforce.
Businesses should understand the likely skills and capabilities they will require from their workforce in future, and likely areas of gaps or surplus.
BE TRANSPARENT ABOUT THE DIRECTION OF THEIR WORKFORCECompanies should communicate clearly and early with the workforce, their representatives, and educational institutions about disruption and foreseeable changes in the workforce’s skills profile. Communication needs to be as timely as possible, delivered as sensitively as possible, and contain all critical information that the impacted individuals need to know.
HELP DISPLACED WORKERSWhen businesses need to respond to change by changing their labour needs, they should provide support for workers who are captured by large-scale displacement, by giving them as much notice as possible, and connecting them with the support services that are available to assist them to move to different roles, companies or careers.
This responsibility falls especially on large businesses, who are more likely to have the resources and breadth to provide required support.
Businesses should measure and track their progress in any support packages for displaced workers.
CONTRIBUTE TO DEVELOPING AUSTRALIAN TALENTBusinesses should work on two fronts to develop talent and meet foreseeable future needs for skills.
Firstly, they should develop and support their own workforces to ensure they have necessary skills and experience. This includes their capability to respond to change. It may be unavoidable to source international talent in some cases, but there are significant advantages to sourcing talent onshore.
This does not necessarily need to involve direct contributions to training. In some instances, the most valuable support a business could provide would be the time and understanding for individuals to pursue their own self development.
Secondly, industries should collectively identify and communicate the skills, values and behaviours they seek from people completeing any education an dtraining, to ensure Australian education institutions prepare learners for the future of work.
Thirdly, organisations should ensure they have the capability to effectively manage change.
AUSTRALIA’S FUTURE LABOUR MARKET MYTHS AND REALITIESTHE ROLES AND RESPONSIBILITIES OF BUSINESS
2

“As soon as I saw the Dulux ad, that was the job I was determined to get.
“I’m getting the chance to do things I never thought I’d be doing.”
“I quite often say that when I first started in 1967, the job was really hard but technology has made it so much easier.
“It’s so much easier for a person of my age to work. I think if I had to work as hard as I did in 1967, I wouldn’t be there but technology has done wonderful things.’’
“You’re running the actual gas plant outside in the field.
“It is something that most people would look at and go I could never do it.
“But coming from a background where I didn’t finish school, I am female, I am Aboriginal in a normally white man’s world, it’s very nice to see that given that opportunity.
“I love the job. I love the people. I love that you don’t just stop. You’ve always got something to learn in that industry.’’
NAOMI BEATH WOODSIDENaomi Beath, 32, is a Kariyarra woman from Port Hedland, who grew up in Karratha with her family. She moved to Perth for high school but dropped out.
She worked for some years in the insurance industry in Perth before returning to Karratha, where Woodside accepted her into an Operations Support Traineeship, designed to support young Indigenous people.
A decade ago, in 2007-08, Woodside was concerned at their Karratha operations that local Indigenous people were not succeeding in gaining an apprenticeship, traineeship or employment – so in consultation with the local Indigenous people, they developed new training pathways.
Naomi has now completed more than four years of training with Woodside and two years of employment. She won a WA Training Award in 2016 [Aboriginal and Torres Strait Islander Student of the Year] and was a finalist in the Australian Training Awards.
1
BRENDA PALMER COLES Brenda Palmer, 86, has worked at the Coles’ supermarket at Malvern for nearly 51 years and is Coles longest-serving checkout operator in Australia.
Brenda first started working at the store in Glenferrie Road on July 19, 1967, and now works four mornings a week, beginning each day at 6.30am.
She first began working at the store after seeing an advertisement for part-time employees. She decided to apply and first started off in the deli before moving to the checkout full-time.
Brenda is a well-known face with customers. She counts many customers as her friends and now serves the grandchildren of the customers she first served in the 1960s.
Stores have changed significantly since the 1960s and Brenda can recall the days before telephones when checkout operators used bells to communicate to managers and the rest of the team. The biggest changes Brenda has witnessed over the past 51 years have been the introduction of barcodes, scanning and then EFTPOS, which have all simplified and sped up the work of check-out operators.
ALI ASSI DULUXGROUPAli Assi, 36, is the son of Lebanese migrants. He grew up and went to school in Preston in Melbourne’s northern suburbs and began working immediately after completing year 12.
Ali worked for 12 years at a large manufacturer supplying local car manufacturers. As Ford gradually scaled back production before final closure in October 2016, Ali ‘saw the writing on the wall’ and took redundancy.
Around that time Dulux had the unique opportunity to build a workforce at its Merrifield site from scratch – creating a range of new opportunities for workers in disrupted industries.
Dulux wanted to build a team of people who would look out for each other and take pride in their work.
The company was also determined to create a diverse workforce which reflected the local community in the north of Melbourne, which they did by engaging directly with local community groups and with inclusive advertising for the roles.
IT’S PEOPLE THAT BRING BUSINESS TO LIFE
BUSINESS COUNCIL OF AUSTRALIA WHO IS BUSINESS?
For more information on Brenda Palmer, Naomi Beath and Ali Assi, and to discover
other stories about the people who bring business to life, go to www.australia-at-work.com.au

WWW.WORKINGFORTHEFUTURE.COM.AU
AUSTRALIA’S FUTURE LABOUR MARKET MYTHS AND REALITIES
FACTSHEET WHAT IS THE ACTU’S PLAN FOR THE FUTURE OF WORK?
WWW.WORKINGFORTHEFUTURE.COM.AU
WWW.WORKINGFORTHEFUTURE.COM.AU
1
THE ACTU’S FALSE CLAIMSFALSE CLAIM 1AUSTRALIA IS MORE UNEQUAL THAN IT HAS BEEN IN 70 YEARS
A recent Productivity Commission report found that sustained economic growth has delivered significantly improved living standards for the average Australian.
Since the 1980s, all income deciles have experienced income growth, with the bottom decile doing well, if not slightly better than most deciles.
Australia’s progressive tax and highly targeted transfer systems substantially reduce inequality as does the provision of in-kind government support (including health, education and child care subsidies).
The Productivity Commission notes that no single metric can definitively answer whether inequality,
poverty and disadvantage in Australia rose, fell or remained steady in recent years. Accordingly, it uses an array of indicators and observes changes over time.
Economic mobility is high in Australia, with almost everyone moving across the income distribution over the course of their lives. For example, over a 16-year period the average Australian was classified in five different income deciles.
An endless debate about inequality does nothing to help those who are doing it tough. Taxing more so governments can spend more would ultimately undermine economic growth and real wages and the capacity to deliver better and fairer outcomes for the community at large and the most vulnerable in particular.
What we need to do is focus on the causes of entrenched disadvantage, particularly intergenerational poverty, and work together on solutions.
WHAT IS THE ACTU’S PLAN FOR THE FUTURE OF WORK?
AUSTRALIA’S FUTURE LABOUR MARKET MYTHS AND REALITIESWHAT IS THE ACTU’S PLAN FOR THE FUTURE OF WORK?
KEY POINTS The Business Council wants a system that:
– delivers a strong, reliable and sustainable safety net for workers and enables businesses to be agile and successful, and
– is future oriented and better balances the needs of workers and employers.
The Australian Council of Trade Unions (ACTU) has proposed a wide-reaching agenda for Australia’s workplace relations system.
This agenda is predicated on tackling incorrect claims that the Australian labour market is increasingly ‘insecure’, inequality in Australia is at record high levels and the enterprise bargaining system is failing.
The modern workforce will see jobs and tasks become more fluid, with individuals taking on broader tasks. It should not be constrained by prescriptive lists of duties or conditions from which the enterprise or the worker cannot deviate.
We don’t know what the jobs of the future will be. But we do know that the more rigid the system is in defining job roles, the more difficult it will be for enterprises to adapt.
The Business Council believes many of the ACTU’s proposals will not deliver good outcomes for workers or employers.
They will make the workplace relations system even more rigid than it is now. They will force people to engage with unions – even if they don’t want to. They will reduce workers’ ability to choose how they work or to negotiate for the conditions that matter to them most. And they will reduce enterprises’ capacity to make decisions to keep them agile and competitive, so they can keep staff employed or hire new staff.

WWW.WORKINGFORTHEFUTURE.COM.AU
2
FALSE CLAIM 2 INSECURE WORK IS INCREASING
There has been a lot of commentary to suggest there have been increases in casual employment or independent contracting. This is not supported by evidence:
– The number of independent contractors in Australia was lower in 2017 than 10 years earlier, down to 8.3 per cent from 9 per cent.
– The proportion of casual workers is currently sitting around 20 per cent of working Australians. The level of casualisation in Australia remained at the same approximate levels since the mid-1990s.1
– Increasingly, part-time workers are in permanent part-time employment, not casual employment. In 2016, 46.8 per cent of part-time workers were permanent compared to 39.5 per cent in 2004.
There has also been a large amount of public discussion about the implications of the gig economy. However, best estimates suggest the gig economy comprises as low as 1-4 per cent of the current workforce.
– This style of work provides participation opportunities for people on a short-term basis that gives them some autonomy around scheduling work.
We must make sure people have employment protections, but we do not want to cut off work opportunities, particularly for young people.
FALSE CLAIM 3THE ENTERPRISE BARGAINING SYSTEM ENCOURAGES EMPLOYERS TO UNDERCUT ONE ANOTHER TO COMPETE ON WAGE COSTS
Wage increases under enterprise agreements are delivering higher wages than the economy wide average.
– The average annualised wage increase for all agreements was 2.8 per cent in March 2018. This is above the pace of wages growth recorded by the (economy wide) wage price index which rose by just 2.0 per cent over the year to March.
– Wage increases under enterprise agreements have been higher than growth in the wage price index for the last seven years.
The Business Council recognises that many workers are worried about their wages and are finding it hard to make ends meet. We are deeply concerned about this issue.
Ultimately it is productivity growth that increases real incomes. In the 1990s, productivity gains came from economic reforms including establishing the enterprise bargaining system. Productivity growth ran at an average 2.2 per cent a year. That was also the pace of real income growth.
In the 2000s, real income growth also ran at about the same rate, but slower productivity growth was offset by the record terms of trade.
With the terms of trade boom now over and productivity growth remaining weak, real income growth has slowed.
Enterprise bargaining agreements provide a mechanism for workers to negotiate higher wages – but this will only happen when workers and employers work together to boost an enterprise’s productivity.
FALSE CLAIM 4THE ENTERPRISE-ONLY BARGAINING SYSTEM IS FAILING… THE PAY INCREASES IT DELIVERS DO NOT REFLECT PRODUCTIVITY INCREASES
The current weakness in real wages growth reflects weak productivity growth.
Over the past year labour productivity has run below long run average levels (with growth of 1.0 per cent). Over the past two years labour productivity has barely risen – it is up just 0.3 per cent over a two-year period.
The long-term link between real wages growth and productivity growth remains unbroken. Over the past 26 years, productivity is up 51 per cent and real wages are up 54 per cent.
FALSE CLAIM 5THE ENTERPRISE-ONLY BARGAINING SYSTEM IS FAILING. MORE AND MORE PEOPLE ARE FALLING OUT OF IT
It’s correct that the numbers of employees covered by current enterprise agreements have fallen dramatically: from a peak of 2,626,600 employees covered in March 2014 to 1,781,900 in March 2018.
AUSTRALIA’S FUTURE LABOUR MARKET MYTHS AND REALITIESWHAT IS THE ACTU’S PLAN FOR THE FUTURE OF WORK?
1 Australian Bureau of Statistics, 6333.0 Characteristics of Employment, August 2017; Australian Bureau of Statistics, 6105.0 Australian Labour Market Statistics, July 2014; Productivity Commission, Forms of work in Australia, April 2013.

WWW.WORKINGFORTHEFUTURE.COM.AU
3
But employers are only moving away from enterprise agreements to rely on the award system because the approach taken by the unions has made the system so hard to work with. It is rigid, complex and intrusive into business operations.
– The system was made worse by the Fair Work Commission’s decision in May 2016 to reinterpret the ‘better off overall test’, which is now impractical and unpredictable.
The Business Council wants workers to get better wages, and the enterprise bargaining system is the best way to do this.
THE ACTU’S AGENDAINTRODUCTION OF INDUSTRY-WIDE AND SECTOR-WIDE BARGAININGThe ACTU argues that workers must be able to negotiate across sectors and industries to ‘establish a solid basis for more secure, fairly paid work’.
The current workplace relations system already establishes a solid basis for secure, fairly paid work.
Is the ACTU suggesting that the minimum wage, the current awards system, and enterprise bargains that they negotiated don’t offer secure fairly paid work?
How do workers get the benefits of their hard work in their own enterprise if they are forced to negotiate across the sector? All workers will be stuck at the same terms and conditions of the worst performing organisation.
Workers who have helped build successful, profitable companies will miss out on being able to negotiate higher wages and improved conditions. How is this fair?
If all the levers a business can use to help it adapt and stay competitive are written into rigid, one-size-fits-all agreements, businesses will struggle to adjust. Jobs will be at risk.
Small businesses in regional areas will have to match the wages and conditions offered by businesses in the capital cities. They will be forced into arrangements that make no sense to them because they bear no resemblance to the way they run their business.
How will they find the money to do this and still have the capacity to take on new workers? How can we expect them to do this and still have money left over to upskill and reskill their existing workers?
Ultimately, an industry-wide bargaining system will only empower the big unions at the expense of workers.
Trade union membership is only 10.4 per cent in the private sector (941,500 people). The ACTU’s system means unions will negotiate wages and conditions in sectors where they have no or a handful of members. Workers will lose their ability to influence the negotiations – to fight for the conditions that are important to them. Why should workers be roped into dealing with unions when, clearly, many don’t want to?
Australia’s modern award system already provides a full set of legally enforceable wage rates and conditions of employment at the industry level.
Agreements provide a mechanism for workers to negotiate above award conditions. They provide an opportunity for workers and employers to discuss the unique circumstances of the enterprise and map out a plan for how they can work together to make the workplace better and the enterprise grow. This role shouldn’t change.
We shouldn’t unravel a tried and tested system, established by Labor, and take ourselves back to the dark ages. We don’t need to go back to a strike ridden, conflict driven workplace relations system in this country.
The best way to achieve wages growth and meaningful jobs for workers is to reform the system so it encourages workers and employers to collaborate to solve problems and use their skills and capital to maximum effect, not through a rigid workplace relations system.
ABOLISH ALL RESTRICTIONS ON AGREEMENT CONTENTThe ACTU wants to abolish all restrictions on the content of enterprise bargaining agreements.
This would pave the way for unions to charge people for negotiating agreements because apparently non-union members – 86 per cent of all workers and more than 90 per cent of private sector workers – are ‘free riders’.
The unions have a record of trying to add clauses into agreements that force workers to pay bargaining fees, even when they are not union members. Trying to take money that is due to go into workers’ pockets. The ACTU needs to clarify whether this is going to happen.
AUSTRALIA’S FUTURE LABOUR MARKET MYTHS AND REALITIESWHAT IS THE ACTU’S PLAN FOR THE FUTURE OF WORK?

WWW.WORKINGFORTHEFUTURE.COM.AU
4
Limiting the content of agreements matters because once an agreement is settled, they set the rules for three to four years.
In a world where technological change can disrupt business models at short notice, enterprises cannot afford to wait for an agreement to expire to change how they operate.
They need agreements that give them the capacity to make decisions to keep their company competitive and their staff employed.
Workers and employers should be able to negotiate agreements that make sense in the context of that enterprise and all its workers.
Bloated agreements will be the enemy of getting tasks to change and adapt to technology. which is the enemy of job creation. Jobs will be at risk. Workers will miss out.
ABOLISH NON-UNION AGREEMENTSThe ACTU argues that agreements should only be made with unions representing workers.
The latest data tells us that union membership is at a record low. Only 14 per cent of all Australian employees and 10.4 per cent of private sector employees have chosen to become a union member.
Why should unions have carte blanche on enterprise bargaining when they do not represent the vast majority of workers?
Workers should have a choice about whether they engage with unions.
Workers should have a choice about who will best represent their needs and preferences when negotiating an agreement. They shouldn’t be roped into a system they have chosen to avoid.
Workers should have a choice about whether they fund a union.
Giving unions unfettered control over agreements – even when workers do not want them to be involved − will encourage some employers to walk away from negotiations and rely on awards. Workers will miss out on the higher wages and improved conditions gained through agreements.
ABOLISH ALL RESTRICTIONS ON AWARD CONTENT The ACTU wants to abolish all restrictions on the content of awards.
Awards have a core purpose of providing a safety net of wages and conditions. But, many have already ventured into territory that workers and employers should negotiate.
Australia is the only country that has awards. They are confusing and complex – for workers and employers. Confusion and complexity is unacceptable in a government-mandated safety net.
Removing restrictions on award content would make the award system even more complex. It would also open the door for unions to further define occupations, dictating how workers do their jobs and how employers structure their workforces, regardless of what the worker or employer needs.
Restrictive job design is not how the modern workforce operates. The modern workforce is about individuals taking on broader tasks, not being confined to an outdated and pre-determined list.
We don’t know what the jobs of the future will be. But we do know that the more rigid the system is in defining job roles, the more difficult it will be for enterprises to adapt. We also know that more interesting and meaningful jobs will be created when workers and employers have some say in what the jobs are.
For small businesses that rely heavily on the award system, increasing the scope of awards is likely to add red tape and unnecessary costs.
This will discourage many employers from expanding their business and taking on new staff.
If it’s going to be complicated and costly to expand, why would we expect a business to bother? Small business owners do not have the time or resources to navigate their way through a complex system.
NEW NATIONAL EMPLOYMENT STANDARDS TO ADDRESS THE PROBLEM OF ‘INSECURE WORK’The Business Council strongly supports workers having the opportunity to secure work and believes that any business that breaks the laws or exploits workers should be held to account.
However, the evidence is clear that the labour market is no more volatile or precarious than in the past.
The ACTU is ignoring that evidence and has proposed that we need a range of new measures to address the increase of ‘insecure work’, including limiting the use of casual employment, labour hire and fixed term contracts.
AUSTRALIA’S FUTURE LABOUR MARKET MYTHS AND REALITIESWHAT IS THE ACTU’S PLAN FOR THE FUTURE OF WORK?

WWW.WORKINGFORTHEFUTURE.COM.AU
THE BUSINESS COUNCIL’S REFORM AGENDAWe want a system that:
1 Has a strong, reliable and sustainable safety net
for all workers.
2 Reflects the fact that how people want to work is
changing, and businesses need the capacity to make the decisions required to stay competitive and be productive.
3 Meets the needs of workers and employers.
This ultimately requires us to balance social and economic objectives. And to balance these objectives without over regulating or under regulating the system.
4 Recognises that workers and employers are not the same.
Some workers will enjoy the
freedom created by new ways of working. Other workers are likely to prefer the security and entitlements gained via permanent full-time and permanent part-time work arrangements. Many parts of the community use casual and contract jobs as a stepping stone to permanent position.
Employers will need to juggle the different needs and expectations of their workforce with the achievement of business objectives. We need the system to give them the capacity to do this.
5 Has agreements that allow a focus on the unique
circumstances of an enterprise.
Enterprises need agreements that give them the capacity to
make decisions that will help their business adapt, be more agile and be globally orientated.
This will be the key to creating new employment opportunities. It will also be vital to deliver the productivity improvements needed to deliver higher wages.
Empowers workers and enterprises can negotiate to realise shared objectives −the ability of an enterprise to overcome challenges and harness the potential of its workforce will be key to creating a more productive and successful enterprise.
6 Has a trusted ‘independent umpire’.
5
These false claims scare people who worry about their job security and the future of their children.
Additionally, the ACTU’s proposals fail to recognise that workers are not the same. Workers have different needs and preferences for how they want to work.
As technology enables new ways of working and new generations enter the labour market, it’s likely that workers’ needs and expectations will become even more diverse.
Casuals, fixed term contracts and labour hire are an important part of the mix of employee work arrangements. These types of jobs provide valuable opportunities for people, particularly low-skilled workers and young people, to gain a foothold in the jobs market. They are often a pathway into a permanent job.
The proposals also imply that workers have no choice when deciding on their employment arrangements – this is not always the case. This flexibility can suit the requirements of many workers as well as employers.
While some people undertake a particular form of work out of obligation, many individuals choose their preferred form of work. These choices are made by balancing preferences for factors like flexibility, autonomy, security, entitlements and advancement prospects. Many people prefer casual or contract work for the flexibility or pay premium. It is not necessarily an indicator of insecurity.
Australia needs a modern workplace relations system that delivers a safety net for workers and gives all enterprises the agility they need to compete and succeed.
Restricting workers and employers from being able to access the full suite of employment arrangements will be at odds with many workers’ wishes. It will create barriers to employment – with disadvantaged groups most likely to feel the negative effects.
AUSTRALIA’S FUTURE LABOUR MARKET MYTHS AND REALITIESWHAT IS THE ACTU’S PLAN FOR THE FUTURE OF WORK?