complete communities public engagement summary
TRANSCRIPT
Complete Communities 1 Public Engagement Summary
Complete Communities Public Engagement Summary
The City of San Diego Planning Department began drafting the Complete Communities initiatives in the spring of 2019, and since June 2019 has presented these initiatives to a wide variety of stakeholder groups and at public meetings. This document provides a summary of public meetings, events, and online outreach activities.
The following list summarizes these outreach activities, events, surveys, and other online engagement, which are attached in this document:
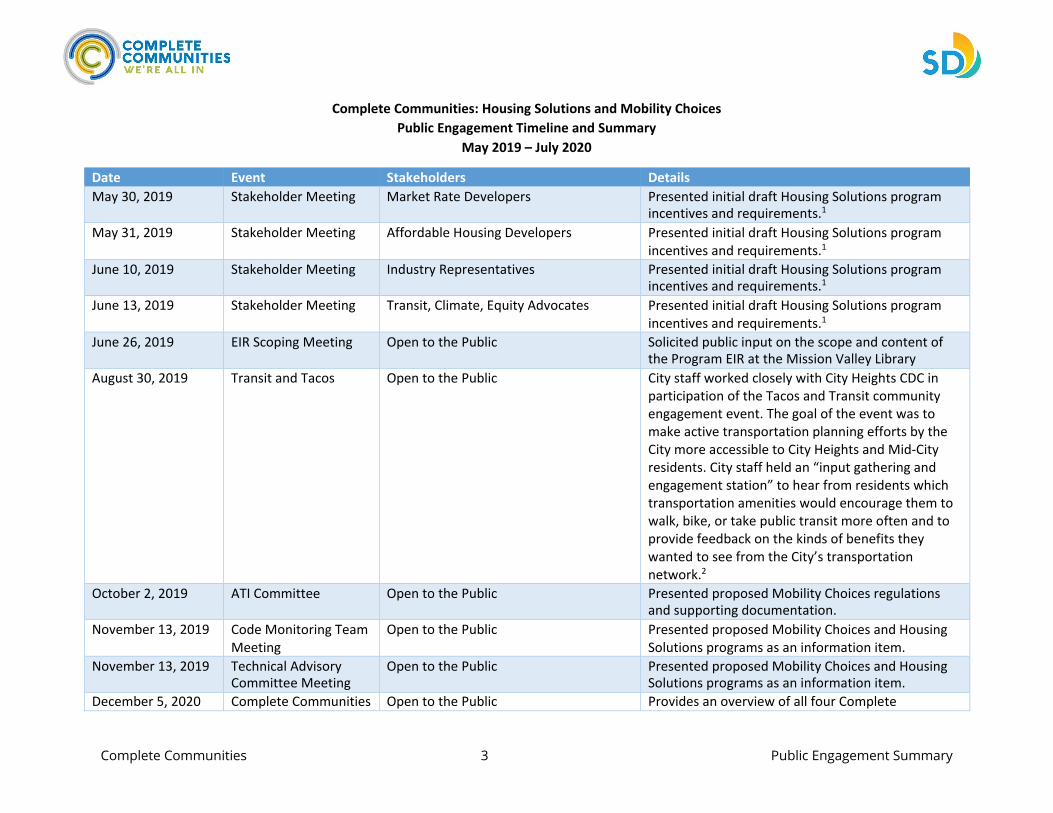
1. Public Engagement Timeline and Summary—Lists all dates, events, stakeholders, and meeting details foroutreach events and activities.
2. Transit & Tacos: Bringing Transportation Planning to the Streets—Provides a summary of communityengagement held on Mobility Choices at the City heights Community Development Corporation fourthannual Transit & Tacos event at the Fair@44 community activation space on El Cajon Boulevard.
3. Complete Communities Online Engagement Tool Screenshots—Provides screenshots of the onlineengagement tool the City launched in December 2019 to provide information on each initiative and tocollect community feedback on program implementation and is still open. Staff also posted a survey aboutthe Housing Solutions initiative on May 1 and closed the survey on June 15.
4. Complete Communities Engagement Tool Survey Results—Provides information on responses fromrespondents.
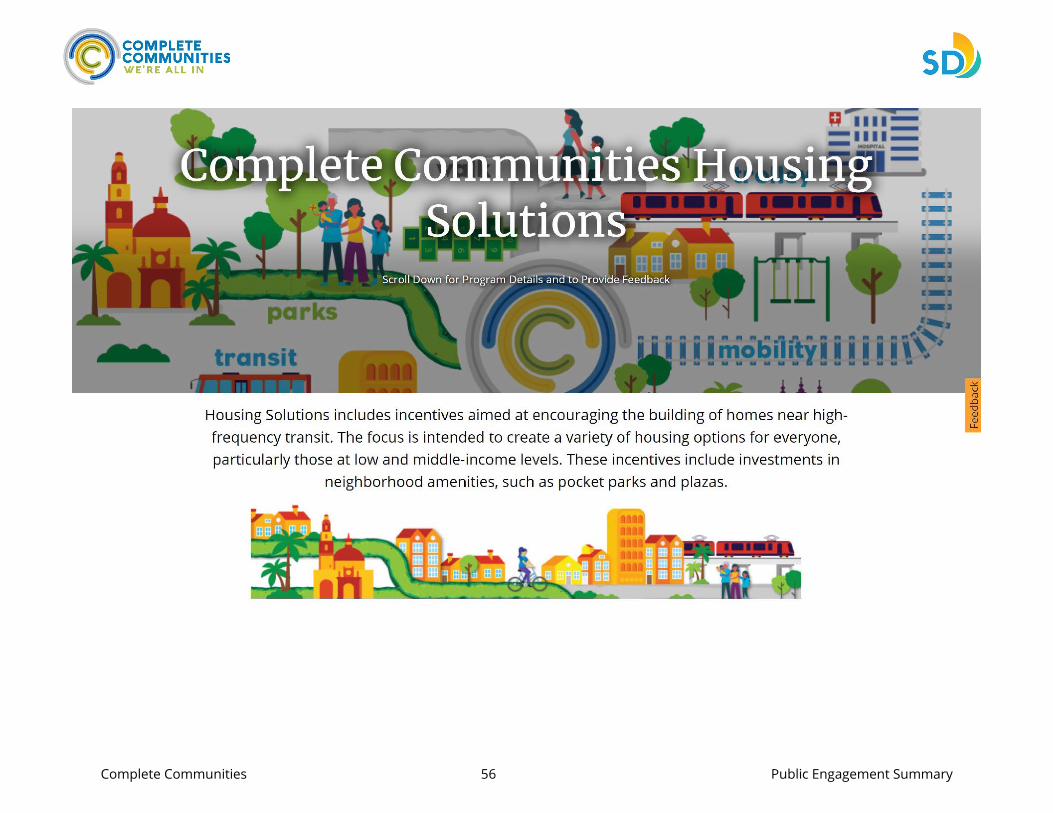
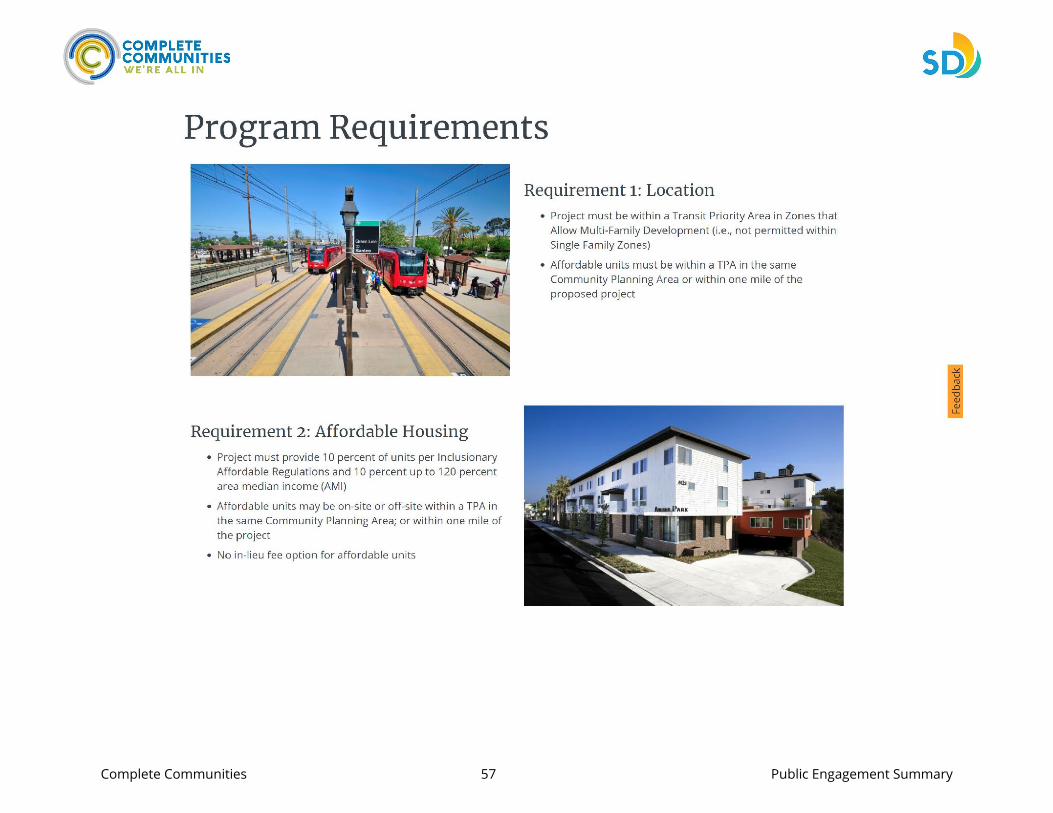
5. Housing Solutions Program Details Webpage – Sample Screenshots—Provides screenshots of the HousingSolutions webpages.
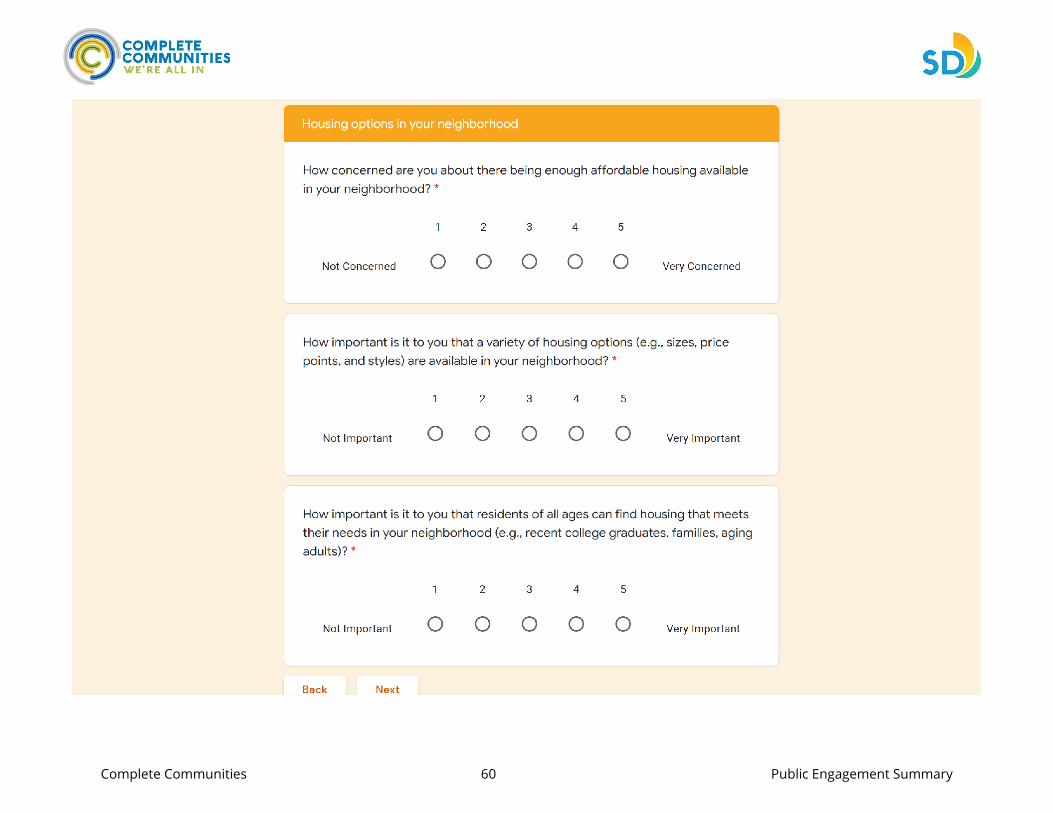
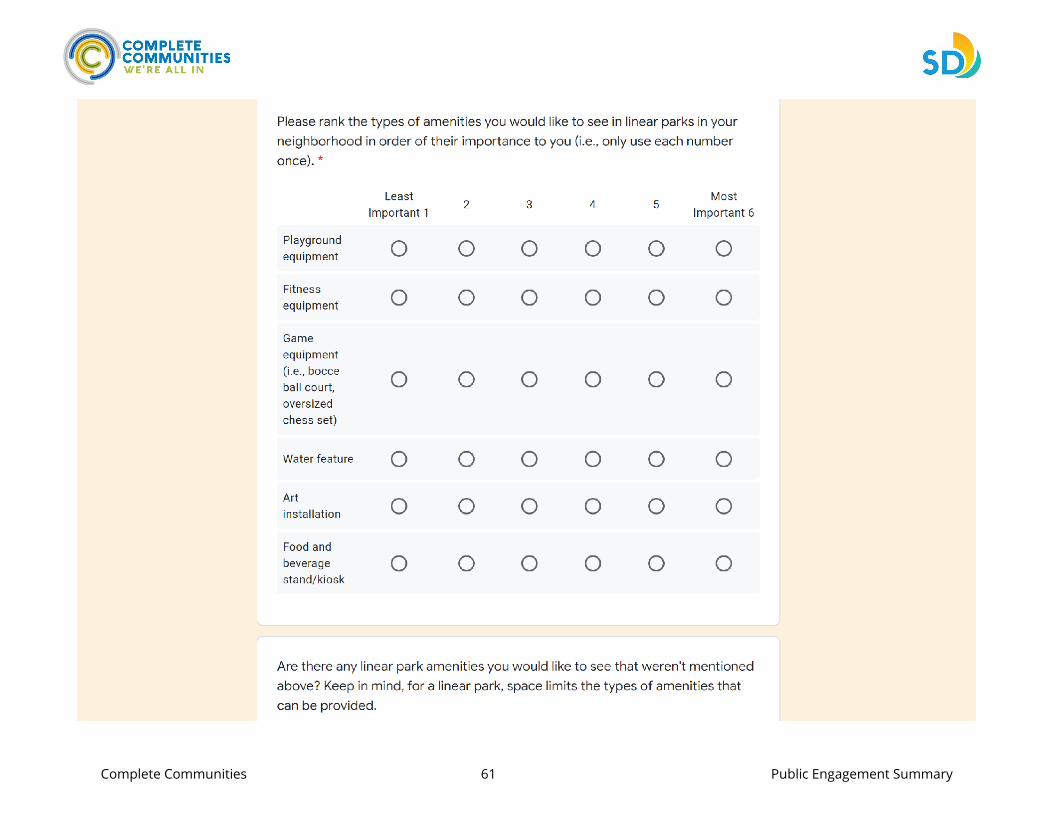
6. Housing Solutions Survey – Sample Screenshots—Provides screenshots of the Housing Solutions survey,which was available between May 1,2020 – June 15, 2020.
7. Mobility Choices Program Details Webpage – Sample Screenshots—Provides screenshots of the MobilityChoices webpages.
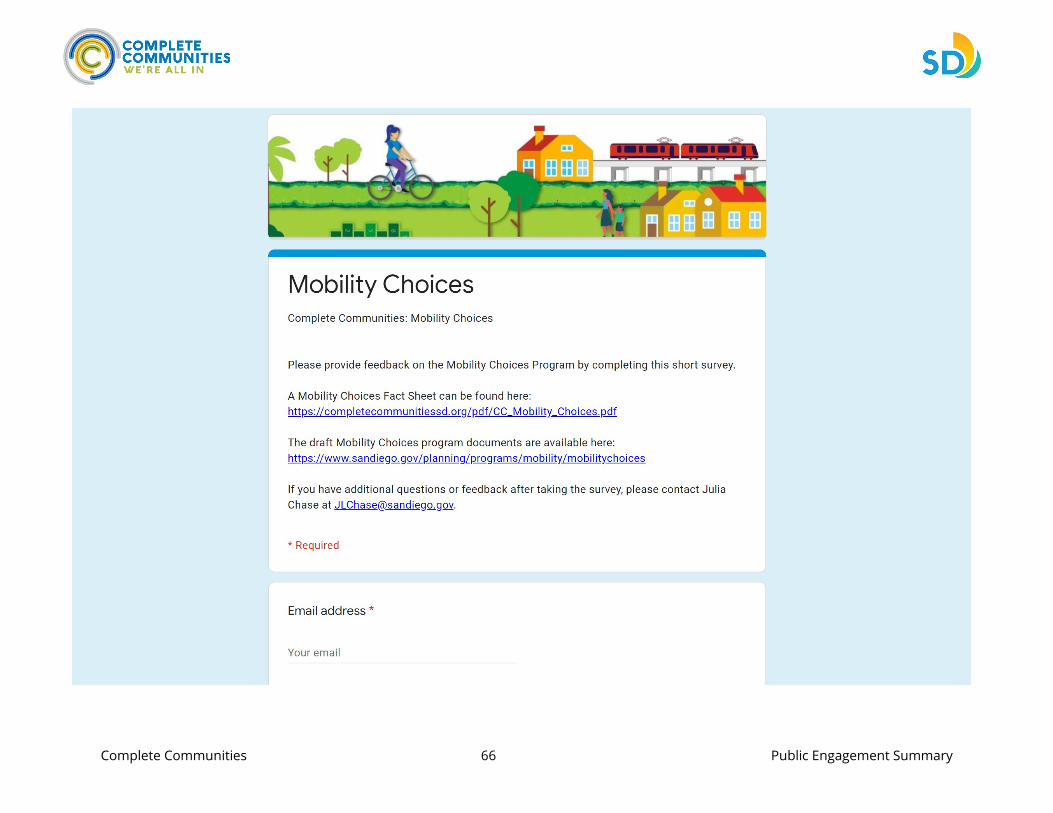
8. Mobility Choices Survey – Sample Screenshots Provides screenshots of the Mobility Choices survey, whichwas available between May 1,2020 – June 15, 2020.
9. Complete Communities Webinar Polling Results—Provides a summary of polling results from the webinarheld on July 13, 2020. Staff partnered with the Institute for Local Government to host a two-hourinteractive public webinar that included presentations on the program concepts and changes to date,polling on previous survey feedback results, and a question and answer session.
Complete Communities 2 Public Engagement Summary
1. Public Engagement Timeline and Summary
Complete Communities 3 Public Engagement Summary
Complete Communities: Housing Solutions and Mobility Choices Public Engagement Timeline and Summary
May 2019 – July 2020
Date Event Stakeholders Details May 30, 2019 Stakeholder Meeting Market Rate Developers Presented initial draft Housing Solutions program
incentives and requirements.1 May 31, 2019 Stakeholder Meeting Affordable Housing Developers Presented initial draft Housing Solutions program
incentives and requirements.1 June 10, 2019 Stakeholder Meeting Industry Representatives Presented initial draft Housing Solutions program
incentives and requirements.1 June 13, 2019 Stakeholder Meeting Transit, Climate, Equity Advocates Presented initial draft Housing Solutions program
incentives and requirements.1 June 26, 2019 EIR Scoping Meeting Open to the Public Solicited public input on the scope and content of
the Program EIR at the Mission Valley Library August 30, 2019 Transit and Tacos Open to the Public City staff worked closely with City Heights CDC in
participation of the Tacos and Transit community engagement event. The goal of the event was to make active transportation planning efforts by the City more accessible to City Heights and Mid-City residents. City staff held an “input gathering and engagement station” to hear from residents which transportation amenities would encourage them to walk, bike, or take public transit more often and to provide feedback on the kinds of benefits they wanted to see from the City’s transportation network.2
October 2, 2019 ATI Committee Open to the Public Presented proposed Mobility Choices regulations and supporting documentation.
November 13, 2019 Code Monitoring Team Meeting
Open to the Public Presented proposed Mobility Choices and Housing Solutions programs as an information item.
November 13, 2019 Technical Advisory Committee Meeting
Open to the Public Presented proposed Mobility Choices and Housing Solutions programs as an information item.
December 5, 2020 Complete Communities Open to the Public Provides an overview of all four Complete
Complete Communities 4 Public Engagement Summary
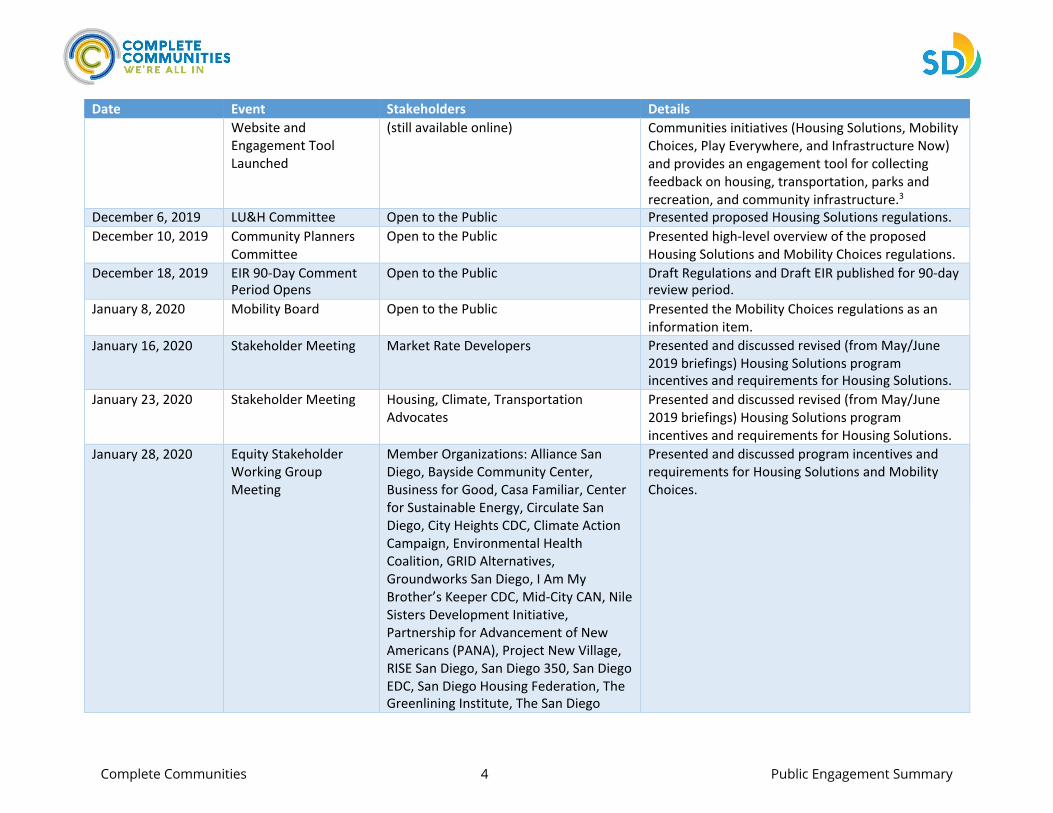
Date Event Stakeholders Details Website and
Engagement Tool Launched
(still available online) Communities initiatives (Housing Solutions, Mobility Choices, Play Everywhere, and Infrastructure Now) and provides an engagement tool for collecting feedback on housing, transportation, parks and recreation, and community infrastructure.3
December 6, 2019 LU&H Committee Open to the Public Presented proposed Housing Solutions regulations. December 10, 2019 Community Planners
Committee Open to the Public Presented high-level overview of the proposed
Housing Solutions and Mobility Choices regulations. December 18, 2019 EIR 90-Day Comment
Period Opens Open to the Public Draft Regulations and Draft EIR published for 90-day
review period. January 8, 2020 Mobility Board Open to the Public Presented the Mobility Choices regulations as an
information item. January 16, 2020 Stakeholder Meeting Market Rate Developers Presented and discussed revised (from May/June
2019 briefings) Housing Solutions program incentives and requirements for Housing Solutions.
January 23, 2020 Stakeholder Meeting Housing, Climate, Transportation Advocates
Presented and discussed revised (from May/June 2019 briefings) Housing Solutions program incentives and requirements for Housing Solutions.
January 28, 2020 Equity Stakeholder Working Group Meeting
Member Organizations: Alliance San Diego, Bayside Community Center, Business for Good, Casa Familiar, Center for Sustainable Energy, Circulate San Diego, City Heights CDC, Climate Action Campaign, Environmental Health Coalition, GRID Alternatives, Groundworks San Diego, I Am My Brother’s Keeper CDC, Mid-City CAN, Nile Sisters Development Initiative, Partnership for Advancement of New Americans (PANA), Project New Village, RISE San Diego, San Diego 350, San Diego EDC, San Diego Housing Federation, The Greenlining Institute, The San Diego
Presented and discussed program incentives and requirements for Housing Solutions and Mobility Choices.
Complete Communities 5 Public Engagement Summary
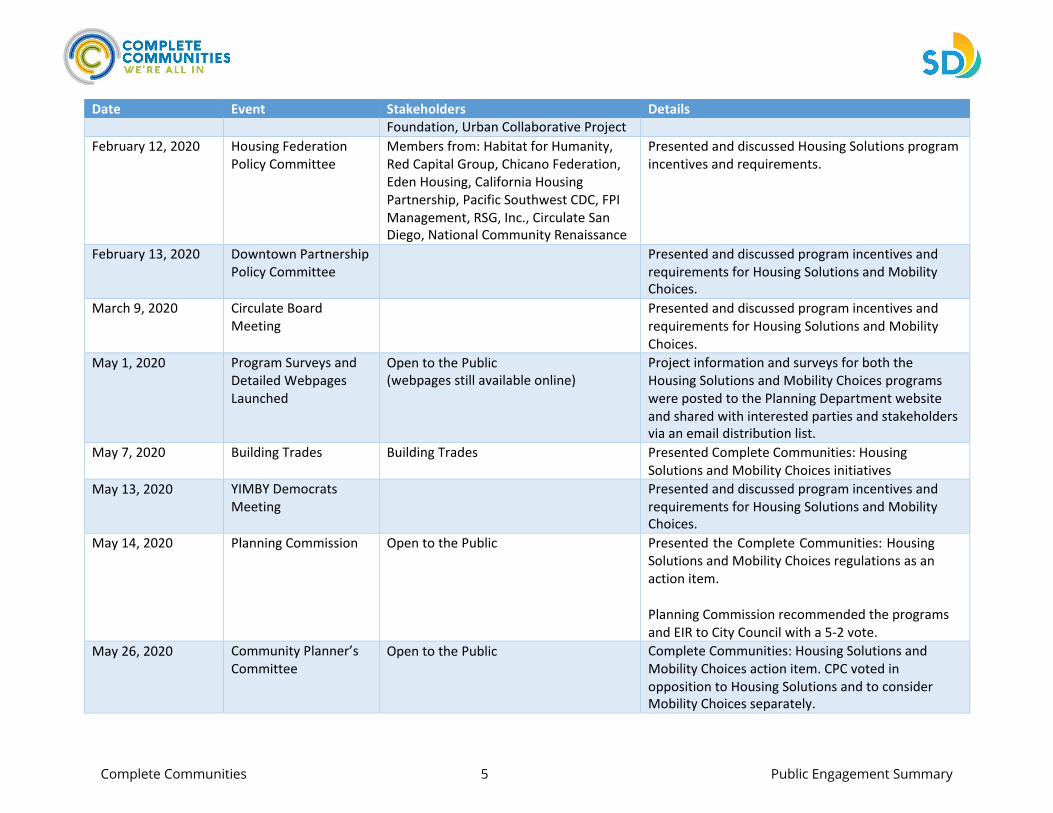
Date Event Stakeholders Details Foundation, Urban Collaborative Project
February 12, 2020 Housing Federation Policy Committee
Members from: Habitat for Humanity, Red Capital Group, Chicano Federation, Eden Housing, California Housing Partnership, Pacific Southwest CDC, FPI Management, RSG, Inc., Circulate San Diego, National Community Renaissance
Presented and discussed Housing Solutions program incentives and requirements.
February 13, 2020 Downtown Partnership Policy Committee
Presented and discussed program incentives and requirements for Housing Solutions and Mobility Choices.
March 9, 2020 Circulate Board Meeting
Presented and discussed program incentives and requirements for Housing Solutions and Mobility Choices.
May 1, 2020 Program Surveys and Detailed Webpages Launched
Open to the Public (webpages still available online)
Project information and surveys for both the Housing Solutions and Mobility Choices programs were posted to the Planning Department website and shared with interested parties and stakeholders via an email distribution list.
May 7, 2020 Building Trades Building Trades Presented Complete Communities: Housing Solutions and Mobility Choices initiatives
May 13, 2020 YIMBY Democrats Meeting
Presented and discussed program incentives and requirements for Housing Solutions and Mobility Choices.
May 14, 2020 Planning Commission Open to the Public Presented the Complete Communities: Housing Solutions and Mobility Choices regulations as an action item.
Planning Commission recommended the programs and EIR to City Council with a 5-2 vote.
May 26, 2020 Community Planner’s Committee
Open to the Public Complete Communities: Housing Solutions and Mobility Choices action item. CPC voted in opposition to Housing Solutions and to consider Mobility Choices separately.
Complete Communities 6 Public Engagement Summary
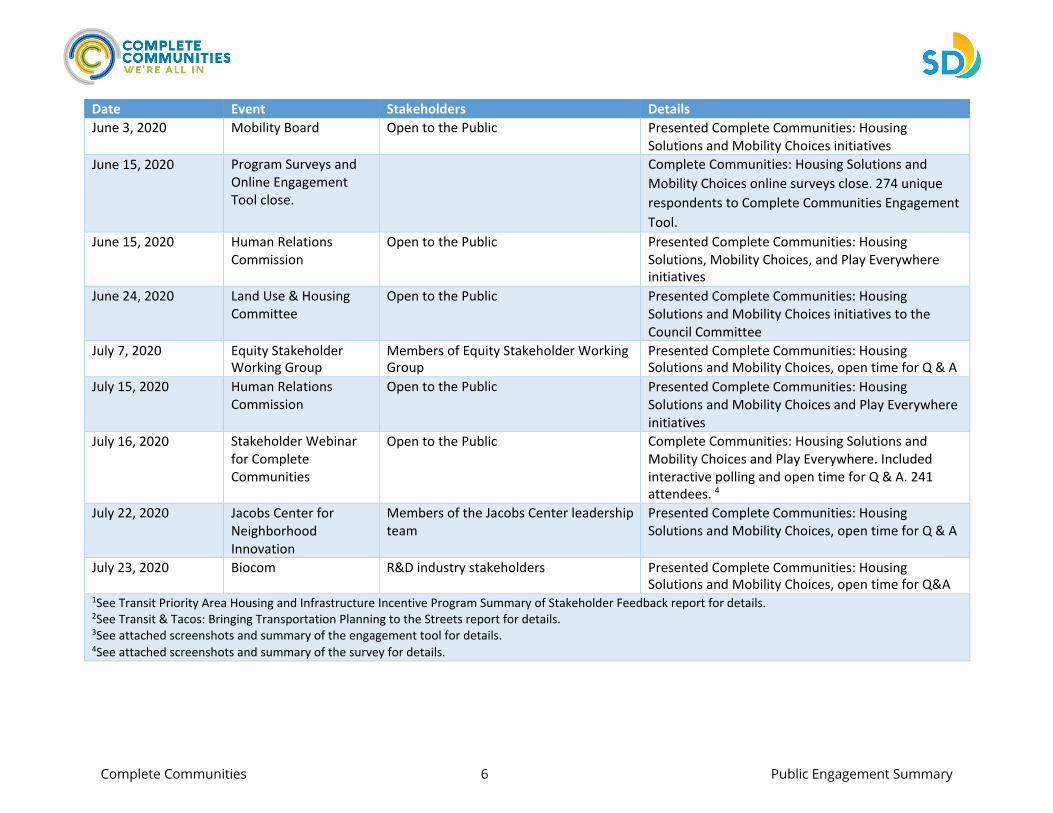
Date Event Stakeholders Details June 3, 2020 Mobility Board Open to the Public Presented Complete Communities: Housing
Solutions and Mobility Choices initiatives June 15, 2020 Program Surveys and
Online Engagement Tool close.
Complete Communities: Housing Solutions and Mobility Choices online surveys close. 274 unique respondents to Complete Communities Engagement Tool.
June 15, 2020 Human Relations Commission
Open to the Public Presented Complete Communities: Housing Solutions, Mobility Choices, and Play Everywhere initiatives
June 24, 2020 Land Use & Housing Committee
Open to the Public Presented Complete Communities: Housing Solutions and Mobility Choices initiatives to the Council Committee
July 7, 2020 Equity Stakeholder Working Group
Members of Equity Stakeholder Working Group
Presented Complete Communities: Housing Solutions and Mobility Choices, open time for Q & A
July 15, 2020 Human Relations Commission
Open to the Public Presented Complete Communities: Housing Solutions and Mobility Choices and Play Everywhere initiatives
July 16, 2020 Stakeholder Webinar for Complete Communities
Open to the Public Complete Communities: Housing Solutions and Mobility Choices and Play Everywhere. Included interactive polling and open time for Q & A. 241 attendees. 4
July 22, 2020 Jacobs Center for Neighborhood Innovation
Members of the Jacobs Center leadership team
Presented Complete Communities: Housing Solutions and Mobility Choices, open time for Q & A
July 23, 2020 Biocom R&D industry stakeholders Presented Complete Communities: Housing Solutions and Mobility Choices, open time for Q&A
1See Transit Priority Area Housing and Infrastructure Incentive Program Summary of Stakeholder Feedback report for details. 2See Transit & Tacos: Bringing Transportation Planning to the Streets report for details. 3See attached screenshots and summary of the engagement tool for details. 4See attached screenshots and summary of the survey for details.
Complete Communities 7 Public Engagement Summary
2. Transit & Tacos: Bringing Transportation Planning to the
Streets
Complete Communities 8 Public Engagement Summary
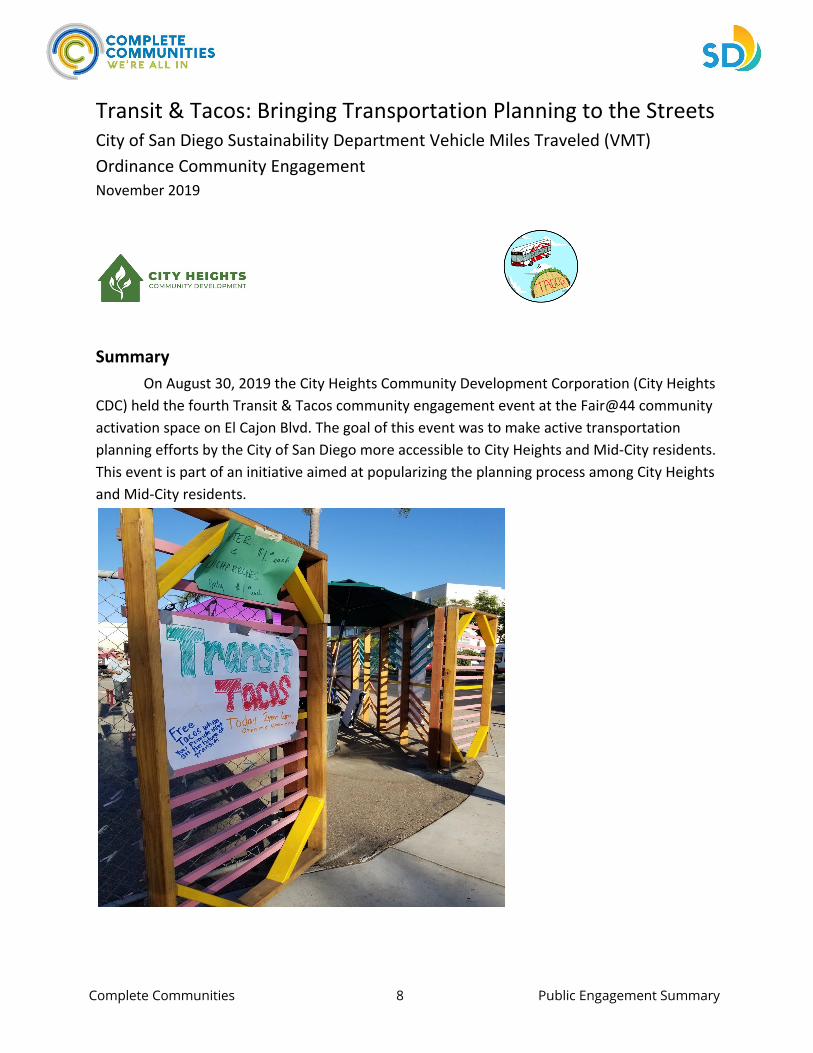
Transit & Tacos: Bringing Transportation Planning to the Streets City of San Diego Sustainability Department Vehicle Miles Traveled (VMT) Ordinance Community Engagement November 2019
Summary On August 30, 2019 the City Heights Community Development Corporation (City Heights
CDC) held the fourth Transit & Tacos community engagement event at the Fair@44 community activation space on El Cajon Blvd. The goal of this event was to make active transportation planning efforts by the City of San Diego more accessible to City Heights and Mid-City residents. This event is part of an initiative aimed at popularizing the planning process among City Heights and Mid-City residents.
Complete Communities 9 Public Engagement Summary
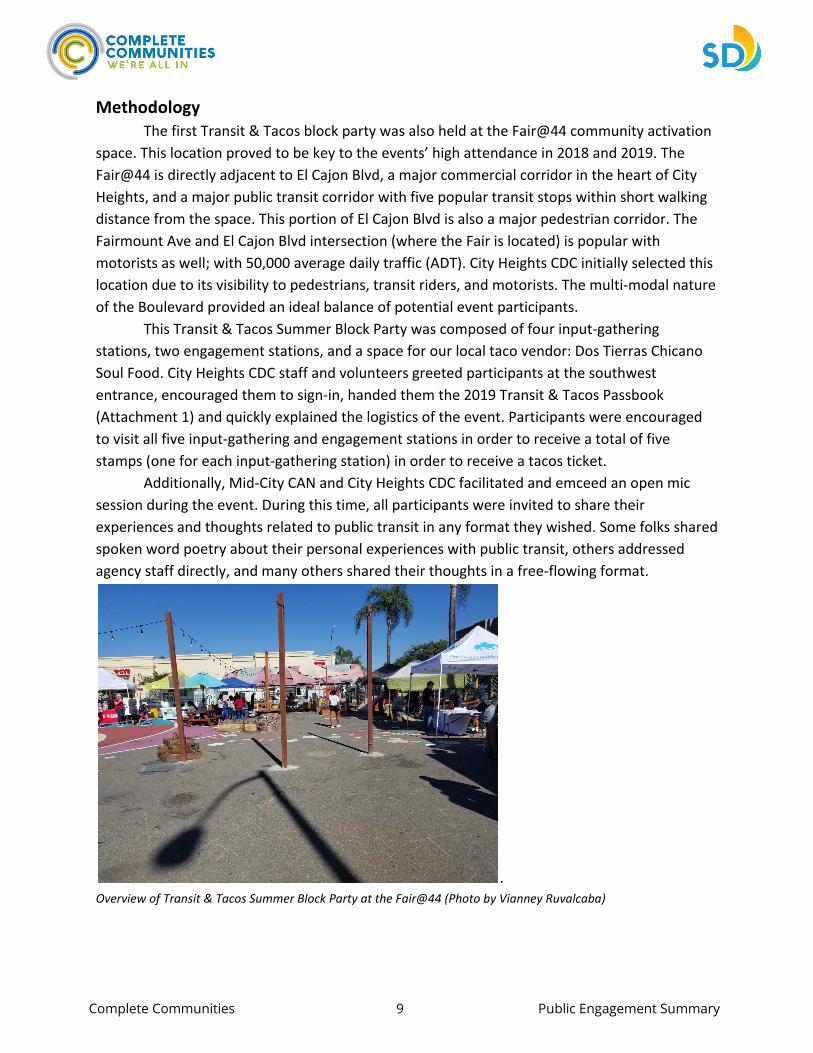
Methodology The first Transit & Tacos block party was also held at the Fair@44 community activation
space. This location proved to be key to the events’ high attendance in 2018 and 2019. The Fair@44 is directly adjacent to El Cajon Blvd, a major commercial corridor in the heart of City Heights, and a major public transit corridor with five popular transit stops within short walking distance from the space. This portion of El Cajon Blvd is also a major pedestrian corridor. The Fairmount Ave and El Cajon Blvd intersection (where the Fair is located) is popular with motorists as well; with 50,000 average daily traffic (ADT). City Heights CDC initially selected this location due to its visibility to pedestrians, transit riders, and motorists. The multi-modal nature of the Boulevard provided an ideal balance of potential event participants.
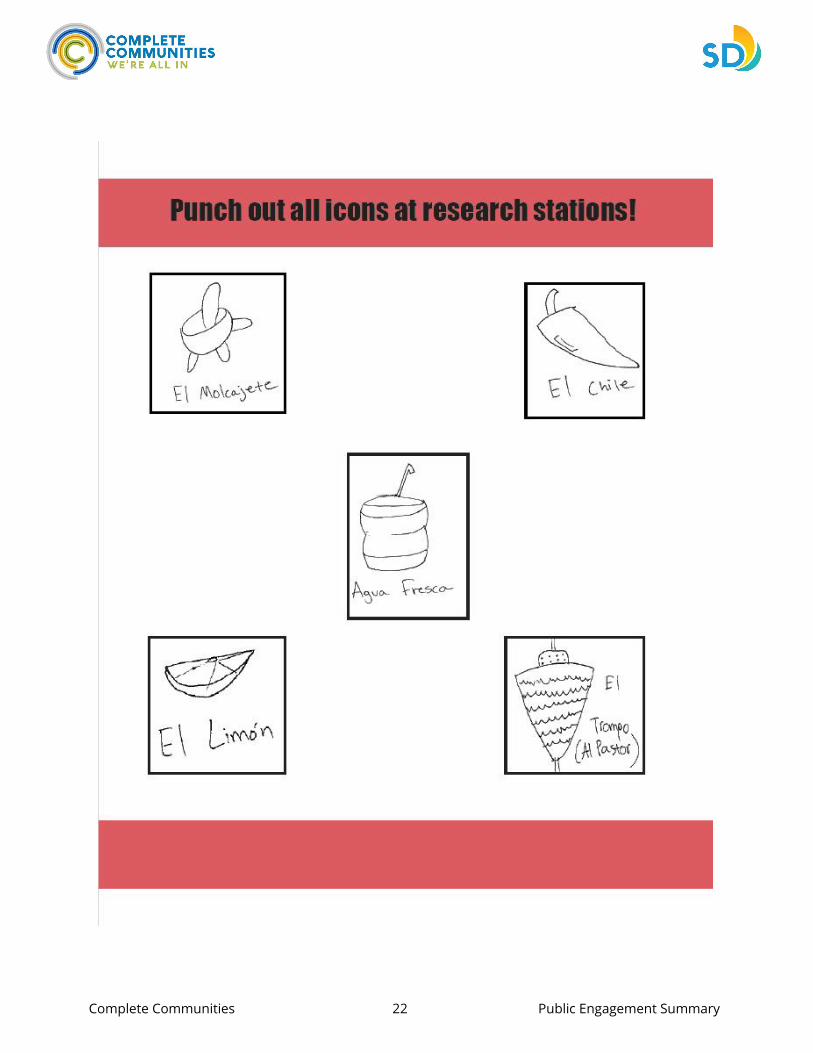
This Transit & Tacos Summer Block Party was composed of four input-gathering stations, two engagement stations, and a space for our local taco vendor: Dos Tierras Chicano Soul Food. City Heights CDC staff and volunteers greeted participants at the southwest entrance, encouraged them to sign-in, handed them the 2019 Transit & Tacos Passbook (Attachment 1) and quickly explained the logistics of the event. Participants were encouraged to visit all five input-gathering and engagement stations in order to receive a total of five stamps (one for each input-gathering station) in order to receive a tacos ticket.
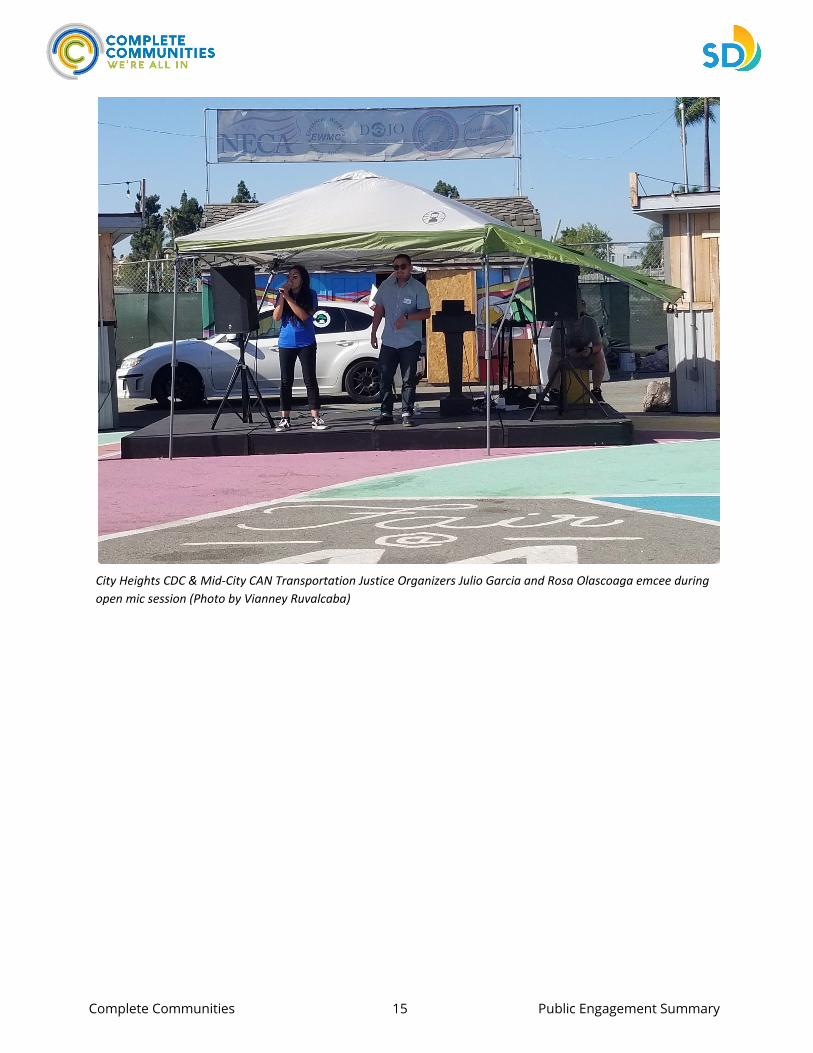
Additionally, Mid-City CAN and City Heights CDC facilitated and emceed an open mic session during the event. During this time, all participants were invited to share their experiences and thoughts related to public transit in any format they wished. Some folks shared spoken word poetry about their personal experiences with public transit, others addressed agency staff directly, and many others shared their thoughts in a free-flowing format.
. Overview of Transit & Tacos Summer Block Party at the Fair@44 (Photo by Vianney Ruvalcaba)
Complete Communities 10 Public Engagement Summary
Input-Gathering and Engagement Stations
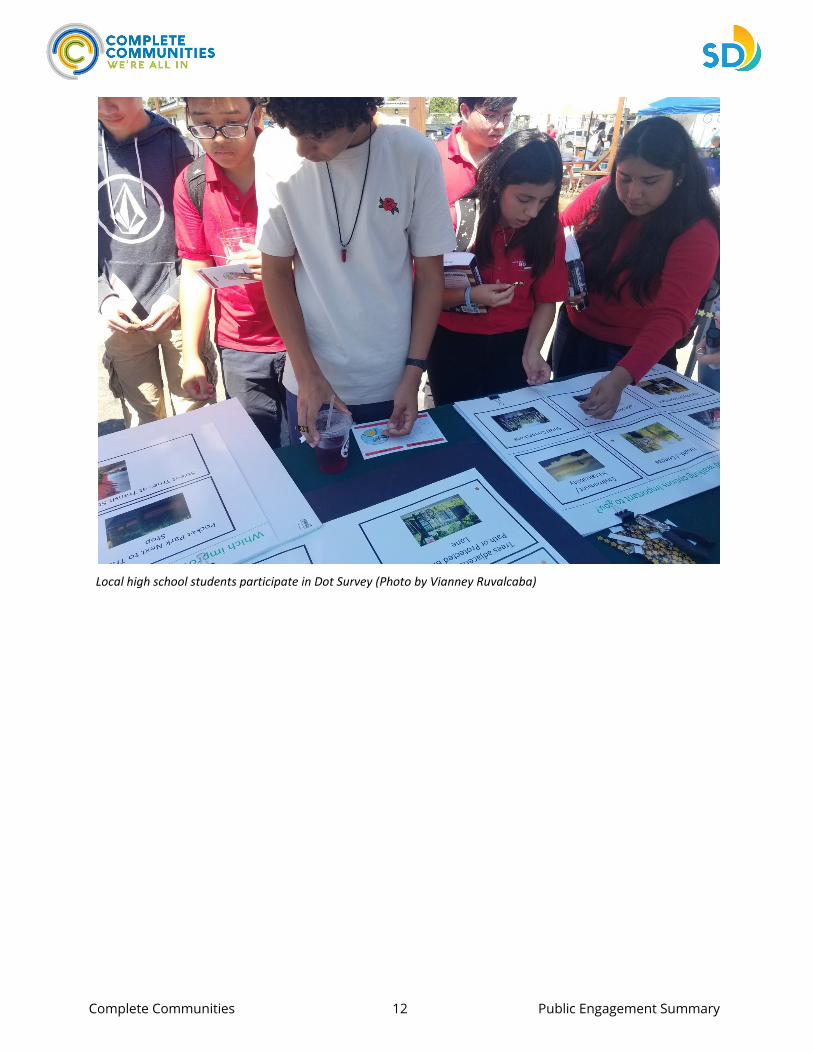
1. City of San Diego Sustainability Dept. Proposed Vehicle Miles Traveled (VMT) Ordinance Dot/Sticker Survey:
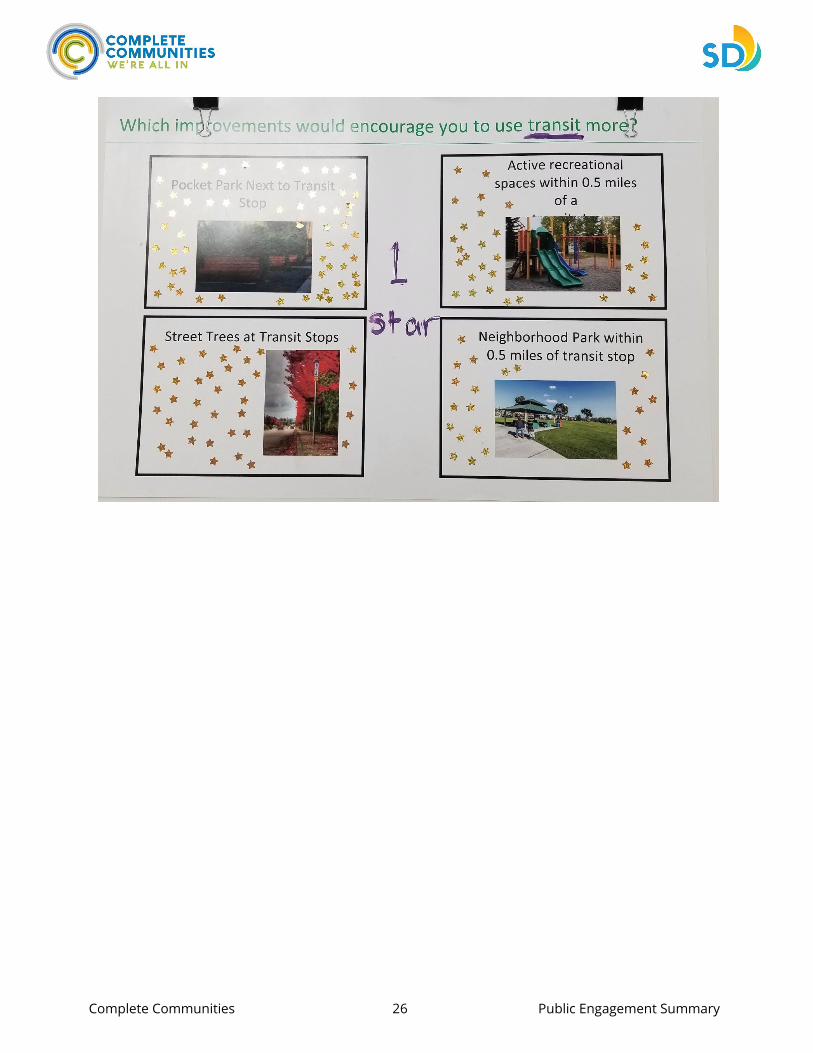
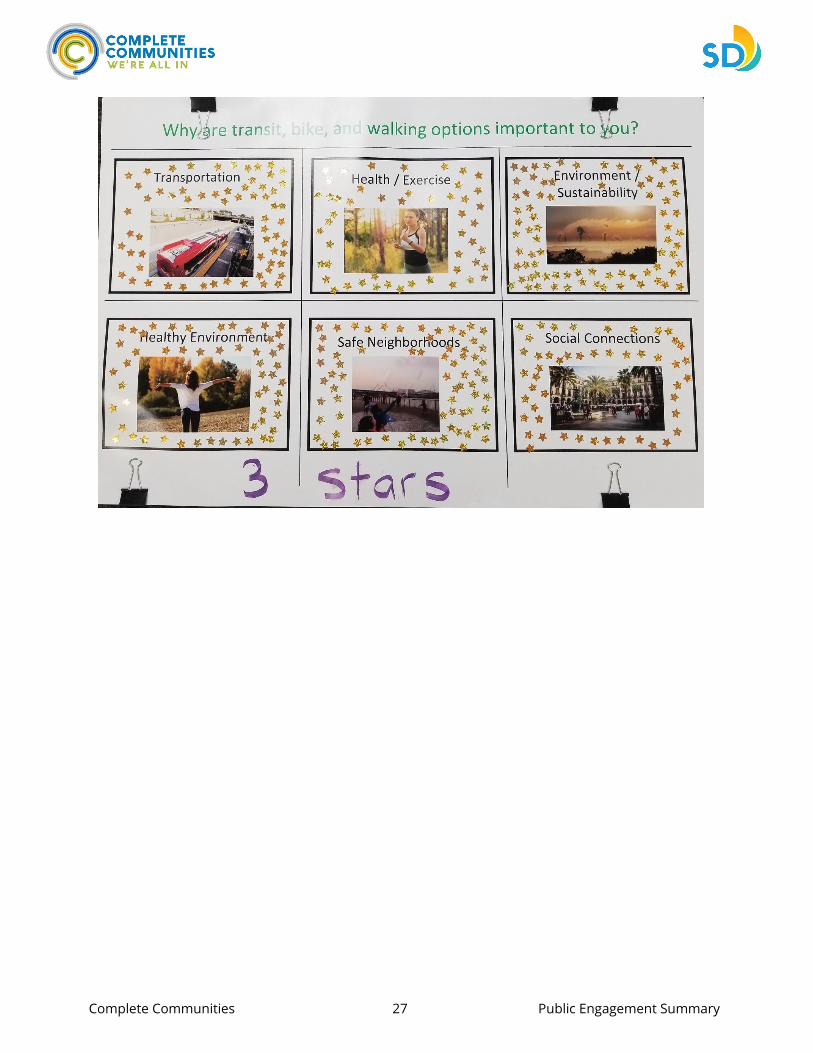
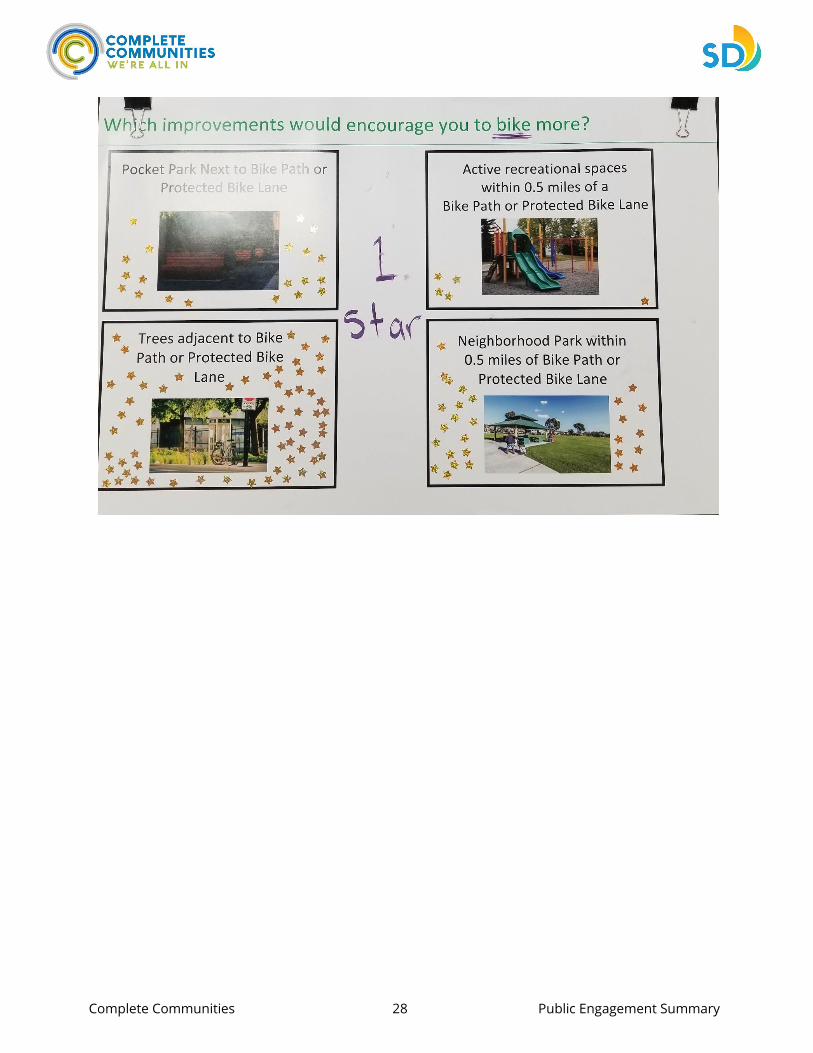
a. City Heights CDC partnered with the City of San Diego’s Sustainability Department to gather public input related to the City’s upcoming VMT ordinance proposal. City staff sought public input on the kinds of values and amenity types most important to City Heights and Mid-City residents as they considered improvements to the City’s active transportation infrastructure. City Heights CDC and City staff developed a Dot Survey (Attachment 2). that asked participants to allocate 5 gold star stickers among a variety of values and amenity-type choices. The values survey asked participants why active transportation choices are important to them (for their opportunities to provide social connections at public spaces, enhanced transportation choices, increased opportunities to exercise and improve personal health, contributions to a cleaner environment and sustainability, and safer neighborhoods due to increased eyes on the street. The amenity-type surveys asked which kinds of amenities would encourage participants to bike and take public transit more often. The choices included pocket parks near transit stops or bike facilities, active recreational spaces (such as playgrounds and sports fields) within 0.5 miles of a transit stop or bike facility, street trees at transit stops or along bike facilities, and neighborhood parks within 0.5 miles of a transit stop of bike facility. Participants were asked to allocate three of their five stickers to the values survey board, and two of their stickers to each of the amenity type survey boards. The results of these surveys are included in the ‘Input’ section below.
2. SANDAG 5 Big Moves Community Portal:
a. City Heights CDC is part of the SANDAG Community-Based Outreach Working Group. Our organization has a contract that includes tasks to conduct outreach for the Regional Transportation Plan (RTP) in City Heights. As part of SANDAG’s effort to share details on the 5 Big Moves vision with communities and groups all over the region, staff and members of the CBO Working Group developed a ‘Community Portal’ display with visuals and text describing the 5 Big Moves concept as part of SANDAG’s bold new vision for our region’s transportation system. The Community Portal has a mix of text and visuals in English and Spanish, and two portions dedicated to comments on what community members are excited and concerned about with regards to the 5 Big Moves vision. City Heights CDC and Nile Sisters Development Initiative (another member of the
Complete Communities 11 Public Engagement Summary
SANDAG CBO Working Group providing services to City Heights residents) staffed the 5 Big Moves Community Portal station and gathered over 50 comments. Nile Sisters and City Heights CDC staff entered the comments collected to the SANDAG CBO Working Group database.
3. San Diego Equity Working Group MTS Projects and Services Survey:
a. City Heights CDC and Mid-City CAN are part of the San Diego Transportation Equity Working Group, which is composed of community-based organizations working on Environmental and Transportation Justice issues. Mid-City CAN and City Heights CDC staff developed a Dot/Sticker where participants could allocate 5 stickers to the public transit projects and service improvements most important to them. The projects were taken from previous advocacy efforts by member organizations of the SDTEWG, last year’s Transit & Tacos block party, and MTS’ ElevateSD 2020 outreach efforts. The results will be used to complement existing Transportation Justice advocacy efforts.
4. MTS ElevateSD 2020 Values Survey:
a. MTS hosted an input-gathering station for their ElevateSD 2020 outreach efforts. City Heights CDC has actively participated in the MTS ElevateSD 2020 public outreach process and assisted the agency with hard to reach public input at pop-up events, public workshops, and other events.
5. Center on Sustainable Energy Engagement Station
a. The Center on Sustainable Energy hosted an engagement station with information on their electric vehicle rebate programs and work with the California Air Resources Board.
6. Bikes Del Pueblo Engagement Station:
a. Bikes del Pueblo hosted an engagement station with information on their educational bike cooperative, including how to get involved and the maintenance education services they provide regularly at several City Heights locations.
Complete Communities 12 Public Engagement Summary
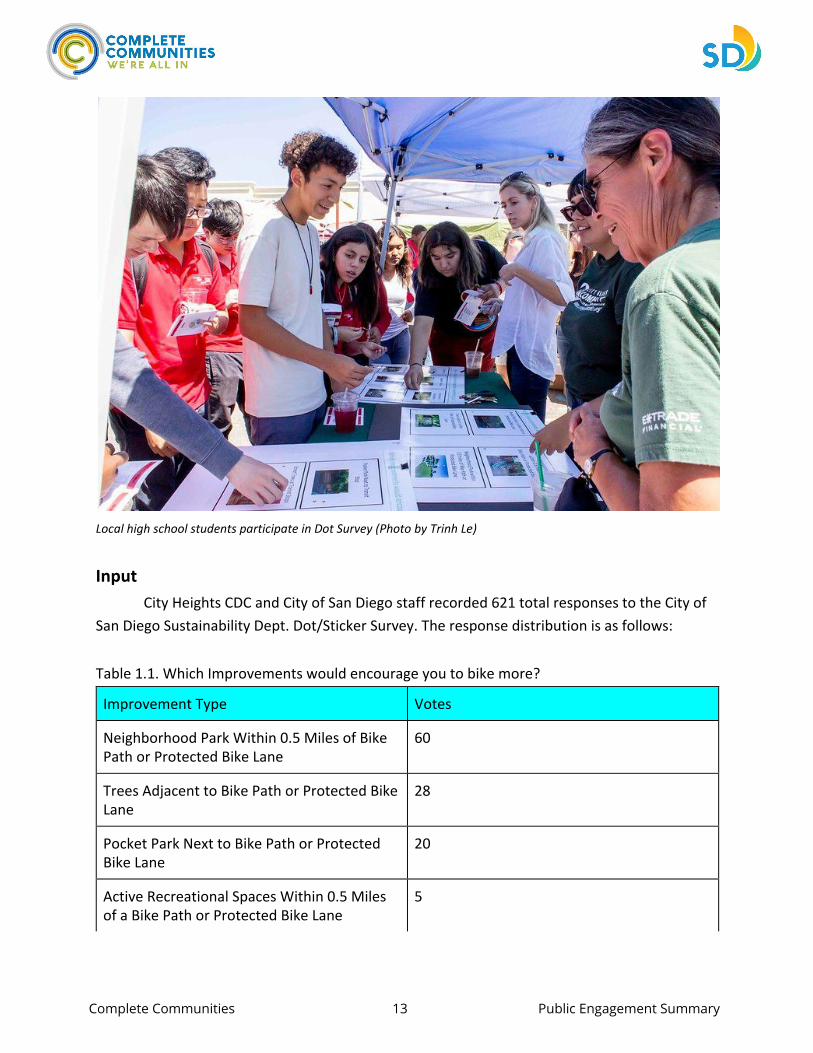
Local high school students participate in Dot Survey (Photo by Vianney Ruvalcaba)
Complete Communities 13 Public Engagement Summary
Local high school students participate in Dot Survey (Photo by Trinh Le)
Input City Heights CDC and City of San Diego staff recorded 621 total responses to the City of
San Diego Sustainability Dept. Dot/Sticker Survey. The response distribution is as follows:
Table 1.1. Which Improvements would encourage you to bike more?
Improvement Type Votes
Neighborhood Park Within 0.5 Miles of Bike Path or Protected Bike Lane
60
Trees Adjacent to Bike Path or Protected Bike Lane
28
Pocket Park Next to Bike Path or Protected Bike Lane
20
Active Recreational Spaces Within 0.5 Miles of a Bike Path or Protected Bike Lane
5
Complete Communities 14 Public Engagement Summary
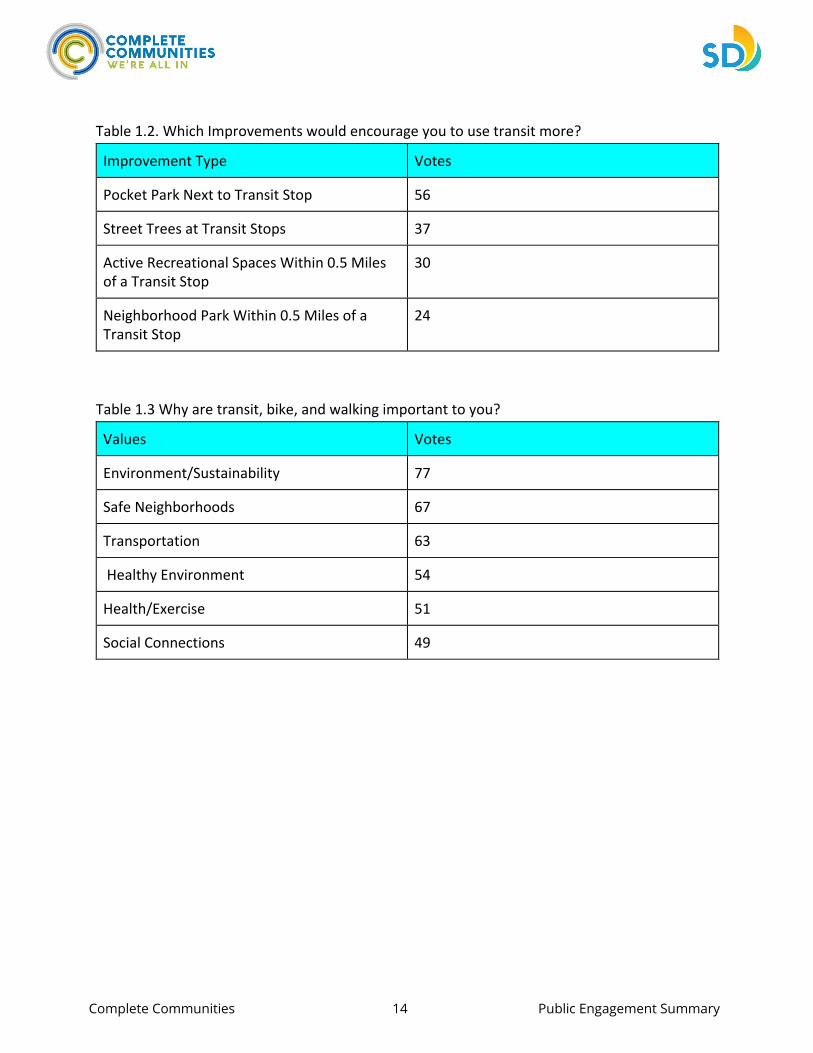
Table 1.2. Which Improvements would encourage you to use transit more?
Improvement Type Votes
Pocket Park Next to Transit Stop 56
Street Trees at Transit Stops 37
Active Recreational Spaces Within 0.5 Miles of a Transit Stop
30
Neighborhood Park Within 0.5 Miles of a Transit Stop
24
Table 1.3 Why are transit, bike, and walking important to you?
Values Votes
Environment/Sustainability 77
Safe Neighborhoods 67
Transportation 63
Healthy Environment 54
Health/Exercise 51
Social Connections 49
Complete Communities 15 Public Engagement Summary
City Heights CDC & Mid-City CAN Transportation Justice Organizers Julio Garcia and Rosa Olascoaga emcee during open mic session (Photo by Vianney Ruvalcaba)
Complete Communities 16 Public Engagement Summary
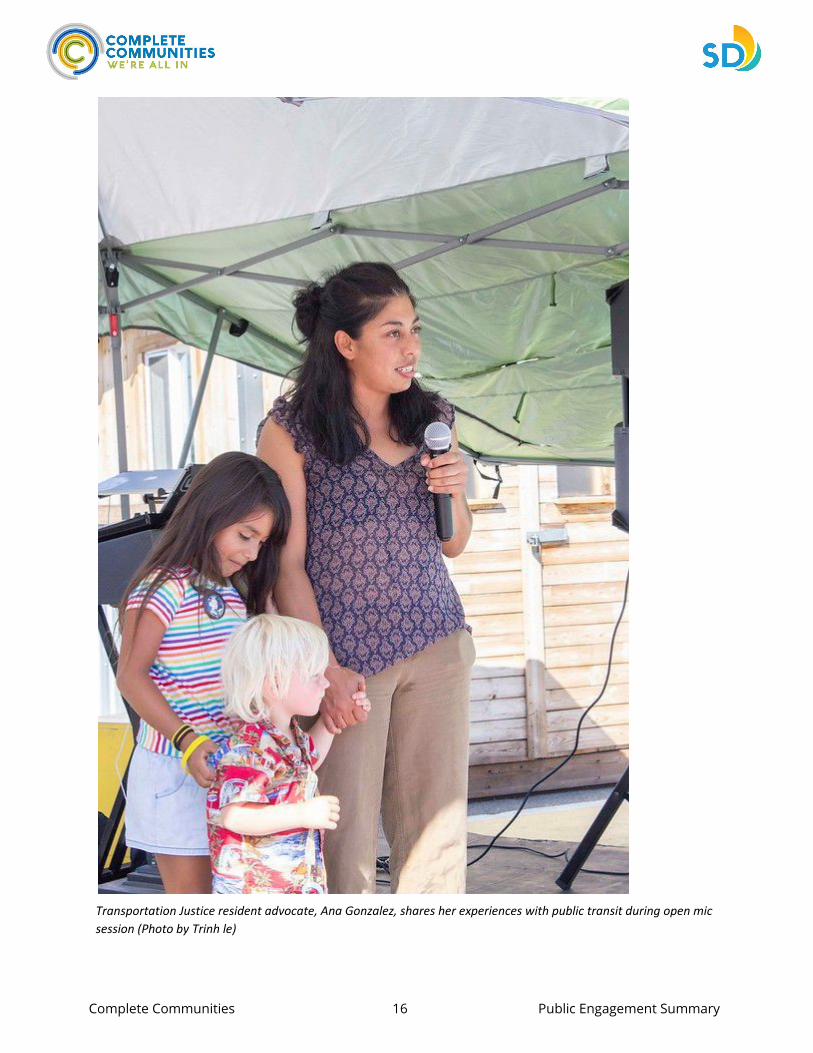
Transportation Justice resident advocate, Ana Gonzalez, shares her experiences with public transit during open mic session (Photo by Trinh le)
Complete Communities 17 Public Engagement Summary
Insights
Table 1.1 indicates that having a neighborhood park within 0.5 of a bike path or facility would encourage respondents to bike the most out of all the amenities listed. Table 1.2 indicates that having a pocket park next to a transit stop would encourage respondents to use transit the most out of all the amenities listed. Table 1.2 indicated that the environment and sustainability are the most important reasons for taking transit, biking, and walking.
Additionally, the SANDAG 5 Big Moves community portal comments revealed an overall positive sentiment among community members for the 5 Big Moves concept. Some of the concerns voiced by residents centered around the Next OS concept, since seniors, people with visual disabilities, and people who do not have access to bank accounts felt insecure about their access to the whole system once cutting edge technology begins to roll out. Many comments voiced their dissatisfaction with the current public transportation system in terms of safety, reliability, and time and express their enthusiasm for a transformation in the way we move across the region.
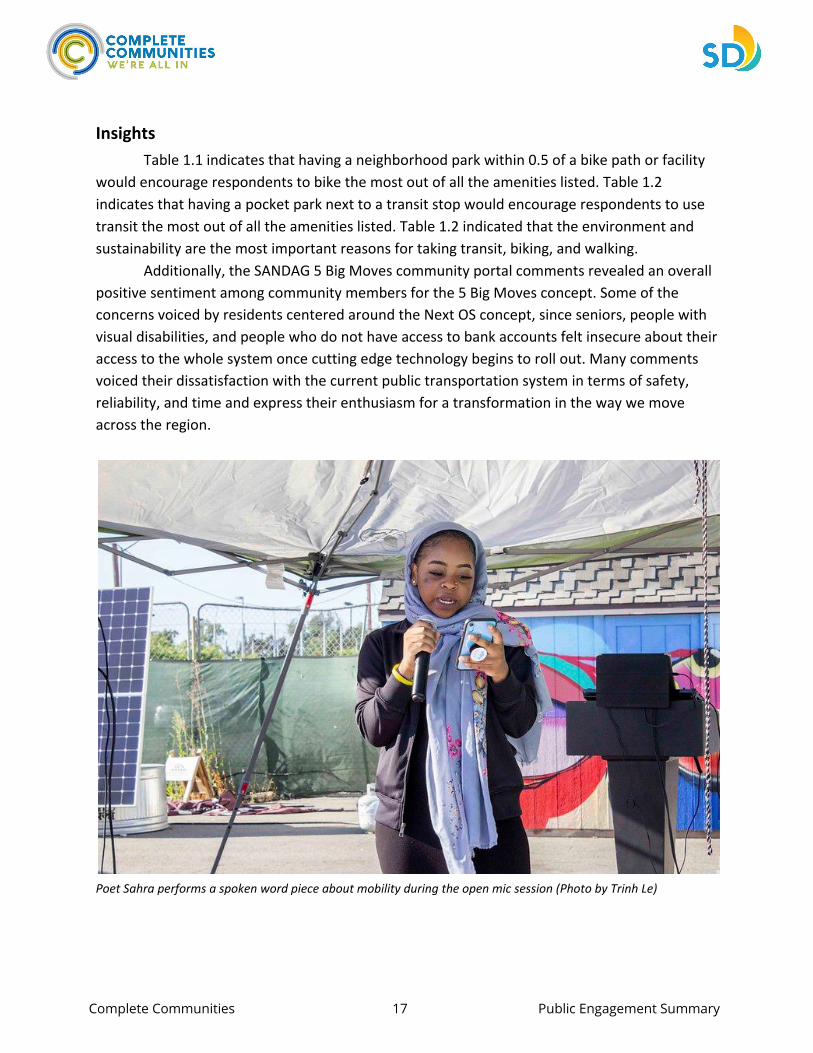
Poet Sahra performs a spoken word piece about mobility during the open mic session (Photo by Trinh Le)
Complete Communities 18 Public Engagement Summary
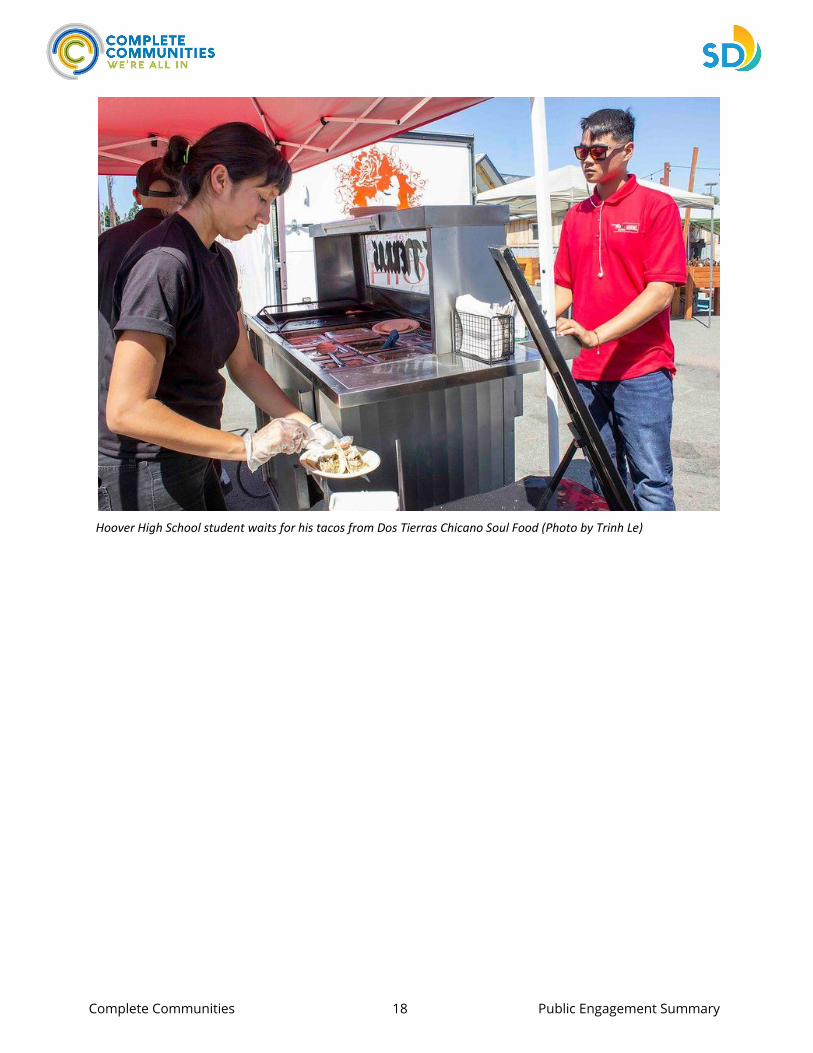
Hoover High School student waits for his tacos from Dos Tierras Chicano Soul Food (Photo by Trinh Le)
Complete Communities 19 Public Engagement Summary
Contacts:
Randolph Torres-Van Vleck Senior Program Manager - Transportation & Planning [email protected]
Vianney A. Ruvalcaba Program Coordinator -Transportation & Planning [email protected]

Complete Communities 20 Public Engagement Summary
Attachment 1: Transit & Tacos 2019 Passbook
Complete Communities 21 Public Engagement Summary
Complete Communities 22 Public Engagement Summary
Complete Communities 23 Public Engagement Summary
Complete Communities 24 Public Engagement Summary
Complete Communities 25 Public Engagement Summary
Attachment 2: Transit & Tacos 2019 Dot Survey
Complete Communities 26 Public Engagement Summary
Complete Communities 27 Public Engagement Summary
Complete Communities 28 Public Engagement Summary
Complete Communities 29 Public Engagement Summary
3. Complete Communities Online Engagement Tool Screenshots
Complete Communities 30 Public Engagement Summary
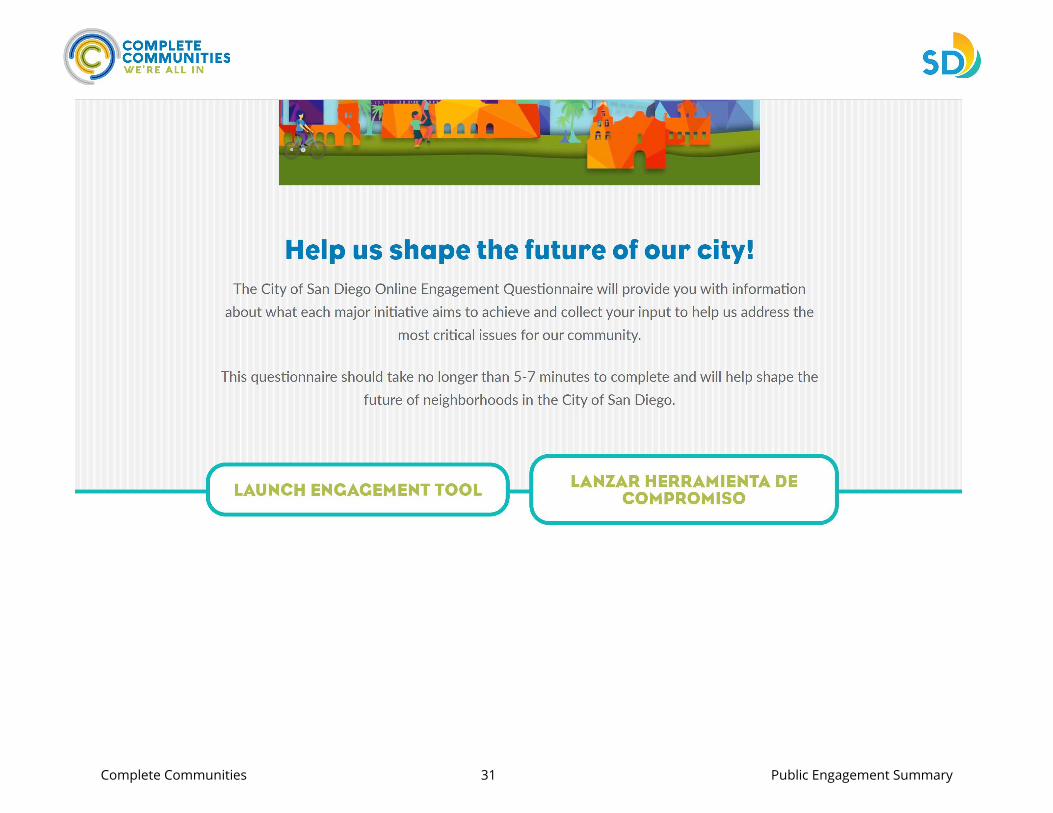
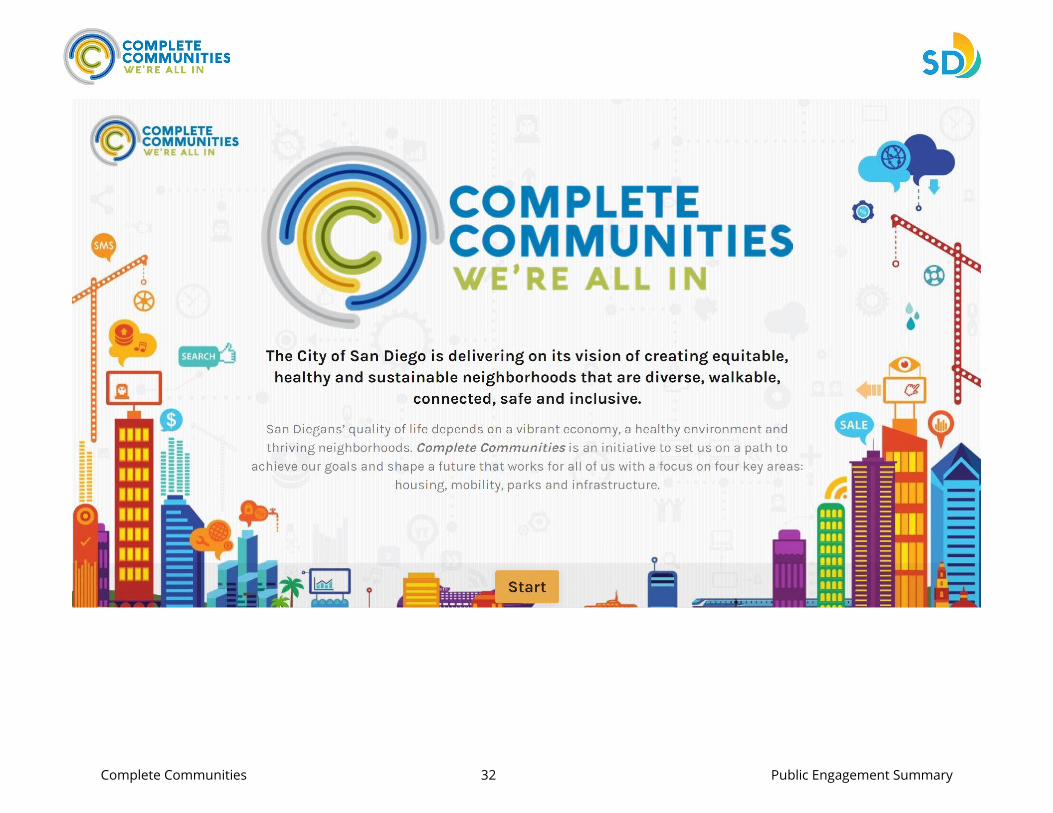
Complete Communities Online Engagement Tool – Sample Screenshots
Complete Communities 31 Public Engagement Summary
Complete Communities 32 Public Engagement Summary
Complete Communities 33 Public Engagement Summary
Complete Communities 34 Public Engagement Summary

Complete Communities 35 Public Engagement Summary
4. Complete Communities Online Engagement Tool Survey Results
Complete Communities 36 Public Engagement Summary
Complete Communities Engagement Tool Results
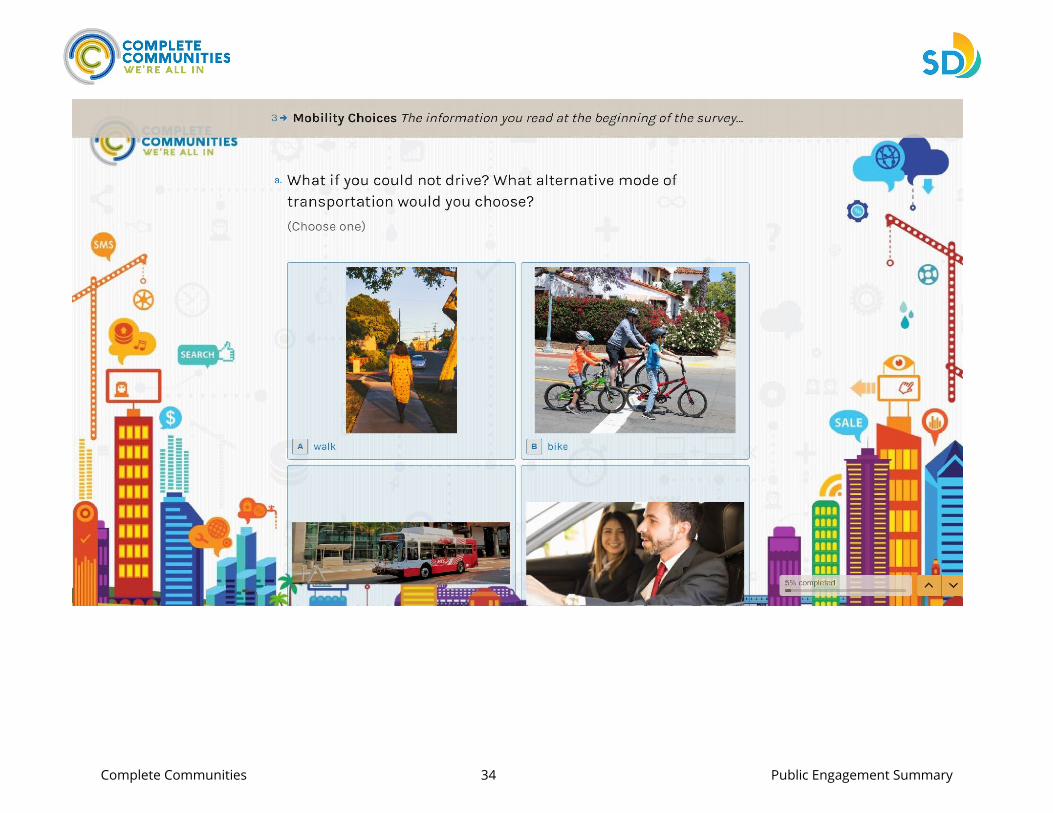
The City of San Diego’s Planning Department launched a website in December 2019 to provide information and context about the City’s proposed Complete Communities initiatives. The main benefits and requirements of each initiative—Housing Solutions, Mobility Choices, Play Everywhere, and Infrastructure Now—were included on the website. The website also featured an engagement tool, which was an informative and interactive survey that asked respondents to indicate which initiative was the most important to them and guided them through four sets of questions pertaining to the state of housing, active transportation, parks, and other infrastructure in the City and their neighborhoods.
The City advertised the website and engagement tool on social media and a media article included a link to the website in May 2020. There were 274 unique respondents to the engagement tool. Individuals who took the survey self-selected to participate, meaning they sought to communicate their opinions and ideas about the proposed initiatives to the Planning Department. The survey does not capture a representative sample of a cross-section of San Diego residents, so it is not statistically valid. The results are indicative of what a small group of individuals who are interested in Planning Department initiatives felt about the Complete Communities initiatives between December 2019 and June 2020.
List of Engagement Tool Questions
• Introduction o In your neighborhood, what is the most needed component of Complete Communities?
• Housing
o Rank what you think are the top two reasons behind the housing crisis in your neighborhood.
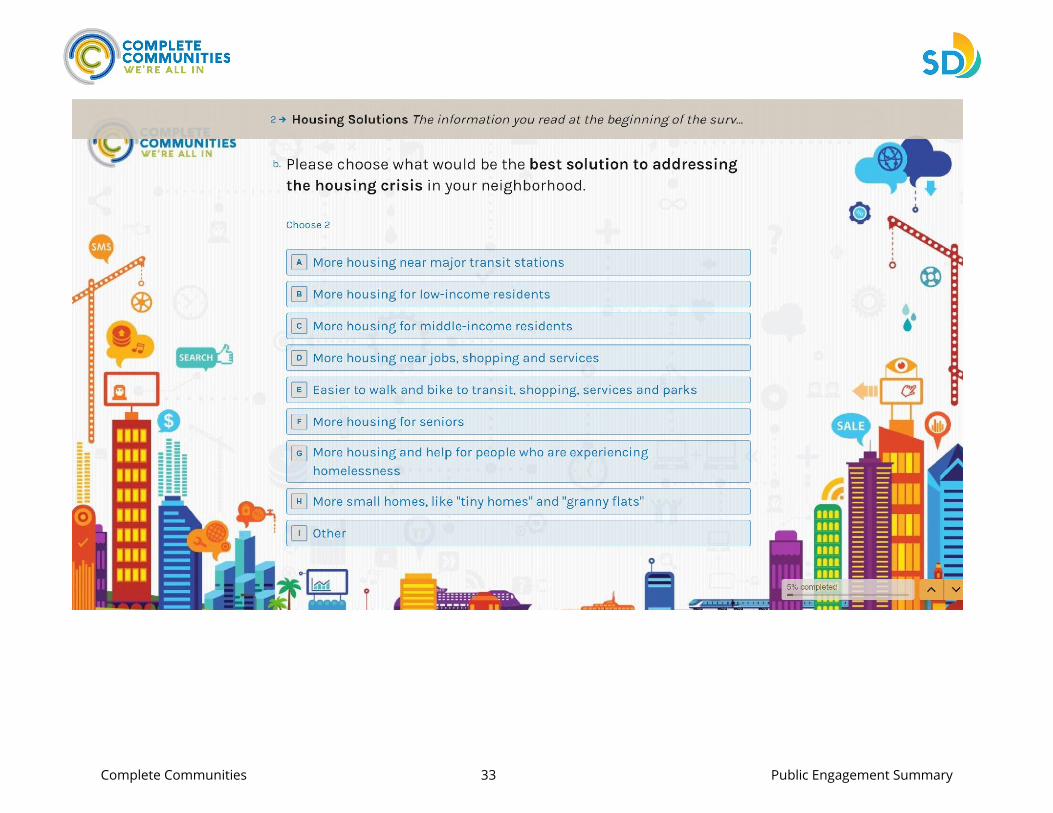
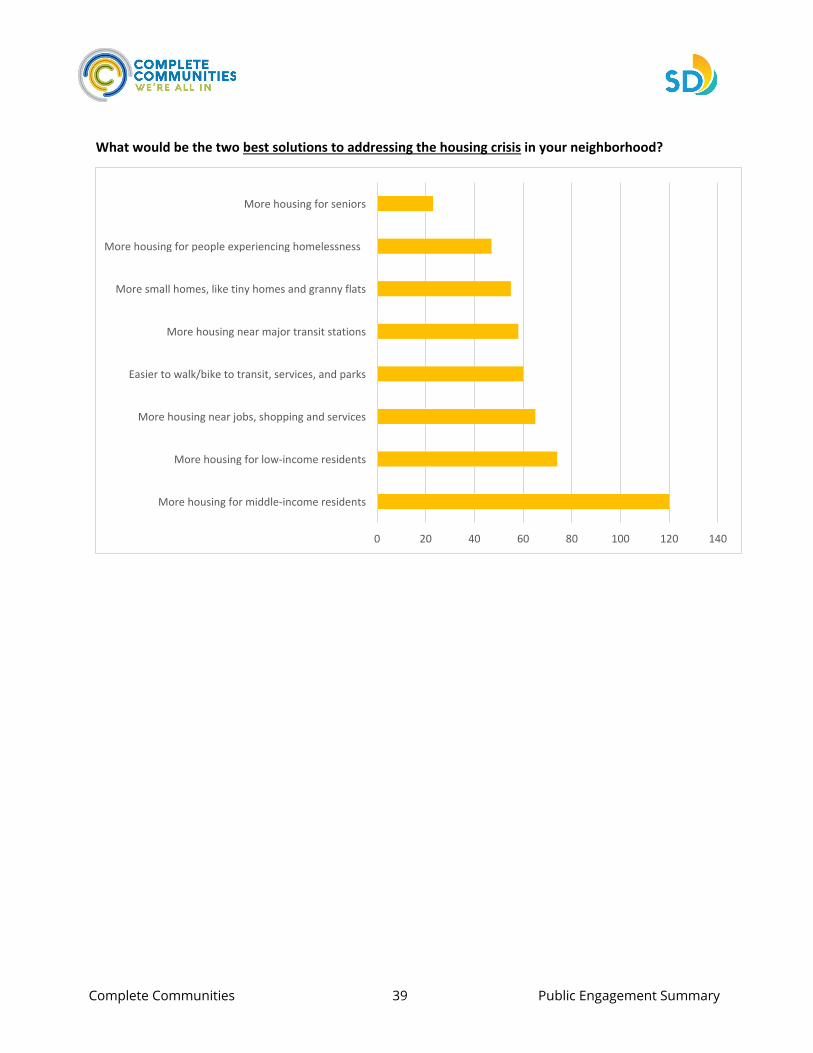
o What would be the two best solutions to addressing the housing crisis in your neighborhood?
• Mobility
o What if you could not drive? What alternative mode would you choose? o What types of improvements would you like to see to help you bike? o What types of improvements would you like to see to help you take public transit? o What types of improvements would you like to see to help you walk? o What types of improvements would you like to see to help you rideshare? o If we made the improvements you chose, where would be the top locations for
development in your neighborhood?
Complete Communities 37 Public Engagement Summary
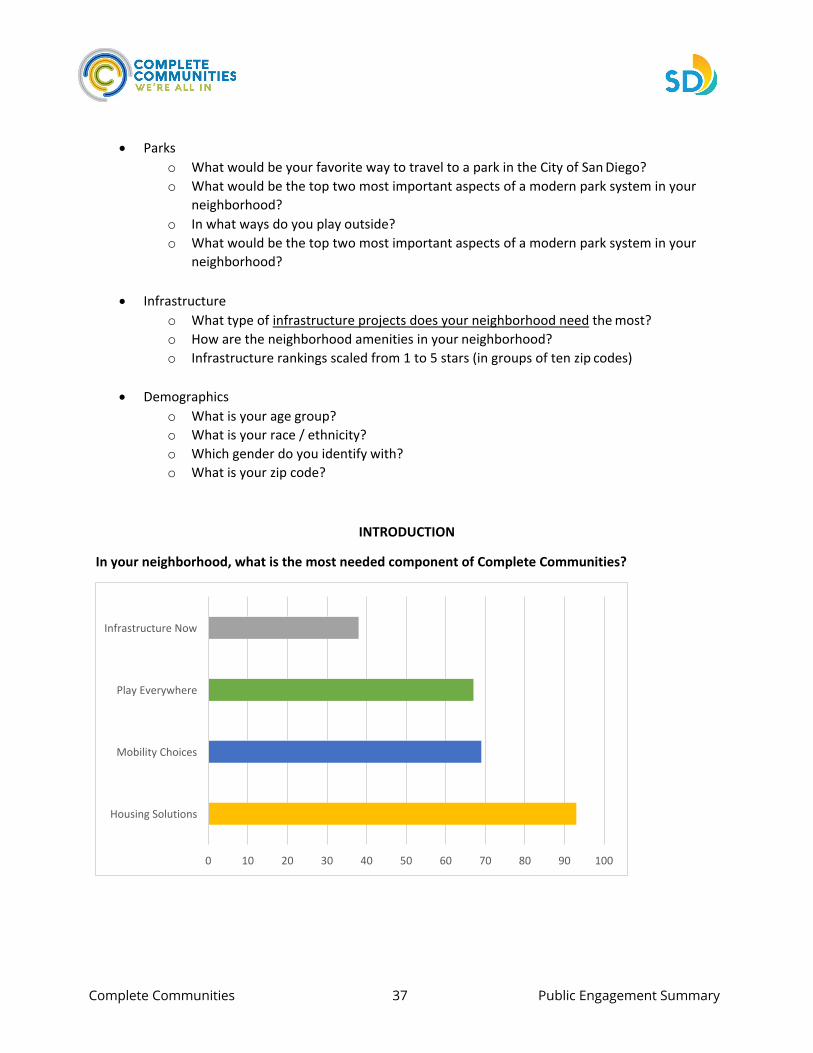
Infrastructure Now
Play Everywhere
Mobility Choices
Housing Solutions
0 10 20 30 40 50 60 70 80 90 100
• Parks o What would be your favorite way to travel to a park in the City of San Diego? o What would be the top two most important aspects of a modern park system in your
neighborhood? o In what ways do you play outside? o What would be the top two most important aspects of a modern park system in your
neighborhood?
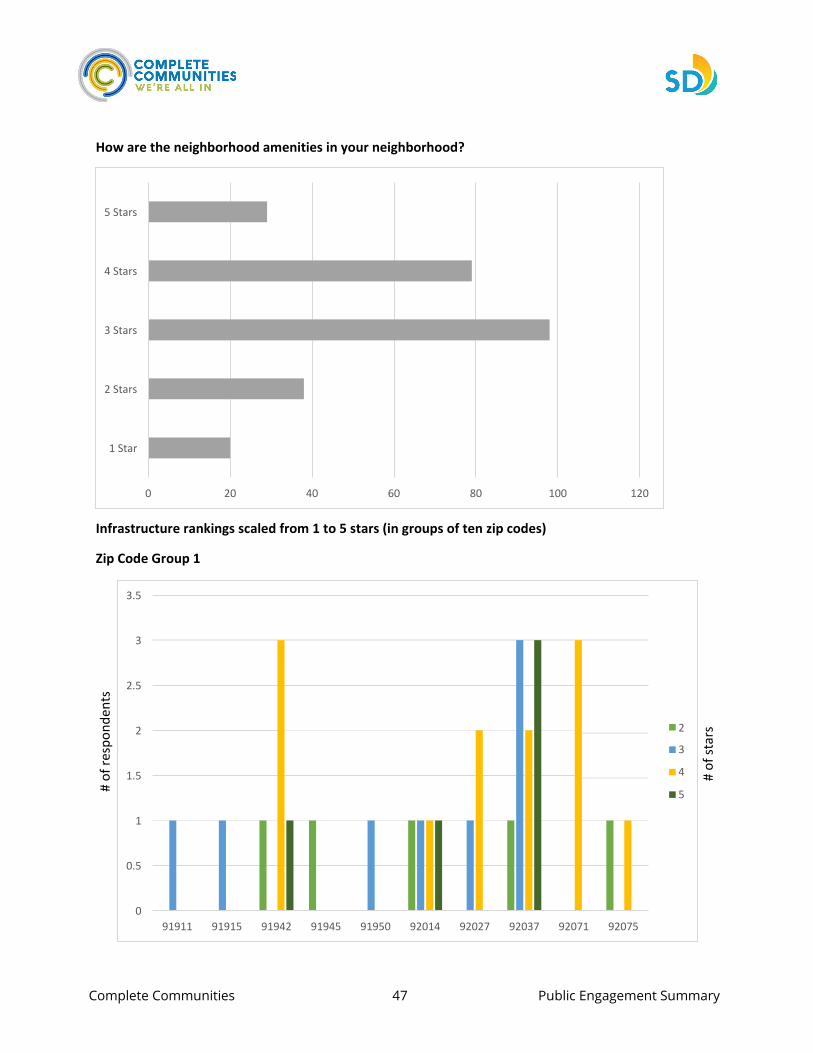
• Infrastructure o What type of infrastructure projects does your neighborhood need the most? o How are the neighborhood amenities in your neighborhood? o Infrastructure rankings scaled from 1 to 5 stars (in groups of ten zip codes)
• Demographics
o What is your age group? o What is your race / ethnicity? o Which gender do you identify with? o What is your zip code?
INTRODUCTION
In your neighborhood, what is the most needed component of Complete Communities?
Complete Communities 38 Public Engagement Summary
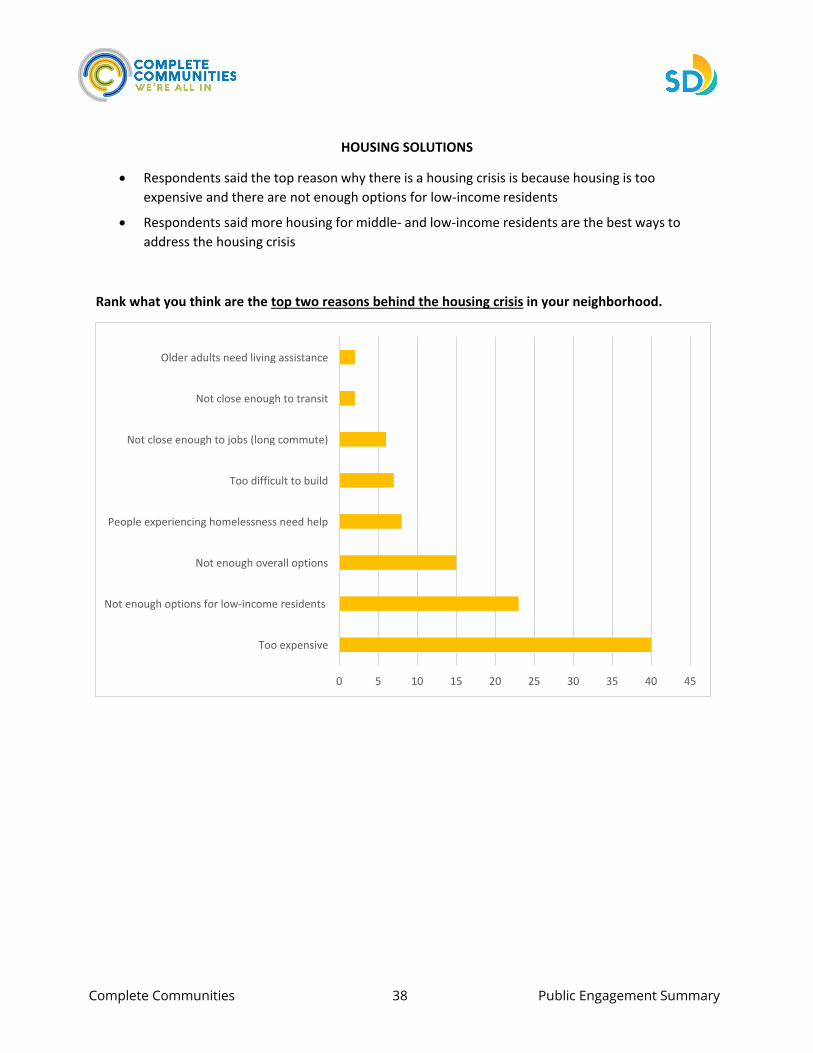
Older adults need living assistance
Not close enough to transit
Not close enough to jobs (long commute)
Too difficult to build
People experiencing homelessness need help
Not enough overall options
Not enough options for low-income residents
Too expensive
0 5 10 15 20 25 30 35 40 45
HOUSING SOLUTIONS
• Respondents said the top reason why there is a housing crisis is because housing is too expensive and there are not enough options for low-income residents
• Respondents said more housing for middle- and low-income residents are the best ways to address the housing crisis
Rank what you think are the top two reasons behind the housing crisis in your neighborhood.
Complete Communities 39 Public Engagement Summary
More housing for seniors
More housing for people experiencing homelessness
More small homes, like tiny homes and granny flats
More housing near major transit stations
Easier to walk/bike to transit, services, and parks
More housing near jobs, shopping and services
More housing for low-income residents
More housing for middle-income residents
0 20 40 60 80 100 120 140
What would be the two best solutions to addressing the housing crisis in your neighborhood?
Complete Communities 40 Public Engagement Summary
80
70
60
50
40
30
20
10
0 Bike Take Public Transit Walk Rideshare
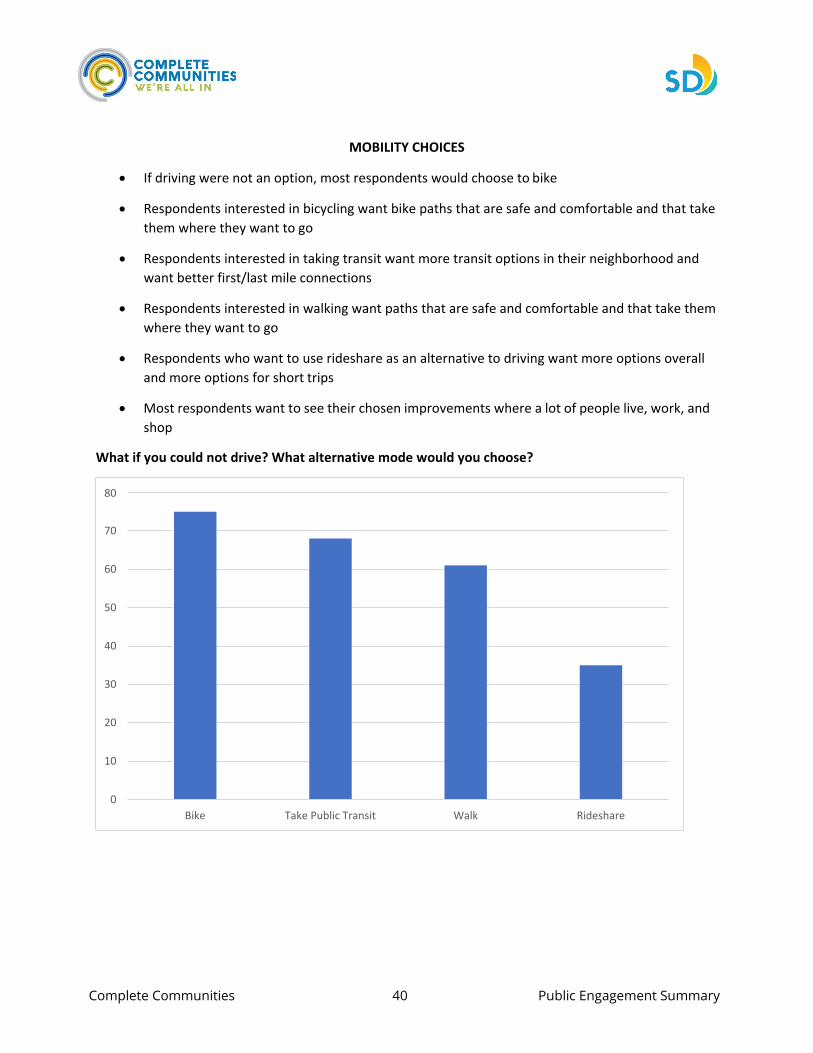
MOBILITY CHOICES
• If driving were not an option, most respondents would choose to bike
• Respondents interested in bicycling want bike paths that are safe and comfortable and that take them where they want to go
• Respondents interested in taking transit want more transit options in their neighborhood and want better first/last mile connections
• Respondents interested in walking want paths that are safe and comfortable and that take them where they want to go
• Respondents who want to use rideshare as an alternative to driving want more options overall and more options for short trips
• Most respondents want to see their chosen improvements where a lot of people live, work, and shop
What if you could not drive? What alternative mode would you choose?
Complete Communities 41 Public Engagement Summary
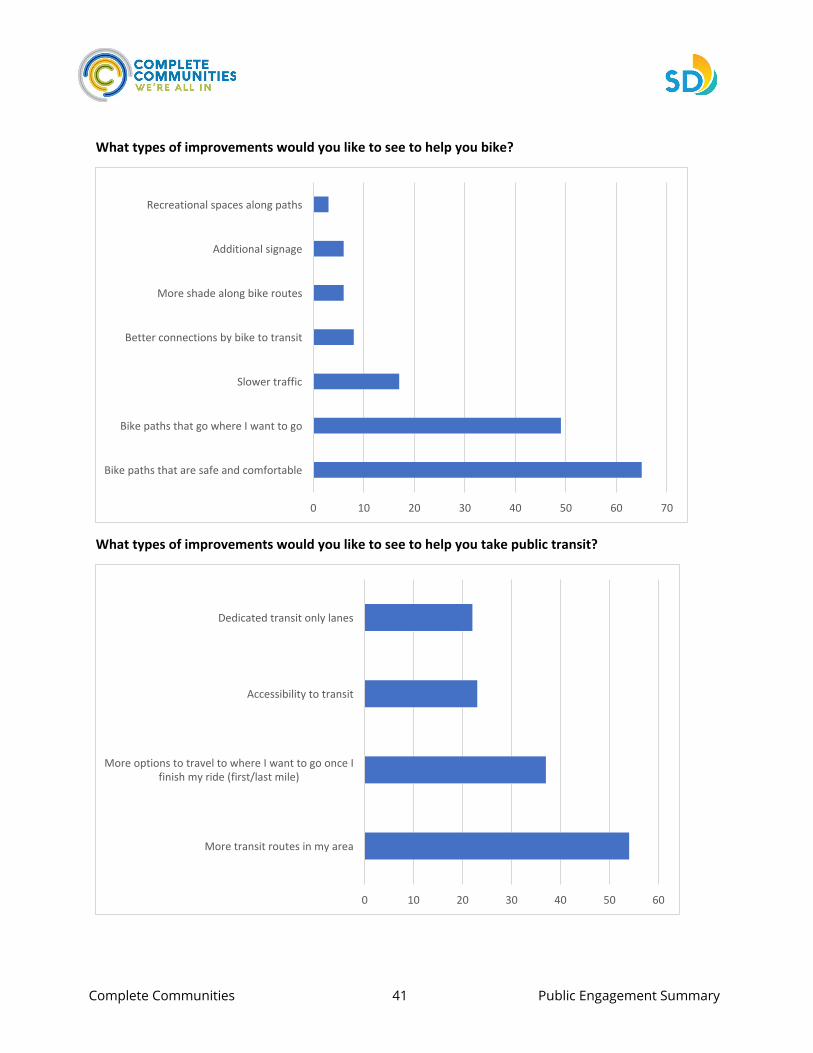
Recreational spaces along paths
Additional signage
More shade along bike routes
Better connections by bike to transit
Slower traffic
Bike paths that go where I want to go
Bike paths that are safe and comfortable
0 10 20 30 40 50 60 70
Dedicated transit only lanes
Accessibility to transit
More options to travel to where I want to go once I finish my ride (first/last mile)
More transit routes in my area
0 10 20 30 40 50 60
What types of improvements would you like to see to help you bike?
What types of improvements would you like to see to help you take public transit?
Complete Communities 42 Public Engagement Summary
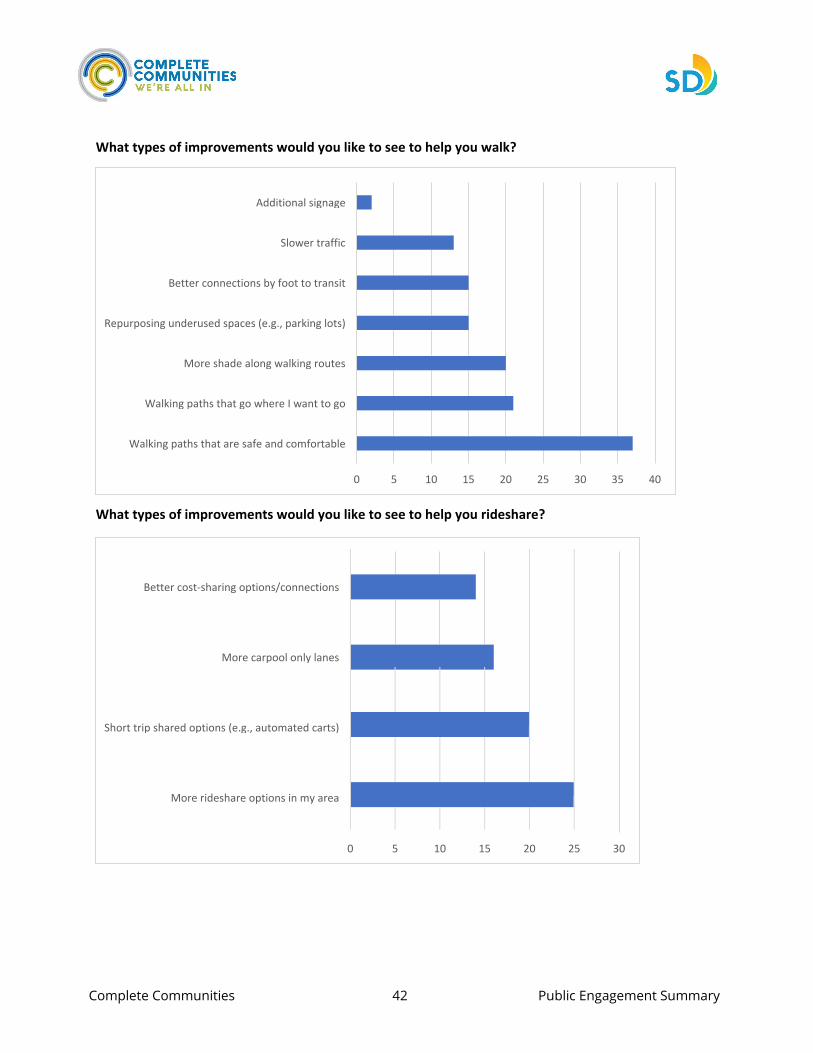
Better cost-sharing options/connections
More carpool only lanes
Short trip shared options (e.g., automated carts)
More rideshare options in my area
0 5 10 15 20 25 30
Additional signage
Slower traffic
Better connections by foot to transit
Repurposing underused spaces (e.g., parking lots)
More shade along walking routes
Walking paths that go where I want to go
Walking paths that are safe and comfortable
0 5 10 15 20 25 30 35 40
What types of improvements would you like to see to help you walk?
What types of improvements would you like to see to help you rideshare?
Complete Communities 43 Public Engagement Summary
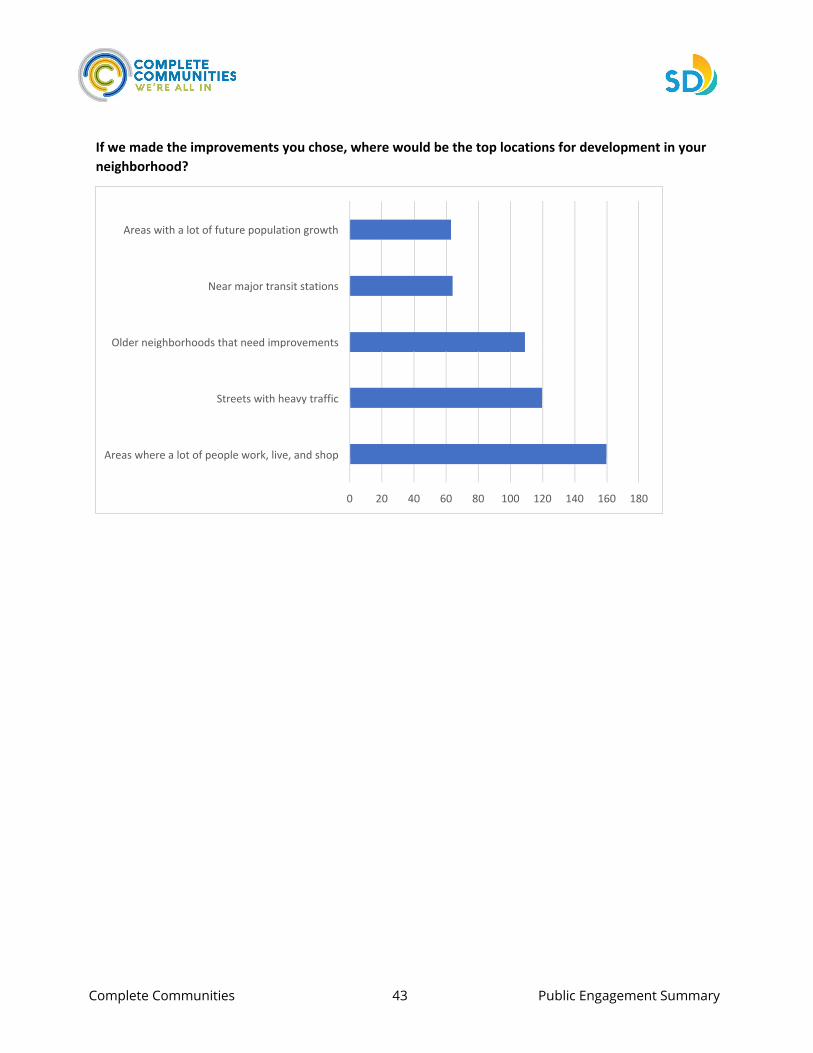
Areas with a lot of future population growth
Near major transit stations
Older neighborhoods that need improvements
Streets with heavy traffic
Areas where a lot of people work, live, and shop
0 20 40 60 80 100 120 140 160 180
If we made the improvements you chose, where would be the top locations for development in your neighborhood?
Complete Communities 44 Public Engagement Summary
Public
Scooter I Don't Know 2% 2%
Rideshare 1%
Transportation 7%
Walking 42%
Private Vehicle 22%
Biking 24%
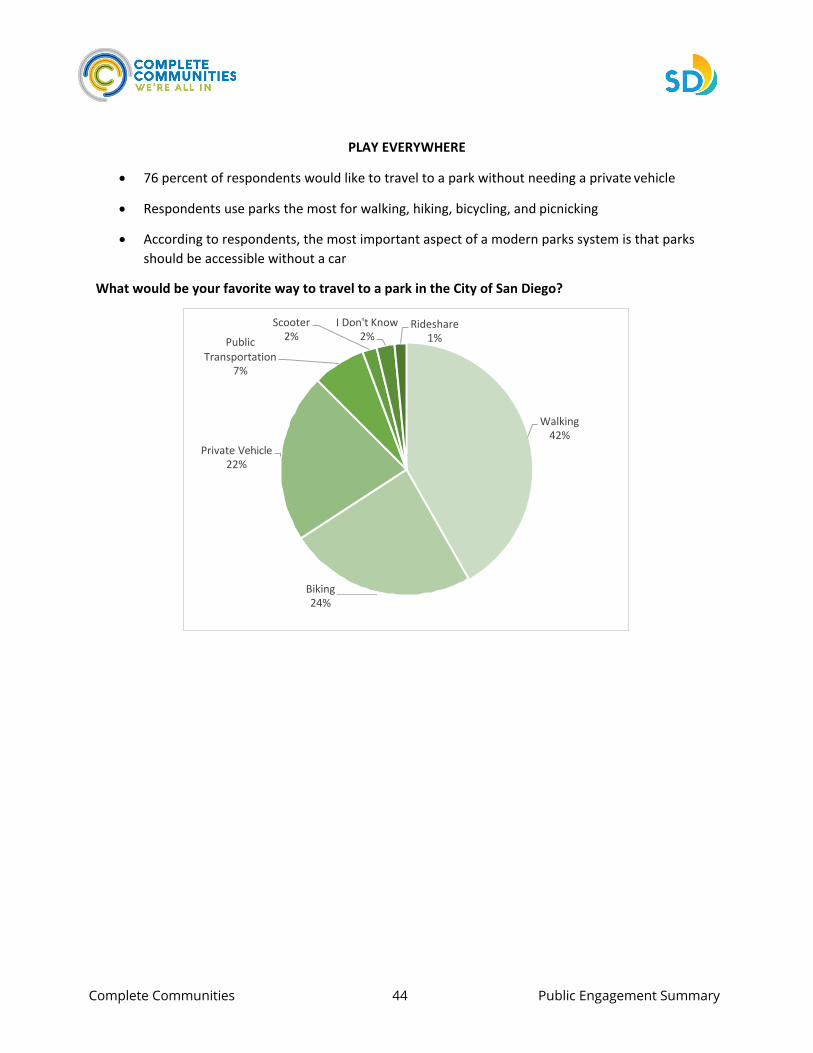
PLAY EVERYWHERE
• 76 percent of respondents would like to travel to a park without needing a private vehicle
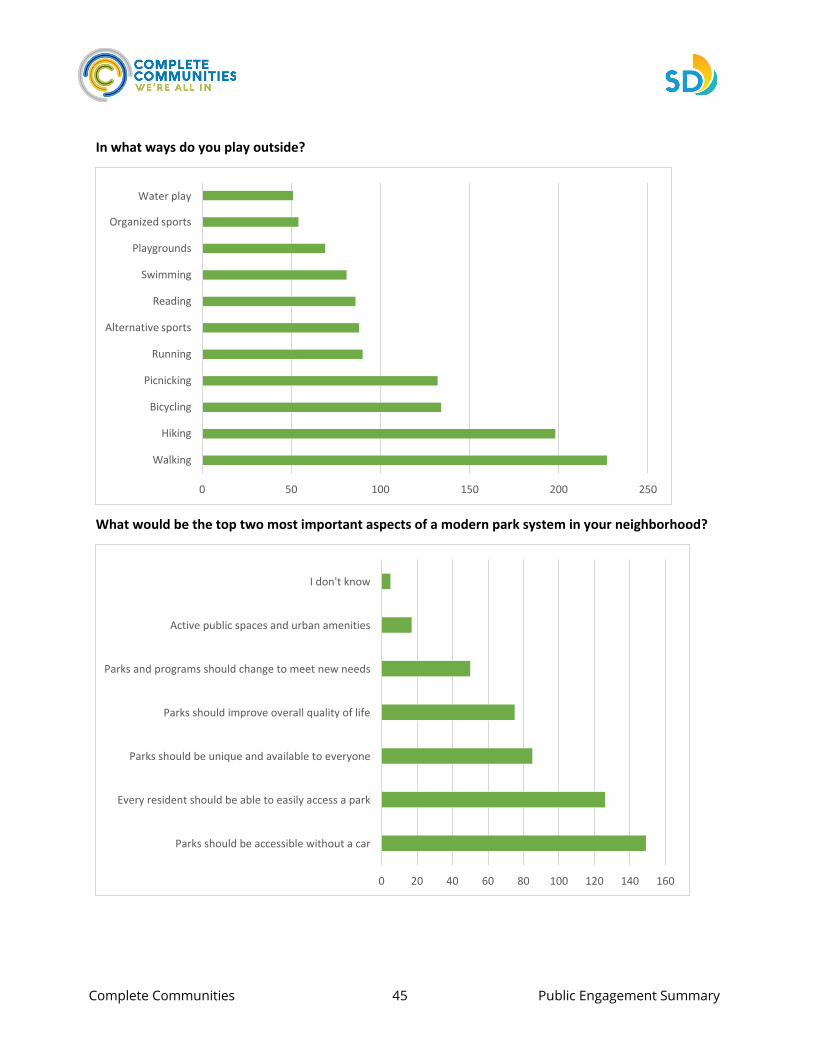
• Respondents use parks the most for walking, hiking, bicycling, and picnicking
• According to respondents, the most important aspect of a modern parks system is that parks should be accessible without a car
What would be your favorite way to travel to a park in the City of San Diego?
Complete Communities 45 Public Engagement Summary
Water play Organized sports
Playgrounds
Swimming
Reading
Alternative sports
Running
Picnicking
Bicycling
Hiking
Walking
0 50 100 150 200 250
I don't know
Active public spaces and urban amenities
Parks and programs should change to meet new needs
Parks should improve overall quality of life
Parks should be unique and available to everyone
Every resident should be able to easily access a park
Parks should be accessible without a car
0 20 40 60 80 100 120 140 160
In what ways do you play outside?
What would be the top two most important aspects of a modern park system in your neighborhood?
Complete Communities 46 Public Engagement Summary
Better signage for walk/bike routes
More accessible walkways/paths
More recreation facilities
Neighborhood facilities (fire stations, libraries, etc.)
Smaller neighborhood projects (plazas, pocket parks)
0 10 20 30 40 50 60 70 80 90 100
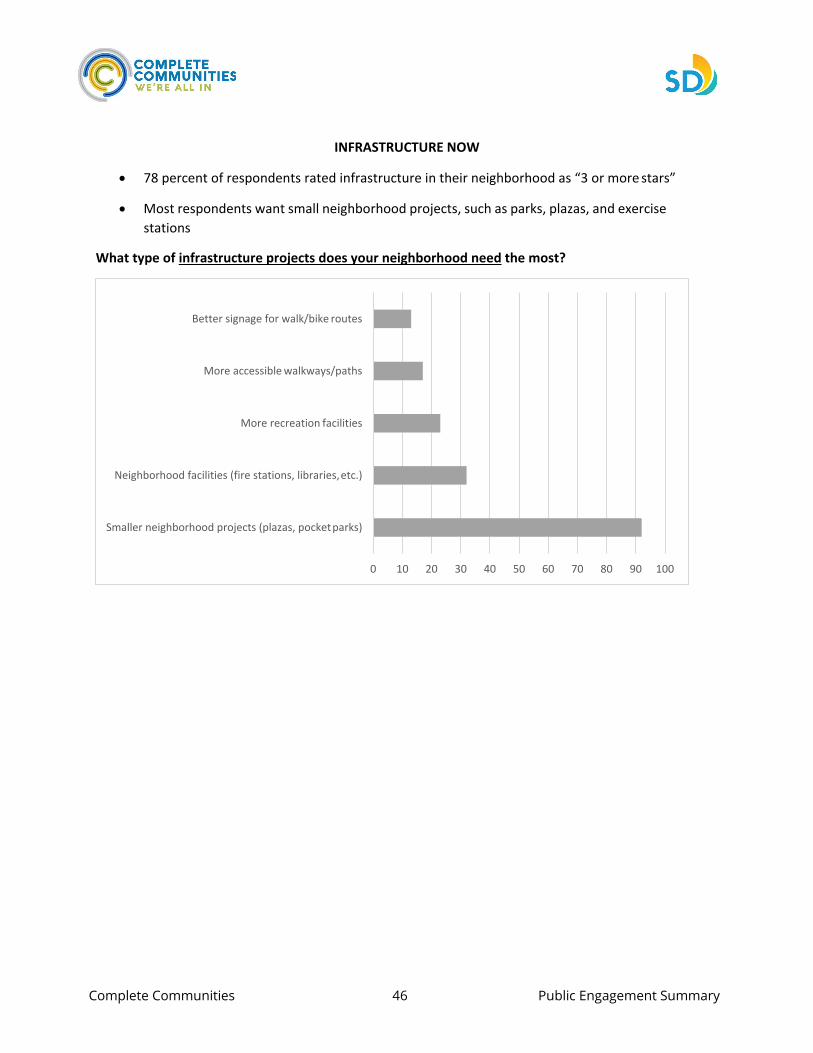
INFRASTRUCTURE NOW
• 78 percent of respondents rated infrastructure in their neighborhood as “3 or more stars”
• Most respondents want small neighborhood projects, such as parks, plazas, and exercise stations
What type of infrastructure projects does your neighborhood need the most?
Complete Communities 47 Public Engagement Summary
5 Stars
4 Stars
3 Stars
2 Stars
1 Star
0 20 40 60 80 100 120
How are the neighborhood amenities in your neighborhood?
Infrastructure rankings scaled from 1 to 5 stars (in groups of ten zip codes)
Zip Code Group 1
3.5
3
2.5
2
1.5
2
3
4
5
1
0.5
0 91911 91915 91942 91945 91950 92014 92027 92037 92071 92075
# of
resp
onde
nts
# of
star
s
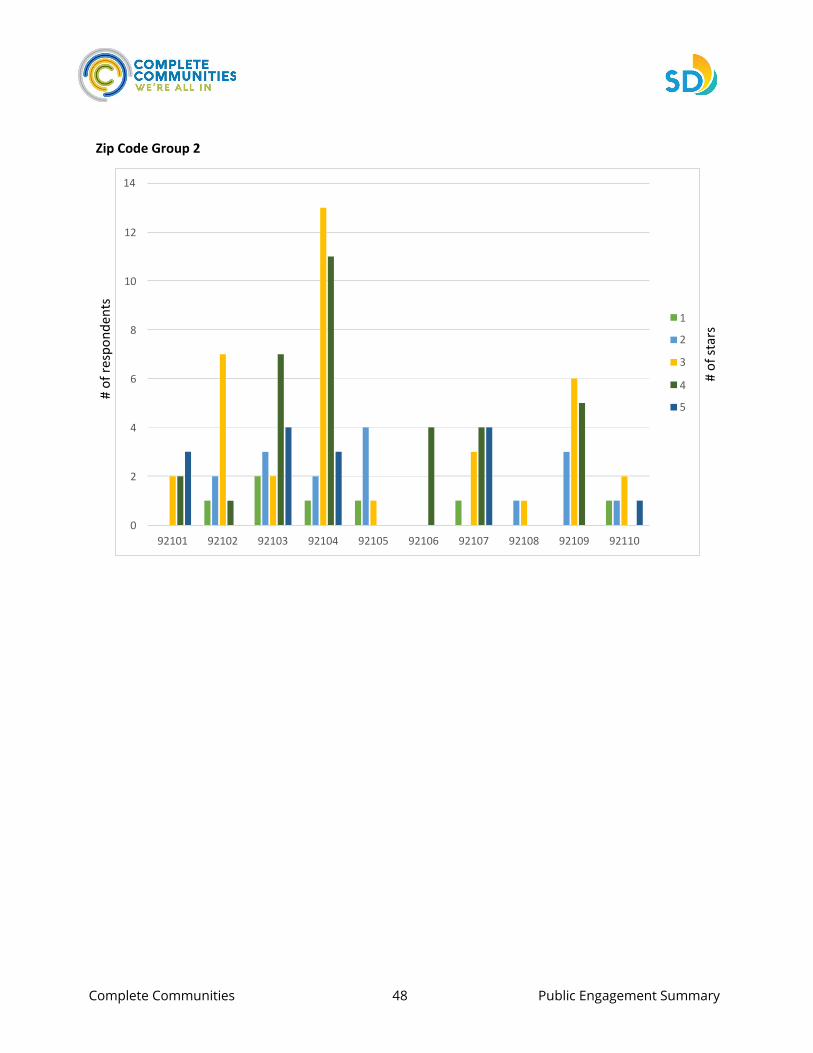
Zip Code Group 2
14
Complete Communities 48 Public Engagement Summary
12
10
8 1
2
3 6 4
5
4
2
0 92101 92102 92103 92104 92105 92106 92107 92108 92109 92110
# of
resp
onde
nts
# of
star
s
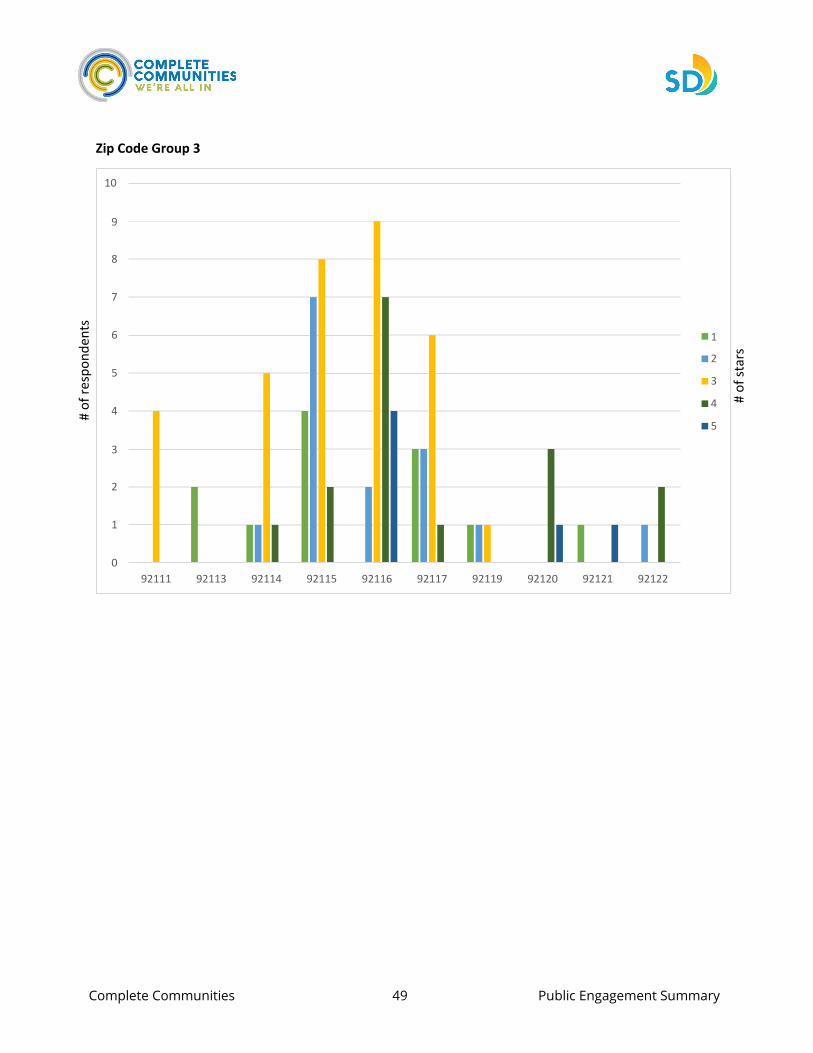
Zip Code Group 3
10
Complete Communities 49 Public Engagement Summary
9
8
7
6
5
4
1
2
3
4
5
3
2
1
0 92111 92113 92114 92115 92116 92117 92119 92120 92121 92122
# of
resp
onde
nts
# of
star
s
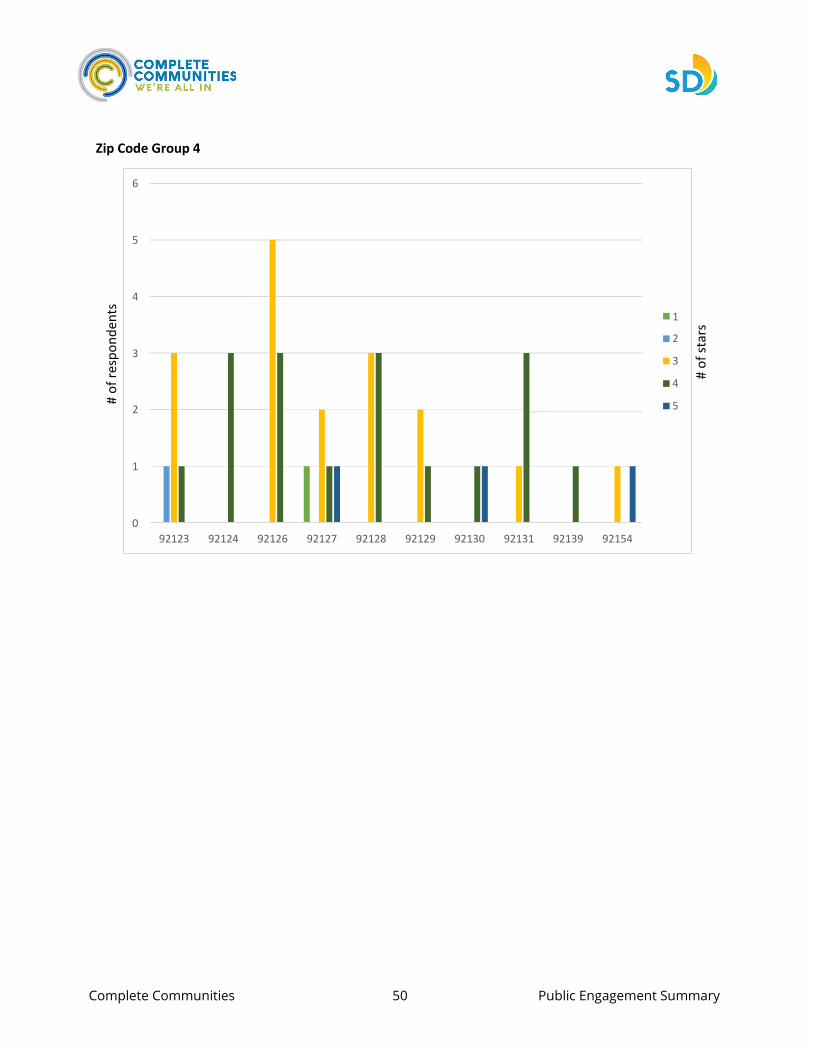
Zip Code Group 4
Complete Communities 50 Public Engagement Summary
6
5
4
3 2
1
2
3
4
5
1
0 92123 92124 92126 92127 92128 92129 92130 92131 92139 92154
# of
resp
onde
nts
# of
star
s
Complete Communities 51 Public Engagement Summary
I prefer not to answer
65 or older
55-64
45-54
35-44
25-35
18-24
Under 18
0 10 20 30 40 50 60 70
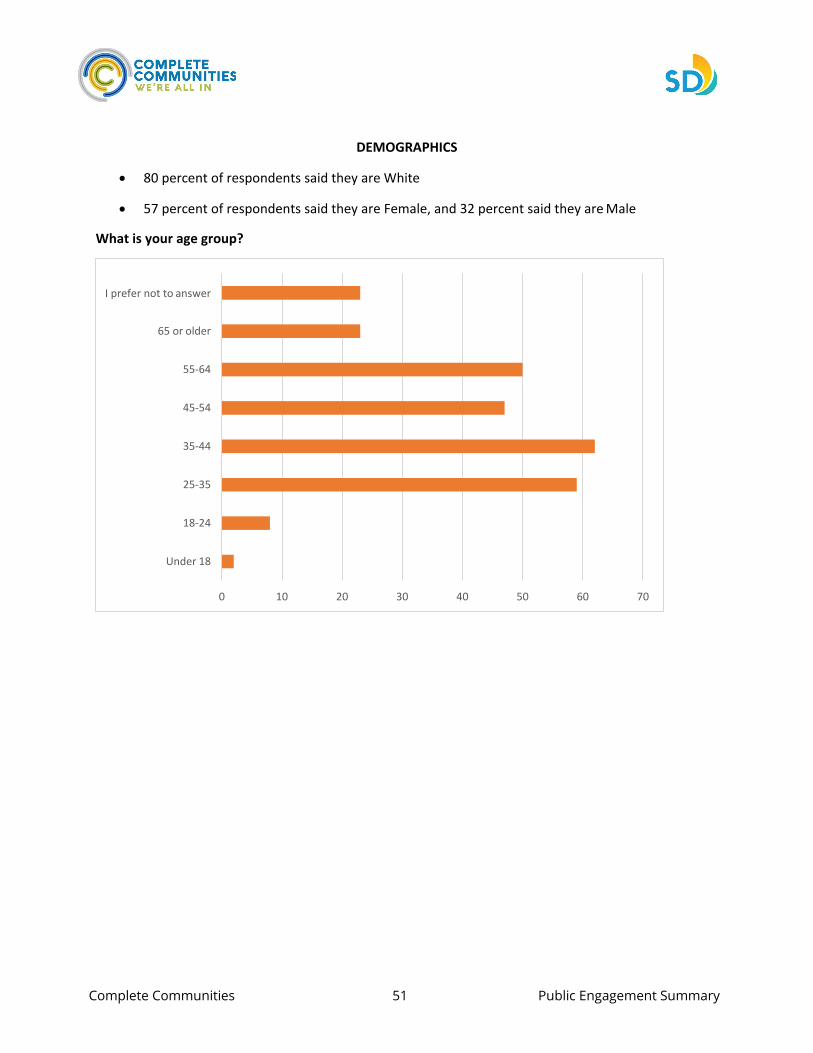
DEMOGRAPHICS
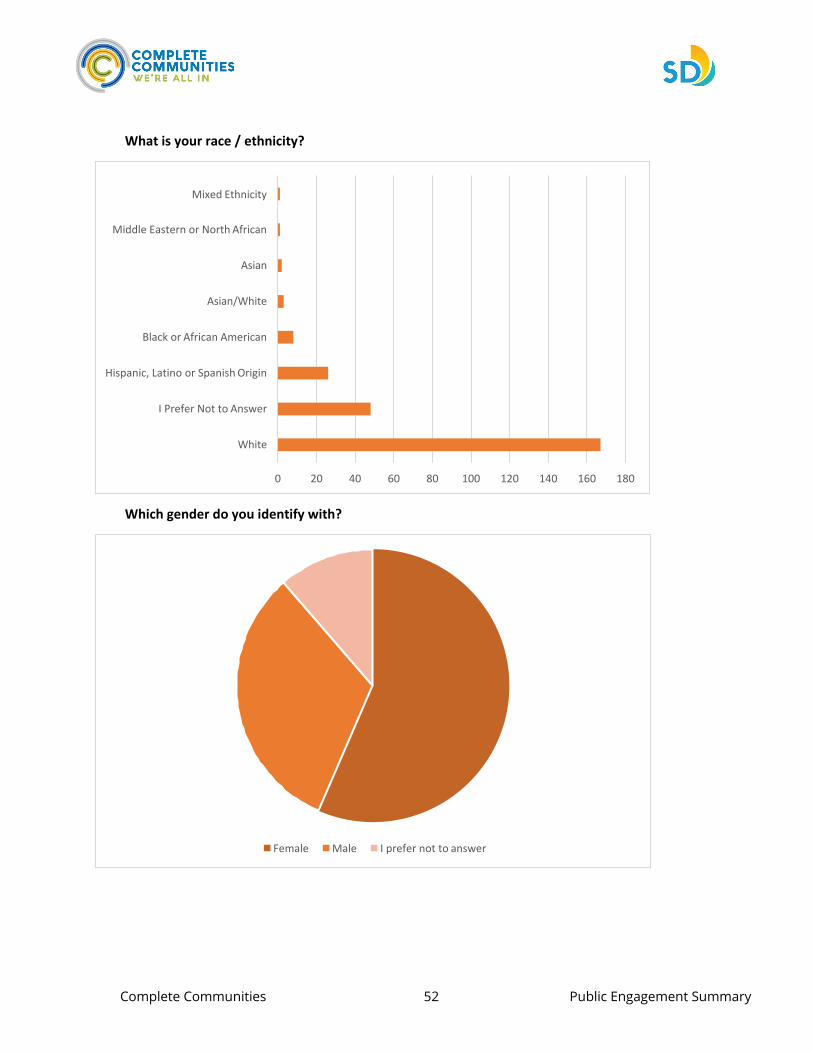
• 80 percent of respondents said they are White
• 57 percent of respondents said they are Female, and 32 percent said they are Male
What is your age group?
Complete Communities 52 Public Engagement Summary
Mixed Ethnicity
Middle Eastern or North African
Asian
Asian/White
Black or African American
Hispanic, Latino or Spanish Origin
I Prefer Not to Answer
White
0 20 40 60 80 100 120 140 160 180
Female Male I prefer not to answer
What is your race / ethnicity?
Which gender do you identify with?
Complete Communities 53 Public Engagement Summary
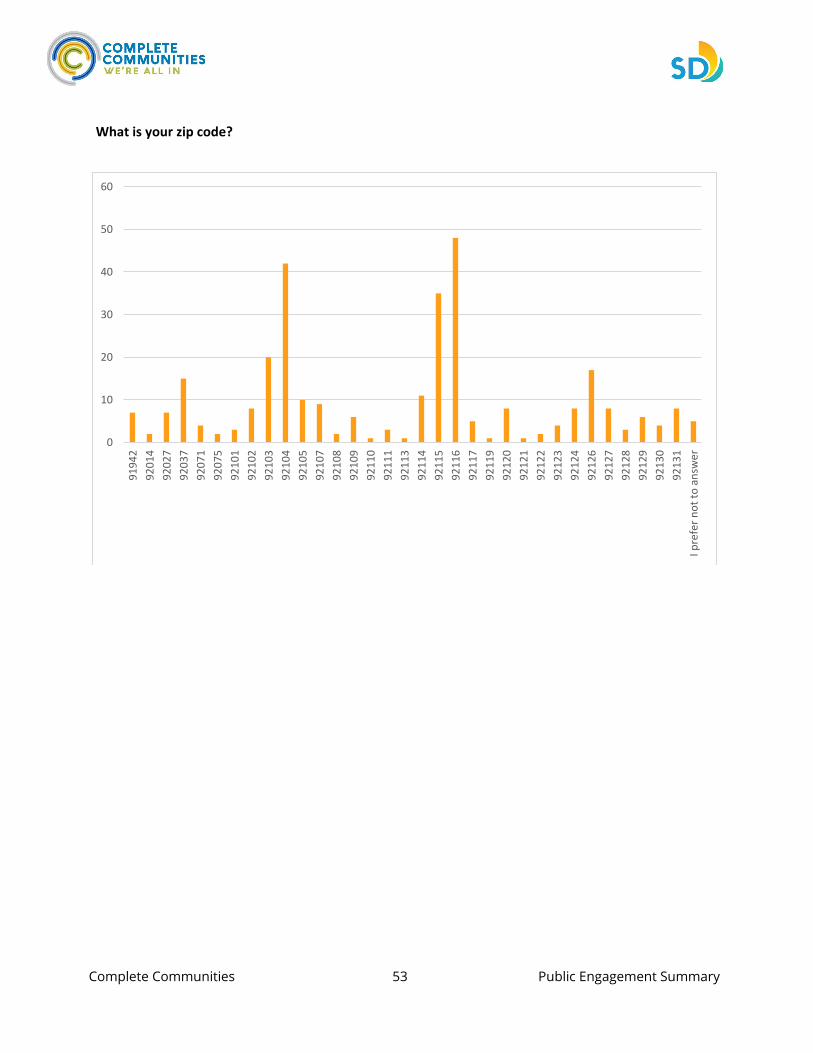
What is your zip code?
0
10
20
30
40
50
60
9194
292
014
9202
792
037
9207
192
075
9210
192
102
9210
392
104
9210
592
107
9210
892
109
9211
092
111
9211
392
114
9211
592
116
9211
792
119
9212
092
121
9212
292
123
9212
492
126
9212
792
128
9212
992
130
9213
1I p
refe
r not
to a
nsw
er
Complete Communities 54 Public Engagement Summary
D1
D2
D3
D4
D5
D6
D7
D8
D9
Outside San Diego I prefer not to answer
0 10 20 30 40 50 60 70 80
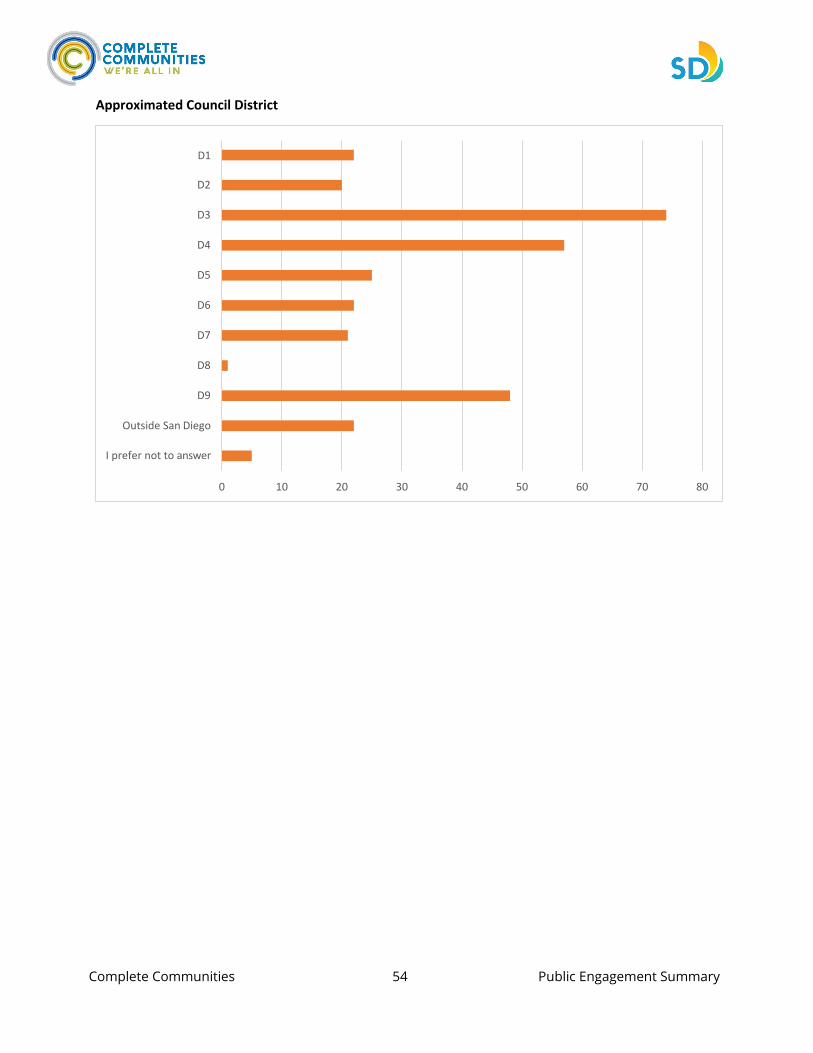
Approximated Council District
Complete Communities 55 Public Engagement Summary
5. Housing Solutions Program Details Webpage – Sample
Screenshots
Complete Communities 56 Public Engagement Summary
Complete Communities 57 Public Engagement Summary
Complete Communities 58 Public Engagement Summary
6. Housing Solutions Survey – Sample Screenshots
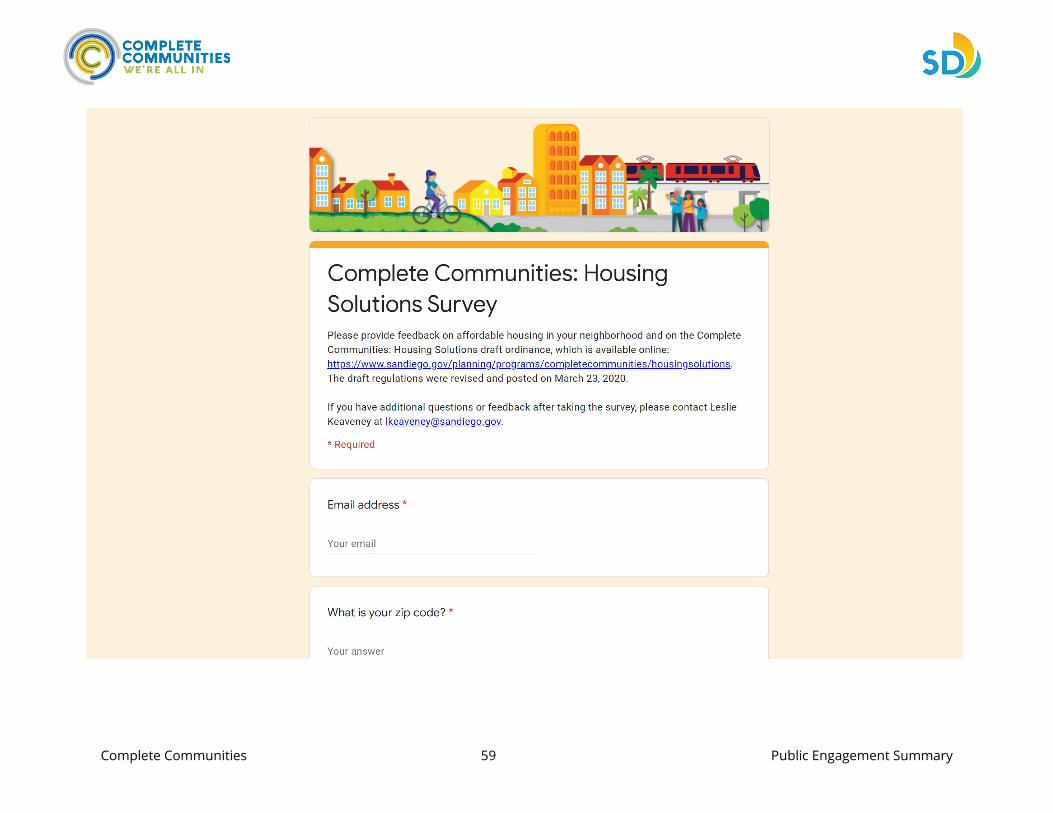
Complete Communities 59 Public Engagement Summary
Complete Communities 60 Public Engagement Summary
Complete Communities 61 Public Engagement Summary
Complete Communities 62 Public Engagement Summary
7. Mobility Choices Program Details Webpage – Sample Screenshots
Complete Communities 63 Public Engagement Summary
Complete Communities 64 Public Engagement Summary
Complete Communities 65 Public Engagement Summary
8. Mobility Choices Survey – Sample Screenshots
Complete Communities 66 Public Engagement Summary
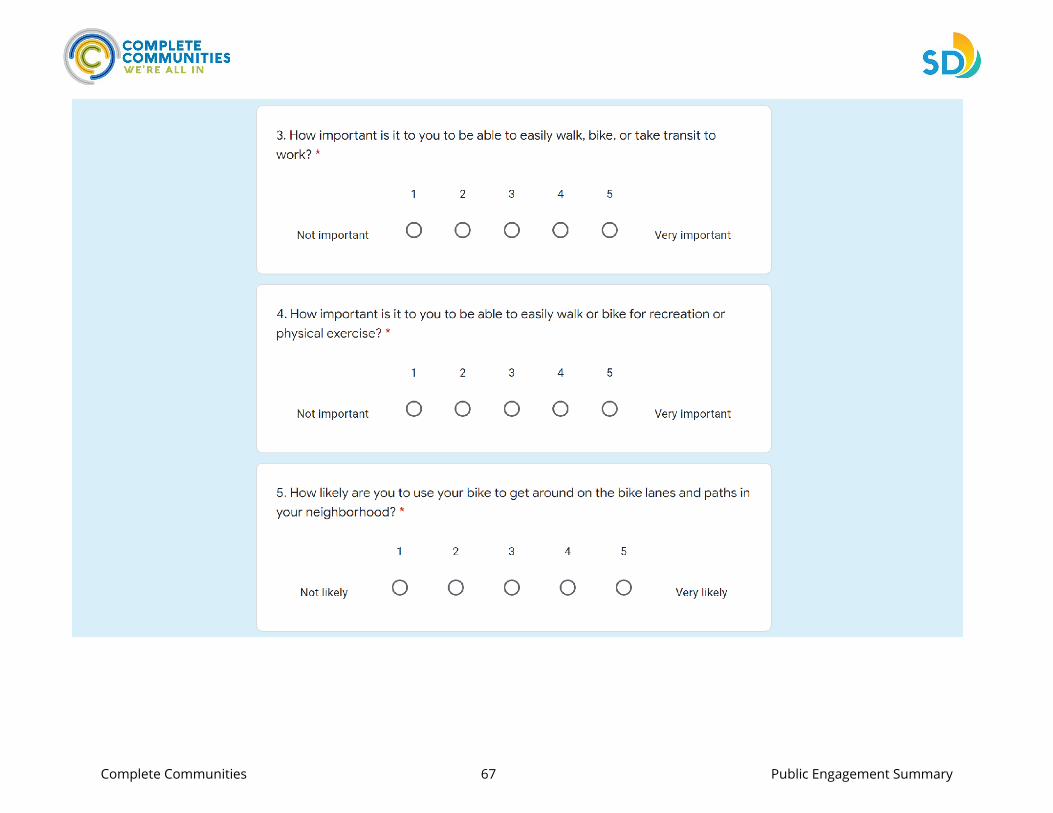
Complete Communities 67 Public Engagement Summary
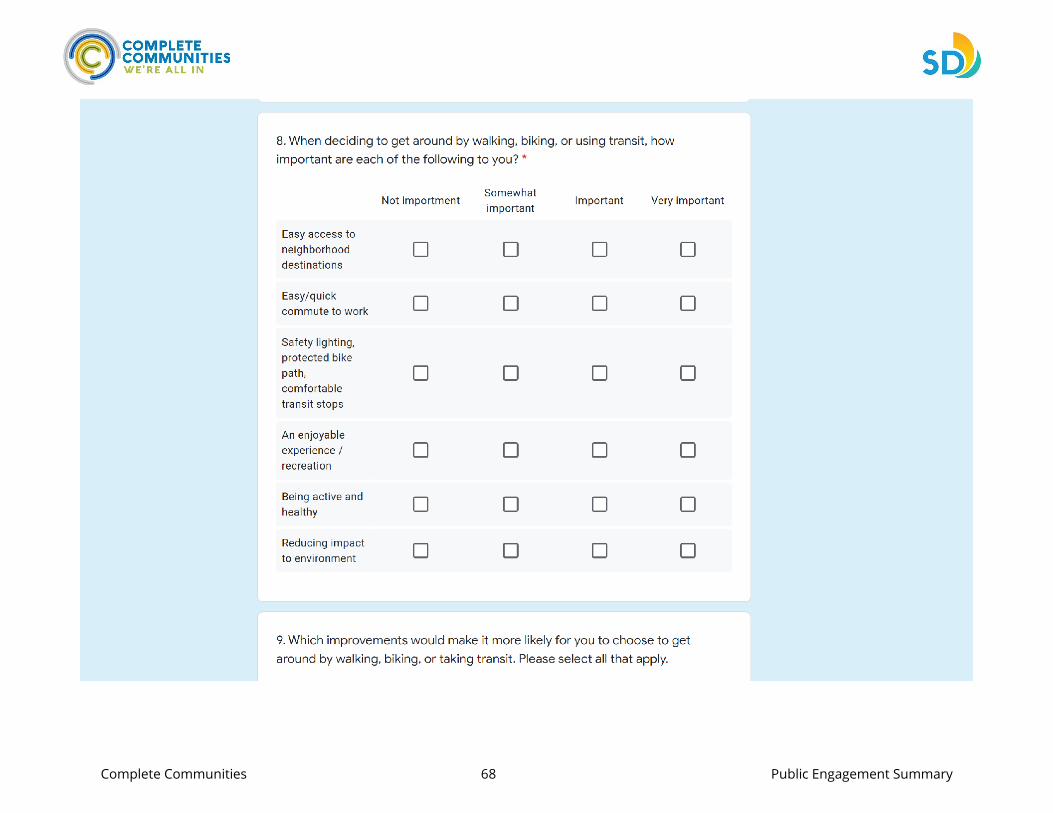
Complete Communities 68 Public Engagement Summary

Complete Communities 69 Public Engagement Summary
9. Complete Communities Webinar Polling Results
Complete Communities 70 Public Engagement Summary
Complete Communities Webinar Polling Results
The City of San Diego’s Planning Department held a public webinar about Complete Communities on July 16, 2020. The Institute for Local Government facilitated the webinar, which included presentations on Housing Solutions, Mobility Choices, and Play Everywhere; polling questions on each initiative; and a moderated question and answer session.
The City advertised the webinar on social media and emailed the Department’s list of interested parties, which includes the chairs and committee members of all community planning groups. There were 241 participants (of 402 registrants). Individuals who attended the webinar self-selected to participate, meaning they sought to communicate their opinions and ideas about the proposed initiatives to the Planning Department. The polling results do not capture a representative sample of a cross-section of San Diego residents, so the results are not statistically valid. They are indicative of what a small group of individuals felt about the Complete Communities initiatives presented on July 16, 2020.
List of Polling Questions
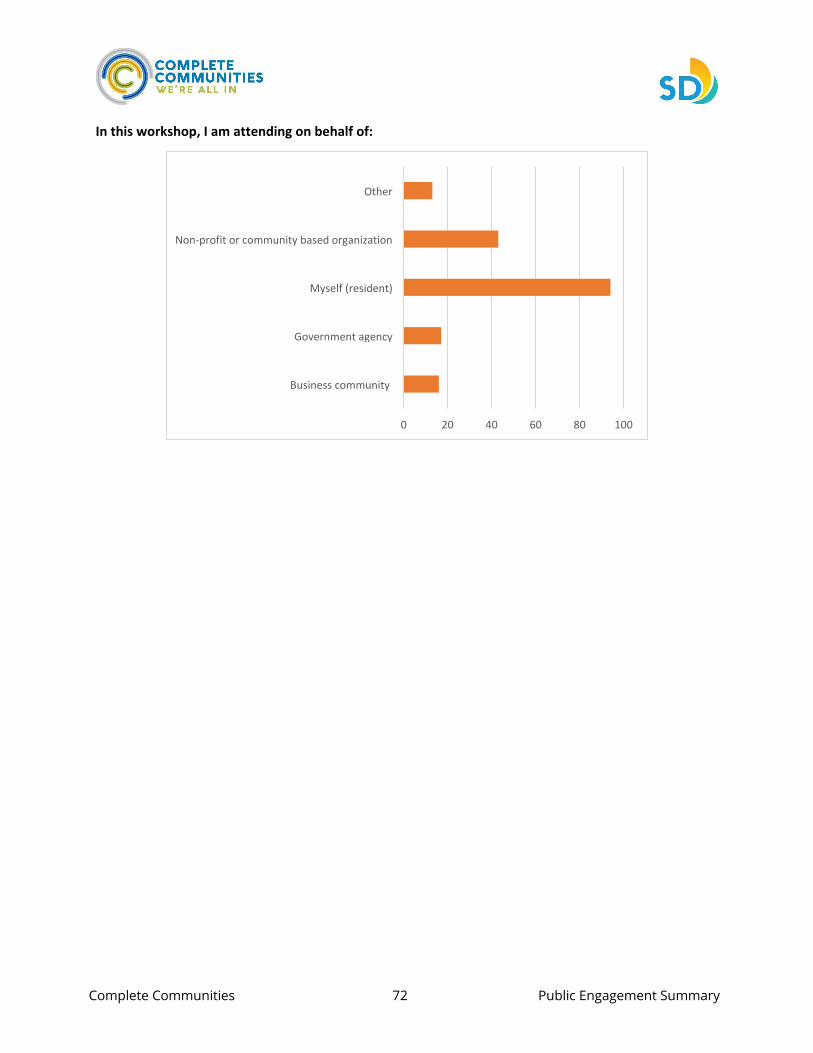
• Introduction o How long have you lived in San Diego? o Are you a Community Planning Group member? o In this workshop, I am attending on behalf of:
• Housing Solutions
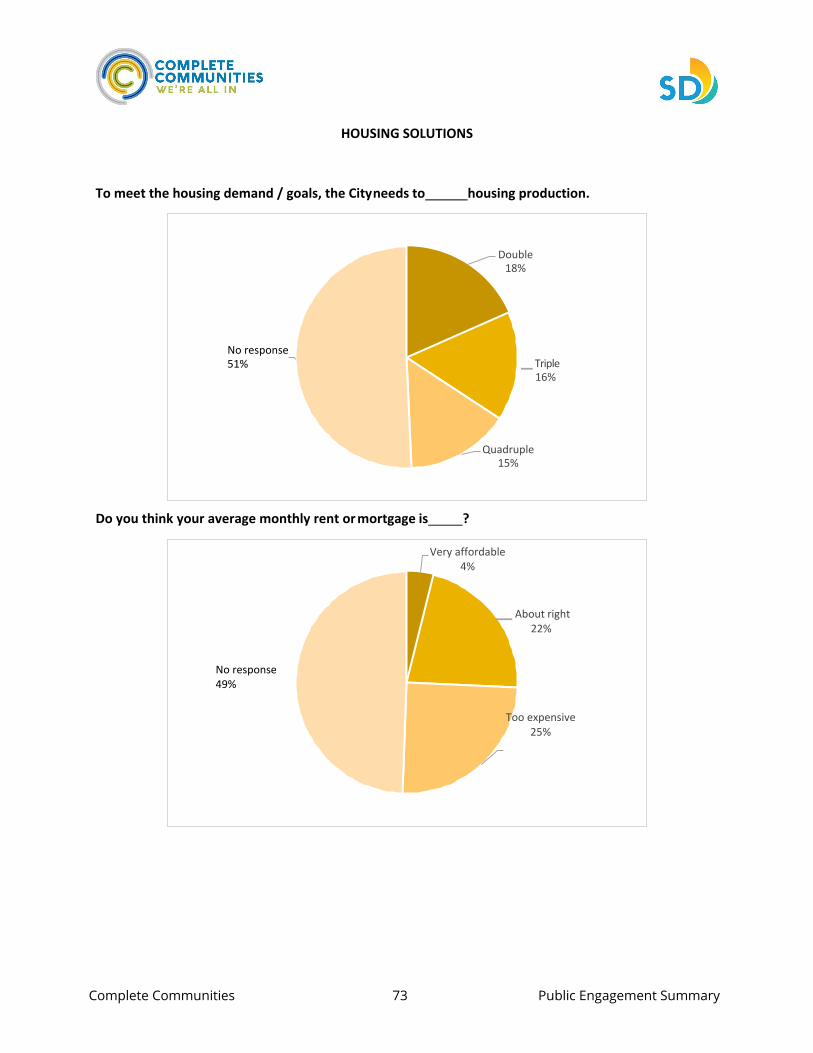
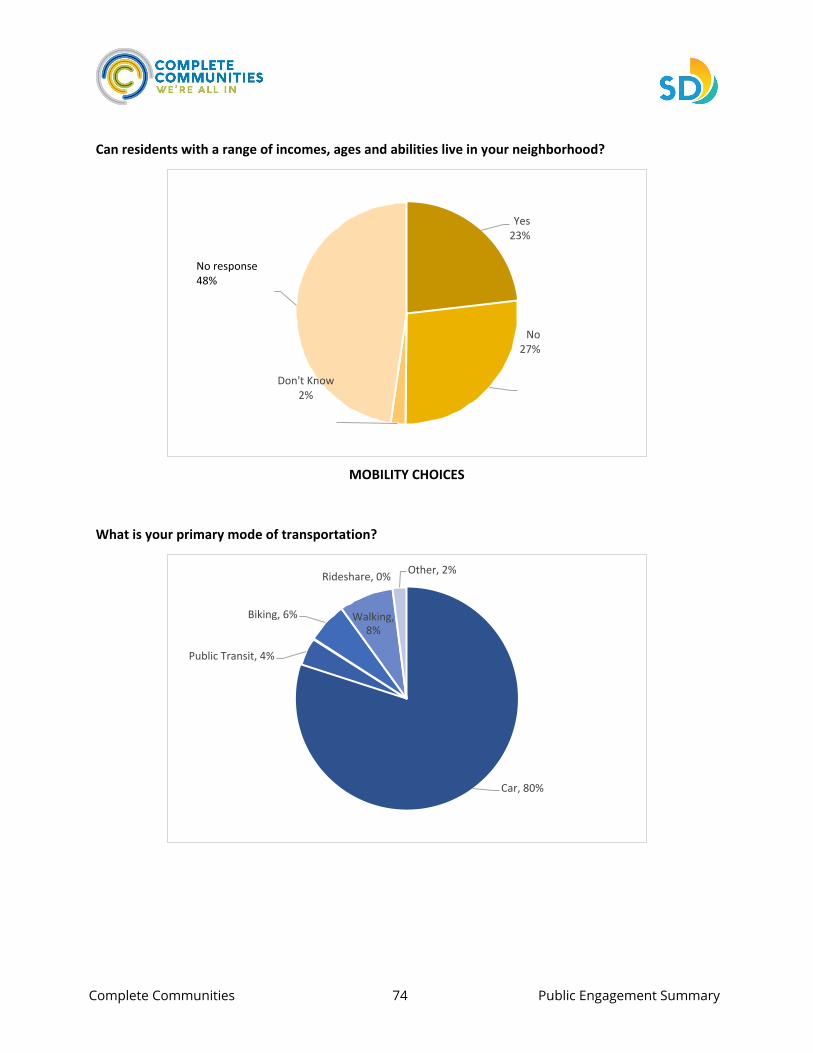
o To meet the housing demand / goals, the City needs to housing production. o Do you think your average monthly rent or mortgage is ? o Can residents with a range of incomes, ages and abilities live in your neighborhood?
• Mobility Choices
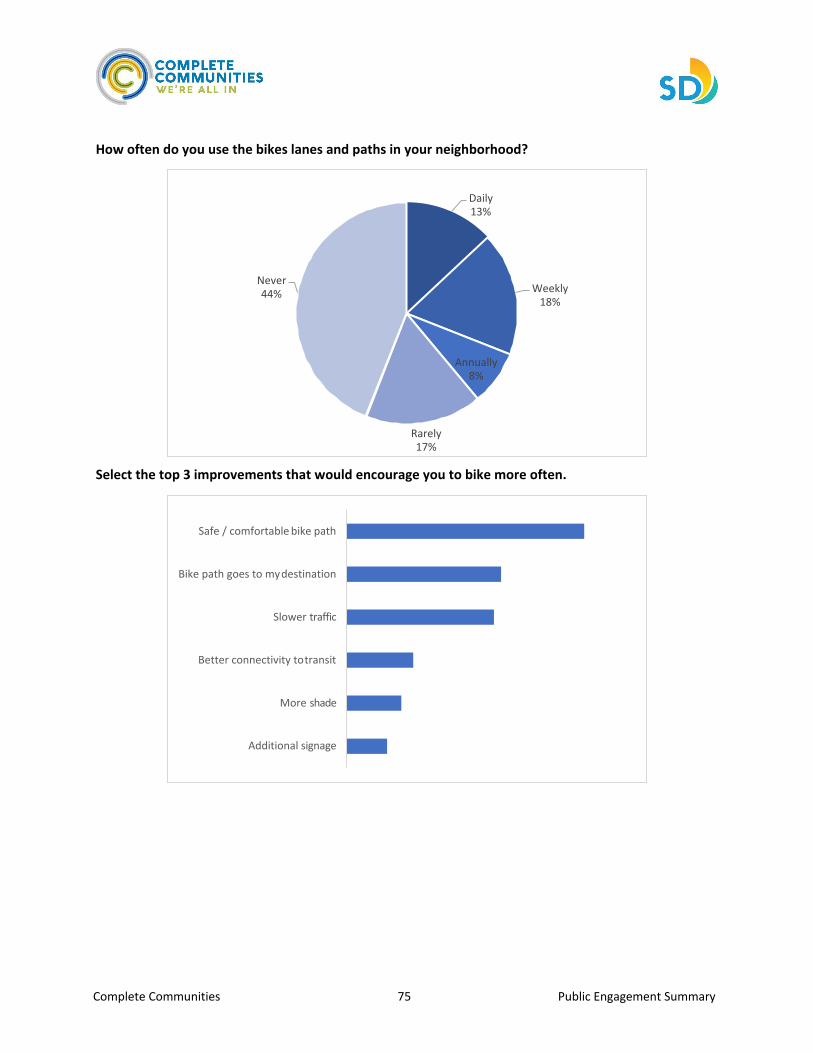
o What is your primary mode of transportation? o How often do you use the bikes lanes and paths in your neighborhood? o Select the top 3 improvements that would encourage you to bike more often.
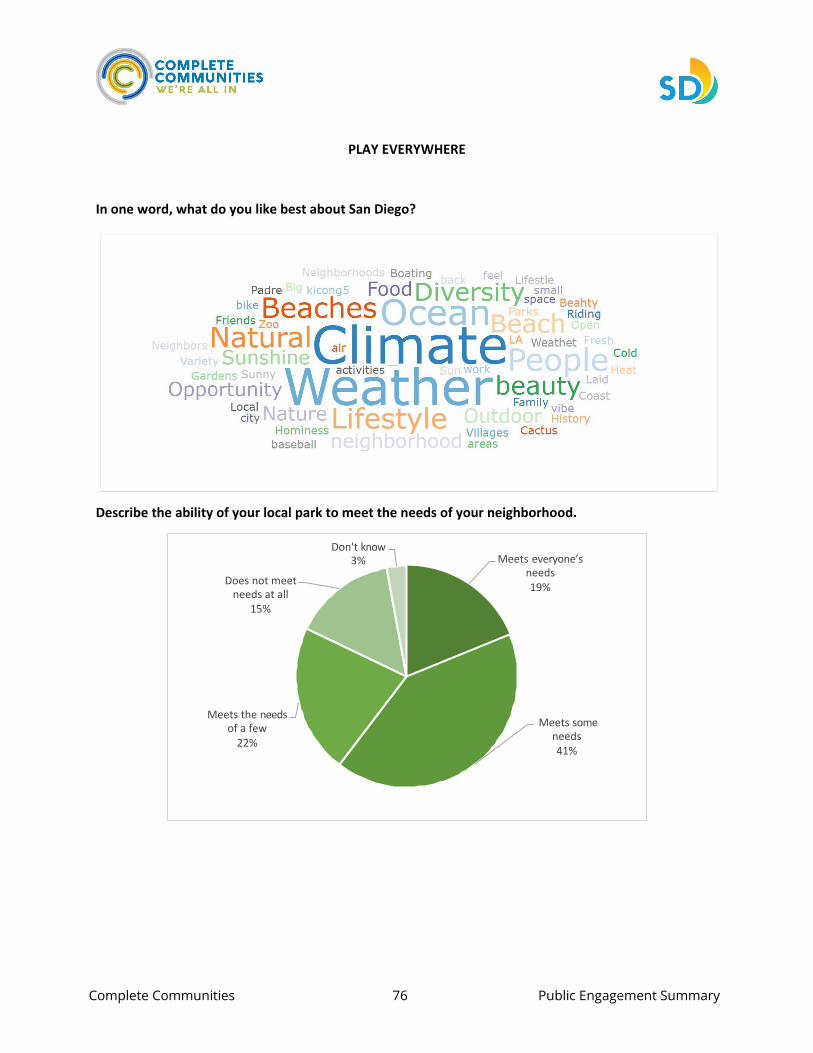
• Play Everywhere
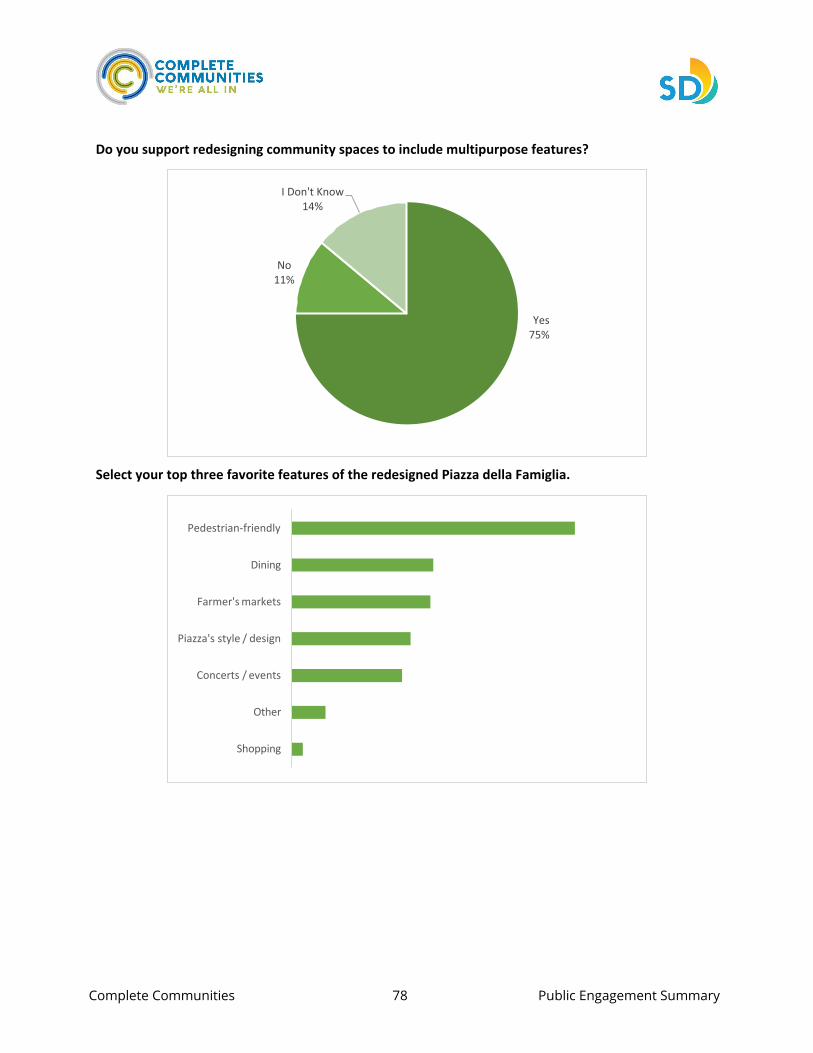
o In one word, what do you like best about San Diego? o Describe the ability of your local park to meet the needs of your neighborhood. o Is there a park within a 10-minute walk of your home? o How often do you access the park(s) in your neighborhood? o Do you support redesigning community spaces to include multipurpose features? o Select your top three favorite features of the redesigned Piazza della Famiglia.
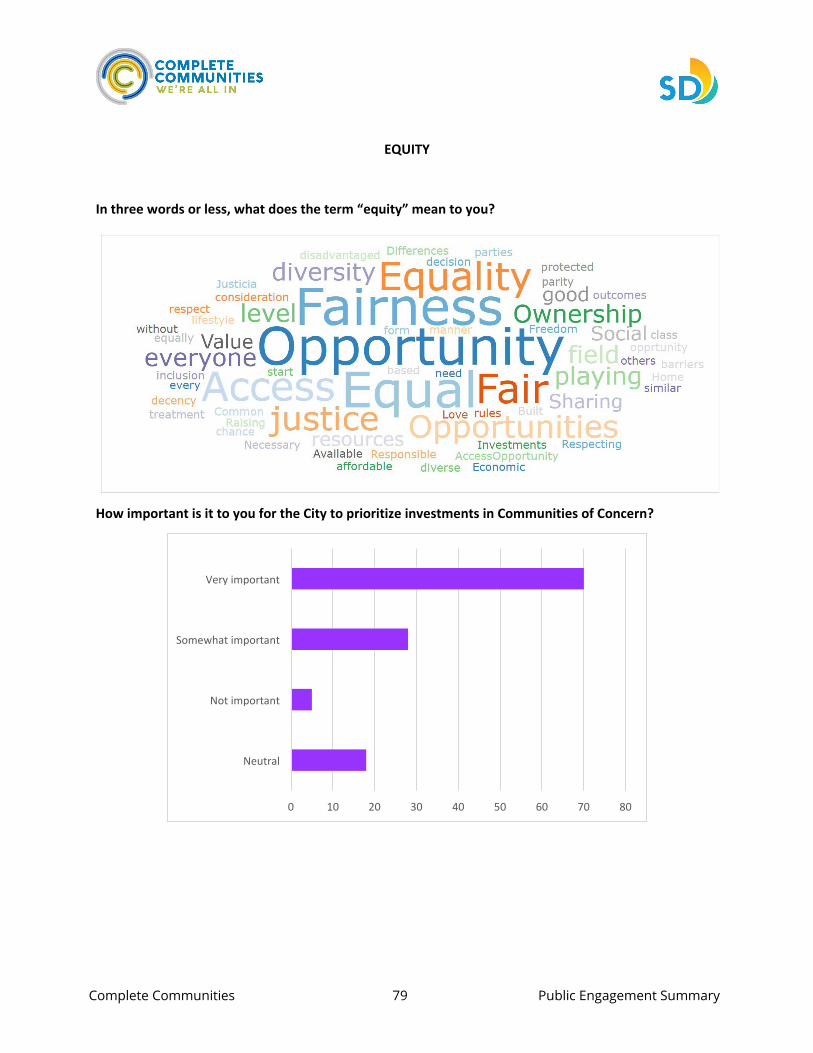
• Equity
o In three words or less, what does the term “equity” mean to you? o How important is it to you for the City to prioritize investments in Communities of
Concern?
Complete Communities 71 Public Engagement Summary
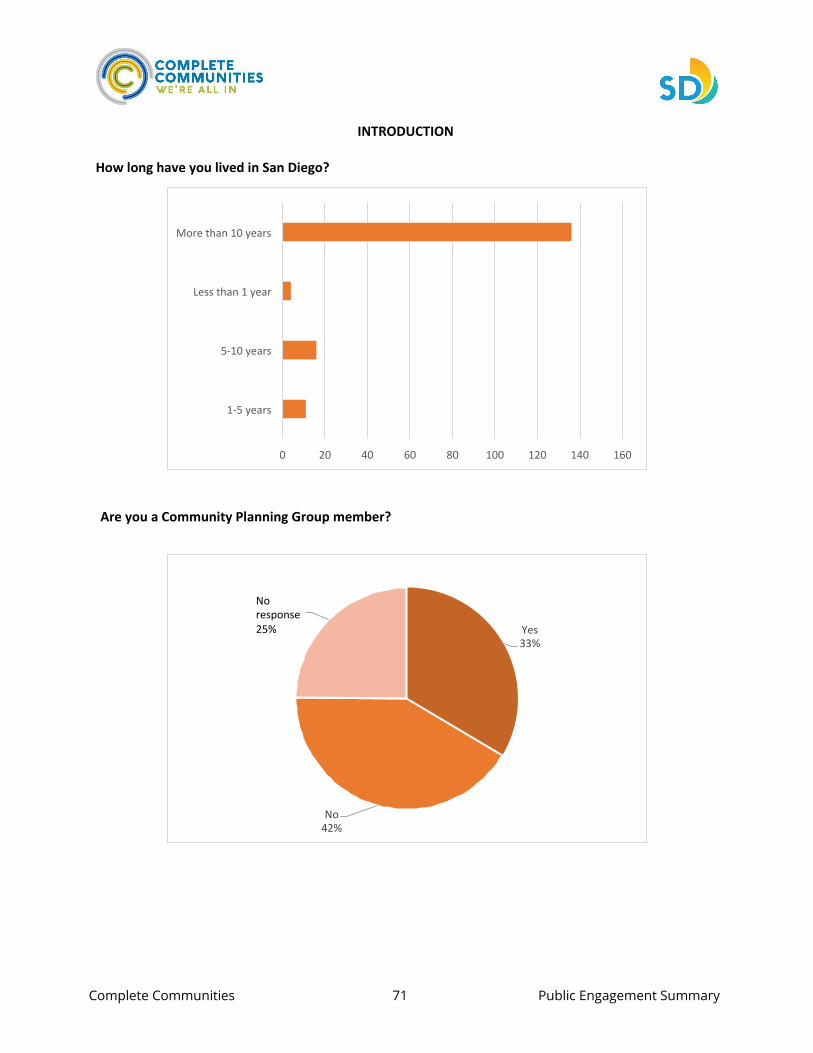
More than 10 years
Less than 1 year
5-10 years
1-5 years
0 20 40 60 80 100 120 140 160
No response 25% Yes
33%
No 42%
INTRODUCTION
How long have you lived in San Diego?
Are you a Community Planning Group member?
Complete Communities 72 Public Engagement Summary
Other
Non-profit or community based organization
Myself (resident)
Government agency
Business community
0 20 40 60 80 100
In this workshop, I am attending on behalf of:
Complete Communities 73 Public Engagement Summary
Double 18%
No response 51% Triple
16%
Quadruple 15%
Very affordable 4%
About right 22%
No response 49%
Too expensive
25%
HOUSING SOLUTIONS
To meet the housing demand / goals, the City needs to housing production.
Do you think your average monthly rent or mortgage is ?
Complete Communities 74 Public Engagement Summary
Yes 23%
No response 48%
No 27%
Don't Know
2%
Rideshare, 0% Other, 2%
Biking, 6% Walking, 8%
Public Transit, 4%
Car, 80%
Can residents with a range of incomes, ages and abilities live in your neighborhood?
MOBILITY CHOICES
What is your primary mode of transportation?
Complete Communities 75 Public Engagement Summary
Daily 13%
Never 44% Weekly
18%
Annually 8%
Rarely 17%
Safe / comfortable bike path
Bike path goes to my destination
Slower traffic
Better connectivity to transit
More shade
Additional signage
How often do you use the bikes lanes and paths in your neighborhood?
Select the top 3 improvements that would encourage you to bike more often.
Complete Communities 76 Public Engagement Summary
Don't know 3%
Does not meet needs at all
15%
Meets everyone’s needs 19%
Meets the needs of a few
22%
Meets some needs 41%
PLAY EVERYWHERE
In one word, what do you like best about San Diego?
Describe the ability of your local park to meet the needs of your neighborhood.
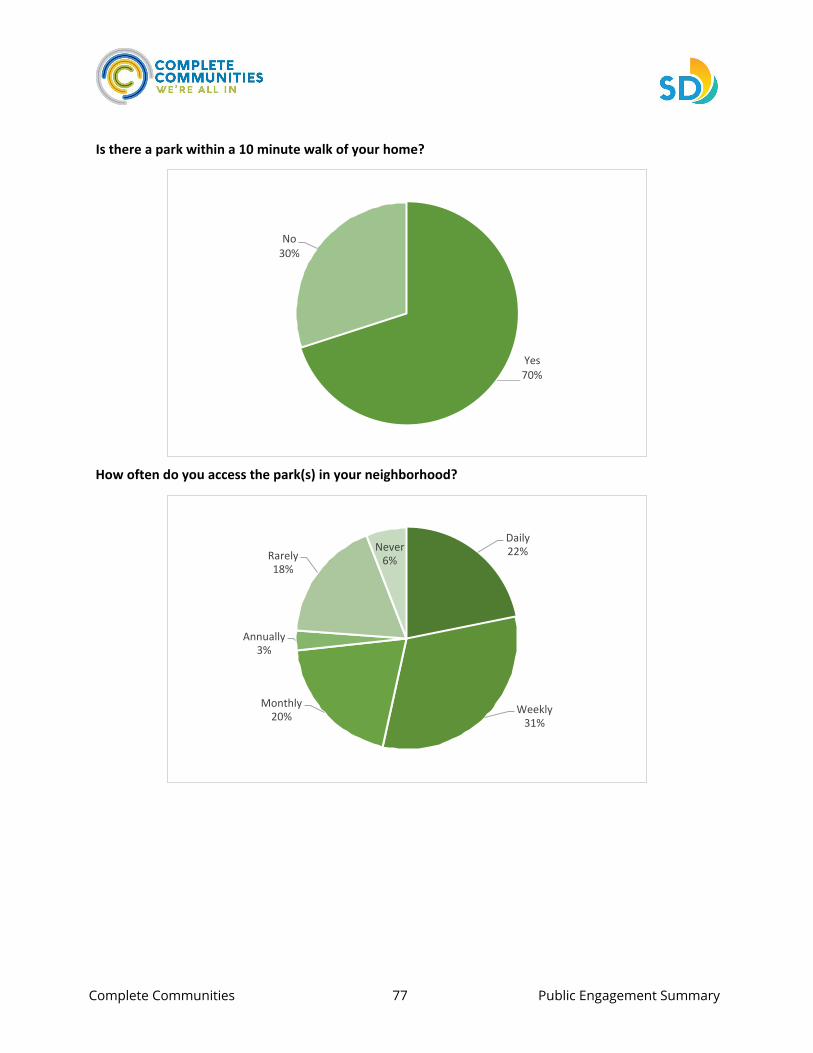
Complete Communities 77 Public Engagement Summary
No 30%
Yes 70%
Rarely 18%
Never 6%
Daily 22%
Annually 3%
Monthly 20% Weekly
31%
Is there a park within a 10 minute walk of your home?
How often do you access the park(s) in your neighborhood?
Complete Communities 78 Public Engagement Summary
I Don't Know
14%
No 11%
Yes 75%
Pedestrian-friendly
Dining
Farmer's markets
Piazza's style / design
Concerts / events
Other
Shopping
Do you support redesigning community spaces to include multipurpose features?
Select your top three favorite features of the redesigned Piazza della Famiglia.
Complete Communities 79 Public Engagement Summary
Very important
Somewhat important
Not important
Neutral
0 10 20 30 40 50 60 70 80
EQUITY
In three words or less, what does the term “equity” mean to you?
How important is it to you for the City to prioritize investments in Communities of Concern?