compilation of thesis
TRANSCRIPT
7/28/2019 Compilation of Thesis
http://slidepdf.com/reader/full/compilation-of-thesis 1/63
1
Chapter 1
The Problem and Its Background
Introduction
The study is performed to know the Level of Awareness on Food
Labeling among HRM students in Our Lady of Fatima University-
Antipolo. There are different kinds of nutrition content that can be seen
on the food labeled products but some of it was not really important to
the consumers. The researchers want to measure the Level of Awareness
of the students to that food claim.
Food labels have been mandatory in the United States since the
1990s, but they have been in the making since the 1860s. What began
as an agricultural research and development project quickly morphed
into a food safety organization. After the Civil War, as interstate
commerce picked up, there was a need for standardized weights,
measures, and manufacturing practices.
By the 1870s concern for quality of traded goods prompted the
pure food movement. These activists urged lawmakers to make food
adulteration a crime. At the time, chemical preservatives went
uncontrolled, milk was unpasteurized, and ice was the only form of
refrigeration. Cottonseed oil was routinely sold as lard, and glucose
syrup made from wheat and corn was used as a cheaper form of sugar.
And unbeknownst to the consumer, medical “tonics” routinely
contained opium, morphine, cocaine, and heroin. In 1903, volunteer
7/28/2019 Compilation of Thesis
http://slidepdf.com/reader/full/compilation-of-thesis 2/63
2
“poison squads” ate foods tainted with chemical preservatives to
demonstrate their effect on human health (http://www.netplaces.com).
Regulation of packaged food began in 1913 with legislation
requiring that foods have clearly labelled weight, measure, or numerical
count of their contents.
In the 1930s, generalized quality ratings were required. They
weren’t very telling, as the only requirement was either “standard,”
“below standard,” or “above standard.” Not until the 1960s were
nutritional content and an ingredients list required on packages. The
FDA reviewed every label for accuracy.
In 1990 the Nutritional Label Education Act regulated health
claims made on food labels, such as “light” and “low-fat.” In 1992 the
Nutrition Facts Panel first appeared, showing per-serving nutritional
information. However, there has been always a struggle between the
public and private organizations on the ingredients reported by food
labels. A similar thing happened with the drug industry. As in the case
of food labels, they needed an adequate explanation of all the things that
the product contained (http://www.diet.com/g/food-labels).
There are many examples, in the history of food labels, of this kind
of occurrences. In the 1920’s the Supreme Court of the United States of
America ruled that those food labels that contained misleading
information, would be sanctioned by the law. This created a huge

7/28/2019 Compilation of Thesis
http://slidepdf.com/reader/full/compilation-of-thesis 3/63
3
precedence since producers had to take a lot of care with their food
labels. No longer could they use food labels with information that tricked
the consumer; food labels with slogans such as "it also cures all kind of
ailments” begun to disappear.
Another important milestone in the history of food labels occurred
in 1958, when the United States of America emitted a decree under
which all food labels had to contain the additives used by the
manufacturer
However, that doesn’t mean that food labels won’t change anymore. As a
matter of fact, the Food Standards Agency of the UK is going to adopt the
recommendations of a study done on food labels. That way, food labels
will be easier to read by manufacturers and consumers. This information
was obtained from supermarkets, public health groups, manufacturers
and consumers (http://www.science20.com).
Nowadays, many different labeled food products are made with
their own specific nutrition facts. These nutrition facts were noted for the
awareness of those who purchase or consumed it. Nutrition fact is a
protocol for all processed food products. It is checked and approved by
Bureau of Food and Drugs (BFAD) the one who administer the quality
among processed food products in the Philippines before it was release to
different food suppliers. The manufacturers of the food items must
inform their consumers about the facts or benefits that they can acquire
upon consuming the item. Food labels provide more than just nutrition
7/28/2019 Compilation of Thesis
http://slidepdf.com/reader/full/compilation-of-thesis 4/63
4
facts, though. It also shows you what’s in a packaged food. (i.e., the
ingredients). The information on a food label can help people manage a
good health condition. Customers with certain health condition like
diabetes can get information on sugar and carbohydrate contents from
the food label, and customers on low-salt or low-fat diets can tell at a
glance how much of these nutrients are in food. Even purified drinking
waters were required to put food claims on their packaging. Consumers
must check the label first before consuming a certain product to help
them on the right amount of consumption they need on their diet. But
most people ignore the existing nutrition facts they are not aware on
what is inside that certain food or what does the food content.
Statement of the Problem
This study aimed to know the level of awareness in food labeling
among HRM students of OLFU- Antipolo.
Specifically, it sought to answer the following questions:
1. What is the Demographic profile in terms of:
1.1. Gender; and
1.2. Year Level?
2. What is the level of awareness of the selected HRM students in
food labeling in terms of:
2.1Serving Size;
2.2 Percent Daily Value; and
2.3 Product Ingredients?
7/28/2019 Compilation of Thesis
http://slidepdf.com/reader/full/compilation-of-thesis 5/63
5
3. Is there a significant relation between demographic profile of the
students and the level of awareness of the selected HRM students in food
labeling?
Hypothesis
There is no significant relation between the demographic profile of
the students and the level of awareness of the selected HRM students in
food labeling.
Significance of the Study
All consumers can use this study for them to be more aware on the
nutrition fact of the processed food products to be consumed or to be
eaten.
HRM Students, this can be used by giving them new information on how
important the food label in the daily life and what can be the benefit on
their health.
Consumers, they can use this study for them to realize the importance of
reading the nutrition fact of food labeled product and how it would
benefit them.
Professors of CHIM, this study can be useful by explaining this research
to the students on how it is important and helpful to read first the label
of every food product to buy.
Future Researchers, allowing them to get new idea in further studies
and expanding the information for food labeling products.
7/28/2019 Compilation of Thesis
http://slidepdf.com/reader/full/compilation-of-thesis 6/63
6
Scope and Limitation of the Study
The researchers aim to know the level of awareness of the
respondents based on the content of the food labeled products. It was
done to determine if the respondents accept the product that has
nutrition facts with the knowledge of its content.
This study is conducted to determine the level of awareness of
HRM student of Our Lady of Fatima University students in Nutrition
Facts on Food Labeled product. The researchers want to know the
awareness of the students on nutrition fact of food labeled product. This
can be done by giving them questionnaires.
Definition of terms
For the purpose of definition of the following terms are defined:
Awareness. These refers to having knowledge; conscious; aware of
danger.
Awareness. Therefore is defined as a human's or an
animal's perception and cognitive reaction to a condition or event.
BFAD. Institution were all the food any other drugs are test to be
qualified. (Bureau of Food and Drugs) the one who approves the quality
of food product in the Philippines.
Consumers. Person or thing that consumes; a person or
organization that uses a commodity or service.
7/28/2019 Compilation of Thesis
http://slidepdf.com/reader/full/compilation-of-thesis 7/63
7
Carbohydrates. Carbohydrates are an ideal source of energy for
the body. This is because they can be converted more readily into
glucose, the form of sugar that's transported and used by the body, than
proteins or fats can.
Cholesterol. It came from the Greek chole- (bile) and stereos (solid)
followed by the chemical suffix -ol for an alcohol, is an organic chemical
substance classified as a waxy steroid of fat. It is an essential structural
component of mammalian cell membranes and is required to establish
proper membrane permeability and fluidity.
Fats. Provide a source of concentrated energy as well as the fat-
soluble vitamins A, D, E and K. Fat transports these vital nutrients
around the body. Consist of a wide group of compounds that are
generally soluble in organic solvents and generally insoluble in water.
F.D.A. (Food and Drug Administration) monitors the safety and
sanitation of food and drugs all over the world.
Hydrogenated Oil. Hydrogenated oil is made by forcing hydrogen
gas into oil at high pressure. Both animal and vegetable fats can be and
are hydrogenated. In general, the more solid the oil is, the more
hydrogenated it is. Hydrogenated oil is oil in which the essential fatty
acids have been converted to a different form chemically, which has
several effects.
Ingredient. The spice use in a product. Means any substance,
including a food additive, used in the manufacture or preparation of a
7/28/2019 Compilation of Thesis
http://slidepdf.com/reader/full/compilation-of-thesis 8/63
8
food and present in the final product although possibly in a modified
form
Label. The distinguish brand of an item. Means any tag, brand,
mark, pictorial or other descriptive matter, written, printed, stenciled,
marked, embossed or impressed on, or attached to, a container of food.
Labeled foods. This was a written document of the nutrition facts
in every process product or food. It tells you about its full vitamins and
minerals.
Labeling. Written or printed words that show the quality of the
food that is being labeled. Includes any written, printed or graphic matter
that is present on the label, accompanies the food, or is displayed near
the food, including that for the purpose of promoting its sale or disposal
Manufacturer. This refers to those who give out a certain product
and processes. Is the one that manufactures or create a certain product.
Minerals. These are important for your body to stay healthy. Your
body uses minerals for many different jobs, including building bones,
making hormones and regulating your heartbeat.
Nutrient. This refers to a chemical that an organism needs to live
and grow or a substance used in an organism's metabolism which must
be taken in from its environment.
Nutrition Facts. The nutrition that you will get in the process
food.
7/28/2019 Compilation of Thesis
http://slidepdf.com/reader/full/compilation-of-thesis 9/63
9
Packaging. These are science, art and technology of enclosing or
protecting products for distribution, storage, sale, and use. Packaging
also refers to the process of design, evaluation, and production of
packages.
Percentage daily value. The Percent Daily Value on the Nutrition
Facts label is a guide to the nutrients in one serving of food. It indicates
how the nutritional content of one serving fits into the diet of a person
who consumes a total of 2,000 calories a day.
Preservatives. Process of preservation wherein the food is stored
and cannot be easily wasted. A chemical substance used to preserve
foods or other organic materials from decomposition or fermentation.
Protein. Protein is the building block of all life and is essential for
the growth of cells and tissue repair.
R.D.A. The daily diet program for the people. (Recommended
Dietary Allowance) it is the required amount of food consumption of
people on their daily diet.
Safety. The quality of averting or not causing injury, danger, or
loss.
Satisfaction. This refers to a good pleasure and giving
contentment to oneself. Gratification of desire; contentment in
possession and enjoyment
7/28/2019 Compilation of Thesis
http://slidepdf.com/reader/full/compilation-of-thesis 10/63
10
Saturated Fat. This is a type of fat found in food. It has been
shown to raise LDL or "bad" cholesterol levels. High LDL-cholesterol is a
risk factor for heart disease.
Serving size. The amount of a food or drink that is generally
served.
Unsaturated fats. These refer to a fat or fatty acid in which there
is at least one double bond within the fatty acid chain. Unsaturated fat
molecules contain somewhat less energy (i.e., fewer calories) than an
equivalent amount of saturated fat.
Vitamins. Vitamins are organic compound required by an
organism as a vital nutrient in limited amounts.
7/28/2019 Compilation of Thesis
http://slidepdf.com/reader/full/compilation-of-thesis 11/63
11
Chapter 2
Review of Related Literature
This chapter contains literature and studies that were gathered by
the researchers that are significantly related to the topic being studied.
Both related literature and studies have provided relevant facts about the
level of awareness on food labeling.
Food Labeling
Nutrient labeling is found to significantly affect consumer
purchase behavior; some evidence that consumers may act as if they
hold nutrient (or health risk) budgets is found. Providing nutrient
information may allow consumers to more easily switch consumption
away from 'unhealthy' products in those food categories where
differences in other quality characteristics (e.g., taste) are relatively small
between the more and less 'healthy' products, toward 'unhealthy'
products in categories where differences may be relatively large (i.e., a
'substitution effect'). If this substitution effect is large, nutrient labeling
may not change the overall consumption of 'unhealthy' nutrients and
thus may not lead to significant changes in health risk ( Teisl and Levy,
1997).
Posits that food labeling is one medium by which consumers can
acquire knowledge about the food they consider buying. This type of
7/28/2019 Compilation of Thesis
http://slidepdf.com/reader/full/compilation-of-thesis 12/63
12
information is becoming increasingly important in a food market where
direct contact with the personnel over the counter is declining. Reports
the results from a pilot study and a consumer survey including 1050
respondents. Reveals that the majority of consumers read the food labels
(often, sometimes or seldom), and that the reading frequency was
associated with the degree of uncertainty about the food supply.
Additives occupied a far more prominent place in these reading activities,
than what could be expected from the respondents’ general notions of
what constitutes a healthy diet. Discusses these results with regard to
consumer apprehension of the presentation of data on the food labels.
(Wandell, 1997).
Five hundred thirty-one members of the American Institute of
Nutrition, 177 persons from the food industry, and 107 consumers from
a Food and Drug Administration mailing list responded to a survey
dealing with nutrition labeling of foods. They identified obesity and heart
disease as the major diet-related national health problems and chose
information about calories, sodium, fat, protein, iron, calcium, and
carbohydrates as most useful to the public. (Heimbach and Stokes
1982).
Nutrition labeling of food products has received considerable
attention in the marketing literature due to increasing consumer interest
in health and diet issues. Nutrition labeling of food products is intended
to enable informed consumer choices and stimulate the consumption
7/28/2019 Compilation of Thesis
http://slidepdf.com/reader/full/compilation-of-thesis 13/63
13
and production of healthful products. Reviews nutrition labeling
research, organizes the literature, and discusses implications for policy
makers, managers and researchers. Analysis of the literature suggests
heterogeneous utilization and comprehension of on-pack nutrition
information by consumers. The effectiveness of nutrition labeling
depends also on the organization and presentation of the information,
implying the importance of regulatory issues. The topic is rich in public
and marketing policy implications and provides several opportunities for
further research (Baltas, 2001).
The authors evaluate seven nutrition label formats to determine
consumer comprehension and acceptance of displayed information. They
test comprehension of five tasks: comparing two products, judging
healthfulness, verifying claims, estimating servings needed to meet the
daily requirements for a nutrient, and balancing nutrients in a daily diet.
Performance scores were higher on some tasks--particularly dietary
management ones--for formats that displayed nutrient amounts in
percentages than for those that displayed nutrient amounts in metric
units, even when interpretational aids were included on the metric
formats. The two most preferred formats were metric formats with an
interpretational aid. The findings have an important impact on
decisionsabout the final nutrition label format required by the Food and
Drug Administration (Levy, Fein, and Schucker 1996).
7/28/2019 Compilation of Thesis
http://slidepdf.com/reader/full/compilation-of-thesis 14/63
14
According to Dr. Alberto G. Romualdez , former Dean of the
University of the Phil. College of Medicine, “When it comes to safety and
proper hydration for the family, doctors knows best. With the belief that
vigilant parenthood and respondent pediatric care are important in
safeguarding the health of the Filipino Family like Wilkins, it uses state-
of-the-art purification and distillation processes, following approved
standards from the Food and Drug Administration (FDA), and Asia
Bottled Waters Association (ABWA)” (Dr. Romualdez Alberto G., 2010).
The overall objective of mandatory labeling requirements is to
provide consumer information and consumer choice. In most countries,
labeling is not primarily about food safety but about consumer
information, as labeling policies are designed to follow safety approval
clearance. At the same time, the rationale behind the provision of
consumer information differs according to the labeling regulation.
Countries with labeling based on production process believe that at least
some consumers base their purchasing decision not only on product
related issues but also on environmental and/or religious, ethical, or
other non – safety related reasons. Countries with product labeling base
their regulation on consumer demand for product information. In
addition, there is a philosophical debate as to whether labeling
requirements support the principle of consumer autonomy or consumer
right – to – know (Streiffer & Rubel, 2003; Hansen, 2004;McKay White &
Veeman, 2007).

7/28/2019 Compilation of Thesis
http://slidepdf.com/reader/full/compilation-of-thesis 15/63
15
Mandatory labeling forces all food processors to take measures
related to their sources of ingredients. This regulation tends to distort the
market towards no GM at all in countries where agricultural
biotechnology has a bad reputation, and where the food industry is
concentrated and thus sensitive to actions by political pressure groups,
such as anti – GM campaigns, despite the fact that a significant share of
consumers would be willing to buy GM food (e.g., Noussair, Robin, &
Ruffieux, 2004).
Food labeling is a major instrument enabling consumers to have
information about the kind of food they purchase and make nutritionally
appropriate choices. Having a supportive marketing environment that
provides content of food items can be considered as a principle in
promoting the health of consumers. Providing food content information
on packets can be thought of as an important element for consumer
protection. “Consumers have as much right to know the nutrien t content
of the foods they choose to purchase as they do to know its country of
origin and that it is safe to eat” (Cowburn and Stockley, 2005).
According to some expert Dieticians, Nutrition fact labels: These
are the labels found on the packaging of the most processed foods.
People can learn a lot about the composition of food from reading these
labels. These labels can be also being useful for learning to predict what
the composition of food product might be (http://dietsinreview.com).
7/28/2019 Compilation of Thesis
http://slidepdf.com/reader/full/compilation-of-thesis 16/63
16
Many countries in the world are developing mandatory or
voluntary programs to assure food safety by using traceability in food
value chain “Traceability is defined as the ability to follow the movement
of a food through specified stage(s) of processing, production, and
distribution” (Souza-Monteiro and Caswell, 2004).
The literature on food labeling can be thought of in two categories.
In the first category, researchers searched the consumer's awareness and
preferences for food labeling. As for the second category, the
respondents‟ willingness-to-pay (WTP) for labeled food is analyzed. As
indicated before, because of some possible diseases resulting from it, a
significant number of researches were conducted on the labeling of meat.
Consumer preferences for labeling of fresh or frozen meat in retail stores
were analyzed by different researchers (Lusk and Fox, 2002; Piedra et al.,
1995; Schupp et al., 1998).
Many countries that have mandatory and voluntary guidelines in
place are currently reviewing their regulations (e.g. United States, EU,
Australia, and New Zealand). In Australia and New Zealand, the
Ministerial Council of Food Standards Australia New Zealand (FSANZ)
launched an independent comprehensive review of food labeling policy in
May 2009. The comment period closed 20 November 2009. The nutrition
labeling debate has reached a critical stage in Australia and New Zealand
as the Food Labeling Law and Policy review was released in January
2011. The review recommends that voluntary multiple traffic lights FOP
7/28/2019 Compilation of Thesis
http://slidepdf.com/reader/full/compilation-of-thesis 17/63
17
labeling system should be introduced, and that such labeling should be
mandatory if health claims are made or equivalent endorsements, trade
names or marks appear on the label (Blewett et al., 2011).
Labeling information should also reflect the needs of consumers.
certain consumers, such as those suffering from diabetes, kidney
disease, heart disease and food allergies, are very aware of their intake of
food, and food labels are their only source of information on the contents
of food products (Chan, 2003:1).
As was stated by NIDO, a local milk brand on the Philippines,
“NIDO is packed with essential nutrients like protein and calcium to help
support growth. It also has DHA and ALA, which are essential for healthy
visual and structural brain development. Check the label to find out how
much essential nutrients and ingredients are in your child’s 3+ milk”
(NIDO Smart Parenting magazine issued October 2010 page54).
The DOST through the leadership of Secretary Estrella F. Alabastro
has committed to make the visions of the Packaging R&D Center
realized. What the local packaging industry has dreamed for the last
twenty years, the DOST made this come true. The Secretary believes the
critical role of packaging in making the Philippine products globally
competitive thus enhancing the socio-economic growth of the country.
Aside from allocating funds for the Center, through her initiative, she has
already created synergy with the business sector like the Packaging
7/28/2019 Compilation of Thesis
http://slidepdf.com/reader/full/compilation-of-thesis 18/63
18
Institute of the Philippines (PIP), Philippine Exporters Confederation
(PHILEXPORT), other government agencies and the learning institutions.
In January 2007, the BFAD issued Bureau Circular 2007-02 titled
“Guidelines in the Use of Nutrition and Health Claims” adopting Codex
Alimentarius Commission CAC/GL 23-1997, Rev. 1-2004, “Guidelines on
the Use of Nutrition and Health Claims”. At the onset of the adoption, the
Bureau did not approve numerous applications to product registrations
due to lack of scientific substantiation of claims, particularly health
claims. Today, the food industry continues to understand the principles
behind the guidelines and identifies / executes means to substantiate
claims including the use of published literature and the conduct of
product clinical studies.
Bayan Muna party-list Rep. Teodoro “Teddy” Casiño, one of the
authors of House Bill (HB) No. 5247, said the measure seeks to uphold
the Filipino consumers’ right to be informed of the contents of what they
are buying and eating. This right to an informed choice will only be
possible if proper labeling is present in food products, particularly those
containing or have undergone genetic modification (Teodoro “Teddy”
Casiño).
Lanao del Norte Rep. Imelda Quibranza Dimaporo, another author
of the bill, said as long as there is no general consensus yet as to the
harmlessness and safety of GMO, it is best to take a precautionary
principle in dealing with these GMOs. Under the measure to be known as
7/28/2019 Compilation of Thesis
http://slidepdf.com/reader/full/compilation-of-thesis 19/63
19
the “Genetically -Modified (GM) Food Labeling Act,” all food and food
products domestically sold, whether manufactured locally or imported,
and which contain genetically-modified organisms, including those
produced by genetic engineering technologies, shall indicate in their
respective labels of packaging that the product contains genetically-
modified organisms or was produced with genetically-engineered material
with the GMO code (Dimaporo, Imelda).
De Leon, Manalo, and Guilatco (2004) conducted a comprehensive
economic study of the potential economic effects of labeling options in
the Philippines, a country that produces GM maize and imports large
volumes of potentially GM commodities. Their study shows that
mandatory labeling would result in an increase of manufacturing costs
by 11 – 12%, which would lead to increases of 10% in consumer prices for
certain products. They conclude that, given the high cost of
implementation and uncertainties in the international regulatory context,
it would be better to avoid the immediate use of mandatory labeling.
Instead they suggested a progressive policy alternative, initiated with the
introduction of a voluntary labeling system, while waiting for a possible
international standard on labeling.
According to Mario V. Capanzana , Ph.D., Director of Food and
Nutrition Research institute, The Food and Nutrition Research Institute
of the Department of Science and Technology (FNRI-DOST), as the
primary R&D institute of the government that mandated to define and
7/28/2019 Compilation of Thesis
http://slidepdf.com/reader/full/compilation-of-thesis 20/63
20
update the Philippine food and nutrition situation through the National
Nutrition Survey. The Food and Nutrition Institute of the Department of
Science and Technology (FNRI-DOST),
These were well received by and proved to be useful to various
organizations and institutions engaged in nutrition and nutrition-related
policy and program development, instruction and research, nutrition
promotion, and food processing, among others. This institute is the one
who execute or monitor the nutritional status or awareness of the
Filipinos about the nutritional benefit that they can get from different
processed food product. According to the Philippine institute of
Development Studies for Nutrition Processed food is that the food has
been subjected to some degree of processing like milling, drying,
concentrating, canning, or addition of some ingredients which changes
partially or completely the physic-chemical and/or sensory characteristic
of the food’s raw material. The study shows on how the processed food
products were manufactured. Philippine institute of Development Studies
Nutrition Processed food (http://www.erbl.plbs.government.ph)
Serving Size
A lot of people these days know that, to calculate how many
calories (or fat, sodium, etc.) you have actually consumed, it’s a complex
recitation of your multiplication tables: the number of calories in one
serving times the number of servings you think you had. The FDA has
7/28/2019 Compilation of Thesis
http://slidepdf.com/reader/full/compilation-of-thesis 21/63
21
been debating changing the serving sizes on food labels to reflect what
people actually eat, especially since portion sizes today are significantly
larger than what the labels predict.
A consumer advocacy group called the Center for Science in the
Public Interest has targeted a few foods whose portion sizes are almost
hilariously unrealistic. After conducting a series of studies, the group
found that the serving sizes for canned soups, ice cream, coffee
creamers, and nonstick cooking sprays grossly underestimated how
much the average person would consume (Ossola, Alexandra).
Four consumer focus group sessions, with a total of 40
participants, were conducted to gather information on the utility and
appropriateness of selected components of nutrition label formats. The
formats reviewed were bar graphs, pie charts, numeric listings, and
adjectival descriptors such as high and low. Participants were asked to
compare food labels using various format types and to discuss the utility
and interpretability of the formats. The outcomes suggested that these
consumers did not find pie charts useful. They considered bar graphs
confusing or unnecessary when numeric values were provided.
Participants expressed concern that adjectival descriptors could be
misleading. The numeric listing format they considered the most useful
consisted of two columns of numbers: one listing the amounts of food
components present in a serving of the food, and a second listing either
the percentage of the label reference value (e.g., the US Recommended
7/28/2019 Compilation of Thesis
http://slidepdf.com/reader/full/compilation-of-thesis 22/63
22
Daily Allowance) or the quantity established as the label reference value.
Participants repeatedly stressed their interest in a simple label. The
results form one component of the Food and Drug Administration's
efforts to evaluate nutrition label formats and will be used in conjunction
with ongoing experimental and quantitative research studies. (Lewis and
Yetley, 1992).
Barbara Rolls, holder of the Guthrie chair of nutritional sciences
and director of the Laboratory for the Study of Human Ingestive
Behavior, found that when served larger portions for an extended period
of time, people consume more food over the entire period.
The research suggests that larger portion could be a driving force
behind the obesity epidemic. Other research has shown that since 1970s
portion sizes of restaurant foods and products have continued to
increase.
Percent Daily Values
In 1990, the United States Congress passed the Nutrition Labeling
and Education Act. This was a very positive move for consumers
because, since 1994, the U.S. Food and Drug Administration (FDA) has
required packaged foods to display labels giving key information about
their contents. The labels must follow a specific format that is very
consumer-friendly. The format gives the nutrient content of foods and
indicates their relationship to a balanced diet. The label also provides an
7/28/2019 Compilation of Thesis
http://slidepdf.com/reader/full/compilation-of-thesis 23/63
23
accurate ingredient listing while specifying all the ingredients in order,
from most (by weight) to least. This list ensures all ingredients are
disclosed in their full amounts.
The numbers on the Nutrition Facts Panel are based on one serving, and
the label tells exactly what one serving means. It may mean one cup of
yogurt, one-half cup of ice cream or fourteen crackers. It’s important to
make note of the serving size so you know how many servings you are
consuming. The servings on the food label are usually, but not always,
exactly the same as the Food Pyramid servings
(http://www.swansonvitamins.com).
The recommended daily values do not take into account the age,
gender, activity level or specific dietary needs a person may have. All of
these factors are known to impact the body’s ability to utilise nutrients in
the food. An unknown, complicating factor is the abundance of highly
processed foods in restaurants and grocery stores. Convenience is
becoming the most important part of our food – not nutrients. Recent
studies show that the amount of grinding, slicing, mashing and
manipulating away from a food’s natural state affects the availability of
calories people get. Processing increases the amount of calories one can
get from the food. This may appear to be good news but processed foods
often contain artificial colourings, sugars, preservatives and other added
chemicals that are unhealthy and addictive. Being addicted to these
7/28/2019 Compilation of Thesis
http://slidepdf.com/reader/full/compilation-of-thesis 24/63
24
foods will increase consumption, increase calories consumed and
encourage weight gain, diabetes and heart disease. Processed foods may
serve a purpose for the under-nourished but over-nourishment and
weight gain has become the most prevalent health complication in the
world. The rates of non-communicable diseases (NCDs) are increasing
out of control in most regions.
Current system outdated Scientists have always known that the
amounts of calories in a particular food are just estimates. Over recent
years, many scientists are calling for changes to the limited system. The
increased awareness of the consumer is demanding easy, accurate and
reliable information about the food that they eat. “If we’re going to put
the information out there on the food label, it would be nice that it’s
accurate,” says David Baer, a research physiologist at the U.S.
Department of Agriculture’s Human Nutrition Research Centre in
Beltsville, Md.
A 2012 study showed how almonds had 20 percent fewer usable
calories than previously estimated. Almonds are roasted, sliced, salted
and processed in many different ways. The type of processing will affect
digestion, percentage of absorption and overall caloric load on the
body. Convenience foods high in calories, eating a potato that is over-
cooked will change the calories we get from it. For example, if you eat a
mashed potato that’s been calculated to contain 300 calories, you’re
likely to absorb most of those calories. But if you eat a whole,
7/28/2019 Compilation of Thesis
http://slidepdf.com/reader/full/compilation-of-thesis 25/63
25
unprocessed potato of the same size, you’ll take in around 200
calories. This is a substantial difference if one is trying to lose and
maintain a healthy weight. The processing of food impacts
carbohydrates a lot more than proteins as they are easier to breakdown
in the body. Experts estimate the calories from unprocessed versus
processed meats may only differ by five to 10 percent while certain
carbohydrates could be as much as 50 percent (Dr. Couillard, Cory).
Product Ingredient
According to U.S. Food and Drug Administration nutrient
content claims ought to tell the consumers the precise content of the
nutrients of the product for them to easily choose a product that fits
their appetite. Nutrient content claims. U.S. Food and Drug
administration, Center for Food Safety and Applied Nutrition (Food
labeling Question and Answers 1993).
Labels can range from simple tags attached to products to complex
graphics a product packaging. Labels perform several functions, such as
to identify the product or brand, and to indicate who made it, where it
was made, when it was made and its contents. Labels are also used to
promote products (Kohler & Armstrong, 2001:12).
A quasi-experimental repeated measures design using a matched
set of 20 test and comparison supermarkets in the Washington, D.C. and
Baltimore, Md., metropolitan areas was used to evaluate a nutrition
7/28/2019 Compilation of Thesis
http://slidepdf.com/reader/full/compilation-of-thesis 26/63
26
information program called "Special Diet Alert" (SDA) introduced by
Giant Food, Inc. into Washington, D.C. stores in March 1981. The
objective of the SDA program was to help supermarket shoppers find
products for special diet needs by providing brand-specific (i.e.,
individual product level) shelf markers that identified products
considered low or reduced in sodium, calories, cholesterol, and fat,
supplemented by take-away information booklets available from a rack in
the store which listed SDA brand names and specific nutrient values.
Market shares of these products were tracked over the two-year
evaluation period in Washington, D.C. and Baltimore stores. The pattern
of differential sales trends across 16 individual food categories was
complicated, but sales of shelf-marked products increased on the average
4 to 8 percent more over the two-year evaluation period in Washington,
D.C. than in Baltimore, Md. stores. The average magnitude of effect
attributable to SDA was modest in comparison with other factors
influencing consumer purchases, highlighting the need for powerful
evaluation designs to assess the effectiveness of information programs
that operate in the context of many other more powerful influences.
Further research is needed to determine which aspects of the SDA
program were critical to its success, but one obvious difference between
SDA and other in-store nutrition information programs that have been
reported in the literature was the use of individual brand-specific shelf
markers to deliver nutrition information to shoppers rather than
7/28/2019 Compilation of Thesis
http://slidepdf.com/reader/full/compilation-of-thesis 27/63
27
prominently displayed sectional posters and detailed educational
pamphlets (Levy, Mathews, Stephenson, Tenney and Schucker 1985).
Theoretical Framework
This study was anchored on Kohler’s learning and insight theory.
According to Wolfgang Kohler proposed the view that insight follows from
the characteristics of objects under consideration. His theory suggested
that learning could occur by "sudden comprehension" as opposed to
gradual understanding. This could occur without reinforcement, and
once it occurs, no review, training, or investigation are necessary.
Significantly, insight is not necessarily observable by another person.
This theory was attested by Julie A. Caswell and Daniel I. Padberg.
According to them food labels play important third-party roles in the food
marketing system through their impact on product design, advertising,
consumer confidence in food quality, and consumer education on diet
and health. However, current analysis focuses overwhelmingly on the
label's direct use as a point-of-purchase shopping aid, even though
such use is limited by consumers' information processing abilities
7/28/2019 Compilation of Thesis
http://slidepdf.com/reader/full/compilation-of-thesis 28/63
28
Research Paradigm
Independent Variable
Dependent Variable
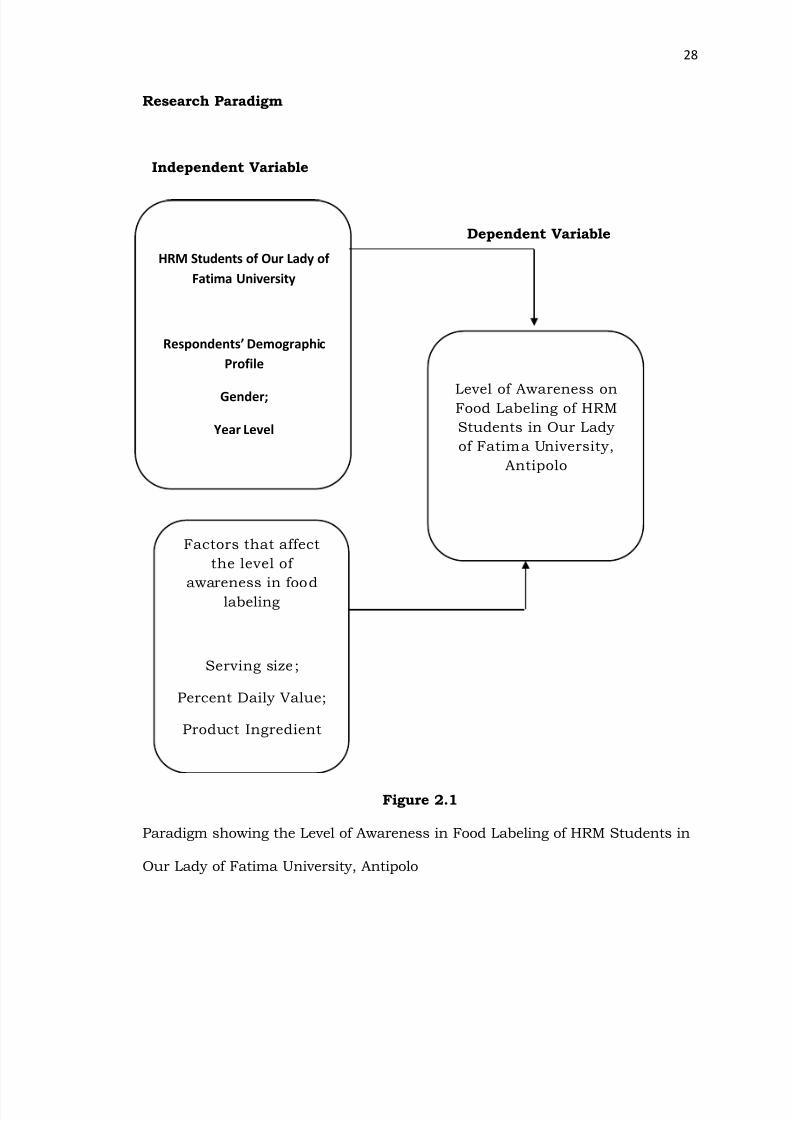
Figure 2.1
Paradigm showing the Level of Awareness in Food Labeling of HRM Students in
Our Lady of Fatima University, Antipolo
HRM Students of Our Lady of
Fatima University
Respondents’ Demographic
Profile
Gender;
Year Level
Factors that affect
the level of
awareness in foodlabeling
Serving size;
Percent Daily Value;
Product Ingredient
Level of Awareness onFood Labeling of HRM
Students in Our Lady
of Fatima University,
Antipolo
7/28/2019 Compilation of Thesis
http://slidepdf.com/reader/full/compilation-of-thesis 29/63
29
Figure 2.1 shows the Level of Awareness in Food Labeling of HRM
Students in Our Lady of Fatima University, Antipolo.
The independent variable includes the profile of the HRM Students in
terms of gender, and year level. It also includes the factors that affect the Level
of Awareness in Food Labeling of HRM Students rendered in Our Lady of
Fatima University, Antipolo.
Level of Awareness on Food Labeling of HRM Students rendered by Our
Lady of Fatima University, Antipolo is the dependent variable.
On the other hand, the process explains how the profile of the
respondents and the factors which affects the level of awareness in food labeling
of HRM students rendered by Our Lady of Fatima University, Antipolo.
7/28/2019 Compilation of Thesis
http://slidepdf.com/reader/full/compilation-of-thesis 30/63
30
CHAPTER 3
Research Methodology
The chapter presents the method of research use. The description
of respondents, the population and locale, the instrument use in the data
gathering and the statistical measures and procedures utilized in the
treatment of data to ensure validity and reliability of interpretation.
Research Design
This study used a Descriptive Research Design. The descriptive
method describes what it is. It is concerned with condition that exist,
opinions that are held, processes that are going on, efforts that are
evident, or trends that are developing. Hence this method was used to
describe the study.
The researchers used the survey questionnaires. The
questionnaires are answerable within 5 to 10 minutes and it took one
day for researcher to collect information. The last day was for the
retrieval of the questionnaires.
7/28/2019 Compilation of Thesis
http://slidepdf.com/reader/full/compilation-of-thesis 31/63
31
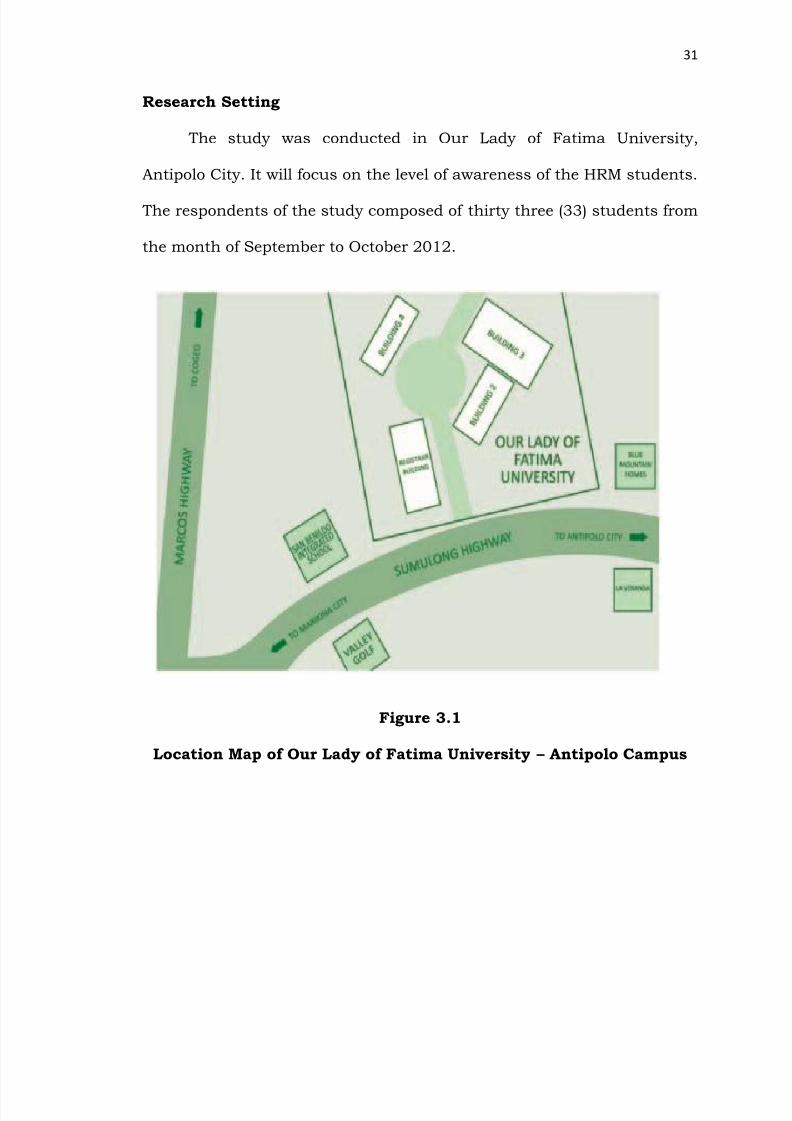
Research Setting
The study was conducted in Our Lady of Fatima University,
Antipolo City. It will focus on the level of awareness of the HRM students.
The respondents of the study composed of thirty three (33) students from
the month of September to October 2012.
Figure 3.1
Location Map of Our Lady of Fatima University – Antipolo Campus
7/28/2019 Compilation of Thesis
http://slidepdf.com/reader/full/compilation-of-thesis 32/63
32
Research Instruments
The main instrument used in this study is the questionnaire
consisting of 2 parts, namely demographic profile and the level of
awareness of the selected HRM students in food labeling in terms of
Serving Size, Percent Daily Value, and Product Ingredients. The personal
data includes the respondents’ gender and year level, but study will
focus only in the level of awareness.
Validation of the Instrument
The first draft of the questionnaire was submitted to the
researcher’s adviser and critic for comments and suggestions for
improvement. It was forwarded for content validation. Items that did not
correspond to the statement of the problems were discarded based on the
evaluation and recommendations made by the research adviser.
Questions found to be vague and difficult to answer were changed and
improved and put into final form. Validity and reliability testing for the
questionnaire using pre-posttests method. These respondents had the
same population characteristics similar to target respondents but
excluded in the study.
Data Gathering Procedures
The researchers request a letter if they can conduct their study
in the said locale, while the researchers is waiting for the confirmation of
the letter, they consult the experts for the validity of the questionnaires.
Then after a couple of days, the School will confirm it and allow the
7/28/2019 Compilation of Thesis
http://slidepdf.com/reader/full/compilation-of-thesis 33/63
33
researchers to implement their study. Meanwhile, on the said School,
researchers started to distribute the questionnaires in thirty one (33)
respondents but first, researchers looked if the respondents are suitable
in the inclusions of the study. Before doing the implementation, the
researchers asked for their consent.
Statistical Treatment
The statistical treatment used was frequency, percentage
distribution and t-test for the demographic profile of the respondents and
weighted mean for the survey questions. The instrument used was
survey questionnaire regarding to the level of awareness on food labeling
products, parameters like gender, year level, etc. would be important in
influencing the person. Therefore the data needs to be treated in these
reference frames.
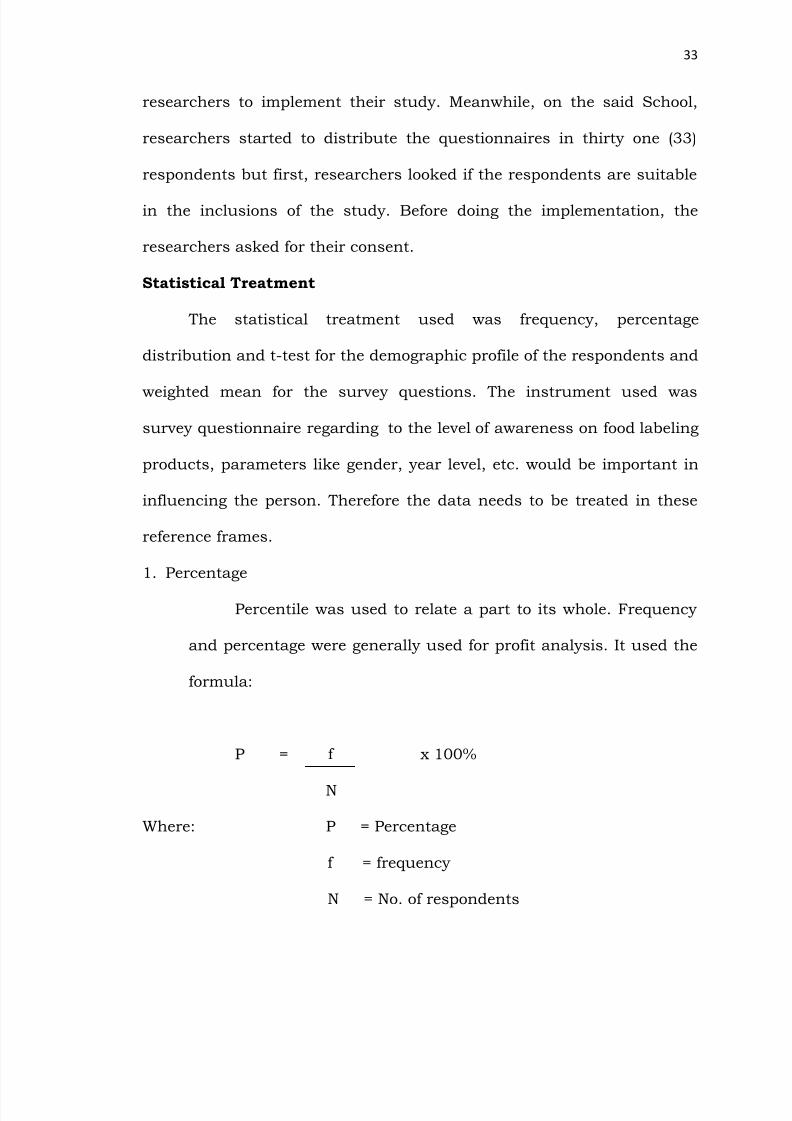
1. Percentage
Percentile was used to relate a part to its whole. Frequency
and percentage were generally used for profit analysis. It used the
formula:
P = f x 100%
N
Where: P = Percentage
f = frequency
N = No. of respondents
7/28/2019 Compilation of Thesis
http://slidepdf.com/reader/full/compilation-of-thesis 34/63
34
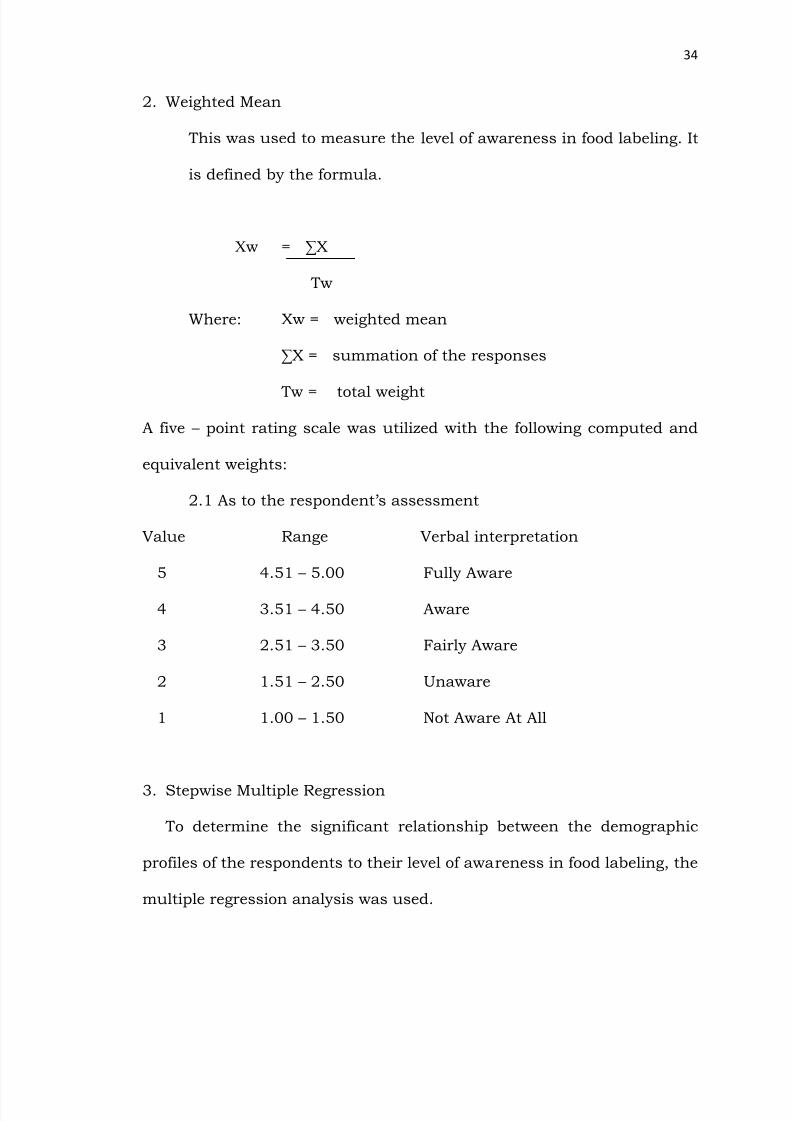
2. Weighted Mean
This was used to measure the level of awareness in food labeling. It
is defined by the formula.
Χw = ∑X
Tw
Where: Xw = weighted mean
∑X = summation of the responses
Tw = total weight
A five – point rating scale was utilized with the following computed and
equivalent weights:
2.1 As to the respondent’s assessment
Value Range Verbal interpretation
5 4.51 – 5.00 Fully Aware
4 3.51 – 4.50 Aware
3 2.51 – 3.50 Fairly Aware
2 1.51 – 2.50 Unaware
1 1.00 – 1.50 Not Aware At All
3. Stepwise Multiple Regression
To determine the significant relationship between the demographic
profiles of the respondents to their level of awareness in food labeling, the
multiple regression analysis was used.
7/28/2019 Compilation of Thesis
http://slidepdf.com/reader/full/compilation-of-thesis 35/63
35
CHAPTER 4
Presentation, Analysis and Interpretation of Data
This chapter presents, analyzes and interprets the data gathered through
the questionnaire. Data were examined, analyzed and organized based on the
problems stated in Chapter 1.
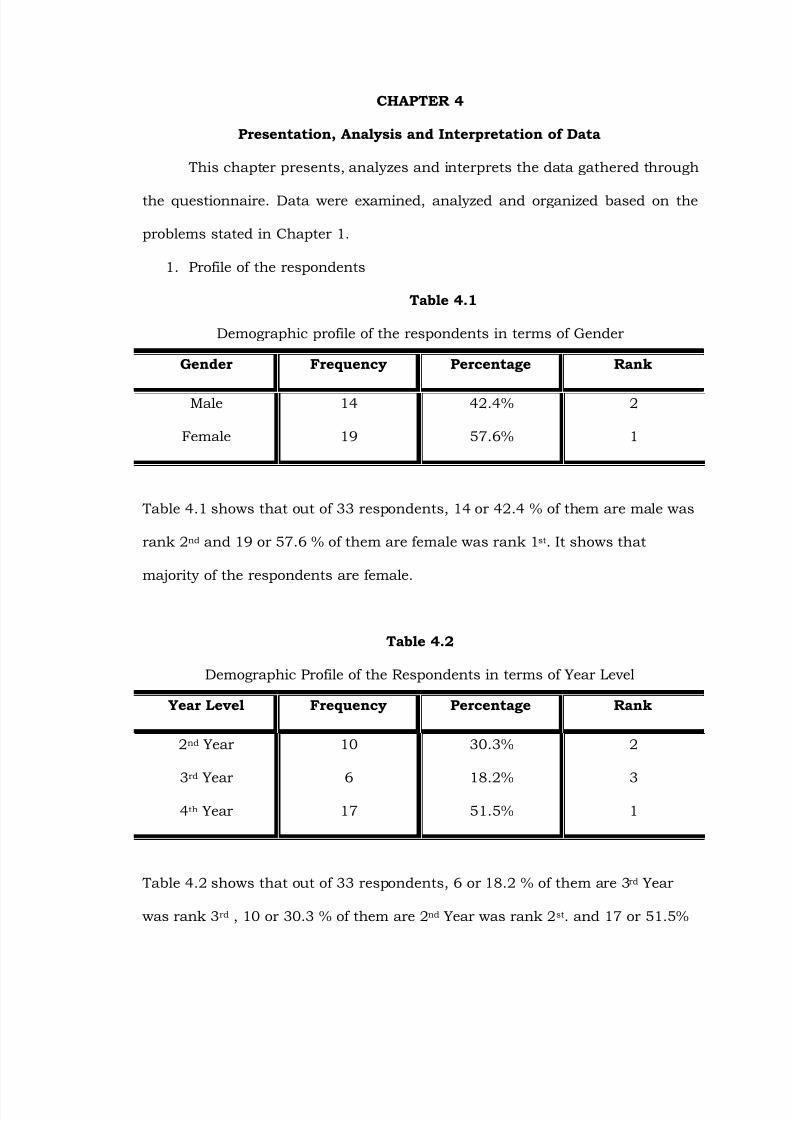
1. Profile of the respondents
Table 4.1
Demographic profile of the respondents in terms of Gender
Gender Frequency Percentage Rank
Male
Female
14
19
42.4%
57.6%
2
1
Table 4.1 shows that out of 33 respondents, 14 or 42.4 % of them are male was
rank 2nd and 19 or 57.6 % of them are female was rank 1st. It shows that
majority of the respondents are female.
Table 4.2
Demographic Profile of the Respondents in terms of Year Level
Year Level Frequency Percentage Rank
2nd Year
3rd Year
4th Year
10
6
17
30.3%
18.2%
51.5%
2
3
1
Table 4.2 shows that out of 33 respondents, 6 or 18.2 % of them are 3rd Year
was rank 3rd , 10 or 30.3 % of them are 2nd Year was rank 2st. and 17 or 51.5%
7/28/2019 Compilation of Thesis
http://slidepdf.com/reader/full/compilation-of-thesis 36/63
36
of them are 4th Year was rank 1st . It shows that majority of the respondents are
4th Year students.
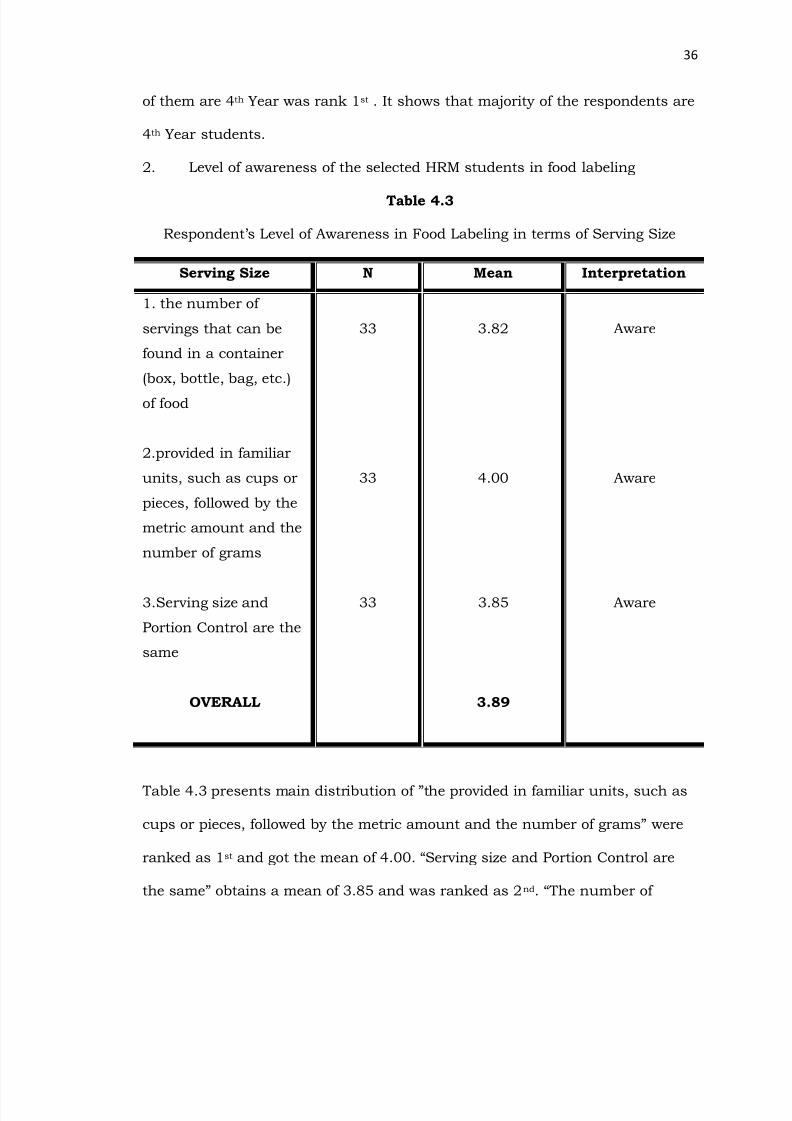
2. Level of awareness of the selected HRM students in food labeling
Table 4.3
Respondent’s Level of Awareness in Food Labeling in terms of Serving Size
Serving Size N Mean Interpretation
1. the number of
servings that can be
found in a container
(box, bottle, bag, etc.)
of food
33 3.82 Aware
2.provided in familiar
units, such as cups or
pieces, followed by the
metric amount and the
number of grams
33 4.00 Aware
3.Serving size and
Portion Control are the
same
OVERALL
33 3.85
3.89
Aware
Table 4.3 presents main distribution of ”the provided in familiar units, such as
cups or pieces, followed by the metric amount and the number of grams” were
ranked as 1st and got the mean of 4.00. “Serving size and Portion Control are
the same” obtains a mean of 3.85 and was ranked as 2nd. “ The number of
7/28/2019 Compilation of Thesis
http://slidepdf.com/reader/full/compilation-of-thesis 37/63
37
servings that can be found in a container (box, bottle, bag, etc.) of food” got the
mean of 3.82 and ranked as 3rd. All of the items mentioned got the
interpretation of there are Aware.
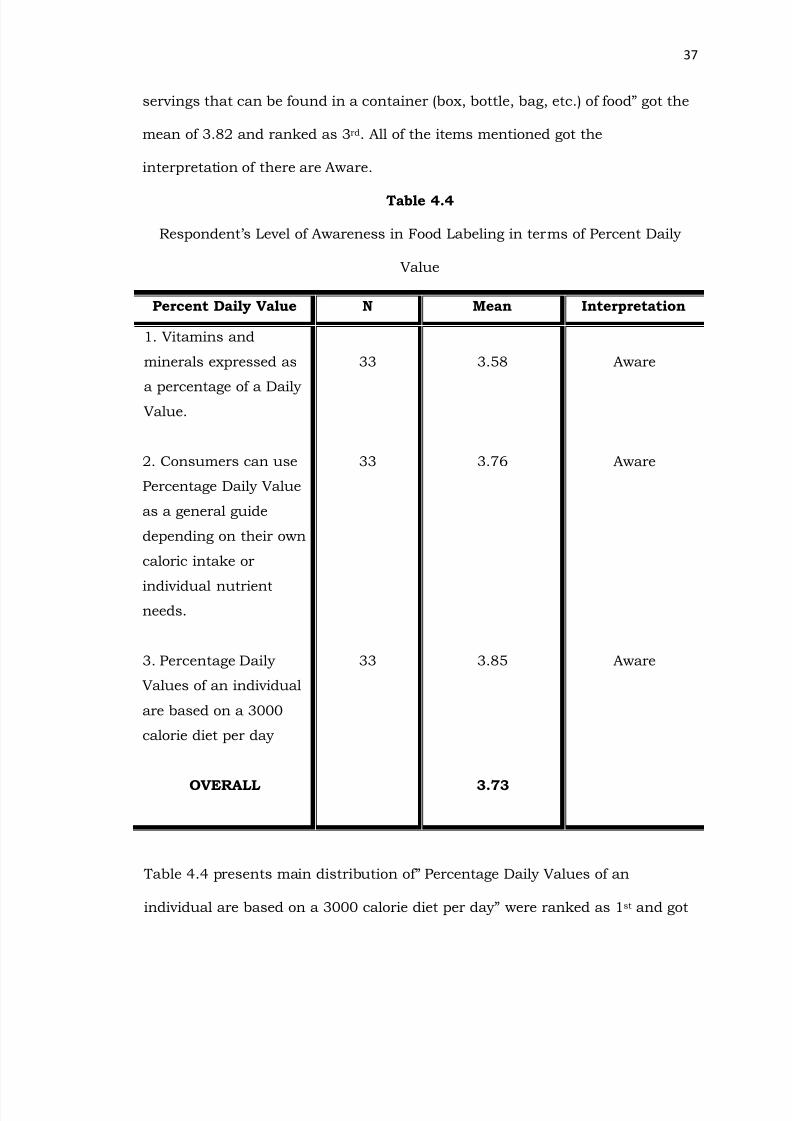
Table 4.4
Respondent’s Level of Awareness in Food Labeling in terms of Percent Daily
Value
Percent Daily Value N Mean Interpretation
1. Vitamins and
minerals expressed as
a percentage of a Daily Value.
33 3.58 Aware
2. Consumers can use
Percentage Daily Value
as a general guide
depending on their own
caloric intake or
individual nutrientneeds.
33 3.76 Aware
3. Percentage Daily
Values of an individual
are based on a 3000
calorie diet per day
33 3.85 Aware
OVERALL 3.73
Table 4.4 presents main distribution of” Percentage Daily Values of an
individual are based on a 3000 calorie diet per day” were ranked as 1st and got

7/28/2019 Compilation of Thesis
http://slidepdf.com/reader/full/compilation-of-thesis 38/63
38
the mean of 3.85. “Consumers can use Percentage Daily Value as a general
guide depending on their own caloric intake or individual nutrient needs.”
obtains a mean of 3.76 and was ranked as 2nd. “Vitamins and minerals
expressed as a percentage of a Daily Value.” got the mean of 3.58 and ranked
as 3rd. All of the items mentioned got the interpretation of there are Aware.
Table 4.5
Respondent’s Level of Awareness in Food Labeling in terms of Product
Ingredients
Product Ingredients N Mean Interpretation
1. Important that
product ingredients must
be listed on food label
33 3.73 Aware
2. Product Ingredients
can be seen in Nutrition
Fact Table
33 3.79 Aware
3. All foods have to carry
an ingredients list
33 3.79 Aware
OVERALL 3.77
Table 4.5 presents main distribution of “Product Ingredients can be seen in
Nutrition Fact Table” and “All foods have to carry an ingredients list” were
7/28/2019 Compilation of Thesis
http://slidepdf.com/reader/full/compilation-of-thesis 39/63
39
ranked as 1st and got the same mean of 3.79. “Important that product
ingredients must be listed on food label” obtains a mean of 3.73 and was
ranked as 2nd. All of the items mentioned got the interpretation of there are
Aware.
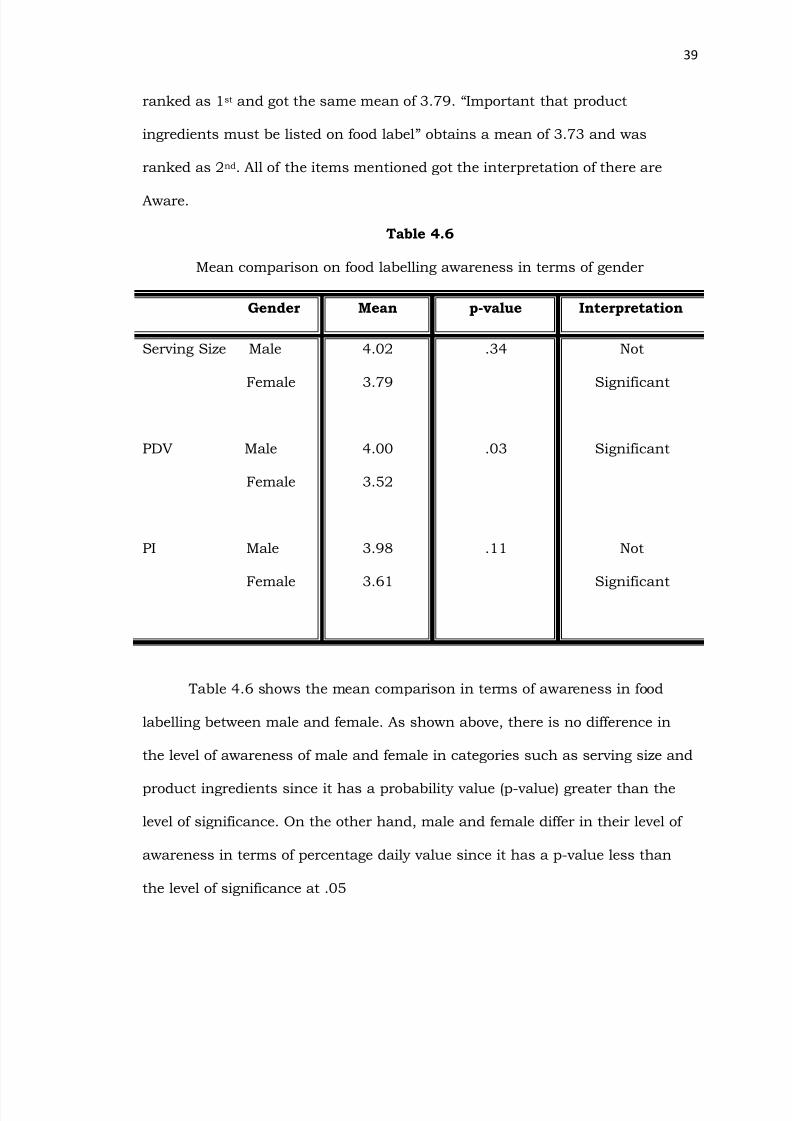
Table 4.6
Mean comparison on food labelling awareness in terms of gender
Gender Mean p-value Interpretation
Serving Size Male
Female
PDV Male
Female
PI Male
Female
4.02
3.79
4.00
3.52
3.98
3.61
.34
.03
.11
Not
Significant
Significant
Not
Significant
Table 4.6 shows the mean comparison in terms of awareness in food
labelling between male and female. As shown above, there is no difference in
the level of awareness of male and female in categories such as serving size and
product ingredients since it has a probability value (p-value) greater than the
level of significance. On the other hand, male and female differ in their level of
awareness in terms of percentage daily value since it has a p-value less than
the level of significance at .05
7/28/2019 Compilation of Thesis
http://slidepdf.com/reader/full/compilation-of-thesis 40/63
40
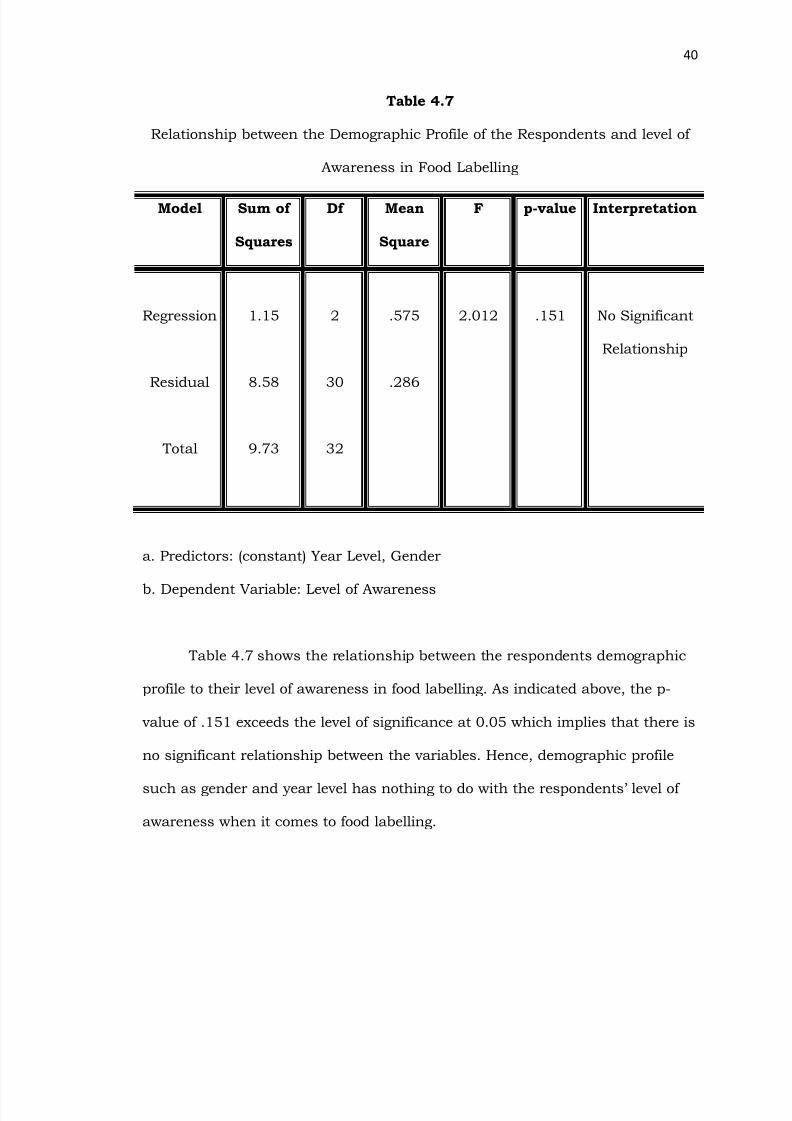
Table 4.7
Relationship between the Demographic Profile of the Respondents and level of
Awareness in Food Labelling
Model Sum of
Squares
Df Mean
Square
F p-value Interpretation
Regression
Residual
Total
1.15
8.58
9.73
2
30
32
.575
.286
2.012 .151 No Significant
Relationship
a. Predictors: (constant) Year Level, Gender
b. Dependent Variable: Level of Awareness
Table 4.7 shows the relationship between the respondents demographic
profile to their level of awareness in food labelling. As indicated above, the p-
value of .151 exceeds the level of significance at 0.05 which implies that there is
no significant relationship between the variables. Hence, demographic profile
such as gender and year level has nothing to do with the respondents’ level of
awareness when it comes to food labelling.
7/28/2019 Compilation of Thesis
http://slidepdf.com/reader/full/compilation-of-thesis 41/63
41
CHAPTER 5
Summary of Findings, Conclusions and Recommendations
This chapter includes the summary of the findings, the
conclusions based on the findings and the recommendation.
Summary of Findings
Based on the tabulated data presented in Chapter 4, the study
revealed the following:
1. In terms of demographic profile, it was found out that:
1.1 Fourteen or 42.4 % of them are male and nineteen or
57.6 % of them are female.
1.2 Six of them are 3rd year, ten of them are 2nd year and
seventeen of them are 4th year.
2. Respondents’ Level of Awareness in Food Labeling
2.1 In terms of serving size, it was found out that:
2.1.1 “The number of servings that can be found in a
container (box, bottle, bag, etc.) of food” were ranked as 3 rd and
got the mean of 3.82.
2.1.2 “ The provided in familiar units, such as cups or pieces,
followed by the metric amount and the number of grams”
were ranked as 1st and got the mean of 4.00.

7/28/2019 Compilation of Thesis
http://slidepdf.com/reader/full/compilation-of-thesis 42/63
42
2.1.3 “Serving size and Portion Control are the same” were
ranked as 2nd and obtains a mean of 3.85. All of the items
mentioned got the interpretation of there are aware.
2.2 In terms of Percentage Daily Value, it was found out that:
2.2.1 “Vitamins and minerals expressed as a percentage of a
Daily Value” were ranked as 3rd and got the mean of 3.58.
2.2.2 “Consumers can use Percentage Daily Value as a general
guide depending on their own caloric intake or individual
nutrient needs” were ranked as 2nd and obtains a mean of
3.76
2.2.3 “Percentage Daily Values of an individual are based on a
3000 calorie diet per day” were ranked as 1st and got the
mean of 3.85. All of the items mentioned got the
interpretation of there are aware.
2.3 In terms of Product Ingredients, it was found out that:
2.3.1 “Important that product ingredients must be listed on
food label” were ranked as 2nd and obtains a mean of
3.73.
2.3.2 “Product Ingredients can be seen in Nutrition Fact Table”
were ranked as 1st and obtains mean of 3.79.
7/28/2019 Compilation of Thesis
http://slidepdf.com/reader/full/compilation-of-thesis 43/63
43
2.3.3 “All foods have to carry an ingredients list” were also
ranked as 1st and got the same mean of 3.79. All of the
items mentioned got the interpretation of there are aware.
3. Relationship between the Demographic Profile of the Respondents and
level of Awareness in Food Labeling, it was found out that:
3.1 Since the p-value of .151 exceeds the level of significance at
0.05 which implies that there is no significant relationship
between the variables. Hence, demographic profile such as gender
and year level has nothing to do with the respondents’ level of
awareness when it comes to food labeling.
Conclusions
In the light of the findings of the study, the following conclusions
are drawn:
1. Most of the respondents are 4th year students and most of them
are female, which admitted that there were aware in food labeling.
2. The mean distribution of the level of awareness of the selected
HRM students in food labeling in terms of Serving Size an aware
remark. The mean distribution of the level of awareness of the
selected HRM students in food labeling in terms of Percent daily
value also got an aware remark. The mean distribution of the level
of awareness of the selected HRM students in food labeling in
terms of product ingredients also got an aware remark. Over all,
7/28/2019 Compilation of Thesis
http://slidepdf.com/reader/full/compilation-of-thesis 44/63
44
the student respondents agreed with level of awareness of the
selected HRM students in food labeling in terms of Serving size,
Percent Daily Value and Product ingredients.
3. There is no significant relationship between the demographic
profile of the students and the level of awareness of the selected
HRM students in food labeling.
Recommendations
The researchers suggest the following recommendations:
To the HRM Students
Try to use this study as a guide for innovating healthy foods.
All of the HRM student must be aware on the nutrition facts
on food labels for them to know the reliability, importance
and the use of the product before consumption.
To the Consumers
Should read the label of the product to help them chose and
compare the healthier food to buy.
Must be aware on the nutritional content and the benefit
that can get from it.
To the Professors
Should encourage students to use this study as a guide for a
healthy diet.
Should teach and give ideas to the students the benefit of
reading the label of a food product before buying it.

7/28/2019 Compilation of Thesis
http://slidepdf.com/reader/full/compilation-of-thesis 45/63
45
To the Future Researchers
Try to use this study and expand more ideas about food
labeling.
7/28/2019 Compilation of Thesis
http://slidepdf.com/reader/full/compilation-of-thesis 46/63
46
REFERENCE LIST
A. Books
Blewett et al., (2011), Kohler, Armstrong, (2001:12) Mandatory and
Voluntary Guidelines
Lusk and Fox, 2002; Piedra et al., (1995); Schupp et al., (1998).Literature on Food Labeling
Noussair, Robin, Ruffieux, (2004) Cowburn and Stockley, (2005).Observed Effects of Labeling Regulations.
Souza-Monteiro and Caswell, (2004). Mandatory or Voluntary Programsto Assure Food Safety.
Streiffer & Rubel, (2003); Hansen, (2004); McKay White & Veeman,(2007). Observed Effects of Labeling Regulations.
U.S. Food and Drug Administration nutrient (1993). Food labelingQuestion and Answers.
B. Journals
Baltas, George (2001). "Nutrition labelling: issues and policies", European Journal of Marketing, Vol. 35 Iss: 5/6, pp.708 – 721.
Heimbach, James T., and Stokes, Raymond C., (1992). Nutrition Labelingand Public Health: Survey of American Institute of NutritionMembers, Food Industry, and Consumers. American Journal
of Clinical Nutrition 36:700-708.
Levy, Allan S., Fein, Sara B., (1998). Consumers' Ability to Perform TasksUsing Nutrition Labels. Journal of Nutrition Education
30(4):210 217) Levy, Fein, Schucker, Raymund E., (1992). More Effective Nutrition
Label Formats Are Not Necessarily Preferred. Journal ofAmerican
Dietetic Association 92(10):1230-1234.
Levy, Allan S., Fein, Sara B., and Schucker, Raymond E., (1996).Performance Characteristics of Seven Nutrition LabelFormats. Journal of Public Policy and Marketing 15(1):1-15.
Levy, Alan S., Mathews, Odonna, Stephenson, Marilyn, Tenney, Janet E.,and Schucker, Raymond E., (1985). The Impact of a
7/28/2019 Compilation of Thesis
http://slidepdf.com/reader/full/compilation-of-thesis 47/63
47
Nutrition Information Program on Food Purchases. Journal of Public Policy and Marketing 4(1)1-13.
Lewis, Cristine J., and Yetley, Elizabeth A., (1992). Focus Group
Sessions on Formats on Nutrition Labels, Journal of the
American Dietetic Association 92(1):62-66.
Teisl, Mario F., Levy, Allan S., (1997). Does Nutrition Labeling Lead toHealthier Eating. Journal of Food Distribution Research.
3(28):19 26.
Wandel, Margareta (1997). Food labeling from a consumer perspective. British Food Journal, Vol. 99 Iss: 6, pp.212 – 219.
C. Magazines
Alabastro, Estrella F. BFAD (2007). Guidelines in the Use of Nutritionand Health
Dr. Romualdez, Alberto. Smart Parenting magazine issued October 2010 page15.
NIDO (2010). Smart Parenting magazine issued page54
Taub-Dix, Bonnie. Men’s Health Magazine. American Dietetic Association
MensHealth magazine issued March-April 2009 page 34
D. Electronic References
Casiño, Teodoro, Dimaporo, Imelda. Bill on mandatory food labeling filed.Retrieved from http://www.erbl.plbs.government.ph on October,
2012.
Capanzana, Mario V., Food and Nutrition Research Institute.http://www.erbl.plbs.government.ph
De Leon, Manalo, and Guilatco (2004). Cost of Labeling Requirements. http://dietsinreview.com
Nutrition fact labels. Retrieved from http://dietsinreview.com onOctobers, 2012
7/28/2019 Compilation of Thesis
http://slidepdf.com/reader/full/compilation-of-thesis 48/63
48
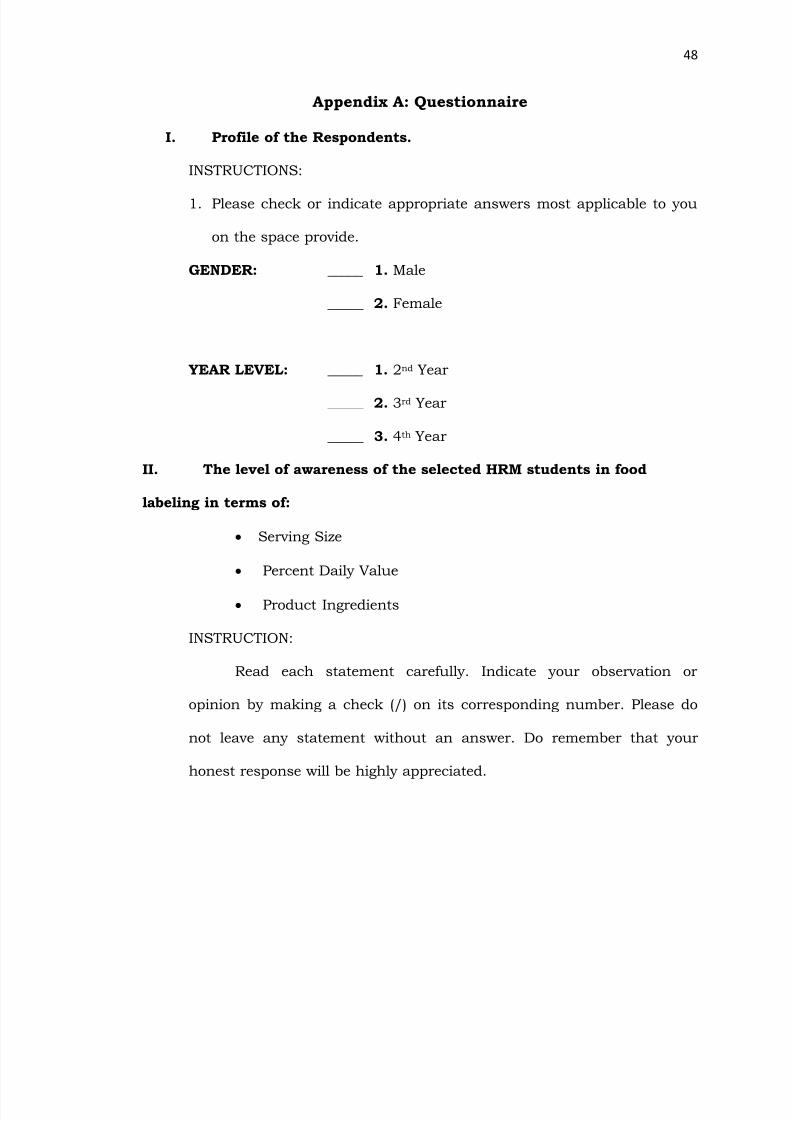
Appendix A: Questionnaire
I. Profile of the Respondents.
INSTRUCTIONS:
1. Please check or indicate appropriate answers most applicable to you
on the space provide.
GENDER: _____ 1. Male
_____ 2. Female
YEAR LEVEL: _____ 1. 2nd Year
_____ 2. 3rd Year
_____ 3. 4th Year
II. The level of awareness of the selected HRM students in food
labeling in terms of:
Serving Size
Percent Daily Value
Product Ingredients
INSTRUCTION:
Read each statement carefully. Indicate your observation or
opinion by making a check (/) on its corresponding number. Please do
not leave any statement without an answer. Do remember that your
honest response will be highly appreciated.
7/28/2019 Compilation of Thesis
http://slidepdf.com/reader/full/compilation-of-thesis 49/63
49
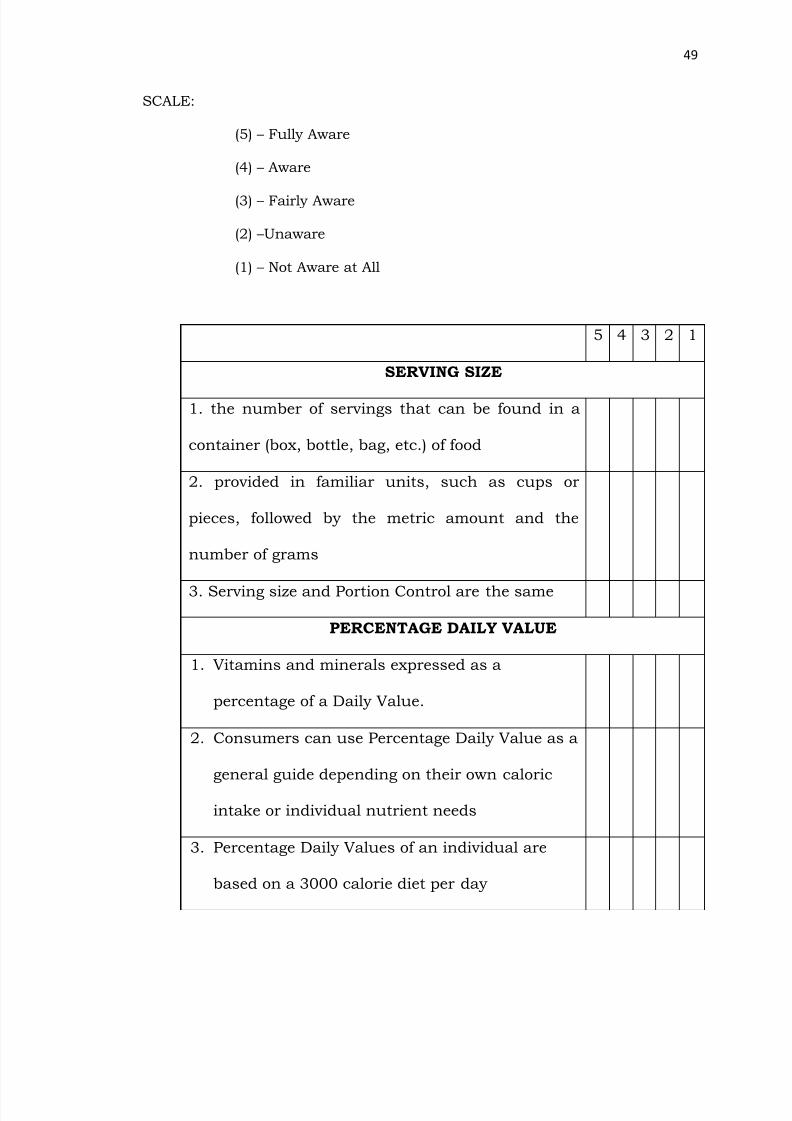
SCALE:
(5) – Fully Aware
(4) – Aware
(3) – Fairly Aware
(2) – Unaware
(1) – Not Aware at All
5 4 3 2 1
SERVING SIZE
1. the number of servings that can be found in a
container (box, bottle, bag, etc.) of food
2. provided in familiar units, such as cups or
pieces, followed by the metric amount and the
number of grams
3. Serving size and Portion Control are the same
PERCENTAGE DAILY VALUE
1. Vitamins and minerals expressed as a
percentage of a Daily Value.
2. Consumers can use Percentage Daily Value as a
general guide depending on their own caloric
intake or individual nutrient needs
3. Percentage Daily Values of an individual are
based on a 3000 calorie diet per day

7/28/2019 Compilation of Thesis
http://slidepdf.com/reader/full/compilation-of-thesis 50/63
50
PRODUCT INGREDIENT
1. Important that product ingredients must be
listed on food label
2. Product Ingredients can be seen in Nutrition
Fact Table
3. All foods have to carry an ingredients list
7/28/2019 Compilation of Thesis
http://slidepdf.com/reader/full/compilation-of-thesis 51/63
51
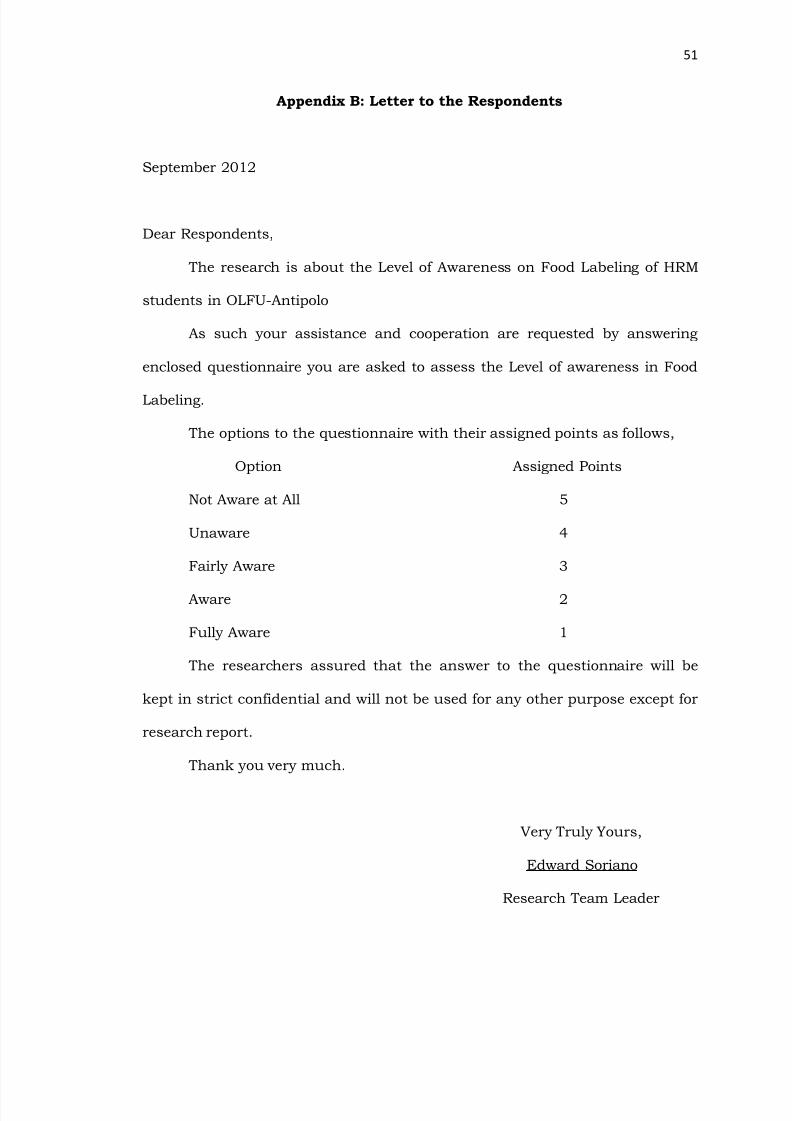
Appendix B: Letter to the Respondents
September 2012
Dear Respondents,
The research is about the Level of Awareness on Food Labeling of HRM
students in OLFU-Antipolo
As such your assistance and cooperation are requested by answering
enclosed questionnaire you are asked to assess the Level of awareness in Food
Labeling.
The options to the questionnaire with their assigned points as follows,
Option Assigned Points
Not Aware at All 5
Unaware 4
Fairly Aware 3
Aware 2
Fully Aware 1
The researchers assured that the answer to the questionnaire will be
kept in strict confidential and will not be used for any other purpose except for
research report.
Thank you very much.
Very Truly Yours,
Edward Soriano
Research Team Leader
7/28/2019 Compilation of Thesis
http://slidepdf.com/reader/full/compilation-of-thesis 52/63
52
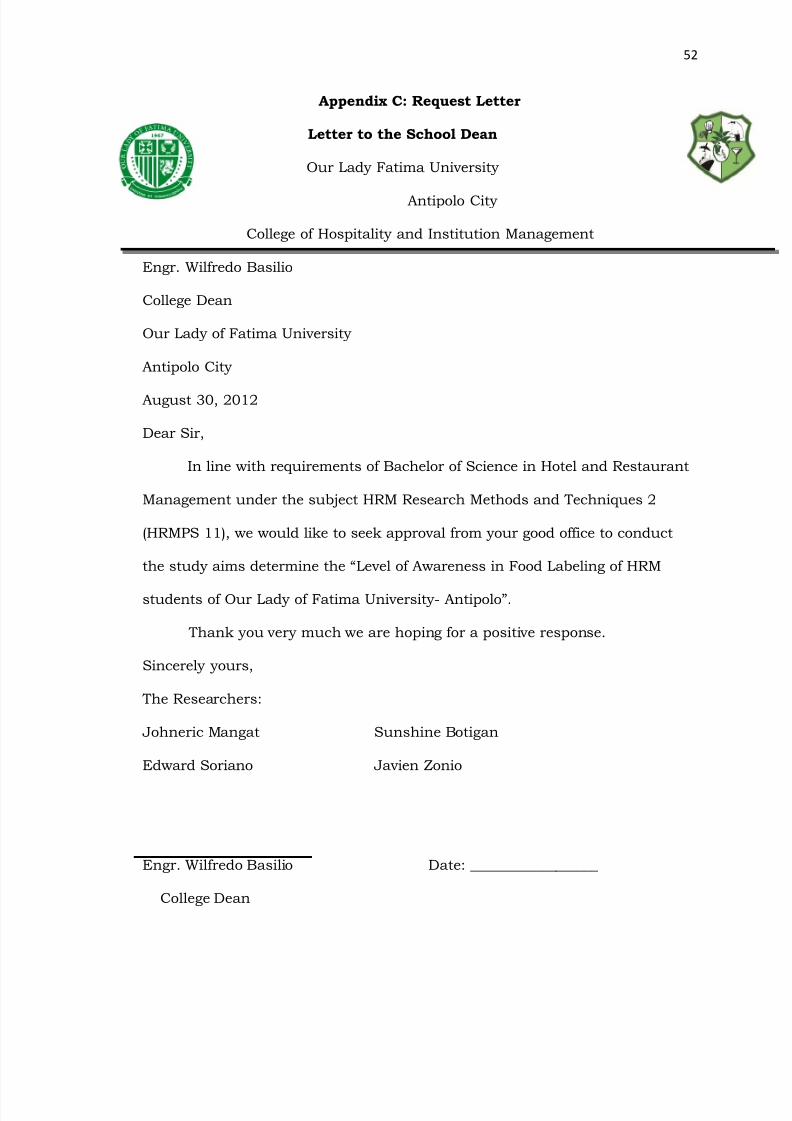
Appendix C: Request Letter
Letter to the School Dean
Our Lady Fatima University
Antipolo City
College of Hospitality and Institution Management
Engr. Wilfredo Basilio
College Dean
Our Lady of Fatima University
Antipolo City
August 30, 2012
Dear Sir,
In line with requirements of Bachelor of Science in Hotel and Restaurant
Management under the subject HRM Research Methods and Techniques 2
(HRMPS 11), we would like to seek approval from your good office to conduct
the study aims determine the “Level of Awareness in Food Labeling of HRM
students of Our Lady of Fatima University- Antipolo”.
Thank you very much we are hoping for a positive response.
Sincerely yours,
The Researchers:
Johneric Mangat Sunshine Botigan
Edward Soriano Javien Zonio
Engr. Wilfredo Basilio Date: __________________
College Dean
7/28/2019 Compilation of Thesis
http://slidepdf.com/reader/full/compilation-of-thesis 53/63
53
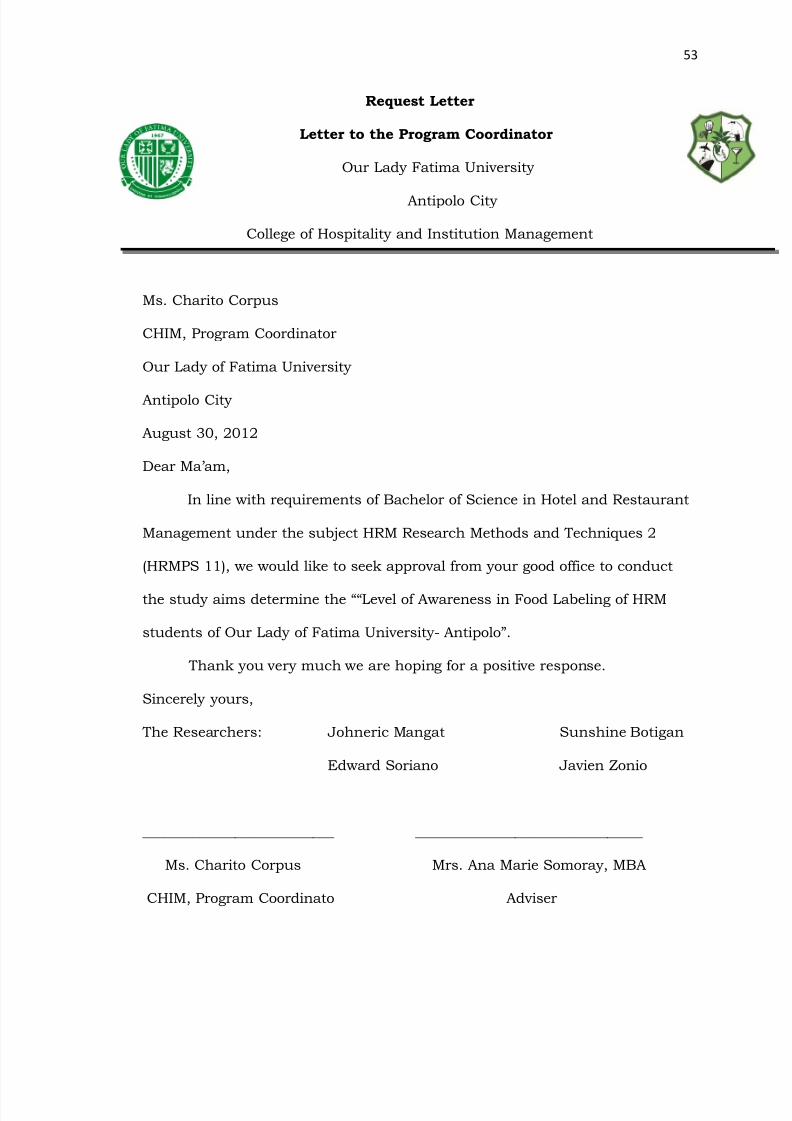
Request Letter
Letter to the Program Coordinator
Our Lady Fatima University
Antipolo City
College of Hospitality and Institution Management
Ms. Charito Corpus
CHIM, Program Coordinator
Our Lady of Fatima University
Antipolo City
August 30, 2012
Dear Ma’am,
In line with requirements of Bachelor of Science in Hotel and Restaurant
Management under the subject HRM Research Methods and Techniques 2
(HRMPS 11), we would like to seek approval from your good office to conduct
the study aims determine the ““Level of Awareness in Food Labeling of HRM
students of Our Lady of Fatima University- Antipolo”.
Thank you very much we are hoping for a positive response.
Sincerely yours,
The Researchers: Johneric Mangat Sunshine Botigan
Edward Soriano Javien Zonio
___________________________ ________________________________
Ms. Charito Corpus Mrs. Ana Marie Somoray, MBA
CHIM, Program Coordinato Adviser
7/28/2019 Compilation of Thesis
http://slidepdf.com/reader/full/compilation-of-thesis 54/63
54
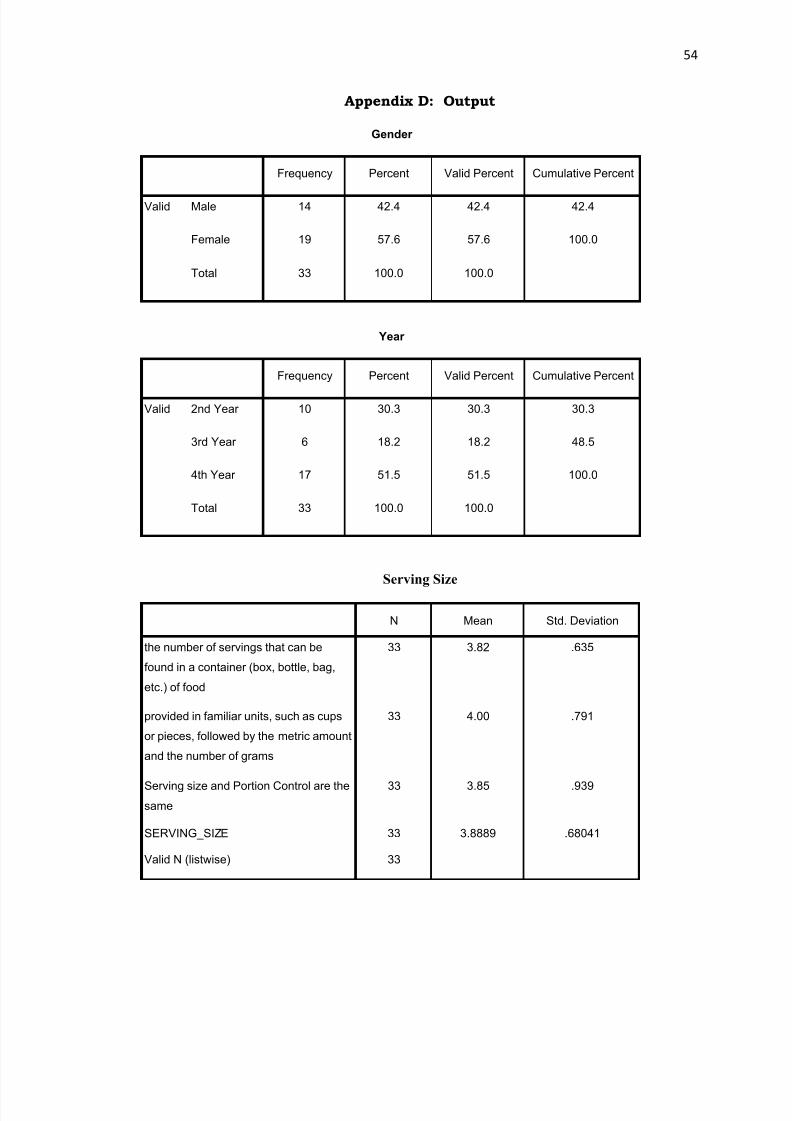
Appendix D: Output
Gender
Frequency Percent Valid Percent Cumulative Percent
Valid Male 14 42.4 42.4 42.4
Female 19 57.6 57.6 100.0
Total 33 100.0 100.0
Year
Frequency Percent Valid Percent Cumulative Percent
Valid 2nd Year 10 30.3 30.3 30.3
3rd Year 6 18.2 18.2 48.5
4th Year 17 51.5 51.5 100.0
Total 33 100.0 100.0
Serving Size
N Mean Std. Deviation
the number of servings that can be
found in a container (box, bottle, bag,
etc.) of food
33 3.82 .635
provided in familiar units, such as cups
or pieces, followed by the metric amount
and the number of grams
33 4.00 .791
Serving size and Portion Control are the
same
33 3.85 .939
SERVING_SIZE 33 3.8889 .68041
Valid N (listwise) 33
7/28/2019 Compilation of Thesis
http://slidepdf.com/reader/full/compilation-of-thesis 55/63
55
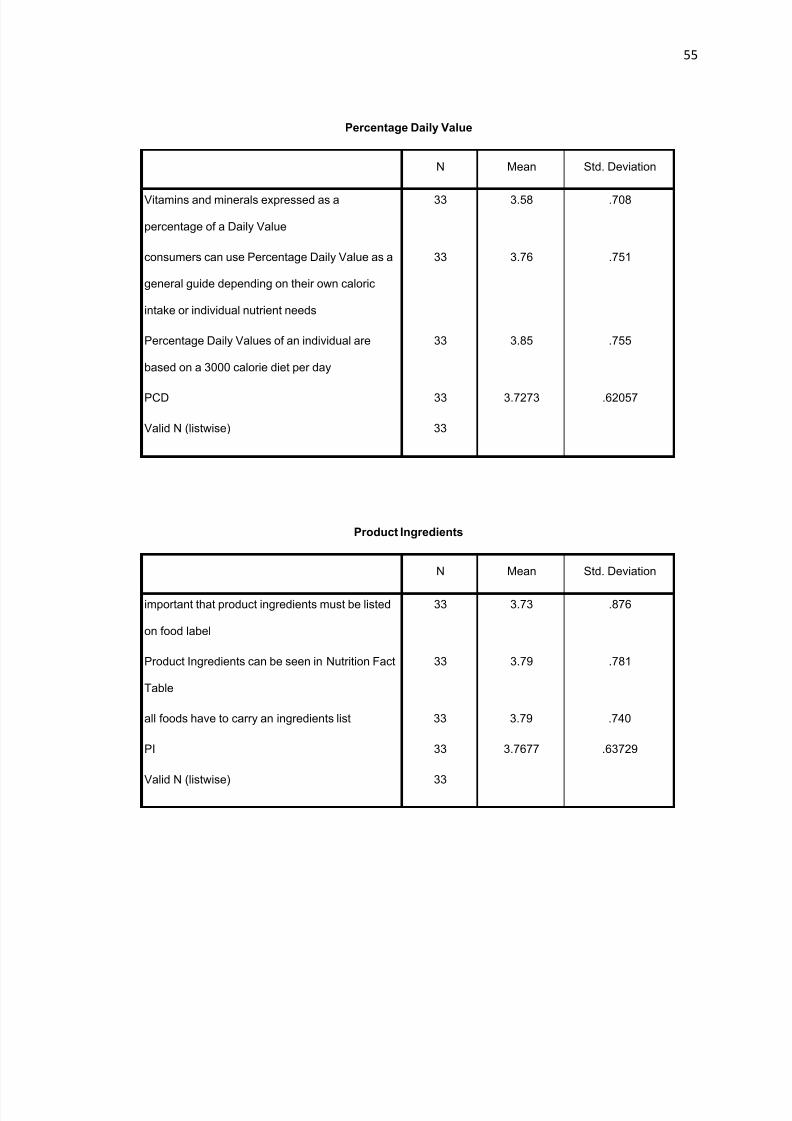
Percentage Daily Value
N Mean Std. Deviation
Vitamins and minerals expressed as a
percentage of a Daily Value
33 3.58 .708
consumers can use Percentage Daily Value as a
general guide depending on their own caloric
intake or individual nutrient needs
33 3.76 .751
Percentage Daily Values of an individual are
based on a 3000 calorie diet per day
33 3.85 .755
PCD 33 3.7273 .62057
Valid N (listwise) 33
Product Ingredients
N Mean Std. Deviation
important that product ingredients must be listed
on food label
33 3.73 .876
Product Ingredients can be seen in Nutrition Fact
Table
33 3.79 .781
all foods have to carry an ingredients list 33 3.79 .740
PI 33 3.7677 .63729
Valid N (listwise) 33
7/28/2019 Compilation of Thesis
http://slidepdf.com/reader/full/compilation-of-thesis 56/63
56
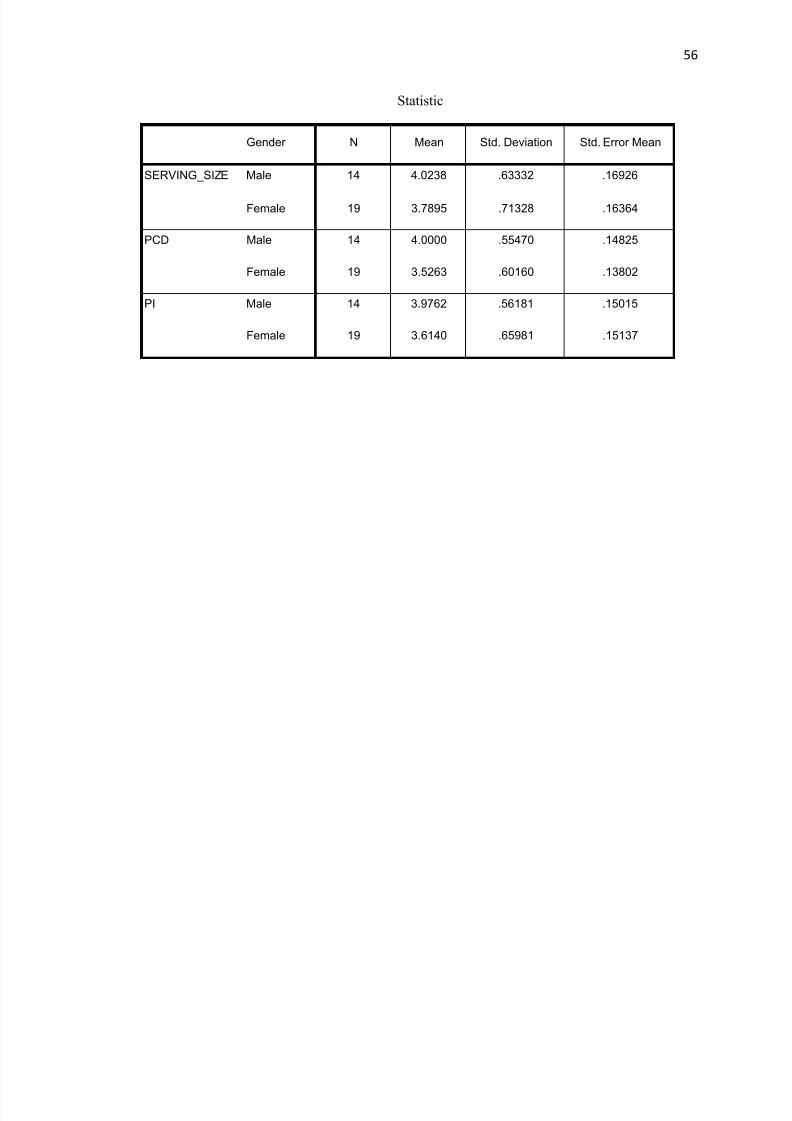
Statistic
Gender N Mean Std. Deviation Std. Error Mean
SERVING_SIZE Male 14 4.0238 .63332 .16926
Female 19 3.7895 .71328 .16364
PCD Male 14 4.0000 .55470 .14825
Female 19 3.5263 .60160 .13802
PI Male 14 3.9762 .56181 .15015
Female 19 3.6140 .65981 .15137
7/28/2019 Compilation of Thesis
http://slidepdf.com/reader/full/compilation-of-thesis 57/63
57
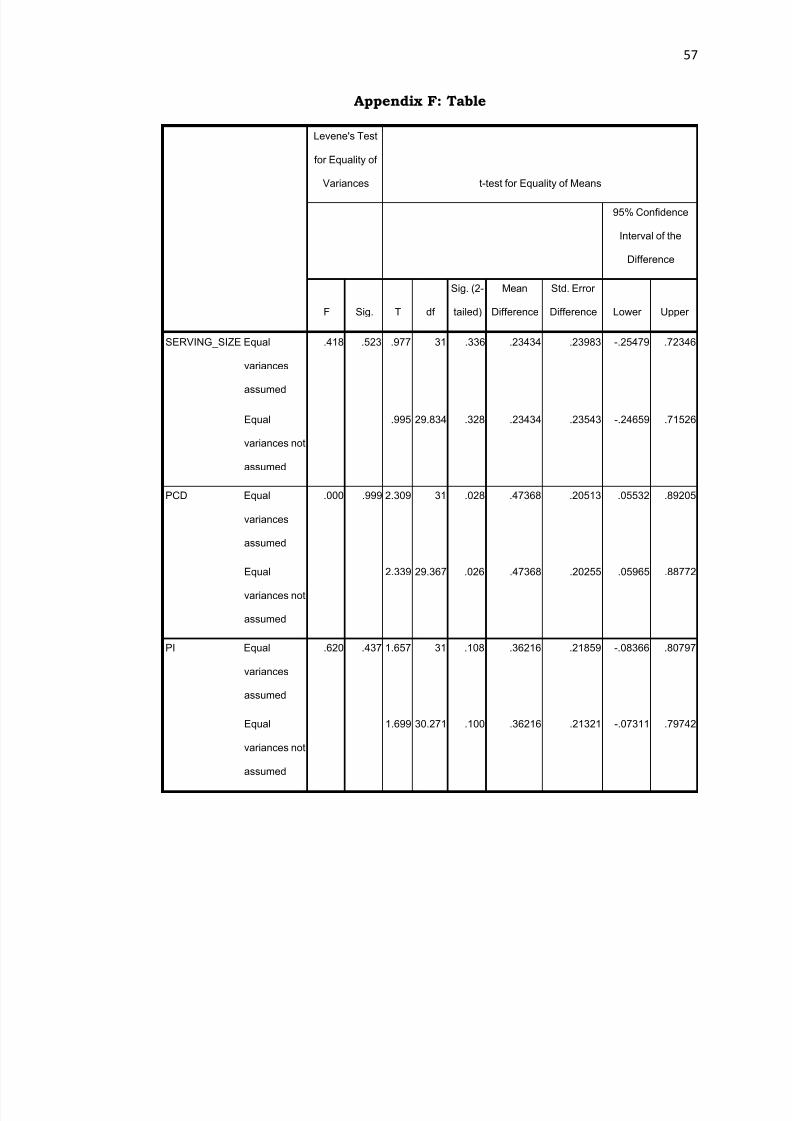
Appendix F: Table
Levene's Test
for Equality of
Variances t-test for Equality of Means
95% Confidence
Interval of the
Difference
F Sig. T df
Sig. (2-
tailed)
Mean
Difference
Std. Error
Difference Lower Upper
SERVING_SIZE Equal
variances
assumed
.418 .523 .977 31 .336 .23434 .23983 -.25479 .72346
Equal
variances not
assumed
.995 29.834 .328 .23434 .23543 -.24659 .71526
PCD Equal
variances
assumed
.000 .999 2.309 31 .028 .47368 .20513 .05532 .89205
Equal
variances not
assumed
2.339 29.367 .026 .47368 .20255 .05965 .88772
PI Equal
variances
assumed
.620 .437 1.657 31 .108 .36216 .21859 -.08366 .80797
Equal
variances not
assumed
1.699 30.271 .100 .36216 .21321 -.07311 .79742
7/28/2019 Compilation of Thesis
http://slidepdf.com/reader/full/compilation-of-thesis 58/63
58
BOTIGAN, SUNSHINE P.Blk.5 lot13 Igorot Village Valley Golf Rd..Cainta, Rizal Mobile no: +639265551030
Email:[email protected]
EDUCATIONAL BACKGROUND
2009 – Present Bachelor of Science in Hotel and RestaurantManagementOur Lady of Fatima University
Antipolo City
2004 – 2008 F.P.F.M.N.H.SCainta, Rizal
1998 – 2004 Saint Anthony Elementary SchoolsCainta, Rizal
TRAININGS AND SEMINARS ATTENDED
October 22, 2011 HOTEL FAMILIARIZATION TOUREdsa Shangri-La
Mandaluyong City
March 12, 2011 THE ROAD MAP TO THE HOSPITALITY
INDUSTRYPhilippine International Convention Center
Pasay City
March 27, 2010 HOUSEKEEPING SEMINARSupreme Hotel
Baguio City
PERSONAL INFORMATION
Date of Birth : November 12, 1991
Sex : Female
Nationality : Filipino
Civil Status : Single
Height : 5’5”
Weight : 65kg

7/28/2019 Compilation of Thesis
http://slidepdf.com/reader/full/compilation-of-thesis 59/63
59
JOHNERIC D. MANGAT141 Batino St. Proj.3, Quezon City.
Mobile No.: 0933-3458028 / 0922-8465444
E–mail: [email protected]
2009 – Present Bachelor of Science in Hotel and RestaurantManagement Our Lady of Fatima University
Antipolo City
2004 - 2007 Faith Christian Science and Arts School
Cainta, Rizal1996 – 2003 Faith Christian Science and Arts School
Cainta, Rizal
December 20 2012 – present Casual Dinning Restaurant
Chili’s Greenhills, San juan greenhills.
October 19, 2010 – Nov 19, 2012 Work Experience
Casual dinning RestaurantPizza Hut Bistro 4th Level, Robinsons
Galleria
October 22-23, 2011 HOTEL FAMILIARIZATION TOUR
Edsa Shangri-la Hotel
Mandaluyong City
March 11, 2011 THE ROADMAP TO THEHOSPITALITY INDUSTRY
Philippine International ConventionCenter, Pasay City
February 14, 2011 ENHANCING THE SKILLS OFFUTURE HOTELIER
Our Lady of Fatima University
Antipolo City
EDUCATIONAL BACKGROUND
TRAININGS AND SEMINARS ATTENDED
7/28/2019 Compilation of Thesis
http://slidepdf.com/reader/full/compilation-of-thesis 60/63
60
February 14, 2011 RESTAURANT AND BAR EXPOSÉ
T.G.I. Friday’s Bar
Tomas Morato, Quezon City
Date of birth : May 26, 1990
Sex : Male
Nationality : Filipino
Civil Status : Single
Height : 5’6”
Weight : 120 Lbs.
PERSONAL INFORMATION
7/28/2019 Compilation of Thesis
http://slidepdf.com/reader/full/compilation-of-thesis 61/63
61
EDWARD F. SORIANO#2 Meadow Lark St. Phase 4. Vista Verde
Country Homes Cainta, Rizal Mobile no: +639157925334
Email:[email protected]
EDUCATIONAL BACKGROUND
2009 – Present Bachelor of Science in Hotel and RestaurantManagementOur Lady of Fatima University
Antipolo City
2003 – 2007 Faith Christian SchoolCainta, Rizal
1997 – 2003 Faith Christian SchoolCainta, Rizal
TRAININGS AND SEMINARS ATTENDED
March 12–April 20, 2012 ON-JOB-TRAININGRestaurant Practicum (Phase 1)
D’Amburger Gastropud
Granada St., Brgy. Valencia, Q.C Greenhills Towncenter
October 22, 2011 HOTEL FAMILIARIZATION TOUREdsa Shangri-La
Mandaluyong City
March 12, 2011 THE ROAD MAP TO THE HOSPITALITYINDUSTRYPhilippine International Convention Center
Pasay City
September 11, 2010 FRUIT AND VEGETABLE CARVINGAudio Visual Room JS Bldg.
Our Lady of Fatima University
Antipolo City
7/28/2019 Compilation of Thesis
http://slidepdf.com/reader/full/compilation-of-thesis 62/63
62
March 27, 2010 HOUSEKEEPING SEMINARSupreme Hotel
Baguio City
PERSONAL INFORMATION
Date of Birth : November 6, 1989
Sex : Male
Nationality : Filipino
Civil Status : Single
Height : 5’7”
Weight : 65kg

7/28/2019 Compilation of Thesis
http://slidepdf.com/reader/full/compilation-of-thesis 63/63
63
JAVIEN B. ZONIO#50 Langka St. Brgy. Dalig Nayon Silangan Antipolo City
Mobile No.: +639268157548
E–mail: [email protected]
2009 – Present Bachelor of Science in Hotel and RestaurantManagement Our Lady of Fatima University
Antipolo City
2005 - 2009 Sumulong Memorial HighSchool Antipolo City
1999 – 2005 Southwell SchoolBinagonan Rizal
March 12, 2011 THE ROADMAP TO THE HOSPITALITYINDUSTRY
Philippine International Convention Center
Pasay City
October 22, 2011 HOTEL FAMILIARIZATION TOUREdsa Shangri-La
Mandaluyong City
September 11, 2010 FRUIT AND VEGETABLE CARVING
Our Lady of Fatima University
Antipolo City
Date of birth : December 04,1990Sex : Female
EDUCATIONAL BACKGROUND
TRAININGS AND SEMINARS ATTENDED
PERSONAL INFORMATION