comphrehensive district agriculture plan (c-dap) district...
TRANSCRIPT

1
COMPHREHENSIVE DISTRICT
AGRICULTURE PLAN
(C-DAP)
DISTRICT AIZAWL
MIZORAM
COMPREHENSIVE DISTRICT AGRICULTURE PLAN
(C-DAP)
FOR RASHTRIYA KRISHI VIKAS YOJANA
OF XIth FIVE YEAR PLAN
Prepared by
District Agriculture Department
Aisawl District

2
FOREWORD
The National Development Council has set the goal of 4 per cent
growth in the 11th plan by reorienting strategies of Agricultural Development
towards meeting the needs of farmers and appropriate use of natural
resources. The state governments are motivated to concentrate on finding
and evolving suitable strategies with innovative technologies and projects
for rejuvenation of agriculture in the country. The need for integrated local
area plans, based on specific endowments and needs of each area, was
stressed from the beginning of planned development. However, despite
several reports and studies, only sporadic efforts and isolated cases of such
planning could be located. It has therefore been decided by the Govt. of
India that the 'District Plan Process' should be an integral part of the
process of preparation of State. GoI Introduced a new Additional Central
Assistance scheme to incentivize States to draw up plans for their
agriculture sector more comprehensively, taking agro-climatic conditions,
natural resource issues and technology into account, and integrating
livestock, poultry and fisheries more fully. I appreciate the Department of
agriculture at the state level also at the district level for their effort and
coordination for preparation of C-DAPs in an appropriate manner consulting
with all line departments of the state. I also congratulate all implementing
agencies of RKVY to work with commitment for achieving the common goals
in general and to improve the agriculture economy of the state.
Date
Director
3
Department of Agriculture
CONTENT
Chapters Title Page
Nos.
Chapter - I Introduction
1.1 Methodology
1.2 Data Collection and Consultation
1.3 Vision Statement
1.4 Objectives
1.5 Approach and Methodology
1.6 Expected Outcome
Chapter - II District Profile
2.1 Introduction
2.2 Demographic Information
2.3 Climate
2.4 Season
2.5 Temperature
2.6 Relative Humidity
2.7 Wind
Chapter - III SWOT Analysis of Various Sectors (Aisawl District)
3.1 SWOT Analysis of in Agriculture Sectors
3.1.1 Strength
3.1.2 Weakness
3.1.3 Opportunities
3.1.4 Threats
3.2 SWOT Analysis of Animal Husbandry

4
3.3 SWOT Analysis of Horticulture
3.3.1 Strength
3.3.2 Weakness
3.3.3 Opportunities
3.3.4 Threats
3.4 SWOT Analysis of Fishery
3.4.1 Strength
3.4.2 Weakness
3.4.3 Opportunities
3.4.4 Threats
3.5 SWOT Analysis in Sericulture
3.5.1 Strength
3.5.2 Weakness
3.5.3 Opportunities
3.5.4 Threats
Chapter - IV Agriculture in Aiswal District
4.1 Introduction
4.2 Operational Land Holding
4.3 Land Characteristics
4.4 Soil Fertility Status
4.5 Climate
4.6 Agro-Climatic Zones
4.7 Flood and Draughts in the District
4.8 Irrigation and Ground Water
4.9 Service Marketing Infrastructure Service Centre in
Agriculture and Allied Sectors
4.10 Soil Testing Laboratory in the District

5
4.11 Basic Marketing Infrastructure for Agricultural
Production / Post Harvest Management
4.12 Agriculture Activities
Chapter V Development of Agri-Allied Sectors
5.1 Horticulture in Aisawl District
5.2 Area, Production and Productivity of Major Fruit Crops
of in the State
5.3 Organic Farming
5.4 Existing Horticulture Cultivation Practices of the
District
5.5 Different Programme Launched by Government for
Development of Horticultural Sector in the District
5.6 Oil Palm Development Programme
5.7 Existing Varieties of Different Horticultural Crops
5.8 Indigenous Crops/ Varieties
5.9 Post Harvest Technology
5.10 Livestock Status and Development
5.11 Fisheries Development
5.12 Sericulture in Aisawl District
5.13 Sericulture in Mizoram
5.14 Availability & Varieties of Sericulture
5.15 Soil and Water Conservation

6
CONTENTS OF TABLES
Sl No Titles Page
Nos.
2.1 General Information of Aizawl District
2.2 The Population Trend in Aizawl District as per 2001 Census
2.3 Temperature (0C) from 2002-05
2.4 Average Relative (%) Humidity District
4.1 Land Holding in the District
4.2 Land Utilization Statistics ( Preceding 3 Years Average)
4.3 Data on Weather (Available Normal)
4.4 Development Block wise Monthly Rainfall in mm
4.5 Agro-Climatic Zones of Aizawl District
4.6 Soil Testing Laboratories in District
4.7 Area, Production and Yield of Major Crops in Irrigated / Rain
fed Conditions during Kharif Season
4.8 Area, Production and Yield of Major Crops in Irrigated / Rain
fed Conditions during Rabi Season
4.9 Gap in Research / Extension / Adoption and Proposed
Extension Strategy for Improving the Productivity / Income of
Various Crops in the District
4.10 Gap in Research / Extension / Adoption and Proposed
Extension Strategy for Improving the Productivity / Income
from Rainfed Paddy (Direct Sown)
4.11 Gap in Research / Extension / Adoption and Proposed
Extension Strategy for Improving the Productivity / Income
from Mustard (Rabi Oilseed)
4.12 Gap in Research / Extension / Adoption and Proposed
Extension Strategy for Improving the Productivity / Income
from Pea (Rabi Pulse)

7
4.13 Gap in Research / Extension / Adoption and Proposed
Extension Strategy for Improving the Productivity / Income
from Kharif Pulse
4.14 Gap in Research / Extension / Adoption and Proposed
Extension Strategy for Improving the Productivity / Income
from Maize
4.15 Proposed Strategy for Agriculture – Physical and Financial
targets for the XI Plan
5.1 Area, Production and Productivity of Major Fruit Crops of
Mizoram (2007-08)
5.2 Area, Production and Productivity of Major Plantation Crops
of Mizoram (2007-08)
5.3 Area, Production and Productivity of Major Spices of Mizoram
(2007-08)
5.4 Area, Production and Productivity of Major Vegetable Crops of
Mizoram (2007-08)
5.5 Area, Production and Productivity of Major Root and Tuber
Crops of Mizoram (2007-08)
5.6 Area, Production and Yield of Major Horticulture Crops
5.7 Crop wise Area Expanded and No. of Beneficiaries Under area
Expansion Scheme up to (2008-09)
5.8 Important Fruit Crops and their Varieties Grown in Mamit
District
5.9 Some Indigenous and Local Fruits and Vegetables Grown in
Mamit District
5.10 Crop Wise Researche / Extension / Adoption Gap Analysis
5.11 Gap in Research / Extension / Adoption and Proposed
Extension Strategy for Improving the Productivity / Income
from OKRA
5.12 Gap in Research / Extension / Adoption and Proposed
Extension Strategy for Improving the Productivity / Income
from Chilli
5.13 Gap in Research / Extension / Adoption and Proposed
Extension Strategy for Improving the Productivity / Income
from Rhizomatous

8
5.14 Gap in Research / Extension / Adoption and Proposed
Extension Strategy for Improving the Productivity / Income
from Banana
5.15 Gap in Research / Extension / Adoption and Proposed
Extension Strategy for Improving the Productivity / Income
from Pineapple
5.16 Gap in Research / Extension / Adoption and Proposed
Extension Strategy for Improving the Productivity / Income
from Passion fruit
5.17 Gap in Research / Extension / Adoption and Proposed
Extension Strategy for Improving the Productivity / Income
from Potato
5.18 Proposed Strategy for Horticultural Development
5.19 Livestock Information
5.20 Distribution of Land and Livestock/Poultry Holdings in the
District
5.21 Benefits from Family Poultry
5.22 Taluka wise Existing of Veterinary Institutions (Aizawl
District)
5.23 Production Plan of Livestock During 11th Plan
5.24 Production Plan of Livestock
5.25 Research / Extension / Adoption Gap and Proposed
Strategies for Improving the Productivity / Income from Goat
5.26 Research / Extension / Adoption Gap and Proposed
Strategies for Improving the Productivity / Income from Pig-1
5.27 Research / Extension / Adoption Gap and Proposed
Strategies for Improving the Productivity / Income from Pig-2
5.28 Research / Extension / Adoption Gap and Proposed
Strategies for Improving the Productivity / Income from Cow /
Mithun / Hill Cattle
5.29 Research / Extension / Adoption Gap and Proposed
Strategies for Improving the Productivity / Income from
Poultry
5.30 Proposed Strategy for Animal Husbandry & Veterinary

9
5.31 The Interventions are Suggested for Promotion of Fishery in
the District
5.32 Strategies Proposed for Improving Production and
Productivity in Sericulture
5.33 Various Interventions Suggested for Sericulture Development
in the District are Presented (in lakhs)
5.34 Abstract of Work plan under RKVY Scheme Soil Treatment
(Soil Department)
5.35 Soil & Moisture Conservation Activities
5.36 Water Conservation
5.37 Physical and Financial Requirements and Proposed Strategies
for Soil Treatment (Rupees in lakhs)
5.38 Proposal for Implementation of Soil & Moisture Conservation
(Rupees in lakh)
5.39 Proposal for Implementation of Water Conservation Activities
(Rupees in Lakhs)
5.40 Proposal for Implementation of Soil & Water Conservation
(Rupees in Lakhs)
EXECUTIVE SUMMARY
10
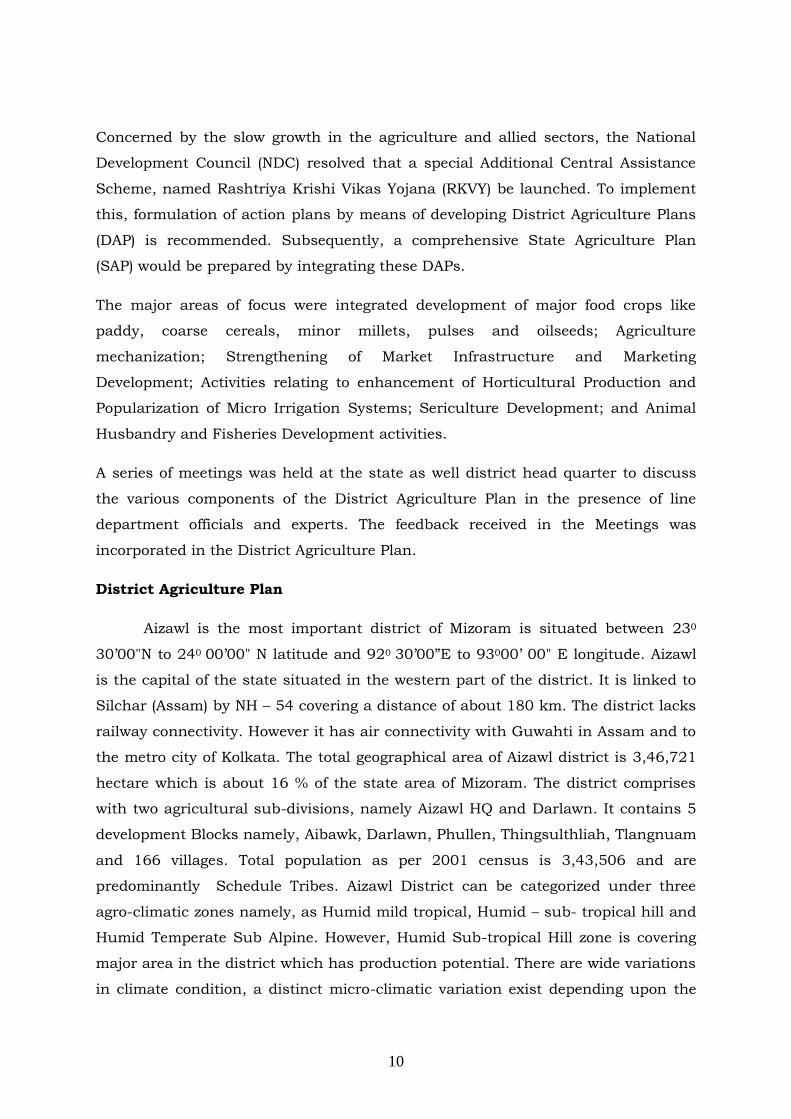
Concerned by the slow growth in the agriculture and allied sectors, the National
Development Council (NDC) resolved that a special Additional Central Assistance
Scheme, named Rashtriya Krishi Vikas Yojana (RKVY) be launched. To implement
this, formulation of action plans by means of developing District Agriculture Plans
(DAP) is recommended. Subsequently, a comprehensive State Agriculture Plan
(SAP) would be prepared by integrating these DAPs.
The major areas of focus were integrated development of major food crops like
paddy, coarse cereals, minor millets, pulses and oilseeds; Agriculture
mechanization; Strengthening of Market Infrastructure and Marketing
Development; Activities relating to enhancement of Horticultural Production and
Popularization of Micro Irrigation Systems; Sericulture Development; and Animal
Husbandry and Fisheries Development activities.
A series of meetings was held at the state as well district head quarter to discuss
the various components of the District Agriculture Plan in the presence of line
department officials and experts. The feedback received in the Meetings was
incorporated in the District Agriculture Plan.
District Agriculture Plan
Aizawl is the most important district of Mizoram is situated between 230
30‟00"N to 240 00‟00" N latitude and 920 30‟00”E to 93000‟ 00" E longitude. Aizawl
is the capital of the state situated in the western part of the district. It is linked to
Silchar (Assam) by NH – 54 covering a distance of about 180 km. The district lacks
railway connectivity. However it has air connectivity with Guwahti in Assam and to
the metro city of Kolkata. The total geographical area of Aizawl district is 3,46,721
hectare which is about 16 % of the state area of Mizoram. The district comprises
with two agricultural sub-divisions, namely Aizawl HQ and Darlawn. It contains 5
development Blocks namely, Aibawk, Darlawn, Phullen, Thingsulthliah, Tlangnuam
and 166 villages. Total population as per 2001 census is 3,43,506 and are
predominantly Schedule Tribes. Aizawl District can be categorized under three
agro-climatic zones namely, as Humid mild tropical, Humid – sub- tropical hill and
Humid Temperate Sub Alpine. However, Humid Sub-tropical Hill zone is covering
major area in the district which has production potential. There are wide variations
in climate condition, a distinct micro-climatic variation exist depending upon the
11
altitude, which sharply differs from place to place. Considering the agro-climatic
conditions, the district has feasibility and scope for cultivation of wide variety of
crops. The staple food crop is paddy (Rice), maize is secondary. Wide range of
fruits, vegetables, Spices, Oilseeds and Pulses are grown. There are plenty of
grasslands, wherein livestock rearing is possible due to naturally available fodder.
Water harvesting is conveniently done in valleys and lower ridges, which are ideal
for „Pisci-culture‟. Irrigation facilities in the forms of river diversion schemes helping
in increasing production of various agricultural and horticultural commodities. The
land holding pattern of the district reflects dominance of both marginal and small
farmers in the district which are found to be in equal proportion. Medium farmers
are very negligible and there is no large farmer. Because of the small and
fragmented land holding of the farmers, extensive farming as well as use of
agricultural machineries like tractor has limited scope.
Priority of the district during IX plan
• Integration of crop husbandry with vegetable and horticultural crops, animal
husbandry, mushroom cultivation and other non crop based farming.
• Introduction of appropriate technologies to increase the production and
productivity of agriculture and allied sectors.
• Encouraging multiple land use by increasing cropping intensity and
intercropping.
• Bridging yield gaps of crops, animals and other enterprises.

12
• Human resources development of rural youths, farm women, other disadvantaged
groups and filed staff.
• Conservation and sustainable management of natural resources.
• Enhancement of soil health
• Paradigm shift from production oriented farming to market oriented agriculture
with the promotion of Agro processing industries.
Objectives Considering the above situation the present database/information
system was developed with the following objectives
Analysis on the existing farming practices.
Collection Analysis of secondary data on agriculture and allied sector.
Identification of production constrains and technological gap.
Documentation of existing marketing pattern.
Formulation of strategies and action plan for different agricultural
production system to increase productivity.
Strategies for the agriculture development.
• Strengthening the extension machinery for effective dissemination of technology.
• Bridging yield gaps of crops, animals and other enterprises.
• Paradigm shift from production oriented farming to market oriented agriculture
with the promotion of Agro processing industries.
• Development of minor irrigation
• Strengthening of rural markets with storage facilities.
• Strengthening of farmers‟ market with additional storage facilities.
• Establishment of cattle feed units.

13
• Integration of crop husbandry with vegetable and horticultural crops, animal
husbandry, mushroom cultivation and other non crop based farming.
• Human resources development of rural youths, farm women, other disadvantaged
groups and filed staff.
Development of suitable technologies such as varietal improvement, input
management supported by a strong institutional arrangements for the supply of
inputs like seed, fertilizers, plant protection chemicals, credit, etc, price support
system favourable to farmers and market infrastructure for major crops like paddy,
maize, sugarcane, banana, vegetables, and fodder crops.
• Encouraging maize as an alternate crop for paddy
• Strengthening water harvesting structures like farm ponds and check dams.
• Reclamation of fallow and degraded lands.
Training and exposure visit to the farmers, traders, and other stakeholders on
grading, post harvest technologies, value addition and market intelligence.
• Inland fisheries development in major tanks and reservoirs and
Abstract of District Agricultural Plan
Budget Details for Activities Proposed in the District Agriculture Plan
Sl No Rs. In Lakhs
2010-11 2011-12 TOTAL
Agriculture
Horticulture
Animal
Husbandry

14
Fishery
Sericulture
Soil
Water
Conservation
KVK
Total
Chapter 1 Introduction
The population is growing very fast in all the par the globe. With the
rising population the supply of food material is also needed to be increased.
The World Food Summit (1997) predicted that food production in developing
countries must be tripled by the year 2050 to cater the demand created by
the expected doubling of the human population and their increasing
standard of living. Globally there will be enough food for a growing world
population by the year 2030, but hundreds of millions of people in
developing countries will remain hungry and many of the environmental
problems caused by agriculture will remain serious.(World Agriculture:
Towards 2015/2030, UN FAO)

15
India occupies 2% of the world geographical area and 16% of its
population. At the time of independence, the country had a total population
of 350 million and produced only 51 million tonnes of food grain. Today,
population has crossed 1 billion marks and food grain production has
increased to 230.67 million tonnes (2007-08). But the agricultural
productivity world over has hit a plateau, whereas, Indian scenario is
different. Apart from the flattening of yields over the past two decades, our
average productivity also lies below the optimum level. The growth spurt
ignited by the green revolution in the 1970 is now seeing diminishing
returns to technology. Again the North Eastern state like Mizoram, the
situation is completely different. Most of the people observe the state as
organic “by default”. In the last 30 years the state has not been able to do
any remarkable job in the field of agriculture, especially for attaining
independency in food supply. At the same time the population of the state is
growing very fast and the last decadal growth rate was 28.82 %. So, in this
current global scenario policy makers have to rethink on the long term basis
for the development of agriculture of the state. Another fact is that the crisis
for food is going to increase in other parts of the country with the increasing
population pressure. Therefore, we need to be independent in our food grain
production.
The economic reforms commenced in 1991 has successfully put the
economy in a higher growth orbit with more than 8 percent growth rate
in total Gross Domestic Product (GDP) especially during the recent
years. However, the agriculture sector which accounted for more than 30
percent of total GDP at the beginning of reforms failed to maintain its
pre-reform growth. On the contrary, it witnessed a sharp declining in
growth after the mid 1990s as the per annum growth in agriculture
sector dropped to 1.9 percent during 1996-97 to 2001-2002 from 3.2
percent in the period 1980-81 to 1995-1996. This happened despite the
fact that agricultural productivity in most of the States was quite low, as
it were, and the potential for the growth of agriculture was high. The
Tenth five year plan target of growth of 4 percent per annum in
agriculture and allied sectors, set to reverse the sharp declining of 1996-
16
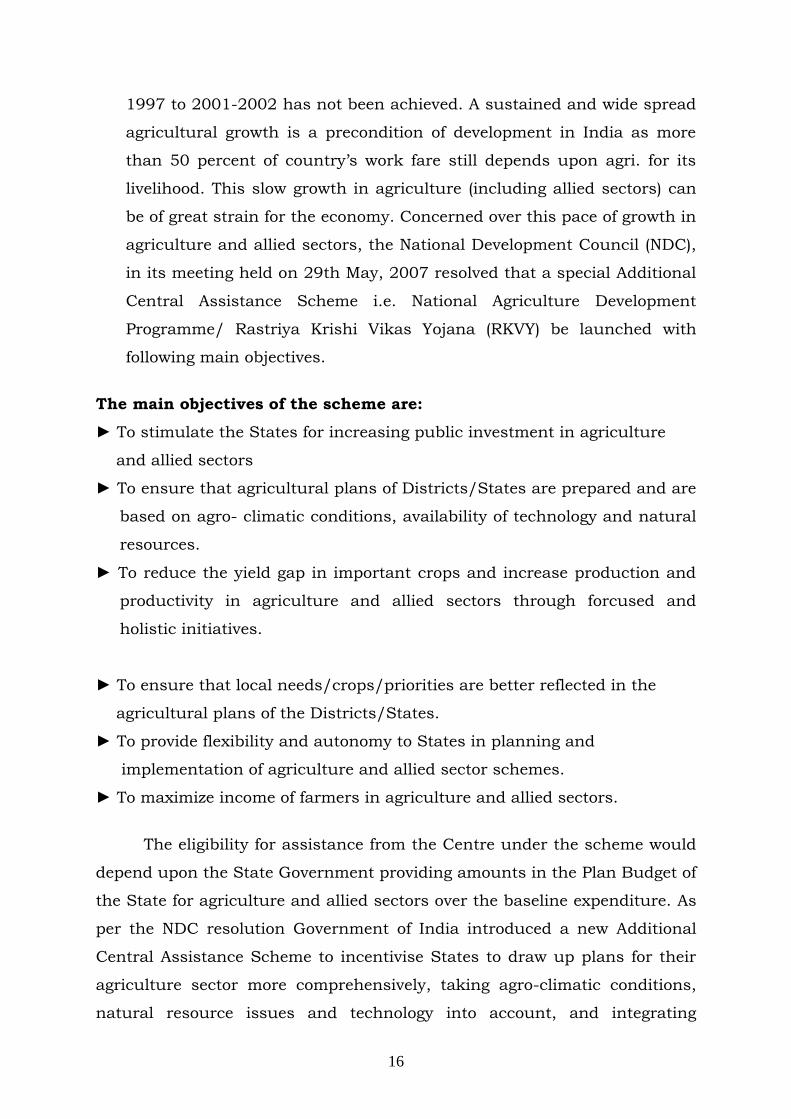
1997 to 2001-2002 has not been achieved. A sustained and wide spread
agricultural growth is a precondition of development in India as more
than 50 percent of country‟s work fare still depends upon agri. for its
livelihood. This slow growth in agriculture (including allied sectors) can
be of great strain for the economy. Concerned over this pace of growth in
agriculture and allied sectors, the National Development Council (NDC),
in its meeting held on 29th May, 2007 resolved that a special Additional
Central Assistance Scheme i.e. National Agriculture Development
Programme/ Rastriya Krishi Vikas Yojana (RKVY) be launched with
following main objectives.
The main objectives of the scheme are:
► To stimulate the States for increasing public investment in agriculture
and allied sectors
► To ensure that agricultural plans of Districts/States are prepared and are
based on agro- climatic conditions, availability of technology and natural
resources.
► To reduce the yield gap in important crops and increase production and
productivity in agriculture and allied sectors through forcused and
holistic initiatives.
► To ensure that local needs/crops/priorities are better reflected in the
agricultural plans of the Districts/States.
► To provide flexibility and autonomy to States in planning and
implementation of agriculture and allied sector schemes.
► To maximize income of farmers in agriculture and allied sectors.
The eligibility for assistance from the Centre under the scheme would
depend upon the State Government providing amounts in the Plan Budget of
the State for agriculture and allied sectors over the baseline expenditure. As
per the NDC resolution Government of India introduced a new Additional
Central Assistance Scheme to incentivise States to draw up plans for their
agriculture sector more comprehensively, taking agro-climatic conditions,
natural resource issues and technology into account, and integrating

17
livestock, poultry and fisheries etc. This involves a new scheme for
Additional Central Assistance (ACA) to State Plans, administered by the
Union ministry of Agriculture over and above its existing centrally sponsored
schemes, to supplement the state-specific strategies. In order to rejuvenate
the agriculture during XIth plan a growth rate of 4 percent per annum has
to be achieved (as per NDC commitment) by reorienting development
strategies that meet the needs of the farmers. The agriculture growth being
essential element of the strategy of making growth more inclusive, the NDC
advised the State Governments on preparation of Comprehensive District
Agriculture Plans (C-DAP) which includes allied agriculture sectors with full
and efficient utilization of available resources. The concept of integrated
local area plans (to raise living standard in rural area and over come food
shortage) based on specific endowments and needs of each area mooted in
1st Five year plan in 1951, could not be materialized in true sense as only
sporadic efforts and isolated cases of such planning were practically
attempted. For success of local area or District level plans the underlying
constraints needed to be identified and required infrastructural investment,
extension (and research system) revamping and market reach with the
system‟s conduct and performance have to be synchronized through a
holistic policy approach. Keeping this in view the C-DAP of district Aisawl is
prepared for achieving sustainable agricultural growth with improved
farmers‟ income through participatory process involving stakeholders and
various organizations. By establishing strong linkages with required
institutional support services the plan will ensure optimum utilization of
scarce physical and financial resources. The Agriculture in the district can‟t
possibly achieve same growth as in the past without recognizing the role of
farmers‟ participatory approach for formulating strategies and finding
solution to new and emerging problems.
1.1 Methodology
The C-DAP was prepared as per the process and methodology suggested
by the planning Commission, Government of India. The approach followed in
preparation of the document was necessarily of Participatory Approach

18
mode. Designed formats for data collection, guided in data collection and
analysis and conducted regular workshops and meetings conducted. The
responsibility of preparing C-DAP of of the Aisawl district was done by the
District agriculture unit with the able guidance from the Director and Join
Director of the state agriculture department and consultations with District/
Block/Village Agriculture Planning Units of the district. Before commencing
the planning process, a sequence of workshops and meetings were
conducted and the following specific aspects were covered discussed.
• Issue and challenges in Agriculture sector.
• Planning concepts and district Planning.
• Basic features and planning process of RKVY.
• Vision, methodology and process of preparing C-DAP.
• Farming system approach.
• Farming situation based extension.
• INM, IPM, NRM, HRD, Marketing and other important aspects.
1.2 Data Collection and consultation: Formal and informal meeting with
Agriculture and line department staff, village administrative units members
and farmers were contacted at different levels. Collected secondary data and
related statistics needed for planning from different departments and other
sources. The field level functionaries of the agriculture department, collected
information with well framed data collection formats given by the MoA, Gov.
of India. For in depth Farm/ village level study covering important aspects
of agriculture and allied fields required information on modified semi-
structured through PRA.
Cross verification of data: The primary as well as secondary data collected
were cross-checked through triangulations and verified from
information/reports available with different government departments and
PRA based exercises. The district plan (draft), SREP and PLP of Aisawl
district and specifically Vision 2020 document prepared by the KVK of the
District consulted widely and used as base for preparation of C-DAP.
19
The required Changes in the management practices aimed in the proposed plan-
• Adoption of resources conservation technologies at large scale.
• Farm productions system for land owing families.
• Soil health sustainability through the applications of fertilizers & other mgt
practices.
• Effective pest management strategies including weed & nematodes based
on economic threshold value.
• Augmentation of the existing water applications through rain water
conservation and demand management.
System approach:
1. Market infrastructure and marketing opportunities, custom hiring
services and some of the policy issue related to subsidy.
2. Collected and discussed the feed back regarding on-Farm and Off-Farm
activates.
3. Farmer inability to invest in the productivity enhancement as majority of
farmers belongs to resources poor category.
4. Livelihood support system for landless families.
5. Profitability and sustainability of cropping system and return
1.3 VISION STATEMENT
Sustainable rural livelihood by accelerating agriculture growth through
diversified farming system.
Priority setting for the district
• Conservation, development and sustainable management of water
resources.
• Soil health improvement
• Popularizing resource conserving technologies.
• Encourages multiple land use by increasing cropping intensity and
intercropping.
• Integration of crop husbandry with vegetable and horticultural crops,

20
animal husbandry, mushroom cultivation and other non crop based
farming.
• Bridging yield gaps of crops, animals and other enterprises.
• Human resources development of rural youths, farm women, other
disadvantaged groups and filed staff.
• Paradigm shift from production oriented farming to market oriented
agriculture with the promotion of Agro processing industries.
1.4 Objectives
Considering the above situation the present database/information system
was developed with the following objectives
1. To make analysis on the existing farming practices.
2. Collection and analysis of secondary data on agriculture and allied
sectors.
3. Identification of production constrains and technological gap.
4. Documentation of existing marketing pattern.
5. Formulation of strategies and action plan for different agricultural
production system to increase productivity.
1.5 Approach and Methodology
The approach and methodology undertaken to conduct the present
analysis was
Consultation with the key stakeholders from both public and private
sector
Comprehensive review of existing farming practices through well
tested survey materials and observation.
1.6 Expected Outcome
This document will provide better and clear understanding of
prevailing agricultural and allied situations, constrains and existing
technological gaps in the district.

21
This document is put forward to provide an insight to identify the
development opportunities and potentialities for employment
generation in the field of agriculture and allied sector.
This document will support the state government to develop
agriculture and allied sector and will help in reforming policies and
action plans.

22
CHAPTER – 2 DISTRICT PROFILE
2.1 INTRODUCTION:
Aizawl is the most important district of Mizoram is situated between
230 30‟00"N to 240 00‟00" N latitude and 920 30‟00”E to 93000‟ 00" E
longitude. Its capital also known as Aizawl which is situated in the western
part of the district. It is linked to Silchar (Assam) by NH – 54 covering a
distance of about 180 km. The district lacks railway connectivity. However it
has air connectivity with Guwahti in Assam and to the metro city of Kolkata.
The total geographical area of Aizawl district is 3,46,721 hectare which is
about 16 % of the state area of Mizoram. The district comprises with two
agricultural sub-divisions, namely Aizawl HQ and Darlawn. It contains 5
development Blocks namely, Aibawk, Darlawn, Phullen, Thingsulthliah,
Tlangnuam and 166 villages. The map of the district is given at figure-1.
Total population as per 2001 census is 3,43,506 and are predominantly
Schedule Tribes.
Table 2.1: General Information of Aizawl District
General Population (As per the 2001 Census)
Dev.
Block
Villages No. of
Reven
ue
Villag
es
Area
(ha)
No.
of
GPs.
Male Female Total S.C S.T In-
habitated
Un-in
habitate
d
Aibawk 20 -- 20 52204 -- 9087 8981 18068 -- 18068
Darlawn 27 -- 27 98242 -- 14550 14227 28777 -- 28777
Phullen 12 -- 12 52338 -- 6850 7416 14266 -- 14266
Thingsulthl
iah 21 -- 21 89437 -- 9018 9039 18057 -- 18057
Tlangnuam 86 -- 86 54500 -- 132828 131510 264338 -- 264338
Total 166 -- 166 346721 -- 172333 171173 343506 -- 343506

23
The topography in general is undulant with broken mountainous /
hilly ranges and between them lies the valley lands suitable for cultivation of
field crops. The hills are suited for Horticultural practices where ever the
slopes are gentle/moderate. The soils in hills are rich in humus due to forest
cover. However, in abandoned jhum lands the situation is reverse. The soil
in general is acidic- pH ranging between 4.5 - 6, deficient in base material,
medium in organic carbon, low in available phosphorus. The predominant
soil taxonomy is Hapludults (typic and humic) and Udonthernts – wherein
moisture retention capacity is very low.
Though the District mainly comprises of hilly terrain there are low
lying valley lands in few pockets, where altitude is rather low having warm
and humid climate facilitating paddy cultivation. The altitude ranges
between 100 meter to 1500 meter in the district.
The economy of the district is pre-dominantly agarian with more than
60% of the total work force engaged either directly or indirectly in
agriculture. However, agriculture still remains under-developed and the
primitive practice of Jhum (shifting cultivation) predominates. Both
production and productivity are relatively low.
Aizawl District can be categorized under three agro-climatic zones
namely, as Humid mild tropical, Humid – sub- tropical hill and Humid
Temperate Sub Alpine. However, Humid Sub-tropical Hill zone is covering
major area in the district which has production potential. There are wide
variations in climate condition, a distinct micro-climatic variation exist
depending upon the altitude, which sharply differs from place to place.
Considering the agro-climatic conditions, the district has feasibility and
scope for cultivation of wide variety of crops. The staple food crop is paddy
(Rice), maize is secondary. Wide range of fruits, vegetables, Spices, Oilseeds
and Pulses are grown. There are plenty of grasslands, wherein livestock
rearing is possible due to naturally available fodder. Water harvesting is
conveniently done in valleys and lower ridges, which are ideal for „Pisci-

24
culture‟. Irrigation facilities in the forms of river diversion schemes helping
in increasing production of various agricultural and horticultural
commodities.
2.2 DEMOGRAPHIC INFORMATION
As per the census of 2001 the total population of the district is
3,43,506. The variation in the density as well as the distribution of
population is related to the physical, social and economic factors, which are
responsible for the characteristics of the population in the district.
Tabel 2.2 : The Population trend in Aizawl district as per 2001 census
District Area
(ha)
No. of
Household
Population Decadal
variation
% 1991-
2001
Literacy
rate (%) Male Female Total
1 2 3 4 5 6 7 8
Aizawl
3,46,721
64753 172333 171173 343506
38.10
96.50
2.3 Climate
Climate is the aggregate of all atmospheric or meteorological
influences such as moisture, wind pressure, temperature and evaporation.
Climate is one of the most important factors of the geographical environment
to which man is subjected and man‟s activities like agriculture, forestry,
supply of water, industry, etc.
The climate of Mizoram is controlled by its location, physiographic,
pressure regime in the North West India and Bay of Bengal, warm and moist
maritime tropical air masses from the Bay of Bengal, local mountain and
valley winds. Overall its climate is tropical monsoon type. As the Mamit
district lies in the North Western part of the state, it enjoys a moderate

25
climate owing to its tropical climate. It falls under the direct influence of the
South West Monsoon. As such the area receives an adequate amount of
rainfall which is responsible for a humid tropical climate characterized by
short winter and long summer with heavy rainfall. In general the climate of
the district is sub-tropical and humid type.
2.4 Season
Based on the variation in temperature, rainfall, humidity and other
general weather conditions four different types of seasons are observed here.
They are
1. The cold and winter season (Thlasik)
Winter season starts from the month of December to first half of
February. This is the coldest season of the year. During this period rainfall
is much less as compared to other seasons, and whatever amount of rainfall
received is originated from North East Monsoon, generally known as the
retreating monsoon.
2. Spring season (Thal)
Spring is the shortest season of the year. It starts from the second half of
the February to the first half of March. Temperature is mild during this
period and the sky is clear and Mizoram people accustomed to build new
houses during this season as there are no weather disturbances during this
period.
3. Summer season/ Rainy season
It is the longest season and starts from the second half of March till the
first half of October. The warmest months, i.e. July and August, prevails
during this period and maximum insolation is received during the early part
of this season. Study from rainfall records reveals that the heavy
precipitation generally starts from the second quarter of May and it
continues up to September and these five months alone contributed 74.41%
of the total annual rainfall during 2007.

26
4. Autumn season (Favang)
It starts from second part of October to November. This season is very
pleasant as both the temperature and rain comes down and it is the season
of harvesting major crops like paddy.
2.5 Temperature
Temperature of the district does not fluctuate much. The average
maximum and minimum temperature of the district is 350C and 5.30C,
respectively. The highest temperature was recorded on 6th May 2004 and it
was 35.60C. On an average July and August was recorded to be the warmest
months with mean maximum temperature 27.50C and mean minimum
temperature 20.40C.
Table 2.3. Temperature (0C) from 2002-2005
Months 2002 2003 2004 2005
Max Min Max Min Max Min Max Min
Jan - - 26.5 6 26.5 5.9 28.2 6.4
Feb - - 29.4 8.5 31.1 5.7 32.2 7.2
March - - 31.5 8.3 34.8 11.6 33.4 13.5
April - - 34.2 16.6 34.2 15 34.8 14.4
May 33.9 16.7 34.3 18.1 35.6 17.4 34.2 16.8
June 32.6 20.4 34 19.5 33.7 20 34.8 19.4
July 32.8 22 34.5 22 32.8 20.6 33.3 21.6
Aug 32.8 22 33.5 20.1 34.3 21.8 - -
Sep 34 20.4 33.1 21.4 31.8 21 - -
Oct 32.5 17 31.1 18.4 31.4 17.2 - -
Nov 30.2 13 29.4 11.3 30.4 12.2 - -
Dec 26.5 6.3 27.6 9 27.6 5.3 - -
The temperature starts falling from November and it falls far low
during December and January. January was recorded to be the coldest
month of the year with mean maximum temperature 27.10C and minimum

27
temperature 6.10C. However, the coldest day was recorded to be 28th
December 2004 with 5.30C.
2.6 Relative Humidity
Relative humidity is the ratio of moisture content in the air to the
moisture holding capacity of the same air and it is directly related to the rate
of evaporation. Of the various components of atmosphere, moisture
constitutes from nearly zero to about 4 percent by volume. Humidity plays a
very important role in the heat budget as well as day to day weather
changes. During these years the highest relative humidity (88.6%) was
found for the month of September 2004.
Table 2.4. Average relative (%) Humidity District
Months 2003 2004 2005 Average
Jan 77.7 81.4 72.4 77.2
Feb 66.7 68.9 52.6 62.7
Mar 58.2 54.6 57.7 56.8
Apr 64.1 73.5 58.4 65.3
May 75.2 63.5 72.1 70.3
June 85.3 80.3 71.9 79.2
July 79.9 86.4 81.5 82.6
Aug 81.1 85.2 NA 83.2
Sep 87.6 88.6 NA 88.1
Oct 87.5 84.3 NA 85.9
Nov 77.7 77.5 NA 77.6
Dec 78.2 71.9 NA 75.1
Average 76.6 76.3 66.7 73.2

28
2.7 Wind
The monsoon wind is the most important wind that prevails in
Mizoram. During summer, the subtropical high pressure belt and the
thermal equator are displaced northward in response to the changing
pattern of solar heating of the earth. From the ocean, particularly from the
North Indian Ocean or Bay of Bengal, they move towards the land mass and
blow over the Asian continent. This South West Monsoon usually reaches
Mizoram during second half of May and prevails up to the first half of
October. The summer monsoon is characterized by highly variable weather
with frequent spells of draught and heavy rains. Besides this, the winter
monsoon also prevails which is a gentle drift of air in which the winds
generally blow from the north east. The retreating monsoon cause sporadic
rainfall especially in Mizoram and other north eastern states producing
sometimes heavy cyclonic rains.
As evidence from the earlier records, Mizoram state is vulnerable to
impact of tropical cyclone which develop in North Indian Ocean (Bay of
Bengal), and the cyclones of the post monsoon season (October to
December) are more intense than those of pre-monsoon season (April and
May). Cyclones are associated with strong winds, torrential rains and
storms. The impacts of these cyclones are quite devastating; it often led to
loss of properties, houses, power line cut-off, blockage of road, damages to
crops and even human lives etc. Generally these winds come from the north
western part of the state as the wind originates from the Bay of Bengal.
Vulnerability Analysis of Cyclone in Mizoram has been conducted by the
State Remote Sensing Center, Mizoram and according to that report there
are 87 villages/ towns/ wards falling in different classes of vulnerability.
Out of this, four villages (Mamit town, Tuipuibari, Hmunpui and Darlung)
are grouped as high vulnerable areas. Other than this, eighteen villages/
towns/ wards are grouped as medium vulnerable and rest sixty five villages/
towns/ wards are grouped as low vulnerable.

29
Chapter-3 SWOT ANALYSIS of Various Sectors (Aisawl District)
3.1 SWOT ANALYSIS of in Agriculture Sectors
3.1.1 STRENGTH
1. Ideal climatic condition
2. Good rainfall
3. Assured Market
4. Technology available
5. Less damage chance from Cyclone& flood
6. Less labour intensive
3.1.2 WEAKNESS
1. Poor soil fertility
2. High Soil erosion
3. Un availability of HYV from local market
4. Scattered areas
5. Poor transport communication
6. Lack of perennial water for irrigation
3.1.3 OPPORTUNITIES
1. Land & Labour available
2. High - Local demand
3. Less - Pest & diseases
4. High - Interest of farmers
5. Easy - export to neighbouring state
6. Cultural practice
3.1.4 THREATS
1. High cost of transportation
2. Natural calamity (Excess rainfall, Landslides, Wind etc)
3. Market failure
4. Lack of storage facilities
5. Lacking of awareness on pest & diseases
6. Scarcity of water during summer

30
3.2 SWOT ANALYSIS of Animal Husbandry
STRENGTH
Mizos by tradition are animal rearers and possess the basic knowledge of
animal husbandry
WEAKNESS
Lack of awareness by the farmers
Financial problems of farmers
OPPORTUNITIES
Good marketing
Potential increase in productivity
Increased demand for livestock products
THREATS
Swine flu/ bird flu outbreak
Significant increase in price of animal feeds
3.3 SWOT ANALYSIS of Horticulture
3.3.1 STRENGTH
1. Good market facility
2. Good temperature and Climate condition
3. Availability of land
4. Almost all the population is Non-vegetarian
5. Abundant supply of rain water
6. Ideal for fodder cultivation
3.3.2 WEAKNESS
1. High cost of labour
2. Scarcity of flat land
3. Transport problem
4. Lack of technology
5. Scattered populations

31
3.3.3 OPPORTUNITIES
1. Available of natural resources
2. High demand of meat and meat product
3. Rain water harvest opportunities
3.3.4 THREATS
1. High transport cost
2. Natural calamity like landslide and high rain fall
3. High cost of feed
4. Low population
5. Lack of storage facility
6. Diseases threat from neighboring countries.
3.4 SWOT ANALYSIS of Fishery
3.4.1 STRENGTH
1. Western belt potential in 4000 Ha for a culture fisheries
2. Farmers strength is around 1500 nos
3. The present production is 1050 MT
4. Area curved so far is around 750 Ha
5. Potential in Fish seed farms is private sector
3.4.2 WEAKNESS
1. Non availability of major inputs like fish feed
2. Drastically weak in District Office manpower and field staff resulting
to poor production due to weak technology transfer.
3. Weak financial allocation in to the district
3.4.3 OPPORTUNITIES
Above potential areas could be developed through CSS Viz:- FFDA and
NFDB

32
3.4.4 THREATS
Although threats like flood are occasional at places Viz:- Darlak and
Zawlnuam, the development resulting to fish production becomes
dominant over threats.
3.5 SWOT ANALYSIS in Sericulture
3.5.1 STRENGTH :
1. Climatic condition ideal for Mulberry and Castor plants.
2. PH of Soil optimum.
3. Agrarian life style of Jhum cultivation ease the mind set of the people
to switch-on Sericulture readily.
4. Mizoram Govt. flagship programme (i.e. Sericulture sector/activities).
5. Short gestation period (i.e. 1 year)
3.5.2 WEAKNESS :
1. Non-traditional.
2. Communication poor.
3. Infrastructure (viz. Grainage house, Godown, etc.) inadequate.
4. Illiteracy on livelihood.
5. Minority area.
3.5.3 OPPORTUNITIES :
1. Hilly terrain unsuitable for wet rice cultivation, good for Mulberry and
Castor.
2. An excellent sector for replacement of Jhum cultivation.
3. Minority areas.
4. Introduction of Sericulture easy due to BPL areas.
5. Mixed & Subsistence Agri. economy.
3.5.4 THREATS :
1. Consumer ignorance.
2. Fair weather road.
3. Lack of technological know-how. Bru-insurgency.

33
CHAPTER – 4 AGRICULTURE IN AIZAWL DISTRICT
4.1 Introduction
Mizoram is situated on the extreme south of north eastern India and it
also falls under the rainfed area. The word “Mizo” means highlander. It
consists of steep hill ranges, separated from one another by narrow valleys.
It is predominantly an agrarian state. It is blessed with diverse topography
and congenial climate which makes it conducive for growing varied type of
agriculture and horticulture crops. The population (8, 91,058nos, Census-
2001) of Mizoram is growing very fast (19.18 %) and 54.9 % of the
population are engaged in agriculture. The present state of the economy is
far from satisfactory with very less improvement in the agricultural
productivity level. The per capita income of Mizoram is above the national
average. However, the state is not self-sufficient and depends heavily on
Central Govt. assistance like most of the North Eastern states. It is not a
highly industrialized state and the traditional industries are mostly for home
consumption.
The economy of the district is largely dependent on agriculture and its
allied sector. The district has diverse topography and favorable climate to
support this enterprise even to a commercial level for some crops. Paddy is a
major crop grown in the district, which is also a staple food of the local
people but the production is still not sufficient to support the growing
population mainly due to large practice of unsustainable farming system.

34
4.2 Operational Land Holding
The land holding pattern of the district reflects dominance of both
marginal and small farmers in the district which are found to be in equal
proportion. Medium farmers are very negligible and there is no large farmer.
Because of the small and fragmented land holding of the farmers, extensive
farming as well as use of agricultural machineries like tractor has limited
scope.
Table 4.1: Land Holding in the District
Sl.
No.
District Marginal Small Semi-
Medium
Medium Large All sizes
1
Aizawl
8,270
8,223
3,230
5
NIL
19,728
4.3 LAND CHARACTERSITICS:
With a geographical area of over 3,46,721 hectare and perched on the
high hills of the Aizawl district possibly has the most difficult terrain, and
hills are separated by rivers flowing north to south, thus creating
innumerable hurdles in intra-district communication. The major rivers
flowing in the district are Tlawng and Tuirial which are fed by number of
tributaries. These rivers flow from south to north and ultimately confluences
to Barak river of Assam.
The district gets an average annual rainfall of about 2100 mm and
that too, in a concentrated period of 6 (six) months resulting in the working
season in a year greatly restricted. At the same time, surface and sub-soil
being highly porous, its retentively of water is low. Consequently, the district
faces the unique paradoxical problem of scarcity of water in the midst of
plenty. However, the people of the district has developed an innovative
practice of harvesting roof top rain water to meet their day to day water
requirement for household activities. Drinking water problem in the capital

35
of the district Aizawl has been greatly solved by the water supply scheme of
the government.
The actual area of permanent paddy rice is 6618 hectare. However,
paddy also is cultivated in shifting cultivation areas. The cropping system
throughout the district is diverse since it is dependent upon soil, micro-
climatic conditions and socio-economic status. Various horticulture crops
like bananas, oranges, papaya, hatkora, Assam lemon, vegetables, spices
like ginger, oilseeds, pulses and areca nut are grown in the district. Of the
total area only 21 percent is put on the paddy and seasonal crops. As high
as 63 percent of the total crop area is under Jhum cultivation. The net sown
area is 18120 and gross cropped area is only 22000. The cropping intensity
is only 125%. The cropping intensity is to be increased to attain self
sufficiency in food production. According to the Agriculture Department‟s
figure of 2007-2008 total production of paddy stood at 10237 MT. During
the same year the area under fruits was 1400 ha. The Forest production is
mainly timber, bamboo, broom-stick etc. The forests are continuously under
great pressure of shifting cultivation.

36
Table 4.2 : Land Utilization Statistics ( preceding 3 years average)
[
Under the Centrally Sponsored Schemes like NWDPRA, IWDP,
Hariyali, NREGA, Technology Mission for Horticultural development etc.,
efforts are being put into the process of reclamation of land, checking of soil
erosion by constructing check dams, rain water harvesting and extension of
areas under fruit crops etc. The State Land Use Board (SLUB) of Mizoram is
situated in the Aizawl city which was consitued in the year 1972. The SLUB
has been reviewing the existing land use pattern of all the districts of
Mizoram. The SLUB is also exploring the possibilities of utilizing the land
according to its capabilities.
Sr.
No
Dev.
Bloc
k
Area in hectares
Geo
grap
hica
l
area
Forest
Area
Land
Under
Non-
agril.
Use
Culti-
vable
waste
Perm
anent
pastu
res
Land
under
miscel
laneou
s
tree
crops
and
groves
Curr
ent
fallo
ws
Oth
er
Fall
ows
Croppi
ng
intens
ity
(%)
Net
sown
area
Gross
croppe
d
area
1. Aiba
wk
522
04 30065 2291 10832 319 322 - - 6521 7280 111.6
2. Darl
awn
982
42 56607 3443 2245 155 20928 - - 1337 1525 114
3. Phul
len
523
38 27560 2833 13145 903 424 - 269 3014 5974 198.2
4. Thin
gsult
hliah
894
37 45666 2487 13436 1030 876 - 20 5229 5437 103.9
5. Tlan
gnua
m
545
00 6391 4673 1506 137 1100 - 895 2019 2044 101.2
Total 346
72 16628 15727 41164 2544 23650
118
4
1812
0 22260 125%

37
4.4 SOIL FERTILITY STATUS
The soil fertility status of the district observed to be moderate but
conducive to support a wide range of crops. The state soil testing laboratory,
Aizawl tested as much as 8000 soil samples of the district which revealed
that soils are acidic in nature with pH values ranging from 4.5 to 6.3.The
percentage of organic carbon content is low to medium. Both the available
nitrogen and available phosphorus found to be medium while available
potash is low in the most parts of the district. Adequate soil management
practices can improve and enrich the fertility status. However, the status of
micronutrient content of soil could not be known due to lack of proper
infrastructural facilities in the soil testing laboratory for analyzing micro-
nutrients. It is obvious that due to high rainfall area, the soils might be
deficient in base materials like calcium, manganese, aluminums etc. Iron
content in the soils is seems to be rich effecting soil nutrient availability.
Necessary soil ameliorative measure is the need of the time to improve upon
the situation. The department of agriculture has initiated a programme of
soil amendment through providing slacked lime to the farmers for
correction/reducing the soil acidity.
4.5 CLIMATE:
The Climate of Aizawl district is generally pleasant and moderate.
There is no extremities of temperature which ranges between 80 C to 300 –
320C. The relative humidity (%) varies from 29% to about 90%. The rainfall
is well distributed, with a span of almost 6 months from May to October.
Although pre-monsoon rains break in form the early part of March with
occasional thunder-storms, the Monsoon period really starts from the
middle part of April. The average annual rainfall is around 2100mm, the
peak period being June- August/September. It declines gradually and
ceases during November. Occasional showers of low to medium intensity
also occur during the period from December to February due to the
influence of the Retreating / N.E. Monsoon.

38
Table 4.3 : Data on Weather (Available normal )
Name
of
district
Rainfall Temperature Relative Humidity (%)
No. of
rainy
days
Average
rainfall
(mm)
Min.ºC Max.ºC Min Max
Aizawl 206 2174.9 8.0 32.12 29.71 89.78
There are no snow-clad mountains hence the rivers are rainfed.
Fig-2:Blockwise rainfall data of Aizawl district, 2008-2009
0
100
200
300
400
500
600
700
800
900
1000
Jan
Feb Mar
Apr
ilM
ayJu
ne Jul
Aug
Sep O
ctNov
Dec
Month
Ra
infa
ll (
mm
)
Aibawk
Darlawn
Phullen
Thingsulthliah
Tlangnuam

39
Table 4.4 : Development Block wise monthly rainfall in mm
Name of
the
Blocks
Months
Jan Feb Mar April May June Jul Aug Sep Oct Nov Dec
Aibawk 59 7 52 29 231 469 727 859 381 133 40 Nil
Darlawn 55 11 39 67 279 495 289 381 282 185 Nil Nil
Phullen 17 Nil 33 44 235 298 319 380 456 108 Nil Nil
Thingsul
thliah 84 25 62 90 506 677 828 727 308 408 69 Nil
Tlangnu
am 44 14 16 34 182 298 174 357 322 128 Nil Nil
Total
(mm) 259 57 202 264 1433 2237 2337 2704
174
9 962 109 0
4.6 AGRO – CLIMATIC ZONES:
Based on the rainfall, temperature, terrain and soil characteristics, the state
of Mizoram has been delineated into the following three agro – climatic
zones.
1. Humid mild tropical,
2. Humid – sub- tropical hill and
3. Humid Temperate Sub Alpine

40
Table 4.5 : Agro-climatic zones of Aizawl district
However, the major area part of the Aizawl district falls under the
Humid Sub-Tropic Hill Zone followed by Humid Temperate sub-alpine and
Humid Mild Tropical zones. Three major soil types are found in these agro-
climatic zones namely, Typic Hapladults and Humic Hapladults covering
an area of 104721 ha and Udonthernts which covers 242000 ha of area. The
average annual rainfall found to be marginally more in the soil type of
Udonthernts. The soil type Hapladults favors paddy cultivation while many
fruits, maize and plantation crop like areca nut are growing in Udonthernts
soil type. The agro-climatic map of Aizawl district.
Name of
the Agro-
Climatic
Zone
Area
in ha
Major soil types Average
rainfall in
mm
(Proceedin
gs 5 years
average)
Major crops
Name Area in ha
Type Area in
ha
(1) (2) (3) (4) (5) (6) (7)
Humid
Sub-
Tropical
3,46,7
21
Hapladults 104721 2100 Paddy 44221
(including
shifting
cultivation
areas)
Udonthernts 242000 2275 Maize 11309
Banana 2250
Orange 4995
Arecan
ut
1182

41
4.7 FLOOD AND DRAUGHTS IN THE DISTRICT:
No major incidence of floods in the district due to existence of hilly
terrains. However, due to heavy rainfall, soil erosion is a major problem. Due
to scanty and erratic distribution of rainfall during November to March,
crops occasionally suffers draught like situation causing moisture stress
particularly during winter season.
4.8 IRRIGATION AND GROUND WATER
No major and medium irrigation facilities could be possible in the
district due to topographical constraint. The state has a minor irrigation
department looking after the development and maintenance of irrigation
schemes in the state as a whole and in the Aizawl district in particular.
Many minor irrigation facilities have been developed. The Aizawl district has
only river diversion schemes. It has 40 river diversion schemes with a gross
command area (GCA) of 1639 ha, which have 1424 cultivable Command
Area (CCA). With these schemes 3043 ha of irrigated potential has been
created. The rain water harvesting in the district is still at meager stage.
The status of ground water could not be obtained as the Central
Ground Water Board (CBGB), Govt. of India has no Ground Water
Monitoring Stations (GWMS) in Mizoram. However, due to high hills and
terrain condition, extraction of ground water for irrigation purpose is least
feasible.
4.9 SERVICE CENTRE IN AGRICULTURE AND ALLIED SECTORS:
The farmers of the district have been adopting mechanization in the
agricultural practices by using power tillers and other tools and implements.
However, they are facing problems of maintenance and repairing facilities or
know how at rural level. Creation of Service centre will be helpful for the
farmers. Hence, provision for creation of service centre at least at Block head
quarter need to be made.

42
4.10 SOIL TESTING LABORATORY IN THE DISTRICT:
There is one Soil Testing Laboratory in the district at Aizawl city to
cater the needs of entire state of Mizoram under the state govt. of Mizoram.
Another soil testing laboratory at Krishi Vikash Kendra (KVK) , Selesih is
also set up. No availability of mobile soil testing unit. The information on the
soil testing laboratory is given in the following table. The state soil testing
laboratory is also not properly functioning. Optimum nutrient application in
soil is not being done due to lack of knowledge of soil fertility status.
Awareness for need and importance of soil testing is very poor. Necessary
field level training is required to create awareness among farmers in the
district.
Table 4.6 : Soil Testing Laboratories in District
Soil Testing
Laboratories
Under
No of Soil Testing
Laboratories
Annual
Analysing
Capacity
No of Samples
Analysed
No of Soil
Testing
Laboratories
having Annual
Analysing
system Static Mobile Total
Govt. Sector 2 NIL 2
8000
( by state soil
testing
laboratory)
8000
( by state soil
testing
laboratory)
1+1
Co-
Operative &
Public U -
taking
-- -- -- -- -- --
Private
Sector -- -- -- -- -- --
Total : 2 NIL 2 8000 8000 1

43
4.11 BASIC MARKETING INFRA-STRUCTURE FOR AGRICULTURAL
PRODUCTION / POST HARVEST MANAGEMENT:
Market infrastructures have not been well organized or built up in the
district so far. Many markets sheds have been constructed in some potential
areas but these areas need good connectivity and market net work. Storage
as well as transportation facilities for agricultural commodities need to be
improved. Rural go down may be constructed at community or co-operative
level. The district also offers scope for development of post harvest
management for many economically viable agricultural and horticultural
commodities. Training for different technologies on post harvest may be
organized in selected areas.
4.12 AGRICULTURE ACTIVITIES:
The economy of the district centers around agriculture and paddy is
predominant commodity which is cultivated during kharif season and even
during winter season in some pockets of the district where assured
irrigation exist. Maize is another important field crop and is cultivated both
during kharif and rabi season. The other important crops of the district are
different pulses and oil seeds, cash crops like ginger, chillies, sugarcane,
vegetables like potato, tomato, cabbage etc. Tables 9 & 10 present the area,
production (MT) and yield (q/ha) of some major crops grown during kharif
and rabi season under rainfed and irrigated conditions.

44
Table 4.7: Area, Production and Yield of Major Crops in Irrigated / Rain fed
Conditions during Kharif Season
Crops
Area(ha) Production (MT) Yield (q/ha)
Irrigate
d %
Rainf
ed % Total
Irrig
ated %
Rainf
ed % Total
Irrig
ated
Rain
fed Average
Paddy 310 4.7 6308 95.3 6618 775 7.6 9462 92.4 10237 2.5 1.5 2
Maize 58 3.1 1794 96.9 1852 137 2 6692 98 6829 2.36 3.7 3.05
Pulses 359 36 649 64.4 1008 268 0.3 5074 65.4 7753 7.46 7.8 7.63
Oilsee
d 185 0.2 577 75.7 762 755 15 4416 85.1 5191 4.08 7.7 5.86
Cash
Crop NA -- 417 -- 417 NA -- 3560 -- 3560 NA 8.5 8.53
Table 4.8 : Area, Production and Yield of Major Crops in Irrigated / Rain fed
Conditions during rabi Season
Crops
Area(ha) Production( q) Yield(q/ha)
Irrigat
ed %
Rain
fed %
Tota
l
Irrigate
d %
Rain
fed % Total
Irrigat
ed
Rainf
ed Average
Maize 25 80 -- -- 25 481 -- -- -- 481 19.22 -- 19.22
Peas &
Bean 123 61 -- -- 123 10927 -- -- -- 10927 88.83 -- 88.83
Cabbag
e 80 90 -- -- 80 12250 -- -- -- 12250 153.1 -- 153.12
Tomato 8 90 -- -- 8 2250 -- -- -- 2250 281.3 -- 281.25
Potato 29 15 -- -- 29 4538 -- -- -- 4538 156.5 -- 156.48

45
4.9 Gap in Research / Extension / Adoption and Proposed Extension Strategy for Improving the Productivity / Income of various crops in the district
Gap in Research / Extension / Adoption and Proposed Extension Strategy for Improving the Productivity / Income
from Rainfed Paddy the District (Transplanted)
Sl.
No Items of Package Existing practice
Recommended
Practice
Gap in
Adopt
Specific Reasons for
Gap
Farmers Proposed Strategy
Strategy to Overcome
gap
1
Sowing Time Method
-Transplant -( May- 1st Week of July) -Local method
-Transplant -(May- 1st Week of July) -SRI
- -Lack of awareness, -
-Demonstration -Training -Exposure visit
2 Varieties
-Local varities
-IR-64 -Pant-12 -KRH
F
-Lack of awareness, -Non-availability of HYV seeds
- Supply of HYV seeds
-Demonstration -Training -Timely supply of HYV seeds -Exposure visit
3 Seed Rate (per ha.)
60-75Kg 45-50Kg F -Lack of awareness
-
-Demonstration -Training
4 Seed Treatment
- Sun/Smoke drying
- Use of chemical
F - Lack of awareness - Lack of inputs
-Availability of inputs in time
-Demonstration -Training -Timely supply of inputs.
5 Organic Manure (tons / ha)
Nil 5 tones/ha F -Lack of awareness -Lack of inputs
-Availability of inputs in time
-Demonstration -Training -Availability of inputs

46
6 Fertilizer
Nil 60:40:40 (NPK) F -Lack of awareness -Lack of inputs
-Availability of inputs
-Demonstration -Training -Timely supply of Fertilizers
7 Micro Nutrient
Nil -Use of Micro- nutrients
F -Lack of awareness
- -Demonstration -Training
8
Pest Management
-Use of cultural methods
-Use of NPK F -Lack of awareness
-Use of Pesticides
-Introduction of IPM
9 Disease Management.
-Use of cultural methods
-Use of NPK F -Lack of awareness -Use of Pesticides
-Introduction of IPM
10 Post Harvest Management
-Traditional method -Scientific Post harvest Technology
F -Lack of awareness - -Awareness campaign - Exposure visit
11
Weed Management
-Hand Weeding -Use of Scientific technologies
F -Lack of awareness -Lack of inputs
-Supply of inputs
-Awareness training - Supply of inputs.

47
Table – 4.10 Gap in Research / Extension / Adoption and Proposed Extension Strategy for Improving the Productivity /
Income from Rainfed_Paddy (Direct Sown)
Sl. No
Items of Package Existing practice Recommended Practice
Gap in Adopt
Specific Reasons for Gap
Farmers Proposed Strategy
Strategy to Overcome gap
1
Sowing Time Method
-Dibbling -April -Local method
-Dibbling -April -
N -
- -
2 Varieties
-Local varieties
- Improved Variety
P
-Lack of awareness -Lack of Improved seeds
-
- Awareness training - - Exposure visit - Demonstration
3 Seed Rate (per ha.) 2530Kg 25-30Kg N - - -
4 Seed Treatment
-Sun /Smoke
drying
- Use of
chemical F
-Lack of awareness
-Lack of inputs
-Availability of
inputs in time
-Demonstration -Training
-Timely supply of inputs.
5 -Organic Manure (tons / ha)
Nil Nil N - - -
6 Fertilizer
Nil 30:20:20(NPK)
F -Lack of awareness -Lack of inputs
-Availability of inputs
-Demonstration -Training -Timely supply of Fertilizers
7 Micro Nutrient Nil Nil
N
-
-
-

48
8 Pest Management
-Use of cultural method
-Use of IPM F -Lack of awareness
-Use of Pesticides
Introduction of IPM -Exposure visit
9 Disease Management.
-Use of cultural methods
-Use of NPK F -Lack of awareness
-Use of Pesticides
Introduction of IPM
10
Post Harvest
Management
Traditional
method
Scientific
Post Harvest Technology
F -Lack of
awareness -
-Awareness campaign
- Exposure visit
11 Weed Management
-Hand Weeding Use of Scientific technologies
F -Lack of awareness -Lack of inputs
Supply of inputs
-Awareness training - Supply of inputs.
49
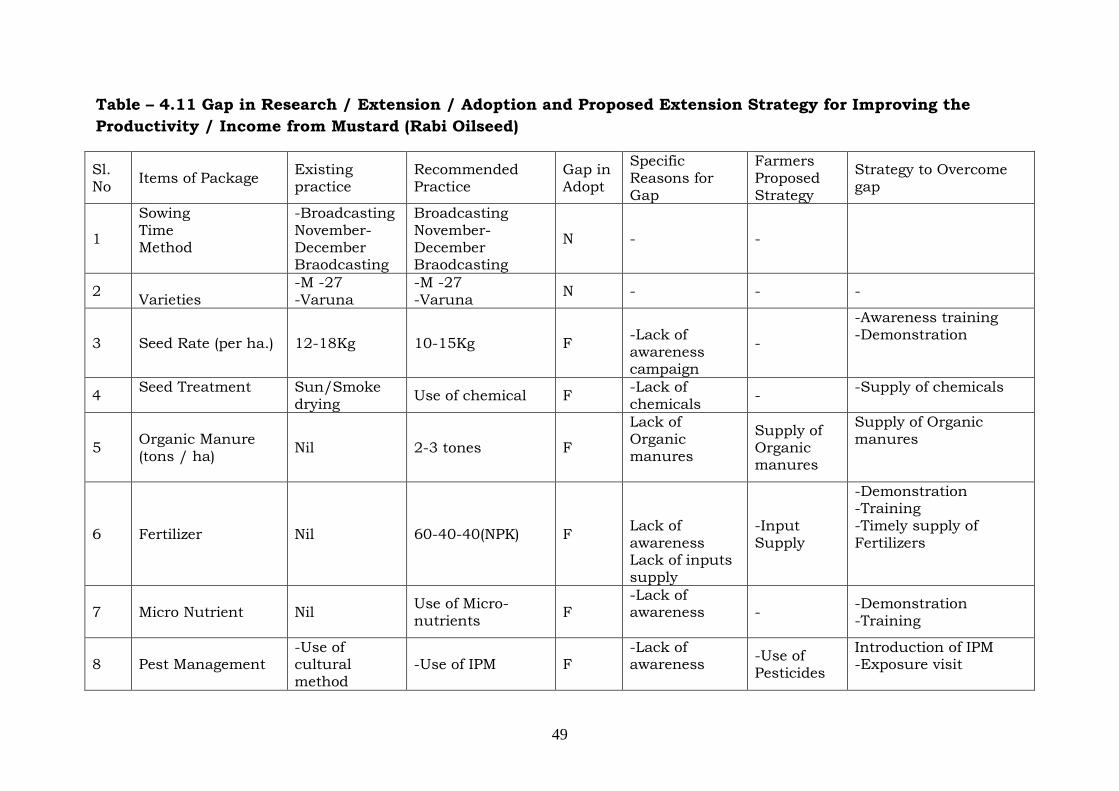
Table – 4.11 Gap in Research / Extension / Adoption and Proposed Extension Strategy for Improving the
Productivity / Income from Mustard (Rabi Oilseed)
Sl. No
Items of Package Existing practice
Recommended Practice
Gap in Adopt
Specific Reasons for Gap
Farmers Proposed Strategy
Strategy to Overcome gap
1
Sowing
Time Method
-Broadcasting
November-December Braodcasting
Broadcasting
November-December Braodcasting
N - -
2 Varieties
-M -27 -Varuna
-M -27 -Varuna
N - - -
3 Seed Rate (per ha.)
12-18Kg 10-15Kg F
-Lack of awareness campaign
-
-Awareness training -Demonstration
4 Seed Treatment
Sun/Smoke drying
Use of chemical F -Lack of chemicals
- -Supply of chemicals
5 Organic Manure (tons / ha)
Nil 2-3 tones F
Lack of Organic manures
Supply of Organic manures
Supply of Organic manures
6
Fertilizer
Nil 60-40-40(NPK) F
Lack of awareness Lack of inputs supply
-Input Supply
-Demonstration -Training
-Timely supply of Fertilizers
7 Micro Nutrient
Nil Use of Micro- nutrients
F -Lack of awareness
- -Demonstration -Training
8 Pest Management -Use of cultural method
-Use of IPM F -Lack of awareness
-Use of Pesticides
Introduction of IPM -Exposure visit

50
9 Disease Management.
-Use of cultural methods
-Use of NPK F -Lack of awareness
-Use of Pesticides
Introduction of IPM
10 Post Harvest Management
Traditional method
-Scientific Post Harvest Technology
F -Lack of awareness
- -Awareness campaign - Exposure visit
11
Weed Management
-Hand Weeding
Use of Scientific technologies
F
-Lack of
awareness -Lack of inputs
Supply of inputs
-Awareness training
- Supply of inputs.

51
Table – 4.12 Gap in Research / Extension / Adoption and Proposed Extension Strategy for Improving the Productivity /
Income from Pea (Rabi Pulse)
Sl. No
Items of Package
Existing practice
Recommended Practice
Gap in Adopt
Specific Reasons for Gap
Farmers Proposed Strategy
Strategy to Overcome gap
1
Sowing Time Method
Direct
sowing November-December Direct sowing
Line sowing November-December Line Sowing
F Lack of awareness
- -Demonstration-Training
2 Varieties Arkel Arkel N - - -
3 Seed Rate (per ha.)
50-60Kg/ha
30-50Kg/ha F Lack of awareness
- -Demonstration-Training
4 Seed Treatment
Sun/Smoke drying
Use of chemical F -Lack of chemicals
- -Supply of chemicals
5 Organic Manure
(tons / ha)
Nil 2-3 tonnes F Lack of Organic
manures
Supply of Organic
manures
Supply of Organic manures
6 Fertilizer
Nil 20:46:0NPK F
-Lack of Fertilizers -Demonstration
Supply of fertilizers
-Supply of Fertilizers -Demonstration -Training
7 Micro Nutrient
Nil Use of micro nutrient
F
Lack of awareness
-
-Training -Exposure visit

52
8
Pest Management
-Use of cultural methodS
-Use of IPM F -Lack of awareness
-Use of Pesticides
-Introduction of IPM -Exposure visit
9
Disease Management.
-Use of cultural methods
-Use of NPK F -Lack of awareness
-Use of Pesticides
-Introduction of IPM
10 Post Harvest Management
Traditional method
Scientific Post Harvest Technology
F -Lack of awareness
- -Awareness campaign - Exposure visit
11 Weed Management
-Hand Weeding
Use of Scientific technologies
F
-Lack of awareness -Lack of inputs
-Supply of inputs
-Awareness training - Supply of inputs.

53
Table – 4.13 Gap in Research / Extension / Adoption and Proposed Extension Strategy for Improving the Productivity /
Income from Kharif Pulse
Sl.
No
Items of
Package
Existing
practice
Recommended
Practice
Gap
in
Adopt
Specific Reasons
for Gap
Farmers
Proposed
Strategy
Strategy to Overcome gap
1
Sowing
Time
Method
Dibbling
April-May
Dibbling
Line sowing
April-May
Line sowing
P
Lack of
awareness
-
Training
Demonstration
exposure visit
2 Varieties Local variety Improve
variety F
Lack of
awareness -
Demonstration
3 Seed Rate
(per ha.)
40Kg/ha 50Kg/ha F
Lack of
awareness -
Demonstration
4
Seed
Treatment
Sun/Smoke
drying
Use of
chemical F
-Lack of
chemicals -
-Supply of chemicals
5
Organic
Manure(tons
/ ha)
Nil
2-4 tonnes
F
-Lack of Organic
manures
-Supply of
Organic
manures
Supply of Organic manures
6
Fertilizer
Nil
20:60:40 NPK
F
-Lack of inputs
-Lack of
awareness
-Supply of
inputs
-Supply of inputs
-Training
-Demonstration
7
Micro
Nutrient
Nil Use of micro
nutrients F
Lack of
awareness -
Awareness training
8 Pest
Management
Use of cultural
method -Use of IPM F
-Lack of
awareness
-Use of
Pesticides
Introduction of IPM
-Exposure visit

54
9
Disease
Management.
-Use of
cultural
methods
-Use of NPK F
-Lack of
awareness
-Use of
Pesticides
Introduction of IPM
10
Post Harvest
Management
Traditional
method
Scientific Post
Harvest
Technology
F -Lack of
awareness -
-Awareness campaign
- Exposure visit
11
Weed
Management
-Hand Weeding
Use of
Scientific
technologies
F
-Lack of
awareness
-Lack of inputs
Supply of
inputs
-Awareness training
- Supply of inputs.

55
Table – 4.14 Gap in Research / Extension / Adoption and Proposed Extension Strategy for Improving the Productivity /
Income from Maize
Sl. No
Items of Package
Existing practice
Recommended Practice
Gap in Adopt
Specific Reasons for Gap
Farmers Proposed Strategy
Strategy to Overcome gap
1
Sowing
Time Method
Dibbling
April-May Dibbling
Line sowing
April-May Line sowing
P -Lack of awareness
-
-Lack of awareness
-Demonstration
2 Varieties
Local Vijay Composite Navjot
F -Lack of awareness
- -Lack of awareness -Demonstration
3 Seed Rate (per ha.)
20-25Kg/ha
15-20 P -Lack of awareness
- -Lack of awareness -Demonstration
4 Seed Treatment
Sun/Smoke drying
Use of chemical F -Lack of chemicals
- -Supply of chemicals
5 Organic Manure (tons / ha)
Nil 2tonnes F Lack of Organic manures
- -Supply of manures
6 Fertilizer
Nil 18:40::40 F
Lack of inputs Lack of awareness
Supply of inputs Supply of inputs Training Demonstration
7 Micro Nutrient
Nil Use of micro nutrients F
Lack of awareness -
Awareness training
8
Pest Management
-Use of cultural methodS
-Use of IPM F -Lack of awareness
-Use of Pesticides
-Introduction of IPM -Exposure visit

56
9 Disease Management.
-Use of cultural methods
-Use of NPK F -Lack of awareness
-Use of Pesticides Introduction of IPM
10 Post Harvest Management
Traditional method
-Scientific Post Harvest Technology
F -Lack of awareness
- -Awareness campaign - Exposure visit
11
Weed
Management
-Hand Weeding
-Use of
Scientific technologies
F
-Lack of
awareness -Lack of inputs
Supply of inputs
-Awareness training
- Supply of inputs.
Note : N - NIL, F - Fully P - Partly

57
Table – 4.15 Proposed Strategy for Agriculture – Physical and Financial targets for the XI Plan
Sl.
No Proposed
Strategy Activities
Unit cost
in Rs
2010-11 2011-12
Phy Fin Phy Fin Total
1
Enhancing
seed
replacement
rate
Production incentive for HYV paddy seeds - - - - - -
Distribution of certified seeds of paddy 1500/qt 50 0.75 75 1.125 1.875
Distribution of certified pulse seeds 4500/qt 80 3.60 95 4.275 7.875
Prodn. incentives for certified pulse seeds - - - - - -
Distribution of certyified oilseeds 3000/qt 30 0.90 40 1.20 2.1
2
Transfer of technology
through crop
demonstration
Mixed cropping demonstration with Maize 5000/ha 15 0.75 25 1.25 2.0
Intercropping demonstration of Arhar based crops 5000/ha 5 0.25 5 0.25 0.5
Intercropping demonstration of Maize based crop 5000/ha 10 0.50 15 0.75 1.25
Demonstration of oilseeds 5000/ha 15 0.75 15 0.75 1.50
Demonstration on pulse 4000/ha 10 0.40 15 0.60 1.00
SRI method of paddy demonstration 7500/ha 15 1.125 15 1.125 2.25
Hybrid rice demonstration 3000/ha 10 0.30 10 0.30 0.9
Farmers Field School (rice, sugarcane, pulses,
oilseeds)
17,000/N
o 20 3.40 25 4.25 7.65
Varietals demonstration on pulses 5000/ha 10 0.50 10 0.50 1.00
Varietals demonstration on Oil seeds 5000/ha 5 0.25 5 0.25 0.50
Varietals demonstration on Maize 5000/ha 10 0.50 10 0.50 1.00
Promotion SRI Village - - - - -
3
Integrated
Nutrient
Management
(FFS)
INM demonstration in rice 17,000/h
a
20 3.40 25 4.25 7.65
INM demonstration on sugarcane 17,000/h
a
10 1.70 15 2.55 4.25
INM demonstration on Oilseed 17,000/h
a
6 1.02 8 1.36 2.38
Supply of micro-nutrients 1000/ha 20 0.20 25 0.25 0.45
Liming of acid soils 1,000/ha 100 1.00 130 1.30 2.30
4 Integrated Pest management
(FFS)
IPM demonstrations on rice 17,000/ha
16 2.72 16 2.72 5.44
IPM demonstrations on Rabi Oilseeeds 17,000/h
a
25 4.25 25 4.25 8.50
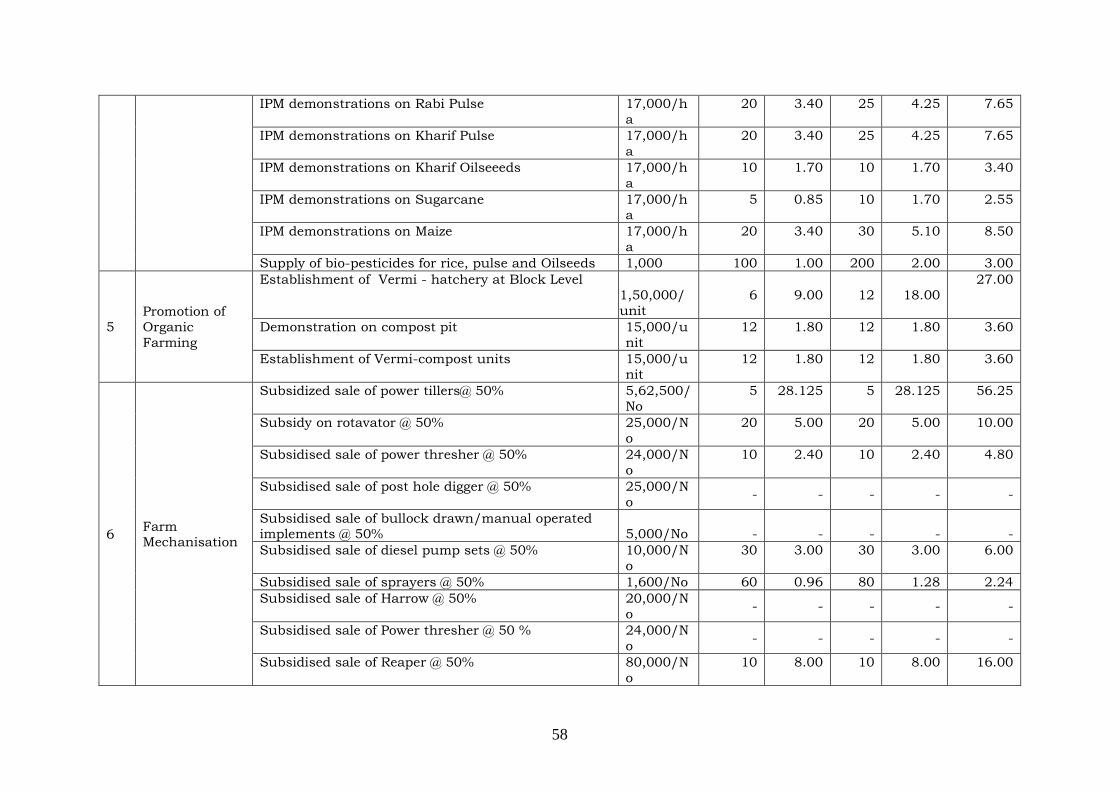
58
IPM demonstrations on Rabi Pulse 17,000/h
a
20 3.40 25 4.25 7.65
IPM demonstrations on Kharif Pulse 17,000/h
a
20 3.40 25 4.25 7.65
IPM demonstrations on Kharif Oilseeeds 17,000/h
a
10 1.70 10 1.70 3.40
IPM demonstrations on Sugarcane 17,000/ha
5 0.85 10 1.70 2.55
IPM demonstrations on Maize 17,000/h
a
20 3.40 30 5.10 8.50
Supply of bio-pesticides for rice, pulse and Oilseeds 1,000 100 1.00 200 2.00 3.00
5
Promotion of
Organic
Farming
Establishment of Vermi - hatchery at Block Level
1,50,000/
unit
6
9.00
12
18.00
27.00
Demonstration on compost pit 15,000/u
nit
12 1.80 12 1.80 3.60
Establishment of Vermi-compost units 15,000/unit
12 1.80 12 1.80 3.60
6 Farm Mechanisation
Subsidized sale of power tillers@ 50% 5,62,500/
No
5 28.125 5 28.125 56.25
Subsidy on rotavator @ 50% 25,000/N
o
20 5.00 20 5.00 10.00
Subsidised sale of power thresher @ 50% 24,000/N
o
10 2.40 10 2.40 4.80
Subsidised sale of post hole digger @ 50% 25,000/N
o - - - - -
Subsidised sale of bullock drawn/manual operated implements @ 50%
5,000/No - - - - -
Subsidised sale of diesel pump sets @ 50% 10,000/N
o
30 3.00 30 3.00 6.00
Subsidised sale of sprayers @ 50% 1,600/No 60 0.96 80 1.28 2.24
Subsidised sale of Harrow @ 50% 20,000/N
o - - - - -
Subsidised sale of Power thresher @ 50 % 24,000/N
o - - - - -
Subsidised sale of Reaper @ 50% 80,000/N
o
10 8.00 10 8.00 16.00

59
Subsidised sale of Cono Weeder @ 50% 3,000/No 50 1.50 50 1.50 3.00
Subsidised sale of Zero tilth seed cum Fert.Drill @
50%
25,000/N
o
5
1.25
5
1.25
2.50
Subsidised sale of Potato Planter 50% 30,000/N
o
5 1.50 5 1.50 3.00
Subsidised sale of Raised Bed Planter @ 50%
25,000/No
-
-
-
-
-
Subsidised sale of Animal Driven Tool Carrier @ 50
%
12,000/N
o
-
-
-
-
-
7 Infrastructure
Development
Establishment of bio control laboratory - - - - -
Assistance for setting up cold storages at District
Headquaters,Sub-Divivsion HQs
-
-
-
- -
Support for establishment of Agri-clinics - - 1 20.00 20.00
Construction of storage godown at District HQ.Sub-Division HQ
-
-
1
40.00
40.00
8 Technology
Transfer
Training farmers groups on crop production
technology (Village Level)
15,000/N
o 9 1.35 9 1.35 2.70
Training farmers groups on crop production
technology (District Level)
30,000/N
o 3 0.90 3 0.90 1.80
Training of VEWs and other extension functionaries on crop production technology at District level
25,000/N
o 1 0.25 1 0.25 0.50
Exposure visit of farmers within the state for 40
farmers
1,00,000/
No
2
2.00
2
2.00 4.00
Exposure visit of farmers outside the state for 20
Farmers
2,00,000/
No 1 2.00 1 2.00 4.00
Conducting field trials on Rabi/ Kharif
100000/
No 2 2.00 2 2.00 4.00
Training of farmers (Village Level) for 50farmers 10,000/N 9 0.90 15 1.50 2.40

60
o
Training of farmers(District/State Level) for 30
farmers
20,000/N
o 2 0.40 3 0.60 1.40
New crop varieties / new practices - - - - - -
9
Support to
State Seed
farm (Seed
Production
Farm)
Procurement of farm inputs LS LS 3.50 LS 6.00 9.50
Machinery and equipment LS LS 5.00 LS 5.00 10.00
Development of Farm Infrastructure LS LS 2.00 LS 2.00 4.00
10 Innovative Programme
Model Organic Farming LS - - - - -
District Level Exhibition Show(Rabi/Kharif) 5,00,000/
No 2 10.00 2 10.00 20.00
Assistance for boring of tube well 24,000/No
10 2.40 15 3.60 6.00
Total 923 139.05 1210 223.66 363.41

61
CHAPTER- 5 DEVELOPMENT OF AGRI-ALLIED SECTORS
5.1 Horticulture in Aizawl District
The North Eastern hill region including Mizoram is considered to be
the rich reservoir of genetic variability of large number of horticultural
crops. The enormous diversity makes the state a gene pool for the varietal
improvement, but in spite of the potentiality, there is not much visible
development in the field of horticulture is going on. Although, the state is
rich with respect to natural resources viz. land, water and biodiversity but
their over exploitation and extraction with poor replenishment has become a
point of concern for their sustainability and future availability with serious
impact on soil health and biodiversity. In addition to natural hazards, the
large scale interference due to traditional system of shifting cultivation and
increased population pressure has enhanced the process of degradation and
desertification to the great extent. Mizoram has unique diversity of agro-
climatic condition, altitudinal variation and well distributed rainfall, which
is highly conducive for cultivation of wide range of horticultural crops
covering fruits, vegetables, plantation crops, flowers, aromatic and medicinal
plants.
In North Eastern Region, horticultural crop are grown in an area of about
6558 lakh ha and produces 49 lakh tonnes of horticultural products. This
roughly accounts for 6% of the countries area under horticulture. Mizoram
has an area of 49339.20 ha (Fig: 1) under horticulture and it produces
499959.05MT of horticultural crops with a productivity of 10.37MT/ha.
Among the horticultural crops, fruit crops occupies maximum area
(33470.00 ha) in the state. The fruits grown ranges from tropical and sub-
tropical fruits like passion fruit, Khasi mandarin, banana, papaya,
pineapple, jack fruit and citrus to temperate fruits like grape, pear and
certain nut fruits. It has a production of 286411.00 MT and productivity of
8.56 MT/ha. Floriculture (91.62 ha) in the state is mainly limited to the few
greenhouses, polyhouses, nethouses and some commercial and government
nurseries and farms. The root and tuber crops in the state are not grown

62
abundantly as it occupies only 4% to the total horticultural crop production
from 91.62ha. In case of plantation crops, its area is 19% but its share to
the total production is 1% only. Whereas, spice crops occupies 14% area to
the total area of horticultural crops but its share to the total production is
more than 28%.
In Mizoram passion fruit and Khasi mandarin are commonly grown
but they have the lowest productivity among the fruit crops. Banana has
the highest production (151519 MT) fallowed by passion fruit and Khasi
mandarin. Among the fruit crops it is found that papaya has the highest
productivity (25.13 MT/ha).
The commonly grown plantation crop in the state are arecanut,
jatropha, oil palm, betel vine, coconut, tung etc. Recently oil palm has
got the popularity in this region and covers 7219ha. But the
production (4451.70MT) and productivity (2.85MT/ha) is found to be
the highest for arecanut among the plantation crops.
Turmeric and ginger are very popular in this hill state and they cover
almost all the area (7762ha) under spice crops grown. Among the
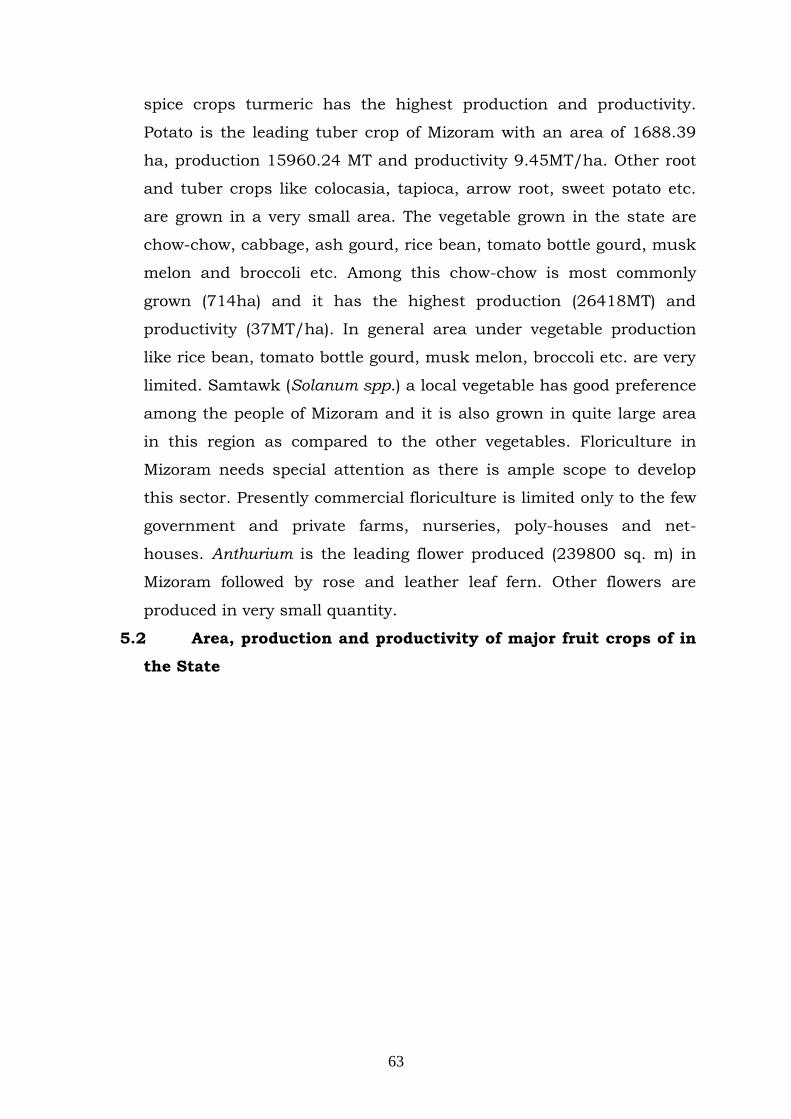
63
spice crops turmeric has the highest production and productivity.
Potato is the leading tuber crop of Mizoram with an area of 1688.39
ha, production 15960.24 MT and productivity 9.45MT/ha. Other root
and tuber crops like colocasia, tapioca, arrow root, sweet potato etc.
are grown in a very small area. The vegetable grown in the state are
chow-chow, cabbage, ash gourd, rice bean, tomato bottle gourd, musk
melon and broccoli etc. Among this chow-chow is most commonly
grown (714ha) and it has the highest production (26418MT) and
productivity (37MT/ha). In general area under vegetable production
like rice bean, tomato bottle gourd, musk melon, broccoli etc. are very
limited. Samtawk (Solanum spp.) a local vegetable has good preference
among the people of Mizoram and it is also grown in quite large area
in this region as compared to the other vegetables. Floriculture in
Mizoram needs special attention as there is ample scope to develop
this sector. Presently commercial floriculture is limited only to the few
government and private farms, nurseries, poly-houses and net-
houses. Anthurium is the leading flower produced (239800 sq. m) in
Mizoram followed by rose and leather leaf fern. Other flowers are
produced in very small quantity.
5.2 Area, production and productivity of major fruit crops of in
the State

64
Table 5.1. Area, production and productivity of major fruit crops of
Mizoram (2007-08)
Sl. No.
Name of crop Area (ha) Production (MT)
Productivity (MT/ ha)
1 Passion fruit B 7 44720 5.00
NB/NP 480 - -
2 Grape B 672 10416 15.50
NB/NP 500 - -
3 Banana B 6220 151519 24.36
NB/NP 1000 - -
4 Khasi Mandarin B 6395 41567 6.5
NB/NP 2812 - -
5 Papaya B 617 15505 25.13
NB/NP 200 - -
6 Hatkora B 854 5969 6.99
NB/NP 1007 - -
7 Other citrus (Lemon, Kagzi lime, Pumelo, Zamir, Sweet orange etc.)
B 942 6132 6.51
NB/NP 453 - -
8 Avocado B 35 716 20.47
NB/NP 100 - -
9 Other fruits (Mango, Peach, Plum, Jack fruit, Guava, Tamarind, Pear, Litchi, Gooseberry etc.)
B 1722 9867 5.73
NB/NP 517 - -
Total 33470.00 286411.00 8.56 B-Bearing, NB- Non bearing, NP- New plantation Source: Directorate of Horticulture, (2007-08)

65
Table 5.2. Area, production and productivity of major plantation crops of
Mizoram (2007-08)
Sl. No.
Name of crop Area (ha) Production (MT)
Productivity (MT/ ha)
1 Areca nut B 1562 4451.70 2.85
NB/NP - - -
2 Jatropha B - - -
NB/NP 150 - -
4 Oil palm B - - -
NB/NP 7219 - -
3 Other plantation crops (Betel vine, Coconut, Tung etc.)
B 1590 2130.60 1.33
NB/NP 230 - -
Total 10751.00 6582.30 1.29
B-Bearing, NB- Non bearing, NP- New plantation
Source: Directorate of Horticulture, (2007-08)
Table 5.3. Area, production and productivity of major spices of Mizoram (2007-08)
Sl. No.
Name of crop Area (ha) Production (MT)
Productivity (MT/ ha)
1 Turmeric 4175.00 83500.00 20.00
2 Ginger 3587.00 57010.93 15.89
3 Black Pepper 50.00 9.04 0.18
4 Bird eye Chillies 100.00 200.00 2.00
5 Other Spices (Onion, Garlic, Cardamom, Coriander etc.)
- - -
Total 7912.00 140720 17.79
Source: Directorate of Horticulture, (2007-08)
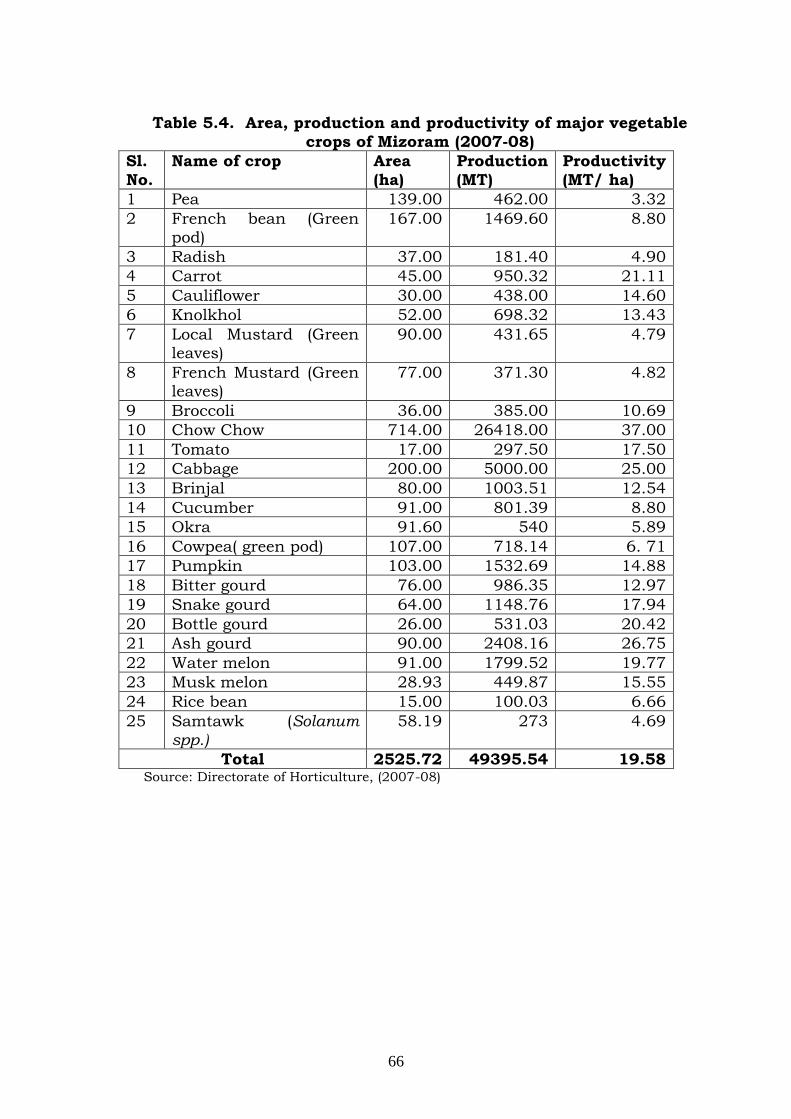
66
Table 5.4. Area, production and productivity of major vegetable
crops of Mizoram (2007-08)
Sl.
No.
Name of crop Area
(ha)
Production
(MT)
Productivity
(MT/ ha)
1 Pea 139.00 462.00 3.32
2 French bean (Green pod)
167.00 1469.60 8.80
3 Radish 37.00 181.40 4.90
4 Carrot 45.00 950.32 21.11
5 Cauliflower 30.00 438.00 14.60
6 Knolkhol 52.00 698.32 13.43
7 Local Mustard (Green leaves)
90.00 431.65 4.79
8 French Mustard (Green leaves)
77.00 371.30 4.82
9 Broccoli 36.00 385.00 10.69
10 Chow Chow 714.00 26418.00 37.00
11 Tomato 17.00 297.50 17.50
12 Cabbage 200.00 5000.00 25.00
13 Brinjal 80.00 1003.51 12.54
14 Cucumber 91.00 801.39 8.80
15 Okra 91.60 540 5.89
16 Cowpea( green pod) 107.00 718.14 6. 71
17 Pumpkin 103.00 1532.69 14.88
18 Bitter gourd 76.00 986.35 12.97
19 Snake gourd 64.00 1148.76 17.94
20 Bottle gourd 26.00 531.03 20.42
21 Ash gourd 90.00 2408.16 26.75
22 Water melon 91.00 1799.52 19.77
23 Musk melon 28.93 449.87 15.55
24 Rice bean 15.00 100.03 6.66
25 Samtawk (Solanum spp.)
58.19 273 4.69
Total 2525.72 49395.54 19.58 Source: Directorate of Horticulture, (2007-08)

67
Table 5.5. Area, production and productivity of major root and
tuber crops of Mizoram (2007-08)
Sl.
No.
Name of crop Area
(ha)
Production
(MT)
Productivity
(MT/ ha)
1 Potato 1688.39 15960.24 9.45
2 Other tuber crops (Colocasia, Tapioca, Arrow root, Sweet
potato etc.)
119.47 890.00 7.44
Total 1807.86 16850.24 9.32 Source: Directorate of Horticulture, (2007-08)
Table 5.6: Area, Production and Yield of Major Horticulture Crops
Sr.
No. Crop
Area Production Yield t / ha
Irriga-
ted % Rainfed % Total
Irriga-
ted % Rainfed % Total
Irriga-
ted Rainfed Average
1 Orange -- -- 141 -- 141 -- - 13740 13740 -- 97.4 97.4
Banana -- -- 53 -- 53 -- - 12340 12340 -- 233 233
Peas &
Fruits -- -- 697 -- 697 -- - 20910 20910 -- 30 30
Mango -- -- 234 -- 234 -- - 7020 7020 -- 30 30
Lime -- - 269 -- 269 -- - 11850 11850 -- 44.1 44.1
5.3 Organic farming:
Most of the agricultural production in the district is organic by
default. In 1996, the department of Agriculture introduced organic farming
project and ran a trial at Lungmuat village in Aizawl district. Here, organic
farming coupled with contour trench farming was demonstrated which
showed promising results. Training on bio-composting was conducted and
many vermi composting units have been developed. It strongly felt that
Mizoram state by virtue of very less amount of chemical inputs imported and
utilized, has a great scope for successful organic farming. The agricultural

68
department has converted all the departmental farms in to model organic
farms. However, considering the production deficiencies in all foods crops,
promotion of organically grown crops is not gaining popularity. There is no
market net work for selling the high quality organic produces. Further,
commercial productions of organic commodities are very less due to lack of
infra-structural facilities and necessary service providers. Formation of
organic groups also not as per requirement. The complexities and lack of
regional/state certification agencies and cost involvement hinder the
cultivation of organic crops in commercial basis. Use of bio-compost is very
essential for soil health management for sustainable production but need
more attention.
5.4 Existing Horticulture Cultivation Practices of the District
Very few progressive farmer has settled horticulture farm. In this
region most of the farmers are practicing jhum. They slash and burn the
jungle to clean the area and cultivate crops for few years and then they shift
to another area for cultivation. In case of perennial crops after planting most
of the farmers comes for harvesting. They takes no to very little care of their
orchards.
Land preparation
In jhum, burning & cleaning the jungle is done in the months of
February- March and wood ash spread over the entire area and small pit are
dugged to plant vegetables. In some low land area vegetables are taken after
paddy harvest in these areas some land preparation practices are adopted.
Planting:
Most of the crops are grown as rainfed in the Jhum. Planting are
done on the onset of monsoon. During rabi season very few farmers are
taken crops due to non availability of water for irrigation. Fruits crops are
also planted on onset of monsoon. Farmers do not maintain any proper
planting distance.

69
Irrigation:
Most of area the crops are grown as rainfed. In some area farmers
used their ponds for irrigation purpose during rabi season.
Fertilizers and Pesticides:
Use of fertilizers and pesticides are very nominal. Only few progressive
farmers used fertilizer and pesticides as they don‟t have good knowledge of
using fertilizer and pesticides. Approximately 770 tonnes fertilizer are used
for production of agricultural and horticultural crops in the district during
2007-08. (Statistical Abstract, Deptt. Of Agriculture (Crop Husbandry),
Mizoram, 2007-08).
Intercropping and mixed cropping:
Farmers are growing all crops together in their jhum and field as a
mixed crops. Growing vegetables and spices as intercrop between the fruit
crops is the common practice in the district. Generally farmers are growing
brinjal, chillies, cucurbits, beans and cowpea as mixed crop in their orchard
and jhum. Some farmers are also growing cowpea with maize in their fields.
Growing of two or more fruit crops together or vegetables between fruit crops
in the orchard are more common practices in the District.
5.5 Different programme launched by Government for Development of
Horticultural sector in the District:
Technology Mission (Integrated development of horticultural crops) in
North Eastern states:
Under this central sector scheme MM-II & MM-III are successfully
going on in the District. Under MM-II the main activities are area extension
of different horticultural crops, creation of water source, on farm water
supply management and transfer of improved technology, production and
management of horticultural crops and other aspect related to horticulture.
Total 5781.72 ha area of different horticultural crops are expanded and
14022persons are benefited to this scheme (table 14).
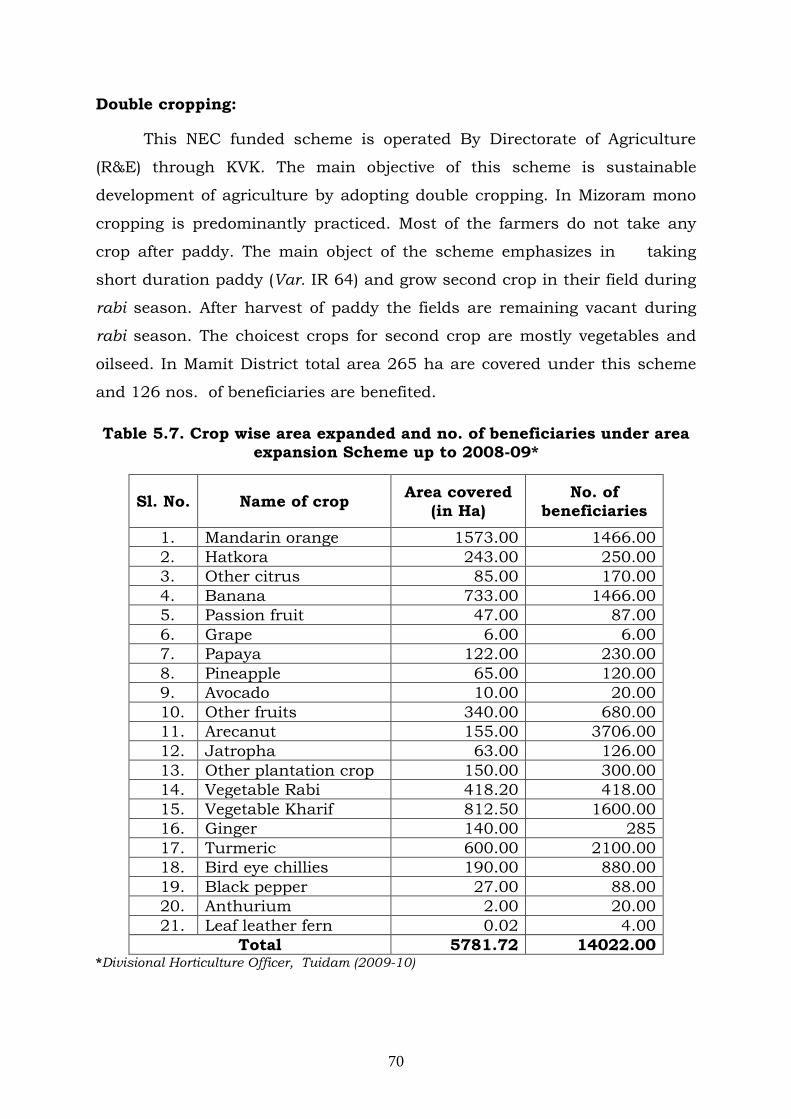
70
Double cropping:
This NEC funded scheme is operated By Directorate of Agriculture
(R&E) through KVK. The main objective of this scheme is sustainable
development of agriculture by adopting double cropping. In Mizoram mono
cropping is predominantly practiced. Most of the farmers do not take any
crop after paddy. The main object of the scheme emphasizes in taking
short duration paddy (Var. IR 64) and grow second crop in their field during
rabi season. After harvest of paddy the fields are remaining vacant during
rabi season. The choicest crops for second crop are mostly vegetables and
oilseed. In Mamit District total area 265 ha are covered under this scheme
and 126 nos. of beneficiaries are benefited.
Table 5.7. Crop wise area expanded and no. of beneficiaries under area expansion Scheme up to 2008-09*
Sl. No. Name of crop Area covered
(in Ha)
No. of
beneficiaries
1. Mandarin orange 1573.00 1466.00
2. Hatkora 243.00 250.00
3. Other citrus 85.00 170.00
4. Banana 733.00 1466.00
5. Passion fruit 47.00 87.00
6. Grape 6.00 6.00
7. Papaya 122.00 230.00
8. Pineapple 65.00 120.00
9. Avocado 10.00 20.00
10. Other fruits 340.00 680.00
11. Arecanut 155.00 3706.00
12. Jatropha 63.00 126.00
13. Other plantation crop 150.00 300.00
14. Vegetable Rabi 418.20 418.00
15. Vegetable Kharif 812.50 1600.00
16. Ginger 140.00 285
17. Turmeric 600.00 2100.00
18. Bird eye chillies 190.00 880.00
19. Black pepper 27.00 88.00
20. Anthurium 2.00 20.00
21. Leaf leather fern 0.02 4.00
Total 5781.72 14022.00 *Divisional Horticulture Officer, Tuidam (2009-10)

71
5.6 Oil Palm Development Programme:
For oil palm development programme, Ministry Of Agriculture and Co-
Operation, Government of India issued administrative approval of oil palm
cultivation under ISOPOM (Integrated Scheme for Oil Palm, Oilseeds and
Maize). The oil palm development programme is a centrally sponsored
scheme on 75:25 sharing between Central Government & State Government.
A high level working group constituted by Government of India under the
chairmanship of Dr. K.L. Chadha have identified 61,000 ha. (approx)
potential area for oil palm cultivation in Mizoram. At present, the entire
eight districts are selected for cultivation of oil palm. Under this programme
at end of XIth plan (2011-12) 31,000ha. area coved under oil palm cultivation
in entire Mizoram.
5.7 Existing varieties of different horticultural crops:
Table 5.8. Important fruit crops and their varieties grown in Mamit
District
5.8 Indigenous crops/ varieties:
Besides the above mentioned crops/varieties, farmers also cultivate
local and indigenous varieties/ crops which are well adopted and suited to
Sl.No. Crops Varieties
1 Mandarin Khasi Mandarin
2 Banana Giant Cavendish, Dawrf Cavendish,
Poovan, Grane Nine
3 Lemon Assam Lemon
4 Pine apple Kew, Queen
5 Passion fruit Purple, Yellow , Giant granadilla
6 Turmeric Megha Turmeric
7 Ginger Nadia, Thingpui, Tingaria, Thinglaidum
8 Papaya Hawaiian Solo, Red leady, Ranchi Dwarf,
Non Descriptive
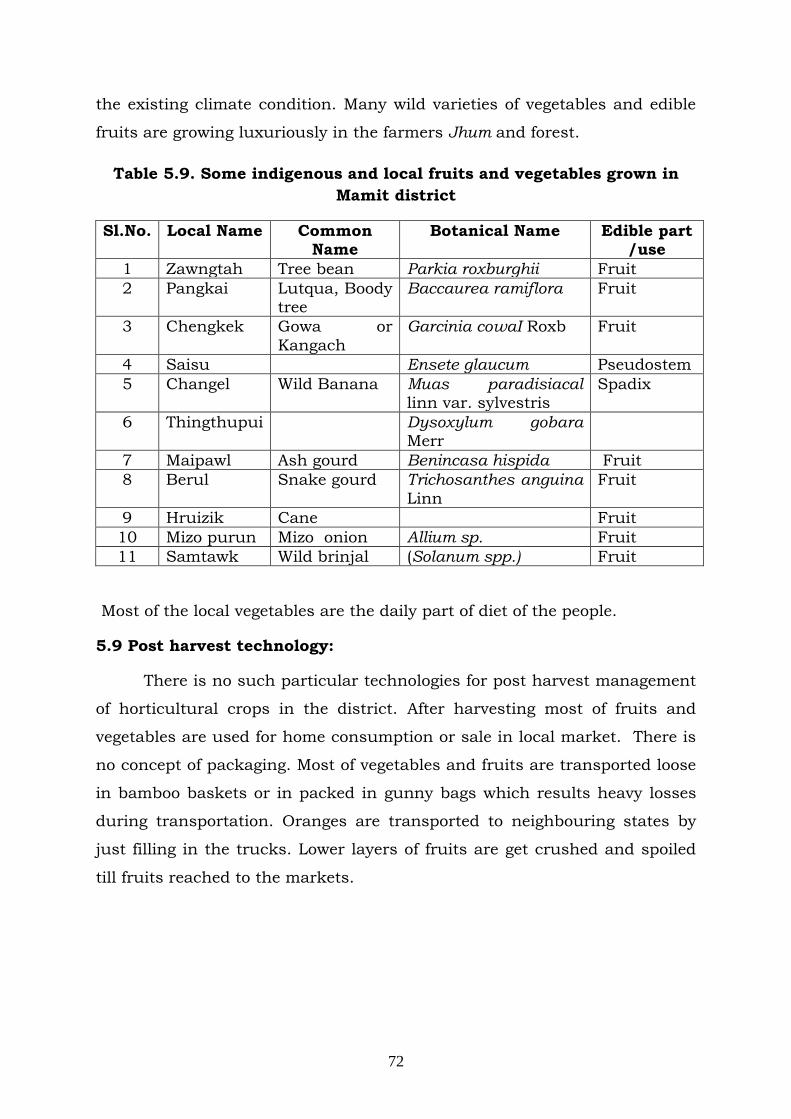
72
the existing climate condition. Many wild varieties of vegetables and edible
fruits are growing luxuriously in the farmers Jhum and forest.
Table 5.9. Some indigenous and local fruits and vegetables grown in
Mamit district
Sl.No. Local Name Common Name
Botanical Name Edible part /use
1 Zawngtah Tree bean Parkia roxburghii Fruit
2 Pangkai Lutqua, Boody tree
Baccaurea ramiflora Fruit
3 Chengkek Gowa or
Kangach
Garcinia cowaI Roxb Fruit
4 Saisu Ensete glaucum Pseudostem
5 Changel Wild Banana Muas paradisiacal linn var. sylvestris
Spadix
6 Thingthupui Dysoxylum gobara Merr
7 Maipawl Ash gourd Benincasa hispida Fruit
8 Berul Snake gourd Trichosanthes anguina Linn
Fruit
9 Hruizik Cane Fruit
10 Mizo purun Mizo onion Allium sp. Fruit
11 Samtawk Wild brinjal (Solanum spp.) Fruit
Most of the local vegetables are the daily part of diet of the people.
5.9 Post harvest technology:
There is no such particular technologies for post harvest management
of horticultural crops in the district. After harvesting most of fruits and
vegetables are used for home consumption or sale in local market. There is
no concept of packaging. Most of vegetables and fruits are transported loose
in bamboo baskets or in packed in gunny bags which results heavy losses
during transportation. Oranges are transported to neighbouring states by
just filling in the trucks. Lower layers of fruits are get crushed and spoiled
till fruits reached to the markets.

73
PRODUCTION GAP ANALYSIS
Table 5.10. Crop Wise Researche / Extension / Adoption Gap Analysis
A. Vegetables : Tomato
Sl. No
Items of Package
Existing practice
Recommended Practice
Gap in Adopt
Specific Reasons for Gap
Farmers Proposed Strategy
Strategy to Overcome gap
1 Sowing
Time
Method
Aug_September
Primary Nursery
Early var : June-July
Middle var: Sept.Oct.
Late var : Oct. – Nov.
Improper management
Lack of awareness and difficulty in convincing farmers
Quality seeds/ inputs
Timely procurement of seeds/inputs and distribution to the farmers.
2 Varieties
Depends on Horti. Deptt./local market
Pusa Samrudhi Aska Saurav, Pusa Uphar
More use of local market units
High cost of hybrid seeds
-do- -do-
3 Seed Rate (per ha.)
1000gm/Ha. Local-400-500gm/ha. Hybrid-200-300g/ha.
Traditional practices
Lack of awareness
Training Training/demonstration
4 Seed Treatment
Poor/Nil Agrosan GN-3gm/1kg seed
Bavistan-2gm.1kgseed
-do- -do- -do- -do-

74
5 Organic Manure
(tons / ha)
Poor Management
FYM-20T/Ha. -do- -do- -do- -do-
6 Fertilizer
Irregular NPK:60:80:120 kg 1Ha. -do- -do- Subsidised -do-
7 Micro Nutrient
Poor/Nil - -do- -do- -do- -do-
8 Pest Management
Need Base Malathion 50EC@2ml/l Rogor 30EC@2ml/l
Improper practices
-do- -do- -do-
9 Disease Management.
Need Base Dithane M-45@3gm/l Indofil M-45@3gm/l
-do- -do- -do- -do-
10 Post Harvest Management
Bomboo basket Proper packing/ plastic crates container
Non-availability
Cost factor
Subsidise rate
-do-
11 Weed Management
Traditional Butachlor @3kg/ha. Alachles @3kg/ha.
High traditional practice
Cost factor, awareness
-do- -do-

75
Crop : Bhindi /OKRA
Table 5.11.Gap in Research / Extension / Adoption and Proposed Extension Strategy for Improving the Productivity / Income from OKRA
Sl. No
Items of Package Existing practice
Recommended Practice
Gap in Adopt Specific
Reasons for Gap
Farmers Proposed Strategy
Strategy to Overcome gap
1 Sowing
Time
Method
April – May
In-situ
Feb – Mar – Spring summer crop
April – June – N.I
Improper management
Lack of awareness and difficulty in convincing farmers
Quality seeds/ inputs
Timely procurement of seeds/inputs and distribution to the farmers.
2 Varieties
Local Aska Abay
Aska Ananuka
More use of local market units
High cost of hybrid seeds
-do- -do-
3 Seed Rate (per ha.)
9-11 kg/ha. 18-22kg/ha. – spring summer
8-10kg/ha. – kharif
Traditional practices
Lack of awareness
Training Training/demonstration
4 Seed Treatment
Nil Bavistan 0.2% -do- -do- -do- -do-
5 Organic Manure
(tons / ha)
FYM FYM 25 T/Ha. -do- -do- -do- -do-

76
6 Fertilizer Occationally NPK:95:10:60 kg/ha.
-do- -do- Subsidised -do-
7 Micro Nutrient
Nil Ca-80kg/ha.
Mg-35kg./ha.
-do- -do- -do- -do-
8 Pest Management
Need base Malathion @2ml/lit
of water
Improper
practices
-do- -do- -do-
9 Disease Management.
-do- Bavistin @2gm/kg. of ssed
Captan/Thiram @3gm/kg of sed
-do- -do- -do- -do-
10 Post Harvest Management
Nil Cooling, packing in gunny bags and do not keep in air tight container
Non-availability
Cost factor Subsidise rate -do-
11 Weed Management
Hand weeding Fluchloralin @1.5kg. a.i/ha.
High traditional practice
Cost factor, awareness
-do- -do-

77
Table 5.12.Gap in Research / Extension / Adoption and Proposed Extension Strategy for Improving the Productivity / Income from Chilli
Sl. No
Items of Package
Existing practice
Recommended Practice
Gap in Adopt Specific
Reasons for Gap
Farmers Proposed Strategy
Strategy to Overcome gap
1 Sowing
Time
Method
March – April
Mixed cropping with jhum paddy
March – May
Nursery raising, In-situ
Improper
management
Lack of
awareness and difficulty in convincing farmers
Quality seeds/
inputs
Timely procurement of
seeds/inputs and distribution to the farmers.
2 Varieties
Local variety, some hybrid variety
California wonder, Pusa Deepti
More use of local market units
High cost of hybrid seeds
-do- -do-
3 Seed Rate (per ha.)
1 Kg./ha. 1 Kg/ha. Traditional practices
Lack of awareness
Training Training/demonstration
4 Seed Treatment
Nil Captan/Thiram @2g/kg of seed
-do- -do- -do- -do-
5 Organic Manure
(tons / ha)
FYM FYM-20T/Ha. -do- -do- -do- -do-
6 Fertilizer
- NPK@100:50:50 kg/ha.
-do- -do- Subsidised -do-

78
7 Micro Nutrient
- - -do- -do- -do- -do-
8 Pest Management
- Chlopyriphos 10kg/ 1ha, Meta Systox 25EC@2ml/l
Improper practices
-do- -do- -do-
9 Disease Management.
Need Base Carbendrzim @1g/kg os seed Thiram/Captan @0.25%
-do- -do- -do- -do-
10 Post Harvest Management
Nil
Traditional Practice
Packed in perjosated plastic bag & store in bamboo basket. Shade dry for 3 days and Sun dry.
Non-availability
Cost factor Subsidise rate -do-
11 Weed Management
Hand weeding Alachlor @2kg/ha. In 800 l of water
High traditional practice
Cost factor, awareness
-do- -do-

79
Crop : GINGER
Table 5.13.Gap in Research / Extension / Adoption and Proposed Extension Strategy for Improving the Productivity / Income from Rhizomatous
Sl. No
Items of Package
Existing practice
Recommended Practice
Gap in Adopt Specific
Reasons for Gap
Farmers Proposed Strategy
Strategy to Overcome gap
1 Sowing
Time
Method
April – May
In – situ
April – May Improper management
Lack of awareness and difficulty in convincing farmers
Quality seeds/ inputs
Timely procurement of seeds/inputs and distribution to the farmers.
2 Varieties
Thingpui, Thanglaidum
Nadia, Thingpui More use of local market units
High cost of hybrid seeds
-do- -do-
3 Seed Rate (per ha.)
5 qtl./acre 12-15 q/ha. Traditional practices
Lack of awareness
Training Training/demonstration
4 Seed Treatment
Nil Dithane [email protected]% for 30 minutes
-do- -do- -do- -do-
5 Organic Manure
(tons / ha)
FYM FYM 25-30T/ha. -do- -do- -do- -do-
6 Fertilizer Occasionally NPK : -do- -do- Subsidised -do-

80
75:50:50kg/ha.
7 Micro Nutrient
- - -do- -do- -do- -do-
8 Pest Management
Need Base Endrin 0.5% Improper practices
-do- -do- -do-
9 Disease Management.
Poor/Nil Dithane M-45 @0.03%
-do- -do- -do- -do-
10 Post Harvest Management
Nil One day sun drying for dry ginger, packing in air proof container.
Non-availability
Cost factor Subsidise rate -do-
11 Weed Management
Hand weeding Alachlor @1.5 kg/ha.
High traditional practice
Cost factor, awareness
-do- -do-
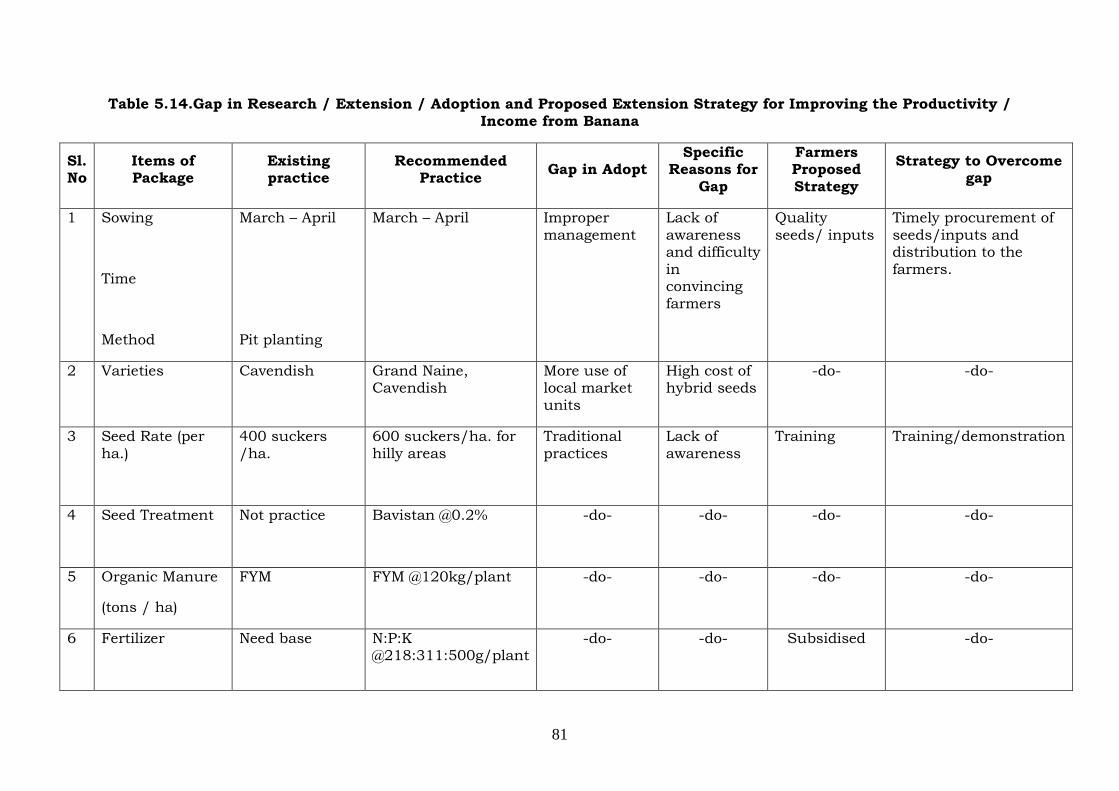
81
Table 5.14.Gap in Research / Extension / Adoption and Proposed Extension Strategy for Improving the Productivity / Income from Banana
Sl. No
Items of Package
Existing practice
Recommended Practice
Gap in Adopt Specific
Reasons for Gap
Farmers Proposed Strategy
Strategy to Overcome gap
1 Sowing
Time
Method
March – April
Pit planting
March – April Improper
management
Lack of
awareness and difficulty in convincing farmers
Quality
seeds/ inputs
Timely procurement of
seeds/inputs and distribution to the farmers.
2 Varieties
Cavendish Grand Naine, Cavendish
More use of local market units
High cost of hybrid seeds
-do- -do-
3 Seed Rate (per ha.)
400 suckers /ha.
600 suckers/ha. for hilly areas
Traditional practices
Lack of awareness
Training Training/demonstration
4 Seed Treatment
Not practice Bavistan @0.2% -do- -do- -do- -do-
5 Organic Manure
(tons / ha)
FYM FYM @120kg/plant -do- -do- -do- -do-
6 Fertilizer
Need base N:P:K @218:311:500g/plant
-do- -do- Subsidised -do-

82
7 Micro Nutrient
- - -do- -do- -do- -do-
8 Pest Management
Cleaning base of the plant
Malathion, Rogor Improper practices
-do- -do- -do-
9 Disease Management.
Poor / Nil Bavistan @2% Removal of bunchy tops
-do- -do- -do- -do-
10 Post Harvest Management
Harvesting & packaging in gunny bags
Grading, drying, packing in bamboo baskets.
Non-availability
Cost factor Subsidise rate -do-
11 Weed Management
Hand weeding Clean cultivation, use of weedicides.
High traditional practice
Cost factor, awareness
-do- -do-

83
Table 5.15. Gap in Research / Extension / Adoption and Proposed Extension Strategy for Improving the Productivity / Income from Pineapple
Sl. No
Items of Package
Existing practice
Recommended Practice
Gap in Adopt Specific
Reasons for Gap
Farmers Proposed Strategy
Strategy to Overcome gap
1 Sowing
Time
Method
April – October
Line Planting
April – October
Line planting across the slope.
Improper
management
Lack of
awareness and difficulty in convincing farmers
Quality seeds/
inputs
Timely procurement of
seeds/inputs and distribution to the farmers.
2 Varieties
Queen, Kew Queen, Kew, Mauritius.
More use of local market units
High cost of hybrid seeds
-do- -do-
3 Seed Rate (per ha.)
15,000 suckers/ha.
44,000 suckers/ha.
Traditional practices
Lack of awareness
Training Training/demonstration
4 Seed Treatment
- Dibling of seed in ceresan solution 4g/l
-do- -do- -do- -do-
5 Organic Manure
(tons / ha)
Not practice FYM @10T/ha. -do- -do- -do- -do-
6 Fertilizer
-do- Urea @40g/10l of water
-do- -do- Subsidised -do-

84
7 Micro Nutrient
-do- - -do- -do- -do- -do-
8 Pest Management
Poor / Nil - Improper practices
-do- -do- -do-
9 Disease Management.
-do- - -do- -do- -do- -do-
10 Post Harvest Management
Not practice Shade drying store in plastic crates.
Non-availability
Cost factor Subsidise rate -do-
11 Weed Management
Hand weeding Butachlor High traditional practice
Cost factor, awareness
-do- -do-

85
Table 5.16.Gap in Research / Extension / Adoption and Proposed Extension Strategy for Improving the Productivity / Income from Passionfruit
Sl. No
Items of Package
Existing practice
Recommended Practice
Gap in Adopt Specific
Reasons for Gap
Farmers Proposed Strategy
Strategy to Overcome gap
1 Sowing
Time
Method
Jan/Feb – sowing
May – Transplanting
In-situ
-do-
-do-
Improper
management
Lack of
awareness and difficulty in convincing farmers
Quality seeds/
inputs
Timely procurement of
seeds/inputs and distribution to the farmers.
2 Varieties
Purple variety Purple var. yellow, var, Hybrid
More use of local market units
High cost of hybrid seeds
-do- -do-
3 Seed Rate (per ha.)
1500 seedlings/ha.
-do- Traditional practices
Lack of awareness
Training Training/demonstration
4 Seed Treatment
Nil - -do- -do- -do- -do-
5 Organic Manure
(tons / ha)
FYM FYM 20T/ha. -do- -do- -do- -do-
6 Fertilizer Need base N:P:K 300: 150:150gm/plant
-do- -do- Subsidised -do-

86
7 Micro Nutrient
- - -do- -do- -do- -do-
8 Pest Management
Need base Malathion 1m/l Nuvan, Dicofol
Improper practices
-do- -do- -do-
9 Disease Management.
Poor/Nil Confidor @0.5 ml/.l of water
-do- -do- -do- -do-
10 Post Harvest Management
Shade drying and pack in bamboo baskets
Store in plastic crates, bamboo basket.
Non-availability
Cost factor Subsidise rate -do-
11 Weed Management
Hand weeding Alachlor @2g/ha. High traditional practice
Cost factor, awareness
-do- -do-

87
Table 5.17.Gap in Research / Extension / Adoption and Proposed Extension Strategy for Improving the Productivity / Income from Potato
Sl. No
Items of Package
Existing practice
Recommended Practice
Gap in Adopt Specific
Reasons for Gap
Farmers Proposed Strategy
Strategy to Overcome gap
1 Sowing
Time
Method
Winter Potato –
Oct- (Plain area) Nov. Summer Potato – Jan – Feb. (Hill area)
-do-
Ridge and furrow, Terracing
Improper
management
Lack of
awareness and difficulty in convincing farmers
Quality seeds/
inputs
Timely procurement of
seeds/inputs and distribution to the farmers.
2 Varieties
Kufri var. Kufri Jyoti, Kufri Mejha, Kufri Ashoka
More use of local market units
High cost of hybrid seeds
-do- -do-
3 Seed Rate (per ha.)
18qtl/Ha. 22.5 – 259/Ha. (Small size 25g)
Traditional practices
Lack of awareness
Training Training/demonstration
4 Seed Treatment
Nil Soaking of seeds in Dithance M-45 @45g/l of water for 30 mins.
-do- -do- -do- -do-
5 Organic Manure
(tons / ha)
5qtl/acre FYM FYM -25-30 T/ha. -do- -do- -do- -do-
6 Fertilizer - N:P:K @ -do- -do- Subsidised -do-

88
120:80:80 kg/ha.
7 Micro Nutrient
- - -do- -do- -do- -do-
8 Pest Management
On need base Malathion 5% Rogor or 30EC
Improper practices
-do- -do- -do-
9 Disease Management.
-do- Dithance M-45@ 0.25% Rodomil 2ml
-do- -do- -do- -do-
10 Post Harvest Management
Store in thatch house
Curing and store in diffused sunlight.
Non-availability
Cost factor Subsidise rate -do-
11 Weed Management
Hand weeding Metribuzin 1kg/ha
High traditional practice
Cost factor, awareness
-do- -do-

89
Proposed Strategy
Activities Unit Cost in Rs. In Lakh
2010-11 2011-12
Phy Fin Phy Fin Total
Fruit Development
M. Orange 0.225 /Ha
60 13.50 65 14.625 28.125
Banana 0.151 / Ha
40 6.00 45 6.75 12.75
Papaya 0.151 / Ha
40 6.00 45 6.75 12.75
Pineapple 0.15 / Ha
45 6.75 45 6.75 13.50
Citrus Rejuvenati
on
0.15 / Ha
80 12.00 85 12.75 24.75
Overhead charge
3.19 3.47 6.66
Grape 0.15 / Ha
40 6.00 45 6.75 12.75
Avocado 0.15 / Ha
40 6.00 45 6.75 12.75
Mango 0.15 / Ha
50 7.50 55 8.25 15.75
TOTAL 395 66.94 430 72.84 139.78
Vegetable Development
Chayote (Squash)
0.13 / Ha
40 5.20 40 5.20 10.40
Cabbage 0.13 / Ha
50 6.50 55 7.15 13.65
Tomato 0.13 / Ha
45 5.85 45 5.85 11.7
Broccoli 0.13 / Ha
40 5.20 50 6.50 11.7
Bhindi 0.13 / Ha
50 6.50 55 7.15 13.65
Bitter gourd
0.13 / Ha
50 6.50 55 7.15 13.65
Brinjal 0.13 / Ha
60 7.80 65 8.45 16.25
Carrot 0.13 / Ha
50 6.50 55 7.15 13.65
TOTAL 385 50.05 420 54.60 104.65
Plantation Crop Development
Coconut 0.20/Ha 50 10.00 60 12.00 22.00
Areca nut 0.15/Ha 60 9.00 70 10.50 19.50
TOTAL 110 19.00 130 22.50 41.50
Spices Development
a) Bird‟s Eye Chillies
0.13/Ha 60 7.80 65 8.45 16.25
b) Turmeric
0.13/Ha 70 9.10 75 9.75 18.85
c) Ginger 0.13/Ha 80 10.40 90 11.70 22.10

90
TOTAL 210 27.30 230 29.90 57.20
Promotion of Nursery
Model Nursery in Public Sector
20.00/no
4 80.00 4 18.00 98.00
Model Nursery in Private Sector
10.00 /no
15 150.00 10 100.00 250.00
Small Nursery in Private Sector (No)
5.00 / no
20 100.0 20 100.0 200.00
Establishment of New Garden
Banana (ha)
Sucker
1st Year Maintained of Banana
Floriculture Rose – (Small & Marginal farmer (Ha)
2.00 / unit
30 60.00 35 70.10 130.10
Incentives to Floriculture Garden (No)
0.50 / unit
30 15.00 35 17.50 32.50
Seed Infrastructure
Vegetable seed Production
10.00/unit
2 20.00 2 20.00 40.00
Integrated Nutrient Management / Integrated Pest Management
A. Fruits IPM on Banana cultivation
0.0.25 200 5.00 300 7.50 12.50
INM on Pineapple
0.05 250 12.50 250 12.50 25.00
INM on Yongchak
0.10 150 15.00 150 15.00 30.00
INM on Passion Fruits
0.10 300 30.00 350 35.00 65.00
IPM on Lime / Lemon
0.025 250 6.25 300 75.00 81.25
B. Vegetables Kharif
IPM on French Bean
0.025 200 5.00 250 6.25 11.25

91
INM on Bhindi
0.05 200 10.00 250 12.50 22.50
INM on Brinjal
0.05 150 7.50 200 10.00 17.50
IPM on Cucurbit
0.025 300 7.50 350 8.75 16.25
INM on Ginger / Turmeric
0.10 450 45.60 500 50.00 95.60
INM on Chillies
0.05 500 25.00 600 30.00 55.00
C. Vegetables Rabi
IPM on Pea 0.05 200 10.00 250 12.50 22.50
IPM on Cabbage
0.05 300 15.00 350 17.50 32.50
INM on Cauliflower
0.05 100 5.00 120 6.00 11.00
INM on Potato
0.10 150 15.00 150 15.00 30.00
INM on Radish
0.05 150 7.50 200 10.00 17.50
INM on Knolkhol
0.05 200 10.00 250 12.50 22.50
INM on Tomato
0.05 150 7.50 150 7.50 15.00
Protected Cultivation
Green House (SF & MF)
0.25/no 40 10.00 50 12.50 22.50
Green House (Other farmer)(Hi Tech)
10.00/no
10 100.00 15 150.00 250.00
Shade net Sq m
0.00020 70 14.00 80 16.00 30.00
Mulching (Ha)
0.08/Ha 70 5.60 80 6.40 12.00
Promotion and Popularization of Organic farming
Construction of compost pit
0.10/no 250 25.00 300 30.00 55.00
Establishment of Vermi- Composts units-Big (No)
2.50/unit
30 75.00 35 87.50 162.50
Establishm

92
ent of Vermi- Compost units-Big (no)
Demonstration of Organic Farming
0.25/no 20 5.00 25 6.25 11.25
Popularization on of organic Fertilizers
Demonstration on use of Rich Reuter “AA”
0.20/unit
30 6.00 35 7.00 13.00
Rich Field
Fertilizer (13:40:13)
0.20/un
it
30 6.00 35 7.00 13.00
Rich Field Fertilizer (19:19:19)
0.20/unit
30 6.00 35 7.00 13.00
Rich Field Fertilizer (13:0:0)
0.20/unit
30 6.00 35 7.00 13.00
Watershed Watershed Development
50.00/no
5 250.00 6 300.00 550.00
Human Resource Development
Training of VEWs and other extension functionaries on crop production technology at District Level.
0.25/no 6 1.50 8 2.00 3.50
Exposure visit outside the State on
IPM / INM, Plantation, Plant Health Management
1.50/no 5 7.50 5 7.50 15.00
Exposure visit inside the state
1.00/no 6 6.00 6 6.00 12.00
Training of 0.25/no 7 1.75 8 2.00 3.75

93
Entrepreneurs
Exposure Visits of Farmers inside the State
1.00/no 5 5.00 5 5.00 10.00
Creation of Water Resources
Construction of community Tanks
2.00/no 70 140.0 80 160.0 300.00
Farm Mechanization
Subsidized sale of power tillers
1.00/no 15 15.00 20 20.00 50.00
Subsidized sale of pump sets @ 50%
0.25/no 20 5.00 30 7.50 12.50
Subsidized sale of sprayers @ 50 %
0.075/no
200 15.00 250 18.75 33.75
Post harvest Infrastructure Development
Assistance for setting up cold storages at Block Level
20.00/unit
4 80.00 80.00
Construction of storage of godown at Block Headquarters
5.00/no 5 25.00 5 25.00 50.00
Establishment of Marketing Infrastructure
Functional Infrastructure for Collection & grading (no)
5.00/no 5 25.00 5 25.00 50.00
Technology transfer
Training of farmer
groups on crop production technology
0.25/no 5 1.25 5 1.25 2.50
Training of farmers on the use of Organic Fertilizers
0.25/no 5 1.25 5 1.25 2.50
Training of 0.25/no 6 1.50 6 1.50 3.00

94
farmers on INM
Training of Farmers on IPM
0.25/no 5 1.25 5 1.25 2.50
Training of Farmers on Post Harvest Technology on important horticultural crops
0.25/no 5 1.25 5 1.25 2.50
Exposure visit of farmers within the state
0.50/no 3 1.50 3 1.50 3.00
Exposure visit of farmers outside the state
1.50/no 3 4.50 3 4.50 9.00
Conducting field trials in new crop varieties / new practices
0.25/no 5 1.25 5 1.25 2.50
Innovative Low Cost Potato Storage
10.00/no
5 50.00 5 50.00 100.00
Programme Structure
District Level Show
2.00/no 2 4.00 2 4.00 8.00
Project Area Connectivity
Horticulture Link Road
3.00/Km
15 45.00 15 45.00 90.00
Capacity Building
(a) Training of
Trainers at(Research institution)
1.00/no 4 4.00 4 4.00 8.00
(b) Awareness Campaign/Seminar/Workshop etc.
5.00 5.00 10.00

95
Table .5.18 Proposed Strategy for Horticultural Development
5.10 LIVESTOCK STATUS AND DEVELOPMENT
In spite of the challenges that lay ahead for Mizoram towards animal
husbandry, India ranks first in respect of cattle and buffaloes, second in
goats, third in sheep and seventh in poultry population in the world. About
22.45 million people work in livestock sector. The contribution of livestock
and fisheries sector to the total GDP during 2006-07 was 5.26%.
India‟s per capita income has doubled over the past 20 years. With
population growth slowing now to about 1.6 per cent per annum, a growth
rate of the gross domestic product (GDP) of around 9 per cent per annum
would be sufficient to quadruple the per capita income by 2020 (Planning
Commission, 2002).
The district poses a challenge in animal husbandry, but restrains like
protectionism policies of the state or the country handicaps the true want
towards animal husbandry. Good governance, sustainable development in
conjunction with environmental friendly methods is perhaps the only
practical answer in order to correct the issues at hand. Scientific methods
improving the products of animals i.e. use of biotechnology may perhaps be
helpful but unfortunately will not increase productivity so as to claim animal
husbandry as part of our GDP. On the other hand challenges are met and
yes, the future holds a promise in all fields as long as we put our heads
together and pave the green fields.
Infrastructure Technical Support
4.50 4.50 90.00
Mushroom Development Unit
Spawn Production
20.00/unit
1 20.00
20.00
Model Horticulture Centre
Research & Development in Horticulture Crops
50.00/no
1 50.00 1 50.00 100.00
Total 6,469 1695.95 7505 1940.60 3895.83

96
There is increasing demand of milk and meat products in the district.
Rearing piggery and poultry are popular mainly for meat production and egg
production. People are showing interest in cattle rearing and dairy farming
in few pockets of the district. Milk production in co-operative basis also
gaining popularity.
However, present level of production can meet only 60 – 65 % of the
total requirements. To fill this gap it is necessary for popularization of more
diary, piggery and poultry farms. State veterinary department, KVK and
College of veterinary science, CAU have to initiate necessary actions for
furthering the development.
Table 5.19: Livestock Information
Area
under
Fodders
(ha)
Cattle(Nos) Buffaloes
(Nos) Sheep(No.) Goats(No.) Poultry(Nos)
Oth
ers
(Nos
)
Total
(Nos)
Fodde
r
crops
Gra
zin
g
Lan
d
Cross
Breed
Indig
e-
nous
Total
Im
pr
o-
ve
d
Ind
ige-
no
us
Tot
al
Im
pro
-
ved
In
di
ge
-
no
us
Tot
al
Im
pr
o-
ve
d
Indige
-
nous
Total Broiler Layer Duck
s
Tur
key
288.8 5860 1486 7346 Nil 263 263 Nil 86 86 Nil 1576 1576 169559 139753 1445 677 3111434
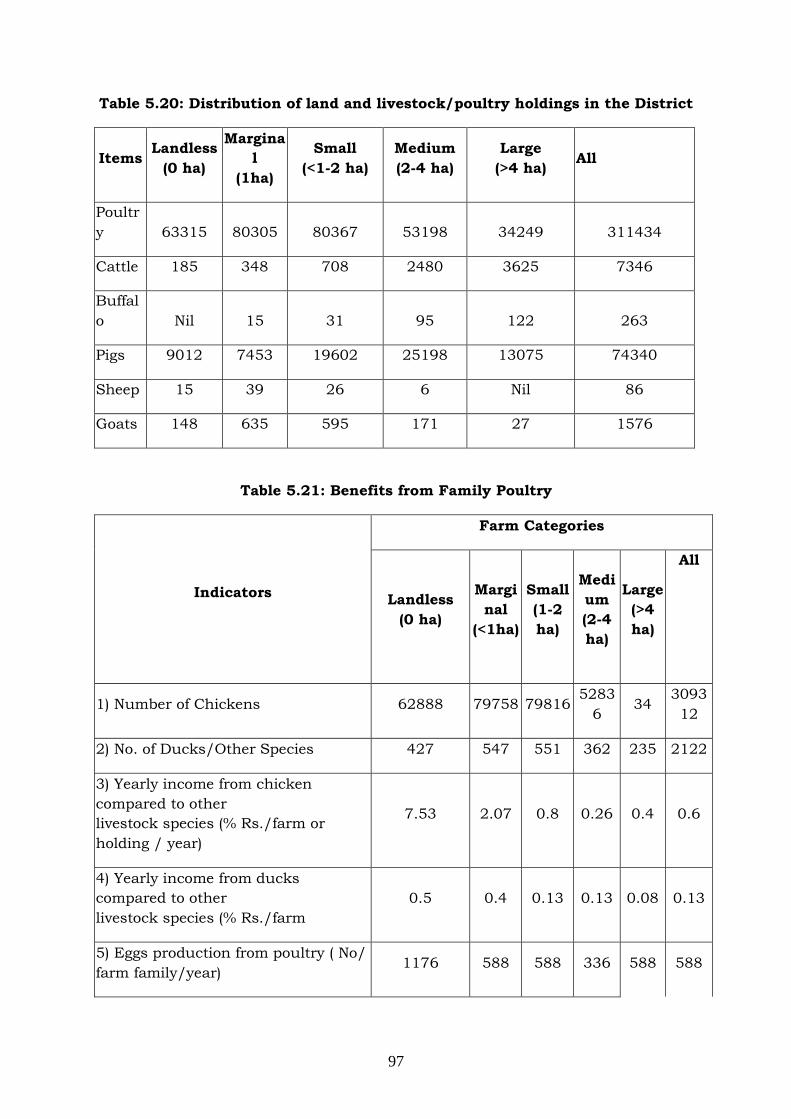
97
Table 5.20: Distribution of land and livestock/poultry holdings in the District
Items Landless
(0 ha)
Margina
l
(1ha)
Small
(<1-2 ha)
Medium
(2-4 ha)
Large
(>4 ha) All
Poultr
y 63315 80305 80367 53198 34249 311434
Cattle 185 348 708 2480 3625 7346
Buffal
o Nil 15 31 95 122 263
Pigs 9012 7453 19602 25198 13075 74340
Sheep 15 39 26 6 Nil 86
Goats 148 635 595 171 27 1576
Table 5.21: Benefits from Family Poultry
Indicators
Farm Categories
Landless
(0 ha)
Margi
nal
(<1ha)
Small
(1-2
ha)
Medi
um
(2-4
ha)
Large
(>4
ha)
All
1) Number of Chickens 62888 79758 79816 5283
6 34
3093
12
2) No. of Ducks/Other Species 427 547 551 362 235 2122
3) Yearly income from chicken
compared to other
livestock species (% Rs./farm or
holding / year)
7.53 2.07 0.8 0.26 0.4 0.6
4) Yearly income from ducks
compared to other
livestock species (% Rs./farm
0.5 0.4 0.13 0.13 0.08 0.13
5) Eggs production from poultry ( No/
farm family/year) 1176 588 588 336 588 588

98
Gender participation
i) Male 90% 90% 90% 90% 90% 90%
ii) Female 10% 10% 10% 10% 10% 10%
Social Profile
i)SC -- -- ---- -- -- -- -- -- -- --
ii)ST 90% 90% 90% 90% 90% 90%
iii) Others 10% 10% 10% 10% 10% 10%
Table 5.22 : Taluka wise Existing of Veterinary Institutions (Aizawl District)
Dist Village
s
Institutions (Nos)
Total
V
H VD
MV
C PVC AIC
KVS
sub-
Centre
Diagno
stic
Labs
PEC
College
/unive
rsity/K
VKTota
l
Aiza
wl 166 1 6 Nil -- 20 -- 1 -- 2 30
VH - Veterinary Hospital, VD - Veterinary Dispensary,
MVC - Mobile Veterinary Centres, PVC - Proposed Veterinary Centres
Source : Statistical Handbook,
Mizoram 2008

99
Table 5.23: Production Plan of Livestock during 11th plan
Sl.
No
Name of
Commodity
Baseline (2007-2008) Baseline (2008-2009) Baseline (2009-2010)
Nos Production (in
tones)
Productivity
(in Kg/nos) Nos Production
Productivi
ty Nos Produc-tion Productivity
1 Milk
i
Indigenous
Cow 956 358 374 1017 371tns 365 kg 1023 383tns 374 kg
ii
Crossbred
Cow 2978 8156 2738.6 2970 7973tns 2677 kg 2969 8131tns 2739 kg
iii Buffalo 106 48 453 125 54 tns 432 kg 127 58 tns 453 kg
2 Eggs
i Desi 56000 4700000 85 nos 56000 5000000 89 nos 56309 47863 85 nos
ii Improved 3000000 6500000 217 nos 2800000 6100000 218 nos
302076
1 6555051 217nos
iii Broiler 547288 1429.52 2.612 57011 1568 tns 2.75 kg 57244 1592 tns 2.792 kg
3 Meat
i Cattle 8938 1025 114.679 9350 1086.6 tns 116.09 kg 9403 1095.54tns 116.51 kg
ii Buffalo 145 19.99 137.931 85 11.523 tns 135.50 kg 74 10.04 tns 135.73 kg
iii 3. Mithun 14 1.89 135.000 65 8.81 tns 135.50 kg 74 10.04 tns 135.73 kg
iv 4. Goats 3122 28 8.969 3380 33.8 tns 10.00 kg 3407 34.34 tns 10.08 kg
v 5. Pigs 44353 4225.99 95.281 45072 4326.91tns 95.999 kg 45145 4343.4 tns 16.21 kg

100
Table 5.24 : Production Plan of Livestock
Sl.
No
Name of
Commodity
Baseline (2010-2011) Baseline (2011-2012) Baseline (2012-2013)
Nos Production Productivity Nos Production Productivit
y Nos Produc-tion
Produc-
tivity
1 Milk
i
Indigenous
Cow 1030 386 tns 374.49 kg 1036 389 tns 375 kg 1042 392 tns 365 kg
ii Crossbred Cow 2968 8131 tns 2739 kg 2968 8131 tns 2740 kg 2967 8130 tns 2677 kg
iii Buffalo 129 59 tns 454 kg 131 59 tns 454 kg 134 61 tns 432 kg
2 Eggs
i Desi 56620 48127 lakhs 85 nos 56932 48962 nos 86 nos 57247 50377 nos 89 nos
ii Improved 3041667 6630834 lakhs 218 nos 3062748 6676725 218 nos 3083916 6753776 218 nos
iii Broiler 57478 1610 tns 2.801 57713 1635.59 tns 2.834 kg 57949 1716.45 2.75 kg
3 Meat
i Cattle 9438 1101.71 tns 116.731 kg 9478 1108.56tns 116.981 kg 9534 1118.54 tns 116.09 kg
ii Buffalo 77 10.52 tns 136.63 kg 73 9.981 tns 136.734 kg 69 9.44 tns 135.50 kg
iii 3. Mithun 84 11.42 tns 135.96 kg 94 12.784 tns 136.00 kg 110 15.05 tns 135.50 kg
iv 4. Goats 3434 35.99 tns 10.48 kg 3461 37.97 tns 10.97 kg 3489 38.56 tns 10.00 kg
v 5. Pigs 4517 4361.9 tns 96.466 kg 45290 4382.31 tns 96.761 kg 45363 4395.31 tns 95.999 kg

101
Table 5.25. Research / Extension / adoption Gap and Proposed Strategies for Improving the Productivity / Income from
Goat
Sl. No.
Items of package Existing practice
Recommended practice
Gap Specific Reasons for Gap
Farmers Proposed Strategy
Strategy to Overcome gap
1 Breed (Non descript Cross Breed) Black Bengal Fail No supply of kids Subsidized kids supplied to
Dissemination of
2 Feed management
Animals are Unavailability of good
farmers proposed breed through A.H & Vety. farm
Green Fodder (Kg / day) grazed in 1-2 grazing land subsidized To supply feed
Dry Fodder (Kg / day) available 0.5-1 Failed cultivated with rate of in subsidized rate and to
Concentrate (gms / day) grazing 500 gms / day suitable fodder concurate feed cultivate fodder in available grazing land
Minerals (gm/day) land as per required Eg. Signal grass
Vitamins (ml / day) by status of
3 Inter Calving Period (months)
150-180 days
animal
160 days
Good
Health care and Vaccination
Village farmers Need for increased veterinary care
4 Health Care limited veterinary aids limited in need access centres and man power
No of Vaccination Annually P village done to atleast once

102
HSBQ Annually Annually P transportation a month
FMD Annually Annually P
5 General Management
Washing (times / day) No specific Semi intensive Failed Lack of Financial and technical support
Training, Monitoring and
Cleaning (times / day) Management with proper knowledge financial support
Housing ( Pucca / Kutcha)
housing and land
Drinking Water (lit / day)
6 Average Milk Yield (lit./day)
No milking done
NB : Vaccination are covered under AH & Vety. Dept. Mizram. However, there has been difficulty in covering villages, due to transport and
limited supply of vaccines.
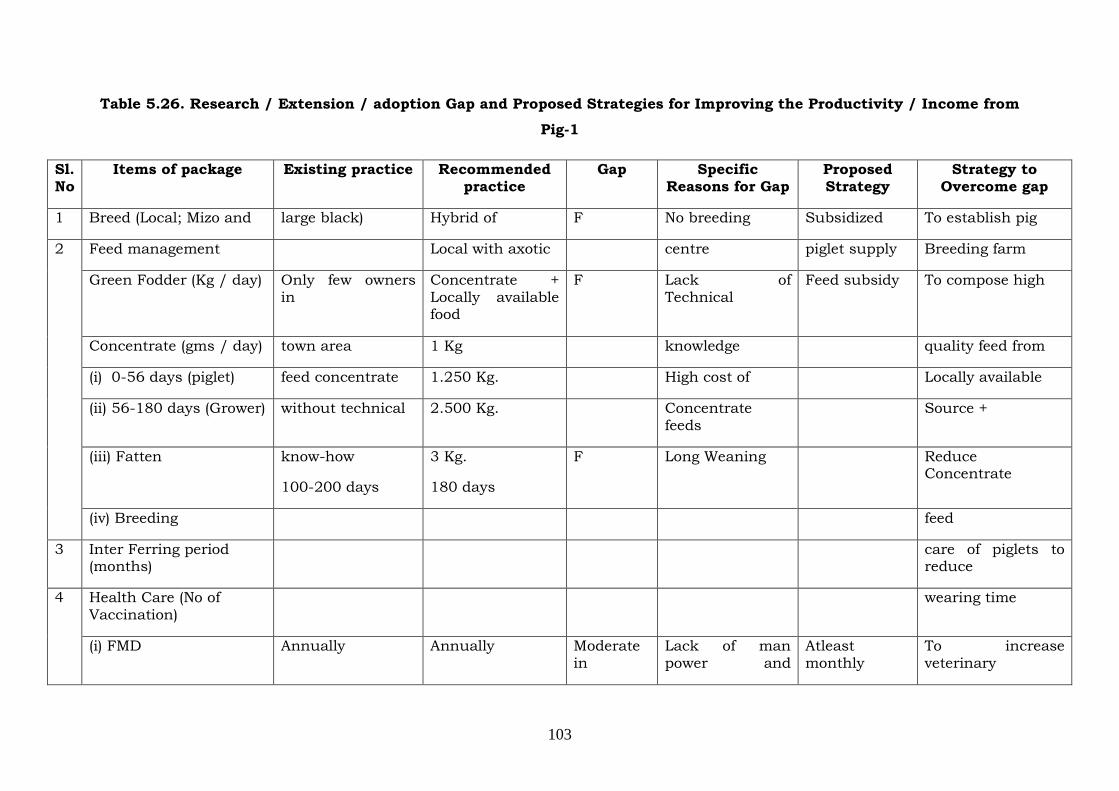
103
Table 5.26. Research / Extension / adoption Gap and Proposed Strategies for Improving the Productivity / Income from
Pig-1
Sl. No
Items of package Existing practice Recommended practice
Gap Specific Reasons for Gap
Proposed Strategy
Strategy to Overcome gap
1 Breed (Local; Mizo and large black) Hybrid of F No breeding Subsidized To establish pig
2 Feed management Local with axotic centre piglet supply Breeding farm
Green Fodder (Kg / day) Only few owners in
Concentrate + Locally available food
F Lack of Technical
Feed subsidy To compose high
Concentrate (gms / day) town area 1 Kg knowledge quality feed from
(i) 0-56 days (piglet) feed concentrate 1.250 Kg. High cost of Locally available
(ii) 56-180 days (Grower) without technical 2.500 Kg. Concentrate feeds
Source +
(iii) Fatten know-how
100-200 days
3 Kg.
180 days
F Long Weaning Reduce Concentrate
(iv) Breeding feed
3 Inter Ferring period (months)
care of piglets to reduce
4 Health Care (No of Vaccination)
wearing time
(i) FMD Annually Annually Moderate in
Lack of man power and
Atleast monthly
To increase veterinary
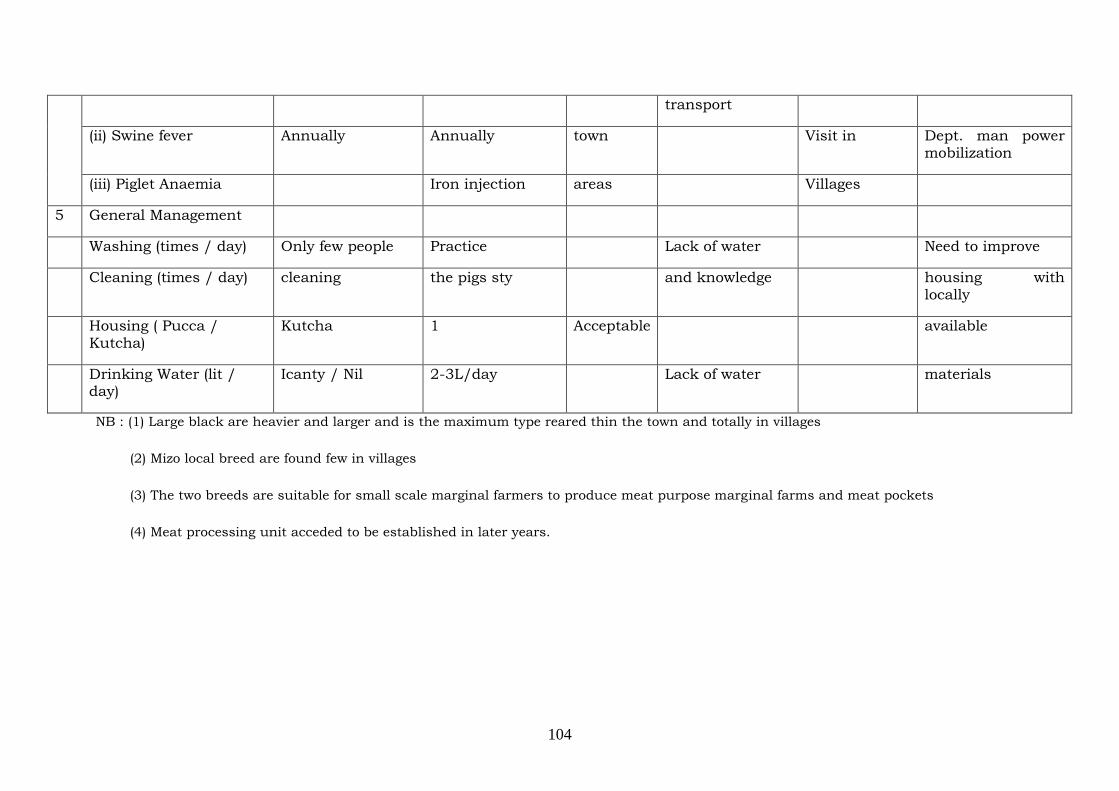
104
transport
(ii) Swine fever Annually Annually town Visit in Dept. man power mobilization
(iii) Piglet Anaemia Iron injection areas Villages
5 General Management
Washing (times / day) Only few people Practice Lack of water Need to improve
Cleaning (times / day) cleaning the pigs sty and knowledge housing with locally
Housing ( Pucca / Kutcha)
Kutcha 1 Acceptable available
Drinking Water (lit / day)
Icanty / Nil 2-3L/day Lack of water materials
NB : (1) Large black are heavier and larger and is the maximum type reared thin the town and totally in villages
(2) Mizo local breed are found few in villages
(3) The two breeds are suitable for small scale marginal farmers to produce meat purpose marginal farms and meat pockets
(4) Meat processing unit acceded to be established in later years.

105
Table 5.27. Research / Extension / adoption Gap and Proposed Strategies for Improving the Productivity / Income from
Pig-2
Sl. No
Items of package Existing practice Recommended practice
Gap Specific Reasons for
Gap
Farmers Proposed Strategy
Strategy to Overcome gap
1 Breed (Yokkshire X Duroc
Cross breed LWY x Duroc x F No breeding farm
Subsidized piglet
To establish pig breeding farm and Artificial Insemination Centre
2 Feed management
few people reared for breeding)
Large Black P Subsidized
Green Fodder (Kg / day) 2 Kg. 2 Kg. High Cost rate of To produce
Concentrate (gms / day) 1.25 Kg F of Concentrate feed Subsidized feed
(i) 0-56 days (piglet) 100 g 1.5 Kg F feeds
(ii) 56-180 days (Grower) 250 g 2.5 Kg F
(iii) Fatten 1 Kg 3 Kg F
(iv) Breeding 2 Kg F
3 Inter Ferring period (months)
180-200 days 160 days Long weaning time
To improve piglet health and reduce weaning time
4 Health Care (No of Covered

106
Vaccination)
(i) FMD Annually Annually P only town
(ii) Swine fever Annually Annually P area
(iii) Piglet Anaemia Iron injection Iron injection P
5 General Management
Washing (times / day) 1-8 / week Daily F Need for
Cleaning (times / day) 1-3 week Daily F Training and
Housing ( Pucca / Kutcha)
Kutch & Pucca Pucca F Farm
Drinking Water (lit / day)
1-2L / day 1-2L / day P Demonstration
NB : The present breed is oceared by few people in town area for breeding. The recommended breed. (Large white lorkshire X Duroc X fargi
black (Local). At present people get cross-bred piglets from other district leading to transportation cost and high cost. Thus, there is need for a
pig breeding farm at Saiha district to promote piggery through Artificial Insemination.

107
Table 5.28. Research / Extension / adoption Gap and Proposed Strategies for Improving the Productivity / Income from
Cow / Mithun / Hill Cattle
Sl. No
Items of package Existing practice
Recommended practice
Gap Specific Reasons for
Gap
Farmers Proposed Strategy
Strategy to Overcome gap
1 Breed 2 types – Hill cattle
& milch cow Mithun & croes Few people only Subsidized Artificial
2 Feed management
(for Dairy)
breed are interested calf Insemination to improve breed
Green Fodder (Kg / day) 10 – 15 Kg. 15 – 20 Kg F No Supply fodder land
Dry Fodder (Kg / day) 2 – 6Kgs. F and fodder development
Concentrate (gms / day) Limited 4 – 8 Kgs. F area feed subsidy
Vitamins (ml / day) Very limited As required F
3 Inter Calving Period (months) (for Dairy)
380-400 days 370 day F Long weaning date
Shortening of weaning time
4 Health Care Available
No. of Vaccination
HSBQ Annually Annually P
FMD Annually Annually P
5 General Management

108
Housing ( Pucca / Kutcha)
Kutcha Kutcha P
Drinking Water (lit / day/ 100 Birds)
2 – 3 L 5 - 8 L F Scarcity of coater
Improvement of housing
6 Average Milk Yield (lit. / day)
5 L 8 – 10 L F Low quality Improved feed and fodder land
feed
NB : 1. Hill cattle could be replaced by Mithun in villages having vast grazing land. Nithun doesnot need feeding except for mineral salt lacks
2. Milch cattle can be of cross breed (H.F X Jersey) for town area and villages near to district headquarters.
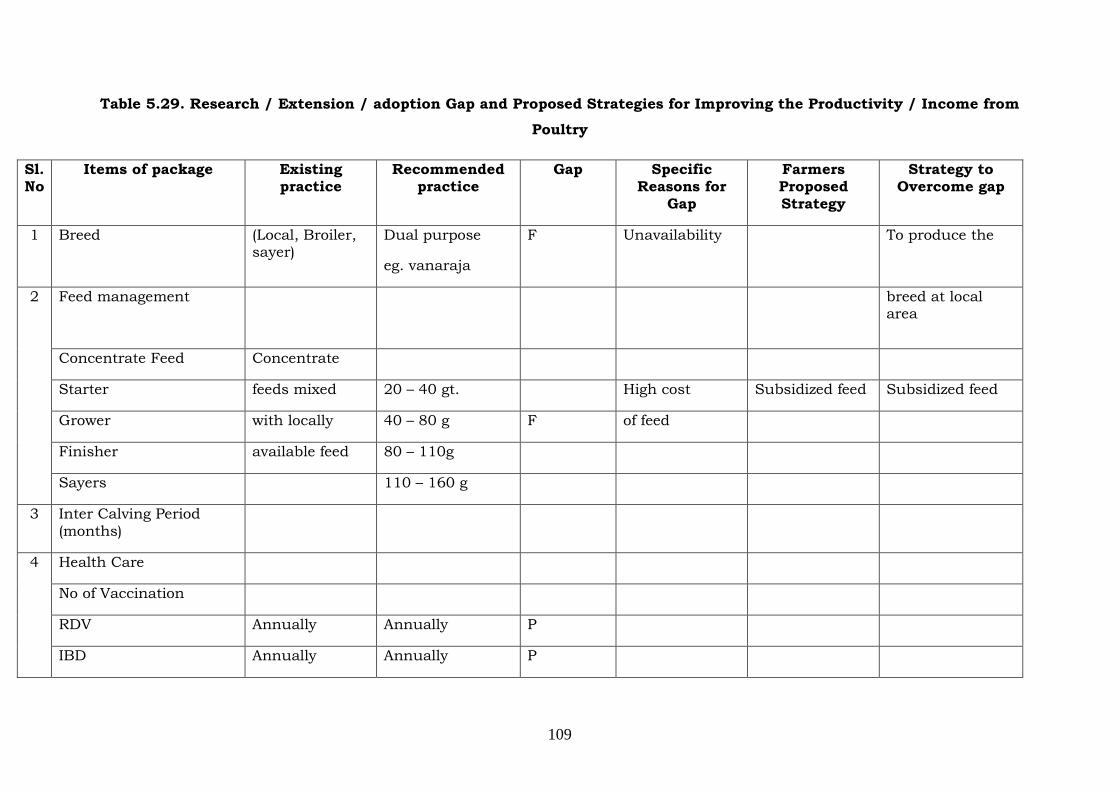
109
Table 5.29. Research / Extension / adoption Gap and Proposed Strategies for Improving the Productivity / Income from
Poultry
Sl. No
Items of package Existing practice
Recommended practice
Gap Specific Reasons for
Gap
Farmers Proposed Strategy
Strategy to Overcome gap
1 Breed (Local, Broiler, sayer)
Dual purpose
eg. vanaraja
F Unavailability To produce the
2 Feed management
breed at local area
Concentrate Feed Concentrate
Starter feeds mixed 20 – 40 gt. High cost Subsidized feed Subsidized feed
Grower with locally 40 – 80 g F of feed
Finisher available feed 80 – 110g
Sayers 110 – 160 g
3 Inter Calving Period
(months)
4 Health Care
No of Vaccination
RDV Annually Annually P
IBD Annually Annually P

110
5 General Management
Housing ( Pucca / Kutcha)
Drinking Water (lit / day )
6 Average Milk Yield (lit. / day)
F Insufficient
water supply

111
Table 5.30. Proposed Strategy for Animal Husbandry & Veterinary
Sl. No Interventions Unit cost Rs.
2010-11 2011-12
1 Animal Health Phy Fin Phy Fin Total
i) Distribution of Vety. Aid Kids 50000/ training 4 nos 2.00 4 2.00 4.00
ii) Cosnt. Of vety. Disp. 20
lakhs/dispensary
1 20.00 1 20.00 40.00
Cattle and Buffalo Dev.
Milk cow induction cow/heifer expected give 10 lit. of
milk per day
Rs 40,000/ cow 10
Cows
4.00 10
Cows
4.00 8.00
2 Piggery development
Distribution of 5 piglets (4female +1 male) of age group
3-4 month.
Rs 3000/Piglet 20
piglet
0.60 20
piglet
0.60 1.20
3 Poultry Development
Backyard Poultry scheme Distribution of 40 grown up
low input technology birds
Rs.350/Bird ie
Rs 1400/unit
30 Unit 4.20 30 4.20 8.40
Construction of Chick rearing unit with procurement of Rs 25 lakhs / 1 25.00 25.00
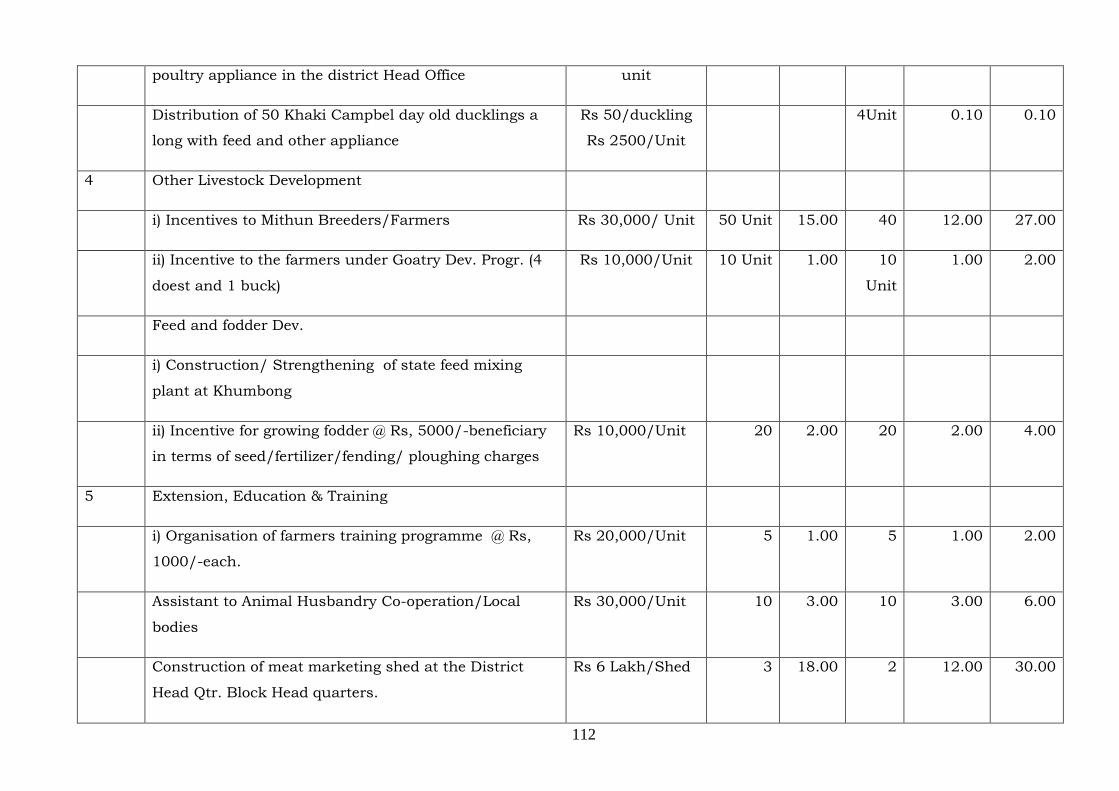
112
poultry appliance in the district Head Office unit
Distribution of 50 Khaki Campbel day old ducklings a
long with feed and other appliance
Rs 50/duckling
Rs 2500/Unit
4Unit 0.10 0.10
4 Other Livestock Development
i) Incentives to Mithun Breeders/Farmers Rs 30,000/ Unit 50 Unit 15.00 40 12.00 27.00
ii) Incentive to the farmers under Goatry Dev. Progr. (4
doest and 1 buck)
Rs 10,000/Unit 10 Unit 1.00 10
Unit
1.00 2.00
Feed and fodder Dev.
i) Construction/ Strengthening of state feed mixing
plant at Khumbong
ii) Incentive for growing fodder @ Rs, 5000/-beneficiary
in terms of seed/fertilizer/fending/ ploughing charges
Rs 10,000/Unit 20 2.00 20 2.00 4.00
5 Extension, Education & Training
i) Organisation of farmers training programme @ Rs,
1000/-each.
Rs 20,000/Unit 5 1.00 5 1.00 2.00
Assistant to Animal Husbandry Co-operation/Local
bodies
Rs 30,000/Unit 10 3.00 10 3.00 6.00
Construction of meat marketing shed at the District
Head Qtr. Block Head quarters.
Rs 6 Lakh/Shed 3 18.00 2 12.00 30.00

113
Total 163 70.8 157 86.90 157.70

114
5.11 FISHERIES DEVELOPMENT
Fishery development is still in nascent stage in Aizawl district in
comparison with its neighboring district of Kolasib. Fish seed being the vital
input for development of fisheries, there is major set back to gather required
momentum towards fishery development. The total water spread area (WSA) in
departmental tanks is found to be only 5.5 ha as reported by the District
Fishery Officer, Aizawl. However, it does not include the private ponds and
community tanks, river and riverine sector.
STRATEGIES PROPOSED FOR IMPROVING FISH PRODUCTION
Items of packages Recommended
Practice
Existing
practice
Specific
problems (**)
Proposed
strategy (***)
Pond preparation
- Organic manures - Inorganic
manures - Bio-fertilizers
10,000 kg
cowdung/ha
200-400 kg/ha
6-8 kg
Small ponds
-
-
2
2
1,2
1,2,4
Feeding schedule
1:1 ratio of Rice
bran 2% oil cake
body wt. Green leaf
Partially
followed
1,2 1,2,4
Cultural practice Multispecies
culture
Monoculture 1,2 3,4
** Specific problems *** Farmer proposed extension strategies :
1. Lack of awareness 1. Awareness campaign
2. Lack of knowledge 2. Demonstration
3. Lack of convention 3. Training
4. Lack of finance 4. Exposure visits
5. Lack intensive 5. Linkage with banks

115
ORGANISATION CHART OF FISHERIES DEPARTMENT
Table 5.31 The interventions are suggested for promotion of fishery in the
district
Interventions
Unit cost in
(Rs.in
lakh)
2010-11 2011-12
Phy Fin Phy Fin Total
Development of fish breeding farm, Lamphel
(Deepening of ponds for an area of 2.5 ha.)
70 / farm
Development of F.F.D.A farm (Pond deepening
for 2.5 ha.)
50/farm
Development of fresh water aquaculture (FFDA
Scheme)
Avg Rs 3
lakh/ha
30ha 90.00 30ha 90 180.00
Development of integrated Fish Farming at two
units
Rs 0.20
lakh/ha
10Ha 2 2
Training of Fish Farmers for FFDA Scheme Rs 0.03
lakh /
terrace
100 3 100 3 6
Mobile Hypophysation Programme
Demonstration on Fish Culture
Development of Cage/Pen Culture
District Fishery Development Officer
Fishery Extension Officer (2 Nos.)
Assistant Fishery Officer (1 No.)
Fishery Demonstrator (3 Nos.)

116
Total 130 93 140 95 188
5.12 SERICULTURE IN AISAWL DISTRICT:
Importance of sericulture in development
The art of silk production is called sericulture that comprises cultivation
of mulberry, silkworm rearing and post cocoon activities leading to
production of silk yarn. Sericulture provides gainful employment,
economic development and improvement in the quality of life to the
people in rural area and therefore it plays an important role in anti
poverty programme and prevents migration of rural people to urban area
in search of employment. Hence several developing nations like China,
India, Brazil, Thailand, Vietnam, Indonesia, Egypt, Iran, Sri Lanka,
Philippines, Bangladesh, Nepal, Myanmar, Turkey, Papua New Guinea,
Mexico, Uzbekistan and some of the African and Latin American
countries have taken up sericulture to provide employment to the people
in rural area.
Multipurpose use of sericulture
Apart from silk, there are several other bye-products from sericulture.
The mulberry fruits are rich in minerals and vitamins and from the roots,
barks and mulberry leaves several ayurvedic and herbal medicines are
prepared. Some of the woody mulberry trees provide timber which are
resistant to termites and the timber is used for making sports items, toys
etc. The mulberry branches after silkworm feeding are generally dried
and used as fuel particularly in the villages. The foliage of mulberry is
used as a fodder for cattle. The mulberry trees are also planted in the
embarkment area for protection of the soil to prevent soil erosion, and
mulberry trees are planted as avenue trees. The silkworm pupae are rich
in oil content and pupal oil is used in cosmetic industry and the
remaining pupal cake is a rich source of protein suitable for poultry and

117
fisheries. In some tribal population, the people eat eri pupa as a source
of protein and nourishment. The silkworm litter is used for bio-gas
production and used as a fuel for cooking in the rural area. Thus
sericulture not only provides silk for fashionable clothings, it also
provides several very useful bye products to the human society.
Therefore, sericulture development provides opportunities to improve the
living standards of people in the rural area in developing countries.
Future demand for silk
The present global silk production is fluctuating around 70, 000 to 90,
000 M.T. and the demand for silk is annually increasing by 5%. With the
increase in population and also with the increased demand for
fashionable clothing items due to fast changing fashion designs in
developed countries, the demand for silk is bound to increase even more.
For increasing the silk production we require highly productive mulberry
varieties and silkworm races and also silkworm races tolerant to adverse
climatic conditions and diseases which can come mainly from the
sericultural germplasm resources and also from the wild relatives of
Bombyx available in the natural habitats.
Present status of silkworm germplasm at global level
Though accurate data are not available on the silkworm germplasm in
different countries of the world, an approximate information indicate that
there are 4310 silkworm germplasm accessions available in different
countries. There is every likelihood that some of these silkworm
accessions are duplicated; for instance the silkworm germplasm from
China, Japan, France, Russia and India might be represented in the
germplasm collection of other countries since these are the principal
source of sericultural germplasm and also several countries might have
exchanged some silkworm germplasm for silkworm breeding and hence a

118
proper documentation on the availability of silkworm germplasm in
different countries is very much required.
A very recent compilation of silkworm genetic stocks indicate that there
are around 3000 genotypes of Bombyx mori at the global level, which
includes mutants, parthenoclones, polyploids and geographical races
(Nagaraju et. al 2001). In fact much of the genetic diversity of Bombyx
mori is derived from the inbred lines of land races and elite stocks
evolved by the silkworm breeders and also from hybridisation of different
geographical races; mainly the Japanese, Chinese, European and tropical
races, which are distinct for several economic characters. The
geographical races also possess several heritable characters for a variety
of morphological, biochemical and quantitative characters. Among the
four geographical races, the bivoltine and univoltine races of temperate
origin and multivoltine races of tropical origin differ widely and exhibit
contrasting characters. The bivoltine and univoltine races produce high
quantity of good quality silk, whereas the multivoltine races are hardy,
tolerant to pathogen load and thereby resistant to diseases compared to
the bivoltines but produce low amount of poor quality silk. Thus, these
geographical races are very valuable genetic stocks for further
improvement of silkworm races and evolution of superior breeds of B.
mori.
Apart from a rich biodiversity of geographical races, there are also a large
number of mutants. The silkworm genetic stocks include more than 500
mutants for a variety of characters viz., serosal colours; larval and adult
integument colours; skin markings and body shapes; cocoon colours and
shapes; physiological traits such as diapause, number of larval moults
and timing of larval maturity; food habits and biochemical features such
as digestive amylase, blood and egg esterases, larval integument
esterase, alkaline and acid phosphatases; haemolymph proteins; silk

119
production and fibroin secretion; homeoproteins and body plan
determination etc. and the various mutants, gene locus and phenotype
were documented recently .
Apart from the geographical races and mutants there is a large genetic
stock of B.mori evolved by the breeders mostly utilising the geographical
races and mutants of larval, pupal and cocoon colour variants of sex
limited races, particularly in Peoples Republic of China, Japan, India and
erstwhile United Soviet Socialist Russia (USSR) and some of these breeds
are commercially exploited in these countries for silkworm rearing to
produce raw silk and the remaining breeds are maintained in the
silkworm germplasm of these countries as breeders genetic stocks and
they are utilised as the genetic material in the silkworm breeding
programmes for evolution of more superior and elite races.
Thus, the geographical races, mutants and the elite breeders stock
constitute the major portion of the present day silkworm germplasm at
the global level apart from the parthenoclones, triploid, polyploids and
wild relatives of Bombyx and Bombycidae
Importance of conservation of silkworm genetic resources
During the recent years, biodiversity conservation programmes have
drawn the attention of many countries including developing nations,
because of the genetic erosion due to indiscriminate use of bio resources
and damage to the environment, destruction of forest, human
interference in eco-system, upsetting the equilibrium of the biosphere.
Improvement in silkworm race heavily depended on the geographical
races of B. mori and the wild relatives of Bombyx were not explored,
unlike in agriculture. Whereas in agricultural, horticultural and
sericultural crop improvement programme the wild species of several

120
crop plants have contributed very valuable genes for resistance to
diseases and pests and tolerance to adverse agroclimatic conditions and
similar exploitation of genes from wild relatives of B.mori have not been
reported.
Biodiversity is the result of evolution that is a continuous phenomenon
induced by natural selection pressure and the population of organisms
evolve through adaptation to the biotic and abiotic stress. Ever since
B.mori was domesticated, the species does not survive in the wild state in
natural condition and also does not survive without human care and
hence natural selection induced genetic diversity in B.mori is rather very
limited to voltinism. Hence, it is very essential to conserve and utilise the
wild relatives of Bombyx mori to broaden its genetic diversity, apart from
the geographical races, mutants, sex-limited races, evolved breeds and
breeders genetic stocks. The wild relatives of Bombyx are very vulnerable
and the vulnerability at different spatial and temporal scales are not
known. The design of biodiversity network in sericulture involving the
complementarity of wild relatives and domesticated B. mori is also not
well established. Therefore, conservation of wild as well as domesticated
seribiodiversity resources is very essential for sustainable development of
sericulture (Fig-3) since loss of genetic resources of domesticated and
wild relatives of Bombyx species along with their unique genes may
disadvantage future generation.
5.13 SERICULTURE IN MIZORAM
Mizoram occupies an important position on account of its unique flora and
fauna. The climate here is congenial for the healthy growth and development

121
of sericulture industry, which covers mulberry, oak tassar, eri and muga
culture, the last three being commonly known as non-mulberry culture. Eri
culture is one of the most predominant sericulture in the region. The muga
culture is unique and confined particularly to the Brahmaputra Valley and
is not found in any other part of the world.
Silk culture or sericulture is the rearing of insect that produces silk yarn. It
is an extremely delicate work that requires patience throughout the entire
cycle of rearing silk moths from egg to cocoons. Silk, is acclaimed as the
queen of all the textiles, having all the desired qualities of textile, viz., fibre-
strength, elasticity, softness, coolness and affinity to dyes. Muga silk is
golden yellow in colour, which makes its very attractive. The world demand
for natural silk textiles is soaring. Traditional silk producing countries like
Japan, Korea, Brazil and Russia have drastically cut production due to
socio-economic reasons. India, taking advantage of the situation, has
launched a massive developmental Scheme on sericulture. The export of silk
has been registering a steady growth of 30% annually. The world silk
demand according to a survey conducted by the International Silk
Association (ISA) is steadily increasing due to the enhanced awareness
about natural fibres and preference for silk fibres. Silk fibres are mostly
woven on handlooms, which are quite popular in the domestic as well as
export markets.
5.14 Availability & Varieties of Sericulture:
Sericulture is not an organized commercial activity as is the case of
mulberry. It is prevalent mainly amongst the tribals in hill districts. The
lower Brahmaputra Valley is the traditional home of eri spinners and
weavers, producing bulk of eri yarn and fabric. The eri cocoons are utilized
locally. In MizoramMuga culture is a new introduction.

122
Table 5.32. Strategies proposed for improving production and
productivity in Sericulture
Items of packages
Existing practice
Recommended
Practice Problems diagnosed
Fr. Proposed extension
strategy
Sowing – planting
- Time - Method
April – May
Pit system
April – May
Pit system
-
-
Organic manure
No Application
10 tons - Lack of awareness
- Lack of finance
- Training & credit facility
Fertilizers (N:P:K)
No Application
220:80:80 - Lack of awareness
- Lack of finance
- Training & credit facility
Pest
- Leaf roller
Nuvan
Nuvan
- Lack of awareness
- Training & demonstration
Rearing method Tray rearing Tray rearing - -
Cocoon yield
30 kgs 80 kgs - Lack of awareness on General
management
- Training & demonstration

123
Table 5.33 Various interventions suggested for Sericulture
Development in the District are Presented (in lakhs)
Sl. No
Name of Activity
Unit Cost (in
lakhs)
2010-11 2011-12
Phy Fin Phy Fin Total
1 Rearing appliances 0.15 100 15.00 100 15.00 115.00
2 Assistance for Irrigation and
other water conservation 0.07 100 7.00 100 7.00 14.00
3 Crop Protection and
disinfecting materials 0.07 100 7.00 100 7.00 14.00
4 Capacity building 0.95 2 1.9 2 1.9 3.8
5 Administrative cost 2.00 2.00 4.00
Sub Total 13.79 91.9 95.9 187.8
1 Mulberry Plantation with start
up tools 0.15 100 15.00 150 22.5 37.50
2 Cost of Rearing House 0.4 100 40.00 150 60.00 100.00
3 Assistant for strengthening of
Mulberry Farm cum Grainage 10 1 10.00 10.00
4 Establishment of Cocoon
godown 5 1 5.00 5.00
5 Rearing appliances 0.15 100 15.00 150 22.5 37.50
6 Assistance for Irrigation and
other water conservation 0.07 100 7.00 150 10.5 17.05
7 Crop Protection and
disinfecting materials 0.07 100 7.00 150 10.5 17.05
8 Construction of Chawki
Rearing Centre 3.5 1 3.5 1 3.5 7.00
9 Capacity Building 0.95 2 1.9 2 2.85 4.75
10 Administrative cost 20.29 3.00 3.00 6.00
Sub Total 92.4 92.4 150.35 242.75
5.15 SOIL AND WATER CONSERVATION
Due to high rainfall area and topographical extremities, the land is
exposed to prone to heavy erosion and landslides causing loss of top
soils. Water is lost due to deep percolation and runoff causing moisture
stress for crop production particularly in winter season. Activities like

124
water harvesting, contour trenching, terracing, gully plugging,
aforestation etc. assume importance.
Surface runoff and resulting soil erosion are the principal means
by which fertilizers, sediment, and pesticide residues reach surface
waters. Infiltration of ponded runoff through permeable soils can move
nitrogen and pesticide residues into ground water. Controlling water flow
through and out of your vineyard will greatly reduce transport of
contaminants off site, and will preserve your vineyard‟s productivity.
Three proven methods of reducing runoff and erosion are to divert excess
water around your vineyard, slow runoff out of your vineyard, and
provide ground covers that break the force of raindrops before they reach
the soil. Soil erosion involves movement of soil particles from one area to
another. In arid areas, disturbed soil is often moved by wind. In our
region, however, water movement is the prime force behind soil erosion.
Soil engineers recognize two types of soil erosion. Gully erosion involves
the mass movement of soil from an area of concentrated flow, often
following heavy rainfall. Gullies expand rapidly and are highly visible.
Sheet and rill erosion, as the name implies, involves more subtle loss of
soil across an entire area. It is more constant, but harder to spot, since it
involves movement of an imperceptibly small layer of soil. Runoff and soil
erosion impacts surface water quality directly through deposition of
sediments in waterways, streams, lakes and estuaries. It is also the
principal means by which fertilizers and pesticides (particularly
herbicides)applied to a vineyard move offsite, as they are often attached
to soil particles. Soil erosion also limits the productivity of vineyards. In
almost any older vineyard in New York, one can find eroded knolls where
subsoil layers are exposed, and swales or depressions with deep deposits
of sediment. Much of this erosion can be traced to clean tillage and
frequent disking practiced in Finger Lakes and Lake Erie hillside
vineyards from the mid-1800s through the early 80s, and more recently

125
on Long Island. This soil movement complicates vineyard management
and leads to more variability in vine size and performance. On Long
Island, runoff accumulates in low areas of vineyards, where it can slowly
infiltrate into groundwater.
For these reasons, soil conservation practices that control water
movement both into and out of vineyards, and limit the force of rainfall
hitting the soil are the best means for maintaining sustainable
production and avoiding offsite movement of pesticides and fertilizers.
Understanding Erosion. Topography, soil characteristics, rainfall, and
ground cover determine the annual rate of soil erosion. Soil conservation
professionals use a tool called the Revised Universal Soil Loss Equation
(RUSLE) to estimate annual rates of soil erosion on a particular site. This
equation predicts an annual rate of soil loss (A) based on several factors
that influence erosion. These factors are:
Rainfall. The amount and intensity of rainfall in a given climate
influences the amount of runoff and leaching.
Soil type. Soils differ in their „erosivity‟ or „erodability‟ based on
composition, soil particle sizes, and reaction to freeze/thaw cycles.
Slope Length. The longer a slope is, the more area it drains and the
more water it carries.
Slope steepness. Water runs faster and with more force down
steeper slopes than down shallow slopes.
Crop Factor. The type and sequence of crops grown affects erosion.
For example, continuous corn would be more prone to soil loss
than corn planted in rotation with alfalfa and small grains.
Perennial crops like grapes with less frequent tillage and soil

126
disturbance would have a lower crop factor than annually seeded
crops.
Management Factor. This factor is used to account for different
management practices. For example, „notill‟ corn, where crop
residues are left on the surface would reduce erosion compared
with corn grown with clean tillage. Similarly, a vineyard with row
middles disked four times annually would be more prone to
erosion than one with permanent cover or straw mulch in row
middles. Soil conservation professionals use this as a planning tool
to determine how different management practices or structures
would affect the annual soil loss. For example, installing diversions
or terraces would reduce erosion by reducing the effective slope
length. The general goal is to reduce the annual estimated soil
erosion (A) to less than the annual replacement or soil formation
rate, generally between 3 to 5 tons per acre per year. If that sounds
like a lot, consider that an acrefoot of soil weighs about 2 million
pounds, and that 5 T/acre/year would amount to a layer about
0.03 inches thick. Soil Conservation Practices Soil conservation
practices prevent erosion and maintain clean water in three ways.
First, diversion of water around vineyards keeps water clean,
because it doesn‟t wash over disturbed soil in the first place.
Filtering of water through soil (drainage systems) and ground cov-
ers removes soil particles and other material suspended in water
that passes through vineyards. Finally, ground covers provide a
protective barrier that breaks the force of raindrops that could
otherwise dislodge soil particles. Key soil conservation practices
used in vineyards are:
Diversion Ditches. Diversion ditches are soil structures constructed
at intervals across the slope. They collect water from slopes and

127
divert it into natural drainage ways. They are seeded and gently
graded, and slow the water down to reduce its erosive force. They
can reduce the amount of water running through a vineyard by up
to 80%.
Water and Sediment Control Basins. Raising a berm across a gully
with a subsurface outlet pipe that discharges at the base of the
slope will collect runoff, and stop erosion by slowing down water
and collecting the sediment.
Buffer Strips. All vineyards require headlands and grassed areas
around their perimeters to allow machinery to turn around. These
grassed areas also protect natural drainage ways by filtering
surface water that leaves vineyards before it gets to streams,
drainage ways and depressions. Generally, about 40 feet of
headland around vineyards is adequate for a buffer strip.
Drainage Tile. Subsurface drainage tile, commonly used in area
vineyards, also helps protect water quality in two ways. Drainage
tile reduces surface runoff that would otherwise occur when soils
become saturated with water. It also allows water to be filtered
through the soil, which removes many contaminants that would be
present in surface runoff.
Vineyard Layout. Planting vineyards so that the rows run across
the slope rather than up and down the slope can reduce erosion by
up to 50 percent. This practice is common, because most slopes
surrounding the Finger Lakes face east or west. Planting across the
slope allows vineyard rows to be oriented north and south, which
allows for maximum sunlight interception as well as soil
conservation.

128
Table 5.34 ABSTRACT OF WORK PLAN UNDER RKVY SCHEME
SOIL TREATMENT (Soil Department)
Type of
Soil
Area in
Ha.
Area
Affected
Area in Ha.
Treatment
required
Strat
egy 2010-
11
2011-
12
Acidity Soil 10,000 10,000 10,000 Limin
g
22.50 22.50
Loamy Soil 9,000 9,000 7,000 Affore
statio
n
50.00 50.00
Total 19,000 19,000 17,000 - 72.50 72.50
Table 5.35 Soil & moisture Conservation Activities
Sl. No.
Type of Activities
Area in Ha.
Unit Cost
No. of Units
Financial Requirement
Amount (in lakhs)
1. Terrace Farming 840 0.24 - 201.60
2. Contour Bunding 500 0.24 - 120.00
3. Channelling - - - -
4. Social Forestry 8,000 0.065 - 520.00
5. Check Wall Construction
- 0.20 1,500 300.00
6. Rubber Nursery - 3.00 50 Nos. 150.00
7. Coffee Nursery - 1.50 50 Nos. 75.00
8. Rubber Plantation
500 1.00 - 500.00
9. Coffee Plantation 300 1.00 - 300.00
10. Ground Water Charging
650 0.60 - 390.00
TOTAL : 2,556.60

129
Table 5.36 Water Conservation
Sl.
No.
Type of Activity Nos. of
Units
Unit Cost Financial
Requirement
Amount (in lakhs)
1. Farm Ponds 3,000 1.00 3,000.00
2. Check Dam 150 1.00 150.00
3. Feeder Channel - - -
4. Canal 25,000
R/M
0.0015
R/M
37.50
5. Water Storage 2,000 1.00 3,000.00
TOTAL 6,187.50
Table 5.37 Physical and Financial Requirements and Proposed
Strategies for Soil Treatment (Rupees in lakhs)
Type of
Soil
Unit Cost
2010-2011 2011-2012
Phy.
Ha.
Fin. Phy. Ha. Fin. Total
1 2 3 4 5 6
Acidity Soil 1500 per Ha. 1500 22.50 1500 22.50 45.00
Loamy Soil 5000 per Ha. 1000 50.00 1000 50.00 100.00
TOTAL 2500 72.50 2500 72.50 145.00

130
Table 5.38. PROPOSAL FOR IMPLEMENTATION OF SOIL & MOISTURE CONSERVATION ( Rupees in lakh)
Sl. No.
Type of Activities
Unit Cos
t per Ha./Nos.
Y E A R – W I S E T A R G E T
2010-2011 2011-2012 2016-2017
TOTAL
8. Rubber Plantartion.
1.00 72 72.00 72 72.00 500.00
9. Coffee plantation.
1.00 44 44.00 44 44.00 300.00
10. Ground Water Charging
0.60 93 56.00 93 56.00 390.00
TOTAL 2,556.60

131
Table 5.39 PROPOSAL FOR IMPLEMENTATION OF WATER CONSERVATION
ACTIVITIES (Rupees in Lakhs)
Sl
.
N
o.
Type of
Activiti
es
Unit
Cost
per
Ha./Nos
.
2010-2011 2011-2012
Phy.
(Ha.)
Fin. Phy.
(Ha.)
Fin. Total
1 2 3 4 5 6 7
1. Farm
Ponds
1.00 430 430.00 430 430.00 860.00
2. Check
Dam
1.00 22 22.00 22 22.00 44.00
3. Feeder
Channe
l
- - - - -
4. Canal 0.0015
R/M
- - 417
R/M
6.25 6.25
5. Water
Storage
.
1.00 430 430.00 430 430.00 860.00
TOTAL: 882 882 1299 1340.
25
1770.25

132
Table 5.40 PROPOSAL FOR IMPLEMENTATION OF SOIL & WATER
CONSERVATION (Rupees in Lakhs)
Sl.
No
Capacity
Building
2010-2011 2011-2012
Phy. Fin. Phy. Fin. Tota
l
1 2 5 6 7 8
1. Training of the
Farmer
LS 35 LS 35 LS 70
2. Office expense LS 20 LS 25 LS 45
3. Machinery and
equipment
LS 20 LS 20 LS 40
4. Contingency LS 10 LS 10 LS 20
5. TA and DA LS 15 LS 10 LS 25
GRAND TOTAL 100 100 200

133
CHAPTER 6 DISTRICT PLAN
The economy of the district is largely dependent on agriculture and
its allied sector. The district has diverse topography and favorable
climate to support this enterprise even to a commercial level for some
crops. Paddy is a major crop grown in the district, which is also a staple
food of the local people but the production is still not sufficient to
support the growing population mainly due to large practice of
unsustainable farming system.
6.1 Proposed Strategy for Agriculture – Physical and Financial
targets for the XI Plan
Sl. No
Proposed Strategy
Activities Unit cost
in Rs
2010-11 2011-12
Ph
y Fin Phy Fin Total
1
Enhancing seed replacement rate
Production incentive for HYV paddy seeds
- - - - - -
Distribution of certified seeds of paddy 1500/qt
50 0.75 75 1.125 1.875
Distribution of certified pulse seeds 4500/qt
80 3.60 95 4.275 7.875
Prodn. incentives for certified pulse seeds
- - - - - -
Distribution of certyified oilseeds 3000/qt
30 0.90 40 1.20 2.1
2
Transfer of
technology through crop demonstration
Mixed cropping demonstration with Maize 5000/ha 15 0.75 25 1.25 2.0
Intercropping demonstration of Arhar based crops 5000/ha 5 0.25 5 0.25 0.5
Intercropping
demonstration of Maize based crop 5000/ha 10 0.50 15 0.75 1.25
Demonstration of oilseeds 5000/ha 15 0.75 15 0.75 1.50
Demonstration on pulse 4000/ha 10 0.40 15 0.60 1.00
SRI method of paddy demonstration 7500/ha
15 1.125 15 1.125 2.25
Hybrid rice demonstration 3000/ha 10 0.30 10 0.30 0.9
Farmers Field School 17,000/No 20 3.40 25 4.25 7.65

134
(rice, sugarcane, pulses, oilseeds)
Varietals demonstration on pulses 5000/ha
10 0.50 10 0.50 1.00
Varietals demonstration on Oil seeds 5000/ha
5 0.25 5 0.25 0.50
Varietals demonstration on Maize 5000/ha
10 0.50 10 0.50 1.00
Promotion SRI Village - - - - -
3
Integrated Nutrient Management
(FFS)
INM demonstration in rice 17,000/ha 20 3.40 25 4.25 7.65
INM demonstration on sugarcane 17,000/ha
10 1.70 15 2.55 4.25
INM demonstration on Oilseed 17,000/ha
6 1.02 8 1.36 2.38
Supply of micro-nutrients 1000/ha 20 0.20 25 0.25 0.45
Liming of acid soils 1,000/ha
100
1.00 130 1.30 2.30
4
Integrated Pest management (FFS)
IPM demonstrations on rice 17,000/ha
16 2.72 16 2.72 5.44
IPM demonstrations on Rabi Oilseeeds 17,000/ha
25 4.25 25 4.25 8.50
IPM demonstrations on Rabi Pulse 17,000/ha
20 3.40 25 4.25 7.65
IPM demonstrations on Kharif Pulse 17,000/ha
20 3.40 25 4.25 7.65
IPM demonstrations on Kharif Oilseeeds 17,000/ha
10 1.70 10 1.70 3.40
IPM demonstrations on Sugarcane 17,000/ha
5 0.85 10 1.70 2.55
IPM demonstrations on Maize 17,000/ha
20 3.40 30 5.10 8.50
Supply of bio-pesticides for rice, pulse and Oilseeds 1,000
100 1.00 200 2.00 3.00
5 Promotion of Organic Farming
Establishment of Vermi - hatchery at Block Level
1,50,000/unit
6
9.00
12
18.00
27.00
Demonstration on compost pit
15,000/unit
12 1.80 12 1.80 3.60
Establishment of Vermi-
compost units
15,000/uni
t
12 1.80 12 1.80 3.60
6 Farm Mechanisation
Subsidized sale of power tillers@ 50%
5,62,500/No
5 28.125 5 28.125 56.25
Subsidy on rotavator @ 50%
25,000/No 20 5.00 20 5.00 10.00
Subsidised sale of power thresher @ 50%
24,000/No 10 2.40 10 2.40 4.80
Subsidised sale of post hole digger @ 50%
25,000/No - - - - -
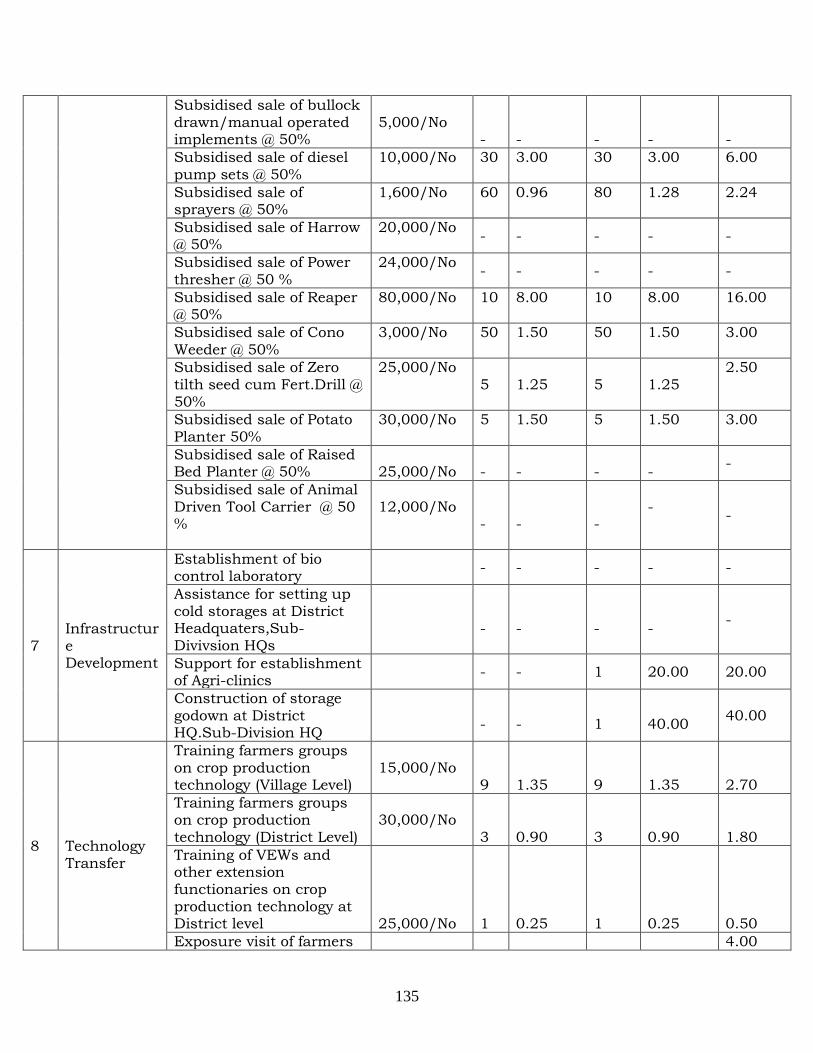
135
Subsidised sale of bullock drawn/manual operated implements @ 50%
5,000/No
- - - - -
Subsidised sale of diesel pump sets @ 50%
10,000/No 30 3.00 30 3.00 6.00
Subsidised sale of sprayers @ 50%
1,600/No 60 0.96 80 1.28 2.24
Subsidised sale of Harrow @ 50%
20,000/No - - - - -
Subsidised sale of Power thresher @ 50 %
24,000/No - - - - -
Subsidised sale of Reaper @ 50%
80,000/No 10 8.00 10 8.00 16.00
Subsidised sale of Cono
Weeder @ 50%
3,000/No 50 1.50 50 1.50 3.00
Subsidised sale of Zero tilth seed cum Fert.Drill @ 50%
25,000/No 5
1.25
5
1.25
2.50
Subsidised sale of Potato Planter 50%
30,000/No 5 1.50 5 1.50 3.00
Subsidised sale of Raised Bed Planter @ 50%
25,000/No
-
-
-
-
-
Subsidised sale of Animal Driven Tool Carrier @ 50 %
12,000/No
- -
-
-
-
7 Infrastructure Development
Establishment of bio control laboratory
- - - - -
Assistance for setting up cold storages at District Headquaters,Sub-Divivsion HQs
- -
-
-
-
Support for establishment of Agri-clinics
- - 1 20.00 20.00
Construction of storage godown at District HQ.Sub-Division HQ
-
-
1
40.00
40.00
8 Technology Transfer
Training farmers groups on crop production technology (Village Level)
15,000/No
9 1.35 9 1.35 2.70
Training farmers groups on crop production technology (District Level)
30,000/No
3 0.90 3 0.90 1.80
Training of VEWs and other extension functionaries on crop production technology at District level
25,000/No 1 0.25 1 0.25 0.50
Exposure visit of farmers 4.00

136
within the state for 40 farmers
1,00,000/No
2 2.00 2 2.00
Exposure visit of farmers outside the state for 20 Farmers
2,00,000/No 1 2.00 1 2.00 4.00
Conducting field trials on Rabi/ Kharif
100000/No 2 2.00 2 2.00 4.00
Training of farmers (Village Level) for 50farmers 10,000/No 9 0.90 15 1.50 2.40
Training of farmers(District/State Level) for 30 farmers 20,000/No 2 0.40 3 0.60 1.40
New crop varieties / new practices - - - - - -
9
Support to State Seed farm (Seed Production Farm)
Procurement of farm inputs LS LS 3.50 LS 6.00 9.50
Machinery and equipment LS LS 5.00 LS 5.00 10.00
Development of Farm Infrastructure LS LS 2.00 LS 2.00 4.00
10 Innovative Programme
Model Organic Farming LS - - - - -
District Level Exhibition Show(Rabi/Kharif)
5,00,000/No
2 10.00 2 10.00 20.00
Assistance for boring of tube well
24,000/No 10 2.40 15 3.60 6.00
Total 32 139.05 1209 223.66 363.41
6.2 Horticultural Development
The North Eastern hill region including Mizoram is considered to
be the rich reservoir of genetic variability of large number of horticultural
crops. The enormous diversity makes the state a gene pool for the

137
varietal improvement, but in spite of the potentiality, there is not much
visible development in the field of horticulture is going on. Although, the
state is rich with respect to natural resources viz. land, water and
biodiversity but their over exploitation and extraction with poor
replenishment has become a point of concern for their sustainability and
future availability with serious impact on soil health and biodiversity. In
addition to natural hazards, the large scale interference due to
traditional system of shifting cultivation and increased population
pressure has enhanced the process of degradation and desertification to
the great extent. Mizoram has unique diversity of agro-climatic condition,
altitudinal variation and well distributed rainfall, which is highly
conducive for cultivation of wide range of horticultural crops covering
fruits, vegetables, plantation crops, flowers, aromatic and medicinal
plants.
Proposed Strategy for Horticultural Development
Proposed Strategy
Activities Unit Cost in Rs. In
Lakh
2010-11 2011-12
Phy Fin Phy Fin Total
Fruit Development
M. Orange 0.225 /Ha
60 13.50 65 14.625 28.125
Banana 0.151 / Ha
40 6.00 45 6.75 12.75
Papaya 0.151 / Ha
40 6.00 45 6.75 12.75
Pineapple 0.15 / Ha
45 6.75 45 6.75 13.50
Citrus Rejuvenation
0.15 / Ha
80 12.00 85 12.75 24.75
Overhead
charge
3.19 3.47 6.66
Grape 0.15 / Ha
40 6.00 45 6.75 12.75
Avocado 0.15 / Ha
40 6.00 45 6.75 12.75
Mango 0.15 / Ha
50 7.50 55 8.25 15.75
TOTAL 395 66.94 430 72.84 139.78

138
Vegetable Development
Chayote (Squash)
0.13 / Ha
40 5.20 40 5.20 10.40
Cabbage 0.13 / Ha
50 6.50 55 7.15 13.65
Tomato 0.13 / Ha
45 5.85 45 5.85 11.7
Broccoli 0.13 / Ha
40 5.20 50 6.50 11.7
Bhindi 0.13 / Ha
50 6.50 55 7.15 13.65
Bitter gourd
0.13 / Ha
50 6.50 55 7.15 13.65
Brinjal 0.13 / Ha
60 7.80 65 8.45 16.25
Carrot 0.13 / Ha
50 6.50 55 7.15 13.65
TOTAL 385 50.05 420 54.60 104.65
Plantation Crop Development
Coconut 0.20/Ha 50 10.00 60 12.00 22.00
Areca nut 0.15/Ha 60 9.00 70 10.50 19.50
TOTAL 110 19.00 130 22.50 41.50
Spices Development
a) Bird‟s Eye Chillies
0.13/Ha 60 7.80 65 8.45 16.25
b) Turmeric
0.13/Ha 70 9.10 75 9.75 18.85
c) Ginger 0.13/Ha 80 10.40 90 11.70 22.10
TOTAL 210 27.30 230 29.90 57.20
Promotion of Nursery
Model Nursery in Public Sector
20.00/no
4 80.00 4 18.00 98.00
Model Nursery in Private Sector
10.00 /no
15 150.00 10 100.00 250.00
Small Nursery in Private Sector (No)
5.00 / no
20 100.0 20 100.0 200.00
Establishment of New Garden
Banana (ha) Sucker
1st Year Maintained of Banana
Floriculture Rose – (Small & Marginal
2.00 / unit
30 60.00 35 70.10 130.10

139
farmer (Ha)
Incentives to Floriculture Garden (No)
0.50 / unit
30 15.00 35 17.50 32.50
Seed Infrastructure
Vegetable seed Production
10.00/unit
2 20.00 2 20.00 40.00
Integrated Nutrient Management / Integrated Pest Management
A. Fruits IPM on Banana cultivation
0.0.25 200 5.00 300 7.50 12.50
INM on Pineapple
0.05 250 12.50 250 12.50 25.00
INM on Yongchak
0.10 150 15.00 150 15.00 30.00
INM on Passion Fruits
0.10 300 30.00 350 35.00 65.00
IPM on Lime / Lemon
0.025 250 6.25 300 75.00 81.25
B. Vegetables Kharif
IPM on French Bean
0.025 200 5.00 250 6.25 11.25
INM on Bhindi
0.05 200 10.00 250 12.50 22.50
INM on Brinjal
0.05 150 7.50 200 10.00 17.50
IPM on Cucurbit
0.025 300 7.50 350 8.75 16.25
INM on Ginger / Turmeric
0.10 450 45.60 500 50.00 95.60
INM on Chillies
0.05 500 25.00 600 30.00 55.00
C. Vegetables Rabi
IPM on Pea 0.05 200 10.00 250 12.50 22.50
IPM on Cabbage
0.05 300 15.00 350 17.50 32.50

140
INM on Cauliflower
0.05 100 5.00 120 6.00 11.00
INM on Potato
0.10 150 15.00 150 15.00 30.00
INM on Radish
0.05 150 7.50 200 10.00 17.50
INM on Knolkhol
0.05 200 10.00 250 12.50 22.50
INM on Tomato
0.05 150 7.50 150 7.50 15.00
Protected Cultivation
Green House (SF & MF)
0.25/no 40 10.00 50 12.50 22.50
Green
House (Other farmer)(Hi Tech)
10.00/n
o
10 100.00 15 150.00 250.00
Shade net Sq m
0.00020 70 14.00 80 16.00 30.00
Mulching (Ha)
0.08/Ha 70 5.60 80 6.40 12.00
Promotion and Popularization of Organic farming
Construction of compost pit
0.10/no 250 25.00 300 30.00 55.00
Establishment of Vermi- Composts units-Big (No)
2.50/unit
30 75.00 35 87.50 162.50
Establishment of Vermi- Compost units-Big (no)
Demonstration of
Organic Farming
0.25/no 20 5.00 25 6.25 11.25
Popularization on of organic Fertilizers
Demonstration on use of Rich Reuter “AA”
0.20/unit
30 6.00 35 7.00 13.00
Rich Field 0.20/un 30 6.00 35 7.00 13.00

141
Fertilizer (13:40:13)
it
Rich Field Fertilizer (19:19:19)
0.20/unit
30 6.00 35 7.00 13.00
Rich Field Fertilizer (13:0:0)
0.20/unit
30 6.00 35 7.00 13.00
Watershed Watershed Development
50.00/no
5 250.00 6 300.00 550.00
Human Resource Development
Training of VEWs and other extension functionaries on crop production technology at District Level.
0.25/no 6 1.50 8 2.00 3.50
Exposure visit outside the State on IPM / INM, Plantation, Plant Health Management
1.50/no 5 7.50 5 7.50 15.00
Exposure visit inside the state
1.00/no 6 6.00 6 6.00 12.00
Training of Entrepreneurs
0.25/no 7 1.75 8 2.00 3.75
Exposure Visits of Farmers inside the State
1.00/no 5 5.00 5 5.00 10.00
Creation of Water Resources
Construction of community Tanks
2.00/no 70 140.0 80 160.0 300.00

142
Farm Mechanization
Subsidized sale of power tillers
1.00/no 15 15.00 20 20.00 50.00
Subsidized sale of pump sets @ 50%
0.25/no 20 5.00 30 7.50 12.50
Subsidized sale of sprayers @ 50 %
0.075/no
200 15.00 250 18.75 33.75
Post harvest Infrastructure
Development
Assistance for setting
up cold storages at Block Level
20.00/unit
4 80.00 80.00
Construction of storage of godown at Block Headquarters
5.00/no 5 25.00 5 25.00 50.00
Establishment of Marketing Infrastructure
Functional Infrastructure for Collection & grading (no)
5.00/no 5 25.00 5 25.00 50.00
Technology transfer
Training of farmer groups on crop production technology
0.25/no 5 1.25 5 1.25 2.50
Training of farmers on the use of Organic Fertilizers
0.25/no 5 1.25 5 1.25 2.50
Training of farmers on INM
0.25/no 6 1.50 6 1.50 3.00
Training of Farmers on IPM
0.25/no 5 1.25 5 1.25 2.50
Training of Farmers
0.25/no 5 1.25 5 1.25 2.50

143
on Post Harvest Technology on important horticultural crops
Exposure visit of farmers within the state
0.50/no 3 1.50 3 1.50 3.00
Exposure
visit of farmers outside the state
1.50/no 3 4.50 3 4.50 9.00
Conducting field trials in new crop varieties / new practices
0.25/no 5 1.25 5 1.25 2.50
Innovative Low Cost Potato Storage
10.00/no
5 50.00 5 50.00 100.00
Programme Structure
District Level Show
2.00/no 2 4.00 2 4.00 8.00
Project Area Connectivity
Horticulture Link Road
3.00/Km
15 45.00 15 45.00 90.00
Capacity Building
(a) Training of Trainers at(Research institution)
1.00/no 4 4.00 4 4.00 8.00
(b) Awareness Campaign/Seminar/Workshop etc.
5.00 5.00 10.00
Infrastructure Technical Support
4.50 4.50 90.00
Mushroom Spawn 20.00/u 1 20.00 20.00

144
Development Unit
Production nit
Model Horticulture Centre
Research & Development in Horticulture Crops
50.00/no
1 50.00 1 50.00 100.00
Total 6419 1824.24
6.3 Animal Husbandry & Veterinary
The district poses a challenge in animal husbandry, but restrains
like protectionism policies of the state or the country handicaps the true
want towards animal husbandry. Good governance, sustainable
development in conjunction with environmental friendly methods is
perhaps the only practical answer in order to correct the issues at hand.
Scientific methods improving the products of animals i.e. use of
biotechnology may perhaps be helpful but unfortunately will not increase
productivity so as to claim animal husbandry as part of our GDP. On the
other hand challenges are met and yes, the future holds a promise in all
fields as long as we put our heads together and pave the green fields.
There is increasing demand of milk and meat products in the district.
Rearing piggery and poultry are popular mainly for meat production and
egg production. People are showing interest in cattle rearing and dairy
farming in few pockets of the district. Milk production in co-operative
basis also gaining popularity.

145
Proposed Strategy for Animal Husbandry & Veterinary
Sl.
No
Interventions Unit cost Rs.
2010-11 2011-12
1 Animal Health Phy Fin Phy Fin Total
i) Distribution of Vety. Aid
Kids
50000/ training 4 nos 2.00 4 2.00 4.00
ii) Cosnt. Of vety. Disp. 20
lakhs/dispensary
1 20.00 1 20.00 40.00
Cattle and Buffalo Dev.
Milk cow induction
cow/heifer expected give 10
lit. of milk per day
Rs 40,000/ cow 10
Cows
4.00 10
Cows
4.00 8.00
2 Piggery development
Distribution of 5 piglets
(4female +1 male) of age
group 3-4 month.
Rs 3000/Piglet 20
piglet
0.60 20
piglet
0.60 1.20
3 Poultry Development
Backyard Poultry scheme
Distribution of 40 grown up
low input technology birds
Rs.350/Bird ie
Rs 1400/unit
30 Unit 4.20 30 4.20 8.40
Construction of Chick
rearing unit with
procurement of poultry
appliance in the district
Head Office
Rs 25 lakhs /
unit
1 25.00 25.00
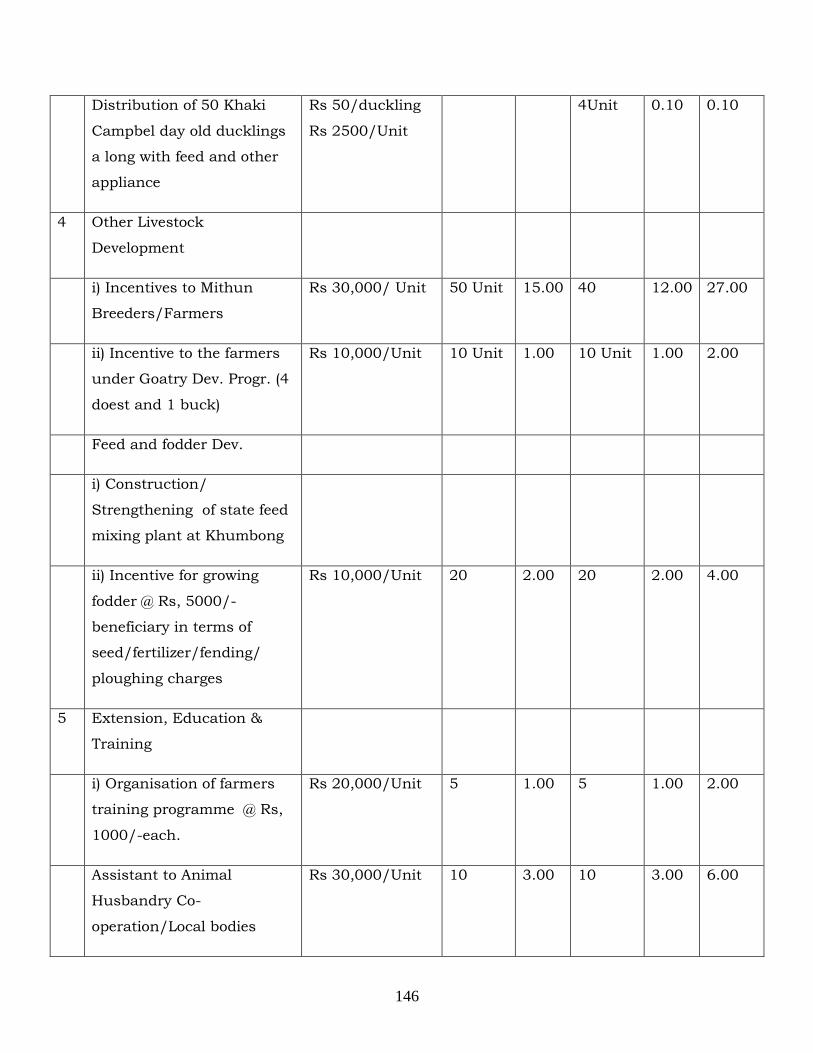
146
Distribution of 50 Khaki
Campbel day old ducklings
a long with feed and other
appliance
Rs 50/duckling
Rs 2500/Unit
4Unit 0.10 0.10
4 Other Livestock
Development
i) Incentives to Mithun
Breeders/Farmers
Rs 30,000/ Unit 50 Unit 15.00 40 12.00 27.00
ii) Incentive to the farmers
under Goatry Dev. Progr. (4
doest and 1 buck)
Rs 10,000/Unit 10 Unit 1.00 10 Unit 1.00 2.00
Feed and fodder Dev.
i) Construction/
Strengthening of state feed
mixing plant at Khumbong
ii) Incentive for growing
fodder @ Rs, 5000/-
beneficiary in terms of
seed/fertilizer/fending/
ploughing charges
Rs 10,000/Unit 20 2.00 20 2.00 4.00
5 Extension, Education &
Training
i) Organisation of farmers
training programme @ Rs,
1000/-each.
Rs 20,000/Unit 5 1.00 5 1.00 2.00
Assistant to Animal
Husbandry Co-
operation/Local bodies
Rs 30,000/Unit 10 3.00 10 3.00 6.00

147
Construction of meat
marketing shed at the
District Head Qtr. Block
Head quarters.
Rs 6 Lakh/Shed 3 18.00 2 12.00 30.00
Total 163 70.8 157 86.9 157.7
6.4 Fishery in the district
Fishery development is still in nascent stage in Aizawl district in
comparison with its neighboring district of Kolasib. Fish seed being the vital
input for development of fisheries, there is major set back to gather required
momentum towards fishery development. The total water spread area (WSA) in
departmental tanks is found to be only 5.5 ha as reported by the District
Fishery Officer, Aizawl. However, it does not include the private ponds and
community tanks, river and riverine sector.
The interventions are suggested for promotion of fishery in the
district
Interventions
Unit cost in
(Rs.in lakh) 2010-11 2011-12
Phy Fin Phy Fin Total
Development of fish breeding farm,
Lamphel (Deepening of ponds for an
area of 2.5 ha.)
70 / farm
Development of F.F.D.A farm (Pond
deepening for 2.5 ha.)
50/farm
Development of fresh water Avg Rs 3 lakh/ha 30ha 90.00 30ha 90 180.00

148
aquaculture (FFDA Scheme)
Development of integrated Fish
Farming at two units
Rs 0.20 lakh/ha 10Ha 2 2
Training of Fish Farmers for FFDA
Scheme
Rs 0.03 lakh / terrace 100 3 100 3 6
Mobile Hypophysation Programme
Demonstration on Fish Culture
Development of Cage/Pen Culture
Total 130 93 140 95 188.00
6.5 Sericulture Development
The climate here is congenial for the healthy growth and development of
sericulture industry, which covers mulberry, oak tassar, eri and muga
culture, the last three being commonly known as non-mulberry culture.
Eri culture is one of the most predominant sericulture in the region. The
art of silk production is called sericulture that comprises cultivation of
mulberry, silkworm rearing and post cocoon activities leading to
production of silk yarn. Sericulture provides gainful employment,
economic development and improvement in the quality of life to the
people in rural area and therefore it plays an important role in anti
poverty programme and prevents migration of rural people to urban area
in search of employment.
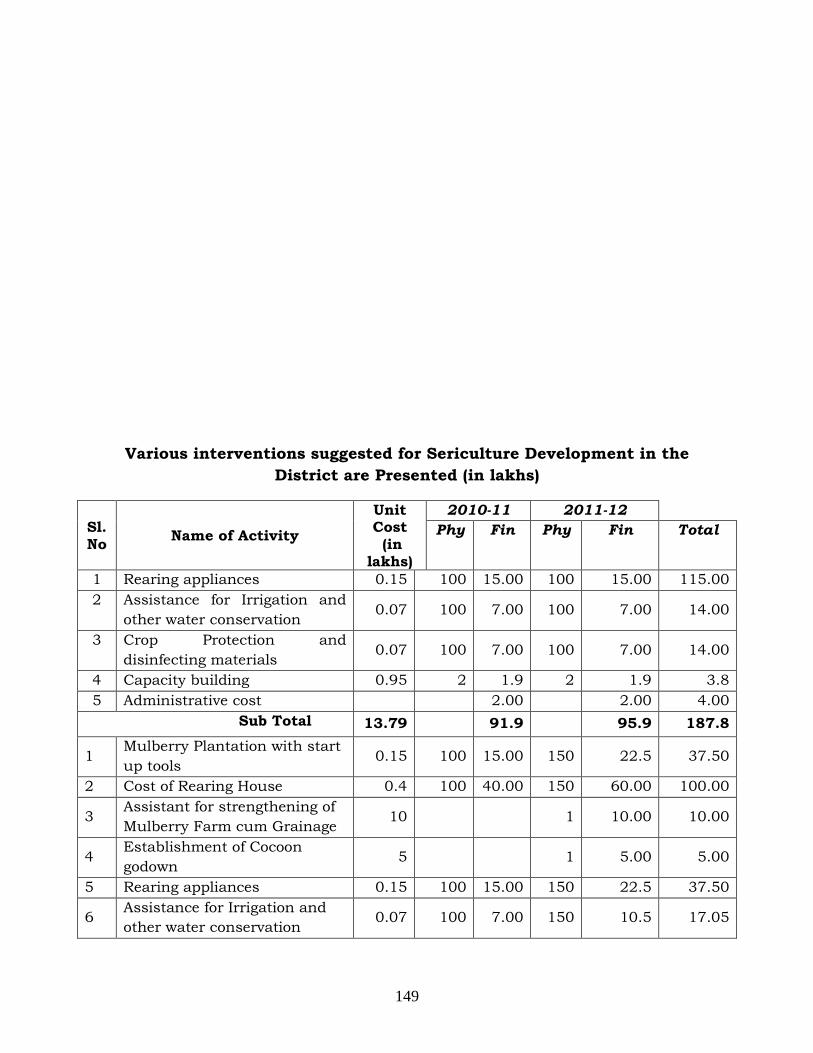
149
Various interventions suggested for Sericulture Development in the
District are Presented (in lakhs)
Sl. No
Name of Activity
Unit Cost (in
lakhs)
2010-11 2011-12
Phy Fin Phy Fin Total
1 Rearing appliances 0.15 100 15.00 100 15.00 115.00
2 Assistance for Irrigation and
other water conservation 0.07 100 7.00 100 7.00 14.00
3 Crop Protection and
disinfecting materials 0.07 100 7.00 100 7.00 14.00
4 Capacity building 0.95 2 1.9 2 1.9 3.8
5 Administrative cost 2.00 2.00 4.00
Sub Total 13.79 91.9 95.9 187.8
1 Mulberry Plantation with start
up tools 0.15 100 15.00 150 22.5 37.50
2 Cost of Rearing House 0.4 100 40.00 150 60.00 100.00
3 Assistant for strengthening of
Mulberry Farm cum Grainage 10 1 10.00 10.00
4 Establishment of Cocoon
godown 5 1 5.00 5.00
5 Rearing appliances 0.15 100 15.00 150 22.5 37.50
6 Assistance for Irrigation and
other water conservation 0.07 100 7.00 150 10.5 17.05

150
7 Crop Protection and
disinfecting materials 0.07 100 7.00 150 10.5 17.05
8 Construction of Chawki
Rearing Centre 3.5 1 3.5 1 3.5 7.00
9 Capacity Building 0.95 2 1.9 2 2.85 4.75
10 Administrative cost 20.29 3.00 3.00 6.00
Sub Total 92.4 92.4 150.35 242.75
6.6 SOIL AND WATER CONSERVATION
Due to high rainfall area and topographical extremities, the land is
exposed to prone to heavy erosion and landslides causing loss of top
soils. Water is lost due to deep percolation and runoff causing moisture
stress for crop production particularly in winter season. Activities like
water harvesting, contour trenching, terracing, gully plugging,
aforestation etc. assume importance.
SOIL TREATMENT (Soil Department)
Type of
Soil
Area in
Ha.
Area
Affected
Area in
Ha.
Treatm
ent
require
d
Strat
egy 2010-
11
2011-
12
Acidity Soil 10,000 10,000 10,000 Limin
g
22.50 22.50
Loamy Soil 9,000 9,000 7,000 Affore
statio
n
50.00 50.00

151
Total 19,000 19,000 17,000 - 72.50 72.50
Soil & moisture Conservation Activities
Sl. No.
Type of Activities
Area in Ha.
Unit Cost
No. of Units
Financial Requirement
Amount (in lakhs)
1. Terrace Farming 840 0.24 - 201.60
2. Contour Bunding 500 0.24 - 120.00
3. Channelling - - - -
4. Social Forestry 8,000 0.065 - 520.00
5. Check Wall Construction
- 0.20 1,500 300.00
6. Rubber Nursery - 3.00 50 Nos. 150.00
7. Coffee Nursery - 1.50 50 Nos. 75.00
8. Rubber Plantation
500 1.00 - 500.00
9. Coffee Plantation 300 1.00 - 300.00
10. Ground Water Charging
650 0.60 - 390.00

152
TOTAL : 2,556.60
Water Conservation
Sl. No.
Type of Activity Nos. of Units
Unit Cost Financial Requirement
Amount (in lakhs)
1. Farm Ponds 3,000 1.00 3,000.00
2. Check Dam 150 1.00 150.00
3. Feeder Channel - - -
4. Canal 25,000 R/M
0.0015 R/M
37.50
5. Water Storage 2,000 1.00 3,000.00
TOTAL 6,187.50
Physical and Financial Requirements and Proposed Strategies for
Soil Treatment (Rupees in lakhs)
Type of
Soil
Unit Cost
2010-2011 2011-2012
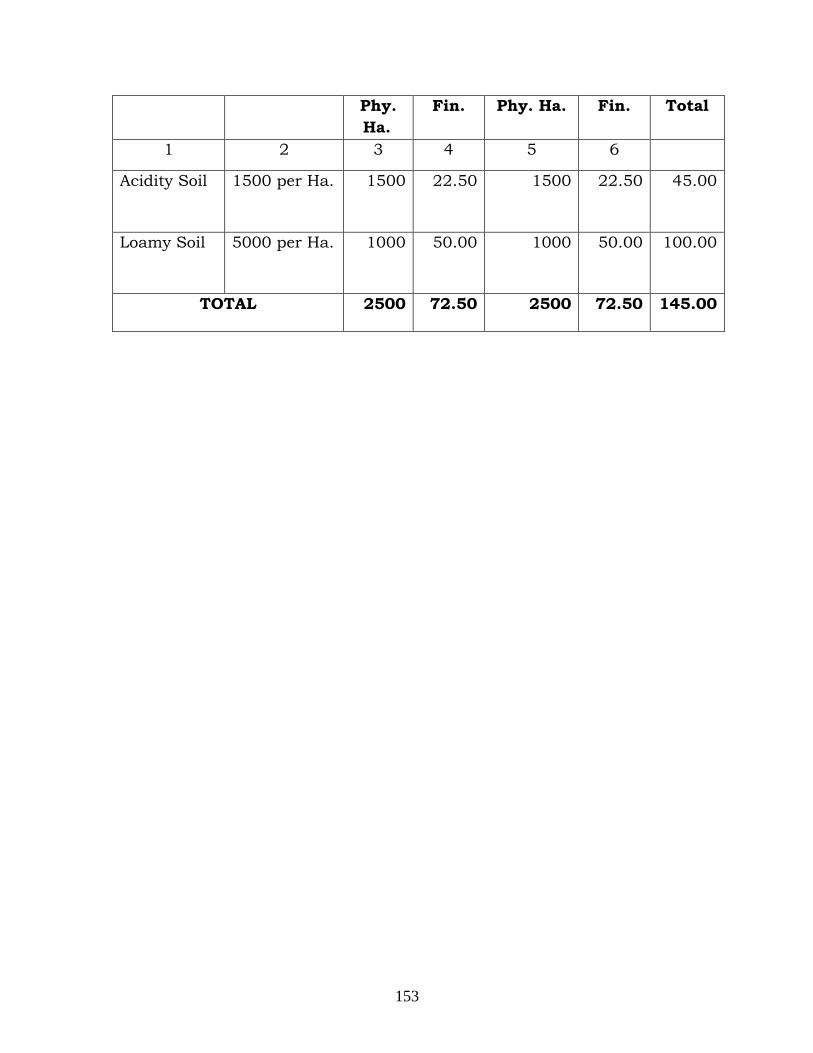
153
Phy.
Ha.
Fin. Phy. Ha. Fin. Total
1 2 3 4 5 6
Acidity Soil 1500 per Ha. 1500 22.50 1500 22.50 45.00
Loamy Soil 5000 per Ha. 1000 50.00 1000 50.00 100.00
TOTAL 2500 72.50 2500 72.50 145.00

154
PROPOSAL FOR IMPLEMENTATION OF SOIL & MOISTURE CONSERVATION ( Rupees in lakh)
Sl. No.
Type of Activities
Unit Cos
t per Ha./Nos.
Y E A R – W I S E T A R G E T
2010-2011 2011-2012 2016-2017
TOTAL
8. Rubber Plantartion.
1.00 72 72.00 72 72.00 500.00
9. Coffee plantation.
1.00 44 44.00 44 44.00 300.00
10. Ground Water Charging
0.60 93 56.00 93 56.00 390.00
TOTAL 2,556.60

155
PROPOSAL FOR IMPLEMENTATION OF WATER CONSERVATION
ACTIVITIES (Rupees in Lakhs)
Sl
.
N
o.
Type of
Activiti
es
Unit
Cost
per
Ha./Nos
.
2010-2011 2011-2012
Phy.
(Ha.)
Fin. Phy.
(Ha.)
Fin. Total
1 2 3 4 5 6 7
1. Farm
Ponds
1.00 430 430.00 430 430.00 860.00
2. Check
Dam
1.00 22 22.00 22 22.00 44.00
3. Feeder
Channe
l
- - - - -
4. Canal 0.0015
R/M
- - 417
R/M
6.25 6.25
5. Water
Storage
.
1.00 430 430.00 430 430.00 860.00
TOTAL: 882 882 1299 888.25 1770.25

156
PROPOSAL FOR IMPLEMENTATION OF SOIL & WATER CONSERVATION
(Rupees in Lakhs)
Sl.
No
Capacity
Building
2010-2011 2011-2012
Phy. Fin. Phy. Fin. Tota
l
1 2 5 6 7 8
1. Training of the
Farmer
LS 35 LS 35 LS 70
2. Office expense LS 20 LS 25 LS 45
3. Machinery and
equipment
LS 20 LS 20 LS 40
4. Contingency LS 10 LS 10 LS 20
5. TA and DA LS 15 LS 10 LS 25
GRAND TOTAL 100 100 200