competitiveness and finance of supply chains
TRANSCRIPT

Competitiveness and finance of supply chains: Considerations on optimisation
Péter Juhász, PhD, CFA
János Száz, DSc
Sándor Misik
Department of Finance
Corvinus University of Budapest
1093, Budapest, Fővám tér 8.
E-mail: [email protected]
KEYWORDS
Growth, Cost of capital, Added value, Efficiency,
Seasonality.
ABSTRACT
The financial aspect of supply chain (SC) management is
a somewhat neglected research area, while earlier papers
showed that it has a strong link to competitiveness. Our
main contribution to literature is to analyse the
competitiveness effects of SC financial management
decisions under perfect information and cooperation
among SC members the absence of which may distort
empirical findings. Our simulation-based research shows
that even in case of perfect foresight seasonality
decreases the profitability and the ability to grow while
increasing the capital need. But, we also conclude that
cooperation of SC members may reduce this additional
capital need while enhancing the profitability and the
growth, thus leading to higher competitiveness. This
cooperation may be achieved through regulating payment
terms or introducing special fees to be paid by the SC
members to the dominating company of the SC. Thus, an
economic policy aiming at providing cheap capital to
firms at a lower level of SC or increasing their added
value at the costs of other SC levels may decrease the
competitiveness of the SC in whole.
INTRODUCTION
When analysing supply chains (SCs), usually the
management of flow of (1) goods and services, (2) rights,
(3) information and knowledge (technology), and (4)
financial resources are listed as critical issues (Pfohl –
Gomm, 2009). This article focuses on this later point.
Based on an extensive survey of Indian firms, More and
Basu (2013) highlight that the most critical challenge is
the lack of shared vision among SC members (SCMs).
The unpredictability of cash flows resulting from delayed
financial transactions, poor automatization of financial
processes, and weak knowledge of SC finance tools are
among the fundamental problems. They call for more
collaboration among SCMs to increase the financial
stability of the SC. However, what would be the SC like
if this cooperation were perfect? In this article, we focus
on possible optimisation of the payment process,
assuming no information barriers among the SCMs.
LITERATURE REVIEW
Recently various papers focused on SCs, particularly on
the competitiveness of them and the new methods to
solve finance issues. Still not too many articles examined
how competitiveness and financing of SCs are connected.
Competitiveness of supply chains
The term of supply chain management appeared in the
literature in the 1980’s. Since then, many papers proved
that the efficient management of SCs increases the
competitiveness of the individual SCMs and so the total
of the SC (Marcuta and Marcuta, 2013).
At the same time, measuring SC competitiveness could
be very complicated. It is usually measured by the sum
of production costs, quality offered and flexibility of the
network. Marwah et al. (2014) emphasise that both
increased efficiency of SCMs and the improvement of SC
activities themselves may lead to improved
competitiveness.
Based on case studies on Indian automotive component
manufacturers, Joshi et al. (2013) even identified 24
factors of competitiveness within eight groups (cost,
flexibility, quality, delivery, buyer-supplier relationship,
technology, environmental factors, and customer
demand).
Instead of focusing on such influencing (input) factors,
we may estimate competitiveness from the output side by
measuring the growth of sales, export or employment, in
addition to achieved profitability and capital efficiency
(business performance) of the SCMs. As for UK Oil and
Gas industry Yusuf et al. (2014) found three SC agility
factors with high correlation to the business performance:
”cooperating to compete” (long-term partnership, reward
based on team performance etc.), ”mastering change and
uncertainty” (rapid decision making, proactive response
to changes etc.) and ”leveraging the impact of people and
information” (information accessibility, team spirit etc.).
Hult et al. (2007) underline that in SCs culture of
competitiveness and knowledge development have a
positive association with performance. They highlight
that during turbulent times the link to knowledge
development becomes stronger, while culture of
competitiveness seems to lose its effects.
Proceedings 32nd European Conference on Modelling and Simulation ©ECMS Lars Nolle, Alexandra Burger, Christoph Tholen, Jens Werner, Jens Wellhausen (Editors) ISBN: 978-0-9932440-6-3/ ISBN: 978-0-9932440-7-0 (CD)
Finance for supply chains
Literature on SC finance usually takes one of two
perspectives: papers either focus on products of financial
institutions to cope with accounts payable and receivable
issues or concentrate on the whole of the SC and the
reduction of the working capital need (inventories
included) and sometimes also on financing invested
assets (Gelsomino et al., 2016).
Still, both of these research directions are far from being
complete. Pfohl and Gomm (2009) underline that
contrary to flow of goods and information only limited
research was done in the field of financing supply chains.
Even in those, the cost of capital stayed mostly neglected.
Those are the amount of capital needed, the cost of that
capital and the flow of cash achieved by employing the
given capital that determine the value of the given
company. Therefore, it is not only by individual
inventory, process, and cash management but also by
collaboration and synchronisation among supply chain
members and optimisation of funding costs that we may
enhance value creation. Based on this logic, we should
not only minimise the capital need of the SC, but
extraordinary efforts should be made to achieve that the
highest amount of capital need emerges at the SCM
facing the lowest cost of financing. Of course, when
optimising, we also have to consider the duration of that
financing need. To be able to do so, Pfohl and Gomm
(2009) underline the importance of the information flow
among SCMs.
Cavenaghi (2013) highlight that this information is
needed not only by SCMs but also by the banks providing
financing to them as no matter which member of the SC
they finance at the end of the day the financial institutions
take the payment risk of the final customer. The
management of these new complex and integrated
systems call for new risk management tools instead of the
standard methods (Chun-Lian, 2016).
Based on case studies, Liebl et al. (2016) emphasise the
vast opportunity reverse factoring may offer in supply
chain financing. In those cases, buyers seek the help of
financial institutions to be able to pay suppliers early to
reduce the risk of shocks a bankruptcy at earlier SC levels
may generate. This tool is more often used by buyers with
a weaker bargaining power as they seem to focus on
strengthening of the relationship to key suppliers with a
flawless track record.
Based a theoretical optimisation model, Wuttke et al.
(2016) showed that introducing SC finance program
(where thanks to the main buyer suppliers receive
financing on their account receivable at preferred term in
exchange for accepting longer payment terms) is a
dynamic process where timing is an essential factor.
They conclude that the immediate introduction of such a
system is not always beneficial for the buyer. It seems
that high procurement volume and long initial payment
terms both promote the introduction. Extending
deadlines under SC financing, which may limit the
number of suppliers, is only advantages buyers with
lower financing cost, high procurement volume and long
initial payment term.
Focusing on the management practices, based on a
sample of 110 Malaysian electronics manufacturer,
Sundram et al. (2011) identified six dimensions having a
significant effect on the SC performance. Like Basu
(2013), they found that agreed (1) vision and goals (i.e. a
kind of central coordination) are the most critical factor,
but also (2) strategic supplier partnership, (3) information
sharing, (4) information quality, (5) postponement
strategy and (6) risk and reward sharing play a
statistically significant role.
Finance of supply chains and competitiveness
The performance of an SCM is strongly linked to that of
the SC. Using a Romanian sample, Gyula (2013) showed
that the financial, marketing and innovation performance
of the SC have a positive and statistically significant
impact on the overall organisational performance.
Filbeck et al. (2016) proved for US automotive
manufacturers that supply chain disruptions do not only
affect negatively the share price of the company being hit
but also those of the competitors. This link was
particularly strong in bear markets, but not present for
Japanese carmakers.
Pino et al. (2010) modelled a SC in a multi-agent system
to show that even in case of a flat final demand a vast
variation could emerge in the demand lower level SCMs
face, called the ‘‘bullwhip effect’’. They conclude that
this variation caused by the separate management of the
SCMs can be dramatically reduced using MASs
methodology. That is why our simulation built on perfect
information assumes no such distortions. They underline
that removing fluctuations from demand reduces the
capital need of SCMs.
MODEL DESCRIPTION
Our model focuses on the financial management issues
of an SC. We examine how different financial parameters
influence the competitiveness (measured by the ability to
grow) of the SC, and how perfect cooperation would
transform financing and payment terms to maximise
shareholder value (total cash flow achieved).
The SC in our model has three levels: A sells to final
customer (market), B is the main supplier of A and the
main buyer of C that purchases raw material at a price of
10 per unit. A, B, and C could each be considered as a
single company, or a representative merged firm for the
given level in the SC. Only A has sales outside of the SC.
We assume perfect foresight regarding the demand level.
Each level needs one period (month) to produce its final
product from the product purchased from its supplier.
Thus, in any given period A produces the required
quantity in line with the market demand (Dt), but places
an order with company B equal to (Dt+1). B produces this
amount but places an order with C equal to Dt+2. So, C
manufactures at time t the amount needed at time t+2.
When manufacturing, the firms have to pay immediately
for wages (any cost not related to SCMs they purchase
from), but they pay for the SC products P days later.
Payment terms may not be the same for different SCMs.
As manufacturing needs one period, suppliers need to
deliver at the start of the period, thus if P=0 payment to
suppliers is due at the beginning of the period.
At the end of the period, all SCMs deliver their products
to their buyers but collect the income only R days later.
(R may be different for all players.) Due to the set-up of
the SC, PA=RB and PB=RC.
Two measures control profitability of the SCMs. Added
value (AV) of their product is added to the price of their
supplier to calculate their selling price. But a given
percentage of AV (Wage%) has to be spent on wages and
other costs due immediately.
The simulation starts with setting up manufacturing
capacities: we assume that to perform production for each
of the SCMs 1 unit/piece invested asset is needed. We
have to purchase the machines by the start of the actual
manufacturing period, so the payment for the machines
takes place a period earlier. If production increases, the
additional investment is deducted from the accumulated
cash. (Equation 3 and 12.) Initial capacity setup takes
place for all companies at the period -2 and that
investment is considered as part of the initial capital need.
As a next step, the cash flow of each period is calculated,
and the result is added to the opening cash balance. To
evade bankruptcy, each of the SCMs has to hold a certain
amount of cash at the start of the simulation, representing
their working capital (WC) need. This WC (together with
the machines) is financed at a cost, though. Cost of
capital (CoC, e.g. interest payment or dividend required)
may be different for each of the firms. The cash balance
is decreased at the end of each period by the starting
amount of capital (covering WC and initial machines)
times CoC.
This calculation method assumes that firms need to hold
a WC enough for to survive the total simulation period
right from the start (capital may not enter or leave the
company, e.g. there is no dividend payment). There is no
loss of capacity due to the usage of the machines and
during the simulation period neither the price of the
products or the machines changes.
The simulation covers 30 periods, where the first period
is the one in which A first sells its products, implying that
manufacturing at C starts in period -2. To measure the
competitiveness of the SC, we calculate the individual
and total amount of start-up capital required to survive
simulation period, total additional cash amount generated
by the end of the simulation (as a measure of
profitability), and maximum growth the SC may survive
using a certain amount of capital.
SC is facing a final market demand for the product of A
that is calculated based on equation 1 and 2.
𝐷𝑡 = 𝐷0 ∗ ∏ (1 + 𝑔𝑖)𝑡𝑖=1 ∗ (1 + 𝑠) (1)
𝑠 = 𝑎 ∗ 𝑠𝑖𝑛 (𝑐 ∗ (𝑡 − 1)) (2)
D stands for the amount of demand, t indicates time
(starting from 1), g shows the growth rate of the period,
s for the seasonality trend. Constants a and c describe the
form and size of seasonality effect and their value were
chosen to be 25 percent and 101 respectively. D0*(1+g1)
equals to 100 in all cases.
The cash flow of any period is calculated using formula
3 and is added to the initial cash amount.
𝐶𝐹𝑡 = 𝐼𝑛𝑐𝑜𝑚𝑒𝑡 − 𝑊𝑎𝑔𝑒𝑠𝑡 − 𝑀𝑎𝑡𝑡 − 𝐼𝑛𝑣 𝑡 (3)
where
𝐼𝑛𝑐𝑜𝑚𝑒𝑡 == (𝑥 ∗ 𝑄
𝑡−𝑖𝑛𝑡(𝑅
30)−1
+ (1 − 𝑥)𝑄𝑡−𝑖𝑛𝑡(
𝑅
30)) ∗ 𝑆𝑃𝑟𝑖𝑐𝑒 (4)
𝑥 =𝑅
30− 𝑖𝑛𝑡 (
𝑅
30) (5)
𝑄𝐴,𝑡 = 𝐷𝑡 𝑄𝐵,𝑡 = 𝐷𝑡−1 𝑄𝐶,𝑡 = 𝐷𝑡−2 (6) 𝑆𝑝𝑟𝑖𝑐𝑒𝐴 = 𝑆𝑝𝑟𝑖𝑐𝑒𝐵 + 𝐴𝑉𝐴 𝑆𝑝𝑟𝑖𝑐𝑒𝐵 = 𝑆𝑝𝑟𝑖𝑐𝑒𝐶 + 𝐴𝑉𝐵 𝑆𝑝𝑟𝑖𝑐𝑒𝐶 = 𝑆𝑝𝑟𝑖𝑐𝑒𝑅𝑎𝑤 + 𝐴𝑉𝐶 (7) 𝑊𝑎𝑔𝑒𝑠𝑡 = 𝑄𝑡 ∗ 𝑊𝑎𝑔𝑒𝑠%𝑡 (8)
𝑀𝑎𝑡𝑡 == (𝑦 ∗ 𝑄
𝑡−𝑖𝑛𝑡(𝑃
30)−1
+ (1 − 𝑦)𝑄𝑡−𝑖𝑛𝑡(
𝑃
30)) ∗ 𝑃𝑃𝑟𝑖𝑐𝑒 (9)
𝑦 =𝑃
30− 𝑖𝑛𝑡 (
𝑃
30) (10)
𝑃𝑝𝑟𝑖𝑐𝑒𝐴 = 𝑆𝑝𝑟𝑖𝑐𝑒𝐵 𝑃𝑝𝑟𝑖𝑐𝑒𝐵 = 𝑆𝑝𝑟𝑖𝑐𝑒𝐶
𝑃𝑝𝑟𝑖𝑐𝑒𝐶 = 𝑆𝑝𝑟𝑖𝑐𝑒𝑅𝑎𝑤 (11) 𝐼𝑛𝑣𝑡 = 𝑚𝑎𝑥 (0, (𝑄𝑡+1 − 𝑄𝑡) ∗ 1) (12)
The initial cash is determined by iteration that aims to
find the minimum amount enough to have all of the end
of period cash balances (from the period -2 to 30) above
0.
SIMULATION RESULTS
First, to have a reference point, we run the simulation
with the parameters in Table 1. We picked 30 days (1
period) as a payment term for all participants. As
procurement takes place at the start of the period and the
sale happens at the end of it, this means that there is a
financing gap of 1 period for all players. Demand was flat
at 100 pieces for all the periods.
Table 1: Base scenario
Firm A B C
Payment days 30 30 30
Added value 10 10 10
Wage (% AV) 60% 60% 60%
Cost of capital 1% 1% 1%
Our result shows that the SC needs altogether 4899 units
of initial capital to set up, but due to the stable operating
cash flow of 400 for all SCMs in each period at the end
of period 30, there will be 29633 extra cash accumulated.
Both investment need and cash profit are distributed
equally among the firms. To be able to grow by 1 percent
monthly (12.7 percent yearly), this system needs 30 units
(0.6 percent) of additional capital. Thus, accumulated
cash rose to 33660.
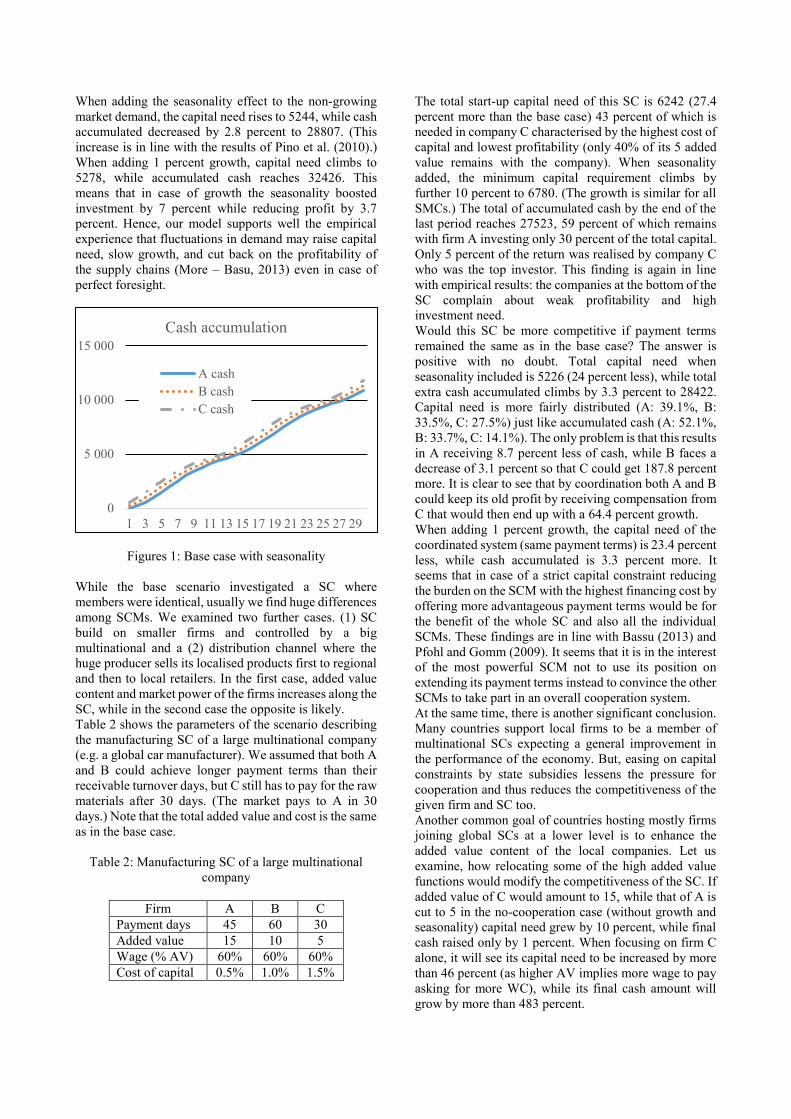
When adding the seasonality effect to the non-growing
market demand, the capital need rises to 5244, while cash
accumulated decreased by 2.8 percent to 28807. (This
increase is in line with the results of Pino et al. (2010).)
When adding 1 percent growth, capital need climbs to
5278, while accumulated cash reaches 32426. This
means that in case of growth the seasonality boosted
investment by 7 percent while reducing profit by 3.7
percent. Hence, our model supports well the empirical
experience that fluctuations in demand may raise capital
need, slow growth, and cut back on the profitability of
the supply chains (More – Basu, 2013) even in case of
perfect foresight.
Figures 1: Base case with seasonality
While the base scenario investigated a SC where
members were identical, usually we find huge differences
among SCMs. We examined two further cases. (1) SC
build on smaller firms and controlled by a big
multinational and a (2) distribution channel where the
huge producer sells its localised products first to regional
and then to local retailers. In the first case, added value
content and market power of the firms increases along the
SC, while in the second case the opposite is likely.
Table 2 shows the parameters of the scenario describing
the manufacturing SC of a large multinational company
(e.g. a global car manufacturer). We assumed that both A
and B could achieve longer payment terms than their
receivable turnover days, but C still has to pay for the raw
materials after 30 days. (The market pays to A in 30
days.) Note that the total added value and cost is the same
as in the base case.
Table 2: Manufacturing SC of a large multinational
company
Firm A B C
Payment days 45 60 30
Added value 15 10 5
Wage (% AV) 60% 60% 60%
Cost of capital 0.5% 1.0% 1.5%
The total start-up capital need of this SC is 6242 (27.4
percent more than the base case) 43 percent of which is
needed in company C characterised by the highest cost of
capital and lowest profitability (only 40% of its 5 added
value remains with the company). When seasonality
added, the minimum capital requirement climbs by
further 10 percent to 6780. (The growth is similar for all
SMCs.) The total of accumulated cash by the end of the
last period reaches 27523, 59 percent of which remains
with firm A investing only 30 percent of the total capital.
Only 5 percent of the return was realised by company C
who was the top investor. This finding is again in line
with empirical results: the companies at the bottom of the
SC complain about weak profitability and high
investment need.
Would this SC be more competitive if payment terms
remained the same as in the base case? The answer is
positive with no doubt. Total capital need when
seasonality included is 5226 (24 percent less), while total
extra cash accumulated climbs by 3.3 percent to 28422.
Capital need is more fairly distributed (A: 39.1%, B:
33.5%, C: 27.5%) just like accumulated cash (A: 52.1%,
B: 33.7%, C: 14.1%). The only problem is that this results
in A receiving 8.7 percent less of cash, while B faces a
decrease of 3.1 percent so that C could get 187.8 percent
more. It is clear to see that by coordination both A and B
could keep its old profit by receiving compensation from
C that would then end up with a 64.4 percent growth.
When adding 1 percent growth, the capital need of the
coordinated system (same payment terms) is 23.4 percent
less, while cash accumulated is 3.3 percent more. It
seems that in case of a strict capital constraint reducing
the burden on the SCM with the highest financing cost by
offering more advantageous payment terms would be for
the benefit of the whole SC and also all the individual
SCMs. These findings are in line with Bassu (2013) and
Pfohl and Gomm (2009). It seems that it is in the interest
of the most powerful SCM not to use its position on
extending its payment terms instead to convince the other
SCMs to take part in an overall cooperation system.
At the same time, there is another significant conclusion.
Many countries support local firms to be a member of
multinational SCs expecting a general improvement in
the performance of the economy. But, easing on capital
constraints by state subsidies lessens the pressure for
cooperation and thus reduces the competitiveness of the
given firm and SC too.
Another common goal of countries hosting mostly firms
joining global SCs at a lower level is to enhance the
added value content of the local companies. Let us
examine, how relocating some of the high added value
functions would modify the competitiveness of the SC. If
added value of C would amount to 15, while that of A is
cut to 5 in the no-cooperation case (without growth and
seasonality) capital need grew by 10 percent, while final
cash raised only by 1 percent. When focusing on firm C
alone, it will see its capital need to be increased by more
than 46 percent (as higher AV implies more wage to pay
asking for more WC), while its final cash amount will
grow by more than 483 percent.
0
5 000
10 000
15 000
1 3 5 7 9 11 13 15 17 19 21 23 25 27 29
Cash accumulation
A cash
B cash
C cash

This result means that by achieving the relocation
competitiveness (capital efficiency) of the whole SC
decreases while that of C increases radically. Because
now a more significant part of the total SC capital need
is financed at a country with a higher cost of capital and
C improves at the expense of B and A, in the long run, all
SCMs will be in a worse position. So, moving more AV
to earlier level if SC located in less favourable countries
is not realistic if the decision is to be made by A
dominating the SC and it is not even advantageous for C
in the long run.
Our third scenario describes a retail chain. In this case, C
is dominant with the highest AV and best financing
position. It is by offering advantageous payment term to
its buyers (very often own subsidiaries) that financing is
provided to A and B operating with a higher cost of
capital due to their smaller size and less advantageous
location (e.g. riskier countries). Critical parameters are
summed up in Table 3.
Table 3: Retail SC of a large multinational company
Firm A B C
Payment days 60 60 30
Added value 5 10 15
Wage (% AV) 60% 60% 60%
Cost of capital 1,5% 1,0% 0,5%
This SC needs a total capital of 7468 and accumulates a
total of 29607 cash. This structure transfers profit from C
to A. A invests 18.2 percent of total capital but receives
24.8 percent of the cash, while C invests 51.4 percent and
gets 45.9 percent only. (B has a share of almost 30
percent in both cases.) This allocation could be
particularly advantageous if all SCMs belong to the same
group and A faces a lower corporate tax rate.
If 1 percent growth is added, the capital need grows by
0.9 percent, while total final cash increases by 13.7
percent. Interestingly, capital need at B climbs by 1.2
percent, while that of A and C only by 0.8 percent.
Adding seasonality to the base case causes similar
distortions. Total initial capital need grows by 9.4
percent, but while this increase is 8.7 percent for A and 8
for C, B suffers a boost of 12.3 percent. This result calls
attention to the fact that the growth and the fluctuation of
demand may put very different burdens to SCMs even if
no structural change occurs within the SC.
To reduce investment need at C, we may try to balance
the return distribution back towards that of the
investment. A way for this could be C to charge some fee
to A (e.g. for the brand, marketing, know-how, licence
fee). For to reflect this transfer from A to C, the
manufacturing cost expressed in percentage of AV
(Wage) should be modified. To evade distortion, we
should keep the total of these costs across the SC
constant. Given the original AV and Wage values, these
expenses amounted to 18 (60%*5+60%*10+60%*15).
For example, assuming a compensation per piece of 1.5,
we have to modify Wage ratio of A up to 90 percent, and
that of C down to 50 percent in our model.
When doing so, SC will need (without growth or
seasonality) 2 percent less capital and produce 0.9
percent more total cash. In other words, this step
improves the financial competitiveness of the SC. Under
the new rules, A loses 62.3 percent of its original final
cash balance, while C receives 35.7 additional cash. This
restructuring leaves B is entirely unaffected, what is the
main difference in this model between charging a fee and
modifying payment terms. Therefore, the fees to be paid
by the SCMs to the controlling entity are tools to fine tune
the system, that is, they offer a method to force
cooperation on SCMs. This new structure including fee
payment performs better not only in case of growth, but
also in case of seasonality, and when controlling for both
of them. (Capital need diminished by 2 percent, total final
cash increased by 1.1-1.5 percent.) This outcome is in
line with Hult et al. (2007) promoting cooperation in
turbulent times and Sundram et al. (2011) addressing fair
risk and reward sharing as one of the SC success factors.
Our finding implies that in case we assume a rational
control over the SC by the dominant player national
authorities may decrease the competitiveness of the SC if
questioning the rightfulness and limiting the amount of
such fees (see transfer pricing regulations).
Table 4 summarises our findings in details. Base
scenarios refer to the primary assumptions related to the
three major cases (identical firms, SC of a large
multinational company and retail chain with a dominant
actor). Relative changes are calculated to the base
scenarios within each case.

Table 4: Summary of scenarios and results
Case Scenario
Parameters* Relative changes to Base scenarios
Flat demand +1% growth in demand
Payable
turnover
days
Added value
Wage ratio
Cost of capital
Seaso- nality
Initial capital
Cash
accu-
mulated
Initial capital
Cash
accu-
mulated
Case 1: Identical
firms
Base scen. 30-30-30 10-10-10 60%-60%-60% 1%-1%-1%
No - - - -
Scenario 1 Yes 7% -3% 6% -4%
Case 2: Production
chain
Base scen. 45-60-30
15-10-5 60%-60%-60% 0.5%-1%-1.5%
No - - - - Scenario 1 Yes 9% -4% 9% -5%Scenario 2
30-30-30 No -22% 2% -22% 2%
Scenario 3 Yes -16% -1% -16% -2%Scenario 4 45-60-30 5-10-15 No 10% 1% 10% 2%
Case 3: Retail
chain
Base scen.
60-60-30 5-10-15
60%-60%-60%
1.5%-1%-0.5%
No - - - - Scenario 1 Yes 9% -4% 9% -5%Scenario 2
90%-60%-50% No -2% 1% -2% 1%
Scenario 3 Yes 7% -3% 7% -4%
*Listed parameter values refer to Firm A - Firm B - Firm C in the given order.
MAJOR FINDINGS AND CONCLUSION
Our simulations have confirmed that fluctuations in
demand cause fall back in growth, profitability and an
increase in the capital need even in case of perfect
information, so it is not only the uncertainty about the
future affecting performance and competitiveness
adversely.
We also showed that cooperation among SCMs might
allow for reducing the total investment need while
boosting the profitability and the ability to grow, in other
words, improves the competitiveness. At the same time,
we concluded that easing the capital constraint by state
subsidies may hurt the competitiveness of the SC
dominated by a big company by reducing the motivation
for cooperation.
Our results also imply that relocating more of the added
value generation of the SC to firms with weak bargaining
power (high working capital need) and a high cost of
capital decreases the competitiveness of the SC. Thus, for
a long-term advantage, economic policy should also
focus on improving macro conditions and payment terms
beside of raising added value content of the local firms.
We also showed that growth of the SC might ask for very
different additional investment from SCMs even if none
of the structural variables changes. At the same time, fees
paid by SCMs to the controlling company may offer a
tool to enforce cooperation among independent firms.
Using them wisely may help to optimise the performance
of the SC and boost its competitiveness. In such cases,
too conservative national transfer pricing systems may
weaken the SC competitiveness.
REFERENCES
Cavenaghi, E. 2013. “Supply-chain finance: The new frontier
in the world of payments”, Journal Of Payments Strategy
& Systems, 7, 4, 290-293.
Chun-Lian, Z. 2016. “Risk assessment of supply chain finance
with intuitionistic fuzzy information”, Journal Of
Intelligent & Fuzzy Systems, 31, 3, 1967-1975.
Filbeck, G., S. Kumar, J. Liu and X. Zhao. 2016. “Supply chain
finance and financial contagion from
disruptions”, International Journal Of Physical
Distribution & Logistics Management, 46, 4, 414-438.
Gelsomino, L., R. Mangiaracina, A. Perego, and A. Tumino.
2016. “Supply chain finance: a literature
review”, International Journal Of Physical Distribution &
Logistics Management, 46, 4, 348-366.
Gyula, L. F. 2013. “Analysis of the Impact of the Supply Chain
Performance on the Overall Organisational
Performance”, Annals Of The University Of Oradea,
Economic Science Series, 22, 1, 1505-1510.
Hult, G., D. Ketchen, and M. Arrfelt. 2007. “Strategic supply
chain management: Improving performance through a
culture of competitiveness and knowledge
development”, Strategic Management Journal, 28, 10,
1035-1052.
Joshi, D., B. Nepal, B, A. Rathore, and D. Sharma. 2013. “On
supply chain competitiveness of Indian automotive
component manufacturing industry“, International Journal
Of Production Economics, 143, 151-161.
Liebl, J., E. Hartmann, and E. Feisel. 2016. “Reverse factoring
in the supply chain: objectives, antecedents and
implementation barriers”, International Journal Of
Physical Distribution And Logistics Management, 46, 4,
393-413.
Marcuta, L. and A. Marcuta. 2013. “Role of supply chain
management in increasing the competitiveness of
companies in a global context”, Scientific Papers:
Management, Economic Engineering In Agriculture &
Rural Development, 13, 1, 227-229.
Marwah, A., G. Thakar, and R. Gupta. 2014. “A confirmatory
study of supply chain performance and competitiveness of
Indian manufacturing organisations“, International Journal
For Quality Research, 8, 1, 23-37.
More, D. and P. Basu. 2013. “Challenges of supply chain
finance: A detailed study and a hierarchical model based on
the experiences of an Indian firm”, Business Process
Management Journal, 19, 4, 624-647.
Pfohl, H. and M. Gomm. 2009. “Supply chain finance:
Optimizing financial flows in supply chains”, Logistics
Research, 1, 3-4, 149-161.
Pino, R., I. Fernández, D. Fuente, J. Parreño, and P. Priore.
2010. “Supply chain modelling using a multi-agent
system”, Journal Of Advances In Management Research, 7,
2, 149-162.
Sundram, V. P. K., A. R. Ibrahim, and V. G. R. C. Govindaraju.
2011. “Supply chain management practices in the
electronics industry in Malaysia: Consequences for supply
chain performance”, Benchmarking: An International
Journal, 18, 6, 834-855.
Wuttke, D., C. Blome, H. Sebastian Heese, and M. Protopappa-
Sieke. 2016. “Supply chain finance: Optimal introduction
and adoption decisions”, International Journal Of
Production Economics, 178, 72-81.
Yusuf, Y. Y., A. Gunasekaran, A. Musa, M. Dauda, N. M. El-
Berishy, S. Cang. 2014. ”A relational study of supply chain
agility, competitiveness and business performance in the oil
and gas industry”, International Journal of Production
Economics, 147, 531-543.
AUTHOR BIOGRAPHIES
PÉTER JUHÁSZ received his master in Economics and
PhD in Business Administration from the Corvinus
University of Budapest, where he is associate professor
of Finance. He also serves as the secretary of CFA
Society Hungary. His field of research covers financial
modelling, business valuation, corporate finance, and
corporate risk management. Besides, he regularly works
as a trainer and coach and acts as a consultant for SMEs.
His e-mail address is peter.juhasz@uni-
corvinus.hu.
JÁNOS SZÁZ is a full Professor at the Department of
Finance at the Corvinus University of Budapest.
Formerly he was the dean of the Faculty of Economics at
Corvinus University of Budapest and President of the
Budapest Stock Exchange. Currently, his main field of
research is financing corporate growth when interest
rates are stochastic. His e-mail address is [email protected].
SÁNDOR MISIK holds an MA in Finance and is a PhD
student at the Department of Finance at the Corvinus
University of Budapest. His main research focus is on the
implied correlations in the Fx markets. He works as
Financial Risk Management Expert at the MOL Group.
He received his ACIIA charter in 2010. His e-mail
address is [email protected].