competitive research article martin j. bliemel*, ian p ......multiplexity is an important, yet often...
TRANSCRIPT

Competitive Research Article
Martin J. Bliemel*, Ian P. McCarthy and Elicia M.A. Maine
An Integrated Approach to StudyingMultiplexity in Entrepreneurial Networks
Abstract: Multiplexity occurs in entrepreneurial networks when flows interactwithin and across relationships. It defines how these networks function and evolveand cannot be examined by studying network structure or flows separately.Despite the growing recognition of the importance of multiplexity, related researchhas remained limited and lacks an integrated approach to simultaneously examinestructure and flows, thus restricting our understanding of entrepreneurial net-works. We propose an integrated approach for conducting inductive studies intomultiplexity, involving an adaptation of the “business networks” conceptualmodel, the configuration theory perspective, and the Q-analysis method.
Keywords: entrepreneurial networks, multiplexity, configuration theory,Q-analysis
DOI 10.1515/erj-2014-0007
1 Introduction
Entrepreneurial networks are considered to be important organizational formsthat both reflect and enable the strategic goals of entrepreneurs (Ostgaard andBirley 1994; Hoang and Antoncic 2003; Hill and Birkinshaw 2008). They areimportant to entrepreneurs for accessing, exchanging, and transformingresources in order to establish firms (Kanter 1983; Birley 1985; Aldrich, Rosen,and Woodward 1987; Ozdemir et al. forthcoming) and overcome liabilities ofnewness and smallness (Stinchcombe 1965; Stuart, Hoang, and Hybels 1999). Bynetwork, we mean the set of relations between the entrepreneur and their direct
*Corresponding author: Martin J. Bliemel, School of Management, UNSW Australia, UNSWBusiness School, Kensington, NSW 2052, Australia, E-mail: [email protected] P. McCarthy: E-mail: [email protected], Elicia M.A. Maine: E-mail: [email protected], BeedieSchool of Business, Simon Fraser University, Vancouver, BC, Canada
Entrep. Res. J. 2014; aop

contacts, including interrelations between these direct contacts, i.e., the entre-preneur’s ego-network. By entrepreneur, we include a person who “carries outnew combinations” to develop their venture (Schumpeter 1934, 78).
Research on entrepreneurial networks has focused either on network structureor network flows, and thus not captured the role of multiplexity in the function orevolution of the entrepreneur’s network (Slotte-Kock and Coviello 2010). Thestructural perspective focuses on who is a part of the network (i.e., which actors),the topology of their relationships, and the entrepreneur’s position in the network(e.g., Shepherd 1991; Soh 2003; Al-Laham and Souitaris 2008). This perspectiveemphasizes how network positions enable aggregation and combination ofresources and is dominated by quantitative methods such as social networkanalysis (SNA), and typically operationalizes only one type of relationship perstudy (e.g., investment, patent co-authorship, or strategic alliances). Such struc-tural methods are limited in their ability to capture the diversity of interactionsbetween the various actors and flows that comprise organizational and inter-organizational systems (Fiss 2007, 2011), including entrepreneurial networks.
The flow perspective focuses on what types of resources are involved inindividual relationships, and on how these diverse resources are put to use,exchanged or transformed (e.g., Larson 1991; Yli-Renko, Sapienza, and Hay2001; Hite 2005). Research using the flow perspective typically focuses on howmultiple exchanges occur and interact within a single relationship using quali-tative research methods (e.g., Larson 1991; Hite 2003, 2005). This focus meansde-emphasizing and thus omitting interactions of flows across relationships.Therefore, research using this perspective is limited in its ability to describe orexplain how multiplexity affects the overall network or its evolution.
Both these network perspectives have proven to be theoretically useful forunderstanding how entrepreneurial networks vary, and which network position orresources matter when. However, reliance on either of the two dominant perspec-tives omits multiplexity at the network level, and thus limits our ability to answerresearch questions about how entrepreneurial networks function and evolve.Recent reviews note the limitations of the two dominant perspectives and criticizethat “the characteristics of individual actors [and their flows], to the extent thatthey are discussed at all, have tended to be treated as residues of social structure”(Kilduff and Brass 2010, 332), and that omissions of network multiplexity result innetwork research that is “unrealistic” (Shipilov 2012, 216). In this study, we applythe concept of multiplexity to the level of the entrepreneur’s network by definingnetwork multiplexity as the interaction of flows within and across relationships.
This paper is similar to other methodology papers (e.g., Siggelkow 2002; Fiss2007; Crawford 2009; Jack 2010) in that it provides a contribution that guidesscholars to adopt a new approach with which research questions can be
2 M.J. Bliemel et al.
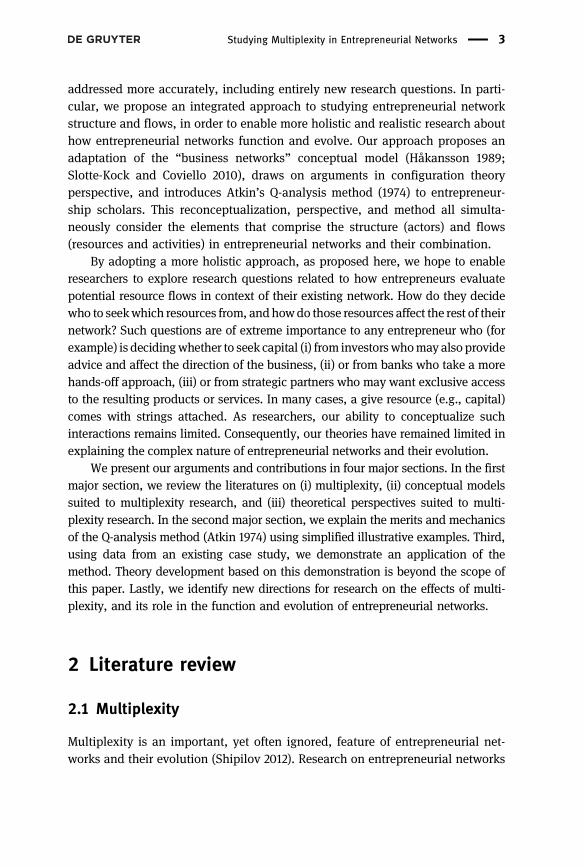
addressed more accurately, including entirely new research questions. In parti-cular, we propose an integrated approach to studying entrepreneurial networkstructure and flows, in order to enable more holistic and realistic research abouthow entrepreneurial networks function and evolve. Our approach proposes anadaptation of the “business networks” conceptual model (Håkansson 1989;Slotte-Kock and Coviello 2010), draws on arguments in configuration theoryperspective, and introduces Atkin’s Q-analysis method (1974) to entrepreneur-ship scholars. This reconceptualization, perspective, and method all simulta-neously consider the elements that comprise the structure (actors) and flows(resources and activities) in entrepreneurial networks and their combination.
By adopting a more holistic approach, as proposed here, we hope to enableresearchers to explore research questions related to how entrepreneurs evaluatepotential resource flows in context of their existing network. How do they decidewho to seekwhich resources from, andhowdo those resources affect the rest of theirnetwork? Such questions are of extreme importance to any entrepreneur who (forexample) is decidingwhether to seek capital (i) from investors whomay also provideadvice and affect the direction of the business, (ii) or from banks who take a morehands-off approach, (iii) or from strategic partners who may want exclusive accessto the resulting products or services. In many cases, a give resource (e.g., capital)comes with strings attached. As researchers, our ability to conceptualize suchinteractions remains limited. Consequently, our theories have remained limited inexplaining the complex nature of entrepreneurial networks and their evolution.
We present our arguments and contributions in four major sections. In the firstmajor section, we review the literatures on (i) multiplexity, (ii) conceptual modelssuited to multiplexity research, and (iii) theoretical perspectives suited to multi-plexity research. In the second major section, we explain the merits and mechanicsof the Q-analysis method (Atkin 1974) using simplified illustrative examples. Third,using data from an existing case study, we demonstrate an application of themethod. Theory development based on this demonstration is beyond the scope ofthis paper. Lastly, we identify new directions for research on the effects of multi-plexity, and its role in the function and evolution of entrepreneurial networks.
2 Literature review
2.1 Multiplexity
Multiplexity is an important, yet often ignored, feature of entrepreneurial net-works and their evolution (Shipilov 2012). Research on entrepreneurial networks
Studying Multiplexity in Entrepreneurial Networks 3

has historically been challenged due to a “tendency toward methodologicalsimplicity” (Coviello and Jones 2004, 502). As a result, “most studies […] takean oversimplified view of networks by assuming away their multiplexity [andthus] are missing a possibility to examine how multiple kinds of relationshipscould simultaneously affect network dynamics and network outcomes” (Shipilov2012, 215, emphasis added).
In general, multiplexity occurs when multiple types of relationshipsoverlap within the same set of actors, thus causing the relationships andactors to be interdependent (Kapferer 1969; Doreian 1974; Koehly and Pattison2005). Its occurrence can be traced back to the fact that people, includingand especially entrepreneurs, “generally [have] more than one relationsimultaneously operating” (Harary 1959, 402). It is particularly important forentrepreneurial networks, since entrepreneurs use their networks to access andcombine diverse types of relationships (e.g., Birley 1985; Lechner and Dowling2003).
Multiplexity is typically defined at the dyad level as the occurrence orinteraction of two or more different types of relationships between the sametwo actors (Rogers and Kincaid 1981; Hoang and Antoncic 2003; Hite 2005;Grossman, Yli-Renko, and Janakiraman 2010). Confusingly, some prior usesand definitions of “network multiplexity” imply a network-level concept, butremain focused on the dyad level (Krohn, Massey, and Zielinski 1988; Dhanarajand Parkhe 2006). To illustrate dyadic multiplexity, we draw on a case studyfrom the literature, in which Chad at DataTools describes the overlapping rolesof a partner firm:
I’m selling my products through them. But I’m also doing work for them. So it kind of goesboth ways… They are [also] a competitor… In this whole relationship, they are actuallyevery single one of these that I can think of [supplier, customer, vendor, broker, previousemployer]. (p. 28 in Hite 2003)
In this paper, we define network multiplexity as the interaction of exchangeswithin and across relationships. This is inclusive of dyadic multiplexity as wellas situations in which a relationship of one type with one actor is interdepen-dent on one or more relationships of other types with other actors. Our definitionis also consistent with the “three key premises” for considering multiplexity atthe network level: “(a) organizations are simultaneously embedded in differentkinds of relationships, (b) these relationships are interdependent [i.e., theyinteract] and (c) this interdependence influences organizations” (Shipilov 2012,215). Network multiplexity has direct implications for how networks functionand how changes propagate throughout networks.
4 M.J. Bliemel et al.

2.2 Conceptual models
Hoang and Antonic (2003, 177) posit that “current work seeking to explainentrepreneurial success is limited by considerable conceptual vagueness regard-ing the resources […] and how we measure the networks that provide thoseresources.” They offer a “general” definition of a network as “consisting of aset of actors and some set of relationships that link them” (2003, 167). However,this definition also remains vague about the nature of the relationships, andmay include, but does not clearly capture multiplexity at the dyad or networklevel.
A conceptual model that is more aligned with network multiplexity researchis offered by Yli-Renko and Autio (1998), in which “the actors’ resources arebound together by activities, which form the links between the [entrepreneur]and the other actors in the network” (p. 255). In this model, relationships involveactivities in which resources are put to use, exchanged or transformed, and areable to capture dyadic multiplexity, as for example in Yli-Renko’s later work(e.g., Grossman, Yli-Renko, and Janakiraman 2010). However, this model and itsassociated figure indicate an assumption that the activities and resources ineach relationship are independent of those in other relationships. Therefore, themodel does not meet Shipilov’s (2012) second key premise that relationships areinterdependent, and thus does not capture network multiplexity.
In order to capture multiplexity within and across relationships, wepropose an adaptation of Håkansson’s (1989) conceptual model. Slotte-Kockand Coviello (2010) also highlight this conceptual model as being useful toentrepreneurship scholars for studying network multiplexity and networkevolution, because it can be used to “understand change within relationshipsas well as across relationships and the impact of change on the wider network”(p. 46). Our adaptation clarifies what is meant by “actor”, “resource”, and“activity” in context of entrepreneurial networks, as visualized in Figure 1.Otherwise, the element types and their inter-connections are the same as inthe original model.
Håkansson’s “business networks” model was developed in the industrialmarketing literature (known as the IMP Group), and views networks as inte-grated systems of “actors linked together by their performance of complemen-tary or competitive […] activities, which implies that certain resources areprocessed as a result of other resources being consumed” (Håkansson 1989, 16,emphasis added). As later articulated in the IMP Group’s seminal summary of 30years of research based on the conceptual model, the “three [actor, resource,activity] layers are inter-connected: Each affects and is affected by the constella-tion of resources, pattern of activities and web of actors in the wider network”
Studying Multiplexity in Entrepreneurial Networks 5

(Håkansson et al. 2009, 33). Because of this layering of multiple actors,resources, and activities, the model is inclusive of dyadic and network multi-plexity. Over the next sections, we review the two dominant network perspec-tives, and use our representation of Håkansson’s model as a reference point fordiscussing the extent to which these perspectives integrate structure and flowelements, and thus network multiplexity.
2.3 The structural perspective
Structural studies tend to focus on the topology of interconnections betweenactors (e.g., Lechner, Dowling, and Welpe 2006; Rothaermel and Deeds 2006;Watson 2007), usually using quantitative SNA methods (Wasserman and Faust1994; Carrington, Scott, and Wasserman 2005). This structural focus is achievedby investigating one type of flow per actor, such as supplies (Uzzi 1996), bankloans (Uzzi 1999), R&D knowledge (Powell, Koput, and Smith-Doerr 1996; Al-Laham and Souitaris 2008), board member advice (Zaheer and Bell 2005), orjoint product development knowledge (Soh 2003). Structural studies haverevealed that favorable outcomes can be achieved by being in dense networks(Lorenzoni and Ornati 1988; Gnyawali and Madhavan 2001), larger networks
Actors (Who)Value creation oriented
network elements that can be defined by their activities or
roles. Includes the entrepreneur investors, customers, and suppliers
Activities (How)Network elements that transform and exchange
resources between actors.Includes financing,
manufacturing, licensing, and communicating.
Resources (What)Network elements used by
actors to carry out activities. Includes
physical, intellectual, and financial resources.
Network
Actors control resources. Resources
attract actors.
Actors perform activities. Activities
involve actors.
Structural Perspective
Flow Perspective
Activities transform or exchange resources. Resources enable or
inhibit activities.
Figure 1: Conceptual model of entrepreneurial networks (adapted from Håkansson 1989)
6 M.J. Bliemel et al.

(Watson 2007), by occupying central network positions (Soh 2003; Al-Lahamand Souitaris 2008), and bridging multiple unconnected parties (Burt 1992;Zaheer and Bell 2005).
This perspective and its reductionist focus on one type of flow at a time maybe rationalized by empirical observations that “entrepreneurs tend to label theireconomic exchange partners and classify them according to the main benefitthat the partner provides” (Lechner, Dowling, and Welpe 2006, 529). However,by focusing only on who is connected to whom, and by being imprecise aboutthe diversity of the their flows and interconnections thereof, such a reductionistrationalization inhibits exploring many research question related to networkmultiplexity and the evolution of the entrepreneurial networks. In comparisonto our conceptual model, this perspective only considers the portion containedin the upper dotted ellipse (Figure 1).
To visualize the structural perspective, Figure 2 shows two simplified entre-preneurial networks: one in which the entrepreneur (E) is connected to 4 investors(I) who are involved in financing the entrepreneur’s venture (Figure 2(a)) and onewith 5 customers (C) who are buying the entrepreneur’s products (Figure 2(b)).Each type of flow (financing vs. buying) is treated as an entirely separate network,and thus represented across two separate network figures. In reality, an entrepre-neur’s need to access venture capital is interdependent on the revenues they cangenerate. Overall, the structural perspective takes multiplexity for granted, andthus misses at least half of the story of how entrepreneurial networks function andevolve.
2.4 The flow perspective
The flow perspective acknowledges that entrepreneurs combine a diverse set ofresources (e.g., Hoang and Antoncic 2003; Lechner and Dowling 2003; Francoand Haase 2011) but is limited to studying each relationship separately (e.g.,Larson 1991; Yli-Renko, Sapienza, and Hay 2001; Hite 2005). Methodologically,flow studies tend to use qualitative methods such as ethnography and case
C1C2C3C4C5
E
I1I2I3I4
E
Legend:E: EntrepreneurI: InvestorC: Customer
Investor network:(a) (b)
Customer network:
Figure 2: Structural perspective (simplified examples)
Studying Multiplexity in Entrepreneurial Networks 7

study analysis to examine the interactions of flows within individual relation-ships and their evolution (e.g., Larson 1991; Hite 2003, 2005). They are limited intheir ability to systematically capture the structural context and patterns ofinteractions across relationships (see Lorenzoni and Lipparini 1999 for a notableexception). In essence, this perspective assumes away the surrounding structureof the network to focus on the elements in the lower dotted ellipse of ourconceptual model (Figure 1).
Figure 3 visualizes two separate relationships using the flow perspective:one investor relationship and one customer relationship. Each of these relation-ships involves multiple interacting flows, described by the resources and activ-ities mentioned in the figures. Even though some of the elements are commonacross both relationships (e.g., entrepreneur and cash), this perspective treatseach relationship separately and is therefore best represented as two figures.Despite this separation, the flow perspective has the potential to be extended tostudy network multiplexity by recognizing actors, resources, and activities thatare common across multiple relationships.
2.5 The configuration theory perspective
The configuration theory perspective posits that organizational systems are“composed of tightly interdependent and mutually supportive elements suchthat the importance of each element can best be understood by making referenceto the whole configuration” (Miller and Friesen 1984, 1). We relax the assump-tion of “tight” interdependence by recognizing that there are varying degrees towhich elements are directly interdependent, and that elements may be indirectlyinterdependent via intermediate (directly interdependent) elements. This var-iance of interdependence is also recognized in Siggelkow’s (2002) detaileddescriptive analysis of the performance and evolution of the Vanguard Groupas a configuration. In this study, Siggelkow “treated organizational systems asnetworks consisting of nodes (organizational elements) and connecting edges
CEILegend:E: EntrepreneurI: InvestorC: Customer
cash, businessadvice
cash, reviews
financing, equity buying, products
(a) (b)Investor relationship:
E
Customer relationship:
Figure 3: Flow perspective (simplified examples)
8 M.J. Bliemel et al.

(interactions)” (2002, 134), and specifically investigated the degree to whichelements were more or less “core”.
We apply the configuration theory perspective to entrepreneurial networks,by simultaneously considering how both the structure and flow elementsinteract to develop holistic and coherent configurations (Meyer, Tsui, andHinings 1993; Snow, Miles, and Miles 2005). By holistic we mean that thenetwork is conceptualized as a single system of interacting elements – actors(structural perspective), activities, and resources (flow perspective) – as opposedto studying these elements in isolation. By coherent we mean that of thedifferent permutations and combinations of structure and flow elementsthat might be hypothetically possible, only a fraction will be viable and inter-esting. The theoretical value in discovering holistic and coherent imagesof networks as configurations is that their attributes are associated withinternal consistency and external fit. These attributes are, in turn, related toviability and effectiveness (Miller and Friesen 1984; Meyer, Tsui, and Hinings1993).
Such holism and coherence of entrepreneurial networks and their networkmultiplexity has “important conceptual, evolutionary or normative implications”(Miller 1996, 507). The evolutionary implications are particularly important,because entrepreneurial networks have high levels of dynamism (e.g., Elfringand Hulsink 2007; Jack, Dodd, and Anderson 2008; Jack et al. 2010), largelybecause entrepreneurs need to access different resources over time (Lechner,Dowling, and Welpe 2006; Rothaermel and Deeds 2006; Watson 2007). Bythinking through the implications of network multiplexity, entrepreneurs canholistically explore potential synergies or conflicts with other relationships intheir network such that the network as a whole remains viable, effective, andcoherent.
Building on the previous example in Figures 2 and 3, we can visualize thesame simplified network as overlapping sets of interacting elements (Figure 4(a))or as interconnected polyhedra (Figure 4(b)) (see also Johnson 1990a for similarexamples). These visualizations draw out which elements are common acrossrelationships and are therefore more “core” to the overall network. These com-mon elements form the basis on which to investigate network multiplexity, andidentify (structure and flow) elements through which changes propagatethroughout the network.
Unlike (quantitative) structural studies or (qualitative) flow studies, config-urational studies usually employ set-theoretic methods (Ragin 2000; Fiss 2007,2011) to “express complicated and interrelated relationships among many vari-ables without resorting to artificial oversimplification of the phenomenon ofinterest” (Dess, Newport, and Rasheed 1993, 776). Standard set-theoretic
Studying Multiplexity in Entrepreneurial Networks 9

methods are appropriate if the entire configuration can be described by a singleset of elements that are tightly interdependent. Networks, however, consist ofmultiple sets of actors and relationships, which may not all interact directly, andthus limiting the utility of standard set-theoretic methods.
Overall, we find that Håkansson’s (1989) conceptual model, the configura-tion theory perspective, and set-theoretic methods are well suited to studyingnetworks as multiple overlapping sets of interacting elements. Methodologicallywe reach beyond standard set-theory methods, and introduce the Q-Analysismethod (Atkin 1974), also a set-theoretical method, and demonstrate its applica-tion to network multiplexity research.
3 The Q-analysis method
Set-theoretic methods have been proposed to study organizational configurationsand enable systematic and repeatable description of complex organizationalforms, including comparison of these descriptions across cases for cross-sectionalor inter-temporal comparison. However, standard set-theoretic methods reduce
equity
investors
businessadvice
financing
entrepreneur
cash
buying
products
reviews
customers
(a)
(b)
reviews
customersinvestors
products
cash
equity entrepreneur
financing
businessadvice buying
Figure 4: (a) Configuration theory perspective (simplified example visualized as a Venndiagram) (b) Configuration theory perspective (simplified example visualized as polyhedra)
10 M.J. Bliemel et al.
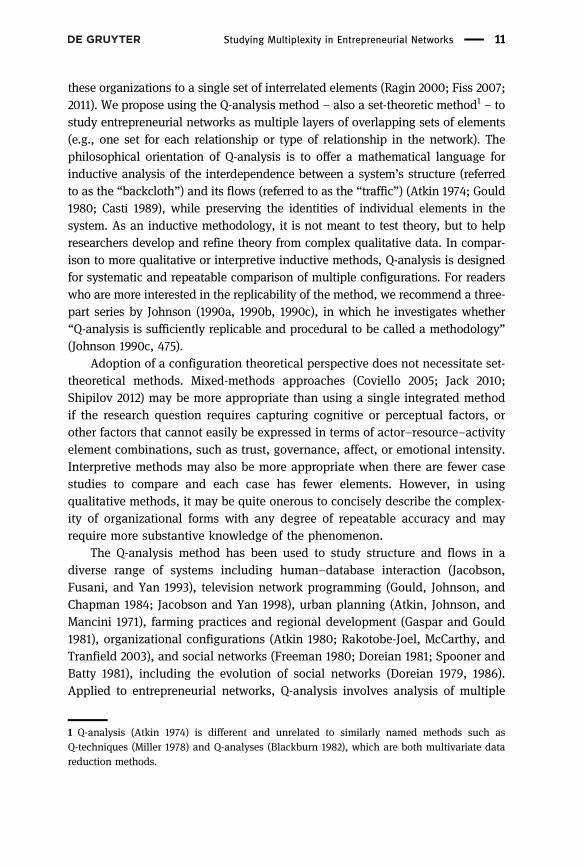
these organizations to a single set of interrelated elements (Ragin 2000; Fiss 2007;2011). We propose using the Q-analysis method – also a set-theoretic method1 – tostudy entrepreneurial networks as multiple layers of overlapping sets of elements(e.g., one set for each relationship or type of relationship in the network). Thephilosophical orientation of Q-analysis is to offer a mathematical language forinductive analysis of the interdependence between a system’s structure (referredto as the “backcloth”) and its flows (referred to as the “traffic”) (Atkin 1974; Gould1980; Casti 1989), while preserving the identities of individual elements in thesystem. As an inductive methodology, it is not meant to test theory, but to helpresearchers develop and refine theory from complex qualitative data. In compar-ison to more qualitative or interpretive inductive methods, Q-analysis is designedfor systematic and repeatable comparison of multiple configurations. For readerswho are more interested in the replicability of the method, we recommend a three-part series by Johnson (1990a, 1990b, 1990c), in which he investigates whether“Q-analysis is sufficiently replicable and procedural to be called a methodology”(Johnson 1990c, 475).
Adoption of a configuration theoretical perspective does not necessitate set-theoretical methods. Mixed-methods approaches (Coviello 2005; Jack 2010;Shipilov 2012) may be more appropriate than using a single integrated methodif the research question requires capturing cognitive or perceptual factors, orother factors that cannot easily be expressed in terms of actor–resource–activityelement combinations, such as trust, governance, affect, or emotional intensity.Interpretive methods may also be more appropriate when there are fewer casestudies to compare and each case has fewer elements. However, in usingqualitative methods, it may be quite onerous to concisely describe the complex-ity of organizational forms with any degree of repeatable accuracy and mayrequire more substantive knowledge of the phenomenon.
The Q-analysis method has been used to study structure and flows in adiverse range of systems including human–database interaction (Jacobson,Fusani, and Yan 1993), television network programming (Gould, Johnson, andChapman 1984; Jacobson and Yan 1998), urban planning (Atkin, Johnson, andMancini 1971), farming practices and regional development (Gaspar and Gould1981), organizational configurations (Atkin 1980; Rakotobe-Joel, McCarthy, andTranfield 2003), and social networks (Freeman 1980; Doreian 1981; Spooner andBatty 1981), including the evolution of social networks (Doreian 1979, 1986).Applied to entrepreneurial networks, Q-analysis involves analysis of multiple
1 Q-analysis (Atkin 1974) is different and unrelated to similarly named methods such asQ-techniques (Miller 1978) and Q-analyses (Blackburn 1982), which are both multivariate datareduction methods.
Studying Multiplexity in Entrepreneurial Networks 11
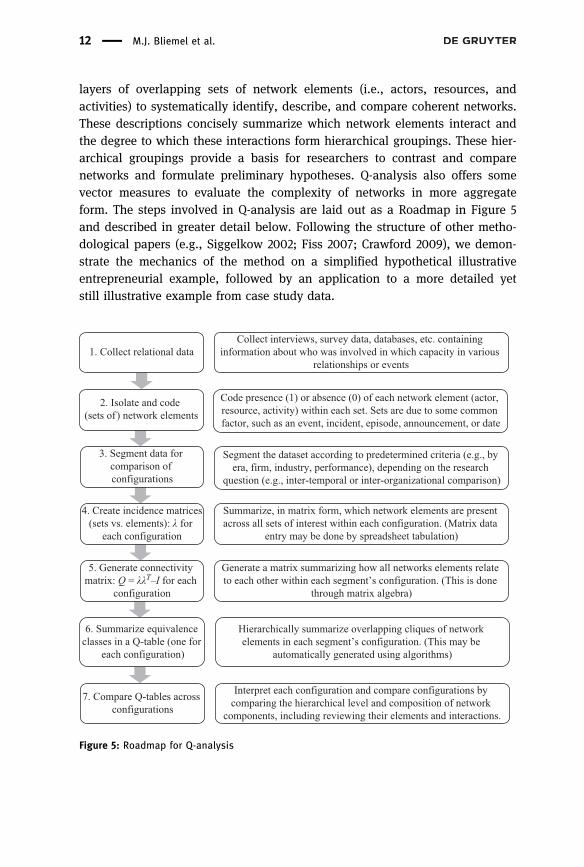
layers of overlapping sets of network elements (i.e., actors, resources, andactivities) to systematically identify, describe, and compare coherent networks.These descriptions concisely summarize which network elements interact andthe degree to which these interactions form hierarchical groupings. These hier-archical groupings provide a basis for researchers to contrast and comparenetworks and formulate preliminary hypotheses. Q-analysis also offers somevector measures to evaluate the complexity of networks in more aggregateform. The steps involved in Q-analysis are laid out as a Roadmap in Figure 5and described in greater detail below. Following the structure of other metho-dological papers (e.g., Siggelkow 2002; Fiss 2007; Crawford 2009), we demon-strate the mechanics of the method on a simplified hypothetical illustrativeentrepreneurial example, followed by an application to a more detailed yetstill illustrative example from case study data.
1. Collect relational data
2. Isolate and code (sets of) network elements
3. Segment data for comparison of configurations
4. Create incidence matrices(sets vs. elements): λ for
each configuration
5. Generate connectivity matrix: Q = λλT–I for each
configuration
6. Summarize equivalence classes in a Q-table (one for
each configuration)
7. Compare Q-tables across configurations
Collect interviews, survey data, databases, etc. containing information about who was involved in which capacity in various
relationships or events
Code presence (1) or absence (0) of each network element (actor, resource, activity) within each set. Sets are due to some common factor, such as an event, incident, episode, announcement, or date
Segment the dataset according to predetermined criteria (e.g., by era, firm, industry, performance), depending on the research
question (e.g., inter-temporal or inter-organizational comparison)
Summarize, in matrix form, which network elements are present across all sets of interest within each configuration. (Matrix data
entry may be done by spreadsheet tabulation)
Generate a matrix summarizing how all networks elements relate to each other within each segment’s configuration. (This is done
through matrix algebra)
Hierarchically summarize overlapping cliques of network elements in each segment’s configuration. (This may be
automatically generated using algorithms)
Interpret each configuration and compare configurations by comparing the hierarchical level and composition of network
components, including reviewing their elements and interactions.
Figure 5: Roadmap for Q-analysis
12 M.J. Bliemel et al.

3.1 Data collection
Data on the elements and sets that compose entrepreneurial networks may becollected in the form of qualitative or quantitative sources. Qualitative datasources include “texts” (Corbin and Strauss 1990; Ryan and Bernard 2003),with each text defining the boundaries of each sub-set of network elements.For example, texts may include individual press releases about strategic alli-ances (e.g., extracted from ReCap, BioScan, or SDC databases), with eachstrategic alliance announcement being coded for the various actors, resources,and activities that are involved. Need be, coding would include the date of thepress release for later segmentation for inter-temporal or longitudinal compar-ison. Texts might also be the researcher’s own observations from experiments,as done in Jacobson et al.’s (Jacobson, Fusani, and Yan 1993) Q-analysis ofstructured interviews of users’ interactions with a database, whereineach observation record contained a combination of “traffic” and “backcloth”elements. Data may also be collected from more direct quantitative sourcessuch as name-generator surveys from SNA methods (Wasserman and Faust1994). These surveys elicit itemized lists of which (present or absent) combina-tions of elements constitute each relationship and thus do not require additionalcoding.
To explain the method, we re-use the data from the same simplified exampleused to illustrate the configuration theory perspective in Section 2.4. In thispaper, it is more important to provide illustrative examples that allow readers toreadily follow every step in the analysis, than it is to provide a large scaledetailed empirical analysis of a phenomenon or derive propositions. In thenext major section of the paper, we demonstrate the method by drawing onempirical data from three case study papers about the same firm, from which weextract 14 elements that describe three types of relationships and their evolutionover two time periods.
3.2 Coding elements and sets
The next step in the process is to code the source data to identify each of thenetwork elements and their occurrence in sets. Therefore, this step is somewhatinterdependent on the research design and data sources and involves somesubjectivity or substantive knowledge relevant to the research question.Directly analogous to Fiss’ (2007, 2011) repeated caution that the substantiveknowledge and theoretical interests of the researcher will guide which sets to
Studying Multiplexity in Entrepreneurial Networks 13

sample across and which elements to include in those sets, Johnson cautionsthat “information is implicit in the interpreter and does not exist in the datafiles: the interpretation depends on the person interpreting and his or her priorknowledge” (1990b, 278, emphasis original). In order to explain the mechanics ofthe method and its application for network multiplexity research, we do notrequire significant subjective knowledge and can use the simplified illustrativedata in Figure 4(a). No further coding is required since this figure already clearlyidentifies which network elements comprise each of the two sets.
To control for subjectivity in the coding process and to attain inter-coderreliability, coding schemes may be compared among researchers on the sameproject (Jacobson, Fusani, and Yan 1993). Coding may also be an iterativeprocess, in which one begins with a tentative coding scheme, reviews theresults, and then decides if the coding scheme requires further revision anditeration (Johnson 1990a, 1990b). If SNA-like name-generator surveys are used,then each actor mentioned in the survey may include questions about resourcesand activities involved in each relationship, so that both structure and flows arecaptured by the survey. Alternatively, using the same name-generator surveymethods, the resource or activity may be pre-specified, to query for which set ofactors they involve (see: Lazega and Pattison 1999 or Cross, Borgatti, and Parker2001 for rare examples of layering of up to five types of communication flowswithin organizations).
In general, elements in each set need not be exclusive to that set; setoverlap is, after all, a central feature of the Q-analysis method. However, eachelement and set should be distinct (Johnson 1990b, 1990c). For example, if onewere to draw on the BioScan Directory as a data source, one could treat eachstrategic alliance or merger announcement as a distinct set, and code for whichfirms (actors) were involved, and code-specific products, IP or other keyresources mentioned, including coding each activity involved. In comparison,if one were to draw on USPTO data, then resource and activity elements may belimited to just “patents” and “patenting”, while each patent may be codedaccording to the inventor and assignee names (actors) mentioned on eachpatent.
Further nuances exist in determining the degree to which network elementsoccur in each set: researchers must decide between a crisp or fuzzy set approach(Ragin 2000; Fiss 2007, 2011). In all examples in this paper, we use crisp sets,with the binary value “1” to indicate that a network element is related to theother network elements in the same set, and the value “0” to indicate when anetwork element is not part of that set. Fuzzy sets, on the other hand, usethreshold measures to specify the extent to which each element occurs in each
14 M.J. Bliemel et al.

set (Ragin 2000; Fiss 2007, 2011). In the Q-analysis terminology, this threshold iscalled the slicing parameter (Atkin 1974; Johnson 1981).
3.3 Dataset segmentation
As demonstrated by Siggelkow (2002), there is value in describing individualconfigurations; more so, in describing and comparing multiple configurations,and exploring research questions regarding their variation (relative), perfor-mance, and evolution. Q-analysis lends itself to descriptive research aboutindividual configurations, as well as to systematic comparative analysis ofgroups of similar configurations. Comparative analysis requires segmentationof the dataset and is, in principal, similar to Qualitative Comparative Analysis(QCA) (Fiss 2007, 2011), which uses standard set-theoretic methods.
Segmentation of the dataset should be aligned with the focus of the study.For descriptive or cross-sectional studies, the dataset may be segmented basedon specific elements within the dataset (e.g., Gaspar and Gould 1981). For inter-temporal or longitudinal studies, the dataset may be segmented into individualperiods or eras (e.g., Siggelkow 2002). To control for relationship decay rates,multiple eras may be combined using “sliding” or “expanding” windows(Doreian 1979, 1986) to analyze fixed duration or cumulative duration time-spans, respectively. For causal inquiry, one might segment the dataset basedon a dependent variable (e.g., Jacobson, Fusani, and Yan 1993). In our explana-tion of Q-analysis (Section 3), we will perform descriptive Q-analysis on only thesimplified illustrative configuration. This is followed by our demonstration ofQ-analysis (Section 4), including inter-temporal comparison to describe theevolution of an illustrative case study from the literature.
3.4 The incidence matrix (λ)
Each data segment is summarized in an incidence matrix, λ, which identifieswhich network elements (m rows) occur in which sets (n columns). In ourdescriptive analysis of the simplified example, we only have one incidencematrix with two sets of elements (2 columns): one representing the financingrelationships and the other representing the selling relationships. These types ofrelationships are represented in the columns in the incidence matrix shown inTable 1. We have deliberately arranged the elements (rows) and color-coded thesets such that the co-occurrence of the entrepreneur and cash elements across
Studying Multiplexity in Entrepreneurial Networks 15

both sets is more obvious. Mathematically, the order of the rows or columnsdoes not actually matter.
The incidence matrix is an input to Q-analysis and not meant to be inter-preted, per se. However, for small matrices like the one in Table 1, it may alreadybe possible to interpret the matrix regarding interactions of elements within andacross sets (i.e., dyadic and network multiplexity), especially if the elements andsets are neatly arranged and color-coded, as above. For instance, the financingrelationships (left column) show three flow elements that interact within thoserelationships: business advice, equity, and cash. Similarly, reviewing the rowsreveals one flow element that interacts across types of relationships: cash. Dueto these interactions, we can deduce that changes in equity may trigger changesin cash within the financing relationships, which may in turn affect cash flows inthe selling relationships and thus also change the need to sell products.Structurally, because the entrepreneur is the only actor occurring across bothcolumns, we can deduce that they are the main person to coordinate thesenetwork multiplexity effects. In Q-analysis terms, such changes in flows are“transmitted” (Johnson 1990a) throughout the system, because only some ele-ments directly interact within or across relationships, but cause other elementsto indirectly interact throughout the network. While such interactions withinand across relationships (i.e., dyadic and network multiplexity) are visuallyevident in such a simple, color-coded, and well-organized incidence matrix,they are usually not brought to light until Step 6.
Table 1: Incidence matrix (simplified example)
16 M.J. Bliemel et al.

3.5 The connectivity matrix (Q-matrix)
To systematically analyze how all the elements in the network directly andindirectly interact, this step involves converting the m by n incidence matrix(λ) into an m by m connectivity matrix, or Q-matrix. This matrix summarizes theinteractions between all elements and is analogous to “influence matrices” incomplex systems analysis (Rivkin and Siggelkow 2003). The connectivity matrixis calculated as Q ¼ λλT �M, where M is an m by m matrix with 1s in every cell.2
The values in the connectivity matrix provide two key pieces of informationwith which to systematically generate and summarize hierarchical groupings ofinteracting elements (as done the next step in the analysis). First, the values onthe main diagonal indicate the dimension levels (or q-levels) of each element andmay be used as a measure of element core-ness (Siggelkow 2002). These valuesindicate the number of additional sets that each element occurs across, otherthan the first set in which it appears. For instance, a value of zero indicatesoccurrence in a single set, with no overlapping sets.
Second, the values in the off-diagonal cells represent the dimension levels ofthe interaction between any two elements. These values indicate how many setsa given element-pair has in common (minus one). A zero in the off-diagonal cellof the connectivity matrix indicates that the two elements co-occur and interactin only one set. If no interaction occurs between a pair of network elements, thisis indicated by a “–” in the appropriate cell in the connectivity matrix.
Like the incidence matrix, the connectivity matrix only represents an inter-mediate step in the Q-analysis and is also not meant to be interpreted, per se.Nonetheless, it may also reveal network multiplexity patterns, especially if theelements and sets are neatly arranged and color-coded, as in the connectivitymatrix for simplified example (Table 2). As before, the elements that directlyinteract within the financing relationships (q-level 0) are shaded yellow, and theelements that directly interact within the buying relationships (q-level 0) areshaded blue. Additionally, the two elements that directly interact across bothtypes of relationships (cash and entrepreneur) are shaded green (q-level 1).Through this direct interaction across both types of relationship, all the otherelements indirectly interact.
2 This algebraic data transformation is virtually identical to the matrix algebra used in 2-modeSNA (Faust 1997; Borgatti and Everett 1997; Borgatti 2009), with the additional step of subtract-ing 1 from the value in every cell. Q-analysis is different from 2-mode SNA in that SNA is focusedon the structure and does not integrate the flow perspective.
Studying Multiplexity in Entrepreneurial Networks 17

3.6 Equivalence classes and the Q-table
The final computational step in Q-analysis is to identify equivalence classes.3
Equivalence classes summarize how elements group together into networkcomponents at a given dimension level. Each equivalence class represents amutually exclusive set of network elements in which all the elements directly orindirectly interact with all other elements in the same equivalence class, accord-ing to the dimension level of their interaction in the connectivity matrix.Consistent with Siggelkow’s (2002) notion of core-ness, equivalence classesform the core components of the overall network, and the elements that bringsub-components together are themselves more core than the other elements inthe same component. For example, a core actor (e.g., the entrepreneur or a keyinvestor) may bring a portion of the network together. Similarly, it may be a coreresource or activity that brings together a portion of the people in the network.Lastly, it may even be a combination of equally core actors, resources, andactivities that brings other sub-components together to form networkcomponents.
Table 2: Connectivity matrix (simplified example)
3 Equivalence classes are distinct from structural equivalence (Burt 1987), which occurs whenany two actors are connected to all other actors in the rest of the network in the same way.
18 M.J. Bliemel et al.

Sub-components consist of elements that all directly interact with each otherto form “cliques” (Luce and Perry 1949; Knoke and Kuklinski 1982). The termclique denotes a set of actors who are all interconnected and may be generalizedhere to denote a set of elements that all interact. A change in one elementdirectly affects all other elements in the same clique. When multiple cliquespartially overlap and are brought together via common elements, these cliquesform a q-chain. Each equivalence class consists of one q-chain, consisting of oneor more cliques. Due to the overlapping elements that chain cliques together, theother elements in those cliques all indirectly interact, and changes may propa-gate throughout the equivalence class via the overlapping elements.
Equivalence classes occur at each dimension level at which elements andtheir interactions exist and are tabulated by dimension level in what is called theQ-table. At higher dimension levels, there are likely to be fewer elements thatinteract and form smaller overlapping cliques and equivalence classes, even-tually encompassing only the most core elements and interactions.4 At lowerdimension levels, these equivalence classes may begin to merge into largerequivalence classes, eventually encompassing all the elements in the networkinto a single equivalence class.
For each dimension level (i.e., each row in the Q-table), the mutuallyexclusive sets of elements that comprise each equivalence class are containedwithin curly brackets – {}. More detailed Q-tables also summarize each cliquewithin each equivalence class, contained within angle brackets – < > (Johnson1990a). Higher dimensional equivalence classes indicate that changes maypropagate faster and further, since the elements in the equivalence classco-occur with more other elements. The occurrence of multiple equivalenceclasses at any given dimension level indicates fragmentation into multiple net-work components.5 Equivalence classes with few large cliques indicate a higherdegree of dyadic multiplexity.6 In contrast, equivalence classes with many(smaller) cliques indicate a higher degree of network multiplexity.
4 Q-analysis also includes an “eccentricity” measure at the element level, which describes thedegree to which an element is more core than the next element to which it is connected (Casti1989). Eccentricity values of zero indicate structural equivalence of a given element with theother elements to which it is connected. Non-zero values indicate that the element causesoverlap of multiple cliques (i.e., the element causes network multiplexity).5 Mathematically, the maximum number of equivalence classes is equal to the number of sets(columns) in the incidence matrix and would occur if there were no overlap across any sets, i.e.,flows and actors are completely independent across relationships.6 The maximum size equivalence class in terms of elements, is equal to the number of elements(rows) in the incidence matrix, and would occur if all elements occurred within at least one set.
Studying Multiplexity in Entrepreneurial Networks 19

Assembling elements into equivalence classes to summarize them in the Q-table usually begins by reviewing the connectivity matrix (Table 2) for elementsthat interact at the highest available dimension level. For our simplified exam-ple, we have already foreshadowed that the highest value is 1, at which theentrepreneur–cash clique exists, followed by the two overlapping cliques atdimension level 0. Scanning the cells of Table 2 for 1s (shaded in green), weindeed see that the entrepreneur and cash elements directly interact and thusform a clique at this dimension level. Since no other elements or interactionsoccur at this dimension level, it is the only clique and also the only equivalenceclass at dimension level 1. Performing the same scan at dimension level 0 (andhigher), we see that there are two overlapping cliques, with each clique repre-senting the financing relationships (highlighted by the yellow and green shadedcells) or the buying relationships (highlighted by the blue and green shadedcells), and the overlap occurring due to the entrepreneur, and cash elements. Asa result of this overlap, the non-overlapping elements in both the cliques allindirectly interact, and these two cliques form a single equivalence class atdimension level 0. Since no other elements occur in the network, this is theonly equivalence class at dimension level 0.
The equivalence classes, their level, and composition for this simplifiedexample are summarized in the Q-table below (Table 3). As foreshadowed dueto the arrangement and color-coding of the cells in the incidence and connec-tivity matrices, the Q-table uses the elements’ identities to spell out how changesin the flow of equity and advice from investors affect the cash available to theentrepreneur, which in turn affects the need to generate cash by selling productsaccording to the reviews from customers. As stylized here, the indirect interac-tions enable changes in flows to propagate throughout the entire network, withthe changes being propagated via the cash and entrepreneur elements.
The second and third columns of Q-table contain two vectors that describe thefragmentation of the network structure across all dimension levels. The firstvector, the structure vector (Q), is a count of how many equivalence classes (i.e.,mutually exclusive components) there are at each dimensional level. Network
Table 3: Q-table (simplified example)
q-level Q Q* Equivalence classes
1 1 0 {<entrepreneur, cash>}0 1 0 {<business advice, investors, financing, equity, entrepreneur,
cash>, <entrepreneur, cash, products, reviews, customers, buying>}
20 M.J. Bliemel et al.

fragmentation is associated with communication failures (Gargiulo and Benassi2000), strategies to control flows (Emerson 1962; Burt 1992), and differences inoverall network performance (Labianca and Brass 2006; Oh, Labianca, andChung 2006). The second vector is the obstruction vector (Q*), which is avariation of the structure vector, in that it counts the number of obstructionsbetween the equivalence classes at each dimension level. The obstruction vectoris calculated by simply subtracting the unit value 1 from the structure vector ateach dimension level. Flows cannot propagate between components at thedimension level because of obstructions, called q-holes, which are conceptuallyanalogous to structural holes (Burt 1992), but more specific about which dimen-sion level they occur at. The Q-table for the simplified example (Table 3) has astructure vector consisting entirely of 1s, indicating that the network is cohesiveand not fragmented at any level, i.e., the flows are interdependent throughoutthe entire network. Overall, Q-tables are hierarchical summaries of interactingelements and identify precisely which elements are the sources of networkmultiplexity across a range of (dimension or core-ness) levels for the entireconfiguration. These summaries then form the basis for comparison of config-urations, as explained in the next step.
On a practical note, Q-tables may be constructed systematically using aniterative approach and assisted by computer algorithms. For every dimensionlevel, the values in a diagonal cells are reviewed to identify elements at or abovethe given dimension level. Starting with these elements, further investigation ofthe off-diagonal cells is required as to which other elements they interact with atthat same level (or higher). This usually requires an iterative search for allpossible combinations of cliques and equivalence classes, which may be auto-mated using clique-listing algorithms (e.g., Bron and Kerbosch 1973; Pardalosand Rogers 1992; Harley 2004). Such algorithms save significant time whenanalyzing larger datasets7 and are limited only by the researcher’s ability tocollect and code data and by the computational power to manipulate thematrices and produce the summary tables.8 We believe Q-analyses of largerdatasets and more complex configurations have remained rare because themechanics of the method are not well articulated and because algorithms forQ-analysis are not broadly accessible beyond those written in outdated program-ming languages (e.g., Mullins 1976 or Tutzauer 1993).
7 The authors may be contacted for their Q-analysis algorithm for Visual Basic in MicrosoftExcel™.8 The computational resource requirements increase geometrically with the number of ele-ments involved.
Studying Multiplexity in Entrepreneurial Networks 21

3.7 Comparison of Q-tables
A key strength of Q-analysis is the way in which Q-tables provide structureddescriptions of configurations, their components, and elements, while preser-ving the qualitative labels of all the elements. These rich descriptions may beused to contrast and compare cases in a cross-sectional manner, or longitudin-ally across time periods. As the number of elements and interactions increase(e.g., as with larger datasets and segments containing multiple cases), so doesthe maximum dimension level in each Q-table. To make Q-tables with differentmaximum dimension levels comparable, the dimension levels may be normal-ized by the maximum dimension level of each Q-table. This normalization thenexpresses the dimension level (e.g., core-ness) of each element, clique, orequivalence class in relative terms (Doreian 1979). See Gaspar and Gould(1981) for an excellent example of relative dimension levels, i.e., qrel-levels.
The simplified illustrative example is a single network and thus does notpresent an opportunity to compare multiple Q-tables. However, in the demon-stration below, we will construct and compare two Q-tables, one for each of twotime periods in the evolution of a single firm’s network.
4 A Q-analysis of Cambridge Display Technologies
Now that we have explained the mechanics of the Q-analysis method using asimplified illustrative example, we demonstrate the method using the CambridgeDisplay Technologies (CDT) case study (Maine and Garnsey 2006, 2007;Minshall, Seldon, and Probert 2007). The CDT case allows us to explore hownetwork multiplexity plays a role in their network over two time periods. For thiscase, the appropriate level of analysis to study network multiplexity is at thelevel of the entrepreneurial ego-network as represented by multiple simulta-neous key relationships, as also recently suggested by Shipilov (2012).
We use the CDT case to demonstrate the Q-analysis method for a number ofreasons. First, CDT is interesting because it is an advanced materials venture.This is a sector known for complex commercialization processes which arecontingent on mobilization of investors and strategic partners (Maine andGarnsey 2006, 2007). Second, CDT’s story involves a critical event in 2000 thatcaused a significant change in commercialization strategy and network. This(acquisition) event creates an opportunity to investigate the role of networkmultiplexity for both time periods and its role in the transformation. Third, theavailable case study data were sufficiently detailed to be able to identify
22 M.J. Bliemel et al.

individual actors, resources and activities, and their interactions. These articlesshould also be readily available to most readers of this article, thus enablingreconstruction of the present data and analysis from the source data, shouldreaders choose to do so. Lastly, on an andragogical note, the available data arecomplex enough to show interactions within and across relationships, and thussuited to studying network multiplexity, but simple enough to follow themechanics without hiding behind computer algorithms. We note here thatthere is significant potential for the proposed method in analyzing larger andmore complex datasets, as done by Gaspar and Gould (1981), Gould, Johnson,and Chapman (1984), or Jacobson, Fusani, and Yan (1993).
4.1 Data collection
Data about CDTs alliance portfolio pre- and post-acquisition in 2000 are fromMaine and Garnsey (2006, 2007) and Minshall, Seldon, and Probert (2007).These three articles comprehensively describe the evolution of both CDT andtheir entrepreneurial network.
4.2 Coding elements and sets
To maintain focus on demonstrating the method, we aggregate individual rela-tionships up to three stylized types of relationships – financing, licensing, andmanufacturing – as shown in Tables 4 and 5. Each type of relationship involvesa different set of multiple resources and activities. A more detailed analysis ofthis case study may have included naming each actor (including individualinvestors, licensees, and manufacturers), finer temporal segmentation (byyear), more specificity about resources (including individual patents, specificmaterials, or payments), and provided finer granularity of activities (includingspecific steps in the process of licensing, manufacturing or financing, such asbidding, negotiating, exchanging, maintaining, or dissolving).
Table 4: Types of relationships for CDT (1998–2000 segment)
Structure elements Flow elements
Type of relationship: actors Types of resources Types of activities
Financing: CDT & investors(e.g., CRIL, University, Genesis and Intel)
Equity, cash,reputation,
Financing
Licensing: CDT & licensees (e.g., Philips,Hoechst, Uniax, SEC, and HP)
IP, cash, materials,reputation
Licensing
Studying Multiplexity in Entrepreneurial Networks 23

4.3 Dataset segmentation
In order to demonstrate the method’s use for studying network evolution, wesegment the data into two time periods: pre- or post-acquisition. The acquisitionevent in 2000 marked a significant transition in available resources and networkconfiguration. Prior to the acquisition, CDT had four investors and five licenseesand was struggling to prove the viability of their IP and materials to thelicensees. After the acquisition (by Kelso and Hillman), the number of investorsincreased to six, and the number of licensees increased to seventeen.Importantly, the additional capital enabled adopting a manufacturing strategyby adding five manufacturers to the network, including their own.
4.4 Incidence matrices
Using the data in Tables 4 and 5, we create incidence matrices (λ) with the rowsmade up by the four actor elements (i.e., investors, licensees, manufacturers, andthe entrepreneur), seven resource elements (equity, cash, reputation, IP, materials,products, and advice) and three activity elements (financing, licensing, and manu-facturing). The columns in the incidence matrix represent the types of relationships(licensing, financing, and manufacturing).9 To make the matrices visually easier tocompare across both time periods, we make them the same dimensions byincluding all three types of relationships, as depicted in Tables 6 and 7,respectively. Adding a column of zeros for the manufacturing relationships in the
Table 5: Types of relationships for CDT (2001–2002 segment)
Structure elements Flow elements
Type of relationship: actors Types of resources Types ofactivities
Financing: CDT & investors (e.g., CRIL, University,Genesis, Intel, Kelso, and Hillman)
Equity, cash, reputation,advice
Financing
Licensing: CDT & licensees (e.g., Philips,Hoechst, Uniax, SEC, HP, and 12 more)
IP, cash, materials,reputation
Licensing
Manufacturing: CDT & manufacturers (e.g., Philips,MDC, Litrex, Opsys, and Osram)
IP, cash, products,materials
Manufacturing
9 Labels of the types of relationships represent their main purpose (Lechner, Dowling, andWelpe 2006), while acknowledging that each relationship actually involves more than a singlebenefit, resource, or activity.
24 M.J. Bliemel et al.

Table 6: CDT incidence matrix (1998–2000 segment)fin
anci
ng
licen
sing
man
ufac
turin
g �� Set(by Type of
Relationship)
Elements:1 1 0 entrepreneur1 0 0 investors1 0 0 equity1 0 0 financing1 1 0 cash
λ = 1 1 0 reputation0 1 0 licensees0 1 0 licensing0 1 0 IP0 1 0 materials0 0 0 advice0 0 0 manufacturers0 0 0 products0 0 0 manufacturing
Table 7: CDT incidence matrix (2001–2002 segment)
finan
cing
licen
sing
man
ufac
turin
g �� Set(by Type of
Relationship)
Elements:1 1 1 entrepreneur1 0 0 investors1 0 0 equity1 0 0 financing1 1 1 cash
λ = 1 1 0 reputation0 1 0 licensees0 1 0 licensing0 1 1 IP0 1 1 materials1 0 0 advice0 0 1 manufacturers0 0 1 products0 0 1 manufacturing
Studying Multiplexity in Entrepreneurial Networks 25
pre-acquisition incidence matrix has no impact on the mathematical transforma-tions or results.
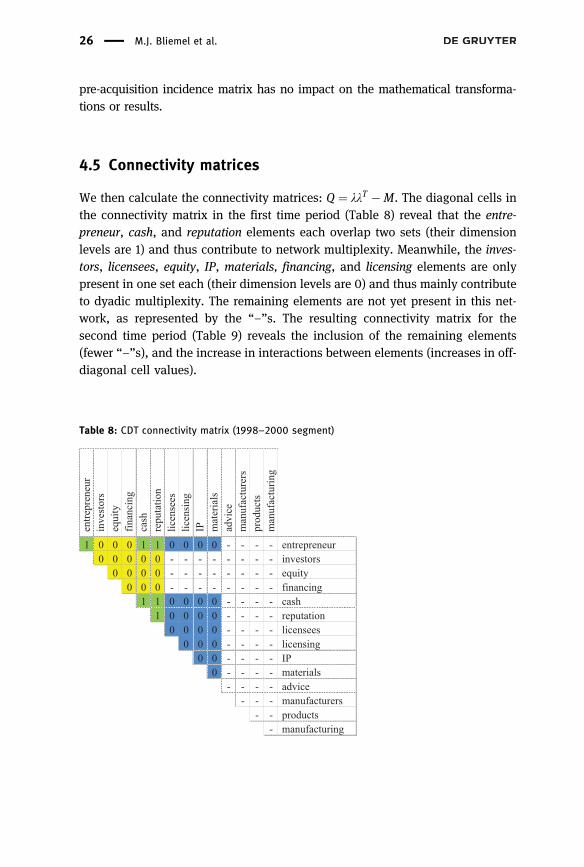
4.5 Connectivity matrices
We then calculate the connectivity matrices: Q ¼ λλT �M. The diagonal cells inthe connectivity matrix in the first time period (Table 8) reveal that the entre-preneur, cash, and reputation elements each overlap two sets (their dimensionlevels are 1) and thus contribute to network multiplexity. Meanwhile, the inves-tors, licensees, equity, IP, materials, financing, and licensing elements are onlypresent in one set each (their dimension levels are 0) and thus mainly contributeto dyadic multiplexity. The remaining elements are not yet present in this net-work, as represented by the “–”s. The resulting connectivity matrix for thesecond time period (Table 9) reveals the inclusion of the remaining elements(fewer “–”s), and the increase in interactions between elements (increases in off-diagonal cell values).
Table 8: CDT connectivity matrix (1998–2000 segment)
entre
pren
eur
inve
stor
seq
uity
finan
cing
cash
repu
tatio
nlic
ense
eslic
ensi
ngIP m
ater
ials
advi
cem
anuf
actu
rers
prod
ucts
man
ufac
turin
g
1 0 0 0 1 1 0 0 0 0 - - - -0 0 0 0 0 - - - - - - - - investors
0 0 0 0 - - - - - - - - equity0 0 0 - - - - - - - - financing
1 1 0 0 0 0 - - - - cash1 0 0 0 0 - - - - reputation
0 0 0 0 - - - - licensees0 0 0 - - - - licensing
0 0 - - - - IP0 - - - - materials
- - - -- - -
- - products- manufacturing
entrepreneur
advicemanufacturers
26 M.J. Bliemel et al.
4.6 Equivalence classes and Q-tables
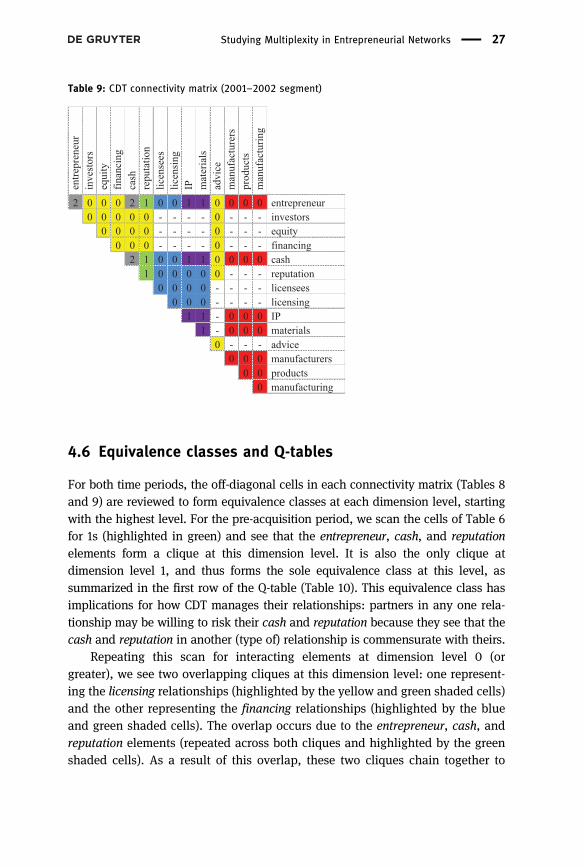
For both time periods, the off-diagonal cells in each connectivity matrix (Tables 8and 9) are reviewed to form equivalence classes at each dimension level, startingwith the highest level. For the pre-acquisition period, we scan the cells of Table 6for 1s (highlighted in green) and see that the entrepreneur, cash, and reputationelements form a clique at this dimension level. It is also the only clique atdimension level 1, and thus forms the sole equivalence class at this level, assummarized in the first row of the Q-table (Table 10). This equivalence class hasimplications for how CDT manages their relationships: partners in any one rela-tionship may be willing to risk their cash and reputation because they see that thecash and reputation in another (type of) relationship is commensurate with theirs.
Repeating this scan for interacting elements at dimension level 0 (orgreater), we see two overlapping cliques at this dimension level: one represent-ing the licensing relationships (highlighted by the yellow and green shaded cells)and the other representing the financing relationships (highlighted by the blueand green shaded cells). The overlap occurs due to the entrepreneur, cash, andreputation elements (repeated across both cliques and highlighted by the greenshaded cells). As a result of this overlap, these two cliques chain together to
Table 9: CDT connectivity matrix (2001–2002 segment)
entre
pren
eur
inve
stor
seq
uity
finan
cing
cash
repu
tatio
nlic
ense
eslic
ensi
ngIP m
ater
ials
advi
cem
anuf
actu
rers
prod
ucts
man
ufac
turin
g
2 0 0 0 2 1 0 0 1 1 0 0 0 00 0 0 0 0 - - - - 0 - - -
0 0 0 0 - - - - 0 - - -0 0 0 - - - - 0 - - -
2 1 0 0 1 1 0 0 0 01 0 0 0 0 0 - - -
0 0 0 0 - - - -0 0 0 - - - -
1 1 - 0 0 01 - 0 0 0
0 - - -0 0 0
0 00
investorsequityfinancingcashreputationlicenseeslicensingIPmaterials
productsmanufacturing
entrepreneur
advicemanufacturers
Studying Multiplexity in Entrepreneurial Networks 27

form one equivalence class. It is also the only equivalence class at dimensionlevel 0, as summarized in the second row in the Q-table (Table 10). Thisequivalence class provides greater detail regarding the how CDT manages theirrelationships. Changes in the flow of materials and IP in the licensing relation-ships may directly cause changes in the flows of cash and reputation in the sametype of relationship. These changes then affect the cash and reputation flows inthe financing relationships, and thus also affect how investors value their equitypositions in CDT. Such interactions within and across relationships reveal net-work multiplexity processes that are often overlooked in network research(Shipilov 2012) and can inform entrepreneurs about how to manage the functionand evolution of their networks.
4.7 Comparison of Q-tables
In comparing CDT’s Q-tables across both time periods (Tables 10 vs. 11), we seethat the network is more multiplex in the second time period, driving the needfor more complex stakeholder and flow management by the entrepreneur. Theincrease in network multiplexity is evident in (i) the higher maximum dimensionlevel (from 1 to 2), (ii) the larger equivalence classes, and (iii) the increase in thenumber of cliques and elements per equivalence class.
Table 10: CDT Q-table (1998–2000 segment)
q-level Q Q* Equivalence classes
1 1 0 {<entrepreneur, cash, reputation>}0 1 0 {<entrepreneur, investors, equity, cash, reputation, financing>,
<entrepreneur, licensees, cash, reputation, IP, materials, licensing>}
Table 11: CDT Q-table (2001–2002 segment)
q-level Q Q* Equivalence classes
2 1 0 {<entrepreneur, cash>}1 1 0 {<entrepreneur, cash, reputation>, <entrepreneur, cash, IP, materials>}0 1 0 {<entrepreneur, investors, equity, cash, reputation, advice, financing>,
<entrepreneur, licensees, cash, reputation, IP, materials, licensing>,<entrepreneur, manufacturers, cash, IP, materials, products,manufacturing>}
28 M.J. Bliemel et al.

The labels of the elements in the Q-tables enable us to describe the increasein network multiplexity in qualitative terms. The acquisition included advice inthe financing relationships, and the addition of the manufacturing relationships.More specifically, the manufacturing relationships included IP and materialsflows which interacted with the licensing relationships. The manufacturing rela-tionships also contributed to an increase in the importance of cash flows acrossall relationships.
5 Discussion
We acknowledge that learning a new method may be daunting. In this explana-tion and demonstration of the Q-analysis method, we have drawn parallels toother methods with which many readers will already be familiar. The mostsignificant effort required with this method should be in collecting the dataand interpreting the results, since software algorithms, once developed, can beused to manipulate the matrices and automatically produce the Q-tables. Weposit that the real value of the Q-analysis method is in concisely describing andanalyzing massively complex systems, as exemplified by Gaspar and Gould(1981), Gould, Johnson, and Chapman (1984), or Jacobson, Fusani, and Yan(1993). For this paper, we felt that analysis of a larger dataset and use of asoftware algorithm would distract from explanation of the method and be toocomplicated to follow as a demonstration of the method.
The proposed integrated approach provides theory development opportu-nities regarding network multiplexity and evolution. While network multiplexityresearch is lacking in management (Shipilov 2012) and many other fields(Johnson 1990b), it is especially important to entrepreneurship when one con-siders that the essence of entrepreneurship is carrying out new combinations(Schumpeter 1934) of elements that are predominantly external to the venture.We thus see a key research opportunity in the identification of entrepreneurialnetwork configurations which are described by both structure and flow condi-tions. These descriptions may extend research on entrepreneurial network com-position (Lechner and Dowling 2003; Lechner, Dowling, and Welpe 2006) bybeing more precise about interactions within and across relationships. TheQ-tables spell out the dyadic and network multiplexity in qualitative detail inthe form of the hierarchically organized equivalence classes, containing cliquesand elements. They also provide some quantitative measures of multiplexity interms of the count, dimension level, and size of each equivalence class andclique. The proposed integrated approach thus provides a finer-grained analysis
Studying Multiplexity in Entrepreneurial Networks 29
of exactly which elements cause network multiplexity, which therefore enablesdevelopment of more accurate theory regarding outcomes, capabilities, or otherfactors that are affected by network multiplexity.
We also see research opportunities in the area of entrepreneurial networkevolution. Building on the above discussion about how network multiplexityaffects how networks function, and acknowledging that entrepreneurial net-works are particularly dynamic (e.g., Elfring and Hulsink 2007; Jack, Dodd,and Anderson 2008; Jack et al. 2010), it is practically essential to considernetwork multiplexity when exploring entrepreneurial network change. By com-paring multiple Q-tables, each representing a different time period, we can beginto understand how network multiplexity changes over time and can infer howchanges propagate across relationships and affect performance.
While an integrated approach has many merits (see also: Hoang andAntoncic 2003; Jack 2010; Slotte-Kock and Coviello 2010), it also has its ownlimitations. Compared to structure-only approaches, an integrated approachmay not have the same level of generality or be as universally portable acrosspopulations of organizations or settings. Compared to flow-only approaches, anintegrated approach may not capture the same level of detail at the level of theindividual actors or relationship, thus potentially omitting attributes of theactors (e.g., capabilities, cognition, or attitudes), and processes or causalmechanisms (Yli-Renko 2005; Vissa 2011). Empirical limitations exist, in thatthe quality of the analysis is dependent on the quality and completeness of thedata. In the above case, we have used secondary data sources that only revealsome of the myriad of connections CDT had in either time period. A systematicapproach to collecting primary data at multiple intervals may include modifyingname-generator surveys (e.g., Wasserman and Faust 1994) to include resourceand activity elements associated with each of the actors. Such (semi-)structureddata would then also benefit from more qualitative stories that can elaborate oncausal mechanisms at play across time periods.
The proposed approach, and in particular the conceptualization, also hasimplications for entrepreneurs. By adopting the proposed conceptualization ofnetworks as layers of multiple interrelated resources, entrepreneurs can makemore informed decisions about who to connect to. For example, in the illustrativecase above, the entrepreneur accepted capital from the acquirer to keep hisventure alive. The new capital enabled a dramatic change in the structure ofalliances and addition of manufacturing partnerships. However, the acquisitionalso meant that the founder lost control of ownership and left the venture. With amore nuanced conceptualization and analysis of the interactions of the cash, IPand actors involved, it is entirely conceivable that the entrepreneur may havechosen to pursue a different strategy to sustain their venture without an acquirer.
30 M.J. Bliemel et al.

6 Conclusion
Network-based studies are an important part of entrepreneurship research.However, we argue that prior research on entrepreneurial networks has beenlimited by applying a structure-only perspective or flow-only perspective, andthat these perspectives are individually are unable to analyze network multi-plexity and its effect on how networks function and evolve. In response, weintroduce an integrated approach for analyzing how structure and flow elementsof entrepreneurial networks interact, that is uniquely suited to network multi-plexity research.
The integrated approach presented here is built on a new combination ofHåkansson’s conceptual model, the configuration theory perspective, andAtkin’s Q-analysis method. Håkansson’s conceptual model is consistent withboth structural conceptualizations (e.g., who is connected to whom?) and rela-tional conceptualizations (e.g., how multiplex are individual relationships?). Theconfigurational perspective is also consistent with the structural perspective(e.g., combinations of actors) and the flow perspective (e.g., combinations ofresources and activities). Lastly, the Q-analysis method was specificallydesigned to study the structure (“backcloth”) and flows (“traffic”) of organiza-tional systems, including entrepreneurial networks. The conceptual model, the-oretical perspective and method all complement each other, and requireminimal adaptation to the entrepreneurial network context. Because the con-ceptual model and theoretical perspective are likely to resonate with or even befamiliar to entrepreneurial network researchers, our emphasis in this paper is onexplaining the component they are likely to be least familiar with: the Q-analysismethod. We posit that an integrated approach is an important step towardimproving our understanding of network multiplexity and its role in determininghow entrepreneurial networks function and evolve. While we have presentedarguments and demonstrated the method in the context of entrepreneurship,they also have relevance for other inter- or intra-organizational networks.
References
Al-Laham, A., and V. Souitaris. 2008. “Network Embeddedness and New-VentureInternationalization: Analyzing International Linkages in the German Biotech Industry.”Journal of Business Venturing 23(5):567–86.
Aldrich, H. E., H. Rosen, and W. Woodward. 1987. “The Impact of Social Networks on BusinessFoundings and Profit: A Longitudinal Study.” In Frontiers in Entrepreneurship Research,edited by N. Churchill, J. Hornaday, B. Kirchhoff, O. Krasner, and K. Vesper, 154–68.Wellesley, MA: Babson College.
Studying Multiplexity in Entrepreneurial Networks 31

Atkin, R. H. 1974. Mathematical Structure in Human Affairs. New York: Crane, Russak andCompany, Inc.
Atkin, R. H. 1980. “The Methodology of Q-Analysis: How to Study Corporations by UsingConcepts of Connectivity.” Management Decision 18(7):380–90.
Atkin, R. H., J. H. Johnson, and V. Mancini. 1971. “An Analysis of Urban Structure UsingConcepts of Algebraic Topology.” Urban Studies 8(3):221–42.
Birley, S. 1985. “The Role of Networks in the Entrepreneurial Process.” Journal of BusinessVenturing 1(1):107–17.
Blackburn, R. S. 1982. “Dimensions of Structure: A Review and Reappraisal.” Academy ofManagement Review 7(1):59–66.
Borgatti, S. P. 2009. “Social Network Analysis, Two-Mode Concepts.” In Encyclopedia ofComplexity and Systems Science, edited by R. A. Meyers, 8279–91. New York: Springer.
Borgatti, S. P., and M. G. Everett. 1997. “Network Analysis of 2-Mode Data.” Social Networks19(3):243–69.
Bron, C., and J. Kerbosch. 1973. “Algorithm 457: Finding All Cliques of an Undirected Graph.”Communications of the ACM 16(9):575–77.
Burt, R. S. 1987. “Social Contagion and Innovation – Cohesion versus Structural Equivalence.”American Journal of Sociology 92(6):1287–335.
Burt, R. S. 1992. Structural Holes. Cambridge, MA: Harvard University.Carrington, P. J., J. Scott, and S. Wasserman. 2005. Models and Methods in Social Network
Analysis. Cambridge, UK: Cambridge University Press.Casti, J. 1989. Alternate Realities – Mathematical Models of Nature and Man. New York: John
Wiley and Sons.Corbin, J., and A. Strauss. 1990. “Grounded Theory Research: Procedures, Canons, and
Evaluative Criteria.” Qualitative Sociology 13(1):3–21.Coviello, N. E. 2005. “Integrating Qualitative and Quantitative Techniques in Network Analysis.”
Qualitative Market Research: An International Journal 8(1):39–60.Coviello, N. E., and M. V. Jones. 2004. “Methodological Issues in International Entrepreneurship
Research.” Journal of Business Venturing 19(4):485–508.Crawford, G. C. 2009. “A Review and Recommendation of Simulation Methodologies for
Entrepreneurship Research.” SSRN eLibrary. Available at http://ssrn.com/abstract=1472113
Cross, R., S. P. Borgatti, and A. Parker. 2001. “Beyond Answers: Dimensions of the AdviceNetwork.” Social Networks 23(3):215–35.
Dess, G. G., S. Newport, and A. M. A. Rasheed. 1993. “Configuration Research in StrategicManagement: Key Issues and Suggestions.” Journal of Management 19(4):775–95.
Dhanaraj, C., and A. Parkhe. 2006. “Orchestrating Innovation Networks.” Academy ofManagement Review 31(3):659–69.
Doreian, P. 1974. “On the Connectivity of Social Networks.” Journal of Mathematical Sociology3:245–58.
Doreian, P. 1979. “On the Evolution of Group and Network Structure.” Social Networks2(3):235–52.
Doreian, P. 1981. “Polyhedral Dynamics and Conflict Mobilization in Social Networks.” SocialNetworks 3(2):107–16.
Doreian, P. 1986. “On the Evolution of Group and Network Structure II: Structures withinStructure.” Social Networks 8(1):33–64.
32 M.J. Bliemel et al.

Elfring, T., and W. Hulsink. 2007. “Networking by Entrepreneurs: Patterns of Tie – Formation inEmerging Organizations.” Organization Studies 28(12):1849–72.
Emerson, R. M. 1962. “Power-Dependence Relations.” American Sociological Review27(1):31–41.
Faust, K. 1997. “Centrality in Affiliation Networks.” Social Networks 19(2):157–91.Fiss, P. C. 2007. “A Set-Theoretic Approach to Organizational Configurations.” Academy of
Management Review 32(4):1180–98.Fiss, P. C. 2011. “Building Better Casual Theories: A Fuzzy Set Approach to Typologies in
Organizational Research.” Academy of Management Journal 54(2):393–420.Franco, M., and H. Haase. 2011. “Network Embeddedness: A Qualitative Study of Small
Technology-Based Firms.” International Journal of Management and EnterpriseDevelopment 11(1):34–51.
Freeman, L. 1980. “Q-Analysis and the Structure of Friendship Networks.” International Journalof Man-Machine Studies 12(4):367–78.
Gargiulo, M., and M. Benassi. 2000. “Trapped in Your Own Net? Network Cohesion StructuralHoles, and the Adaptation of Social Capital.” Organization Science 11(2):183–96.
Gaspar, J., and P. Gould. 1981. “The Cova Da Beira: An Applied Structural Analysis of Agricultureand Communication.” Lund Studies in Geography/B 48:183–214.
Gnyawali, D. R., and R. Madhavan. 2001. “Cooperative Networks and Competitive Dynamics: AStructural Embeddedness Perspective.” Academy of Management Review 26(3):431–45.
Gould, P. 1980. “Q-Analysis, or a Language of Structure: An Introduction for Social Scientists,Geographers and Planners.” International Journal of Man-Machine Studies 13(2):169–99.
Gould, P., J. Johnson, and G. Chapman. 1984. The Structure of Television. London, UK: Pion.Grossman, E. B., H. Yli-Renko, and R. Janakiraman. 2010. “Resource Search, Interpersonal
Similarity, and Network Tie Valuation in Nascent Entrepreneurs’ Emerging Networks.”Journal of Management 38(6):1760–87.
Håkansson, H. 1989. Corporate Technological Behaviour: Co-Operation and Networks. London:Routledge.
Håkansson, H., D. Ford, L. E. Gadde, I. Snehota, and A. Waluszewski. 2009. Business inNetworks. Chichester, UK: John Wiley & Sons.
Harary, F. 1959. “Graph Theoretic Methods in the Management Sciences.” Management Science5(4):387–403.
Harley, E. 2004. “Comparison of Clique-Listing Algorithms.” Paper presented at theInternational Conference on Modeling, Simulation and Visualization Methods in Las Vegas,NV, June 21–24.
Hill, S. A., and J. Birkinshaw. 2008. “Strategy-Organization Configurations in Corporate VentureUnits: Impact on Performance and Survival.” Journal of Business Venturing 23(4):423–44.
Hite, J. M. 2003. “Patterns of Multidimensionality Among Embedded Network Ties: A Typologyof Relational Embeddedness in Emerging Entrepreneurial Firms.” Strategic Organization1(1):9–49.
Hite, J. M. 2005. “Evolutionary Processes and Paths of Relationally Embedded Network Ties inEmerging Entrepreneurial Firms.” Entrepreneurship: Theory & Practice 29(1):113–44.
Hoang, H., and B. Antoncic. 2003. “Network-Based Research in Entrepreneurship – A CriticalReview.” Journal of Business Venturing 18(2):165–87.
Jack, S. L. 2010. “Approaches to Studying Networks: Implications and Outcomes.” Journal ofBusiness Venturing 25(1):120–37.
Studying Multiplexity in Entrepreneurial Networks 33

Jack, S., S. D. Dodd, and A. R. Anderson. 2008. “Change and the Development ofEntrepreneurial Networks over Time: A Processual Perspective.” Entrepreneurship &Regional Development 20(2):125–59.
Jack, S., S. Moult, A. R. Anderson, and S. Dodd. 2010. “An Entrepreneurial Network Evolving:Patterns of Change.” International Small Business Journal 28(4):315–37.
Jacobson, T. L., D. S. Fusani, and W. Yan. 1993. “Q-Analysis of User-Database Interaction.”International Journal of Man-Machine Studies 38(5):787–803.
Jacobson, T. L., and W. Yan. 1998. “Q-Analysis Techniques for Studying CommunicationContent.” Quality and Quantity 32(1):93–108.
Johnson, J. H. 1981. “Some Structures and Notations of Q-Analysis.” Environment and PlanningB: Planning and Design 8(1):73–86.
Johnson, J. H. 1990a. “Expert Q-Analysis.” Environment and Planning B: Planning and Design17(2):221–44.
Johnson, J. H. 1990b. “Interpretation and Hierarchical Set Definition in Q-Analysis.”Environment and Planning B: Planning and Design 17(3):277–302.
Johnson, J. H. 1990c. “The Rules of Q-Analysis.” Environment and Planning B: Planning andDesign 17(4):475–86.
Kanter, R. M. 1983. The Change Masters: Innovation for Productivity in the AmericanCorporation. London, UK: Unwin Hyman Limited.
Kapferer, B. 1969. “Norms and the Manipulation of Relationships in a Work Context.” In SocialNetworks in Urban Situations, edited by J. C. Mitchell, 181–244. University of Zambia:Manchester University Press.
Kilduff, M., and D. J. Brass. 2010. “Organizational Social Network Research: Core Ideas and KeyDebates.” Academy of Management Annals 4:317–57.
Knoke, D., and J. H. Kuklinski. 1982. Network Analysis. Beverly Hills, CA: Sage.Koehly, L. M., and P. Pattison. 2005. “Random Graph Models for Social Networks: Multiple
Relations or Multiple Raters.” In Models and Methods in Social Network Analysis, edited byP. J. Carrington, J. Scott, and S. Wasserman, 162–91. Cambridge, UK: Cambridge UniversityPress.
Krohn, M. D., J. L. Massey, and M. Zielinski. 1988. “Role Overlap, Network Multiplexity, andAdolescent Deviant Behavior.” Social Psychology Quarterly 51(4):346–56.
Labianca, G. J., and D. J. Brass. 2006. “Exploring the Social Ledger: Negative Relationships andNegative Asymmetry in Social Networks in Organizations.” Academy of ManagementReview 31(3):596–614.
Larson, A. 1991. “Partner Networks: Leveraging External Ties to Improve EntrepreneurialPerformance.” Journal of Business Venturing 6(3):173–88.
Lazega, E., and P. E. Pattison. 1999. “Multiplexity, Generalized Exchange and Cooperation inOrganizations: A Case Study.” Social Networks 21(1):67–90.
Lechner, C., and M. Dowling. 2003. “Firm Networks: External Relationships as Sources for theGrowth and Competitiveness of Entrepreneurial Firms.” Entrepreneurship & RegionalDevelopment 15(1):1–26.
Lechner, C., M. Dowling, and I. Welpe. 2006. “Firm Networks and Firm Development: The Role ofthe Relational Mix.” Journal of Business Venturing 21(4):514–40.
Lorenzoni, G., and A. Lipparini. 1999. “The Leveraging of Interfirm Relationships as a DistinctiveOrganizational Capability: A Longitudinal Study.” Strategic Management Journal20(4):317–38.
34 M.J. Bliemel et al.

Lorenzoni, G., and O. A. Ornati. 1988. “Constellations of Firms and New Ventures.” Journal ofBusiness Venturing 3(1):41–57.
Luce, R., and A. Perry. 1949. “A Method of Matrix Analysis of Group Structure.” Psychometrika14(2):95–116.
Maine, E., and E. Garnsey. 2006. “Commercializing Generic Technology: The Case of AdvancedMaterials Ventures.” Research Policy 35(3):375–93.
Maine, E., and E. Garnsey. 2007. “The Commercialization Environment of Advanced MaterialsVentures.” International Journal of Technology Management 39(1/2):49–71.
Meyer, A. D., A. S. Tsui, and C. R. Hinings. 1993. “Configurational Approaches to OrganizationalAnalysis.” Academy of Management Journal 36(6):1175–95.
Miller, D. 1978. “The Role of Multivariate ‘Q-Techniques’ in the Study of Organizations.”Academy of Management Review 3(3):515–31.
Miller, D. 1996. “Configurations Revisited.” Strategic Management Journal 17(7):505–12.Miller, D., and P. H. Friesen. 1984. Organizations: A Quantum View. Englewood Cliffs, NJ:
Prentice-Hall, Inc.Minshall, T., S. Seldon, and D. Probert. 2007. “Commercializing a Disruptive Technology Based
Upon University IP Through Open Innovation: A Case Study of Cambridge DisplayTechnology.” International Journal of Innovation & Technology Management4(3):225–39.
Mullins, E. R. Jr. 1976. “An APL Program for Q-Analysis.” International Journal of Man-MachineStudies 8(5):499–500.
Oh, H., G. J. Labianca, and M.-H. Chung. 2006. “A Multilevel Model of Group Social Capital.”Academy of Management Review 31(3):569–82.
Ostgaard, T. A., and S. Birley. 1994. “Personal Networks and Firm Competitive Strategy: AStrategic or Coincidental Match?.” Journal of Business Venturing 9(4):281–305.
Ozdemir, S. Z., P. Moran, X. Zhong, and M. J. Bliemel. 2014. “Reaching and Acquiring ValuableResources: The Entrepreneur’s Use of Brokerage, Cohesion, and Embeddedness.”Entrepreneurship Theory and Practice forthcoming 1–31.
Pardalos, P. M., and G. P. Rodgers. 1992. “A Branch and Bound Algorithm for the MaximumClique Problem.” Computers & Operations Research 19(5):363–75.
Powell, W. W., K. W. Koput, and L. Smith-Doerr. 1996. “Interorganizational Collaboration andthe Locus of Innovation: Networks of Learning in Biotechnology.” Administrative ScienceQuarterly 41(1):116–45.
Ragin, C. C. 2000. Fuzzy-Set Social Science. Chicago, IL: University of Chicago Press.Rakotobe-Joel, T., I. P. McCarthy, and D. Tranfield. 2003. “A Structural and Evolutionary
Approach to Change Management.” Computational and Mathematical Organization Theory8(4):337–64.
Rivkin, J. W., and N. Siggelkow. 2003. “Balancing Search and Stability: Interdependenciesamong Elements Organizational Design.” Management Science 49(3):290–311.
Rogers, E. M., and D. L. Kincaid. 1981. Communication Networks: Toward a New Paradigm forResearch. New York: The Free Press.
Rothaermel, F. T., and D. L. Deeds. 2006. “Alliance Type, Alliance Experience and AllianceManagement Capability in High-Technology Ventures.” Journal of Business Venturing21(4):429–60.
Ryan, G. W., and H. R. Bernard. 2003. “Techniques to Identify Themes.” Field Methods15(1):85–109.
Studying Multiplexity in Entrepreneurial Networks 35

Schumpeter, J. A. 1934. The Theory of Economic Development. Cambridge, MA: HarvardUniversity Press.
Shepherd, J. 1991. “Entrepreneurial Growth through Constellations.” Journal of BusinessVenturing 6(5):363–73.
Shipilov, A. 2012. “Strategic Multiplexity.” Strategic Organization 10(3):215–22.Siggelkow, N. 2002. “Evolution towards Fit.” Administrative Science Quarterly 47:125–59.Slotte-Kock, S., and N. Coviello. 2010. “Entrepreneurship Research on Network Processes: A
Review and Ways Forward.” Entrepreneurship: Theory & Practice 34(1):31–57.Snow, C. C., R. E. Miles, and G. Miles. 2005. “A Configurational Approach to the Integration of
Strategy and Organization Research.” Strategic Organization 3(4):431–39.Soh, P. H. 2003. “The Role of Networking Alliances in Information Acquisition and Its
Implications for New Product Performance.” Journal of Business Venturing 18(6):727–44.Spooner, R., and M. Batty. 1981. “Networks of Urban Systems Analysts.” Environment and
Planning B 8(4):449–75.Stinchcombe, A. L. 1965. “Social Structure and Organizations.” In Handbook of Organizations,
edited by J. G. March, 142–93. Chicago, IL: Rand McNally.Stuart, T. E., H. Hoang, and R. C. Hybels. 1999. “Interorganizational Endorsements and the
Performance of Entrepreneurial Ventures.” Administrative Science Quarterly 44(2):315–49.Tutzauer, F. 1993. Qbit (Version 1.1). Buffalo, NY: Department of Communication, State
University of New York at Buffalo.Uzzi, B. 1996. “The Sources and Consequences of Embeddedness for the Economic
Performance of Organizations: The Network Effect.” American Sociological Review61(4):674–98.
Uzzi, B. 1999. “Embeddedness in the Making of Financial Capital: How Social Relations andNetworks Benefit Firms Seeking Financing.” American Sociological Review 64(4):481–505.
Vissa, B. 2011. “A Matching Theory of Entrepreneurs’ Tie Formation Intentions and Initiation ofEconomic Exchange.” Academy of Management Journal 54(1):137–58.
Wasserman, S., and K. Faust. 1994. Social Network Analysis: Methods and Applications.Cambridge, UK: Cambridge University Press.
Watson, J. 2007. “Modeling the Relationship between Networking and Firm Performance.”Journal of Business Venturing 22(6):852–74.
Yli-Renko, H. 2005. “All Your Eggs in One Basket? Dependence on a Key Customer and theSurvival of Young, Technology-Based Firms.” Unpublished Manuscript, West CoastResearch Symposium Conference Paper, Seattle, WA.
Yli-Renko, H., and E. Autio. 1998. “The Network Embeddedness of New, Technology-BasedFirms: Developing a Systemic Evolution Model.” Small Business Economics 11(3):253–67.
Yli-Renko, H., H. J. Sapienza, and M. Hay. 2001. “The Role of Contractual Governance Flexibilityin Realizing the Outcomes of Key Customer Relationships.” Journal of Business Venturing16(6):529–55.
Zaheer, A., and G. G. Bell. 2005. “Benefiting From Network Position: Firm Capabilities,Structural Holes, and Performance.” Strategic Management Journal 26(9):809–25.
36 M.J. Bliemel et al.