competitive actions of small firms in a declining market
TRANSCRIPT
Competitive Actions of Small Firms in aDeclining Marketjsbm_337 578..598
by Matthew Bumgardner, Urs Buehlmann, Albert Schuler, andJeff Crissey
Small firms, through their flexibility advantages and closeness to customers, poten-tially can increase their sales volume in economic downturns. The decline in U.S.housing construction (beginning in 2006) provided an opportunity to develop andtest four hypotheses predicting the attributes and marketing actions associated withsuccessful companies supplying housing markets. Smaller firms and those producingmade-to-order products were most likely to have realized increased sales volume.These successful firms were not engaged in several marketing actions hypothesized toincrease sales volume in a declining market. Small firm competitiveness was basedmore on working closely with customers to produce fully customized products.
IntroductionAfter years of robust growth driven
largely by readily available credit, favor-able demographics, wealth effects, andspeculation, the U.S. housing marketbegan a precipitous decline in 2006(Buehlmann et al. 2008). With singlefamily housing starts at 0.74 million
annualized and permits at 0.67 million inJanuary 2008, the industry reached itsslowest pace since 1993. An additional4.13 million single family homes were onthe market. As of January 2008, singlefamily resale inventories were at 10.1months, and new housing inventorieswere at 9.9 months.1 The value of privateconstruction (accounting for 75 percent
Matthew Bumgardner is Forest Products Technologist at the USDA Forest Service, NorthernResearch Station.
Urs Buehlmann is associate professor at Virginia Tech, Wood Science and Forest Products.Albert Schuler is Research Forester (now retired) at the USDA Forest Service, Northern
Research Station.Jeff Crissey was previously editor at Modern Woodworking (he is currently editor at
Commerical Carrier Journal).Address correspondence to: Matthew Bumgardner, U.S. Department of Agriculture Forest
Service, Northern Research Station, 359 Main Road, Delaware, OH 43015. E-mail:[email protected] for new home inventory: U.S. Bureau of Census—http://www.census.gov/const/www/newressalesindex.html. Source for existing home inventory: National Association of Realtors—http://www.realtor.org/research/index.html.
Journal of Small Business Management 2011 49(4), pp. 578–598
JOURNAL OF SMALL BUSINESS MANAGEMENT578
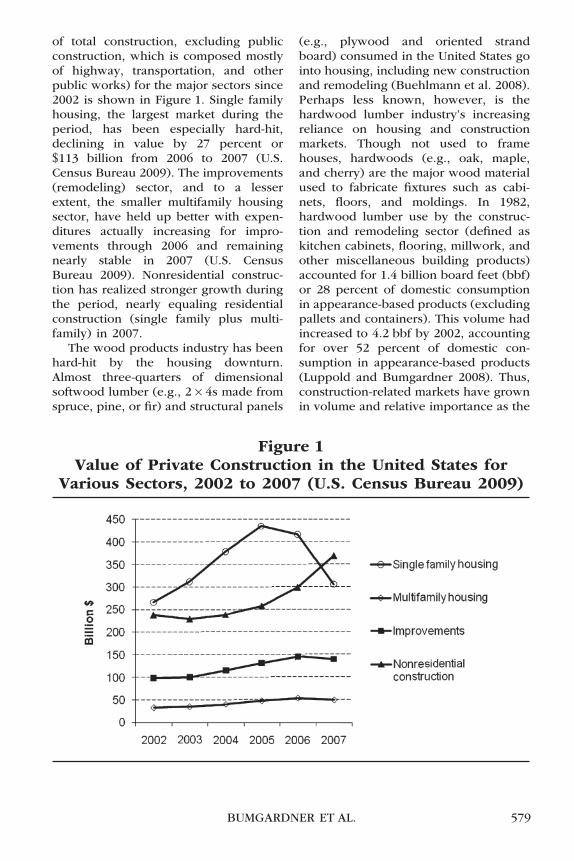
of total construction, excluding publicconstruction, which is composed mostlyof highway, transportation, and otherpublic works) for the major sectors since2002 is shown in Figure 1. Single familyhousing, the largest market during theperiod, has been especially hard-hit,declining in value by 27 percent or$113 billion from 2006 to 2007 (U.S.Census Bureau 2009). The improvements(remodeling) sector, and to a lesserextent, the smaller multifamily housingsector, have held up better with expen-ditures actually increasing for impro-vements through 2006 and remainingnearly stable in 2007 (U.S. CensusBureau 2009). Nonresidential construc-tion has realized stronger growth duringthe period, nearly equaling residentialconstruction (single family plus multi-family) in 2007.
The wood products industry has beenhard-hit by the housing downturn.Almost three-quarters of dimensionalsoftwood lumber (e.g., 2 ¥ 4s made fromspruce, pine, or fir) and structural panels
(e.g., plywood and oriented strandboard) consumed in the United States gointo housing, including new constructionand remodeling (Buehlmann et al. 2008).Perhaps less known, however, is thehardwood lumber industry’s increasingreliance on housing and constructionmarkets. Though not used to framehouses, hardwoods (e.g., oak, maple,and cherry) are the major wood materialused to fabricate fixtures such as cabi-nets, floors, and moldings. In 1982,hardwood lumber use by the construc-tion and remodeling sector (defined askitchen cabinets, flooring, millwork, andother miscellaneous building products)accounted for 1.4 billion board feet (bbf)or 28 percent of domestic consumptionin appearance-based products (excludingpallets and containers). This volume hadincreased to 4.2 bbf by 2002, accountingfor over 52 percent of domestic con-sumption in appearance-based products(Luppold and Bumgardner 2008). Thus,construction-related markets have grownin volume and relative importance as the
Figure 1Value of Private Construction in the United States for
Various Sectors, 2002 to 2007 (U.S. Census Bureau 2009)
BUMGARDNER ET AL. 579
domestic furniture manufacturing indus-try has moved offshore, reducing the tra-ditionally largest market for hardwoodlumber. Hardwood lumber use by thefurniture industry was larger than for theconstruction and remodeling sector untilabout 1992—between 1992 and 2002,consumption by the furniture industrydeclined by 23 percent to 2.1 bbf(Luppold and Bumgardner 2008). Withthis increasing importance of thehousing sector, it is no surprise that thesecondary wood industry is hard-hitby the slowdown in housing marketscoupled with lost furniture markets.
Small-Firm Performance inDeclining Markets
As described more fully in the nextsection, it is often said that smaller firmsmanufacturing customized products andoperating at high price points are themost competitive in the current eco-nomic environment for secondary woodproducts. However, this literature issomewhat limited. This study was con-ducted to confirm these suppositions andto determine the actions successful sec-ondary wood products firms were takingin the current downturn in single familyresidential construction (SFRC). A fewstudies have assessed the strategies thatfirms employ during economic down-turns. The evidence suggests that largerfirms generally focus more on cost reduc-tion during such conditions whereassmaller firms focus on marketing andrevenue generation (Latham 2009;Pearce and Michael 1997; Shama 1993),although cost reduction, particularlyfor easily replaceable assets, can beimportant to smaller manufacturing firmsduring recession as well (Michael andRobbins 1998). However, though previ-ous studies have investigated the rolesof competitive strategy (Barth 2003) andowner–manager demographic factors(Kangasharju 2000) on firm performancein mature markets, little is knownwhether small firms are capable of per-
forming better than large firms undersuch conditions. Though understood togenerally exhibit higher growth ratesthan larger firms (Davidsson et al. 2002),will smaller firms also exhibit a greaterpropensity to grow in a decliningmarket?
Theoretical Backgroundand Hypotheses
Large firms often are seen as having acompetitive advantage over small firms inmost any chosen field (Penrose 1995),with economies of scale and scope, aswell as experience effects, being majorbenefits associated with larger size(Ghemawat 1986). Smaller firms alsotend to face more difficulties and risks inobtaining financial capital (Lawless andWarren 2005; Penrose 1995). In the 1950sand 1960s, it was believed that small firmsfaced an uncertain future. Emphasis wasplaced on the scale economies associatedwith “Fordist” models of mass produc-tion of largely undifferentiated productsusing rigid management and productionschedules to meet growing post-Warconsumption (Baker 1995). However, theeconomic uncertainties associated withglobalization, changing consumer prefer-ences toward customized products (Pine1993), and other factors since the 1970sresulted in flexible specialization being akey component of industrial structuringin developed economies, which created afavorable environment for smaller, moreadaptable firms (Baker 1995). As a result,small firms remain an important compo-nent of the manufacturing economy in theUnited States as in other developed coun-tries (Mulhern 1995). Whereas largerfirms seek to expand into areas wheretheir advantages are the greatest, that is,where scale economies are present(Penrose 1995), opportunities are leftopen for smaller, more flexible firms todevelop differentiated products that canovercome the potential cost penaltiesassociated with serving smaller markets(Bhide 1994).
JOURNAL OF SMALL BUSINESS MANAGEMENT580
The U.S. manufacturing sector hasexperienced several challengingdecades. The manufacturing workforcein 2003, which numbered approximately16 million, was equal in size to that of1961. Over the past three decades, nearly5 million manufacturing jobs have beenlost, with the losses concentrated inthose jobs involving low-skill labor(Deitz and Orr 2006). Though some ofthese losses can be attributed to produc-tivity gains, another major driver behindthe decline of U.S. manufacturingprowess is the ongoing globalization oftrade, which has brought the compara-tive cost disadvantages of the UnitedStates as a manufacturing location to theforefront in several industrial sectors(Deitz and Orr 2006). Many U.S.-basedsecondary wood products industriessuch as furniture, flooring, and millwork(particularly where commodity-typeproducts have been the norm) have beenespecially hard-hit by the worldwideopening of markets for goods and ser-vices (Schuler and Buehlmann 2003).In this context, many secondary woodproducts firms find themselves in asimilar position to the broader manu-facturing sector in the United States—flexibility and specialization havebecome critical to competitiveness.
Interestingly, the primary producersin the hardwood supply chain (sawmillsproducing lumber for consumption bythe secondary industry) have followedan “expand or exit” strategy over the pastthree decades (Luppold and Bumgardner2009), which is consistent with the scaleadvantages of being larger (Penrose1995) and thus counter to trends in thesecondary industry. That is, mills thathave invested in sawing technology toexpand production capacity have real-ized increased economies of scale thathave driven smaller, less cost-efficienthardwood sawmills out of the market.However, to date, mills in the primarysector generally have not faced intenseglobal competition in domestic markets,
and commodity-type production remainscommon.
Sources of Competitive Advantagefor Small Secondary Wood Firms
To counteract the unfavorable manu-facturing trends, efforts are beingundertaken to find, and promote imple-mentation of, the competitive advantagespossessed by domestic wood productscompanies. For example, research hasshown that attributes such as flexibilityin order quantities and replacement partavailability are competitive advantagespossessed by the U.S. furniture industryrelative to imported products fromsources in China (Buehlmann et al.2006). The increasing importance of thecustomized economy, where customersexpect products and services to be cus-tomized to their needs and expectations,and are willing to pay a premium forthem, call for flexible entities able tointeract with individual customers anddeliver with speed the desired productor service (Schuler and Buehlmann2003). Small firms seem well-positionedto profit from these trends. Their sizemakes them flexible to tailor productsand services to particular market nichesand needs (Gilmore et al. 1999). Cus-tomization opportunities for secondarywood products such as furniture, cabi-nets, and millwork include choices forspecies, finish, hardware, and evenproduct design and physical dimensions(Lihra, Buehlmann, and Beauregard2008; Terreri 2008).
Most often, small firms serve localmarkets and source their supplies fromlocal or regional suppliers, minimizingproblematic activities such as long trans-portation distances. Their closeness alsofacilitates communication with their sup-pliers (Bumgardner, Romig, and Luppold2007). Previous research also has shownthat smaller wood products companiesplace greater emphasis on craftsmanshipas a desirable employee characteristicthan do larger firms (Bumgardner et al.
BUMGARDNER ET AL. 581
2005), suggesting that smaller firmsmight seek to take advantage of nichemarkets where quality and skilled pro-duction provides a competitive advan-tage and price sensitivity is less of afactor (Porter 1980). These potentialadvantages for small firms, including theability to provide customized, higher endproducts, lead to development of the fol-lowing hypotheses for the present study.
HypothesesGenerally, large firms are seen to have
certain inherent advantages over smallfirms in most any field that they mightcare to enter, especially in cases whereeconomies of large-scale production,marketing, and research are compellingand relatively easy to introduce and main-tain (Ghemawat 1986; Penrose 1995).Diez-Vial (2009) showed that as firmsgrow, they are generally more interestedin leveraging value chain capabilitiesthrough vertical integration, whereassmaller firms perceive a need to stay moreflexible, especially in situations wherethere is high demand uncertainty. It thusseems to follow, as found by Latham(2009) and Shama (1993), that large firmswould focus more on cost reductions as ameans of weathering recessions, whereassmaller firms would focus more onrevenue generation activities such asproduct refinement and promotion, cus-tomer service, niche marketing, andexpanding distribution channels. Smallerfirms lack the economies of scale and cashflow necessary to rely on cost-reductionstrategies during downturns and thus, aremore likely to seek additional revenuesources (Latham 2009).
In the case of the secondary woodproducts industry, larger firms, particu-larly in the furniture sector, have movedmanufacturing off-shore to take advan-tage of lower labor costs (Schuler andBuehlmann 2003), essentially following ageneric competitive strategy of cost lead-ership (Porter 1980). However, this canlead to challenges in implementing a cus-
tomization strategy that offers differen-tiation in the marketplace. For example,a recent report described a large furni-ture manufacturing company that,though recognizing (and acting upon)the opportunities associated with offer-ing customized products to consumers,must first disassemble imported (andbatch-produced) products before remov-ing the original finish to serve thismarket. Specified finishes from customerorders from retail showrooms are thenreapplied before reassembling for ship-ment (Russell 2009).
Opportunities for small firms toproduce semi-customized or fully cus-tomized secondary wood products existbecause larger firms seek to expand intoareas where their advantages are thegreatest, that is, where scale economiesare present (Penrose 1995). Opportuni-ties are thus left open for smaller, moreflexible firms to develop differentiatedproducts, tailored to specific customerdemands, which can overcome the costpenalties associated with serving smallermarkets (Bhide 1994) and where pricesensitivity is not a major factor (Porter1980). For example, Dean, Brown, andBamford (1998) found that the availabil-ity of niche opportunities within anindustry was associated with inducementof small business formation relative tolarger firms. This advantage for smallfirms can be especially important duringan economic downturn as DeDee andVorhies (1998) found that manufacturingon a customer order basis was positivelyrelated to financial performance forsmall firms during recession. We there-fore propose that successful firms inthe current housing downturn will besmaller, and more likely to be producingsemi-custom and fully customized prod-ucts at higher price points.
H1: Firms having increased sales volumein the declining SFRC market will besmaller as measured by number ofemployees and total sales.
JOURNAL OF SMALL BUSINESS MANAGEMENT582
H2: Firms having increased sales volumein the declining SFRC market will bemore customized as measured byproportion of semi-custom productsproduced and proportion of made-to-order products produced.
H3: Firms having increased sales volumein the declining SFRC market will beoperating at a higher price point.
There are a number of reasons whyindustries face decline. These includetechnological advances that foster substi-tute products, changes in buyers’ lif-estyles or tastes, changes in the costs ofinputs or of complementary products,and shrinking customers groups/potential buyers sliding into trouble(Harrigan and Porter 1983); the latterseems most explanatory of the currenthousing downturn. Of course, circum-stances can change and declines canreverse, which is widely expected of theU.S. housing industry as longer termunderlying demographic factors remainpositive (Joint Center for HousingStudies of Harvard University 2008;National Association of Home Builders2008). It is the companies that foreseerevitalization and/or have a strong stakein an industry that are the most likely tobe optimistic about future demand andtake steps to persevere (Harrigan andPorter 1983).
When operating in mature markets ordeclining markets, there are several mar-keting actions that can be taken toextend volume growth, including conver-sion of noncustomers in target segmentsinto customers (increasing penetration),increasing the frequency or volume ofuse among existing customers, andexpanding into untapped market seg-ments. Boyd, Walker, and Larreche(1995) identified several such actionswithin these broad categories, 11 ofwhich were investigated in the presentstudy. Several of these activities aresimilar to those used by Latham (2009) to
represent Hofer’s (1980) revenue-generating strategy for turning around astagnant or declining company. It washypothesized that successful firms oper-ating in the declining SFRC market wereemploying such actions given that salesgrowth is more difficult in maturemarkets (Barth 2003). Furthermore, ifsuccessful firms in the current SFRCdownturn are found to be smaller (aspredicted), it would be expected thatthese firms would respond to the reces-sionary conditions by focusing more onmarketing activities to generate revenuethan on cost reduction (Latham 2009;Pearce and Michael 1997; Shama 1993).However, a countervailing factor couldbe that smaller firms have reportedfacing difficulties related to marketingactivities such as product promotion,distribution, and market research(Huang and Brown 1999; Mulhern 1995).Perhaps these firms, if smaller, thereforewill be less engaged in marketingactivities.
H4: Firms having increased sales volumein the declining SFRC market aremore engaged in marketing activitiesto extend sales volume.
MethodsAn email was sent by Modern Wood-
working magazine in February 2008 toall subscribers with an email addressavailable (approximately 17,000) invitingthem to participate in the study. This listincluded several nonmanufacturing firmsand other entities, but it was not practicalto ascertain from the list the type oforganization represented in order toremove nonrelevant entries. However, asdescribed later, it was possible to testfor response bias for the respondingsample. The email included a cover letterexplaining the study and a link to thequestionnaire posted on the Internet. Areminder notice was sent via e-mail twoweeks after the initial email. The ques-tionnaire contained 24 questions and
BUMGARDNER ET AL. 583
was completed by respondents online.As an incentive for participation, respon-dents were entered in a sweepstakes towin a prize. A total of 496 responseswere received after a four-week period.The usable sample of manufacturers was430 after removing nonmanufacturingresponders such as distributors, serviceproviders, and educational organizations(the apparently low response rate, astraditionally defined, was partially afunction of the heavy presence ofnonmanufacturers in the list of emailaddresses on file). Respondents wereactive in markets across the UnitedStates, ranging from 44 percent of firmsdoing regular business in the Midwest to21 percent of respondents doing regularbusiness in California. Over 69 percent ofthe respondents held positions in corpo-rate or operating management or wereowners, whereas another 16 percentwere in production management.
It was possible to check for nonre-sponse bias by comparing the samplewith known parameters for ModernWoodworking subscribers. The propor-tion of the sample with less than 50employees was 82 percent, whereas thisproportion was 72 percent for the popu-lation. Also, the sample was composed of71 percent cabinet and household furni-ture manufacturing firms, whereas firmsassociated with these products were 62percent of the population. Thus, thoughthere were some minor differences,the sample seemed to be a reasonablerepresentation of the Modern Woodwork-ing population, which was composedof about 35,000 subscribers. However,given that differences might existbetween subscribers and nonsubscribers,some caution is warranted in generaliz-ing beyond companies subscribing tothe magazine. Another point to note, asdescribed in the next section, was thatthose responders facing a decliningmarket were only 15 percent greater thanthose realizing increased demand in thecurrent environment. Thus, there might
have been a subset of respondents “moti-vated” to respond based on their success.The combined result could be overrepre-sentation of successful firms relative tothe overall industry.
In order to test the hypotheses, therespondents were placed into one offour market/performance groups basedon: the proportion of their productionvolume that was directly associated withthe SFRC market in 2007 (i.e., used in thebuilding or trimming of new homes,excluding furniture or furnishings) andwhether their sales volume increased ordecreased from 2006 to 2007. Primaryinterest was with those firms that hadmore than 60 percent of their productionvolume associated with the decliningSFRC market and whose sales volumeincreased from 2006 to 2007. Salesgrowth has been used in other smallbusiness studies as the performancemeasure of choice (Barth 2003). Avolume of 60 percent was chosen inorder to include firms that had a clearmajority of sales in the SFRC market (andthus would be potentially impacted bychanges in this market) but also recog-nizing that many firms produce productsthat can be used in multiple markets(e.g., kitchen cabinets can be producedfor both the single family and multifam-ily housing market). Categorical datawere analyzed using c2 tests of indepen-dence; whereas the tables connectedwith these tests show percentages ineach cell to aid with interpretation ofresults (next section), the tests werebased on the associated frequencycounts. Interval-level data were analyzedusing multivariate analysis of variance(MANOVA/ANOVA).
Results and DiscussionGroup Descriptions
The breakdown of the sample alongthe market and performance dimensions(percentage of business from SFRCmarkets and sales volume performance)is shown in Table 1. There was a fairly
JOURNAL OF SMALL BUSINESS MANAGEMENT584
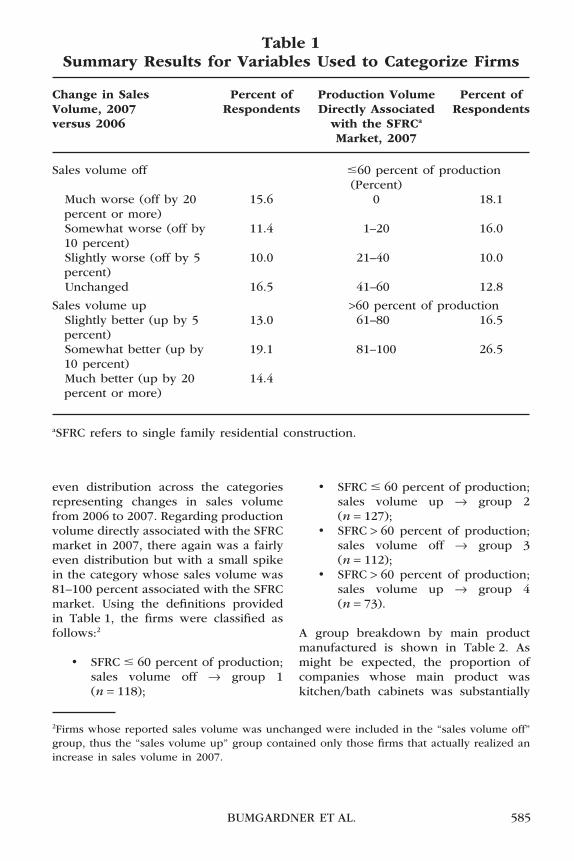
even distribution across the categoriesrepresenting changes in sales volumefrom 2006 to 2007. Regarding productionvolume directly associated with the SFRCmarket in 2007, there again was a fairlyeven distribution but with a small spikein the category whose sales volume was81–100 percent associated with the SFRCmarket. Using the definitions providedin Table 1, the firms were classified asfollows:2
• SFRC � 60 percent of production;sales volume off → group 1(n = 118);
• SFRC � 60 percent of production;sales volume up → group 2(n = 127);
• SFRC > 60 percent of production;sales volume off → group 3(n = 112);
• SFRC > 60 percent of production;sales volume up → group 4(n = 73).
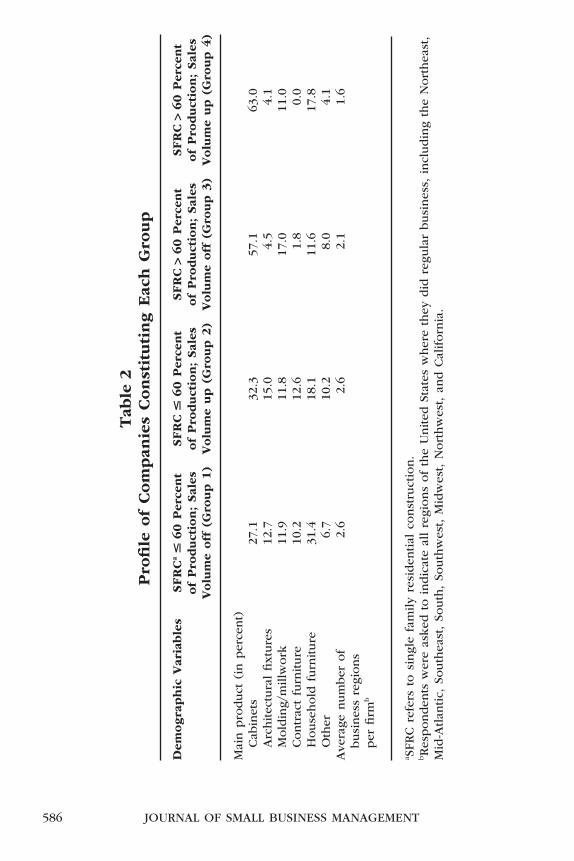
A group breakdown by main productmanufactured is shown in Table 2. Asmight be expected, the proportion ofcompanies whose main product waskitchen/bath cabinets was substantially
2Firms whose reported sales volume was unchanged were included in the “sales volume off”group, thus the “sales volume up” group contained only those firms that actually realized anincrease in sales volume in 2007.
Table 1Summary Results for Variables Used to Categorize Firms
Change in SalesVolume, 2007versus 2006
Percent ofRespondents
Production VolumeDirectly Associated
with the SFRCa
Market, 2007
Percent ofRespondents
Sales volume off �60 percent of production(Percent)
Much worse (off by 20percent or more)
15.6 0 18.1
Somewhat worse (off by10 percent)
11.4 1–20 16.0
Slightly worse (off by 5percent)
10.0 21–40 10.0
Unchanged 16.5 41–60 12.8
Sales volume up >60 percent of productionSlightly better (up by 5percent)
13.0 61–80 16.5
Somewhat better (up by10 percent)
19.1 81–100 26.5
Much better (up by 20percent or more)
14.4
aSFRC refers to single family residential construction.
BUMGARDNER ET AL. 585
Tab
le2
Pro
file
of
Com
pan
ies
Const
ituti
ng
Eac
hG
roup
Dem
ogra
phic
Var
iable
sSFR
Ca
�60
Per
cent
of
Pro
duct
ion;
Sal
esV
olu
me
off
(Gro
up
1)
SFR
C�
60
Per
cent
of
Pro
duct
ion;
Sal
esV
olu
me
up
(Gro
up
2)
SFR
C>
60
Per
cent
of
Pro
duct
ion;
Sal
esV
olu
me
off
(Gro
up
3)
SFR
C>
60
Per
cent
of
Pro
duct
ion;
Sal
esV
olu
me
up
(Gro
up
4)
Mai
npro
duct
(in
per
cent)
Cab
inet
s27
.132
.357
.163
.0A
rchitec
tura
lfixt
ure
s12
.715
.04.
54.
1M
old
ing/
millw
ork
11.9
11.8
17.0
11.0
Contr
act
furn
iture
10.2
12.6
1.8
0.0
House
hold
furn
iture
31.4
18.1
11.6
17.8
Oth
er6.
710
.28.
04.
1A
vera
genum
ber
of
busi
nes
sre
gions
per
firm
b
2.6
2.6
2.1
1.6
a SFR
Cre
fers
tosi
ngl
efa
mily
resi
den
tial
const
ruct
ion.
bRes
ponden
tsw
ere
asked
toin
dic
ate
allre
gions
of
the
United
Stat
esw
her
eth
eydid
regu
lar
busi
nes
s,in
cludin
gth
eN
ort
hea
st,
Mid
-Atlan
tic,
South
east
,So
uth
,So
uth
wes
t,M
idw
est,
Nort
hw
est,
and
Cal
iforn
ia.
JOURNAL OF SMALL BUSINESS MANAGEMENT586
higher for those firms primarily in theSFRC market (groups 3 and 4), whereasarchitectural fixtures and contract furni-ture as a main product was proportion-ally higher for those firms operatingprimarily in non-SFRC markets (groups 1and 2). Another difference of note wasthat firms in group 3 and especiallygroup 4 did regular business in fewergeographic regions on average than didfirms in groups 1 and 2 (ANOVAF = 4.27; df = 3, 424; p = .01), which isnot surprising given the local nature ofhousing construction. These differencesin markets served, coupled with differ-ences in sales volume, allowed for mean-ingful comparative analysis of thefour groups to test the hypotheses.For example, companies that realizedincreasing and decreasing sales volumein the SFRC market were represented
(i.e., group 4 and group 3, respectively).The categories were quite similar interms of respondents’ position, with 64percent to 73 percent either being incorporate/operations management orthe firm owner. Most of the remainderin each category was in productionmanagement.
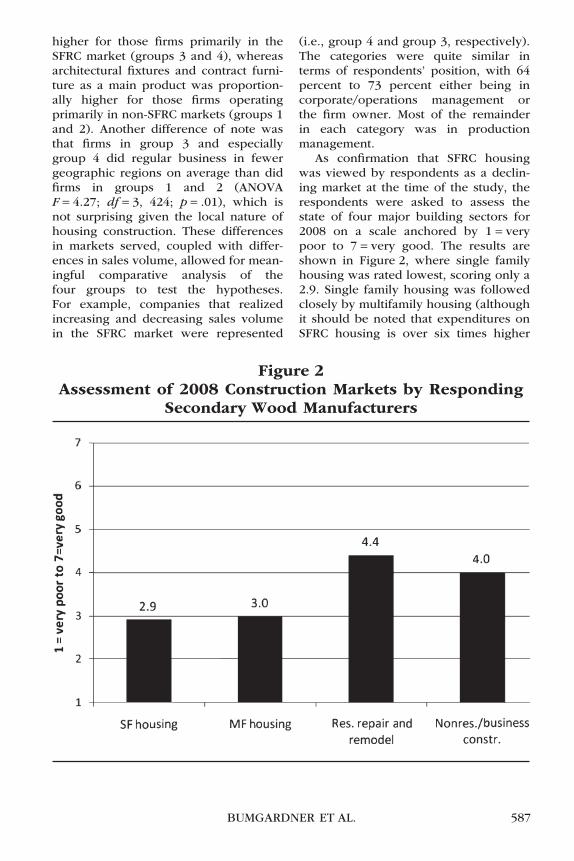
As confirmation that SFRC housingwas viewed by respondents as a declin-ing market at the time of the study, therespondents were asked to assess thestate of four major building sectors for2008 on a scale anchored by 1 = verypoor to 7 = very good. The results areshown in Figure 2, where single familyhousing was rated lowest, scoring only a2.9. Single family housing was followedclosely by multifamily housing (althoughit should be noted that expenditures onSFRC housing is over six times higher
Figure 2Assessment of 2008 Construction Markets by Responding
Secondary Wood Manufacturers
BUMGARDNER ET AL. 587
than expenditures on multifamilyhousing nationally, thus SFRC is amuch more important segment). Resi-dential repair and remodeling andnonresidential/business constructionwere perceived to be somewhat strongermarkets for 2008.
Further, as confirmation that firms ingroup 4 were generally doing well in theSFRC market, ANOVA results (F = 5.85;df = 3, 426; p < .01) indicated that group4 assessed the 2008 SFRC housingmarket significantly more favorable thandid the other groups (means of 2.9, 2.8,2.8, and 3.5, respectively, using therating scale in Figure 2). This would beexpected for firms whose reported salesvolume was up whereas having a major-ity of their business directly associatedwith that market. Of course, the possibil-ity also exists that such optimism is influ-enced by the stake these firms have inthe SFRC market, which can affect objec-tivity toward seeing the reality of decline(Harrigan and Porter 1983).
H1H1 states that firms having increased
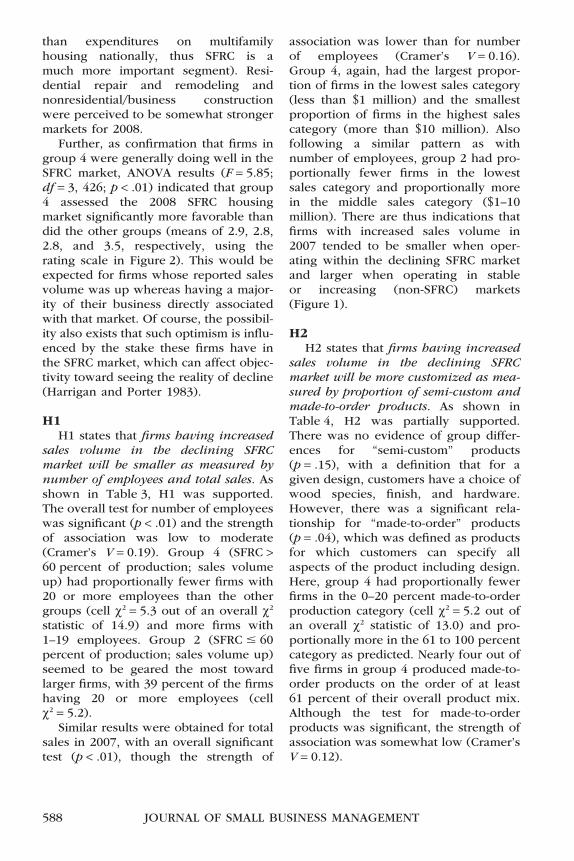
sales volume in the declining SFRCmarket will be smaller as measured bynumber of employees and total sales. Asshown in Table 3, H1 was supported.The overall test for number of employeeswas significant (p < .01) and the strengthof association was low to moderate(Cramer’s V = 0.19). Group 4 (SFRC >60 percent of production; sales volumeup) had proportionally fewer firms with20 or more employees than the othergroups (cell c2 = 5.3 out of an overall c2
statistic of 14.9) and more firms with1–19 employees. Group 2 (SFRC � 60percent of production; sales volume up)seemed to be geared the most towardlarger firms, with 39 percent of the firmshaving 20 or more employees (cellc2 = 5.2).
Similar results were obtained for totalsales in 2007, with an overall significanttest (p < .01), though the strength of
association was lower than for numberof employees (Cramer’s V = 0.16).Group 4, again, had the largest propor-tion of firms in the lowest sales category(less than $1 million) and the smallestproportion of firms in the highest salescategory (more than $10 million). Alsofollowing a similar pattern as withnumber of employees, group 2 had pro-portionally fewer firms in the lowestsales category and proportionally morein the middle sales category ($1–10million). There are thus indications thatfirms with increased sales volume in2007 tended to be smaller when oper-ating within the declining SFRC marketand larger when operating in stableor increasing (non-SFRC) markets(Figure 1).
H2H2 states that firms having increased
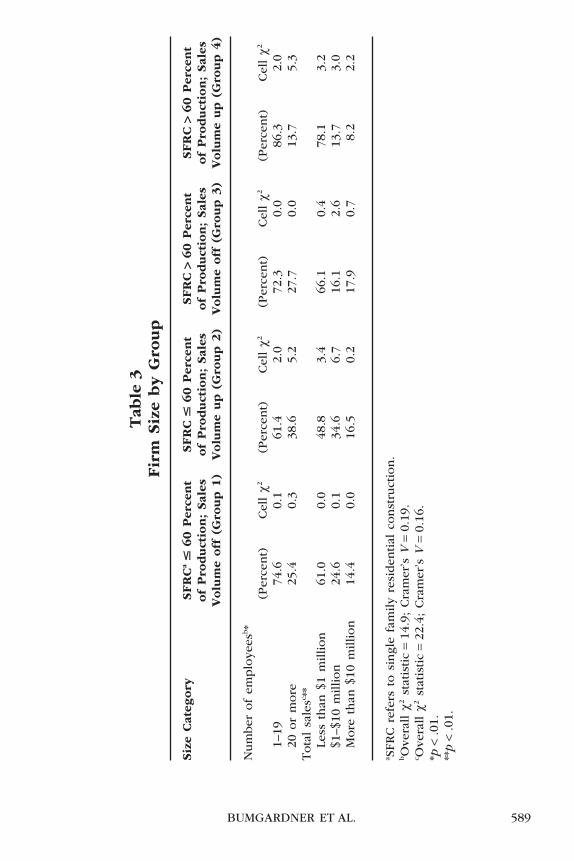
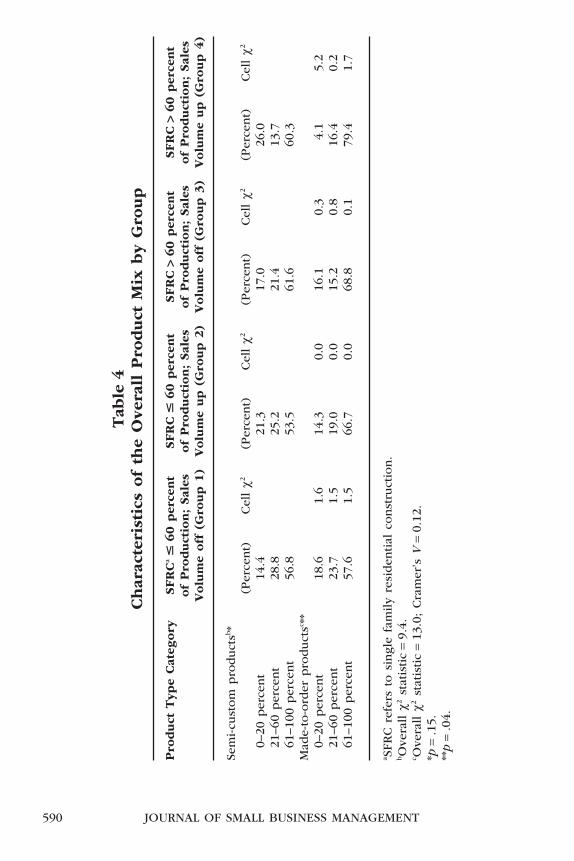
sales volume in the declining SFRCmarket will be more customized as mea-sured by proportion of semi-custom andmade-to-order products. As shown inTable 4, H2 was partially supported.There was no evidence of group differ-ences for “semi-custom” products(p = .15), with a definition that for agiven design, customers have a choice ofwood species, finish, and hardware.However, there was a significant rela-tionship for “made-to-order” products(p = .04), which was defined as productsfor which customers can specify allaspects of the product including design.Here, group 4 had proportionally fewerfirms in the 0–20 percent made-to-orderproduction category (cell c2 = 5.2 out ofan overall c2 statistic of 13.0) and pro-portionally more in the 61 to 100 percentcategory as predicted. Nearly four out offive firms in group 4 produced made-to-order products on the order of at least61 percent of their overall product mix.Although the test for made-to-orderproducts was significant, the strength ofassociation was somewhat low (Cramer’sV = 0.12).
JOURNAL OF SMALL BUSINESS MANAGEMENT588
Tab
le3
Fir
mSiz
eby
Gro
up
Siz
eC
ateg
ory
SFR
Ca
�60
Per
cent
of
Pro
duct
ion;
Sal
esV
olu
me
off
(Gro
up
1)
SFR
C�
60
Per
cent
of
Pro
duct
ion;
Sal
esV
olu
me
up
(Gro
up
2)
SFR
C>
60
Per
cent
of
Pro
duct
ion;
Sal
esV
olu
me
off
(Gro
up
3)
SFR
C>
60
Per
cent
of
Pro
duct
ion;
Sal
esV
olu
me
up
(Gro
up
4)
Num
ber
of
emplo
yees
b*
(Per
cent)
Cel
lc2
(Per
cent)
Cel
lc2
(Per
cent)
Cel
lc2
(Per
cent)
Cel
lc2
1–19
74.6
0.1
61.4
2.0
72.3
0.0
86.3
2.0
20or
more
25.4
0.3
38.6
5.2
27.7
0.0
13.7
5.3
Tota
lsa
lesc *
*Le
ssth
an$1
million
61.0
0.0
48.8
3.4
66.1
0.4
78.1
3.2
$1–$
10m
illion
24.6
0.1
34.6
6.7
16.1
2.6
13.7
3.0
More
than
$10
million
14.4
0.0
16.5
0.2
17.9
0.7
8.2
2.2
a SFR
Cre
fers
tosi
ngl
efa
mily
resi
den
tial
const
ruct
ion.
bO
vera
llc2
stat
istic
=14
.9;
Cra
mer
’sV
=0.
19.
c Ove
rall
c2st
atis
tic
=22
.4;
Cra
mer
’sV
=0.
16.
*p<
.01.
**p
<.0
1.
BUMGARDNER ET AL. 589
Tab
le4
Char
acte
rist
ics
of
the
Ove
rall
Pro
duct
Mix
by
Gro
up
Pro
duct
Typ
eC
ateg
ory
SFR
Ca
�60
per
cent
of
Pro
duct
ion;
Sal
esV
olu
me
off
(Gro
up
1)
SFR
C�
60
per
cent
of
Pro
duct
ion;
Sal
esV
olu
me
up
(Gro
up
2)
SFR
C>
60
per
cent
of
Pro
duct
ion;
Sal
esV
olu
me
off
(Gro
up
3)
SFR
C>
60
per
cent
of
Pro
duct
ion;
Sal
esV
olu
me
up
(Gro
up
4)
Sem
i-cu
stom
pro
duct
sb*
(Per
cent)
Cel
lc2
(Per
cent)
Cel
lc2
(Per
cent)
Cel
lc2
(Per
cent)
Cel
lc2
0–20
per
cent
14.4
21.3
17.0
26.0
21–6
0per
cent
28.8
25.2
21.4
13.7
61–1
00per
cent
56.8
53.5
61.6
60.3
Mad
e-to
-ord
erpro
duct
sc **
0–20
per
cent
18.6
1.6
14.3
0.0
16.1
0.3
4.1
5.2
21–6
0per
cent
23.7
1.5
19.0
0.0
15.2
0.8
16.4
0.2
61–1
00per
cent
57.6
1.5
66.7
0.0
68.8
0.1
79.4
1.7
a SFR
Cre
fers
tosi
ngl
efa
mily
resi
den
tial
const
ruct
ion.
bO
vera
llc2
stat
istic
=9.
4.c O
vera
llc2
stat
istic
=13
.0;
Cra
mer
’sV
=0.
12.
*p=
.15.
**p
=.0
4.
JOURNAL OF SMALL BUSINESS MANAGEMENT590
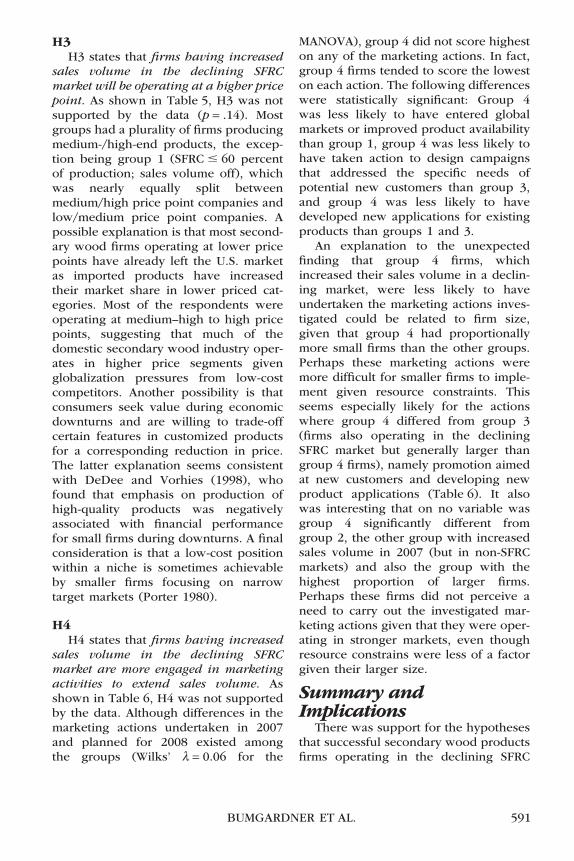
H3H3 states that firms having increased
sales volume in the declining SFRCmarket will be operating at a higher pricepoint. As shown in Table 5, H3 was notsupported by the data (p = .14). Mostgroups had a plurality of firms producingmedium-/high-end products, the excep-tion being group 1 (SFRC � 60 percentof production; sales volume off), whichwas nearly equally split betweenmedium/high price point companies andlow/medium price point companies. Apossible explanation is that most second-ary wood firms operating at lower pricepoints have already left the U.S. marketas imported products have increasedtheir market share in lower priced cat-egories. Most of the respondents wereoperating at medium–high to high pricepoints, suggesting that much of thedomestic secondary wood industry oper-ates in higher price segments givenglobalization pressures from low-costcompetitors. Another possibility is thatconsumers seek value during economicdownturns and are willing to trade-offcertain features in customized productsfor a corresponding reduction in price.The latter explanation seems consistentwith DeDee and Vorhies (1998), whofound that emphasis on production ofhigh-quality products was negativelyassociated with financial performancefor small firms during downturns. A finalconsideration is that a low-cost positionwithin a niche is sometimes achievableby smaller firms focusing on narrowtarget markets (Porter 1980).
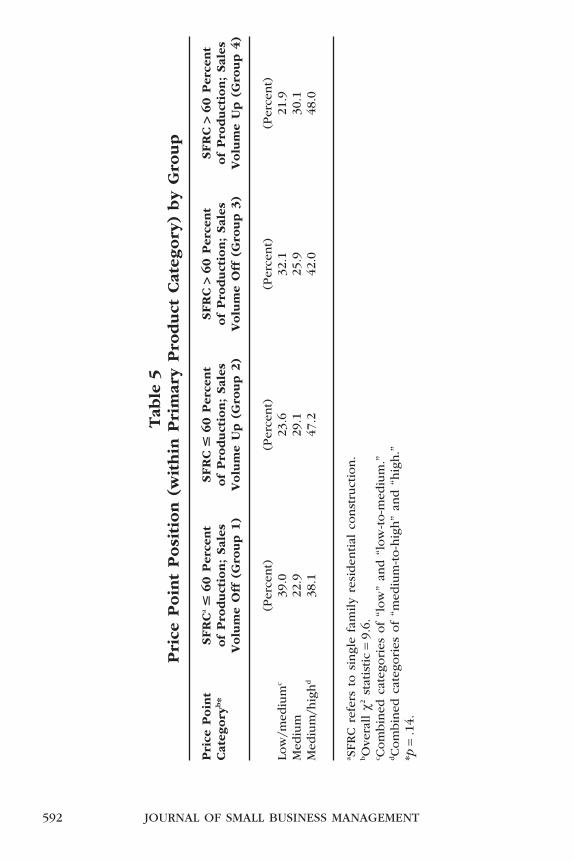
H4H4 states that firms having increased
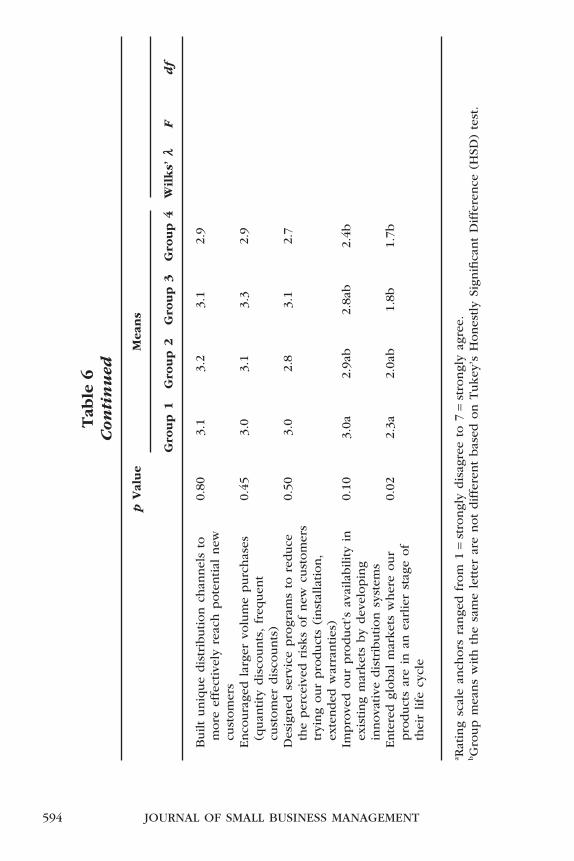
sales volume in the declining SFRCmarket are more engaged in marketingactivities to extend sales volume. Asshown in Table 6, H4 was not supportedby the data. Although differences in themarketing actions undertaken in 2007and planned for 2008 existed amongthe groups (Wilks’ l = 0.06 for the
MANOVA), group 4 did not score higheston any of the marketing actions. In fact,group 4 firms tended to score the loweston each action. The following differenceswere statistically significant: Group 4was less likely to have entered globalmarkets or improved product availabilitythan group 1, group 4 was less likely tohave taken action to design campaignsthat addressed the specific needs ofpotential new customers than group 3,and group 4 was less likely to havedeveloped new applications for existingproducts than groups 1 and 3.
An explanation to the unexpectedfinding that group 4 firms, whichincreased their sales volume in a declin-ing market, were less likely to haveundertaken the marketing actions inves-tigated could be related to firm size,given that group 4 had proportionallymore small firms than the other groups.Perhaps these marketing actions weremore difficult for smaller firms to imple-ment given resource constraints. Thisseems especially likely for the actionswhere group 4 differed from group 3(firms also operating in the decliningSFRC market but generally larger thangroup 4 firms), namely promotion aimedat new customers and developing newproduct applications (Table 6). It alsowas interesting that on no variable wasgroup 4 significantly different fromgroup 2, the other group with increasedsales volume in 2007 (but in non-SFRCmarkets) and also the group with thehighest proportion of larger firms.Perhaps these firms did not perceive aneed to carry out the investigated mar-keting actions given that they were oper-ating in stronger markets, even thoughresource constrains were less of a factorgiven their larger size.
Summary andImplications
There was support for the hypothesesthat successful secondary wood productsfirms operating in the declining SFRC
BUMGARDNER ET AL. 591
Tab
le5
Pri
ceP
oin
tP
osi
tion
(wit
hin
Pri
mar
yP
roduct
Cat
egory
)by
Gro
up
Pri
ceP
oin
tC
ateg
ory
b*
SFR
Ca
�60
Per
cent
of
Pro
duct
ion;
Sal
esV
olu
me
Off
(Gro
up
1)
SFR
C�
60
Per
cent
of
Pro
duct
ion;
Sal
esV
olu
me
Up
(Gro
up
2)
SFR
C>
60
Per
cent
of
Pro
duct
ion;
Sal
esV
olu
me
Off
(Gro
up
3)
SFR
C>
60
Per
cent
of
Pro
duct
ion;
Sal
esV
olu
me
Up
(Gro
up
4)
(Per
cent)
(Per
cent)
(Per
cent)
(Per
cent)
Low
/med
ium
c39
.023
.632
.121
.9M
ediu
m22
.929
.125
.930
.1M
ediu
m/h
igh
d38
.147
.242
.048
.0
a SFR
Cre
fers
tosi
ngl
efa
mily
resi
den
tial
const
ruct
ion.
bO
vera
llc2
stat
istic
=9.
6.c C
om
bin
edca
tego
ries
of
“low
”an
d“l
ow
-to-m
ediu
m.”
dCom
bin
edca
tego
ries
of
“med
ium
-to-h
igh”
and
“hig
h.”
*p=
.14.
JOURNAL OF SMALL BUSINESS MANAGEMENT592
Tab
le6
Mar
ket
ing
Act
ions
Under
taken
in2007
or
Pla
nned
for
2008
by
Sec
ondar
yW
ood
Pro
duct
sM
anufa
cture
rsto
Exte
nd
Sal
esV
olu
me
pV
alue
Mea
ns
Gro
up
1G
roup
2G
roup
3G
roup
4W
ilks’
lF
df
Multiv
aria
tean
alys
isof
vari
ance
(MA
NO
VA
)G
roup
0.06
0.89
61.
4033
,1,
214.
5A
NO
VA
for
dep
enden
tva
riab
les
Enhan
ced
our
pro
duct
’sva
lue
by
addin
gfe
ature
s,ben
efits
,or
serv
ices
0.56
4.0a
3.9
4.2
4.1
Rem
inded
our
cust
om
ers
thro
ugh
adve
rtis
ing
and
per
sonal
sellin
gof
the
bas
icben
efits
of
our
pro
duct
san
dse
rvic
es
0.64
3.8
3.8
4.0
3.8
Dev
eloped
diffe
rentiat
edpro
duct
lines
with
feat
ure
sta
rget
edto
the
uniq
ue
nee
ds
of
pote
ntial
new
cust
om
ers
0.18
3.9
3.7
4.0
3.5
Des
igned
adve
rtis
ing
or
per
sonal
sellin
gca
mpai
gns
that
addre
ssed
the
spec
ific
nee
ds
of
pote
ntial
new
cust
om
ers
0.05
3.4a
bb
3.5a
b3.
7a2.
9b
Dev
eloped
and
pro
mote
dnew
applica
tions
for
our
exis
ting
pro
duct
s0.
023.
5a3.
3ab
3.6a
2.9b
Enhan
ced
our
pro
duct
’sva
lue
by
incl
udin
git
inth
edes
ign
of
inte
grat
edsy
stem
s
0.40
3.3
3.2
3.5
3.1
BUMGARDNER ET AL. 593
Tab
le6
Con
tin
ued
pV
alue
Mea
ns
Gro
up
1G
roup
2G
roup
3G
roup
4W
ilks’
lF
df
Built
uniq
ue
dis
trib
ution
chan
nel
sto
more
effe
ctiv
ely
reac
hpote
ntial
new
cust
om
ers
0.80
3.1
3.2
3.1
2.9
Enco
ura
ged
larg
ervo
lum
epurc
has
es(q
uan
tity
dis
counts
,fr
equen
tcu
stom
erdis
counts
)
0.45
3.0
3.1
3.3
2.9
Des
igned
serv
ice
pro
gram
sto
reduce
the
per
ceiv
edri
sks
of
new
cust
om
ers
tryi
ng
our
pro
duct
s(i
nst
alla
tion,
exte
nded
war
ranties
)
0.50
3.0
2.8
3.1
2.7
Impro
ved
our
pro
duct
’sav
aila
bility
inex
isting
mar
ket
sby
dev
elopin
gin
nova
tive
dis
trib
ution
syst
ems
0.10
3.0a
2.9a
b2.
8ab
2.4b
Ente
red
global
mar
ket
sw
her
eour
pro
duct
sar
ein
anea
rlie
rst
age
of
thei
rlife
cycl
e
0.02
2.3a
2.0a
b1.
8b1.
7b
a Rat
ing
scal
ean
chors
range
dfr
om
1=
stro
ngl
ydis
agre
eto
7=
stro
ngl
yag
ree.
bG
roup
mea
ns
with
the
sam
ele
tter
are
not
diffe
rent
bas
edon
Tukey
’sH
ones
tly
Sign
ifica
nt
Diffe
rence
(HSD
)te
st.
JOURNAL OF SMALL BUSINESS MANAGEMENT594
housing market were smaller and manu-factured more fully customized pro-ducts than their counterparts. However,semi-customization was not enough towarrant success; a statistical differencewas found only for fully customized,made-to-order products. Smaller firmswith the capability to manufacture prod-ucts to order seem especially well-positioned to weather the current andfuture downturns in the housing marketand possibly also to compete with off-shore competitors. Another implication isthat small firms will become increasinglyimportant to understanding consumptionpatterns for hardwood lumber and otherraw materials even though the availabilityof data to measure consumption bysmall firms can be limited (Bumgardner,Romig, and Luppold 2007). It also couldpose challenges related to distributionalefficiency for lumber manufacturers andwholesalers as they may need to reachproportionally more small customers inthe future. For example, a U.S. hardwoodsawmill owner, commenting on changesin the industry, was recently quoted,“It used to be I only had a few largecustomers on my Christmas card list,now I have hundreds of small customers”(Hardwood Review 2007, p. 16). Thesesmaller secondary manufacturers willneed to establish close relationships andlines of communication with their suppli-ers so that their raw material needs areunderstood clearly.
Interestingly, group 2 firms, whichlike group 4 firms had increased salesvolume but presumably were operatingin stronger markets (e.g., nonresidentialconstruction and contract furniture), con-tained the highest proportion of largerfirms. Group 2, with proportionally morelarge firms, had possibly achieved moremarket diversification and thus increasedsales volume; economies of scale mightalso have helped these larger firms(Serrasqueiro and Nunes 2008).
There was no evidence that group 4firms were employing the marketing
actions investigated as important toincreasing volume in mature and declin-ing markets. They were consistently lesslikely than their counterparts to beengaged in these actions, especiallythose that lost sales volume in 2007(i.e., groups 1 and 3). Possibly, the smallnature of firms in group 4, which mightnot have the resources necessary toincrease exports or to develop new dis-tribution channels, explains the differ-ence (Huang and Brown 1999). Ellis andPecotich (2001) found that for small andmedium-sized firms (defined as 200employees or fewer, much larger thanthe definition used in the present study),information regarding export opportuni-ties is discovered largely throughdecision-makers’ social networks withpotential foreign buyers; such networksmight be limited for most small second-ary wood manufacturers. Perhaps group4 firms, being generally smaller, weremore flexible (Gilmore et al. 1999)and thus able to develop specialistniches within the SFRC housing market(e.g., made-to-order cabinets). By focus-ing on existing product applications,distribution systems, and customers(Table 6) in limited regional areas(Table 2), these firms seemingly wereable to grow in the downturn by workingclosely with their customers. As statedby Gilmore et al. (1999, p. 33), “[our]findings suggest that the SME [smalland medium-sized enterprise], by stayingclose to its customers, will have a keenunderstanding of their needs.” Futureresearch could look more closely atthe factors sought out by customersseeking made-to-order production bysmaller firms, such as craftsmanship(Bumgardner et al. 2005) and serviceprovision (Araujo and Spring 2006).
In summary, this study provides evi-dence that smaller firms can increasetheir sales volume in a declining market,a feat that might prove more difficultfor larger firms. Furthermore, consistentwith theory that large firms possess
BUMGARDNER ET AL. 595
inherent advantages over small firmswhen scale economies are present, largerfirms were more likely to have grownsales volume when operating in thestable and increasing markets investi-gated. As globalization has broughtintense pressure on domestic manufac-turers to pursue competitive strategiesthat concentrate either on general costreduction or seeking out more protectedmarkets, smaller firms have becomemore focused on niches, whereas manylarger firms have followed strategies oflowering costs through outsourcing pro-duction. Thus, perhaps small firms werebetter positioned to weather the declinein overall demand for secondary woodproducts as the housing crises intensi-fied. A consequence of outsourcing pro-duction to distant locations seems to be aloss of flexibility, yet flexibility can beleveraged to generate revenue duringeconomic downturns by offering differ-entiated products to customers whosespecific needs are met through custom-ized production. In addition, inherentcloseness to customers allows small firmsto understand and respond to the poten-tial trade-offs in quality, product options,and price during economic downturns.However, small firms apparently lackedthe resources necessary to engage inmany of the marketing activities to growsales volume in declining markets,perhaps suggesting that such actionsgenerally are most appropriate for largercompanies.
LimitationsReaders should keep in mind the limi-
tations of this study. As with most surveyresearch, the results are based on asingle respondent from each company;though the respondents tended to beupper management or company owners,the perspective of the single sourcemight not necessarily represent the per-spectives of other decision-makers in thefirm. The measure of performance for thestudy was limited in that it was based on
change in sales volume for a one-yearperiod, from 2006 to 2007. However, asFigure 1 shows, the market change inthat span was somewhat dramatic soit is likely that the overall secondarywood products industry was negativelyimpacted during this period. Anotherlimitation was that firm age was notconsidered; though other studies haveshown that “new” firms outperform firmsone year or older in age during decliningmarket conditions (Kangasharju 2000), itis unlikely that a large proportion offirms in the sample were new firms bythis definition. Also, the small firms inthis study might best be considered verysmall as the categorical definitions wereless than 20 employees and less than $1million in annual sales, respectively. Thedefinition of “small” varies in the litera-ture depending in part on the particularindustries studied. Lastly, the populationwas from a single source, subscribersto Modern Woodworking magazine.Though this subscriber base is large andlikely representative of the larger sec-ondary wood products industry, somecaution is warranted in generalizingto firms outside Modern Woodworkingsubscribers.
ReferencesAraujo, L., and M. Spring (2006). “Ser-
vices, Products, and the InstitutionalStructure of Production,” IndustrialMarketing Management 35, 797–805.
Baker, P. (1995). “Small Firms, IndustrialDistricts, and Power Asymmetries,”International Journal of Entrepre-neurial Behaviour and Research 1(1),8–25.
Barth, H. (2003). “Fit among CompetitiveStrategy, Administrative Mechanisms,and Performance: A ComparativeStudy of Small Firms in Mature andNew Industries,” Journal of SmallBusiness Management 41(2), 133–147.
Bhide, A. (1994). “How EntrepreneursCraft Strategies That Work,” HarvardBusiness Review 72(2), 150–161.
JOURNAL OF SMALL BUSINESS MANAGEMENT596

Boyd, H., O. Walker, and J. Larreche(1995). Marketing Management: AStrategic Approach with a Global Ori-entation, 2nd ed. Chicago, IL: Irwin.
Buehlmann, U., M. Bumgardner, T. Lihra,and M. Frye (2006). “Attitudes of U.S.Retailers toward China, Canada, andthe United States as ManufacturingSources for Furniture: An Assessmentof Competitive Priorities,” Journal ofGlobal Marketing 20(1), 61–73.
Buehlmann, U., M. Bumgardner, A.Schuler, and J. Crissey (2008). “Man-aging the Downturn,” Modern Wood-working, April, 40–49.
Bumgardner, M., U. Buehlmann, A.Schuler, and B. Wisdom (2005).“Approaches to, and Perceived Ben-efits of, Training in the SecondaryWood Industry,” Wood and FiberScience 37(3), 384–393.
Bumgardner, M., R. Romig, and W.Luppold (2007). “Wood Use by Ohio’sAmish Furniture Cluster,” Forest Prod-ucts Journal 57(12), 6–12.
Davidsson, P., B. Kirchhoff, A. Hatemi-J,and H. Gustavsson (2002). “EmpiricalAnalysis of Business Growth FactorsUsing Swedish Data,” Journal of SmallBusiness Management 40(4), 332–349.
Dean, T. J., R. L. Brown, and C. E.Bamford (1998). “Differences in Largeand Small Firm Responses to Environ-mental Context: Strategic Implicationsfrom a Comparative Analysis of Busi-ness Formations,” Strategic Manage-ment Journal 19, 709–728.
DeDee, J. K., and D. W. Vorhies (1998).“Retrenchment Activities of SmallFirms During Economic Downturn:An Empirical Investigation,” Journalof Small Business Management 36(3),46–61.
Deitz, R., and J. Orr (2006). “A Leaner,More Skilled U.S. ManufacturingWorkforce,” Current Issues in Eco-nomics and Finance 12(2), 1–7.
Diez-Vial, I. (2009). “Firm Size Effects onVertical Boundaries,” Journal of SmallBusiness Management 47(2), 137–153.
Ellis, P., and A. Pecotich (2001). “SocialFactors Influencing Export Initiationin Small and Medium-Sized Enter-prises,” Journal of MarketingResearch 38(1), 119–130.
Ghemawat, P. (1986). “SustainableAdvantage,” Harvard Business Review64(5), 53–58.
Gilmore, A., D. Carson, A. O’Donnell,and D. Cummins (1999). “AddedValue: A Qualitative Assessmentof SME Marketing,” Irish MarketingReview 12(1), 27–35.
Hardwood Review (2007). “Market Com-ments,” Hardwood Review Weekly24(9), 16–17.
Harrigan, K. R., and M. E. Porter (1983).“End-Game Strategies for DecliningIndustries,” Harvard Business Review83(4), 111–120.
Hofer, C. W. (1980). “Turnaround Strate-gies,” Journal of Business Strategy1(1), 19–31.
Huang, X., and A. Brown (1999). “AnAnalysis and Classification of Prob-lems in Small Business,” InternationalSmall Business Journal 18(1), 73–85.
Joint Center for Housing Studies ofHarvard University (2008). The Stateof the Nation’s Housing: 2008. Cam-bridge, MA: President and Fellows ofHarvard College.
Kangasharju, A. (2000). “Growth of theSmallest: Determinants of Small FirmGrowth during Strong MacroeconomicFluctuations,” International SmallBusiness Journal 19(1), 28–43.
Latham, S. (2009). “Contrasting StrategicResponse to Economic Recession inStart-Up versus Established SoftwareFirms,” Journal of Small BusinessManagement 47(2), 180–201.
Lawless, R. M., and E. Warren (2005).“The Myth of the Disappearing Busi-ness Bankruptcy,” California LawReview 93(3), 743–795.
Lihra, T., U. Buehlmann, and R. Beaure-gard (2008). “Mass Customisation ofWood Furniture as a Competitive
BUMGARDNER ET AL. 597
Strategy,” International Journal ofMass Customisation 2(3/4), 200–215.
Luppold, W., and M. Bumgardner (2008).“Forty Years of Hardwood LumberConsumption: 1963 to 2002,” ForestProducts Journal 58(5), 6–12.
Luppold, W., and M. Bumgardner (2009).“Patterns of Hardwood Sawmill Indus-try Concentration: Tennessee CaseStudy, 1979 to 2005,” Forest ProductsJournal 59(5), 76–80.
Michael, S. C., and D. K. Robbins (1998).“Retrenchment Among Small Manu-facturing Firms During Recession,”Journal of Small Business Manage-ment 36(3), 35–45.
Mulhern, A. (1995). “The SME Sector inEurope: A Broad Perspective,”Journal of Small Business Manage-ment 33(3), 83–87.
National Association of Home Builders(2008). Long Term Forecast 2017—Long-Term Trend Housing Produc-tion: How Will We Get There fromHere? Washington, DC: NAHB/Housing Economics.
Pearce, J. A., and S. C. Michael (1997).“Marketing Strategies that Make Entre-preneurial Firms Recession-Resistant,”Journal of Business Venturing 12,301–314.
Penrose, E. (1995). The Theory of theGrowth of the Firm, 3rd ed. Oxford,NY: Oxford University Press.
Pine, J. B. (1993). Mass Customization:The New Frontier in Business Compe-tition. Boston, MA: Harvard BusinessSchool Press.
Porter, M. E. (1980). Competitive Strat-egy. New York: The Free Press.
Russell, T. (2009). “Henredon OffersMore Options,” Furniture/Today33(47), 1, 8.
Schuler, A., and U. Buehlmann (2003).Identifying Future Competitive Busi-ness Strategies for the U.S. FurnitureIndustry: Benchmarking and Para-digm Shifts. Gen. Tech. Rep. NE-304.Newtown Square, PA: U.S. Depart-ment of Agriculture, Forest Service,Northeastern Research Station.
Serrasqueiro, Z. S., and P. M. Nunes(2008). “Performance and Size:Empirical Evidence from PortugueseSMEs,” Small Business Economics 31,195–217.
Shama, A. (1993). “Marketing StrategiesDuring Recession: A Comparison ofSmall and Large Firms,” Journal ofSmall Business Management 31(3),62–72.
Terreri, A. (2008). “Amish FurnitureMakers Succeed in Cluster,” Timber-Line 14(5), 16–23.
U.S. Census Bureau (2009). “AnnualValue of Private Construction Put inPlace 2002–2008,” http://www.census.gov/const/C30/private.pdf. (accessedon October 19, 2009).
JOURNAL OF SMALL BUSINESS MANAGEMENT598