competition in new zealand: an analysis using micro … · competition in new zealand: an analysis...
TRANSCRIPT

899417
Competition in New Zealand: An analysis using micro data Philip Stevens, Ministry of Economic Development
Abstract
Understanding the relationship between competition and economic performance is
critical to developing government policy and regulation to support a dynamic and
growing economy. Recently it has been suggested that there exists an inverted U-
Shaped relationship between competition and economic performance. Up to a certain
point, increased competition stimulates more innovation as firms try to escape
competition. However, innovation is often a costly activity and so requires the
prospect of rents in order to be undertaken. Thus, it may be that in some sectors
competition impedes innovation and growth, as Schumpeterian effects dominate and
post-innovation rents are competed away. We currently have little or no information
of the degree of competition in the majority of the sectors of the NZ economy and
much less still of how this compares with other economies. This paper uses a rich
source of information, the prototype Longitudinal Business Database, to examine the
nature and extent of competition in New Zealand. Unlike most other studies in this
area internationally, we have information on essentially the whole population of
economically significant firms. Another innovation is that we have information on
firms own perception of competition in a subset of firms.
JEL Classifications:
Keywords: Micro data; competition: firm performance;
Corresponding author: Philip Stevens, Economic Strategy Branch, Ministry of
Economic Development, 33 Bowen Street, PO Box 1473,
Wellington 6011, New Zealand, E-mail:

899417
Disclaimer
The opinions, findings, recommendations and conclusions expressed in this report are
those of the author(s). Statistics NZ, MED, and Motu take no responsibility for any
omissions or errors in the information contained here.
Access to the data used in this study was provided by Statistics NZ in accordance with
security and confidentiality provisions of the Statistics Act 1975. Only people
authorised by the Statistics Act 1975 are allowed to see data about a particular,
business or organisation. The results in this paper have been confidentialised to
protect individual businesses from identification.
The results are based in part on tax data supplied by Inland Revenue to Statistics NZ
under the Tax Administration Act 1994. This tax data must be used only for statistical
purposes, and no individual information is published or disclosed in any other form,
or provided back to Inland Revenue for administrative or regulatory purposes. Any
person who had access to the unit-record data has certified that they have been shown,
have read and have understood section 81 of the Tax Administration Act 1994, which
relates to privacy and confidentiality. Any discussion of data limitations or
weaknesses is not related to the data's ability to support Inland Revenue's core
operational requirements.
Any table or other material in this report may be reproduced and published without
further licence, provided that it does not purport to be published under government
authority and that acknowledgement is made of this source.

899417 3
1 Introduction
Understanding the relationship between competition and economic performance is
critical to developing government policy and regulation to support a dynamic and
growing economy. Most economists believe that competition is an important
determinant of economic performance and, hence, welfare. However, theory and
evidence have not always been in accord. Recently, it has been suggested that there
exists an inverted U-Shaped relationship between competition and economic
performance. Up to a certain point, increased competition stimulates more innovation
as firms try to escape competition. However, innovation is often a costly activity and
so requires the prospect of rents in order to be undertaken. Thus, it may be that in
some sectors competition impedes innovation and growth, as Schumpeterian effects
dominate and post-innovation rents are competed away. We currently have little or
no information of the degree of competition in the majority of the sectors of the NZ
economy and much less still of how this compares with other economies. This paper
uses a rich source of information, the prototype Longitudinal Business Database
(LBD), to examine the nature and extent of competition in New Zealand.
In section 2 we consider why competition is considered important and present
some methods suggested for measuring it. In section 3, we outline our method and in
section 4, our data. In section 5, we present our results. Section 6 concludes.
2 Background
‘The European Commission fined Intel a record 1.06 billion euros
Wednesday for abusing its dominance in the computer chip market, the
strongest sign yet that regulators worldwide are serious about opening the
technology sector to competition’.
New York Times 13 May 2009.
‘As Richard Caves remarks, economists have a “vague suspicion that
competition is the enemy of sloth” (Caves, 1980, p.88)’.
Nickell (1995), p. 66.
Competition is important, but it is not always clear precisely what is meant by it. As
the first quotation shows, many governments and inter-government agencies think

899417 4
that a lack of competition is very bad for citizens’ welfare. As the second quotation
illustrates, whilst many economists think it is one if not the most important factors in
the performance of economies, theories of what competition actually is and how it
operates are often unconvincing, piecemeal and/or contradictory.
2.1 What is competition?
Nickell (1995) asks the question ‘how does competition work?’ and comes up with
two broad mechanisms: managerial (and staff) effort, and its effects on innovation.
The first is the essentially view that competition improves performance in static
(efficiency) terms, the second relates to the dynamic context1. Nickel noted, however,
that theory was ambiguous on the direction of the effect of competition in either of
these contexts and evidence was sketchy. Whereas work like Vickers (1992) show
that competition tends to raise managerial effort and hence company performance,
Martin (1995) shows that a reduction in demand associated with an increase in the
numbers of competitors. Similarly, whereas Porter (1990) strongly argues for the role
in competition in promoting innovation, Schumpeter (1943) and subsequent writers
such as Aghion and Howitt (1992) and Grossman and Helpman (1991) suggest that
competition lowers both the rents from which innovative activity can be funded and
the post innovation rents, the hope of which stimulates such activity.
This conclusion was mirrored ten years later in Aghion and Griffith (2006).
The work of these two authors, with various other co-authors2 brought the two
alternative views together into a framework whereby the relationship between
competition and outcomes is U-shaped. That is, by allowing the first derivative of
economic performance with respect to competition to be both positive and negative at
different points. Policy, therefore, depends crucially upon where we are on the
competition-performance schedule.
1 Tirole (1988) concludes something similar when he considers the strategic interaction of firms in a
game-theoretic industrial organisation framework. He classifies the many instruments firms use to
compete in a market according to the speed at which they can be altered. In the short run, firms
compete by altering their price, advertising and sales effort. In the medium term firms can change their
cost structures and product characteristics (within given cost and production sets – technology, in
economics parlance). Finally, in the long run, the product characteristics and the cost structures
themselves (i.e. shift the frontier of the production and cost sets) can be changed through research and
development (p. 205). 2 E.g. Aghion, Bloom, Blundell, Griffith and Howitt (2002, 2005), Aghion, Griffith and Howitt (2006a
and 2006b).

899417 5
2.2 Competition in New Zealand
New Zealand is generally thought to have a good competition environment. It has
sound competition law plus it has very low barriers to international trade and
investment (Crawford, 2006). Crawford summarises the (sparse) economic literature
on competition in New Zealand as falling into three main categories, or mixes of
them:
• expert commentary on the application of competition policy in particular cases
• descriptive statistics on characteristics of New Zealand industry relevant to
competition policy (of which he lists none)
• econometric studies (of which he lists just one: Fabling and Grimes, 2006)
This current paper sits in the second category, although as the first part of a two-year
study that will include work that is firmly in the latter category.
2.3 Measuring Competition
The difficulties economists have defining precisely what competition is and how it
works mean that there are many ways in which it might be measured. Since
competition is essentially a process, we can divide the groups of potential measures
into three that relate to the causes of competition being as it is, the activities that take
place in the act of competing and the outcomes of competitive behaviour3:
Figure 1
Of course the world is seldom as simple as this. Outcomes of one ‘round’ of
competition can be the strategic instruments in a longer game. Thus, a particular level
of innovation may be the outcome of a competitive process, but as many authors have
3 This three-way split is very much in the spirit of the structure-conduct-performance paradigm. See
Sawyer (1985) for a critique and Nickell (1996) for an apology of sorts.
Determinants
• fixed costs
• patents
• substitutability
Activities
• entry/exit
• pricing
• advertising
Outcomes
• profits
• market-share
• innovation

899417 6
noted, innovation itself is a means whereby firms seek to compete (or indeed escape
from competition).
Aghion and Griffith (2006) divide the determinants of competition into two:
entry deterrents and the substitutability of products. Barriers to entry include patents
and economies of scale (i.e. high fixed-costs). A literature matching patents to firm
performance has recently grown up. However, whilst this is fine when using patents
as a measure of innovative activity, it is often not clear which ones are actually active
– i.e. relate to products being produced in the market. Such, measures may be useful
in studies of single (or few) markets; as a general measure they are both resource-
intensive to construct and suffer from problems of comparability across sectors and
technologies (something other measures are not immune to either, of course).
Below we set out a section of the more popular measures of competition.
Concentration Ratio
Perhaps the simplest measure of a market’s competitiveness is the concentration ratio.
This takes a number of firms (say five) and measures the amount of the total market
sales accounted for by these firms. Thus, the k-firm concentration ratio in industry j is
given by:
(1) ∑
∑
∈
∈==
ji
i
k
jll
l
k
jSales
Sales
C,1
The downsides of this measure are threefold. First, it does not account for the
competitive pressures from outside New Zealand, beyond the market for domestic
firms (i.e. FDI). Imports are an important element in many markets. Second, it
suffers from the problems of defining the extent of the market in terms of product or
services. Such measures are based on industry classifications. Not only are these
based on methods of production, rather than on products or services, but firms are
assigned to an industry by some measure of predominance (e.g. sales). Third, the
choice of the number of firms to include in the measure is essentially arbitrary, albeit
informed by experience.

899417 7
Market Share
Market share is a measure of the competitive pressure from the perspective of the
firm. It is given simply by:
(2) ∑
=
l
l
ii
Sales
Salesmksh where jli ∈,
Again, we come up against the problems of the definition of the market and the
problems outlined above.
Herfindahl Index
Named after Orris C. Herfindahl4, the Herfindahl Index is defined as the sum of the
squares of the market shares of firms within the industry5, where the market shares are
expressed as percentages. The result is proportional to the average market share,
weighted by market share
(3) ∑=i
imkshH 2
Many jurisdictions use the Herfindahl Index to determine whether mergers are
detrimental to welfare. Take for example, the Antitrust Division of the United States
Department of Justice. According to the 1992 Horizontal Merger Guidelines issued
by the U.S. Department of Justice and the Federal Trade Commission6, the agencies
will regard a market in which the post-merger Herfindahl Index is below 0.1 as
‘unconcentrated’. Those between 0.1 and 0.18 are considered to be ‘moderately
concentrated’, and those above 0.18 are considered ‘highly concentrated’. A merger
potentially raises ‘significant competitive concerns’ if it produces an increase in the
Herfindahl Index of more than 0.01 points in a moderately concentrated market or
more than 0.005 points in a highly concentrated market. A merger is presumed ‘likely
to create or enhance market power or facilitate its exercise’ if it produces an increase
in the Herfindahl Index of more than 0.01 points in a highly concentrated market’7.
4 Also called the Herfindahl-Hirschman after Albert O. Hirschman
5 This is sometimes limited to the top 50 firms, since once we get below the fiftieth largest firm, its
squared market share is getting very small indeed. 6 See U.S. Department of Justice and the Federal Trade Commission, Horizontal Merger Guidelines
http://www.usdoj.gov/atr/public/guidelines/horiz_book/hmg1.html 7 http://www.unclaw.com/chin/teaching/antitrust/herfindahl.htm
899417 8
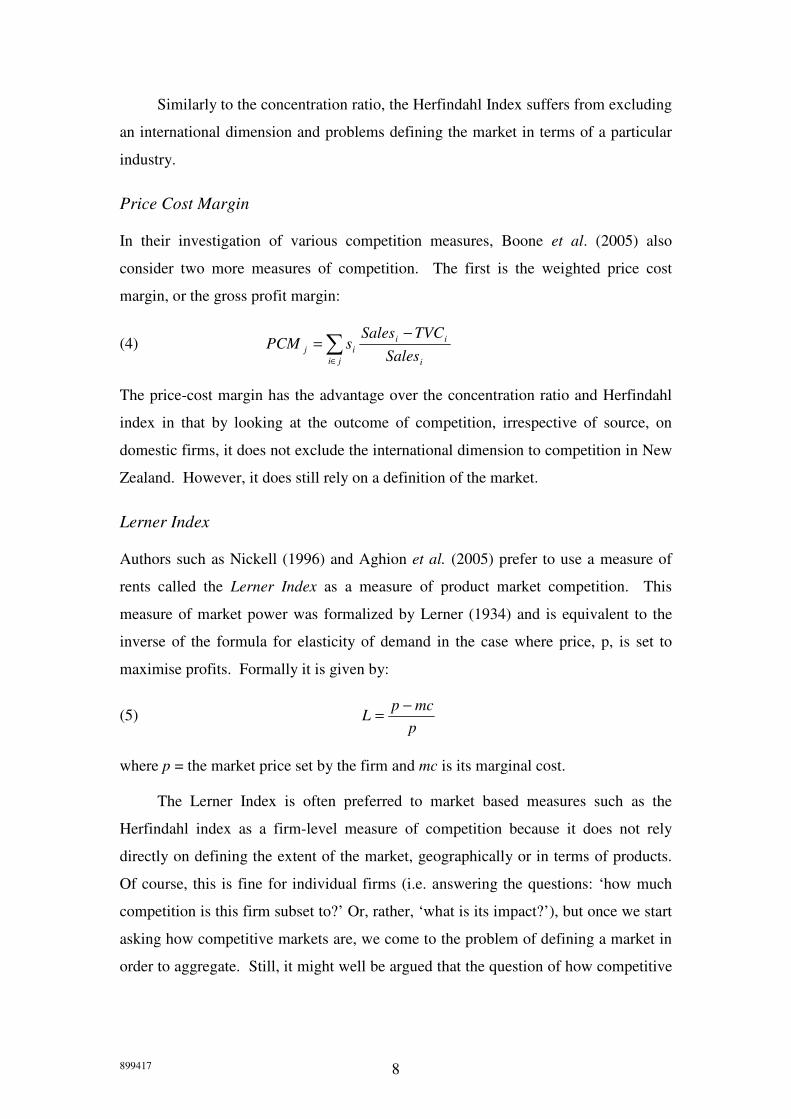
Similarly to the concentration ratio, the Herfindahl Index suffers from excluding
an international dimension and problems defining the market in terms of a particular
industry.
Price Cost Margin
In their investigation of various competition measures, Boone et al. (2005) also
consider two more measures of competition. The first is the weighted price cost
margin, or the gross profit margin:
(4) ∑∈
−=
ji i
ii
ijSales
TVCSalessPCM
The price-cost margin has the advantage over the concentration ratio and Herfindahl
index in that by looking at the outcome of competition, irrespective of source, on
domestic firms, it does not exclude the international dimension to competition in New
Zealand. However, it does still rely on a definition of the market.
Lerner Index
Authors such as Nickell (1996) and Aghion et al. (2005) prefer to use a measure of
rents called the Lerner Index as a measure of product market competition. This
measure of market power was formalized by Lerner (1934) and is equivalent to the
inverse of the formula for elasticity of demand in the case where price, p, is set to
maximise profits. Formally it is given by:
(5) p
mcpL
−=
where p = the market price set by the firm and mc is its marginal cost.
The Lerner Index is often preferred to market based measures such as the
Herfindahl index as a firm-level measure of competition because it does not rely
directly on defining the extent of the market, geographically or in terms of products.
Of course, this is fine for individual firms (i.e. answering the questions: ‘how much
competition is this firm subset to?’ Or, rather, ‘what is its impact?’), but once we start
asking how competitive markets are, we come to the problem of defining a market in
order to aggregate. Still, it might well be argued that the question of how competitive

899417 9
is New Zealand, could still be answered by such a measure, no matter how one
calculated the figure at the sub-aggregate level.
Prices and marginal costs are difficult to observe. Therefore, empirical
applications tend to use alternative definitions. Nickell (1996) uses the following
measure:
(6) VA
KCIPD ⋅−++Π
where Π = profits before tax, D = depreciation, IP = interest payments, C = cost of
capital, K = capital stock. The cost of capital is equal to
(7) λρδ ++rr .
where rr is the real interest rate, δ the rate of depreciation, ρ is the risk premium, and
λ is a weight (0≤λ≤1). The real interest rate is taken by Nickell to be equal to the
annual real gross redemption yield on 2 percent Treasury index linked 1996 securities.
The depreciation rate, δ, is assumed to be constant at 4 percent. The risk premium, ρ,
is equal to the firm’s average stock market return over the period 1972-86 less the
average short-term interest rate over the same period. The three rent variables used in
Nickell (1996) correspond to λ =0, λ =1 and λ = shareholders’ funds divided by the
sum of shareholders’ funds, debentures, bank loans, other loans, bank overdrafts,
acceptance credits and short-term borrowings. That is λ ≈ equity/(equity + debt).
Aghion et al. (2005) use the following measure based on operating profits n and
an estimated financial cost of capital, divided by sales:
(8) Sales
FCLA
−′=
Π
where Π' is operating profit net of depreciation and provisions8, FC is financial cost.
The cost of capital is assumed to be 0.085 for all firms and time periods and the
capital stock is measured using the perpetual inventory method. In an earlier working
paper version of this paper, the authors report a version of this excluding the financial
cost variable (Aghion et al., 2002), but note that there is little difference in their
results using each method.
8 This is the same as including depreciation and provisions in profits and then including them in the
cost of capital, as in Nickell (1996).

899417 10
To obtain an industry-level competition measure, Aghion et al. (2005) use the
average of their Lerner Index:
(9) ∑∈
−=ji
iA
j
jA LN
COMP ,,
11
where i indexes firms, j indexes industry and Nj is the number of firms in industry j.
In this paper we do not consider the Lerner index, for technical reasons. This is,
however, one of the ‘next cabs off the block’ as we develop the paper and the project.
3 Method
In this current paper we shall focus on three measures of competition: a firm’s market
share, the industry’s concentration ratio and Herfindahl Index. We also consider the
price-cost margin, but because of some problems with its calculation this is merely
exploratory at this stage. In this initial study, we shall define market/industry by both
four and three digit ANZSIC code. In later work we shall examine theoretically more
preferable measures such as the Lerner Index and Boone et al.’s (2005) relative
profits measure.
The precise definitions of these variables are as follows.
Concentration Ratio
We shall employ a five firm concentration ratio for the 3- and 4-digit (i.e. where j =
the 3-digit or 4-digit industries:
(10) ∑
∑
∈
∈==
ji
i
jll
l
jSales
Sales
C
5
,15
Sales is BAI Sales, adjusted to an ex-GST basis using data on zero-rated sales9.
Market Share
Likewise, market share as in equation (2), with sales as measured above, and defined
for both 3-digit and 4-digit industries (mksh3 and mksh4, respectively).
9 For more on this, see the Data Appendix.

899417 11
Herfindahl Index
The Herfindahl Index is simply the sum of the squares of the market shares as set out
in equation (3), again defined for both 3-digit and 4-digit industries (mksh3 and
mksh4, respectively).
Price Cost Margin
We estimate the price cost margin using the following simple calculation:
(11) ∑∈
−−=
ji i
iii
ijSales
PurchasesWagesSalessPCM
where Sales and Purchases come from the BAI and Wages is gross earnings from
LEED. One problem with this measure is that it combines revenue and expenditure
from two different sources. A simple alternative would be to use the IR10 financial
accounts. However, this would reduce the sample size somewhat and in particular we
would loose a number of larger firms10
. Since a major element to the analysis of
competitive behaviour is the presence or absence of large and potentially dominant
firms in a market or industry, this would be a serious omission. In future work we
will bring these sources together (along with data from the Annual Enterprise Survey,
which is skewed towards larger firms to maximise the proportion of value-added and
employment it covers) to generate more comprehensive measures of competition.
4 Data
The data come from Statistics New Zealand’s Longitudinal Business Database (LBD).
The LBD is built around the Longitudinal Business Frame (LBF), to which are
attached, among other things, Goods and Services Tax (GST) returns, financial
accounts (IR10) and aggregated Pay-As-You-Earn (PAYE) returns, all provided by
the Inland Revenue Department (IRD). The full LBD is described in more detail in
Fabling, Grimes, Sanderson and Stevens (2008). The survey data considered in this
paper relate to the Business Operations Survey (BOS) 2005, 2006 and 200711
.
The administrative data we use have four sources: counts of employees from
PAYE returns, the Business Activity Indicator (BAI) dataset, and IR10 forms. The
10
For more on this see Fabling, Grimes and Stevens (2008). 11
For a fuller description of the BOS and a comparison of both quantitative and qualitative data in the
BOS to alternative administrative sources, see Fabling, Grimes and Stevens (2008).

899417 12
BAI is derived from GST data, with the main manipulations applied being temporal
and group return apportionment and limited imputation for single missing returns. In
this paper, the BAI is the source for data on sales of goods and services, and
purchases. Financial accounts returns (IR10) are the source for information on
opening and closing stock. In later work we will use more comprehensive and
theoretically-correct measures of capital stock and value-added from the AES. The
variables used in this paper are discussed in more detail in the data appendix.
5 Results
Our measures of competition are presented in Table 1 to Table 6. These are
calculated at the 3- and 4-digit industry level and aggregated up to the 2-digit
(ANZSIC sub-division) level to prevent the paper turning into one long table. We
present separate tables for each measure (five-firm concentration ratio, Herfindahl
index and price-cost margin) and for each definition of the ‘market’ (3- and 4-digit
level). We present summary statistics – mean, median, upper and lower quartile,
weighted by value-added – for the (3- and 4-digit) markets that make up the (2-digit)
industry. Therefore, for the measures that take the market to be the 3-digit industry,
the first row of the table – A01 Agriculture – is made up of six markets. These
correspond to the 3-digit ANZSIC industry Groups: A011 Horticulture and Fruit
Growing, A012 Grain, Sheep and Beef Cattle Farming, A013 Dairy Cattle Farming,
A014 Poultry Farming, A015 Other Livestock Farming, and A016 Other Crop
Growing. For measures that take the market to be the 4-digit industry, A01 contains
21 markets, corresponding to 4-digit industry Classes from A0111 Plant Nurseries to
A0169 Crop and Plant Growing not elsewhere classified. Note that the figures are
pooled over financial years 2000 – 2007, so that the mean represents the average of all
industries over the entire period.
5.1 Concentration ratios
Our calculations of the proportion of total sales in a market accounted for by the five
largest firms are set out in Table 1 and Table 2. The first thing we note is the
considerable heterogeneity in the numbers. The average concentration ratio in sub
industries varies from under 5% in A01 Agriculture to over 90% in a couple of the
mining industries. As one would expect, the measures calculated at the 4-digit

899417 13
industry are generally higher than those at the 3-digit level (there are a couple of
exceptions, caused by our weighting by value added, which is sometimes negative12
).
The 2-digit industries containing the most concentrated markets are: B15
Services to Mining, B13 Metal Ore Mining, D37 Water Supply, Sewerage and
Drainage Services, I64 Air and Space Transport, and J71 Communication Services.
Whilst the ordering changes when we define the market as the 3- or 4-digit industry,
the top five remain the same. These all look like industries that potentially have large
fixed costs. Theory suggests that industries with high fixed costs will be characterised
by higher levels of concentration.
12
Weighting by sales would ensure that 4-digit measures are always greater than or equal to3-digit
measures, but value added gives a feel for the ‘importance’ of sub industries in economic terms.

899417 14
Table 1 5-firm concentration ratio for 3-digit industry (2000-07)
ANZSIC 1996 Industry (Sub Division) N mean P25 Median P75
A01 Agriculture 76,353 0.033 0.010 0.038 0.038 A02 Services to Agriculture; Hunting and Trapping 7,602 0.144 0.141 0.141 0.141
A03 Forestry and Logging 6,282 0.389 0.389 0.389 0.389
A04 Commercial Fishing 2,718 0.264 0.272 0.272 0.272
B13 Metal Ore Mining 111 0.903 0.903 0.903 0.903
B14 Other Mining 246 0.338 0.252 0.252 0.252
B15 Services to Mining 105 0.914 0.923 0.923 0.923
C21 Food, Beverage and Tobacco 2,133 0.691 0.576 0.630 0.894
C22 Textile, Clothing, Footwear and Leather Manufacturing
2,766 0.396 0.239 0.343 0.480
C23 Wood and Paper Product Manufacturing 2,937 0.481 0.338 0.399 0.775
C24 Printing, Publishing and Recorded Media 2,802 0.350 0.307 0.307 0.401
C25 Petroleum, Coal, Chemical and Associated Product Manufacturing
1,488 0.528 0.434 0.643 0.671
C26 Non-Metallic Mineral Product Manufacturing 990 0.684 0.645 0.645 0.753
C27 Metal Product Manufacturing 4,290 0.438 0.174 0.174 0.866
C28 Machinery and Equipment Manufacturing 7,077 0.363 0.099 0.472 0.544
C29 Other Manufacturing 4,092 0.163 0.140 0.140 0.142
D36 Electricity and Gas Supply 66 0.729 0.769 0.769 0.769
D37 Water Supply, Sewerage and Drainage Services
78 0.811 0.811 0.811 0.811
E41 General Construction 19,470 0.254 0.145 0.145 0.414
E42 Construction Trade Services 31,656 0.094 0.051 0.118 0.118
F45 Basic Material Wholesaling 4,203 0.522 0.320 0.674 0.674
F46 Machinery and Motor Vehicle Wholesaling 6,951 0.177 0.134 0.134 0.134
F47 Personal and Household Good Wholesaling 11,505 0.261 0.150 0.159 0.416
G51 Food Retailing 12,936 0.282 0.243 0.243 0.321
G52 Personal and Household Good Retailing 22,983 0.297 0.109 0.188 0.263
G53 Motor Vehicle Retailing and Services 12,372 0.143 0.134 0.148 0.148
H57 Accommodation, Cafes and Restaurants 14,637 0.131 0.095 0.175 0.175
I61 Road Transport 10,494 0.125 0.076 0.076 0.076
I63 Water Transport 414 0.557 0.557 0.557 0.557
I64 Air and Space Transport 588 0.732 0.732 0.732 0.732
I65 Other Transport 216 0.288 0.288 0.288 0.288
I66 Services to Transport 3,051 0.250 0.195 0.195 0.195
I67 Storage 417 0.399 0.399 0.399 0.399
J71 Communication Services 4,305 0.823 0.895 0.895 0.895
K73 Finance 5,361 0.401 0.378 0.378 0.378
K74 Insurance 159 0.648 0.651 0.651 0.651
K75 Services to Finance and Insurance 5,016 0.239 0.220 0.255 0.255
L77 Property Services 73,968 0.110 0.059 0.059 0.149
L78 Business Services 61,812 0.235 0.152 0.163 0.355
N84 Health Services 3,066 0.200 0.107 0.107 0.349
O86 Community Services 13,722 0.113 0.033 0.033 0.189
O87 Motion Picture, Radio and Television Services 1,746 0.129 0.098 0.141 0.141
P91 Libraries, Museums and the Arts 2,646 0.695 0.281 0.890 0.890
P92 Sport and Recreation 4,188 0.215 0.151 0.151 0.250
P93 Personal Services 4,245 0.563 0.225 0.887 0.887
* N = Average number of firms in the 2-digit industry sub division over entire period
* Counts of firms random-rounded to base 3 for confidentiality reasons
3-digit measures summarised at the 2-digit level weighted by value-added

899417 15
Table 2 5-firm concentration ratio for 4-digit industry (2000-07)
ANZSIC 1996 Industry (Sub Division) N mean P25 Median P75
A01 Agriculture 76,353 0.055 0.010 0.042 0.069 A02 Services to Agriculture; Hunting and Trapping 7,602 0.161 0.158 0.158 0.158
A03 Forestry and Logging 6,282 0.415 0.133 0.319 0.695
A04 Commercial Fishing 2,718 0.311 0.234 0.354 0.383
B13 Metal Ore Mining 111 0.803 0.953 0.953 0.953
B14 Other Mining 246 0.445 0.372 0.372 0.383
B15 Services to Mining 105 0.946 0.965 0.965 0.965
C21 Food, Beverage and Tobacco 2,133 0.813 0.655 0.885 0.976
C22 Textile, Clothing, Footwear and Leather Manufacturing
2,766 0.517 0.239 0.512 0.718
C23 Wood and Paper Product Manufacturing 2,937 0.589 0.417 0.417 0.969
C24 Printing, Publishing and Recorded Media 2,802 0.439 0.336 0.336 0.531
C25 Petroleum, Coal, Chemical and Associated Product Manufacturing
1,488 0.786 0.620 0.857 0.994
C26 Non-Metallic Mineral Product Manufacturing 990 0.814 0.795 0.857 0.857
C27 Metal Product Manufacturing 4,290 0.552 0.241 0.334 0.972
C28 Machinery and Equipment Manufacturing 7,077 0.531 0.283 0.607 0.861
C29 Other Manufacturing 4,092 0.276 0.115 0.230 0.359
D36 Electricity and Gas Supply 66 0.729 0.769 0.769 0.769
D37 Water Supply, Sewerage and Drainage Services
78 0.884 0.818 0.818 0.970
E41 General Construction 19,470 0.305 0.057 0.319 0.389
E42 Construction Trade Services 31,656 0.140 0.088 0.123 0.134
F45 Basic Material Wholesaling 4,203 0.615 0.402 0.717 0.922
F46 Machinery and Motor Vehicle Wholesaling 6,951 0.334 0.271 0.317 0.444
F47 Personal and Household Good Wholesaling 11,505 0.407 0.211 0.349 0.534
G51 Food Retailing 12,936 0.323 0.299 0.321 0.321
G52 Personal and Household Good Retailing 22,983 0.359 0.161 0.243 0.449
G53 Motor Vehicle Retailing and Services 12,372 0.169 0.097 0.142 0.142
H57 Accommodation, Cafes and Restaurants 14,637 0.131 0.095 0.175 0.175
I61 Road Transport 10,494 0.146 0.076 0.076 0.076
I63 Water Transport 414 0.710 0.708 0.708 0.708
I64 Air and Space Transport 588 0.846 0.858 0.858 0.858
I65 Other Transport 216 0.323 0.292 0.292 0.292
I66 Services to Transport 3,051 0.387 0.323 0.323 0.329
I67 Storage 417 0.402 0.400 0.400 0.400
J71 Communication Services 4,305 0.836 0.895 0.895 0.895
K73 Finance 5,361 0.382 0.378 0.378 0.378
K74 Insurance 159 0.684 0.679 0.679 0.679
K75 Services to Finance and Insurance 5,016 0.284 0.252 0.255 0.255
L77 Property Services 73,968 0.131 0.062 0.062 0.149
L78 Business Services 61,812 0.310 0.195 0.242 0.333
N84 Health Services 3,066 0.213 0.107 0.107 0.349
O86 Community Services 13,722 0.166 0.038 0.099 0.282
O87 Motion Picture, Radio and Television Services 1,746 0.181 0.098 0.147 0.147
P91 Libraries, Museums and the Arts 2,646 0.797 0.590 0.977 0.977
P92 Sport and Recreation 4,188 0.272 0.072 0.072 0.542
P93 Personal Services 4,245 0.620 0.234 0.618 0.995
* N = Average number of firms in the 2-digit industry sub division over entire period
* Counts of firms random-rounded to base 3 for confidentiality reasons
4-digit measures summarised at the 2-digit level weighted by value-added

899417 16
5.2 Herfindahl indices
Our calculation of Herfindahl indices for 3- and 4-digit industries are summarised in
Table 3 and Table 4, respectively. Again there is considerable heterogeneity in our
measure across industries. The rankings of industries are similar to the concentration
ratios, although this is not an identity. When we define the market as the 3-digit
industry, the Herfindahl index yields the same top five industries in terms of
concentration as the five-firm concentration ratios. However, when we define the
market as the 4-digit industry, the Herfindahl index yields a couple of new entries in
the top five most concentrated industries: D37 Water Supply, Sewerage and Drainage
Services, B15 Services to Mining, I64 Air and Space Transport, C21 Food, Beverage
and Tobacco, and C25 Petroleum, Coal, Chemical and Associated Product
Manufacturing.
We noted in our introduction that the U.S. Department of Justice and the
Federal Trade Commission regard a market in which the post-merger Herfindahl
Index above 0.18 as ‘highly concentrated’. An interesting exercise is to consider how
many of our 2-digit industries look ‘highly concentrated’ on average by this
definition. When we calculate the Herfindahl index using the definition of a market
as the 3-digit industry (Table 3) we find that six out of 47 industries are highly
concentrated. When we define the market as the 4-digit industry, we find 13. We
must, however, add a number of caveats to this exercise. First, the US economy is
considerably larger than the New Zealand one, and so a large firm in the US context
might well be larger than the whole industry in New Zealand. Second, we have not
included the international dimension to our analysis. New Zealand is a small, open
economy and imports play an important part in many markets. Third, many of the
large firms in New Zealand are international firms, exporting a large portion of their
commodities and goods abroad.

899417 17
Table 3 Herfindahl index for 3-digit industry (2000-7)
ANZSIC 1996 Industry (Sub Division) N mean P25 Median P75
A01 Agriculture 76,353 0.001 0.000 0.001 0.001
A02 Services to Agriculture; Hunting and Trapping 7,602 0.007 0.006 0.006 0.006
A03 Forestry and Logging 6,282 0.055 0.055 0.055 0.055
A04 Commercial Fishing 2,718 0.024 0.026 0.026 0.026
B13 Metal Ore Mining 111 0.378 0.378 0.378 0.378
B14 Other Mining 246 0.067 0.032 0.032 0.032
B15 Services to Mining 105 0.442 0.490 0.490 0.490
C21 Food, Beverage and Tobacco 2,133 0.251 0.093 0.095 0.477
C22 Textile, Clothing, Footwear and Leather Manufacturing
2,766 0.055 0.021 0.036 0.076
C23 Wood and Paper Product Manufacturing 2,937 0.083 0.039 0.049 0.184
C24 Printing, Publishing and Recorded Media 2,802 0.036 0.026 0.026 0.049
C25 Petroleum, Coal, Chemical and Associated Product Manufacturing
1,488 0.131 0.057 0.123 0.123
C26 Non-Metallic Mineral Product Manufacturing 990 0.157 0.134 0.134 0.204
C27 Metal Product Manufacturing 4,290 0.164 0.010 0.010 0.376
C28 Machinery and Equipment Manufacturing 7,077 0.074 0.005 0.111 0.112
C29 Other Manufacturing 4,092 0.012 0.008 0.008 0.009
D36 Electricity and Gas Supply 66 0.099 0.145 0.145 0.145
D37 Water Supply, Sewerage and Drainage Services 78 0.295 0.295 0.295 0.295
E41 General Construction 19,470 0.025 0.007 0.007 0.052
E42 Construction Trade Services 31,656 0.004 0.001 0.005 0.005
F45 Basic Material Wholesaling 4,203 0.072 0.033 0.101 0.101
F46 Machinery and Motor Vehicle Wholesaling 6,951 0.013 0.007 0.007 0.007
F47 Personal and Household Good Wholesaling 11,505 0.023 0.009 0.011 0.042
G51 Food Retailing 12,936 0.037 0.021 0.021 0.055
G52 Personal and Household Good Retailing 22,983 0.057 0.004 0.015 0.021
G53 Motor Vehicle Retailing and Services 12,372 0.007 0.006 0.006 0.007
H57 Accommodation, Cafes and Restaurants 14,637 0.006 0.004 0.007 0.007
I61 Road Transport 10,494 0.010 0.004 0.004 0.004
I63 Water Transport 414 0.112 0.112 0.112 0.112
I64 Air and Space Transport 588 0.288 0.288 0.288 0.288
I65 Other Transport 216 0.029 0.029 0.029 0.029
I66 Services to Transport 3,051 0.038 0.017 0.017 0.017
I67 Storage 417 0.046 0.046 0.046 0.046
J71 Communication Services 4,305 0.332 0.393 0.393 0.393
K73 Finance 5,361 0.047 0.046 0.046 0.046
K74 Insurance 159 0.121 0.125 0.125 0.125
K75 Services to Finance and Insurance 5,016 0.019 0.018 0.020 0.020
L77 Property Services 73,968 0.008 0.002 0.002 0.009
L78 Business Services 61,812 0.025 0.008 0.008 0.051
N84 Health Services 3,066 0.025 0.006 0.006 0.043
O86 Community Services 13,722 0.009 0.001 0.001 0.012
O87 Motion Picture, Radio and Television Services 1,746 0.008 0.006 0.009 0.009
P91 Libraries, Museums and the Arts 2,646 0.171 0.028 0.238 0.238
P92 Sport and Recreation 4,188 0.020 0.008 0.008 0.020
P93 Personal Services 4,245 0.223 0.017 0.414 0.414
* N = Average number of firms in the 2-digit industry sub division over entire period
* Counts of firms random-rounded to base 3 for confidentiality reasons
3-digit measures summarised at the 2-digit level weighted by value-added

899417 18
Table 4 Herfindahl index for 3-digit industry (2000-7)
ANZSIC 1996 Industry (Sub Division) N mean P25 Median P75
A01 Agriculture 76,353 0.003 0.000 0.001 0.003 A02 Services to Agriculture; Hunting and Trapping 7,602 0.009 0.008 0.008 0.008
A03 Forestry and Logging 6,282 0.090 0.008 0.054 0.175
A04 Commercial Fishing 2,718 0.043 0.019 0.043 0.052
B13 Metal Ore Mining 111 0.514 0.514 0.514 0.514
B14 Other Mining 246 0.085 0.043 0.043 0.071
B15 Services to Mining 105 0.464 0.542 0.542 0.542
C21 Food, Beverage and Tobacco 2,133 0.374 0.128 0.391 0.616
C22 Textile, Clothing, Footwear and Leather Manufacturing
2,766 0.100 0.021 0.085 0.139
C23 Wood and Paper Product Manufacturing 2,937 0.186 0.056 0.056 0.353
C24 Printing, Publishing and Recorded Media 2,802 0.080 0.032 0.032 0.106
C25 Petroleum, Coal, Chemical and Associated Product Manufacturing
1,488 0.361 0.133 0.308 0.637
C26 Non-Metallic Mineral Product Manufacturing 990 0.326 0.204 0.272 0.272
C27 Metal Product Manufacturing 4,290 0.225 0.024 0.059 0.478
C28 Machinery and Equipment Manufacturing 7,077 0.183 0.025 0.101 0.340
C29 Other Manufacturing 4,092 0.061 0.006 0.019 0.040
D36 Electricity and Gas Supply 66 0.099 0.145 0.145 0.145
D37 Water Supply, Sewerage and Drainage Services 78 0.473 0.449 0.449 0.504
E41 General Construction 19,470 0.044 0.002 0.033 0.047
E42 Construction Trade Services 31,656 0.018 0.003 0.006 0.007
F45 Basic Material Wholesaling 4,203 0.131 0.055 0.170 0.220
F46 Machinery and Motor Vehicle Wholesaling 6,951 0.039 0.022 0.032 0.059
F47 Personal and Household Good Wholesaling 11,505 0.067 0.014 0.050 0.106
G51 Food Retailing 12,936 0.066 0.055 0.055 0.080
G52 Personal and Household Good Retailing 22,983 0.073 0.012 0.017 0.088
G53 Motor Vehicle Retailing and Services 12,372 0.023 0.003 0.008 0.010
H57 Accommodation, Cafes and Restaurants 14,637 0.006 0.004 0.007 0.007
I61 Road Transport 10,494 0.019 0.004 0.004 0.004
I63 Water Transport 414 0.174 0.174 0.174 0.174
I64 Air and Space Transport 588 0.411 0.449 0.449 0.449
I65 Other Transport 216 0.046 0.030 0.030 0.030
I66 Services to Transport 3,051 0.066 0.035 0.039 0.039
I67 Storage 417 0.048 0.047 0.047 0.047
J71 Communication Services 4,305 0.360 0.393 0.393 0.393
K73 Finance 5,361 0.038 0.046 0.046 0.046
K74 Insurance 159 0.137 0.134 0.134 0.134
K75 Services to Finance and Insurance 5,016 0.028 0.020 0.020 0.022
L77 Property Services 73,968 0.016 0.002 0.002 0.009
L78 Business Services 61,812 0.057 0.011 0.018 0.037
N84 Health Services 3,066 0.032 0.006 0.006 0.043
O86 Community Services 13,722 0.020 0.001 0.005 0.028
O87 Motion Picture, Radio and Television Services 1,746 0.020 0.006 0.011 0.011
P91 Libraries, Museums and the Arts 2,646 0.254 0.116 0.339 0.339
P92 Sport and Recreation 4,188 0.041 0.003 0.003 0.093
P93 Personal Services 4,245 0.289 0.018 0.156 0.587
* N = Average number of firms in the 2-digit industry sub division over entire period
* Counts of firms random-rounded to base 3 for confidentiality reasons
4-digit measures summarised at the 2-digit level weighted by value-added
899417 19
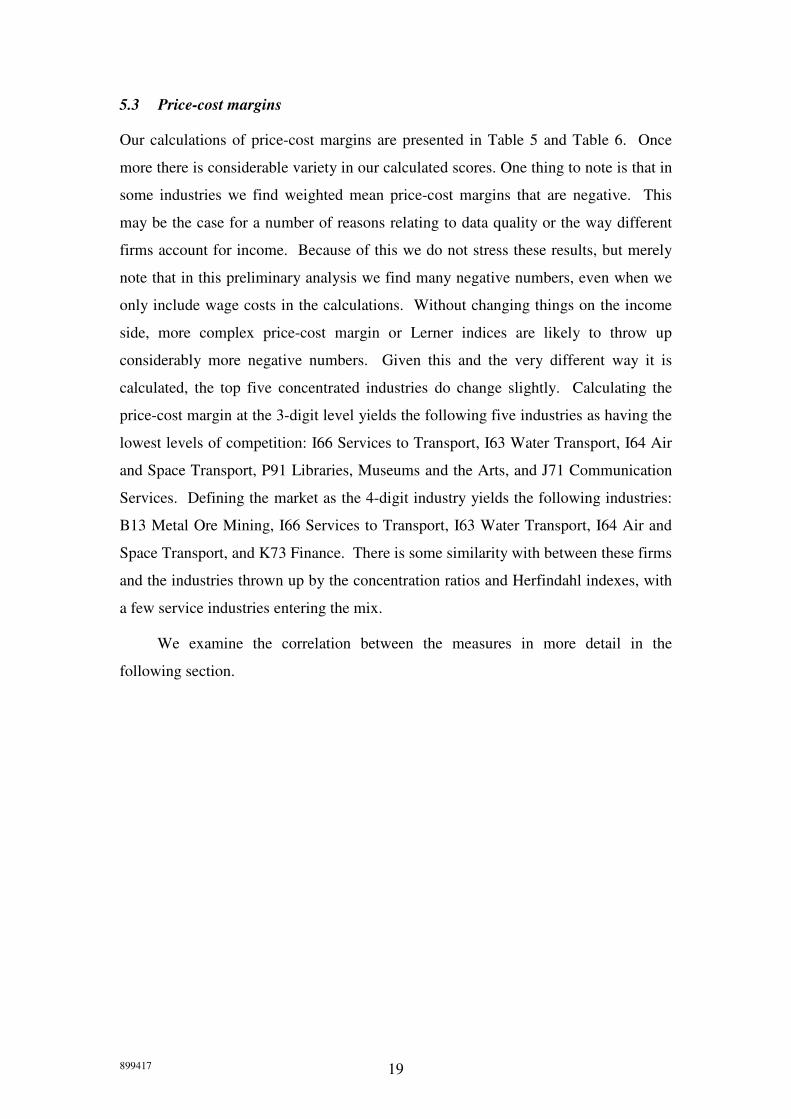
5.3 Price-cost margins
Our calculations of price-cost margins are presented in Table 5 and Table 6. Once
more there is considerable variety in our calculated scores. One thing to note is that in
some industries we find weighted mean price-cost margins that are negative. This
may be the case for a number of reasons relating to data quality or the way different
firms account for income. Because of this we do not stress these results, but merely
note that in this preliminary analysis we find many negative numbers, even when we
only include wage costs in the calculations. Without changing things on the income
side, more complex price-cost margin or Lerner indices are likely to throw up
considerably more negative numbers. Given this and the very different way it is
calculated, the top five concentrated industries do change slightly. Calculating the
price-cost margin at the 3-digit level yields the following five industries as having the
lowest levels of competition: I66 Services to Transport, I63 Water Transport, I64 Air
and Space Transport, P91 Libraries, Museums and the Arts, and J71 Communication
Services. Defining the market as the 4-digit industry yields the following industries:
B13 Metal Ore Mining, I66 Services to Transport, I63 Water Transport, I64 Air and
Space Transport, and K73 Finance. There is some similarity with between these firms
and the industries thrown up by the concentration ratios and Herfindahl indexes, with
a few service industries entering the mix.
We examine the correlation between the measures in more detail in the
following section.

899417 20
Table 5 Price-cost margin for 3-digit industry (2000-07)
ANZSIC 1996 Industry (Sub Division) N mean P25 Median P75
A01 Agriculture 76,353 0.125 0.136 0.138 0.138
A02 Services to Agriculture; Hunting and Trapping 7,602 0.075 0.075 0.075 0.075
A03 Forestry and Logging 6,282 0.100 0.100 0.100 0.100
A04 Commercial Fishing 2,718 0.120 0.133 0.137 0.138
B13 Metal Ore Mining 111 -0.159 -0.206 -0.206 -0.206
B14 Other Mining 246 0.137 0.120 0.121 0.121
B15 Services to Mining 105 -0.088 -0.139 -0.139 -0.139
C21 Food, Beverage and Tobacco 2,133 0.226 -0.010 0.129 0.228
C22 Textile, Clothing, Footwear and Leather Manufacturing
2,766 0.096 0.079 0.097 0.110
C23 Wood and Paper Product Manufacturing 2,937 0.122 0.089 0.127 0.153
C24 Printing, Publishing and Recorded Media 2,802 0.135 0.111 0.111 0.167
C25 Petroleum, Coal, Chemical and Associated Product Manufacturing
1,488 0.191 0.110 0.130 0.264
C26 Non-Metallic Mineral Product Manufacturing 990 0.156 0.155 0.156 0.156
C27 Metal Product Manufacturing 4,290 0.124 0.093 0.120 0.151
C28 Machinery and Equipment Manufacturing 7,077 0.143 0.108 0.125 0.213
C29 Other Manufacturing 4,092 0.108 0.090 0.090 0.150
D36 Electricity and Gas Supply 66 0.191 0.170 0.170 0.170
D37 Water Supply, Sewerage and Drainage Services 78 0.062 0.059 0.065 0.065
E41 General Construction 19,470 0.068 0.066 0.066 0.070
E42 Construction Trade Services 31,656 0.120 0.120 0.120 0.131
F45 Basic Material Wholesaling 4,203 0.115 0.058 0.158 0.159
F46 Machinery and Motor Vehicle Wholesaling 6,951 0.060 0.066 0.069 0.070
F47 Personal and Household Good Wholesaling 11,505 0.096 0.053 0.117 0.129
G51 Food Retailing 12,936 0.073 0.011 0.124 0.133
G52 Personal and Household Good Retailing 22,983 0.071 0.053 0.058 0.102
G53 Motor Vehicle Retailing and Services 12,372 0.041 0.017 0.054 0.054
H57 Accommodation, Cafes and Restaurants 14,637 0.089 0.082 0.082 0.108
I61 Road Transport 10,494 0.084 0.085 0.085 0.085
I63 Water Transport 414 0.505 0.505 0.505 0.505
I64 Air and Space Transport 588 0.374 0.373 0.373 0.373
I65 Other Transport 216 0.049 0.050 0.050 0.050
I66 Services to Transport 3,051 0.605 0.636 0.637 0.637
I67 Storage 417 0.068 0.068 0.068 0.068
J71 Communication Services 4,305 0.255 0.302 0.302 0.302
K73 Finance 5,361 0.122 -0.023 -0.023 0.103
K74 Insurance 159 0.129 0.170 0.170 0.170
K75 Services to Finance and Insurance 5,016 0.079 -0.106 0.231 0.231
L77 Property Services 73,968 0.042 0.014 0.014 0.082
L78 Business Services 61,812 0.143 0.059 0.125 0.161
N84 Health Services 3,066 0.125 0.119 0.142 0.142
O86 Community Services 13,722 0.170 0.129 0.215 0.215
O87 Motion Picture, Radio and Television Services 1,746 0.011 -0.052 -0.052 0.176
P91 Libraries, Museums and the Arts 2,646 0.269 0.141 0.330 0.330
P92 Sport and Recreation 4,188 0.114 0.095 0.095 0.152
P93 Personal Services 4,245 0.230 0.034 0.392 0.392
* N = Average number of firms in the 2-digit industry sub division over entire period
* Counts of firms random-rounded to base 3 for confidentiality reasons
3-digit measures summarised at the 2-digit level weighted by value-added

899417 21
Table 6 Price-cost margin for 4-digit industry (2000-07)
ANZSIC 1996 Industry (Sub Division) N mean P25 Median P75
A01 Agriculture 76,353 0.129 0.115 0.138 0.138
A02 Services to Agriculture; Hunting and Trapping 7,602 0.090 0.064 0.064 0.064
A03 Forestry and Logging 6,282 0.100 0.098 0.101 0.101
A04 Commercial Fishing 2,718 0.127 0.056 0.126 0.138
B13 Metal Ore Mining 111 0.030 0.030 0.030 0.030
B14 Other Mining 246 0.142 0.096 0.143 0.143
B15 Services to Mining 105 0.326 0.083 0.083 0.083
C21 Food, Beverage and Tobacco 2,133 0.235 0.043 0.115 0.302
C22 Textile, Clothing, Footwear and Leather Manufacturing
2,766 0.097 0.078 0.110 0.135
C23 Wood and Paper Product Manufacturing 2,937 0.124 0.081 0.137 0.137
C24 Printing, Publishing and Recorded Media 2,802 0.135 0.110 0.128 0.137
C25 Petroleum, Coal, Chemical and Associated Product Manufacturing
1,488 0.270 0.122 0.152 0.344
C26 Non-Metallic Mineral Product Manufacturing 990 0.163 0.116 0.116 0.193
C27 Metal Product Manufacturing 4,290 0.124 0.112 0.124 0.160
C28 Machinery and Equipment Manufacturing 7,077 0.147 0.098 0.120 0.155
C29 Other Manufacturing 4,092 0.109 0.088 0.088 0.151
D36 Electricity and Gas Supply 66 0.191 0.170 0.170 0.170
D37 Water Supply, Sewerage and Drainage Services 78 0.066 0.065 0.067 0.067
E41 General Construction 19,470 0.069 0.063 0.063 0.070
E42 Construction Trade Services 31,656 0.122 0.113 0.117 0.125
F45 Basic Material Wholesaling 4,203 0.117 0.051 0.128 0.161
F46 Machinery and Motor Vehicle Wholesaling 6,951 0.069 0.058 0.065 0.094
F47 Personal and Household Good Wholesaling 11,505 0.109 0.067 0.091 0.190
G51 Food Retailing 12,936 0.079 0.011 0.037 0.132
G52 Personal and Household Good Retailing 22,983 0.073 0.054 0.059 0.109
G53 Motor Vehicle Retailing and Services 12,372 0.066 0.016 0.099 0.106
H57 Accommodation, Cafes and Restaurants 14,637 0.089 0.082 0.082 0.108
I61 Road Transport 10,494 0.085 0.085 0.085 0.085
I63 Water Transport 414 0.551 0.605 0.605 0.605
I64 Air and Space Transport 588 0.388 0.410 0.410 0.410
I65 Other Transport 216 0.053 0.047 0.047 0.047
I66 Services to Transport 3,051 0.627 0.684 0.684 0.723
I67 Storage 417 0.068 0.068 0.068 0.068
J71 Communication Services 4,305 0.256 0.302 0.302 0.302
K73 Finance 5,361 0.371 -0.023 -0.023 0.103
K74 Insurance 159 0.129 0.169 0.169 0.169
K75 Services to Finance and Insurance 5,016 0.068 -0.077 0.231 0.231
L77 Property Services 73,968 0.043 0.018 0.018 0.112
L78 Business Services 61,812 0.149 0.111 0.141 0.146
N84 Health Services 3,066 0.124 0.124 0.142 0.142
O86 Community Services 13,722 0.171 0.125 0.183 0.219
O87 Motion Picture, Radio and Television Services 1,746 0.017 -0.076 -0.076 0.176
P91 Libraries, Museums and the Arts 2,646 0.281 0.099 0.397 0.397
P92 Sport and Recreation 4,188 0.111 0.068 0.068 0.150
P93 Personal Services 4,245 0.229 0.082 0.307 0.403
* N = Average number of firms in the 2-digit industry sub division over entire period
* Counts of firms random-rounded to base 3 for confidentiality reasons
4-digit measures summarised at the 2-digit level weighted by value-added

899417 22
5.4 Comparing measures
It is useful also to compare these measures with each other. A cross-plot of the 2-
digit weighted mean of the concentration ratios and Herfindahl indices along with (ln)
labour productivity are presented in Figure 213
. As one might expect, the measures of
competition calculated at the 3- and 4-digit level are closely related to each other,
with the relationship between the concentration ratios and Herfindahl indices being
non-linear. There are signs of a positive relationship between competition and labour
productivity, but there appears to be some variance in this. The relationship between
the other concentration indices and the price-cost margin are rather less clear (see
Figure 4) and indicative of a number of outliers in the data that warrant further
examination.
5-firmConcentration
ratio(3-digit)
5-firmConcentration
ratio(4-digit)
HerfindahlIndex
(3-digit)
HerfindahlIndex
(4-digit)
LabourProductivity
0 .5 1
0
.5
1
0 .5 1
0
.2
.4
0 .2 .4
0
.2
.4
.6
0 .2 .4 .6
9
10
11
12
Average for 2-digit industry for 2000-2007
Competition measures and Labour Productivity
Figure 2 Pairwise comparison of competition measures and productivity
We can test the similarity of the measures more formally. Table 7 and Table 8
present results of Pearson and Spearman (rank) correlations, respectively. These are
13
A larger matrix of scatter plots including the price-cost margin is presented in the appendix (Figure
4).

899417 23
based on industry averages over the entire period (2000-07). The Pearson correlations
are weighted by value-added.
The five firm concentration ratios are highly (and significantly) correlated, as
they are with their respective Herfindahl Indices. The higher rank correlations
confirm the non-linearity apparent in Figure 2. The price-cost margin indicators are
highly-correlated with each other, but not with the concentration ratios and Herfindahl
Indices.
The concentration and Herfindahl measures are all correlated with labour
productivity at varying levels of significance. The price-cost margin indicators
exhibit an even higher (Pearson) correlation with (ln) labour productivity still.
However this is not true when we consider the (Spearman) rank correlation. This may
be a product of the weighting, with the relation being greater in larger sub-industries
(in terms of value added).
Table 7 Pearson correlations
cr53 cr54 herf3 herf4 pcm3 pcm4
cr54 0.908 1
(0.0000)
herf3 0.916 0.759 1
(0.0000) (0.0000)
herf4 0.870 0.932 0.806 1
(0.0000) (0.0000) (0.0000)
pcm3 0.169 0.241 0.214 0.142 1
(0.2572) (0.1033) (0.1478) (0.3400)
pcm4 -0.008 0.137 -0.049 0.028 0.892 1
(0.9574) (0.3593) (0.7423) (0.8502) (0.0000)
ln(LP) 0.414 0.486 0.355 0.310 0.558 0.499
(0.0038) (0.0005) (0.0143) (0.0338) (0.0000) (0.0004)
� Variables relate to averages over the whole 2000-07 period.
� Weighted by value added
� p-values in parenthesis

899417 24
Table 8 Spearman correlations
cr53 cr54 herf3 herf4 pcm3 pcm4
cr54 0.941 1
(0.0000)
herf3 0.977 0.943 1
(0.0000) (0.0000)
herf4 0.923 0.967 0.954 1
(0.0000) (0.0000) (0.0000)
pcm3 0.092 0.122 0.151 0.178 1
(0.5394) (0.4140) (0.3124) (0.2314)
pcm4 0.014 0.076 0.062 0.120 0.908 1
(0.9262) (0.6134) (0.6790) (0.4207) (0.0000)
ln(LP) 0.422 0.464 0.416 0.382 0.241 0.186
(0.0031) (0.0010) (0.0037) (0.0082) (0.1026) (0.2102)
� Variables relate to averages over the whole 2000-07 period.
� p-values in parenthesis
5.5 Firms’ own perception of competition
One advantage of the data at our disposal is the presence of a measure of firms’ own
perception of the degree of competition. Firms are asked to ‘How would you describe
this business’s competition?’ and are given four levels of competition:
• captive market/ no effective competition
• no more than one or two competitors
• many competitors, several dominant
• many competitors, none dominant
These responses broadly correlate with economists’ concepts of monopoly, duopoly,
monopolistic/Chamberlain/Robinson competition and perfect competition. The
overall percentages of firms reporting to be operating in each type of market are
outlined in Figure 3. Over half of firms report that they are operating in a market
where there are many competitors and several are dominant. Just over a fifth report
that they operate in what is effectively a perfectly competitive market, and just under
a fifth report that they are operating within a market that is effectively a duopoly. The
figures are extremely similar in each year (there are no signs of large increases or
decreases in the competitive environment).

899417 25
Figure 3 Self-reported competition
0
10
20
30
40
50
60
2005 2006 2007
captive market/no effectivecompetition
no more than one or twocompetitors
many competitors, severaldominant
many competitors, nonedominant
� Responses to the following question: ‘How would you describe this business’s competition?’
� Source: Business Operations Survey
� Note that percentages exclude approx 6% who respond ‘don’t know’
� Weighted and stratified
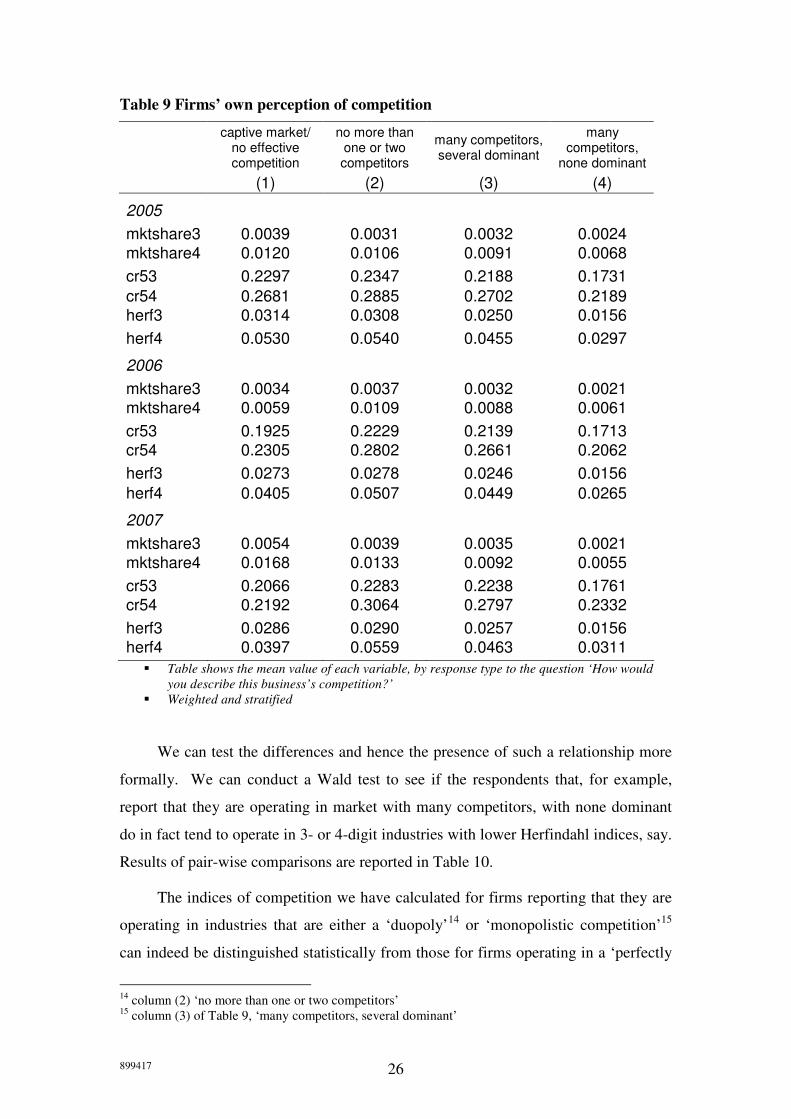
In what follows we drop the price-cost margin, but include the firm’s market share.
This is because firms may be reporting competitive pressure as much from their own
perspective as from that of the whole market. We can see from Table 9 that firms
reporting higher levels of competition do indeed appear to be experiencing more
competition, as evidenced by the lower averages of market-share, concentration ratios
and Herfindahl indices. However, such figures do not reveal what within-group
variation exists in the figures.
899417 26
Table 9 Firms’ own perception of competition
captive market/
no effective competition
no more than one or two competitors
many competitors, several dominant
many competitors,
none dominant
(1) (2) (3) (4)
2005
mktshare3 0.0039 0.0031 0.0032 0.0024
mktshare4 0.0120 0.0106 0.0091 0.0068
cr53 0.2297 0.2347 0.2188 0.1731
cr54 0.2681 0.2885 0.2702 0.2189
herf3 0.0314 0.0308 0.0250 0.0156
herf4 0.0530 0.0540 0.0455 0.0297
2006
mktshare3 0.0034 0.0037 0.0032 0.0021
mktshare4 0.0059 0.0109 0.0088 0.0061
cr53 0.1925 0.2229 0.2139 0.1713
cr54 0.2305 0.2802 0.2661 0.2062
herf3 0.0273 0.0278 0.0246 0.0156
herf4 0.0405 0.0507 0.0449 0.0265
2007
mktshare3 0.0054 0.0039 0.0035 0.0021
mktshare4 0.0168 0.0133 0.0092 0.0055
cr53 0.2066 0.2283 0.2238 0.1761
cr54 0.2192 0.3064 0.2797 0.2332
herf3 0.0286 0.0290 0.0257 0.0156
herf4 0.0397 0.0559 0.0463 0.0311
� Table shows the mean value of each variable, by response type to the question ‘How would
you describe this business’s competition?’
� Weighted and stratified
We can test the differences and hence the presence of such a relationship more
formally. We can conduct a Wald test to see if the respondents that, for example,
report that they are operating in market with many competitors, with none dominant
do in fact tend to operate in 3- or 4-digit industries with lower Herfindahl indices, say.
Results of pair-wise comparisons are reported in Table 10.
The indices of competition we have calculated for firms reporting that they are
operating in industries that are either a ‘duopoly’14
or ‘monopolistic competition’15
can indeed be distinguished statistically from those for firms operating in a ‘perfectly
14
column (2) ‘no more than one or two competitors’ 15
column (3) of Table 9, ‘many competitors, several dominant’

899417 27
competitive market’16
. This result holds at the 1% significance level and across all
years17
. There is much more variability in our ability to distinguish between other
groups, depending on the variable used and the year the comparison is made. In
particular firms who report that they are operating in a market that is effectively a
monopoly18
can be statistically distinguished from other groups in less than half of the
comparisons. This group is, almost by definition, a small one. Nevertheless, the fact
that our measures of competition do allow us to distinguish between competitive and
non-competitive markets is an encouraging piece triangulation/cross-validation.
In future work we will probe into the data contained in the BOS in more detail.
As Fabling, Grimes and Stevens (2008) have noted, firms’ perceptions as measured in
the BOS contain useful information because the often match the concepts we are
interested in more closely than the ‘objective’ alternatives.
16
column (4) of Table 9, ‘many competitors, none dominant’ 17
With the exception of our market share variables in 2005, that do so only at the 5% or 10% level in
three cases. 18
column (1) of Table 9, ‘captive market/no effective competition’

899417 28
Table 10 F-tests of competition measures across BOS responses
F-test (1)=(2)
F-test (1)=(3)
F-test (1)=(4)
F-test (2)=(3)
F-test (2)=(4)
F-test (3)=(4)
2005
mktshare3 0.467 0.442 2.056 0.012 2.760* 4.701** (0.4946) (0.5063) (0.1516) (0.9130) (0.0967) (0.0302)
mktshare4 0.201 0.898 2.931* 0.940 6.292** 6.890*** (0.6539) (0.3433) (0.0870) (0.3323) (0.0122) (0.0087)
cr53 0.060 0.348 9.105*** 2.169 32.273*** 34.452*** (0.8061) (0.5554) (0.0026) (0.1408) (0.0000) (0.0000)
cr54 0.646 0.009 4.343* 1.418 17.165*** 17.202*** (0.4215) (0.9236) (0.0372) (0.2337) (0.0000) (0.0000)
herf3 0.013 1.759 10.912*** 3.524* 26.609*** 34.250*** (0.9094) (0.1848) (0.0010) (0.0605) (0.0000) (0.0000)
herf4 0.009 0.589 5.390** 2.837* 20.283*** 15.659*** (0.9252) (0.4430) (0.0203) (0.0922) (0.0000) (0.0001)
2006
mktshare3 0.053 0.025 1.617 0.612 8.233*** 10.770*** (0.8174) (0.8750) (0.2035) (0.4342) (0.0041) (0.0010)
mktshare4 7.259*** 4.015** 0.019 2.292 11.132*** 11.064*** (0.0071) (0.0451) (0.8908) (0.1301) (0.0009) (0.0009)
cr53 2.724* 1.684 1.579 0.727 21.251*** 34.737*** (0.0989) (0.1944) (0.2089) (0.3939) (0.0000) (0.0000)
cr54 4.289** 3.213* 1.360 0.709 17.212*** 26.746*** (0.0384) (0.0731) (0.2436) (0.3997) (0.0000) (0.0000)
herf3 0.012 0.299 5.803** 1.485 21.574*** 23.899*** (0.9141) (0.5848) (0.0160) (0.2231) (0.0000) (0.0000)
herf4 1.490 0.342 3.542 1.241 21.901*** 26.305*** (0.2223) (0.5587) (0.0599) (0.2653) (0.0000) (0.0000)
2007
mktshare3 0.815 1.389 3.995** 0.483 8.751*** 13.058*** (0.3668) (0.2387) (0.0457) (0.4869) (0.0031) (0.0003)
mktshare4 0.201 0.993 2.193 5.283** 19.036*** 22.531*** (0.6539) (0.3191) (0.1387) (0.0216) (0.0000) (0.0000)
cr53 1.113 0.850 2.581 0.156 21.107*** 39.764*** (0.2915) (0.3566) (0.1082) (0.6931) (0.0000) (0.0000)
cr54 10.654*** 7.465*** 0.327 2.167 12.368*** 10.378*** (0.0011) (0.0063) (0.5675) (0.1411) (0.0004) (0.0013)
herf3 0.006 0.382 7.867*** 1.499 26.770*** 32.388*** (0.9358) (0.5367) (0.0051) (0.2210) (0.0000) (0.0000)
herf4 3.278* 0.709 1.074 2.973* 16.968*** 12.320*** (0.0703) (0.3999) (0.3002) (0.0847) (0.0000) (0.0005)
� Weighted and stratified
� * significant at 10%;
** significant at 5%;
*** significant at 1%

899417 29
Note that we have been describing these measures as if they do indeed firms’, or
rather their general manager’s, perception of their market. It may of course be that
they are referring to their own competitive environment. If a market is effectively a
monopoly, but there are some other firms still managing to survive, how would firms
respond? It may be that the monopolist reports that they are in a monopoly, but that
other firms do not. The largest firm may think that they are operating as a (non-
monopoly) competitor in an international market, whereas the other firms think of
themselves as operating in a national market, dominated by one big domestic player,
or even in a more competitive local market. This speculation throws up the
distinction between an absolute (or technical) definition of the market and a relative
one. What an observer might describe as the extent of the market as determined by
technical aspects such as product classifications and transport costs, may not accord
with that of firms operating in that market. This is important as the firm’s competitive
behaviour will depend upon with whom it is they are competing. However, this
perception might be itself be the outcome of competition. The firm may not consider
foreign firms as its rivals because it cannot compete with them – hiding, as it were, in
a local market, protected by obscurity, transport costs or legal barriers.
6 Conclusions
In this paper we have painted a picture of competition in New Zealand. We have
done this by calculating a number of alternative measures of competition suggested by
the literature. We have also compared them with each other, and a measure of
performance. Furthermore, we have also compared them to a measure of firms’ own
perception of their competitive environment.
We have found that there is considerable heterogeneity in the degree of
competition both within and between 2-digit industries as measured by our indicators.
As one might expect because of their similarity of construction, we have found a high
degree of correlation between the market share-based measures of competition. The
preliminary results of our calculations of price-cost margins suggest that: (a) we need
to do some more work on them to make sure we are obtaining the correct measure,
particularly if we seek to calculate Lerner indices; and (b) whilst there is commonality
between them and the concentration ratios and Herfindahl indices, they are also likely

899417 30
to pick up other aspects of competition, such as international competition, and
overcome some of the problems of market definition, with respect to
products/industries.
This paper is a piece of preliminary work as part of a two-year project on
Competition in New Zealand, funded by the Cross-Departmental Research Pool. The
team is made up of representatives of the Ministry of Economic Development, the
Treasury and the Commerce Commission. In later work we will develop this work in
a number of ways. First we shall develop our measures of domestic competition.
Second, we will attempt to supplement our analysis with international information
(such as information on foreign ownership, exporting, imports of goods and
(potentially) services), to provide a more robust measure of competition. We shall
compare these measures more comprehensively with self-reported measures of
competition and other measures of the extent of markets in the BOS. Finally, we shall
investigate the impact of the competitive environment on economic outcomes such as
productivity and innovation.

899417 31
7 Data Appendix
The sample is based on firms that were never in the following institutional sectors
5111 ‘Households’ and 6111 ‘Rest of World’.
inst_sector96
1111 Private Corporate Producer Enterprises
1121 Private Non-corporate Producer Enterprises
1211 Producer Boards
1311 Central Government Enterprises
1321 Local Government Enterprises
2111 Central Bank
2211 Private Registered Banks
2212 Central Government Registered Banks
2213 Local Government Registered Banks
2221 Private Other Broad Money (M3) Depository Organisations
2222 Central Government Other Broad Money (M3) Depository Organisations
2223 Local Government Other Broad Money (M3) Depository Organisations
2291 Private Other Depository Organisations nec
2292 Central Government Other Depository Organisations nec
2293 Local Government Other Depository Organisations nec
2311 Private Other Financial Organisations except Insurance and Pension Funds
2312 Central Government Other Financial Organisations except Insurance and Pension Funds
2313 Local Government Other Financial Organisations except Insurance and Pension Funds
2411 Private Insurance and Pension Funds
2412 Central Government Insurance and Pension Funds
2413 Local Government Insurance and Pension Funds
3111 Central Government (excluding Funded Social Security Schemes)
3121 Funded Social Security Schemes
3211 Regional Authorities
3291 Other Local Authorities
3311 Rūnanga Iwi
4111 Private Non-profit Organisations Serving Households
They were in business types 1 through 7.

899417 32
business type business_type96_text
1 Individual Proprietorship
2 Partnership
3 Registered Limited Liability Company (non Co-op)
4 Co-operative Companies
5 Joint Ventures and Consortia
6 Branches of Companies Incorporated Overseas
7 Government Owned Trading Entity
8 Central Government
9 Local Authority Trading Enterprise (LATE)
10 Local Government
11 Incorporated and Unincorporated Societies and Associations
12 Charitable Trusts
13 Trusts/Estates
14 Consulates and Foreign Embassies.
20 Other Business Types
It excludes SOEs (inst_sector96_code=1311 and business_type96_code=7) and
firms that were ever ANZSIC code M (Government Administration and Defence) or
had missing ANZSUC codes.
7.1 Business Activity Indicator (BAI) Data
The Business Activity Indicator uses GST data from the Inland Revenue Department
matched to the SNZ Business Frame. The BAI data come from the Goods and
Services Tax return form, GST 101. In order to create the BAI dataset, SNZ
temporarily apportion the data down to a monthly frequency, apportion returns across
GST group members and apply limited imputation in cases where a single return
appears to be missing. As noted in Fabling et al. (2008), the GST-based sales and
purchases data is potentially contaminated by capital income and expenditure. In
particular this includes sales of second-hand assets and businesses, purchases of land,
buildings, plant, machinery and businesses. For more on this subject see section 5.4
of Fabling et al. (2008).
Sales
The sales data in the BAI relate to ‘Total sales and income for the period (including
GST and any zero-rated supplies).’ This is adjusted using data on zero-rated sales as
follows
(12) ( ) ZZSS IE +−=9
8

899417 33
where SE = Sales excluding GST, SI = Sales including GST, Z = zero rated sales.
Purchases
The purchases data in the BAI also come from the Goods and services tax return
form, GST 101. They relate to ‘Total purchases and expenses (including GST) for
which tax invoicing requirements have been met’ as include an estimate for imported
goods and the use of private goods and services in taxable activity.
7.2 IR10 Data
The IR10 data used in this paper come from page 1 of the IRD form Accounts
information IR10 form. More information on what should appear in the IR10 form
can be found in the IRD guide IR10G. Note that a table of descriptive statistics for all
items on page 1 of the IR10 is provided in Table 21 of Appendix 2.
Sales
The sales data recorded in the IR10 form relate to Box 2 ‘Gross income from sales
and/or services’ and are GST exclusive.
Other income/revenue
The ‘other income/revenue’ variable used in Table 5 is the sum of Box 7 ‘interest
received’, Box 8 ‘dividends’, Box 9 ‘rental and lease payments’ and Box 10 ‘other
income’.
Profit
The profits data recorded in the IR10 form relate to Box 29 ‘Total current year taxable
profit’. Note that this includes changes in stocks.
Other expenditures
‘Other expenditures’ in Table 5 is the sum of Box 4 ‘Purchases’ (less the change in
stocks from Box 3 ‘Opening stock’ and Box 5 ‘Closing stock’ (both of which include
work in progress)), plus Boxes 13-16, 18, 19, and 21-27. For a list of the box
numbers, the names of the variables and descriptive statistics, see Table 21 of
Appendix 2.

899417 34
7.3 LEED/PAYE Data
Our data on employment come from the Linked Employer-Employee Database. It has
two components, counts of employees and working proprietors.
Employees
Employment is measured using an average of twelve monthly PAYE employee counts
in the year. These monthly employee counts are taken as at 15th of the month. This
figure excludes working proprietors and is known as Rolling Mean Employment
(RME).
Working proprietors
The working proprietor count is the number of self-employed persons who were paid
taxable income during the tax year (at any time). In LEED, a working proprietor is
assumed to be a person who (i) operates his or her own economic enterprise or
engages independently in a profession or trade, and (ii) receives income from self-
employment from which tax is deducted.
From tax data, there are five ways that people can earn self-employment income from
a firm:
• As a sole trader working for themselves (using the IR3 individual income
tax form [this is used for individuals who earn income that is not taxed at
source]);
• Paid withholding payments either by a firm they own, or as an independent
contractor (identified through the IR348 employer monthly schedule);
• Paid a PAYE tax-deducted salary by a firm they own (IR348);
• Paid a partnership income by a partnership they own (IR20 annual
partnership tax form [this reports the distribution of income earned by
partnerships to their partners] or the IR7 partnership income tax return);
• Paid a shareholder salary by a company they own (IR4S annual company
tax return [this reports the distribution of income from companies to
shareholders for work performed (known as shareholder-salaries)]).

899417 35
Note that it is impossible to determine whether the self-employment income involves
labour input. For example, shareholder salaries can be paid to owner-shareholders
who were not actively involved in running the business. Thus there is no way of
telling what labour input was supplied, although the income figures do provide some
relevant information (a very small payment is unlikely to reflect a full-year, full-time
labour input).

899417 36
8 Additional Graphs and Tables
Figure 4 Competition measures, including price-cost margin, and productivity
5-firmConcentration
ratio(3-digit)
5-firmConcentration
ratio(4-digit)
HerfindahlIndex
(3-digit)
HerfindahlIndex
(4-digit)
Price-costmargin(3-digit)
Price-costmargin(4-digit)
LabourProductivity
0 .5 1
0
.5
1
0 .5 1
0
.2
.4
0 .2 .4
0
.2
.4
.6
0 .2 .4 .6
-.5
0
.5
-.5 0 .5
-.5
0
.5
-.5 0 .5
9
10
11
12
Average for 2-digit industry for 2000-2007
Competition measures and Labour Productivity

899417 37
9 Biography
Philippe Aghion, Nick Bloom, Richard Blundell, Rachel Griffith and Peter Howitt,
(2002), ‘Competition and Innovation: An Inverted-U Relationship’, Working
Paper WP02/04, London: Institute for Fiscal Studies.
Philippe Aghion, Nick Bloom, Richard Blundell, Rachel Griffith and Peter Howitt,
(2005), ‘Competition and Innovation: An Inverted-U Relationship’, The
Quarterly Journal of Economics, 120(2), pp. 701-728.
Philippe Aghion, Rachel Griffith and Peter Howitt, (2006a), ‘U-shaped relationship
between vertical integration and competition: Theory and evidence’,
International Journal of Economic Theory, 2(3-4), pp. 351-363.
Philippe Aghion, Rachel Griffith and Peter Howitt, (2006b), ‘Vertical Integration and
Competition’, American Economic Review, 96(2), pp. 97-102.
Philippe Aghion and Rachel Griffith, (2006), Competition and Growth: Reconciling
Theory and Evidence, MIT Press.
Philippe Aghion and Peter Howitt, (1992), ‘A Model of Growth through Creative
Destruction’, Econometrica, 60(2), pp. 323-51.
Jan Bloom, Rachel Griffith, and Rupert Harrison, (2005), ‘Measuring Competition’,
London: Advanced Institute of Management Research, Research Working Paper
Series.
Ron Crawford, (2006), ‘Competition Policy and Innovation: Issues for New Zealand’,
Report prepared for Ministry of Economic Development.
Richard Fabling, and Arthur Grimes, (2006), ‘Practice Makes Profit: Business
Practices and Firms Success’, Ministry of Economic Development.
Richard Fabling, Arthur Grimes, Lynda Sanderson, and Philip Stevens, (2008), ‘Some
Rise by Sin Others by Virtue Fall: Firm dynamics, market structure and
performance’, Ministry of Economic Development Occasional Paper 01/04.
Richard Fabling, Arthur Grimes, and Philip Stevens, (2008), ‘A Comparison of
Qualitative and Quantitative Firm Performance Measures’ Ministry of
Economic Development Occasional Paper 04/08
899417 38
Grossman, G., Helpman, E. (1991). Innovation and Growth in the World Economy,
Cambridge, MA: MIT Press.
Abba P. Lerner, A. (1934), ‘The Concept of Monopoly and the Measurement of
Monopoly Power’, The Review of Economic Studies, 1.3, pp. 157-175.
Stephen Nickell (1995), The Performance of Companies, Oxford: Blackwells
Stephen Nickell (1996), ‘Competition and Corporate Performance’, Journal of
Political Economy, 104(4), pp. 724-746.
Malcom Sawyer, (1985), ‘The Economics of Industries and Firms’, 2nd
Edition,
London: Routledge.
Joseph A. Schumpeter. (1943), Capitalism, Socialism and Democracy, London: Allen
and Unwin (originally published in the USA in 1942; reprinted by Routledge,
London in 1994).
Jean Tirole, (1988), The Theory of Industrial Organization, Cambridge, MA: MIT
Press.