competition in a consumer loan market: payday loans and...
TRANSCRIPT
Competition in a Consumer Loan Market:
Payday Loans and Overdraft Credit
Brian T. Melzer and Donald P. Morgan*
May 6, 2011
Abstract
We find that banks and credit unions adjust the terms of overdraft credit based on the
availability of payday credit, a substitute product. When payday loans are available, depositories
increase overdraft credit limits and raise overdraft fees. These findings suggest that banks
respond to competition by improving the quality of their product, paying checks that they would
have otherwise bounced. The increase in overdraft fees is surprising when viewed in isolation
but sensible given the risk involved in extending additional credit. Using Federal Reserve data on
bounced checks, we find no support for the view that overdraft fees rise because payday and
overdraft credit are complements. Furthermore, we show that credit unions‟ overdraft activities
are less profitable when payday loans are available, consistent with increased competition. Our
findings illuminate competition in the large, yet largely unstudied, small dollar loan market.
JEL classification: D14 (Personal Finance), G2 (Financial Institutions and Services)
Keywords: Household finance, adverse selection, consumer credit, overdraft credit, payday loan,
usury, predatory lending, price-increasing competition
* Melzer: Kellogg School of Management, Northwestern University ([email protected]). Morgan:
Federal Reserve Bank of New York ([email protected]). The authors‟ views do not necessarily represent
those of the Federal Reserve Bank of New York. We thank Shawn Cole, Sumit Agarwal, Philip Strahan, David
Matsa Chad Syverson, Jeff Jones, and seminar participants at the FDIC, the FTC, and the University of Arkansas for
comments. Ihab Seblani provided excellent research assistance. We also gratefully acknowledge Michael Moebs for
sharing Moebs $ervices‟ data on checking account fees and services, as well as Rhoda Nybeck and JV Proesel of
Moebs $ervices for their help with the data.
1
I. Introduction
This paper studies competition between two very different looking financial
intermediaries offering similar credit services. On the one side are mainstream banks and credit
unions that supply overdraft credit whenever they cover checks or other transactions that would
have overdrawn depositors‟ accounts. Depository institutions earned an estimated $36 billion on
overdraft and other deposit fees in 2006 (GAO 2008). On the other side are payday lenders who
advance cash against customers‟ personal checks for about two weeks, providing the check-
writer with $50 to $1000 of credit in the interim. An estimated 19 million households tapped the
$50 billion dollar payday loan market in 2007 (Stephens 2008).
Both types of credit are controversial, and as a result, increasingly regulated. Payday
lenders have long been maligned for high prices, while banks have come under fire more
recently for the high cost of overdraft credit. Fifteen states now prohibit payday loans via usury
limits or outright bans. In 2009 both houses of Congress considered legislation limiting the price
and frequency of overdraft charges (H.R. 3904 and S. 1799), and in July 2010 the Federal
Reserve issued new rules requiring customers to opt-in to overdraft coverage of ATM and debit
transactions.
Much of the literature on payday credit focuses on the effect of credit access on
household well-being. Our focus is different; we ask whether competition from payday lenders
affects the price and availability of overdraft credit. Do banks raise overdraft fees when payday
loans are no longer available? Do they extend less overdraft credit when they are no longer
pushed by a competitor? In light of the regulatory flux in these markets, these are important
questions.
2
Our analysis uses data from a national survey of banks and credit unions to measure the
effect of payday lending on overdraft fees and credit limits. We estimate the effect through two
different identification schemes. The first, following Morgan and Strain (2008), compares how
overdraft terms change as states switch from allowing to prohibiting payday credit, or vice versa.
The second, following Melzer (2011), focuses on states that prohibit payday credit, and
compares terms at institutions located near the border of a state that allows payday credit with
terms at institutions located further from such a border. The identifying assumption for the first
scheme is that legal changes within states are independent of overdraft terms. The identifying
assumption for the second scheme is that the payday laws and the location of intermediaries in
one state are independent of laws in neighboring states. Importantly, the identifying assumptions
of these two models are independent, which strengthens the overall research design.
We find that depository institutions change their overdraft credit programs along several
margins when they compete with payday lenders. Surprisingly, they raise prices: both models
imply that overdraft fees are roughly 5% higher when payday loans are available. At the same
time, they provide more generous overdraft coverage. Institutions that previously refused to
cover any overdraft attempts initiate “bounce protection” programs under which they extend
credit up to a limit, and those already offering bounce protection provide higher credit limits.
These increases in overdraft credit are substantial: we estimate a 6% increase in the frequency of
bounce protection and a 12% increase in overdraft credit limit.
We interpret these changes as adjustments to both price and product quality induced by
competition. Depositories offer a higher quality checking product by covering more checks, but
doing so involves an incremental cost – default losses on overdraft credit – for which they raise
prices. Banks respond in this way because depositors can use payday credit to avoid bounced
3
checks. In fact, Morgan and Strain (2008) document such substitution around payday loan
prohibitions in North Carolina and Georgia using Federal Reserve check processing data, and we
confirm their results in a sample with four additional state law changes. Our conjecture, then, is
that banks extend overdraft credit to preserve fee revenue that they would have earned from
bounced check fees in the absence of payday lending.
Several ancillary findings confirm this interpretation. Using bank and credit union
regulatory data, we show that the increases in overdraft coverage are costly – overdraft credit
losses rise along with credit limits when payday loans are available. We also find no evidence of
increased fee revenue, despite the rise in overdraft prices, which suggests that the overall
quantity of overdraft activity does not rise with payday availability. Together, these two results
imply that the profitability of overdraft and bounced check activities decline due to payday loan
competition, a conclusion for which we offer both direct and indirect evidence. Looking at
profitability directly, we find that the ratio of loan losses to fee revenue increases with payday
lending; for every dollar of fee revenue earned from bounced checks and overdrafts, depositories
sustain higher losses. As an indirect measure of overdraft profitability, we also consider “free”
checking offers. On this point, we find robust evidence that depositories are less likely to offer
“free” checking accounts when they face payday loan competition. The literature on add-on
pricing uses checking accounts as a canonical example of a base good that is subsidized to earn
profits through add-on services. Viewed through this lens, our results perhaps indicate that banks
are less willing to subsidize accounts because overdraft activities are less profitable.
In falsification exercises, we also show that our two measures of payday credit access
bear no relationship with unemployment rates, credit card loan balances and credit card loss
rates. These findings are useful in ruling out the concern that our findings are driven by an
4
omitted variable like the demand for credit or the riskiness of credit that might correlate with
payday availability.
As the first paper to study how the availability of payday credit affects the price and
availability of another type of credit, our paper extends the growing literature on the
consequences of payday credit access.1 Fusaro (2008) also studies the cost of overdraft credit, but
does not investigate its determinants. Hannan (2006) and Deyoung and Phillips (2009) analyze
competition within the overdraft and payday credit markets, respectively, but do not look at
competition across the two industries.
Section II compares overdraft and payday credit and makes the case, based on prices and
usage patterns, that they are partial substitutes. Section III describes the exit and entry of payday
lenders that constitute the “experiments” we use to study overdraft and deposit outcomes.
Section IV and V presents the results on bounced check volumes and overdraft terms,
respectively. Section VI considers the effect of payday lending on overdraft revenues, credit
losses and profits. Section VII concludes by discussing implications for consumer welfare,
policy, and future research.
II. Overdraft and Payday Credit
This section describes the two main players in the small-dollar loan market and compares
the pricing and usage of their services.
II.1. Overdraft Credit
When presented with a transaction that overdraws a customer‟s account a bank must
decide whether to make the payment, thereby extending credit to the depositor, or reject the item,
returning it unpaid. Traditionally, banks made those decisions on an ad hoc basis, but in the mid-
1 See Morse (2009), Morgan and Strain (2008), Melzer (2009), Skiba and Tobacman (2008a), Carrell and Zinman
(2008), Zinman (forthcoming), Stoianovici and Maloney (2008), Wilson et al. (2008), and Campbell et al. (2008).
5
to late-1990s financial advisory firms began marketing trade-marked, computer algorithms
designed to automate and optimize these decisions. The advent of automated overdraft programs
greatly increased the quantity of overdraft credit.
The FDIC‟s (Federal Deposit Insurance Corporation) recent study of bank overdraft
programs reveals how ubiquitous overdraft credit programs have now become (FDIC 2008).
Roughly 70 percent of banks with assets over $250 million have automated overdraft of one sort
or another. The study shows that depository institutions offer a full “suite” of overdraft credit,
ranging from lines of credit (LOC) to discretionary overdraft protection, more familiarly known
as “bounce protection,” the variety we study.
Depending on the amount of the overdraft, overdraft credit can be more expensive than
payday credit. The median NSF (insufficient funds) fee charged by depository institutions per
overdraft was $27 in 2007 (FDIC 2008). At that fee, the implicit annual percentage interest
(APR) on a hypothetical, two week overdraft of $60 is about 1,173 percent, more than the typical
APR for payday credit. According to FDIC (2008), the median overdraft amount for debit, ATM
and check transactions was $20, $60 and $66 in 2006, suggesting that a substantial number of
transactions can be funded more cheaply through payday credit.
While some overdraft activity is undoubtedly accidental and therefore not affected by
payday loan availability, we maintain that payday loans and overdraft credit are potential
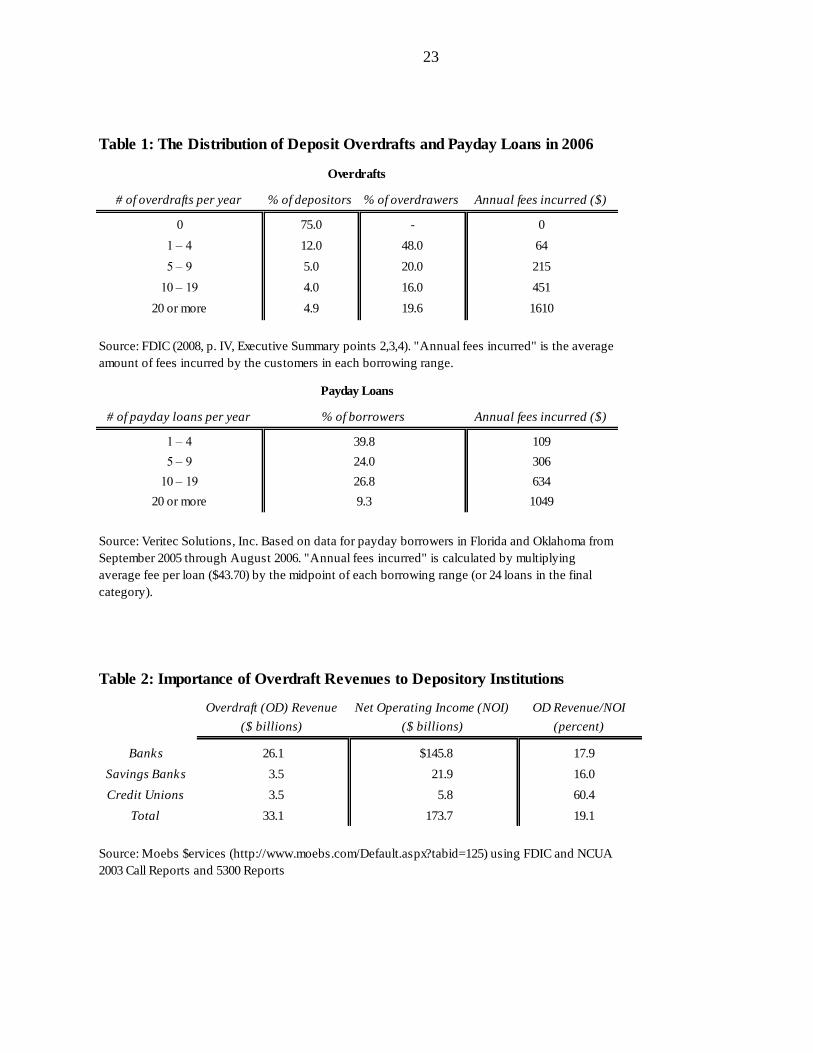
substitutes for a substantial number of overdraft creditors. In fact, usage patterns of overdraft and
payday credit are quite similar, with repeated borrowing common for both types of credit (Table
1). This similarity suggests overlap in the customers using these two types of credit.
Supplying overdraft credit generates substantial revenue for depository institutions by
any number of measures. For the median bank studied in FDIC (2008), NSF fee income
6
accounted for 43 percent of noninterest income and 21 percent of net operating income. Banks
and credit unions, particularly the latter, are surprisingly reliant on revenue from overdraft credit
(Table 2).
Supplying overdraft credit is not without risks or costs, however. Depository institutions
involuntarily closed 30 million accounts between 2001and 2005 for “recidivist” check bouncing,
and the trend is upward (Campbell, Jerez-Martinez, and Tufano 2008, p.1). The average loss per
bad account in 2007 was $310 (FDIC 2008).
II.2. Payday Credit
Payday lending also emerged in the mid- to late-1990s as a variation on a check cashing
transaction. Customers receive a short-term cash advance by exchanging a post-dated personal
check for cash, paying a $50 fee for $350 of credit in the typical transaction. At maturity, two to
four weeks later, the loan is repaid either when the lender cashes the check, or the borrower gives
the lender cash in person.
Payday credit underwriting is minimal; applicants must prove that they have a checking
account and a job. The checking account pre-requisite makes checking accounts and payday
credit partial complements, implying positive correlation in the individual demand for each.
Given a deposit account, however, payday credit and overdraft credit are substitutes, implying
negative correlation in their individual demand. The controversy over payday lending has led to
a large literature investigating how payday credit access affects a variety of outcomes: crime and
foreclosure (Morse 2011), bounced check rates and complaints against lenders and debt
collectors (Morgan and Strain 2008), difficulty paying bills (Melzer 2011), bankruptcy (Skiba
and Tobacman 2008a; Stoianovici and Maloney 2008), air-force reenlistment (Carrel and
Zinman 2008), expected well-being (Zinman 2010), virtual well-being (Wilson et al. 2008), and
7
involuntary account closings (Campbell et al. 2008). The findings from that literature are mixed,
with some studies concluding that payday credit ameliorates financial hardship and others
concluding the opposite. None of the literature studies how payday credit access affects the price
of substitute forms of credit, as we do.
III. Entry and Exit by Payday Lenders as “Experiments”
The controversy over payday credit has also led to considerable flux in the state laws
governing it. Following Melzer (2011) and Morgan and Strain (2008), we use those fluctuations
as well as cross-sectional differences to identify plausibly exogenous variation in payday credit
supply.
With a few exceptions, northeastern states have barred entry of payday lenders by strict
enforcement of usury limits. Seven additional states have closed markets outright or indirectly,
via prohibitive usury limits, while one has sanctioned and safe harbored the practice. The
appendix documents the regulatory differences in detail. Using those differences, we define two
distinct indicators of payday credit availability: Allowed and Access.
Allowedsy equals one for institutions located in a state s where payday credit is allowed in
year y, and zero otherwise. Because our regressions include state fixed effects, the variation that
identifies the effect of Allowed comes from states that switch from prohibiting to allowing
payday credit, and vice-versa. One state, New Hamphshire, switched from prohibiting to
allowing in 2000. The District of Columbia and six states switched from allowing to prohibiting
payday credit between 2002 and 2008.4
Our identifying assumption is that political-economy decisions driving changes in
Allowed are exogenous with respect to outcomes. We follow the literature in taking the law
4 These six states are Georgia, Maryland, North Carolina, Pennsylvania, Oregon and West Virginia.
8
changes as exogenous, but we also provide evidence for that assumption in falsification tests
reported later.
The second availability measure is a sequence of distance-based indicators.
Access_X_Ycy, is a county-year level indicator equal to one if an institution is located in a county
whose center is within X and Y miles of a state that allows payday lending (zero if not). For
example, Access_0_10 equals one if an institution is in a county located 10 miles or less from a
state that allows payday loans, and zero otherwise. Access_10_20 and Access_20_30 are defined
analogously. The omitted category is Access_30_plus.
Note that Access varies within state, but only in states that prohibit payday lending.5 Its
effect is identified by comparing outcomes at institutions relatively near states that allow payday
credit to outcomes at more remote institutions. The identifying assumption is that the distance
between institution i and a state where payday credit is allowed is exogenous with respect to
overdraft terms at institution i, a different assumption than needed for Allowed. That assumption
requires, firstly, that payday credit regulations in bordering states are uncorrelated with
characteristics of the overdraft market across the border, and secondly, that payday credit
availability does not alter the composition of depositories near the border. To weaken the latter
assumption, we control for the institution type, institution size (log assets), and the concentration
of the local deposit market.
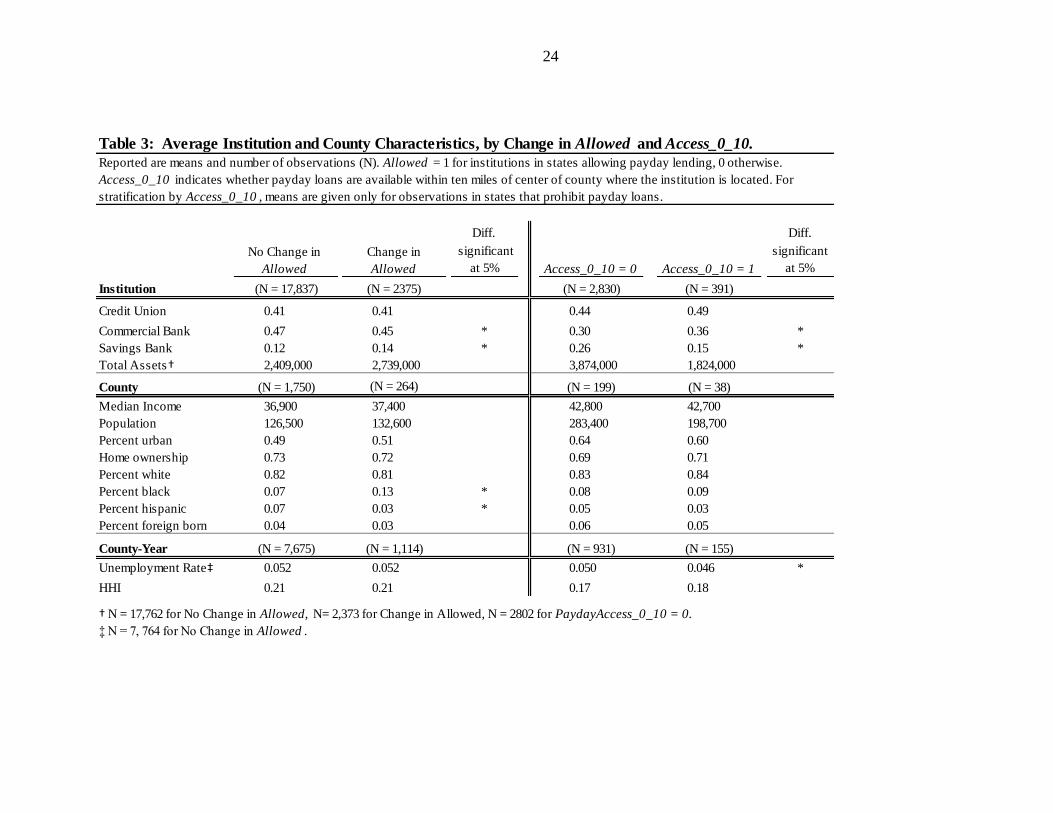
The institutional and county characteristics defined by Allowed and Access differ in a few
ways (Table 3). States with changes in Allowed have higher proportions of Hispanics and blacks,
and relatively more savings banks (versus commercial banks). Savings banks are also over-
represented (relative to commercial banks) in counties without access to payday credit
5 The 13 states that prohibited payday lending for some time during the sample period are CT, DC, GA, MA, MD,
NC, NH, NJ, NY, OR, PA, VT, and WV.
9
(Access_0_10 =1). Unemployment rates are significantly lower in those counties as well.
Importantly, our regression analysis controls for those differences by including institution and
county-level controls.
IV. How do Overdraft Check Volumes Vary with Payday Lending?
Our analysis begins by testing whether payday loans are used to substitute for checking
account overdrafts. We use quarterly data on the volume of returned (“bounced”) checks
processed by Federal Reserve Check Processing Centers (Fed CPCs) between 1998:Q1 and
2008:Q3, and examine how check volumes change when payday lending is prohibited in a CPC
area.
Some limitations of the data require discussion. First, we would ideally analyze all
overdraft attempts, both covered and uncovered, but we observe only those that are not covered,
i.e., those that are bounced.6 Second, Fed CPCs operate regionally; a CPC might process checks
drawn on depository institutions from other states (which introduces some error in variables) and
some states do not have a Fed CPC (which limits the events we can study). Third, with electronic
payments supplanting checks, the Federal Reserve in 2004 began consolidating its check
processing operations by closing some CPCs and transferring their operations to others. To
maintain continuous series for those CPCs, we follow the bank merger literature and create pro
forma series by combining the data for those CPCs at the beginning of the observation period.7
New Hampshire and the District of Columbia have never had a CPC within their borders so we
omit their law changes from our set of “experiments.” That leaves six events, all bans, with
which we identify the effect of payday credit access on rates and amounts of returned checks.
6 To clarify, overdraft attempts can be divided into two mutually exclusive and exhaustive categories, returned
(bounced) checks and covered (protected) overdrafts. 7 Having to use pro forma series tends to attenuate the impact of payday lending bans on the outcomes.
10
To determine how returned check patterns vary with payday credit access we estimate
difference-in-difference regressions:
The dependent variable, Ycsdt, denotes either the rate of returned checks or the average
dollar amount per returned check at CPC c in state s in Federal Reserve District d at time (year-
quarter) t. The rate of returned checks is measured per number of per number of checks
processed and per dollar value of checks processed. The rate per number processed seems more
pertinent here because payday credit users, having lower than average income, are likely to write
(and bounce) smaller checks with only muted effects on the dollar rate of returned checks. The
regressions include a fixed effect for each CPC ( ) and each date ( ). Allowed is defined as
before, except the NH and DC events are excluded. The two Unemployment variables denote the
quarterly unemployment rate in the Federal Reserve District and state where CPC c is located.
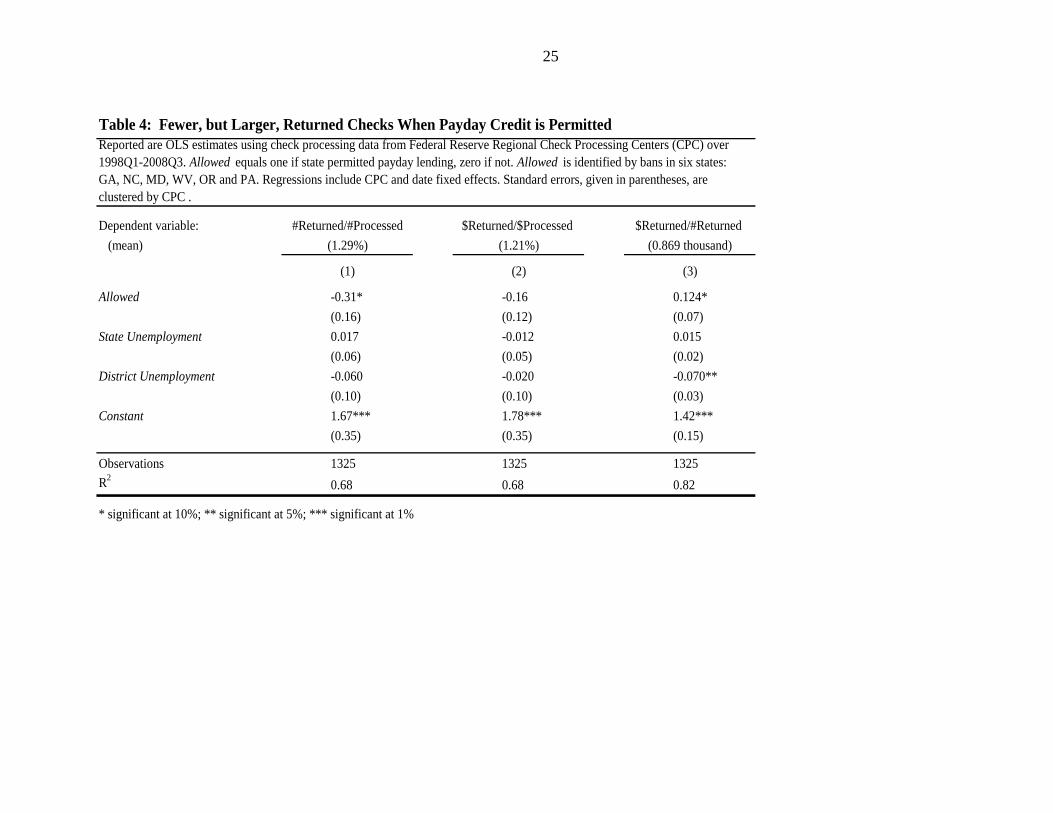
Table 4 reports the returned check regressions. The results in column (1) indicate that the
returned check rate per checks processed, the measure more closely associated with small dollar
check writers, declines when payday lending is allowed. The coefficient on Allowed of 1.31
implies the rate of returns per number processed falls by 0.24 percent relative to average, a
surprisingly large amount. The rate of returned checks per dollar processed tends downward
(Column 2), but the decline is not statistically significant. The final specification indicates that
the amount per returned check rises when payday lending is permitted (significant at the ten
percent level). The average amount per return increases by $124 dollars when payday lending is
permitted, an increase of 14 percent relative to average.
11
These findings – fewer, but larger bounced checks when payday loans are available – are
consistent with the hypothesis that some depositors use payday loans to avoid bounced checks,
particularly small checks.8 It is also worth noting that changes to bank overdraft policies may
also play a role. If banks increase overdraft limits when payday loans are available, we would
also expect to observe fewer bounced checks of larger average value. We return to this point in
Section VI, but first we show how overdraft terms vary with payday lending.
V. How Overdraft Terms Vary With Payday Lending?
V.1. Data
The data on overdraft prices, overdraft limits and free checking are from Moebs $ervices
(sic), a research and consulting firm focused on financial services. For their overdraft pricing
survey, Moebs draws a random sample of institutions – stratified by region, asset size and
institution type – and calls a branch close to each institution‟s main office to assess fees and
services for customers at that location.9
The full space of data spans roughly 20,000 branch-year observations, half on
commercial banks, 40 percent on credit unions, and 10 percent on savings banks. There are three
variables of interest: Fee, the fee charged per overdraft event; OD Limit, the maximum overdraft
balance allowed under overdraft protection; and Free Checking, a binary variable indicating
whether the institution offers free checking accounts. Fee, measured in constant (2008) dollars, is
8 The finding of fewer, but larger returned checks is also consistent with an adverse selection stemming from the
lump sum pricing of overdraft credit. That lump sum pricing means that for sufficiently large overdrafts, overdraft
credit is cheaper than payday credit. Thus, when payday credit is available, depositors prone to small overdrafts may
switch to payday credit to avoid overdrawing while depositors prone to large overdrafts may stick with overdraft
credit. That sorting implies fewer, but larger returned checks, as observed. That sorting is adverse because the large
overdrafters that stick with overdraft credit cost more to serve because they borrow more and if they default,
depositories lose more. While this adverse selection could help explain why overdraft prices increase when payday
credit is available, we do not test that hypothesis formally because we do not have the requisite data on all overdraft
attempts, including those that were covered. 9 Many banks with regional or national branch networks are chartered separately in each state. Moebs samples from
the population of chartered institutions, so a single bank holding company might be sampled multiple times in a
given year, across separately chartered subsidiaries.
12
observed at banks from 1995 to 2008, and at credit unions from 1999 to 2008. Average and
median Fee are $25 and $26, but some institutions charge above $50. OD Limit is observed in
four years – 2004 through 2008, excluding 2006. The average reported credit limit is $514. Free
Checking is observed from 2003 to 2008. Free checking is common; about 75 percent of
depository institutions offer it.
We match the Moebs survey data with balance sheet data filed by each institution with
the FDIC and NCUA (National Credit Union Administration). We also use the FDIC‟s Summary
of Deposits database to calculate the HHI (Hirshman-Herfindahl index) of bank deposit market
concentration for each county and year.10
County characteristics including median income, racial
composition, home ownership, population and percent urban population, are from the 2000
Census. Unemployment rates, by county and year, are from the Bureau of Labor Statistics‟ Local
Area Unemployment Statistics.
V.2. Findings with Allowed
We estimate the impact of payday credit availability using difference-in-difference
regressions of the form:
Yicsy represents Fee, OD Limit or Free checking at institution i in county c, state s, at year
y. The fixed effects (as and ay) control for differences in the mean of Y across states and years.
Some versions of (1) include a Census division-year effect to control for region-specific trends.
HHI (Herfindahl-Hirschman Index) measures bank deposit market concentration in each county-
year. Cnty is a vector of eight county-level control variables, including the unemployment rate,
10
NCUA does not collect the equivalent data for credit unions so credit union market shares cannot be calculated.
13
which varies across years.11
Inst controls for the natural log of assets and institution type (with
dummy variables): savings bank, credit union, or commercial bank (the omitted category). The
regressions are estimated by ordinary least squares, but we report probit estimates of Free
Checking in robustness tests. Observations are clustered by state in calculating Huber-White
robust standard errors.
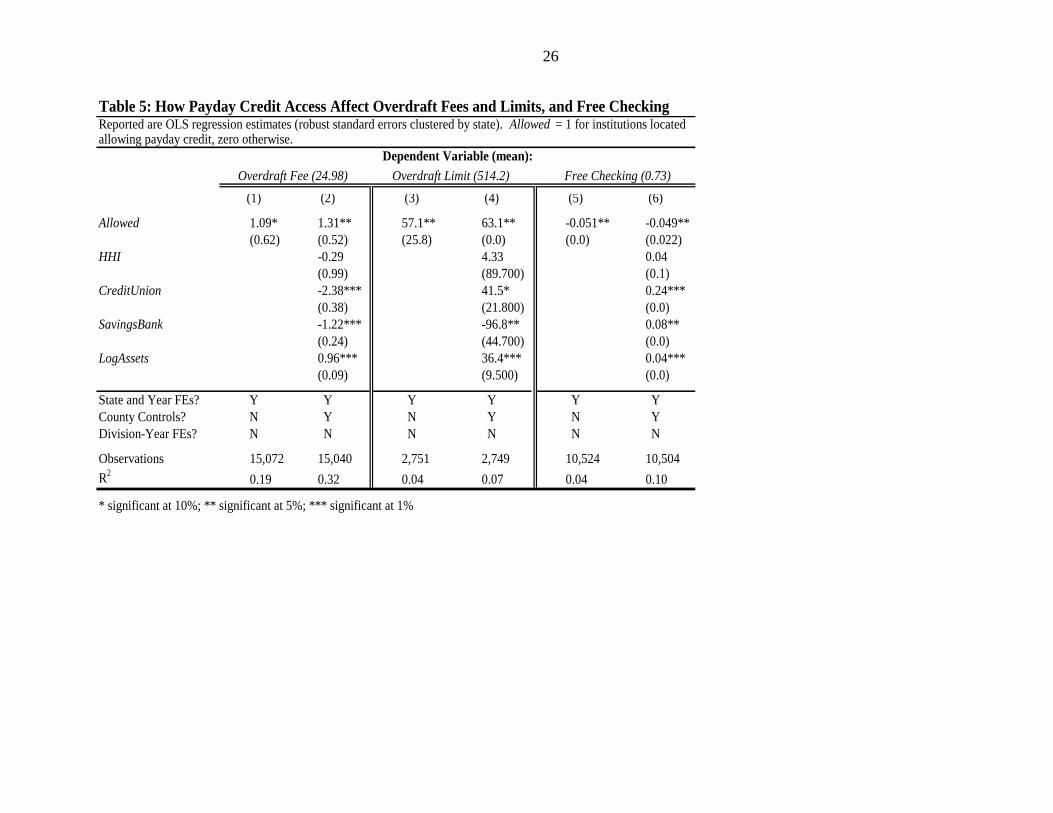
Table 5 reports the regression estimates. The results indicate that access to payday credit
is associated with higher overdraft fees and credit limits, and reduced availability of free
checking. The coefficient on Allowed is positive and significantly different from zero in both Fee
regressions. The baseline difference-in-difference model, without county and institution controls,
implies overdraft fees increase by $1.09 when payday credit is available. Adding county and
institution controls raises the estimated effect to $1.31, a 5 percent increase relative to the
average overdraft fee of $25.12
Allowed also has a positive and significant coefficient in both OD
Limit regressions. In the second model, the coefficient on Allowed of 63.1 implies that
depositories increase their overdraft limits by 12% relative to average when payday credit is
available. Lastly, the Free Checking regressions indicate depository institutions are less likely to
offer free checking when payday credit is allowed. Allowed is negative and significant in both
specifications. Both models imply that depositories in states that allow payday lending are five
percentage points less likely to supply free checking.
Before discussing the results, we document very similar findings using an entirely
different measure of payday credit availability.
V.3. Findings with Access
11
The county-level Census controls are cubics in median income, population and percent urban population; percent
black, white, Hispanic and Asian; percent home hownership and percent foreign born. 12
The estimated coefficient on Allowed is also stable when county dummy variables are used in place of the Cnty
vector (results not reported).
14
A potential concern with Allowed is that states endogenously liberalize their payday
lending laws as overdraft fees increase, leading to a biased estimate of β. Using Access reduces
those concerns, as the identifying variation in Access does not depend on law changes in the
institution‟s home state.
The regression model using Access is:
Apart from replacing Allowed with Access, model (3) differs from (2) in two ways. First, model
(3) includes a state-year effect (instead of state and year effects) to exclude variation in Access
created by the state-level changes in payday availability captured by (2). Second, some
specifications of (3) include Border, a dummy indicating whether an institution is located in a
county within 25 miles of a state border. Border controls for general differences between
institutions located near a state border and interior counties. To improve precision of the
estimates we include all observations in the regression sample, but the identifying variation in
Access comes from institutions in the thirteen states that prohibit payday lending at some time
during the sample.
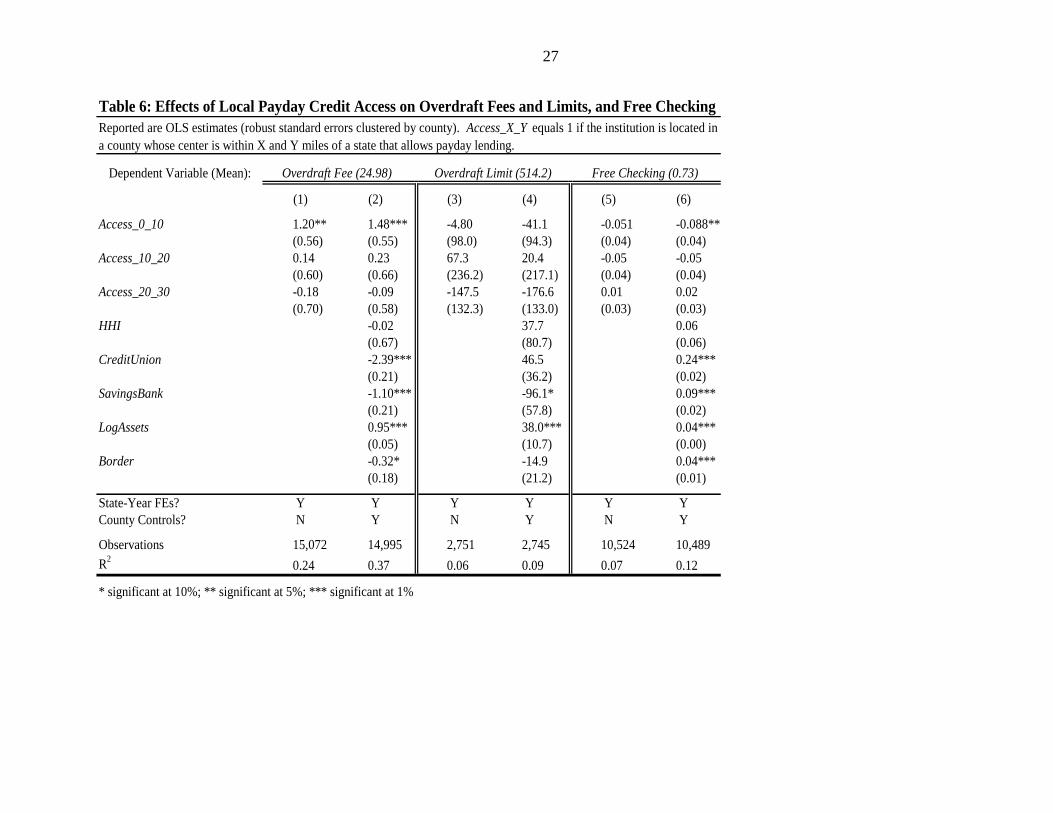
Table 6 reports the regression estimates. We observe the same significant differences
across types of institutions and size of institution as with regression model (2). The effect of
market concentration (HHI) is insignificant, as before.
For overdraft fees and free checking, the results with Access are very similar to those
with Allowed. Overdraft fees are significantly higher when payday credit is accessible. These
estimates are very close to the earlier estimates; given the type and size of institutions and other
controls, overdraft fees are $1.48 higher when payday credit is available within 10 miles. Access
15
beyond ten miles does not significantly affect overdraft prices.13
Depository institutions are also
5 to 9 percentage points less likely to offer free checking if payday credit is accessible within 10
miles, with no discernible effect at greater distances. The coefficients on Access_0_10 also do
not appear to be driven by differences in institutions or economic conditions in border areas;
adding Border and other county covariates actually increases the estimated effect of
Access_0_10 for both Fee and Free Checking. The results for OD Limit reveal little about the
relationship between payday credit and overdraft limits due to large standard errors on the Access
coefficients.15
V.4. Robustness
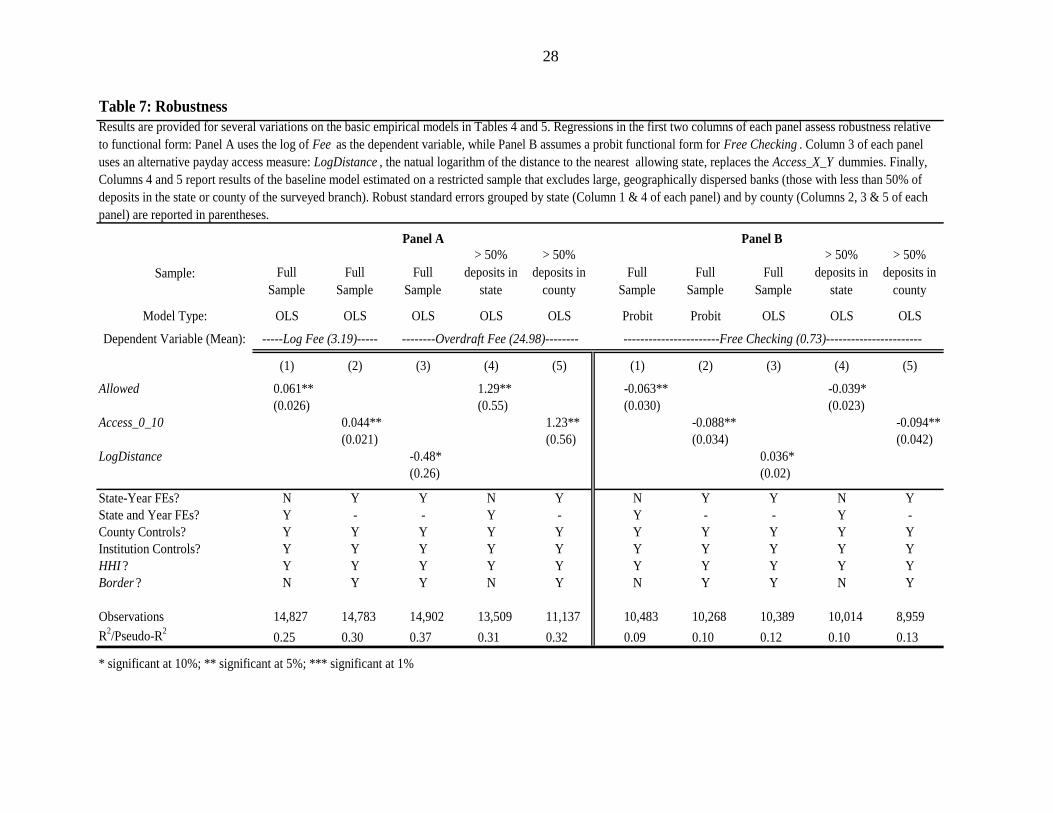
Table 7 shows that the findings above are robust to alternative functional forms, a
continuous analog of Access and sample restrictions that exclude geographically dispersed banks.
The log-linear model with Log(Fee) as the dependent variable yields an estimated effect
of Allowed and Access of between four percent and six percent, as shown in Columns 1 and 2 of
Panel A. This analysis confirms that the nominal to real price adjustment does not change the
results. Estimating a probit model for Free Checking (Panel B, Columns 1 and 2) yields marginal
effects very similar to the linear probability estimates in the main results.
Column 3 in each panel confirms the results of model (3) using a continuous measure,
LogDistance, instead of Access. A one log point increase in the distance to a state that allows
payday credit increases the probability that Free Checking is available by four percentage points
and decreases overdraft fees about 50 cents.
13
F-tests reject equality between the coefficients on Access_0_10 and Access_10_20 (p-value 0.08), and between the
coefficients on Access_0_10 and Access_20_30 (p-value 0.02). 15
Since a number of law changes occur between 2004 and 2008, the identifying variation in Allowed is not
dramatically reduced because of the limited time sample, but the identifying variation in Access comes from all
sample years.
16
Finally, Columns 4 and 5 of each panel show that the main findings are stable when the
sample is restricted to institutions that have a large proportion of deposits, at least 50 percent, in
the state or county of the surveyed branch. These results confirm that the effects of Allowed and
Access are not driven by large banks that operate across multiple states or counties. For such
institutions, it is less plausible that payday loan availability in the area of the surveyed branch
influences overdraft and checking account terms, which are often set uniformly across the entire
branch network.
V.5. Findings with Credit Union Regulatory Data
In this section we validate the findings on overdraft limits using additional data on
overdraft activities reported by credit unions in regulatory filings (Call Reports). The National
Credit Union Administration (NCUA) mandates detailed disclosure on overdraft programs;
credit unions must report whether they offer bounce protection or overdraft lines of credit, and if
so, they must report the aggregate amount of unused commitments under each program. Banks
are not required to report such data.
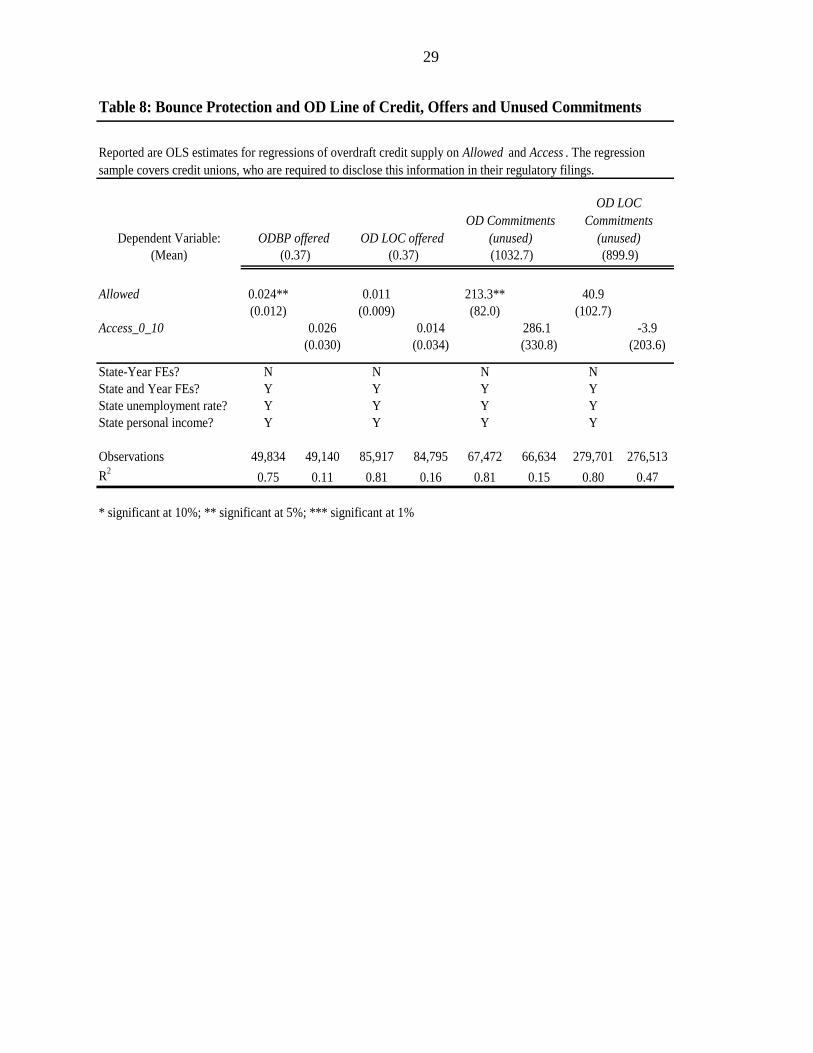
Consistent with the findings in the Moebs data, the results in Table 8 show that credit
unions increase overdraft coverage when they compete with payday lenders. They do so along
two dimensions. First, a credit union is more likely to offer bounce protection when payday
lending is allowed. The coefficients on Allowed and Access_0_10 are similar, at roughly two and
a half percentage points, with the coefficient on Allowed significant at the 5 percent level.
Overall, 37% of credit unions offer bounce protection during the sample period, implying payday
credit access is associated with a 6 percent to 7 percent increase in the proportion of institutions
offering bounce protection. Second, credit unions report higher unused overdraft protection
commitments when payday loans are available. Again, specifications using Allowed and
17
Access_0_10 suggest similar increases, with the effect of Allowed significant at the 5 percent
level. Unused commitments increase by roughly 20 percent over, or $200,000 over the $1
million average level of unused commitments. These results indicate that when they compete
with payday lenders, credit unions increase overdraft coverage on both the extensive margin –
more offer coverage – and the intensive margin – among those offering overdraft, credit limits
increase.
These changes appear to be specific to the bounce protection program, with which
payday loans compete most directly; as shown in columns 3 and 5, changes in the availability
and unused commitments of overdraft lines of credit are small and statistically insignificant. This
insignificant finding for overdraft lines of credit helps rule out the possibility that some
unobserved change is driving up both overdraft credit supply and payday loan availability.
VI. Fee Income, Losses and Profits from Deposit Accounts
To complete the picture of how payday lending affects bank overdraft activities we
examine the components of profits using Call Report data. Banks and credit unions report fee
income earned on deposit accounts (Fee Income), which includes account maintenance fees,
ATM fees, and fees charged on overdraft attempts, whether covered or not. They also report
overdraft credit losses in a residual loan loss category (Loan Losses Other), as well as pre-tax
profits (Operating Income). These data are observed semi-annually from June 1995 through
December 2008 for credit unions and from June 2001 through December 2008 for banks.
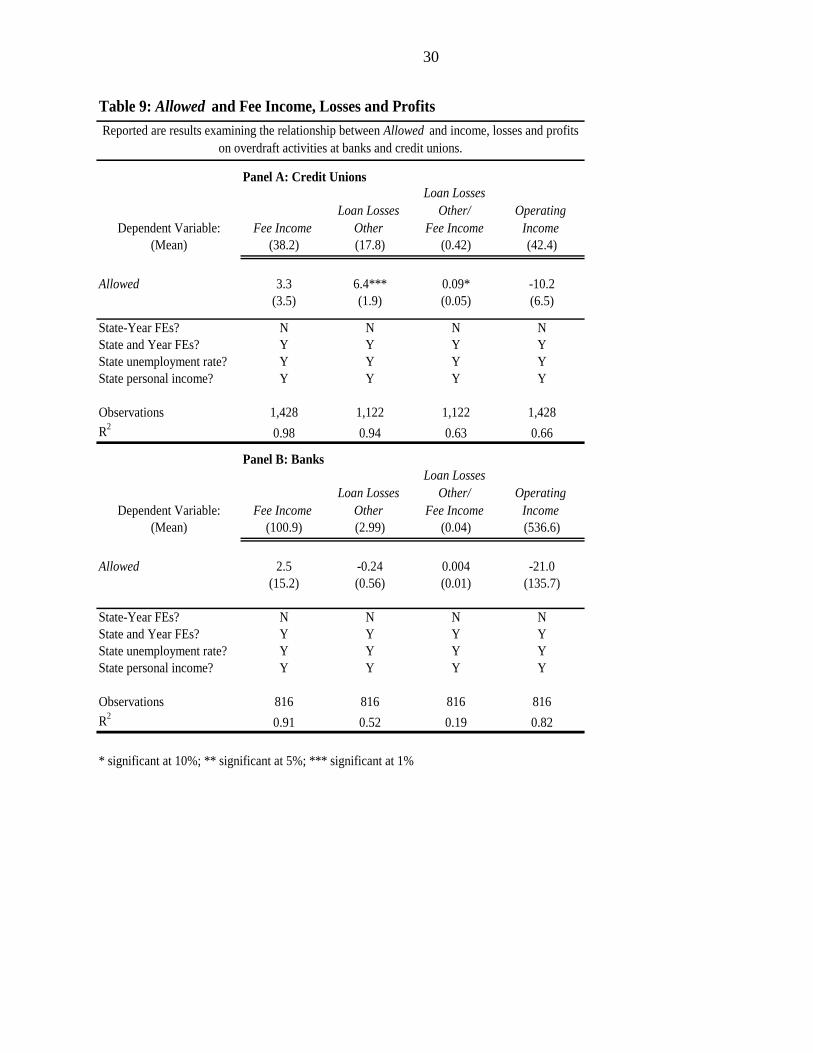
We use Fee Income as a proxy for overdraft revenue and test whether revenue increases
with payday availability. Given that the average price per overdraft attempt is 5% higher when
payday loans are available, we would expect overdraft revenues to be higher as well if the
number of attempts also increases. As in model (2), we use a difference-in-difference approach,
18
with aggregate Fee Income at the state level regressed on Allowed, state fixed effects, time fixed
effects and two time-varying controls, personal income and the unemployment rate. Estimation
results are reported in the first column of each panel in Table 9. In neither case is fee income
significantly related to Allowed. For banks, the coefficient on Allowed of 2.5 suggests a modest
increase of $2.5 billion or 2.5% relative to average fee income of $100 billion. For credit unions,
Allowed is associated with a $3.3 million increase in fee income, roughly 10% relative to the
average of $38.2 million. In both cases, but particularly for banks, there are wide confidence
intervals around these estimates.
Next, we consider loan losses. For credit unions, we find a positive and significant
coefficient on Allowed, suggesting that credit unions bear additional credit losses as they expand
overdraft protection. Among banks, we find no relationship between losses and Allowed, perhaps
because of measurement error in the residual loss category.
Finally, we consider profitability. For credit unions we find that the ratio of loan losses to
fee income increases with payday availability. This suggests lower profitability in overdraft
activities; for every dollar of fee income earned, credit unions give up a larger share to defaults.
Based on point estimates, Operating Income also declines with Allowed, very modestly at banks
and more significantly credit unions. However, these findings are not statistically significant.
Our analysis of overdraft revenue, losses and profits shows no evidence that demand for
overdraft increases with payday availability, though it does confirm that credit unions bear
additional credit losses as they expand overdraft coverage.
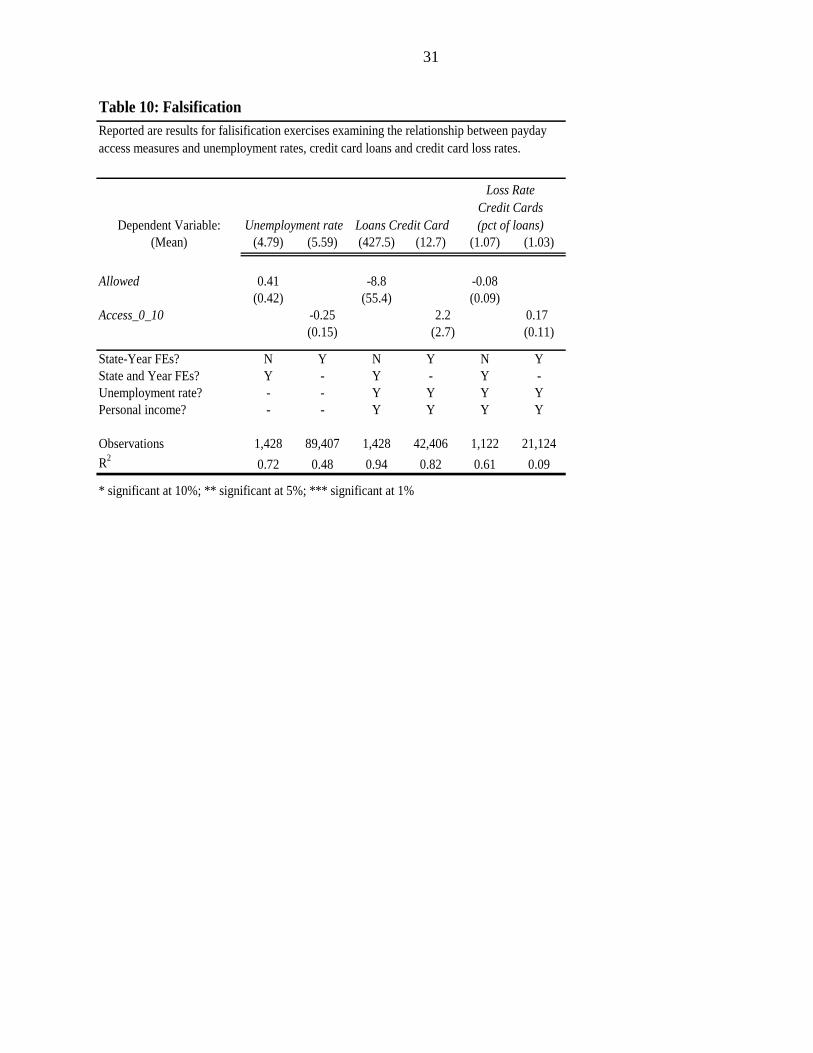
VI. Falsification
How do we explain our finding of price-increasing competition? Perhaps it is the result of
an omitted variable in each model, whereby payday availability coincides with greater demand
19
for credit or greater default risk among borrowers; overdraft prices are higher in the presence of
payday lending, but not because of payday lending. Notably, these conditions would have to
change over time to confound the effect of Allowed, and spill across state borders to confound
the effect of Access. To examine this concern we run three falsification exercises that test
whether payday availability correlates with county unemployment rates, demand for credit card
loans, and loss rates on credit card loans. The results, shown in Table 10, show no statistically
significant relationship between these variables and either measure of payday loan availability.
VII. Conclusion
Quite a lot has been written about whether access to payday credit raises or lowers
welfare of users, but nothing has been written about the competitive implications of payday
credit access. Our findings suggest that competition from payday lenders leads depositories to
improve the quality of their deposit services by increasing overdraft limits and increasing the
supply of bounce protection. Depositories do that not out of altruism, of course, but to preserve
some of the revenue they lose on bounced checks fees when erstwhile overdrawers switch to
payday credit. The increased extension of overdraft credit is not a free lunch, however, as it
entails credit risk to depositories. As a result of the extra risk, depositories charge more for
overdraft credit. Were it not for the increase in overdraft prices, the welfare implications would
be obvious; competition from payday lenders would be welfare improving. Given the price
increase, the implications are ambiguous.
20
References
Advance America Cash Advance Centers, Inc. December 18, 2007. “Advance America
Announces Decision to Close 66 Remaining Centers in Pennsylvania.” Press release. Retrieved
2009-09-01. http://investors.advanceamerica.net/releasedetail.cfm?ReleaseID=282418.
Advance America Cash Advance Centers, Inc. 2009. Form 10-K Annual Report 2009.
Retrieved 2010-02-10 from http://investors.advanceamerica.net/sec.cfm.
Bair, Sheila. 2005. Low-Cost Payday Loans: Opportunities and Obstacles. Report
Prepared for The Annie E. Casey Foundation.
Bertrand, Marianne and Adair Morse. 2009. Information Disclosure, Cognitive Bias, and
Payday Borrowing. Working Paper, University of Chicago Booth Graduate School of Business.
Bertrand, Marianne, Esther Duflo and Sendhil Mullainathan. 2004. How Much Should
We Trust Differences-in-Differences Estimates? Quarterly Journal of Economics, 119(1): 249-
75.
Bond P., D. Musto and B. Yilmaz. forthcoming. Predatory mortgage lending Journal of
Financial Economics (forthcoming).
Campbell, Dennis, Asis Martinez-Jerez, Peter Tufano. 2008. Bouncing Out of the
Banking System: An Empirical Analysis of Involuntary Bank Account Closures. Presented at the
Federal Reserve Bank of Boston Workshop on Consumer Behavior and Payment Choice.
Carrell, Scott, and Jonathan Zinman. 2008. In Harm‟s Way? Payday Loan Access and
Military Personnel Performance. Working Paper.
Chen, Yongmin and Michael Riordan.2008. Price Increasing Competition. Rand Journal
of Economics, 39.
DeYoung, Robert and Phillip Ronnie J., Payday Loan Pricing (January 14, 2009).
Networks Financial Institute 2006-WP-05 (revised version); FRB of Kansas City Paper No.
RWP 09-07. Available at SSRN: http://ssrn.com/abstract=1066761
FAIR Overdraft Coverage Act of 2009, S.1799, 111th
Cong., 1st Sess. (2009).
Fusaro, Marc.2008. Hidden Consumer Loans: An Analysis of Implicit Interest Rates on
Bounced Checks. Journal of Economic and Family Issues, Vol. 29, No.2, June.
Gabaix , Xavier David Laibson.2006. Shrouded Attributes, Consumer Myopia, and
Information Suppression in Competitive Markets. The Quarterly Journal of Economics, MIT
Press, vol. 121(2), pages 505-540, May.
21
GAO. 2008. Bank Fees: Federal Banking Regulators Could Better Ensure that
Consumers Have Required Disclosure Documents Prior to Opening Checking or Savings
Accounts. Government Accountability Office, GAO-08-281.
Hannan, Timothy H. 2006. Retail Deposit Fees and Multimarket Banking. Journal of
Banking and Finance, 30: 2561-78.
Heckman, J. 1981. “The Incidental Parameters Problem and the Problem of Initial
Conditions in Estimating a Discrete Time-Discrete Data Stochastic Process,” in Structural
Analysis of Discrete Data with Econometric Applications,” edited by C.F. Manski and D.
McFadden, Cambridge, MA.
Hsiao, Cheng. 1986. Analysis of Panel Data. Econometric Society Monograph,
Cambridge University Press.
Melzer, Brian T. 2011. The Real Costs of Credit Access: Evidence from the Payday
Lending Market. Quarterly Journal of Economics 126(1), 517-555.
Morgan, Donald and Michael Strain.2008. Payday Holiday: How Households Fare after
Payday Credit Bans. Federal Reserve Bank of New York Staff Study 309.
Morse, Adair. 2009. Payday Lenders: Heroes or Villains?. Working Paper.
North Carolina Department of Justice (March 1, 2006). “Payday lending on the way out
in NC.” Press release. Retrieved 2009-08-27. http://www.ncdoj.gov/News-and-Alerts/News-
Releases-and-Advisories/Press-Releases/Payday-lending-on-the-way-out-in-NC.aspx
Perloff, J.M, V.Y. Suslow, and P.J. Seguin. 2006. "Higher Prices from Entry: Pricing of
Brand-Name Drugs." Mimeo.
Sabatini, Patricia. “Days May Be Numbered for State‟s Payday Lenders.” Pittsburgh
Post-Gazette. 26 Mar. 2006.
Skiba, Paige and Jeremy Tobacman. 2008a. Do Payday Loans Cause Bankruptcy?
Working Paper.
Skiba, Paige Marta and Jeremy Tobacman.2008b. Payday Loans, Uncertainty, And
Discounting: Explaining Patterns of Borrowing, Repayment, and Default (August 21, 2008).
Vanderbilt Law and Economics Research Paper No. 08-33. Available at SSRN:
Stegman, Michael A. 2007. Payday Lending. Journal of Economic Perspectives 2007. 21
(1), 169-190.
Stegman, Michael and Robert Faris.2003. Payday Lending: A Business Model that
Encourages Chronic Borrowing. Economic Development Quarterly, 17(1), 8-32.
Stephens, Inc. 2008. Payday Loan Industry Report.
22
Stoianovici, Petru Stelian and Maloney, Michael T. 2008. Restrictions on Credit: A
Public Policy Analysis of Payday Lending Available at SSRN: http://ssrn.com/abstract=1291278
Veritec Solutions, Inc. August, 2006. Florida Trends in Deferred Presentment.
Veritec Solutions, Inc. August, 2006. Oklahoma Trends in Deferred Deposit Lending.
Ward, M.R., J.P. Shimshack, J.M. Perloff, and J.M. Harris. 2002. Effects of the Private-
Label Invasion in Food Industries. American Journal of Agricultural Economics,84: 961-973.
West Virginia Office of the Attorney General (May 9, 2007). “Attorney General McGraw
Reaches Agreement with WV's Last Payday Lender, First American Cash Advance.” Press
release. Retrieved 2009-09-01. http://www.wvago.gov/press.cfm?ID=337&fx=more
White, James. 2007. NSF Fees. Ohio State University Law Journal, Vol. 68, # 1: 185-199
Wilson, Bart J., Findlay, David W., Meehan, James W. , Wellford, Charissa P. and
Schurter, Karl. 2008. An Experimental Analysis of the Demand for Payday Loans.
Zinman, Jonathan, forthcoming, “Restricting consumer credit access: Household survey
evidence on effects around the Oregon rate cap,” Journal of Banking and Finance.
23
Table 1: The Distribution of Deposit Overdrafts and Payday Loans in 2006
# of overdrafts per year % of depositors % of overdrawers Annual fees incurred ($)
0 75.0 - 0
1 – 4 12.0 48.0 64
5 – 9 5.0 20.0 215
10 – 19 4.0 16.0 451
20 or more 4.9 19.6 1610
# of payday loans per year Annual fees incurred ($)
1 – 4 109
5 – 9 306
10 – 19 634
20 or more 1049
Overdrafts
Payday Loans
Source: Veritec Solutions, Inc. Based on data for payday borrowers in Florida and Oklahoma from
September 2005 through August 2006. "Annual fees incurred" is calculated by multiplying
average fee per loan ($43.70) by the midpoint of each borrowing range (or 24 loans in the final
category).
Source: FDIC (2008, p. IV, Executive Summary points 2,3,4). "Annual fees incurred" is the average
amount of fees incurred by the customers in each borrowing range.
% of borrowers
39.8
24.0
26.8
9.3
Table 2: Importance of Overdraft Revenues to Depository Institutions
Overdraft (OD) Revenue Net Operating Income (NOI) OD Revenue/NOI
($ billions) ($ billions) (percent)
Banks 26.1 $145.8 17.9
Savings Banks 3.5 21.9 16.0
Credit Unions 3.5 5.8 60.4
Total 33.1 173.7 19.1
Source: Moebs $ervices (http://www.moebs.com/Default.aspx?tabid=125) using FDIC and NCUA
2003 Call Reports and 5300 Reports
24
Table 3: Average Institution and County Characteristics, by Change in Allowed and Access_0_10.
Diff. Diff.
No Change in
Allowed
Change in
Allowed
significant
at 5% Access_0_10 = 0 Access_0_10 = 1
significant
at 5%
Institution (N = 17,837) (N = 2375) (N = 2,830) (N = 391)
Credit Union 0.41 0.41 0.44 0.49
Commercial Bank 0.47 0.45 * 0.30 0.36 *
Savings Bank 0.12 0.14 * 0.26 0.15 *
Total Assets† 2,409,000 2,739,000 3,874,000 1,824,000
County (N = 1,750) (N = 264) (N = 199) (N = 38)
Median Income 36,900 37,400 42,800 42,700
Population 126,500 132,600 283,400 198,700
Percent urban 0.49 0.51 0.64 0.60
Home ownership 0.73 0.72 0.69 0.71
Percent white 0.82 0.81 0.83 0.84
Percent black 0.07 0.13 * 0.08 0.09
Percent hispanic 0.07 0.03 * 0.05 0.03
Percent foreign born 0.04 0.03 0.06 0.05
County-Year (N = 7,675) (N = 1,114) (N = 931) (N = 155)
Unemployment Rate‡ 0.052 0.052 0.050 0.046 *
HHI 0.21 0.21 0.17 0.18
† N = 17,762 for No Change in Allowed, N= 2,373 for Change in Allowed, N = 2802 for PaydayAccess_0_10 = 0.
‡ N = 7, 764 for No Change in Allowed .
Reported are means and number of observations (N). Allowed = 1 for institutions in states allowing payday lending, 0 otherwise.
Access_0_10 indicates whether payday loans are available within ten miles of center of county where the institution is located. For
stratification by Access_0_10 , means are given only for observations in states that prohibit payday loans.
25
Dependent variable: #Returned/#Processed $Returned/$Processed $Returned/#Returned
(mean) (1.29%) (1.21%) (0.869 thousand)
(1) (2) (3)
Allowed -0.31* -0.16 0.124*
(0.16) (0.12) (0.07)
State Unemployment 0.017 -0.012 0.015
(0.06) (0.05) (0.02)
District Unemployment -0.060 -0.020 -0.070**
(0.10) (0.10) (0.03)
Constant 1.67*** 1.78*** 1.42***
(0.35) (0.35) (0.15)
Observations 1325 1325 1325
R2
0.68 0.68 0.82
* significant at 10%; ** significant at 5%; *** significant at 1%
Reported are OLS estimates using check processing data from Federal Reserve Regional Check Processing Centers (CPC) over
1998Q1-2008Q3. Allowed equals one if state permitted payday lending, zero if not. Allowed is identified by bans in six states:
GA, NC, MD, WV, OR and PA. Regressions include CPC and date fixed effects. Standard errors, given in parentheses, are
clustered by CPC .
Table 4: Fewer, but Larger, Returned Checks When Payday Credit is Permitted
26
Table 5: How Payday Credit Access Affect Overdraft Fees and Limits, and Free Checking
allowing payday credit, zero otherwise.
(1) (2) (3) (4) (5) (6)
Allowed 1.09* 1.31** 57.1** 63.1** -0.051** -0.049**
(0.62) (0.52) (25.8) (0.0) (0.0) (0.022)
HHI -0.29 4.33 0.04
(0.99) (89.700) (0.1)
CreditUnion -2.38*** 41.5* 0.24***
(0.38) (21.800) (0.0)
SavingsBank -1.22*** -96.8** 0.08**
(0.24) (44.700) (0.0)
LogAssets 0.96*** 36.4*** 0.04***
(0.09) (9.500) (0.0)
State and Year FEs? Y Y Y Y Y Y
County Controls? N Y N Y N Y
Division-Year FEs? N N N N N N
Observations 15,072 15,040 2,751 2,749 10,524 10,504
R2
0.19 0.32 0.04 0.07 0.04 0.10
* significant at 10%; ** significant at 5%; *** significant at 1%
Reported are OLS regression estimates (robust standard errors clustered by state). Allowed = 1 for institutions located
Dependent Variable (mean):
Overdraft Limit (514.2)Overdraft Fee (24.98) Free Checking (0.73)
27
Table 6: Effects of Local Payday Credit Access on Overdraft Fees and Limits, and Free Checking
Dependent Variable (Mean):
(1) (2) (3) (4) (5) (6)
Access_0_10 1.20** 1.48*** -4.80 -41.1 -0.051 -0.088**
(0.56) (0.55) (98.0) (94.3) (0.04) (0.04)
Access_10_20 0.14 0.23 67.3 20.4 -0.05 -0.05
(0.60) (0.66) (236.2) (217.1) (0.04) (0.04)
Access_20_30 -0.18 -0.09 -147.5 -176.6 0.01 0.02
(0.70) (0.58) (132.3) (133.0) (0.03) (0.03)
HHI -0.02 37.7 0.06
(0.67) (80.7) (0.06)
CreditUnion -2.39*** 46.5 0.24***
(0.21) (36.2) (0.02)
SavingsBank -1.10*** -96.1* 0.09***
(0.21) (57.8) (0.02)
LogAssets 0.95*** 38.0*** 0.04***
(0.05) (10.7) (0.00)
Border -0.32* -14.9 0.04***
(0.18) (21.2) (0.01)
State-Year FEs? Y Y Y Y Y Y
County Controls? N Y N Y N Y
Observations 15,072 14,995 2,751 2,745 10,524 10,489
R2
0.24 0.37 0.06 0.09 0.07 0.12
* significant at 10%; ** significant at 5%; *** significant at 1%
Reported are OLS estimates (robust standard errors clustered by county). Access_X_Y equals 1 if the institution is located in
a county whose center is within X and Y miles of a state that allows payday lending.
Overdraft Fee (24.98) Free Checking (0.73)Overdraft Limit (514.2)
28
Table 7: Robustness
Panel B
Sample: Full
Sample
Full
Sample
Full
Sample
> 50%
deposits in
state
> 50%
deposits in
county
Full
Sample
Full
Sample
Full
Sample
> 50%
deposits in
state
> 50%
deposits in
county
Model Type: OLS OLS OLS OLS OLS Probit Probit OLS OLS OLS
Dependent Variable (Mean):
(1) (2) (3) (4) (5) (1) (2) (3) (4) (5)
Allowed 0.061** 1.29** -0.063** -0.039*
(0.026) (0.55) (0.030) (0.023)
Access_0_10 0.044** 1.23** -0.088** -0.094**
(0.021) (0.56) (0.034) (0.042)
LogDistance -0.48* 0.036*
(0.26) (0.02)
State-Year FEs? N Y Y N Y N Y Y N Y
State and Year FEs? Y - - Y - Y - - Y -
County Controls? Y Y Y Y Y Y Y Y Y Y
Institution Controls? Y Y Y Y Y Y Y Y Y Y
HHI ? Y Y Y Y Y Y Y Y Y Y
Border ? N Y Y N Y N Y Y N Y
Observations 14,827 14,783 14,902 13,509 11,137 10,483 10,268 10,389 10,014 8,959
R2/Pseudo-R
20.25 0.30 0.37 0.31 0.32 0.09 0.10 0.12 0.10 0.13
* significant at 10%; ** significant at 5%; *** significant at 1%
Results are provided for several variations on the basic empirical models in Tables 4 and 5. Regressions in the first two columns of each panel assess robustness relative
to functional form: Panel A uses the log of Fee as the dependent variable, while Panel B assumes a probit functional form for Free Checking . Column 3 of each panel
uses an alternative payday access measure: LogDistance , the natual logarithm of the distance to the nearest allowing state, replaces the Access_X_Y dummies. Finally,
Columns 4 and 5 report results of the baseline model estimated on a restricted sample that excludes large, geographically dispersed banks (those with less than 50% of
deposits in the state or county of the surveyed branch). Robust standard errors grouped by state (Column 1 & 4 of each panel) and by county (Columns 2, 3 & 5 of each
panel) are reported in parentheses.
Panel A
-----Log Fee (3.19)----- --------Overdraft Fee (24.98)-------- -----------------------Free Checking (0.73)-----------------------
29
Table 8: Bounce Protection and OD Line of Credit, Offers and Unused Commitments
Dependent Variable:
(Mean)
Allowed 0.024** 0.011 213.3** 40.9
(0.012) (0.009) (82.0) (102.7)
Access_0_10 0.026 0.014 286.1 -3.9
(0.030) (0.034) (330.8) (203.6)
State-Year FEs? N N N N
State and Year FEs? Y Y Y Y
State unemployment rate? Y Y Y Y
State personal income? Y Y Y Y
Observations 49,834 49,140 85,917 84,795 67,472 66,634 279,701 276,513
R2
0.75 0.11 0.81 0.16 0.81 0.15 0.80 0.47
* significant at 10%; ** significant at 5%; *** significant at 1%
(0.37) (0.37) (1032.7) (899.9)
Reported are OLS estimates for regressions of overdraft credit supply on Allowed and Access . The regression
sample covers credit unions, who are required to disclose this information in their regulatory filings.
ODBP offered OD LOC offered
OD Commitments
(unused)
OD LOC
Commitments
(unused)
30
Table 9: Allowed and Fee Income, Losses and Profits
Panel A: Credit Unions
Dependent Variable: Fee Income
Loan Losses
Other
Loan Losses
Other/
Fee Income
Operating
Income
(Mean) (38.2) (17.8) (0.42) (42.4)
Allowed 3.3 6.4*** 0.09* -10.2
(3.5) (1.9) (0.05) (6.5)
State-Year FEs? N N N N
State and Year FEs? Y Y Y Y
State unemployment rate? Y Y Y Y
State personal income? Y Y Y Y
Observations 1,428 1,122 1,122 1,428
R2
0.98 0.94 0.63 0.66
Panel B: Banks
Dependent Variable: Fee Income
Loan Losses
Other
Loan Losses
Other/
Fee Income
Operating
Income
(Mean) (100.9) (2.99) (0.04) (536.6)
Allowed 2.5 -0.24 0.004 -21.0
(15.2) (0.56) (0.01) (135.7)
State-Year FEs? N N N N
State and Year FEs? Y Y Y Y
State unemployment rate? Y Y Y Y
State personal income? Y Y Y Y
Observations 816 816 816 816
R2
0.91 0.52 0.19 0.82
* significant at 10%; ** significant at 5%; *** significant at 1%
Reported are results examining the relationship between Allowed and income, losses and profits
on overdraft activities at banks and credit unions.
31
Table 10: Falsification
Dependent Variable:
(Mean) (4.79) (5.59) (427.5) (12.7) (1.07) (1.03)
Allowed 0.41 -8.8 -0.08
(0.42) (55.4) (0.09)
Access_0_10 -0.25 2.2 0.17
(0.15) (2.7) (0.11)
State-Year FEs? N Y N Y N Y
State and Year FEs? Y - Y - Y -
Unemployment rate? - - Y Y Y Y
Personal income? - - Y Y Y Y
Observations 1,428 89,407 1,428 42,406 1,122 21,124
R2
0.72 0.48 0.94 0.82 0.61 0.09
* significant at 10%; ** significant at 5%; *** significant at 1%
Reported are results for falisification exercises examining the relationship between payday
access measures and unemployment rates, credit card loans and credit card loss rates.
Unemployment rate Loans Credit Card
Loss Rate
Credit Cards
(pct of loans)
32
APPENDIX A: PAYDAY LOAN REGULATIONS
Summary of Coding for Allowed:
The Moebs survey of checking account fees and services was conducted in December of 2006, and in June
for every other year. Five states prohibited loans throughout the sample period (Allowed = 0): CT, MA, NJ, NY and
VT. Seven states changed from allowing to prohibiting payday lending between 1995 and 2008 (Allowed = 0
beginning in the year given in parentheses): MD (2002), GA(2004), NC (2006), WV (2006), DC (2008), OR (2008)
and PA (2008). One state changed from prohibiting to allowing payday lending between 1995 and 2008 (Allowed =
1 beginning in the year given in parentheses): NH (2000). The remaining states allowed loans throughout the sample
period (Allowed = 1).
States that prohibited payday lending throughout 1995-2008
New Jersey and New York forbid payday loans via check cashing laws that prohibit advancing money on
post-dated checks (N.J. Stat. 17:15A-47 and NY CLS Bank 373) and usury limits (N.J. Stat. 2C:21-19 and NY CLS
Penal 190.42). Massachusetts banned payday loans through a usury limit on small loans made or brokered in the
state (ALM G.L.c.140 §96 and CMR 209 26.01). Connecticut prohibited lending via a cap on check cashing fees
(Conn. Agencies Reg. § 36a-585-1) and small loan interest rates (Conn. Gen. Stat. 36a-563). Vermont prohibited
payday lending through a usury limit (8 V.S.A. § 2230 and 9 V.S.A. § 41a).
We confirmed by reading 10-K filings and company websites that the largest multistate payday store
operators – Ace Cash Express, Advanced America, Cash America, Check into Cash, Check „N Go, Money Mart and
Valued Services – did not operate payday loan stores in these five states.
States that experienced a change in payday loan availability between 1995 and 200819
Maryland banned payday lending through restrictions on fees charged by check cashers (MD Financial
Institutions Code § 12-120) and small loan interest rates (MD Commercial Law Code § 12-306), and finally passed
anti-loan brokering legislation (MD Commercial Law Code § 14-1902), effective June, 2002 to eliminate the agency
payday lending model, whereby payday lenders operated as agents, arranging loans for out-of-state banks.
Georgia banned payday lending with a law that took effect in May, 2004 (O.C.G.A. § 16-17-1).
Payday lenders operated under the agent model in North Carolina and West Virginia until 2006. All
remaining lenders agreed to exit North Carolina in March, 2006, after facing a series of suits filed by the state
Attorney General (see NC Department of Justice press release). First American Cash Advance, the last payday
lender in West Virginia, operated under the agent model until July, 2006 (see press release from WV Attorney
General). North Carolina prohibits payday lending through a 36% interest rate cap on small loans (N.C. Gen. Stat. §
53-173). West Virginia prohibits payday lending by limiting fees on check cashing, prohibiting payday check
cashing (W. Va. Code § 32A-3-1) and imposing a usury limit on small loans (W. Va. Code § 47-6-5b).
The District of Columbia prohibited payday lending in November, 2007, by limiting fees on check cashing
and prohibiting post-dated check cashing (D.C. Code § 26-317 and 26-319).
Oregon placed a de facto ban on payday lending in July, 2007, by imposing a 36% interest rate cap as well
as restrictions on loan renewals (ORS § 725.622).
Payday lending was ostensibly banned throughout the sample period in Pennsylvania via a cap on small
loan interest rates (P.A. 7 P.S. § 6201-6219), but the agent model was permitted through a law that sanctioned loan
brokering (P.A. 73 P.S. § 2181-2192). Some lenders ceased operations in the state in mid-2006, after the FDIC
placed restrictions on their bank lenders (Sabatini, 2006). However, Advance America, the largest national payday
lender, did not stop lending and close its Pennsylvania stores until December, 2007 (See Advance America 9/07
press release).
New Hampshire‟s small loan interest rate ceiling acted as a de facto ban on payday loans until it was
removed in January, 2000 (1999 NH ALS 248), and payday lenders entered thereafter.
19
We have not captured every law change with Allowed. We include those that were binding, as confirmed through
press releases, news stories and the public filings of the largest payday loan operators. In the case of one law
sanctioning payday credit in Rhode Island (R.I. P.L. 2001, Ch. 371, § 4), we could not confirm the date payday
lenders entered; according to a supervisor in the Division of Banking, check cashers began offering payday on
transactions prior to the July 2001 law change. We do not count Rhode Island as a state with a change in Allowed.