competition, competitiveness and development: lessons...
TRANSCRIPT

UNCTAD/DITC/CLP/2004/1
UNITED NATIONS CONFERENCE ON TRADE AND DEVELOPMENT
Geneva
COMPETITION, COMPETITIVENESS AND DEVELOPMENT: LESSONS FROM DEVELOPING COUNTRIES
UNITED NATIONS New York and Geneva, 2004
CHAPTER IV
251Mikyung Yun
Competition policy, supply capacity
and export competitiveness
IV
IV.1. COMPETITION AND PRODUCTIVITY GROWTH: EVIDENCE FROM KOREAN
MANUFACTURING FIRMS
Mikyung Yun
1. The relationship between competition, productivity and development:
a selective literature review
Authors have been prolific in exploring the connection between competition and eco-
nomic growth but theoretical treatment does not offer any ready conclusions. For exam-
ple, although competition induces productivity gains, this might be outweighed by the
monopolist’s advantage for innovation. The theoretical ambiguity has rendered empirical
analysis of greater importance. There are many dimensions to the connection between
competition and economic growth, but an important area of empirical research has
focused on analysing the impact of product market competition on productivity growth.
Ahn (2002) reports, in a recent survey of the literature, that a large number of empirical
studies seem to confirm that product market competition encourages productivity growth.
Nickell (1996) is representative of such a study. He finds that for a sample of 676 UK firms
over the period 1975–1986, competition was associated with both higher productivity
levels and productivity growth. Disney, Haskel and Heden (2000) extend this study to a
larger data set of around 143,000 UK establishments over the period 1980–1992 and
find similar results. Using a different methodology, Klette (1999)1
finds that, for 14 manu-
facturing industries in Norway, plants with higher market power tend to be less produc-
tive.
However, most of the current studies are based on experiences in developed
country, especially in North America and Europe. Despite mounting empirical evidence
coming from the developed countries, it is often argued that, during the early stages of
development, too much competition would inhibit economic growth. The proponents of
this argument typically refer to the Korean experience. It is widely believed that Korea’s
economic development is based on nurturing national champions by suppressing com-
petition at firm level and protecting the domestic market.
This suggests that the appropriate level of competition differs for different stages of
economic development. Indeed, some argue that there is an optimal level of competition,
given the economic circumstances, and that maximum competition is not always better
(Singh, 2002). With respect to Korea, Amsden and Singh (1994) show that, given the
251-263.pmd 26/05/2004, 14:31251

252 Competition and Productivity Growth
market size of Korea, there was actually more competition than is widely perceived and
not all of the growth is due to government protection and subsidies. Further, they argue
that there are different kinds of competition – for example competition for the market as
opposed to competition in the market. Competition among a small number of large con-
glomerates is representative of the former kind of competition, and such competition can
be as fierce as competition within a market.
Competition for the market has been usually applied to analyse standards competi-
tion and network effects, but viewing competition as the selection process that weeds out
the less efficient from the more efficient is in line with the “competition for the market” type
of competition. There is empirical support for the active role of selection in promoting
competition and productivity for Korea. Using plant-level data for the period 1990–1998,
Hahn (2000) shows that plant entry and exit rates in the manufacturing sector are high
(higher than in the US and several developing countries), and that entry and exit
account for as much as 45 per cent and 65 per cent of productivity growth during cyclical
upturn and downturn, respectively. This suggests that at least in the post-liberalization
Korean economy, selection has been an important element of product market competi-
tion, and a dynamic source of productivity growth. On the other hand, the study also
shows that market share reallocation between continuing plants (i.e. competition in the
market) plays only a minor role in productivity growth.
Glen, Lee and Singh (2001) also show that competition in many developing coun-
tries has been higher than is usually thought. Their study finds that the persistence of
profits in selected emerging markets2
is less than that reported for developed economy
markets. This indicates that developing country product markets are at least as competi-
tive as those in advanced countries and imply that competition by itself is not necessarily
the most important ingredient for economic growth. This conclusion also implies that
adopting a stringent competition policy is not a priority in developing economies. How-
ever, Glen and colleagues do not directly explore what the source of such competition is,
or what impact such an unexpectedly high level of competition has had on productivity
growth.
Transition economies, which have switched over from the planned economic system
to a market-based system in the 1990s, have become an excellent subject to study the
impact of competition as an external shock on productivity and existing evidence sup-
ports the “optimal competition” theory. A good example of such a study is that of Carlin et
al. (2001), which shows that competition has a positive effect on firm performance, but that
the relationship is not a simple one. Firms that had fewer than three competitors were
more productive than either firms that had more than three competitors or monopolies. At
the same time, market dominance (measured by price elasticity) was shown to have a
positive impact on sales growth.
In a cross-country study (100 countries over the period 1986–1995), using the
presence of an antitrust policy as the main proxy for intensity of competition, Dutz and
Hayri (1999) show that competition has a positive impact on growth, both in developed
251-263.pmd 26/05/2004, 14:31252

253Mikyung Yun
and developing countries. An interesting finding in their study is that, unlike their Latin
American and European counterparts, a group of Asian countries3
did not show any
correlation between competition and growth. This result, if correct, implies that while
competition might encourage growth, there are other factors that can also do so.
The foregoing literature review shows that evidence from developing economies on
the impact of competition on productivity growth at firm level is rather thin. The remainder
of this paper addresses the debate of whether or not competition has contributed to
productivity gains in Korea, by focusing on the impact of product market competition on
productivity using firm-level panel data. The next section presents the empirical work.
Although this paper does not directly deal with competition policy per se, a number of
policy implications are drawn in the concluding section, based on the empirical results.
2. Competition and productivity growth: empirical analysis
2.1. Theoretical background
This study explores the impact of competition on productivity and productivity growth
by estimating a production function. A simple Cobb–Douglass production function with two
factors of production, labour and capital, can be expressed as in equation (1).
where Y is output, K is capital stock, and L is labour. Labour productivity is given by
dividing output by labour as in equation (2). The constant term A, or total factor produc-
tivity, represents the shift in the production function at given levels of labour and capital,
and is given by equation (3). It is the unexplained source of productivity growth, and is
generally identified with technical change.4
As the literature review in Section 1 shows,
product market competition is increasingly viewed as an important source of productivity
and productivity growth (i.e. as a significant constituent of the shift parameter). However,
whether or not this applies to the developing economies is still open to debate.
This paper explores the impact of competition on productivity by estimating a simple
production function at firm level. Taking logs on both sides, adding competition variables
and incorporating industry and time dummies to the labour productivity equation (i.e.
equation 2) yields equation (4).
251-263.pmd 26/05/2004, 14:31253
ε it
α
α αα
α
α
α α
α

254 Competition and Productivity Growth
In this equation, Yit
represents the output of firm i at time t, Kit
is the capital stock of firm i at
time t, and Lit
is hours worked at firm i at time t. Therefore, Yit
/Lit
is the labour productivity.
The third term, cit
, represents the degree of competition and its coefficient measures how
much impact competition has on the level of productivity of the firm. On the other hand, the
fourth term, cit
t, represents the impact of competition on productivity growth, with t being
the time trend. The coefficient of this term measures how much competition affects changes
in productivity over time. Following Nickell (1996) and Disney, Haskel and Heden
(2000), this formulation allows one to distinguish the effect of competition on the level of
productivity from its effect on the growth of productivity. The term Zi
captures all unob-
served firm-specific factors influencing the level of productivity that does not change over
time, while Zt
captures shocks common to all firms over time. The error term eit
captures
all other shocks to company productivity, including technological change (i.e. At
). The
term Zj
captures industry-specific characteristics, with the subscript j representing indus-
try.
Equation (4) is not easy to estimate because the firm-specific factors are unobservable
and make it difficult to construct a proxy for this variable. However, if these factors are
stable over time, it can be eliminated by first differencing. Four proxies are used to
represent competition (or lack thereof): number of firms (NUM), firm’s market share
(MKS), industry concentration (CR3), and rent (RENT). Firm’s market share or industry
concentration are probably not reliable cross-section measures of market power be-
cause collusion depends not only on the size of the firms relative to the market, but also
on other factors such as the ability of firms to hide price changes, which are hard to
observe. However, these factors are not likely to change much over time, and it is
possible to expect that changes in the measure of market share be correlated with
changes in the true measure of market power. Thus, market share or industry concen-
tration is a reasonably good time-series measure of market power (Nickell, 1996; Dis-
ney, Haskel and Heden, 2000).
Further, these variables can be affected by technological or cost differences between
firms. Indeed, a reverse causality may exist. While a firm’s market dominance may lead
to slack and result in a loss of productivity (competitiveness), it is possible that firms with
high productivity gain a high market share, leading to positive correlation between
market power and productivity. Industry concentration may make collusion easier, lower-
ing competition and thus the effort to increase productivity, but it is also possible that a high
level of concentration is a result of competition, which weeds out the less productive firms.
This would again lead to positive correlation between the inverse measure of competition
and productivity. The reverse causality problem also exists for rent. A high level of
monopoly rent leads to slack and thus a decrease in productivity, but it is also possible that
a firm enjoys a high level of profits due to its high productivity. Therefore, these variables
are lagged by one period to fix the direction of causality being estimated.
However, there does not seem to be any obvious problem of reverse causality for
number of firms. A high number of firms would indicate a high level of competitive pres-
sure, and lead to higher productivity. However, higher productivity does not necessarily
251-263.pmd 26/05/2004, 14:31254

255Mikyung Yun
mean a high or low number of firms, unless there are economies of scale. To pick up the
effect of economies of scale, the variable SIZE is added to the estimation. In addition, as
noted by Nickell, Nicolitsas and Dryden (1997), competition comes not only from the
product market but also from the financial market, and this is represented by the variable
FP, financial pressure. Therefore, the final equation estimated is equation (5).
2.2. The data and variables
This study uses an unbalanced panel data set of manufacturing firms for the period
1990–2002. All firm-level data are provided by the Korea Information Service Inc., a
proprietary credit-rating agency. Industry-level data, such as industry concentration and
shipment at the five-digit level, are published by the Korea Development Institute. This
∆ln(Yit/Lit) = α1∆lnKit + α2∆MKSit-1 + α3∆CR3it-1 + α4∆NUMit +α
5NUM
it + α
6∆RENT
it-1 + α
7RENT
it-1 + α
8∆FP
it+ α
9FP
it +
α10SIZEit + α11Ζj + α12Ζt + ε it (5)
251-263.pmd 26/05/2004, 14:31255

256 Competition and Productivity Growth
data series exists only up to 2000. Table 1 shows the measurements used to proxy the
variables in equation (5). A firm’s output is represented by value added, and is normal-
ized by the producer price index published by the National Statistical Office. The amount
of labour is measured by number of employees, and capital input by fixed asset. Fixed
asset is normalized by the capital deflator calculated from the real and nominal capital
stock published by the National Statistical Office.
The variable RENT represents price cost margin, or above-normal profit and is
proxied by before-tax profit divided by sales. Financial pressure, FP, is measured by
financial expenses divided by sales. SIZE is a dummy variable, taking on the value of 1
for large firms, and 0 for small and medium firms. Industry dummies group the firms into 23
industries (three-digit level). The time dummy takes on a value of 1 for 1990–1997, and
0 for 1998–2002. Therefore, the time dummy should be able to pick up the effect of any
structural changes due to the financial crisis.
The summary statistics in Table 2 and the following graphs show the general trend of
the important variables and the economic environment in Korea during the period 1990–
2002. The GDP increases until 1996 and then plummets during the crisis years of 1997–
1998. It has rapidly recovered since then. The annual average of percentage growth in
251-263.pmd 26/05/2004, 14:31256

257Mikyung Yun
labour productivity at firm level does not show much dramatic movement during 1990–
2002, showing a very slow but increasing trend. Korean firms suffered from very low
profitability, with the annual average being in the negative for the entire period under
study. However, the difference between the minimum and the maximum is quite large.
Profitability increases significantly from 1996 to 1997, perhaps due to large-scale bank-
ruptcies of insolvent firms, which are no longer in the sample to pull down the averages.
But if this is the case, profitability should recover somewhat after 1997. Consistent with the
profitability series, industry concentration steadily decreases until 1997, when it shoots
up, again possibly due to the large number of bankruptcies at the time of the crisis.
Concentration seems to level off after 1998. It is quite evident that 1997 is a watershed in
many respects and there is a structural break before and after the financial crisis.
Graph 1. Trend in real GDP: 1990–2002 annual averages. Unit: billion US$
Graph 2. Trend in labour productivity growth: 1990–2002 annual averages
Unit: 1000won/person
251-263.pmd 01/06/2004, 08:51257

258 Competition and Productivity Growth
Graph 3. Trend in annual average rent
Graph 4. Trend in annual average CR3
2.3. Estimation results
The results are shown in Table 3. Column 1 gives the regression result for all the
variables included, whereas column 2 reports the more parsimonious specification,
dropping variables that are not significant. As predicted, capital input (K) is positive and
significant. Market share (MKS) and industry concentration (CR3) are not significant,
indicating that changes in these variables do not affect changes in productivity in any
significant way. It is interesting to note that market share is unexpectedly signed positively,
but industry concentration is negatively signed as predicted.
Changes in the number of firms (NUM) positively affect changes in productivity, and
this is significant at the 10 per cent level. On the other hand, the number of firms is
negatively correlated with change in productivity, but this effect is not significant. Similarly,
change in rent (RENT) is positively correlated with productivity change, but this effect is
not significant. Rent itself is negatively correlated with productivity change, and this effect
251-263.pmd 26/05/2004, 14:31258

259Mikyung Yun
is highly significant. This suggests that while enjoyment of monopoly rent may boost
productivity, it is not conducive to long-term, cumulative growth in productivity, and that
the latter effect is likely to be more significant. Finally, financial pressure has the greatest
impact on productivity, but a negative one. The competitive pressure coming from the
financial market raises neither productivity nor productivity growth. Why this is so, is
difficult to explain but it may reflect the heavy financial burden borne by Korean firms both
before and after the financial crisis. The dummy variable SIZE is not significant, indicating
that economies of scale (i.e. bigger firms were not necessarily the more efficient) may not
be important. This is difficult to believe for most manufacturing economies, and it is possi-
ble that the SIZE variable is not picking up the economies of scale effect very well.
Table 3. Impact of competition on productivity and
productivity growth
251-263.pmd 01/06/2004, 08:51259

260 Competition and Productivity Growth
When the insignificant variables, market share, industry concentration and firm size
are dropped in column 2, the results remain much the same, except that now both the
level and the change effect of number of firms become significant.
These results are, however, provisional. Import competition has not been included
among the explanatory variables, due to the difficulty in matching product classification
used for trade data and industry data. This procedure is difficult and tedious at the highly
disaggregated level (for example, below the three-digit level). Further, a more precise
measure of market power (such as price cost margin) would be preferred. Firms in the
service sector were excluded from this sample, but as this sector takes up a large portion
of the economy, it would be important to include the services sector. Furthermore, meas-
uring productivity with only the surviving firms may result in sample selection bias (see
Disney, Haskel and Heden, 2000). A methodology has been developed to deal with this
problem, and it would be worth extending this analysis to correct for sample selection
bias, if any.
Summing up, the regression results seem to suggest the following:
Industry dynamics such as changes in number of firms (i.e. entry and exit of firms)
could be a more significant index of competition than individual or combined market
shares of the top few firms. Further, change in number of firms is an important source of
competition and productivity growth while a high number of firms in the market itself is not
conducive to productivity growth. This supports Hahn’s study (Hahn, 2000), which
shows that the selection effect is much greater than competition within the market in
explaining productivity growth.
Rent is positively correlated with productivity but negatively correlated with produc-
tivity growth, and only the latter effect is significant. When this is interpreted for the long-
term horizon, it may mean that increased monopoly rent may boost productivity growth
now, but will hinder economic development in the long run, and that the latter effect is the
significant one.
Competitive pressure coming from the financial market is not helpful to either produc-
tivity or productivity growth. But this may reflect the particular circumstances arising from
the financial crisis rather than through any linkages between competitive pressures from
the financial market affecting corporate governance and managerial effort in the firm.
3. Conclusion
This paper did not directly deal with competition policy and its application to developing
economies but rather focused on empirical analysis of the impact of competition on firm-
level productivity. Nevertheless, a number of policy implications can be drawn based on
the Korean experience analysed above. First, competition policy should not narrowly
focus on curbing the market dominance of the few firms already in the market but rather
employ a broad approach that keeps entry and exit barriers low. This means adopting a
broad-based deregulatory framework to eliminate as much red tape on entry and exit of
firms into the overall economy as possible. This is probably better done through compe-
251-263.pmd 26/05/2004, 14:31260

261Mikyung Yun
tition advocacy, cultivating entrepreneurial culture, and providing functional support on
the supply side (e.g. infrastructure, setting up market institutions) to assist newcomers and
directing exiting firms to new opportunities, rather than through case by case investiga-
tions of violations of competition law.
An interesting avenue for future analysis would be to compare the application of
competition policy in developing countries to that of high-tech industries in developed
countries. One can find an uncertain analogy between applying competition policy to
developing economies, where most of the production technology introduced is new, and
the application of competition policies to high-tech industries in developed countries,
where technology is rapidly developing in an emerging market structure. The competi-
tion for the markets, characteristic of competition among Korean firms, is akin to the
competition for the markets found in network industries. Seemingly anti-competitive be-
haviour may hide intense levels of underlying competition, and too much intervention on
competition-policy grounds (or on the basis of industry structure such as concentration
levels) in the early period of the industry’s development may inhibit the fully fledged
growth of the industry. It is important to note that such an analogy is applicable only if the
technology being adopted is new to the developing country, and the industry is taking off
with participants and industry structure unfolding over time. The analogy would not be
appropriate where there is no dynamics in the industry, and if the industry incumbents
are obviously abusing their monopoly power, without any incentive to adopt new ways
of doing things.
Second, whether it is simple competitive advocacy or setting up highly sophisticated
court procedures, it is important to have competition policy in whatever form, as persistent
monopoly rents are not conducive for long-term, cumulative productivity growth. It would
therefore be important to have an authority in charge of promoting and implementing
competition law and competition advocacy.
Third, the financial market needs to be well developed before it can have a positive
effect on productivity through sharpening competition for managers who will then struggle
to raise the effort to survive and stay in the market. Otherwise, financial pressure may
only act as too heavy a burden on firms. In this sense, product market competition may
be a much more important source of keeping managerial effort on alert than the financial
market, which is likely to be inadequate in monitoring firm performance in developing
economies. Therefore, the role of competition policy would be much more important in
developing economies than in developed economies where there are many other chan-
nels (such as the well-developed financial market and markets for mangers) through
which firm performance can be monitored.
For more general conclusions regarding the application of competition policy for
developing economies, it would be important to directly test for hypotheses found in the
literature, such as the stages theory (or optimal competition theory) and comparing the
relative importance between competition through selection effect and competition within
the market. The former hypothesis would require a longer time series, or pooling of firm-
251-263.pmd 26/05/2004, 14:31261

262 Competition and Productivity Growth
level data of countries at different levels of economic development. Further, this would
require assuming a particular shape of the production function. This is beyond the scope
of the current paper, and is left for future studies.
References
Ahn, S.H. (2002). Competition, Innovation, and Productivity Growth: A Review of Theory and
Evidence, Economic Department Working Papers No. 317. OECD.
Amsden, A and Singh, A. (1994). The Optimal Degree of Competition and Dynamic Efficiency in
Japan and Korea, European Economic Review, 28: 941–951.
Carlin, W., Fries, S., Schaffer, M.E. and Seabright, P. (2001). Competition and Enterprise Perform-
ance in Transition Economies: Evidences from a Cross-country Survey. CEPR Discussion
Paper No. 2840.
Disney, R., Haskel, J. and Heden, Y. (2000). Restructuring and Productivity Growth in UK
Manufacturing, CEPR Discussion Paper No. 2463.
Dutz, M.A. and Hayri, A. (1999). Does More Intense Competition Lead to Higher Growth? CEPR
Discussion Paper. No. 2249.
Glen, J., Lee, K. and Singh, A. (2001). Competition, Corporate Governance, and Financing of
Corporate Growth in Emerging Markets: Empirical Investigations in the Light of the Asian
Crisis. Cambridge University.
Hahn, C.-H. (2000). Entry, Exit, and Aggregate Productivity Growth: Micro Evidence on Korean
Manufacturing, Economic Department Working Papers No. 272. OECD.
Hall, R.E. (1988). The Relationship between Price and Marginal Cost in US Industry, Journal of
Political Economy 96: 921–947.
Hulten, C.R. (2000). Total Factor Productivity: A Short Biography, NBER Working Paper Series.
Working Paper 7471.
Klette, T.J. (1999). Market Power, Scale Economies and Productivity: Estimation from a Panel of
Establishment Data. The Journal of Industrial Economics, XLVII (4): 451–476.
Nickell, S.J. (1996). Competition and Corporate Performance, Journal of Political Economy 104:
724–746.
Nickell, S.J., Nicolitsas, D. and Dryden, N. (1997). What makes firms perform well? European
Economic Review, 41: 783–796.
Singh, A. (2002). Competition and Competition Policy in Emerging Markets: International and
Developmental Dimensions. ESRC Center for Business Research. University of Cambridge
Working Paper. No. 246.
Notes
1
Klette (1999) extends Hall’s approach (Hall 1988) of estimating market power which accounts
for economies of scale and quasi-fixity of capital.
2
Korea, Brazil, India, Jordan, Malaysia, Mexico and Zimbabwe. The data set employed uses
the largest 100 corporations quoted on the stock market with 10 or more years of unbroken time-
series data. Profit is measured by return on assets (ratio of after-tax earnings to total assets).
3
Korea, China, Thailand, Indonesia, Malaysia, Hong Kong, Singapore and the Philippines.
4
Hulten (2000: 9) emphasizes that this is not always an appropriate interpretation. The shift
parameter captures costless improvements in the way an economy’s resources of labour and
capital are transformed into real GDP. For example, technical change due to R&D spending will
not be captured by A if R&D is not excluded from Kt
, and Lt
. Further, institutional organization
of production will also shift the function, as will systematic changes in worker effort.
251-263.pmd 26/05/2004, 14:31262

263Mikyung Yun
251-263.pmd 26/05/2004, 14:31263

264
IV.2. COMPETITION POLICY, MANUFACTURING EXPORTS, INVESTMENT ANDPRODUCTIVITY: FIRM-LEVEL EVIDENCE FROM TANZANIA MANUFACTUR-ING ENTERPRISES
Godius Kahyarara
Executive Summary
The major objective of this study is to answer the question: to what extent is firm-
level performance measured by investment, productivity and export influenced by
government measures aiming to stimulate competition and protect consumers against
monopoly? To analyse this influence, the study assesses the effect of control of
dominant firms through institutions, the effect of mergers to prevent industries be-
coming monopolized and the effect of control of anti-competitive behaviour. The analy-
sis focuses on assessing firm-level effects due to existing government efforts to regu-
late business activity in order to ensure that it operates in the public interest. In
particular, the study analyses the role of competition policy in influencing productiv-
ity, investment and export performance of Tanzanian manufacturing enterprises. The
study focuses on the hypothesis that fair competition has a causal impact on the
quality and quantity of manufactured exports, productivity and investment.
In fulfilling the study objective, the following issues are covered: a thorough lit-
erature review that provides, among other things, the theoretical framework on which
the empirical analysis of the study is based. Previous findings and conclusions re-
garding the topic under investigation are also presented. The other issue covered by
the study is an empirical study of the Tanzanian case. This section provides direct
evidence based on microeconomic data of how the existing government policy and
institutions charged with overseeing fair competition have succeeded in ensuring
competitive production that is fair and in line with the public interest. The empirical
approach of this case study focuses on identifying, describing and measuring vari-
ables that link competition policy and firm performance, and assessing the impact of
legal and institutional structures of competition policy and the related policies on
domestic firm performance. Specifically, the study estimates the probability functions
for investment, productivity and exports and the production functions in which com-
petition policy and competition variables are among the independent variables. The
final issue covered in the study is the question: what are the prerequisites for the
successful implementation of competition policy in developing countries and the
mechanisms through which this may operate? The study findings are used to pro-
vide this perspective.
The study argues that, prior to the 1980s, competition policy played little role in
most developing countries. It was contended that free trade did not allow a true
comparative advantage situation to develop due to differences between marginal
social and marginal private costs. Based on this argument, industrialization in most
of the developing countries was undertaken through highly protective industrial and
264-301.pmd 26/05/2004, 14:37264

265Godius Kahyarara
trade policies particularly through the infant industry argument for protection. The
presence of a large state sector partly explained why many developing countries did
not find it necessary to have a competition policy. While there were some gains in
industrialization, the general performance of inward-looking protected industrializa-
tion programmes was not very successful. High effective rates of protection resulted
in monopolistic enterprises which were characterized by high investments but with
low rates of capacity utilization, falling value added and total factor productivity, over-
reliance on government subsidies and generally inefficient industrial bases in most
developing countries.
Nonetheless, the 1990s have seen a reversal of trade and industrial policies in
developing countries. This decade was marked by comprehensive economic reforms,
aimed at moving away from state control towards a market economy. After the intro-
duction of the reforms, it is not difficult to see why the need for competition policy
becomes crucial in developing countries. The basic assumption of the market-based
economy is that the competitive process will ensure the efficient allocation of re-
sources which is essentially a self-correcting mechanism, and that intervention will
be required only occasionally to correct temporary imperfection. However, in prac-
tice, markets exhibit some form of imperfect or monopolistic competition even in the
absence of a state monopoly. Sometimes reform measures such as privatization can
simply involve replacing the public monopoly with a private one.
To account for the limitations of the market economy, many governments in de-
veloping countries have established laws and institutions to regulate economic ac-
tivities. The introduction of competition policy and the creation of antitrust authorities
are some of the steps taken to facilitate such regulation. The specific areas targeted
by the competition policies and antitrust authorities include (i) control of dominant
firms by regulation, (ii) control of mergers to prevent industries becoming monopo-
lized, and (iii) control of anti-competitive acts, such as predatory pricing. The main
goal of competition policy is to facilitate competition that brings economic benefits
through greater efficiency, lower prices, greater choice and higher product quality.
The interaction of competition and long-term firm performance in terms of such as-
pects as exports, investment and productivity movements is less well understood.
The analysis of this study is thus a contribution to this area. Our data set permits us
to investigate various measures of competition and competition policy. We first test
for the possibility that competition policy can be one of the determinants of firm per-
formance, and then assess how the introduction of competition into production has
influenced performance at firm level.
Our empirical results given in this chapter do not indicate that firm performance
has been adversely affected by competition policy. Distinctively, we find a positive
relationship between competition policy with productivity, investment and export. For
the export and investment performances, the results are stable even when we con-
sider unobserved firm-specific attributes. For the productivity effect of competition
policy, the results are influenced by firm-specific attributes suggesting that the posi-
264-301.pmd 26/05/2004, 14:37265

266 Competition Policy Manufacturing Exports, Investment and Productivity
tive relationship between competition policy and firm productivity is highly dependent
on firm-specific characteristics. The other findings of the study are that there is a
negative impact of competition on certain firms. In particular, firms that regard com-
petition as one of the three biggest production problems have more difficulty in en-
hancing exports, maintaining productivity and investing. We point out that such find-
ings form a basis for the need to adopt competition policy as an intervention mecha-
nism, to minimize the adverse effect of competition.
The analysis of aggregate manufacturing sector statistics undertaken in this chap-
ter also do not show any clear evidence that sector performance measured by export
and investment has been affected adversely by the introduction of competition policy
– indeed all these variables at some point have shown an up-and-down trend that
might be due to factors that have less to do with competition policy. We have evi-
dence of high concentrations in Tanzanian manufacturing and the existence of anti-
competitive behaviour, which have been reported to the fair competition department.
It is true that the policy may have affected the specific firms that were reported to the
commission. However, based on the information about investment and export be-
haviour of some of the firms, we find no major effect, and our data do not provide
support for the view that anti-competitive behaviour through a means such as false
advertisement are helpful to their performance. In fact, such companies have re-
tained their position and some have their performance improved even after being
dealt with by the competition laws.
To address the question on what are the prerequisites for the successful imple-
mentation of competition policy in developing countries, we first argue that there are
specific characteristics in developing countries which pose a great challenge for policy
makers when designing an appropriate competition policy that will bring about eco-
nomic development, restrain anti-competitive behaviour, limit abuses of monopoly
power, and promote industrial development. For instance, whereas market entry and
access are the key elements of market economies that many developing countries
are currently striving to achieve, in practice, promoting the conditions for wider mar-
ket access and efficiency through competition has been a difficult challenge. In most
developing countries, the market or indivisible hand does not always operate very
smoothly and indeed instances of market failure are rather frequent. The other limits
to competition policy design in developing countries are the existence of large infor-
mal activities, lack of well-defined property rights, limited environmental, safety and
health standards, underdeveloped consumer protection institutions and laws, limited
capability to verify and check standards, lack of technical expertise and experience
in competition policy and limited institutional capability in areas of competition and
antitrust. The prerequisites for the successful implementation of competition policy in
developing countries are therefore: a sound competitive environment in other eco-
nomic sectors and policies that are directly or indirectly linked to competition policy,
establishment of production standards, defined property rights, consumer protection
agencies organized as an efficient institutional framework with adequate human,
264-301.pmd 26/05/2004, 14:37266

267Godius Kahyarara
technical and financial resources, harmonization of competition policy with those of
countries with similar characteristics and/or economic partners, establishment of pro-
cedures and methods that can allow the monitoring of competition, ensuring that
competition is legally protected and provides settlement for disputes through appro-
priate institutions with adequate knowledge of competition matters, improving the
system of data collection and reporting on competition matters, e.g. changes in in-
dustrial concentration, changes in market power, investment behaviour of the pro-
ducing firms, and other possible measures of competition, encouragement, and fa-
cilitating training in disciplines necessary for the competition policy implementation
such as competition law, and an economics field that has a strong emphasis on
competition aspects and the related fields.
1. Introduction
This study assesses the role of competition policy in influencing productivity, invest-
ment and export performance of Tanzanian manufacturing enterprises. We focus on
the hypothesis that fair competition has a causal impact on the quality and quantity of
manufactured exports, productivity and investment. The study’s main argument is
that the presence of a competitive environment motivates firms to consistently make
different decisions regarding investment, training, technology and the selection of
inputs, and thus raises their productivity. However, in the absence of fair competition,
the quality and quantity of investment and productivity, along with the extent of ex-
port performance, might be impaired. It is only through fair competition that domestic
firms, which target global markets, can be assured of future certainty, which gives
them substantial incentives to invest in improving the efficiency of their operations to
support technology transfer through a variety of means to economies with favour-
able factor endowments – including direct investment. By examining the patterns of
manufacturing productivity, investment and export across Tanzanian manufacturing
firms, we will attempt to show how the extent of openness and the competitiveness
of markets affect the relative performance of manufacturing firms.
The major study objective is thus to investigate the extent to which firm-level
performance measured by investment, productivity and export are influenced by
government measures aiming to stimulate competition and protect consumers against
monopoly. To analyse this influence, the study assesses the effect of control of domi-
nant firms through institutions, the effect of mergers to prevent industries becoming
monopolized and the effect of control of anti-competitive behaviour such as full-line
forcing and predatory commission. In particular, the study assesses the existing gov-
ernment efforts to regulate business activity in order to ensure that it operates in the
public interest. The study asserts that, whereas there are advantages of competition
policy, its adverse effects cannot be ruled out. Firms facing actual or potential com-
petitors will, in theory, concentrate on improving their products and lowering produc-
tion costs. However, the threat poised by competition may be so severe that it leads
to closure of weak incumbent firms. This explains why governments would wish to
regulate business activity in order to ensure that it operates in the public interest.
264-301.pmd 26/05/2004, 14:37267

268 Competition Policy Manufacturing Exports, Investment and Productivity
The motivation of the study is that about a decade ago competition policy played
little role in most developing countries. It was contended that free trade did not allow
a true comparative advantage situation to develop due to differences between mar-
ginal social and marginal private costs; hence, there was a need to temporarily pro-
tect trade during its initial high-cost period until the correct pattern of international
specialization is established. Based on this argument industrialization in most devel-
oping countries was marked by highly protective industrial and trade policies, espe-
cially under the infant industry argument for protection. While there were some gains
in industrialization, the general performance of inward-looking protected industriali-
zation programmes was not very successful. High effective rates of protection re-
sulted in monopolistic industrial enterprises which were characterized by high invest-
ments but with low rates of capacity utilization, falling value added and total factor
productivity and over-reliance on government subsidies, hence leading to an ineffi-
cient industrial base.
It was during that era that Tanzania strived to achieve state-led development. To
facilitate development, the government controlled all markets and directed various
projects. Investment was targeted as the government tried to allocate resources
directly through systems of control such as business licenses. Through the infant
industry argument, Tanzanian manufacturing firms were highly protected against for-
eign producers through a restrictive trade policy, an imposition of local content re-
quirement, a technological transfer requirement and a ceiling on profit repatriation.
Initially, the manufacturing sector generated significant growth, especially in the 1970s,
but from the late 1970s this growth halted. The sector faced high rates of effective
protection, an absence of competition and decreasing capacity utilization factors that
resulted in decreasing efficiency and increasing costs (Ndulu, 1986).
The economic reforms adopted in the mid-1980s have shown some signs of
recovery, such as a positive real growth rate and increased participation of the pri-
vate sector in production. Nevertheless, as in many other developing countries, com-
petition in broad international markets has not resulted in significant responses in
elastic demand-induced improvements in productivity, investment and exports. The
manufacturing exports are still a small proportion of the total country exports. Even in
the domestic market, Tanzanian manufacturers have been facing stiff competition
from imported cheap manufactured products. After the collapse of the state-control-
led economy, Tanzania has shown considerable efforts to attain the competition policy
that is relevant to its own local environment, which will regulate economic activities in
line with public interest and discourage anti-competitive behaviour. This study is thus
particularly relevant currently where Tanzania’s stage of industrialization is associ-
ated with substantial changes in manufacturing organization and technology and
poorly integrated markets.
Despite major changes regarding the competitive environment in which the manu-
facturing sector operates, the interaction of competition and long-term firm perform-
ance in terms of such things as exports, investment and productivity movements is
264-301.pmd 26/05/2004, 14:37268

269Godius Kahyarara
less well understood. For instance, the move from the state monopoly towards a
market-oriented system involves both the elimination of protections and the introduc-
tion of competition. On the other hand, competition subjects firms to continuous threats
from new suppliers, products or processes. The potential role of competition policy
after liberalization is to enhance the effectiveness of competition in reallocating mar-
ket shares between firms, inducing improved performance in existing firms, inducing
entry by more, rather than less, efficient firms and expediting the exit of inefficient
firms. Recent empirical works that establish the significance of within-firm impacts of
competition on performance highlight the fact that there are welfare gains available
from heightened competition. The antitrust authority has to find out whether the com-
petition enhances firm performance.
In this chapter, we therefore use firm-level information to investigate whether the
competitive environment in which the manufacturing firms of Tanzania operate in-
creases productivity growth, investment and exports, along with an investigation into
any anti-competitive behaviour and its effect on firm performance. We provide direct
evidence based on microeconomic data of how the existing government policy and
institutions charged with overseeing fair competition have succeeded in ensuring
competitive production that is fair and in line with the public interest. The study
further identifies gaps and the need for policy changes and/or institutional restructur-
ing to cater for the new production environment within which the Tanzanian manufac-
turing sector operates. The data used are the employer-employee matched firm-
level data obtained from Tanzanian Manufacturing/RPED surveys which contain de-
tailed information on company-level performance and other firm characteristics. The
data used contain information on the extent to which firm managers rank competition
from both local and foreign firms among the three biggest problems facing their com-
panies. With regard to this, managers are asked how often they had any dispute with
their competitors and how such disputes were resolved. Finally, there are questions
aimed at assessing the effectiveness of the existing institutions and regulations in
enhancing fair competition in Tanzanian manufacturing.
The structure of the chapter is as follows. In section 2, we provide the link be-
tween competition policy, competition and firm performance and review the literature
that analyses the impact of competition policy on firm performance. The discussion
in this second section provides guidance as to the relative importance of competition
policy for firm performance. In particular, it provides, among other things, the theo-
retical framework on which the empirical analysis of this chapter is based. Previous
findings and conclusions on the related analysis are also provided in this section.
The third section uses aggregate statistics from the Tanzanian manufacturing sector
to evaluate export performance, investment and competition in Tanzanian manufac-
turing. The discussion considers changes in industrial performance along with indus-
trial and trade polices of Tanzania over the 1960–2003 period. The fourth section
discusses the theoretical framework of the study, data and models estimated. The
fifth section describes the impact of competition policy on firm firm-level performance
264-301.pmd 26/05/2004, 14:37269

270 Competition Policy Manufacturing Exports, Investment and Productivity
while the sixth section discusses the empirical estimates of the productivity effects of
competition and the impact of competition policy on firm-level performance based on
the Tanzanian case. The emphasis in section seven is on an examination of the
effect of competition policy on investment and export performance of a firm. Section
eight examines market power concentration and competition policy in the Tanzanian
manufacturing sector. The summary and conclusions are given in section nine. In
particular, this section outlines the prerequisites for the successful implementation of
competition policy in developing countries and the mechanisms through which it may
operate, based on the study findings and experience from related works.
2. Competition policy, competition, firm performance and some empirical
evidence
This section examines the links between firm performance, competition policies and
competition. First we provide a definition and justification of competition policies and
then we review the empirical and theoretical literature concerning competition policy
and firm performance. Specifically, we undertake a thorough literature review that
provides, inter alia, the theoretical framework on which the empirical analysis of the
study is based. Previous findings and conclusions regarding the topic under investi-
gation are also summarized in this section. In the previous section, we pointed out
that, before the 1980s, competition policy did not exist in many developing countries.
In particular, we showed that there was an infant industry argument that justified
industrialization under highly protective industrial and trade policies in many devel-
oping countries. But since the introduction of the comprehensive economic reforms
of the 1980s, it is not difficult to see why the need for competition policy becomes
crucial in developing countries. Prior to the 1980s, many manufacturing firms in de-
veloping countries were natural monopolies under state ownership. The presence of
a large state sector partly explained why many developing countries did not find it
necessary to have a competition policy. However, the need for competition policy is
called for in the new liberal market-based “outward-looking” economy. The basic
assumption of the market reforms introduced after the economic reforms is that the
competitive process will ensure the efficient allocation of resources, that it is essen-
tially a self-correcting mechanism, and that intervention will be required only occa-
sionally to correct temporary imperfection.
To facilitate competition, many developing countries have privatized the former
state-owned firms. However, privatization and liberalization are necessary, but not
sufficient, conditions for eliminating monopoly and market imperfections. In practice,
markets exhibit some form of imperfect or monopolistic competition even in the ab-
sence of a state monopoly; hence, privatization as a process can simply involve
replacing the public monopoly with a private one. If there are fewer firms then they
can have scope to exercise their market power to manipulate the market in favour of
firm-specific interests. In fact, some authors in this area argue that the creation of
artificial barriers, for example, can allow such firms to earn excess profits without
new entrants being able to compete to bring prices down. There are many other
264-301.pmd 26/05/2004, 14:37270

271Godius Kahyarara
forms through which manufacturing activities can be subjected to the adverse effects
of competition.
To account for the limitations of the market economy, many governments in de-
veloping countries have established laws and institutions to regulate economic ac-
tivities (including manufacturing-related activities) so that they operate in the public
interest. The specific areas targeted by the competition policies and antitrust authori-
ties include (i) control of dominant firms by regulation, (ii) control of mergers to pre-
vent industries becoming monopolized, and (iii) control of anti-competitive acts, such
as predatory pricing. In the manufacturing sector, competition policy aims at prevent-
ing restrictive practices, such as manufacturers insisting on a minimum retail price.
Cartels and agreements prevent, restrict, or distort competition. The idea behind the
introduction of competition policy is to ensure that competition brings economic ben-
efits: it leads to greater efficiency, lower prices, greater choice and higher product
quality.
There are other justifications for the competition policy in the manufacturing sec-
tor. The sunk cost argument for regulation, whereby there might be barriers to entry
into markets stemming from the high sunk costs of establishment is one such justifi-
cation. The competition policy is expected to ensure that the behaviour of the incum-
bent, i.e. the already established firm, does not contribute to artificial sunk costs. In
the same way, the competition policy should protect the incumbent against entry that
can lead to unexpected losses such as an inability to recover the sunk costs, e.g.
technological duplication. It has been emphasized that the need to sink costs is not a
barrier to entry if the entrant can invest in new technology with a performance advan-
tage over obsolescent technology. There are also wider benefits of competition in
that if firms are efficient, their international competitiveness will improve and the
economy will see higher exports, lower imports and more employment.
The literature examining the effect of competition on firm performance is diverse.
There have been numerous studies linking competition policy and competition with
various firm performance indicators such as productivity, exports, investment, growth
and profitability. The literature classifies the analysis of the relationship between com-
petition and productivity into three sources from which the link between competition
and productivity can arise. Firstly, following the observation of Hicks (1935), increased
productivity under competition could arise from better incentives for workers and
managers, and hence a reduction in slack and inefficiencies, in a competitive envi-
ronment. Secondly, competition could improve productivity by providing better incen-
tives for innovation. This is illustrated in endogenous growth frameworks where com-
petition provides stronger incentives to adopt new technologies (Aghion, Harris and
Vickers, 1995; Aghion and Howitt, 1996; Aghion, Dewatripont and Rey, 1999). A third
strand of theories stresses the role of competition in weeding out inefficient firms
through a dynamic process of entry of new firms, exit of unproductive firms and
reallocation of output from less productive to more productive firms. The Melitz model
also predicts increased productivity following trade liberalization.
264-301.pmd 26/05/2004, 14:37271

272 Competition Policy Manufacturing Exports, Investment and Productivity
There have been studies linking competition and productivity. Evidence of the
effect of competition on the level of productivity is provided in studies by Nickell,
Wadhwani and Wall (1992) and by Hay and Liu (1994). In these studies, a positive
correlation between competition and productivity is reported. A contrasting, positive
effect of high concentration (reflected in a positive correlation between market share
and productivity growth) on productivity growth was found by Nickell (1992), whose
later study (Nickell, 1996) suggests a positive effect of competition (measured by
increasing number of competitors or lower rents) on productivity growth. The litera-
ture examining the effect of competition on technical efficiency is summarized in
Nickell (1996). Studies by Caves and Barton (1990), Green and Mayes (1991) and
Caves et al. (1992) suggest that an increase in market concentration tends to reduce
technical efficiency.
In several studies, it has been theoretically modelled and empirically verified that
increased import competition tends to reduce domestic cost-price margins in con-
centrated industries. Scherer and Huh (1992) note that some US firms react aggres-
sively to increased import competition by increasing their R&D expenditure, while
other firms react submissively. Bernard and Wagner (1997) found that, in Germany,
exporters were more productive than their non-exporting counterparts. Bernard and
Jensen (1999) made a similar observation regarding US manufacturers. Helpman
and Krugman (1989) give an exposition of a wide range of models incorporating
different modes of imperfect competition that share the common feature that aboli-
tion of institutional trade barriers reduces the mark-up.
There are studies which have assessed the effect of investment on local firms.
Liu and colleagues (Wei et al., 2000) consider productivity effects of foreign invest-
ment in the UK. For the 1991–1995 period, they found that foreign investment has
been beneficial for the productivity of UK-owned firms in the same industry. Instead
of the anticipated convergence of productivity levels between domestic and foreign
firms, which means that domestic firms would need higher productivity growth rates
than foreign ones to catch up, they found evidence to the contrary, indicating that the
gap between foreign and domestic firms is widening.
Blomström and Sjöholm (1998) found that foreign establishments have a rela-
tively higher level of labour productivity, but that domestic firms benefit from spillover
effects (also in terms of labour productivity). Anderson (2001), using panel data on
Indonesian manufacturing establishments for the 1980–1995 period, also found pro-
ductivity spillovers from foreign to purely domestic enterprises. Kokko (1994) estab-
lished similar positive effects for labour productivity in Mexico. Blomström and Wolff
(1994) also concluded that, during the 1965–1982 period, foreign presence signifi-
cantly influenced the rates of growth of productivity of local Mexican firms. Positive
results are also found by Kokko et al. (1996) for the Uruguayan manufacturing indus-
try.
264-301.pmd 26/05/2004, 14:37272

273Godius Kahyarara
Several other studies have also found negative effects of foreign investment on
the productivity of local firms. The overall effect of foreign participation on the pro-
ductivity of the entire industry was weakly positive. Studies by Haddad and Harrison
(1993) for Morocco and Aitken et al. (1996) for Venezuela and Mexico also showed
no positive spillovers in productivity and wages, respectively. A study by Kawai (1994),
using a set of Asian and Latin-American countries, indicated that an increase in for-
eign investment had a generally negative effect on productivity, though positive re-
sults could be established for some countries.
There is limited empirical evidence concerning the impact of competition policy
on firm performance. A few authors who have analysed this aspect have based their
studies either on advanced countries or transition economies mainly in eastern Eu-
rope. Gonenc, Maher and Nicoletti (2000) surveyed the effect of regulatory reform in
OECD countries. They focused on previously regulated industries – both competitive
and non-competitive. Their studies provide evidence that competition policy results
in improved static and dynamic efficiency, enhanced quality and lower prices to con-
sumers. Dutz and Vagliasindi (2000a,b) measured the effect of competition policy
rules and implementation on competition in a transition context. In the first study
(Dutz and Vagliasindi, 2000a), they measured competition by enterprise mobility: an
economy-wide indicator that captures the frequency with which private enterprises
expanded employment over the 1997–1999 period, weighted by the corresponding
proportion of expanding firms that increase labour productivity. They explained this
enterprise mobility measure by average market concentration, average pressure of
foreign competition, competition policy rules (constructed as explained in the previ-
ous subsection), competition policy implementation (see above) and corporate gov-
ernance in 18 transition countries. They found that both rules and implementation
improve enterprise mobility and that the effect of implementation is more important.
They also found that more adequate corporate governance and stronger foreign
competition increase economy-wide enterprise mobility, while the greater the aver-
age market concentration the smaller the measured enterprise mobility. In the sec-
ond study (Dutz and Vagliasindi 2000b), their dependent variable is the average
frequency with which enterprises faced a more competitive environment (the propor-
tion of firms facing at least one competitor in the domestic market) in 1999. They
constructed this variable for 20 transition countries and explain it with twice-lagged
competition policy implementation and the change of the implementation over the
previous 2 years. They also use the overall state of privatization and variables as-
sessing the hardening of the budget constraint as explanatory variables.
Despite the differences in empirical approach, methods and variables used in
the studies reviewed in this section, it is possible to draw some general conclusions.
First of all, estimating the effect of competition and competition policy on firm per-
formance in most of the studies presented generates positive effects. However, there
are problems in estimating the effect of competition and competition policy on firm
performance particularly endogeneity, specification of production function and input
264-301.pmd 26/05/2004, 14:37273

274 Competition Policy Manufacturing Exports, Investment and Productivity
measurement. There is a potential simultaneity problem when estimating production
function especially when firm performance is correlated with firm-specific character-
istics. Estimates that do not control for these effects may be thus biased. In this
study, we control for this bias by estimating the firm fixed-effects estimates. We have
seen, for instance, that studies that control for such heterogeneity find significant
influence of the fixed effects on estimated coefficients.
The other important issue from the literature presented above is that the inclu-
sion of a broad variety of additional firm characteristics improves the estimation and
reduces the measured competition impact. Estimations excluding such variables may
therefore be biased. It may also be the case that competition measures may pick up
the performance effects of other variables that are frequently closely correlated with
market and overall macroeconomic conditions. For instance, the Tanzanian manu-
facturing sector experienced huge investment growth during initial efforts to estab-
lish large state-owned firms, a factor that is not correlated with the existence of com-
petition. In this study, we present panel data from the Tanzanian Manufacturing En-
terprise surveys. We are thus able to use the panel dimension of the data to control
for the unobserved time-invariant firm characteristics when estimating the impact of
competition on firm performance. We estimate a production function with labour and
capital inputs, and augmented by competition policy and competition variables. To
account for the problems arising due to type, specification of production functions will
estimate both the value added and the gross output production functions.
3. Export performance, investment and competition in Tanzanian
manufacturing
In this section, we discuss the relationship between competition policy export per-
formance and competition policy in Tanzania based on the manufacturing sector
performance. The analysis is based on the aggregate statistics of the manufacturing
sector. The data used are the annual surveys of industrial production, the industrial
census over the 1966–2002 period. The time series trend enables an assessment of
the changes in the exports and investment performance before and after the compe-
tition policy was introduced. Given that the competition policy was introduced in 1994,
our competition variable takes the value of 1 for the post-1994 years and 0 for the
years before that. The investment trends, total factor productivity, exports and in-
vestment are presented in Table 1.
The investment of a manufacturing firm is an important aspect of competition.
This partly stems from the fact that barriers to entry are considered an important
structural characteristic of an industry that can be inferred through investment. Bain’s
pioneering work (1956) specified three sources of entry barriers: absolute cost ad-
vantages of incumbent firms, economies of scale and product-differentiation advan-
tages of incumbent firms, such as reputation and goodwill. Other reasons include the
learning experience possessed by the existing firms, consumer loyalty to brands
already used, and availability of financing (banks are less eager to lend to new inves-
264-301.pmd 26/05/2004, 14:37274
275Godius Kahyarara
tors) (see also Geroski, Gilbert and Jacquemin, 1990). Whereas there can be many
reasons why entry may not occur, the investment performance of an industry is gen-
erally assumed to strongly influence the entry conditions. The primary explanation
for entry barriers is the existence of entry cost. When the investment costs of estab-
lishing a new firm are high, the establishment of new firms will be difficult. To some
extent, firms that are already in business, i.e. incumbent firms, can have an incentive
to deter entry through creating artificially high investment costs. One aspect of the
argument for infant protection was that opening up the domestic market would lead
to a decline in local production due to competition from imported finished products.
The trends in investment after liberalization and the introduction of competition policy
could thus shed light on this issue.
In Figure 1, we present trends in investment in the Tanzanian manufacturing
sector, and assess how the introduction of competition policy has influenced its trend.
The data are from the aggregate statistics of the Tanzanian manufacturing sector
from the 1960s to 2000. The time series trend of the data enables us to divide the
data set into the pre-competition and post-competition period. The competition policy
variables take the value of 1 in the post-competition policy and 0 for the pre-compe-
tition policy era. As we showed earlier, the competition policy in Tanzania did not
exist until 1994. We therefore compare the behaviour in sector investment during the
time when there was no competition policy with the post-competition policy period.
The estimated investment shown in Figure 1 indicates that investment accumu-
lation increased steadily from 1966 up to 1974. Further, we note that there was
substantial growth in investment in the sector from 1974 through 1982. The increases
during that period partly reflect the response to rapid import substitution industriali-
zation that Tanzania introduced during the 1970s. It was in this period that the manu-
facturing sector of Tanzania experienced rapid expansion enhanced by the Import
Substitution Industrialization strategy of 1968 and Basic Industrial Strategies (1974).
To implement these strategies, a rapid expansion of the manufacturing sector’s ca-
pacity was pursued. Ndulu and Semboja (1986) indicated that production capacity
increased by 77 per cent between 1967 and 1975, and doubled between 1975 and
1981. The declining trend especially after 1979 might be due to the economic crisis
marked by a foreign exchange crisis and input constraints. The sector faced high
rates of effective protection, an absence of competition and decreasing capacity
utilization factors that resulted in decreasing efficiency and increasing costs (Ndulu,
1986). Due to the economic crisis, by 1986 output was at only 30 per cent of its 1979
level, with the share of GDP falling from 12 per cent in the 1970s to 8 percent in the
1980s (Mans, 1994). This was the period when major state-owned monopolistic
firms were established. The figure also shows that from the late 1970s to the mid-
1980s, investment in the sector fell markedly. This trend coincides with the economic
crisis of the early 1980s. The recovery in investment is noticeable, especially from
the late 1980s, when Tanzania embarked on major economic restructuring. The trend
264-301.pmd 26/05/2004, 14:37275

276 Competition Policy Manufacturing Exports, Investment and Productivity
in investment from 1994, when competition policy was introduced, indicates that
sector investment is relatively higher than the pre-1970s level.
Figure 1. Trends in manufacturing investment.
Source: Computed from the Economic Surveys, Statistical Abstracts and National
Accounts (various issues).
The estimated total factor productivity (TFP) series of the Tanzanian manufactur-
ing sector is shown in column 1 of Table 1. Based on the results in this first column,
the estimates of TFP from 1966 to 1969 were negative and ranged between –12 and
–52. The TFP improved from 1969 to 1979, and was positive throughout this period.
From 1980 to 1985, total factor productivity fell significantly. Declining trends of total
factor productivity associated with increased capital stock can be due to the effect of
industrial expansion marked by under-utilization of capacity. The reforms introduced
in the 1980s were intended to restore performance in the manufacturing sector through
increased capacity utilization, export promotion, attraction of private sector (both
foreign and domestic), investment increased competitiveness and overall efficiency
(Maliyamkono, 1985). During this period, inefficient companies closed down as the
government role in direct production substantially decreased. However, the post-
1994 period does not reflect a significant improvement in total factor productivity.
Based on such an observation, we have little evidence of the link between total factor
productivity and competition policy. However, one limitation of analysis based on
these aggregate statistics is the extent to which they can represent the entire sector,
as they cover only medium and large enterprises. We will exploit this issue more
using firm-level statistics.
In columns 2 and 3 of Table 1, we show the role of manufactured exports over
time before and after the introduction of the competition policy. The trend is also
displayed in Figure 2. It is apparent that Tanzania’s share in the world market is
Trends in Manufacturing Investment
0
500
1000
1500
2000
2500
3000
Year 1966 1970 1974 1978 1982 1986 1990 1994 1998 2002
Gross
264-301.pmd 26/05/2004, 14:37276

277Godius Kahyarara
negligible and has been declining in real terms. One objective of the trade and finan-
cial sector liberalization, which has been implemented since the 1980s, is to encour-
age manufacturing firms to operate in a more competitive environment so as to en-
hance their efficiency and productivity. There was certainly an expectation that, after
the reforms, local firms would hold their market share and increase exports. On the
basis of the official statistics there is no basis to believe that this expectation has
been met. The other aspect is whether and to what extent the export trend observed
here is linked to competition policy. When we consider the early 1990s as the cut-off
point for competition, we find that there is no systematic pattern in changes in export
and changes in policy. The export figures for example were higher in 1990–1991, fell
dramatically between 1991 and 1995, and then peaked in 1996–1998. Further, the
exports fell significantly between 1999 and 2001.
Figure 2. Trends of manufacturing exports 1996–2002.
Source: Computed from the Economic Surveys, Statistical Abstracts and National
Accounts (various issues).
However, the analysis of firm performance presented in this section is limited by
the extent to which the aggregate statistics can be representative of the entire sec-
tor. The figures reported in all aggregate sources are based on the large and me-
dium-sized firms, hence excluding micro and small firms. Given that firm size can
influence firm-specific characteristics, there is a question as to how representative
they are of the entire sector. The other limitation of the aggregate statistics of Tanza-
nian manufacturing is that, prior to 1988, the sector was protected through tariffs,
subsidization and other forms of protection. This could lead to over-valuation of the
output figures prior to 1988 as reported in official sources. For instance, Bukuku
(1993) argued that some manufacturing enterprises were financially profitable ven-
tures only because of high protection of domestic production, but at world prices their
contribution was not significant. In this study, we present firm-level statistics that
contain information for all firm sizes, i.e. micro, small, medium and large firms from
Trends of Manufacturing Exports 1966-2002
0
20
40
60
80
100
120
140
Year 1966 1970 1974 1978 1982 1986 1990 1994 1998 2002
264-301.pmd 26/05/2004, 14:37277

278 Competition Policy Manufacturing Exports, Investment and Productivity
Table 1. Total factor productivity, investment, export and competition policy in
Tanzanian manufacturing.
Note: TFP is total factor productivity. The total factor productivity is directly estimated from the production
function. Data on investment are from the Economic Surveys, Statistical Abstracts and National Accounts
(various issues). The export figures are in millions of US dollars. The investment data are real values of
gross fixed investment deflated using the 1994 CPI =100 and are in millions of Tanzanian shillings. The
competition variable is a dummy for whether or not the period was affected by competition policy. Specifi-
cally, the dummy is equal to 1 if the year was influenced by competition policy and 0 if otherwise.
Y ear TFP
Exports
(U S$) Log export
R eal
investm ent
1966 -52 13 18 382.50
1967 -47 18 19 354.80
1968 -27 17 19 437.00
1969 -12 18 19 323.00
1970 5 19 19 621.40
1971 9 19 19 509.83
1972 26 25 19 335.14
1973 37 26 19 405.00
1974 50 30 19 719.00
1975 40 35 19 785.50
1976 19 32 19 1555.27
1977 54 45 20 2202.50
1978 51 62 20 1906.06
1979 39 50 20 2401.78
1980 0 60 20 2189.17
1981 -20 65 20 1282.21
1982 -22 60 20 877.70
1983 -19 50 20 484.50
1984 -15 47 20 552.55
1985 -10 33 20 588.56
1986 5 53 22 729.13
1987 35 39 22 1319.09
1988 1 63 23 1496.86
1989 30 73 23 1523.88
1990 6 105 24 1152.06
1991 -19 104 24 1658.42
1992 -64 70 24 1161.65
1993 -81 64 24 1295.75
1994 5 52 24 1120.08
1995 1 77 24 1065.79
1996 -1 109 25 813.10
1997 2 123 25 887.62
1998 3 111 25 800.77
1999 -4 36 24 918.69
2000 -2 30 24 866.33
2001 -6 56 25 1058.23
2002 -17 66 25 1002.15
264-301.pmd 26/05/2004, 14:37278

279Godius Kahyarara
1993 to 2002. This information will be used to compare productivity trends for 1993–
2002 based on both firm-level and aggregate-sector statistics. In this study, we use a
firm-level data set that contains firms of all sizes, i.e. micro, small, medium and large
firms. The data also provide detailed information concerning aspects of firm-level
performance, competition and regulations. We will therefore use this information to
provide a more rigorous firm-level assessment of the relationship between competi-
tion policy and firm performance.
4. Methods and approach for assessing the impact of competition policy
on manufacturing performance
In this section, we provide the methodology and approach for assessing the impact
of competition policy and competition on firm performance. We also discuss the limi-
tations of the approach and possible solution(s) for such problems. In addition, we
discuss ways of tackling estimation problems employed in this study. We also specify
the model to be estimated and the data available for our study. The discussion on
data includes a description of the type of data used, their source and the creation of
variables to be estimated. The empirical approach of this chapter focuses on identi-
fying, describing and measuring variables that link competition policy and firm per-
formance and assessing the impact of the legal and institutional structures of com-
petition policy and the related policies on domestic firm performance. In particular,
the methodology used develops measurement criteria that can be tested over time in
the same sector or replicated in other countries with similar characteristics. Recently,
we have seen an increase in the availability of firm-level micro-data in developing
countries, primarily through the regional Programme of Enterprise Development
(RPED) surveys organized by the World Bank. This chapter uses an existing data
source from Tanzanian manufacturing firm surveys that are part of the RPED sur-
veys. The independent variables in our analysis are variables that proxy for the set of
measures and instruments used by government that determine the conditions of
competition. In view of the possible overlap between competition policy and compe-
tition, the chapter attempts to include some variables that proxy for competition such
as the existence of five competitors in the production sector and the condition of
competition.
The dependent variables in our estimates are the investment, export and pro-
ductivity variables. The fact that panel data are used enables us to provide an empiri-
cal analysis that controls for unobserved characteristics that affect the measurement
of causal effects of competition policy on our firm performance variables. The RPED
surveys data used in this chapter collect information on competition from imports,
competition from local firms, the effect of government industrial policies on firm per-
formance, the effect of government restrictions on various aspects related to indus-
trial activities, and the way taxation policy affects company performance.
264-301.pmd 26/05/2004, 14:37279

280 Competition Policy Manufacturing Exports, Investment and Productivity
4.1. Estimating the productivity effect of competition
To assess the productivity effect of competition policy on the manufacturing sector,
we estimate the production function as follows:
where Qt
is the value of manufacturing output in year t, At
is an index of total factor
productivity or a coefficient that denotes the level of technology, and Kt
and Lt
are the
stocks of physical capital and labour for year t, respectively, and COM is a dummy for
competition policy. In order to estimate our production function [1], we introduce log
variables that give us the following equation:
where Qt
is the log of output, logKt
, logLt
and logCt
are logs of capital stock, labour
and indirect costs, respectively, COM is as defined in equation [1] and e is the error
term. Value added production function output is measured as value added hence
the dependent variable in equation [2] is the log of value added. The value added
production function is specified in equation [3] below.
However, there are problems in estimating the effect of competition on firm per-
formance productivity, particularly endogeneity, and specification of production func-
tion and input measurement. There is a potential simultaneity problem when estimat-
ing production function especially when firm usage of inputs is correlated with firm-
specific characteristics, e.g. a strategy to adjust for unforeseen upsets during transi-
tion. In addition, firm-specific effects are correlated with the competition variables;
hence, estimates that do not control for these effects may be biased. In this study, we
control for this bias by estimating the differenced production function estimates.
The other estimation problem arises from specification of production function
(i.e. whether the value added or gross output production function is specified). The
previous studies that have estimated production function argue that the choice be-
tween using the gross output or value added production function is important be-
cause each specification leads to different results. Basu and Fernald (1997), for
example, indicated that estimates of the increasing returns to scale measured by the
value added production function do not imply increasing returns to scale in the gross
output production function. The problems of estimating gross output production func-
tion are also highlighted in Griliches and Klette (1996), who argued that when sales
are used instead of output in production function analysis, and if the prices are corre-
lated with included variables in the model, an omitted variable bias will arise. The
authors also argued that in the presence of imperfect competition, value added suf-
fers from an omitted variable bias and aggregation bias. Allied with that, the value
Qt= A
tK
β1
tL
t
β2
COMt
β3
[1]
Log Qt=logA
t + β1logKt + β2logL
t + β logCt t
Log Vt=logA
t + β1logKt + β2logL
t + ε [3]
264-301.pmd 26/05/2004, 14:37280
3 + β4COM +ε [2]

281Godius Kahyarara
added production function, is said to impose weak separability on technology unless
the sample used satisfies the condition that the ratio of price of materials to the price
of output is constant (Ferguson, 1965). Data availability and the market conditions
are therefore important determinants of the choice between the two specifications.
To address the weakness of alternative specifications, we estimate production func-
tions that analyse the impact of output on factor productivity and human capital char-
acteristics of learning by comparing the value added with the gross output production
functions.
4.2. Estimating the competition and competition policy effects on firm
performance
To estimate the possible influence of competition and competition policy on firm per-
formance indicators of investment, exports and productivity, we specify a probability
or likelihood model, i.e. a probit function. Such a model is an appropriate tool for
fitting a situation with a binary outcome. In our situation, we assume that the pres-
ence of competition policy and/or competition per se will result in two possible out-
comes: (1) enhance firm performance through increased productivity, export and
investment, or (2) limit firm performance by eliminating its likelihood to export or
invest and reducing its productivity. To investigate the way competition policy and/or
competition might have affected firm performance the model groups firms into those
that increased performance after the competition policy and/competition was intro-
duced and those that experienced reduced performance after the introduction of
competition policy and/or competition. To be able to examine the effect of competi-
tion policy on investment and export, we estimate a probit model. The binary out-
come is characterized as changes in export/investment due to changes in competi-
tion policy. The probit model estimate is defined as follows:
where Y*ijt is the unobserved “latent” variable determining the levels of investment
and/or firm-level exports of firm j during time t. Xijt
is a set of observable determinants
of investments and exports. To facilitate our analysis we include the competition
i
served, we can observe
nary outcomes.
Y*ijt = β0 + β1Xijt + δijt [4]
Y*ijt = 1 if Y*ijt > 0
0 otherwise [5]
264-301.pmd 26/05/2004, 14:37281
variable COM, among the possible determinants of investment and exports. de-β
Y , a dummy variable that we characterized above for bi-
notes parameter estimates and is the disturbance term. Although Y*ijt is not ob-δ

282 Competition Policy Manufacturing Exports, Investment and Productivity
4.3. Measuring changes in market power and concentration
In order to investigate changes in market power or concentration, we specify a con-
centration measure. There are a variety of indices that can be used. Most concentra-
tion measures are based on the shares of an individual firm. If we denote the number
of firms in the sector as n and qit
represents the share of sales of an ith
firm at time t,
then the sum of qit
from 1 to n will be qt
and the share of each firm in the market for a
specified time period, say year t, would be expressed as:
The Concentration Ratio (CR) can be calculated as the total share of firms which
have the largest shares in the market. It is denoted by CR(k) and is calculated as:
In most applications CR(4), CR(8) or CR(16) are used; the selection of k is arbitrary.
The other measure is the Hirschman-Herfindahl Index (HH). This measure can be
described as the sum of pit
s weighted by themselves:
The HH index lies between 1/n, where all pit
values are equal, and 1, where there is
only one pit
, implying that qit
= qt
.
Theoretical support for the HH index is provided by Cowling and Waterson (1976)
but many studies use the concentration ratios as they are often supplied by the
official statistics. Various authors have argued that for an economy with high concen-
tration, the use of the HH index is more revealing, as the changes taking place at the
top end of the size distribution can be obscured by the measures such as CR(4).
5. The effect of competition policy on firm performance
This section analyses the effect of competition policy on firm performance. In par-
ticular, we assess the role of competition policy in influencing a firm’s propensity to
export or invest and its productivity. In the introduction section of this chapter, we
i = 1,...,n and t = 1,...,T
[6]
[7]
[8]
264-301.pmd 26/05/2004, 14:37282

283Godius Kahyarara
argued that, in order to promote desirable economic performance, competition policy
may strategically subject firms to rules that safeguard anti-competitive behaviour,
such as collusive tendering and bidding, and price-fixing arrangements. To achieve
the intended objectives, competition polices can aim at limiting the economic power
of some firms and abuses of the economic and political system. However, there is
limited evidence that competition policy will at all times lead to all these advantages.
In a study by Brien, Howe and Wright (1979), it was highlighted that clearly there is a
belief that competition policy has harmful effects upon the development of firms. The
authors further indicate how, in their earlier study, it came to light that competition
policy had been responsible for the lack of prosperity of firms; what they called ‘the
anti-competitive tide’, the rise of restrictive practices to protect profit margins in the
face of the emergence of mass trade-unionism, which meant that downward wage
stickiness will greatly increase in times of recession.
Therefore, the major question that surfaces from implementing competition policy
is whether and to what extent is firm-level performance influenced by competition
policy? It is anticipated that a well-designed and effective competition policy en-
hances the international competitiveness of efficient firms and improves the economy
in ways such as higher exports, the attraction of new investments, lower imports and
more employment. Whether or not this is the case is the subject of empirical investi-
gation in this area. To address this question, we estimate the firm-level production
function, the export propensity function and the investment propensity function, in
which the proxy for competition policy is one of the variables that determine firm
productivity, export and investment. We look at the investment, export and productiv-
ity of firms in an attempt to see whether the competition policy has any effect on firm-
level performance. In addition to these functions, we compare trends in selected
firm-level performance indicators of profit rates, exports, investment and value added
of firms that have indeed been affected by the competition policy, before and after
the competition measures were introduced.
We begin by presenting the descriptive statistics of the key variables used in our
estimations, namely gross output, raw materials, exports, capital stock and the hu-
man capital variables of schooling, tenure and work experience. The data show that
in 1993 the gross real output was US$ 1,034,332, and increased gradually over the
1990–2000 period. By the year 2000, the gross output had reached US$ 1,887,968.
The observed changes are a reflection of substantial reforms in the sector, espe-
cially privatization of many stagnant state firms and encouragement of investment in
the sector during the period. The substantial rise in gross output is supported by a
rise in value added. The figure shows that value added was US$ 392,069 in 1993,
but reached US$ 1,498,333 in 2000. It is evident that both net output and gross
output have shown an increasing trend during the period.
The other variable presented is export. The trend in this variable shows that
export performance has not significantly changed over the entire 1990–2000 period.
The average total exports have stagnated at about US$ 4.5 million.
264-301.pmd 26/05/2004, 14:37283

284 Competition Policy Manufacturing Exports, Investment and Productivity
The data show that, prior to the mid-1990s, the average tenure was 7 years, and
during the late 1990s and 2000 it increased slightly to about 8 years. In theory, this
short tenure cannot be expected to result in significant firm-specific skill acquisition.
Therefore, firms might experience less positive gains in productivity due to firm-spe-
cific skills. The data also show that between 1993 and 2000, the average years of
education of a member of a firm’s workforce in our surveyed firm-level data was
about 8 years. The results suggest that the majority of the workers have less than
secondary school education and very few have post-secondary education, which
requires about 16 years of education in total.
Table 3. Regression estimates of the effect of competition policy on manufac-
turing productivity.
The results reported in the first column of Table 3 are for estimating the effect of
competition policy on firm-level productivity. The measure of firm-level productivity or
“the dependent variable” is the log of value added. The competition policy variable is
measured as a dummy that takes the value of 0 for the period before the competition
__________________________________________________________________________Variables OLS1 OLS2 OLS3 FEM1 FEM2 FEM3
Dependent Value added Investment Export Value added Investment Export
Com-policy 0.412 0.821 0.133 -0.246 1.410 0.422
(2.33)** (2.47)** (0.53) (0.62)** (2.57)** (1.74)*
Com1 -0.586 -0.291 -2.045
(1.00) (0.81) (1.44)*
Log capital 0.349 0.881 0.217 -0.026 1.35 0.005
(9.63)*** (6.87)*** (3.53) (0.10) (6.43)*** (0.03)
Log labour 0.702 0.200 0.142 0.622 -0.567 0.22
(10.27)*** (0.66) (1.46)* (3.18)*** (1.48) (1.62)*
Log value added 0.774 -0.066 0.373
(9.34)*** (0.39) (6.58)***
Job training -0.789 -0.536
(1.61) (0.43)
Other training 0.363 -0.011
(1.30) (0.01)
Experience 0.033 -0.013
(2.03)** (0.89)
Tenure -0.021 0.074
(1.37) (2.28)
Schooling 0.552 0.100
(1.65) (1.73)*
Constant 3.501 7.30 1.763 7.92 3.63 5.37
(8.29)** (7.54)*** (16.78)** (2.58)** (2.48)** (2.63)**
Observations 421 421 421 421 421421
R-squared 0.73 0.73 0.92 0.30 0.78 0.900
F 74 22 102 4 149
Prob > F 0.000 0.000 0.000 0.000 0.000 0.000
Notes: Absolute value of t-statistics in parentheses; *significant at 1 per cent level;
**significant at 5 per cent level; ***significant at 10 per cent level.
264-301.pmd 26/05/2004, 14:37284

285Godius Kahyarara
policy was introduced and 1 after the competition policy was introduced. The pro-
ductivity effect of the competition policy variable is estimated directly from the pro-
duction function. Other determinants of productivity considered in this first column
are log of capital stock, log of labour and human capital. The real value added is the
deflated value of the difference of total manufactured output minus indirect costs and
minus raw materials used in producing the output. The capital stock is a real capital
stock series based upon an initial observation of the firm’s replacement value of
plant and machinery, which is augmented with subsequent investments in plant and
machinery made by the firm. The weighted average of schooling, tenure, age and
training are derived from firm-level information for each individual concerning the
highest level of education completed, the occupational specialization, work tenure
and age. Each value is weighted by the proportion of workers in a given occupa-
tional category in each firm to obtain a weighted average for each firm.
As shown in Table 3, competition policy is an important determinant of establish-
ment productivity. In particular, it is shown that competition policy has a positive and
significant effect on firm-level productivity. The estimated coefficient reported in the
first column implies that firm-level productivity in the post-competition policy era is
about 50 per cent higher than the productivity effect in the pre-competition policy
period. The other results in the first column suggest that capital stock, stock of labour
and human capital also influence firm-level productivity.
The results presented in the second column are for testing whether competition
policy has any effect on investment in our data. The results are obtained from esti-
mating an investment equation in which competition policy is one of the variables
that determine the level of firm-level investment. The other determinants of invest-
ment are the stock of capital, firm size (measured by log of labour), firm performance
(measured by log of value added) and the general competition environment meas-
ured by the situation where competition is one of the three major problems that face
a particular firm. The results in the second column are that the implied competition
policy coefficient would suggest that investment is higher in the post-competition
period than in the pre-competition policy period. The results indicate that firm-level
investment in the post-competition policy period is over one-fold higher than firm-
level investment prior to the establishment of the competition policy. The other im-
portant determinant of firm-level investment according to the results is the stock of
capital. It is indicated that a 1 per cent rise in the stock of capital results in a 0.8 per
cent increase in investment. Further results indicate that competition per se is nega-
tively related to investment. In particular, it is indicated that firms that regard compe-
tition as one of the three biggest problems for production have less investment than
those that do not regard competition as one of the three production problems.
The third column presents estimates of the export function. As for the other firm
performance measures (value added and investment), we include the proxy for com-
petition policy measure among the determinants of exports. The other determinants
of exports included in this column are competitive environment, log of capital, log of
264-301.pmd 26/05/2004, 14:37285

286 Competition Policy Manufacturing Exports, Investment and Productivity
labour, and log of value added. The results indicate that there is no significant corre-
lation between competition policy and export. The variables that appear to have
strong effect on export are firm size, measured by the log of labour, and the log of
value added.
While the results in columns 1–3 highlight the importance of competition policy
for firm-level performance, particularly productivity and investment, there are several
limitations to these findings. First and foremost is the problem of endogeneity. The
presence of unobserved establishment characteristics that are time invariant is likely
to bias our estimated coefficients. We mitigate this effect by estimating fixed-effect
models of all the three models and report their results in columns 4–6. The results in
columns 4–6 indicate that when we control for unobserved firm-specific characteris-
tics, competition policy appears to have significant effects on all firm performance
indicators presented in this section (i.e. value added, investment and export per-
formance of a firm). The results suggest that the causal relationship between com-
petition policy and firm performance indicators discussed in this section is not nega-
tively affected by firm-specific characteristics. In fact, there appears to be a positive
correlation between firm fixed effects and performance effects of competition policy.
In all cases, the estimated coefficient size of competition is substantially increased
after the control of firm fixed effects.
Table 4. Summary statistics of firm performance before and after the introduc-
tion of competition policy.
Source: Tanzanian Manufacturing Surveys – part of Regional Enterprise Develop-
ment Surveys (1994–2001).
Table 4 shows the average total exports, value added, investment and the rate of
profit before and after the introduction of competition policy. This sort of presentation
allows us to compare the changes in magnitude of the performance variables after
the competition policy is introduced. The results indicate that the mean exports after
264-301.pmd 26/05/2004, 14:37286

287Godius Kahyarara
the introduction of competition policy are half those before the policy was introduced.
The other observation is that in both cases, there is high variability in export from the
mean (as the standard deviations in both cases are more than twice the mean). But
given such an observation, it may be necessary to isolate the effect of competition
policy from other possible influences of export performance. As we mentioned in the
Introduction, the Tanzanian manufacturing sector has been subjected to a series of
reforms particularly privatization. The performance of the sector has not been very
satisfactory and in some cases the performance is below the pre-reform levels. A
detailed account of the factors behind such performance is beyond the scope of this
study, but it is apparent that there are other factors influencing the observed trends in
exports.
The other mean displayed in the table is that for value added. The results for this
variable indicate that the value added after the introduction of competition policy is
higher than the average value added before the competition policy was introduced.
Just like the export figures, they appear to have higher variation from the mean
(higher standard deviations). The investment figures are much higher in the post-
competition policy period than in the pre-competition policy period. Similarly, the profit
rates are higher in the post-competition policy period than in the pre-competition
policy era. But, as we mentioned above, our results are subject to data problems and
other limitations. Despite these limitations, it is evident from the data that there is no
evidence that competition policy has adversely affected any of the performance vari-
ables described here. In general, competition policy does not appear to have clear
adverse effects on firm performance.
6. The empirical estimates of the productivity effects of competition
In this section, we estimate the link between competition and firm performance. In
particular, we estimate the gross output and value added production functions in
which competition variables are included among the determinants of firm-level pro-
ductivity. Two measures of competition are available from the survey data. The first
is a measure of the existence of competition within the line of production of a firm.
This sort of competition is measured by the existence of at least five major competi-
tors. The second measure of competition is based on whether competition is one of
the three biggest problems affecting the firm. In this way we are able to differentiate
between the effect of the existence of competition and the effect of competition itself.
264-301.pmd 26/05/2004, 14:37287

288 Competition Policy Manufacturing Exports, Investment and Productivity
Table 6. Regression estimates of the effect of competition on manufacturing
productivity.
Notes: Absolute value of t-statistics in parentheses; *significant at 5 per cent level;
**significant at 1 per cent level. Tzwn, Tanzanian private ownership; statec, state
ownership; vadus, value added in US dollars; inplan, investment plan; fmage, firm
age; ll, log of labour; lmus, log of raw materials; lous, log of other inputs. Round1 is
the year 1993, round2 1994, round3 1995, round5 1997, round6 1998 and round7
1999. The omitted variable is for round8 which is the year 2000.
The results reported in column 1 indicate that for a firm that ranks competition
among the three biggest problems, there is a substantial negative effect of productiv-
ity due to competition. In particular, the results show that a competition problem
264-301.pmd 26/05/2004, 14:37288

289Godius Kahyarara
reduces productivity by 35 per cent. The other results in this column indicate that the
estimated coefficient on capital stock is 0.28 and highly significant at the 1 per cent
level. It has a positive sign implying that a 1 per cent increase in capital stock will
lead to an increase in value added by 0.32 per cent while the labour coefficient is
0.76 and both are significant at the 1 per cent level with a positive sign, implying that
a 1 per cent increase in the labour force increases value added by 0.76 percent and
a 1 percent rise in capital stock increases productivity by 0.32 percent. The esti-
mated total effect of change in inputs is roughly 1 (summing to 1.08) per cent hence
displaying a constant returns to scale.
In column 2, we report the results that models the value added as a function of
the existence of competition measured by the existence of at least five competitors.
Other production inputs appear in column 2. The results show that the existence of
competitors is positively correlated with productivity. Specifically, we find that the
existence of at least five competitors is associated with a 24 per cent increase in
productivity. These results suggest that there is a positive correlation between pro-
ductivity and the competition environment, which is consistent with the economic
liberalization objectives. Other results are that the estimated coefficient on capital
stock is 0.34 and highly significant at the 1 per cent level. It has a positive sign
implying that a 1 per cent increase in capital stock will lead to an increase in value
added by 0.34 per cent. The labour coefficient is 0.75 and is significant at the 1 per
cent level with a positive sign, implying that a 1 per cent increase in labour force
increases value added by 0.75 per cent.
But, as previously noted, different specifications of production function lead to
estimates that are radically different. We therefore estimate the gross output produc-
tion function as a supplement to our value added production function estimations.
The results in the third column confirm a negative correlation with competition being
one of the major production problems facing a firm and productivity. Although the
results are weakly statistically significant, they still show that there is a fall in produc-
tivity of about 7 per cent for firms that consider competition as a major problem in
production. Further, we note that other production inputs such as raw materials,
labour and human capital characteristics, such as education, are positively corre-
lated with gross output. In the fourth column, we estimate the gross output produc-
tion function where the measure of existence of competition is included among the
determinants of productivity. The results still confirm a positive correlation between
productivity and the existence of competition. However, the estimated coefficient is
lower than reported in the second column.
The results presented in Table 6 suggest that the existence of competition and
the competition problem comprise one of the major production problems that affect a
firm’s productivity differently. It is evident that the existence of competition has a
positive effect on firm productivity, and when competition is ranked among the three
major production problems, a negative effect on firm’s productivity is observed. None-
theless, there are limitations to the OLS approach used in the table, especially re-
264-301.pmd 26/05/2004, 14:37289

290 Competition Policy Manufacturing Exports, Investment and Productivity
garding the failure to address the problem of unobserved characteristics mentioned
earlier. To account for this problem, we estimate the differenced production functions
that exploit the time variation to difference out the unobserved time-invariant aspects
that are the source of this estimation problem. The results are reported in Table 7.
Table 7. Regression estimates of the effect of competition on manufacturing
productivity.
Absolute value of t-statistics in parentheses; *significant at 5 per cent level; **signifi-
cant at 1 per cent level. Variables are as defined in Table 5, except that dd refers to a
264-301.pmd 26/05/2004, 14:37290

291Godius Kahyarara
differenced variable. Eduwgted is the weighted variable of schooling, tenwgt is the
weighted average of tenure, and pextwgt is the weighed average of work experi-
ence. Jotwgts is the weighed average of job training attended in the past and onjotwgs
is the weighted average of job training attended recently.
The results in the first column suggest that even when we control for firm fixed
effects, the impact of the existence of competition on productivity is positive. It is
observed that controlling for firm fixed effects, the existence of at least five competi-
tors raises the productivity of a firm by 13 per cent. The results on the other hand are
less than those obtained using OLS, suggesting that the OLS results were biased
upwards. In the second column, we consider the effect of competition problem on
firm productivity once we control for firm fixed effects. The results reveal that there is
still a negative correlation between competition problem and firm productivity, al-
though the results are not statically significant. In columns 3 and 4, we estimate the
differenced gross output production function. In the third column, a positive correla-
tion between existence of competition and productivity is confirmed. In column 4, a
negative correlation between competition problem and firm-level productivity is ob-
served, but the results are not statistically significant.
7. Determinants of competition investment plans and exports
In this section, we examine the effect of competition policy on investment and export
behaviour of a firm by assessing the extent to which one variable is a determinant of
the other. Specifically we estimate the extent that either of the determinants of in-
vestment plan and export behaviour could be affected by competition and vice versa.
In column 1, we present a probability equation for the existence of competition. The
independent variable estimated in this probit equation is for whether a firm has at
least five competitors. The determinants of competition existence considered in this
equation are firm ownership, productivity (measured as value added), investment
plan, export behaviour, firm size and sector. The results show that an increase in
value added reduces the existence of competition for a firm. It is also observed that
the probability of the firm-level plans to invest increases with the existence of compe-
tition. This is consistent with the predictions that competition may induce investment
as a tool to maintain production in the face of increased competition. The other re-
sults in column 1 indicate that the likelihood of the existence of competition is influ-
enced by sector, firm age and export behaviour. The exporters are less likely to have
more competitors than non-exporters. Also, the existence of competition is nega-
tively correlated with firm age implying that old firms are less likely to have more
competitors than new ones.
In column 2, we report estimates of a probit equation for estimating the determi-
nants of the competition problem in the surveyed firms. Similar determinants consid-
ered in the first column are presented. The value added is negatively related to the
competition problem implying that the higher the value added, the less the likelihood
of facing competition among the biggest production problems. The results also show
264-301.pmd 26/05/2004, 14:37291

292 Competition Policy Manufacturing Exports, Investment and Productivity
Table 5. Determinants of competition investment plans and exports.
Absolute value of z-statistics in parentheses; *significant at 5 per cent level; **signifi-
cant at 1 per cent level.
Com petition
problem
Com petition
existence
Export
sales
Investm ent
plans
plans
tzwn 0.058 0.678 -0.041 0.078
(0.25) (3.96)*** (0.18) (0.34)
S tatec 0.900 0.251 0.637
(2.26)** (0.50) (1.17)
vadus -0.001 -0.001 0.0001 0.000
(1.25.) (2.16)** (1.61)* (0.92)
inplan -0.001 -0.001
(1.64)* (4.51)*
m icro -0.527 0.154 -1.217 -1.271
(1.92) (0.79) (3.79)*** (3.72)**
sm all -0.266 0.093 -0.756 -0.656
(1.44) (0.62) (4.76)*** (4.04)**
m edium -0.50 -0.619 -0.416 -0.334
(2.07) (3.13)** (2.29)** (1.83)
fm age 0.001 -0.010 -0.014 0.012
(1.24) (1.96)* (2.08) (2.33)*
exports -0.983 -0.325
(2.72)** (1.72)*
com p -0.621 -0.386 -0.377
(4.04)*** (2.66)** (2.35)**
com 1 -1.088 -1.12
(2.90)** (3.87)**
com f1 -0.144 1.551
(0.85) (9.22)
lkus -0.201
(2.89)**
ll 0.013
(0.12)
lm us -0.037
(0.37)
lous 0.181
(1.32)
Chi2 53.1 131 70.86 156
Pseudo R2
0.2199 0.17 0.135 0.314
Prob > chi2
0.0000 0.000 0.000 0.000
Log
likelihood
-177 -318 -227 -169
O bservations 648 648 648 648
264-301.pmd 26/05/2004, 14:37292

293Godius Kahyarara
a negative relationship between the possibility of mentioning competition among the
three biggest production problems and the investment plans. This suggests that firms
that rank competition among the top production problems are less likely to invest in
the future. Further, we observe that competition problems are more common to smaller
firms than large firms, non-exporters than exporters, and are sector specific. In par-
ticular, we find that the likelihood of ranking competition among the three biggest
production problems is higher in the textile sector than in the wood sector. In col-
umns 3 and 4, we present the probability models for estimating the determinants of
investment plans and exports. In both estimates, competition variables are included
among the determinants of investment plans and exports. The results in column 3
indicate that the likelihood of investing in the future is positively related to the exist-
ence of competition, but negatively correlated to the competition problem. In the
fourth column, we do not find significant correlation between the likelihood of export
and competition.
8. Market power concentration and competition policy in the Tanzanian
manufacturing sector
This section reviews the implementation of Tanzanian Competition Law. The enact-
ment of the law and the establishment of the Competition Authority have largely been
due to Tanzania’s obligation under regional and international agreements along with
the comprehensive economic reforms adopted in the mid-1980s. After a prolonged
period of economic problems especially in the first half of the 1980s, Tanzania em-
barked on a course of market-oriented reforms at the end of the second half of the
1980s. Reform of the trade regime stood at the core of the reform programme. This
involved commitment to a more flexible exchange rate policy and abandoning of
import substitution policies through promotion of exports as well as liberalization of
imports. Another main objective of the 1980s reform was privatization of state-owned
enterprises and liberalization of financial markets. The reforms brought about pro-
found changes in the incentive structure economic actors faced and in the way they
did business. This was the case especially for the Tanzanian manufacturing industry,
which had to go through a fundamental reorientation after decades of protection
under import substitution policies. Cushioned by import restrictions and high tariff
barriers, many sectors of the manufacturing industry had been highly concentrated,
and state-owned enterprises had dominated many important sectors. Export promo-
tion policies created a new set of incentives for the manufacturing industry.
We first assess the trends in market power or concentration after the reforms
and provide some cases illustrating to what extent competition policy has been a key
influence on the observed trends. The market power considered here is the degree
to which a firm exercises influence over price and output. When firms have market
power, they can use this power to raise the price above the going rate. The degree of
dominance in market share is one form of market power acquisition. When the sales
of a firm as a proportion of the product traded in the market form a significant portion
of sales, a firm will then have market power. The reform measures aimed at chang-
264-301.pmd 26/05/2004, 14:37293

294 Competition Policy Manufacturing Exports, Investment and Productivity
ing the market structure, in particular the nature of competition and pricing. Specifi-
cally, we discuss the trends in concentration estimated from the survey data.
Table 8. Measures of concentration of the manufacturing firms from Tanzanian
manufacturing surveys (1993–2001).
Source: Computed using firm survey data from the Tanzanian manufacturing sur-
veys (1993–2001).
Table 8 gives average concentrations for all manufacturing industries that are
included in the Tanzanian manufacturing surveys over the period 1993–2001. The
concentration ratio that concerns us here is the ratio that shows the degree to which
an industry is dominated by a small number of large firms or is made up of many
small firms. This ratio is calculated based on the concentration ratios specified in
section 3. The concentration ratios CR3, CR4 and CR5, as well as the HH index are
reported. The firm share is measured in terms of their contribution to sales during the
year of survey. In view of the fact that the competition law in Tanzania was introduced
in 1994, the year 1993 represents the pre-competition policy era. Based on the con-
centration results reported in Table 8, the concentration ratios of CR3, CR4 and CR5
reveal that a reduction in concentration occurred after 1993. This is the period when
the manufacturing sector went through restructuring and privatization phases and in
which privately owned firms entered the market. However, the decrease in concen-
tration appears to be moderate over the period. The decline in concentration ratio
indices is notable in firms that are not among the top three dominants. In fact, the
concentration of the largest firm remains higher and well above its 1993 level. The
Year 1993 1994 1996 1998 1999 2000 2001
Firm1 0.29 0.34 0.41 0.50 0.49 0.45 0.41
Firm2 0.28 0.23 0.06 0.07 0.07 0.06 0.06
Firm3 0.06 0.06 0.05 0.06 0.06 0.06 0.05
Firm4 0.05 0.06 0.01 0.02 0.01 0.02 0.02
Firm5 0.03 0.05 0.01 0.01 0.01 0.01 0.01
Others 0.29 0.26 0.46 0.34 0.36 0.40
Concentration
Ratio:
CR3 0.63 0.63 0.52 0.63 0.62 0.57 0.52
CR4 0.68 0.69 0.53 0.65 0.63 0.59 0.54
CR5 0.71 0.74 0.54 0.66 0.64 0.60 0.55
Herfindahl 0.24 0.38 0.47 0.37 0.37 0.38
1/H 3.84 4.16 2.63 2.13 2.70 2.70 2.63
264-301.pmd 26/05/2004, 14:37294

295Godius Kahyarara
concentration behaviour of the largest firm partly influences the trends in concentra-
tion ratios presented in the table. For instance, a substantial fall in concentration of
firm2 in 1996 was obscured by an accompanied significant rise in concentration of
the largest firm, firm1.
One would have expected that the more liberal import policies and the export
orientation of the 1980s would also transform the structure of the Tanzanian manu-
facturing industry and lead to less market concentration. One objective of the eco-
nomic liberalization was to reduce monopolization. However, the evidence available
on the evolution of market concentration in Tanzanian manufacturing industries since
1993 presented in Table 8 point to the persistence of monopolization and high con-
centration in some specific activities of the Tanzanian manufacturing industry during
the post-reform era. The experience from previous studies in this area shows that
cement production, cigarettes, beer and textiles are good examples of where a few
large firms dominate the market share in Tanzania.
Given the persistence of high concentration ratios in the manufacturing industry,
the importance of instituting and implementing antitrust mechanisms in Tanzania
becomes more apparent. The absence of well-articulated competition policy and law
would create a breeding ground for all sorts of anti-competitive practices. In 1994,
Tanzania adopted the Fair Trade Practices Act (1994) which exhaustively prescribes
rules for the protection of the interests of consumers. The law prohibits misleading or
deceptive conduct. It requires that in determining whether a person has contravened
the law, the Commissioner may have regard to the strength of the bargaining posi-
tions of the parties, the validity of conditions, the consumer’s understanding of the
documents and the circumstances (e.g. use of force or unfair tactics). In addition to
other unfair practices, the Fair Trade Practices Act prohibits misrepresentations, mis-
leading advertising and conduct, bait supply, harassment and coercion.
The requirement to comply with prescribed consumer product safety standards
and the requirements of the Act relating to consumer protection are obligatory on
penalty of prescribed fines and/or imprisonment. Fines imposed are stated in the
Act. Some recent cases are summarized in Table 9 below. There is clear evidence of
the anti-competitive practice of the monopolistic companies as well as of less con-
centrated ones. However, as it is noted, most of the cases are based on narrowly
defined competition parameters. Institutional, legal and human resource constraints
are among the factors behind the limited enforcement of competition law in Tanzania
(ESRF, 2002).
9. Summary conclusion and policy recommendations
In this chapter, we set out to answer the question: to what extent firm-level perform-
ance measured by investment, productivity and export are influenced by govern-
ment measures aiming to stimulate competition and protect consumers against mo-
nopolization? Our empirical results in this chapter do not indicate that firm perform-
ance has been adversely affected by competition policy. On the contrary, we find a
264-301.pmd 26/05/2004, 14:37295
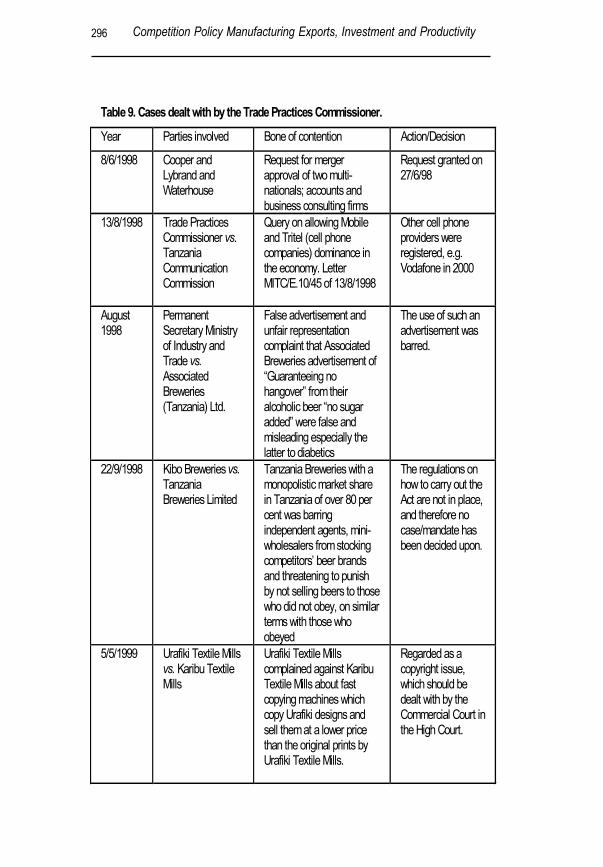
296 Competition Policy Manufacturing Exports, Investment and Productivity
Table 9. Cases dealt with by the Trade Practices Commissioner.
Year Parties involved Bone of contention Action/Decision
8/6/1998 Cooper and
Lybrand and
Waterhouse
Request for merger
approval of two multi-
nationals; accounts and
business consulting firms
Request granted on
27/6/98
13/8/1998 Trade Practices
Commissioner vs.
Tanzania
Communication
Commission
Query on allowing Mobile
and Tritel (cell phone
companies) dominance in
the economy. Letter
MITC/E.10/45 of 13/8/1998
Other cell phone
providers were
registered, e.g.
Vodafone in 2000
August
1998
Permanent
Secretary Ministry
of Industry and
Trade vs.
Associated
Breweries
(Tanzania) Ltd.
False advertisement and
unfair representation
complaint that Associated
Breweries advertisement of
“Guaranteeing no
hangover” from their
alcoholic beer “no sugar
added” were false and
misleading especially the
latter to diabetics
The use of such an
advertisement was
barred.
22/9/1998 Kibo Breweries vs.
Tanzania
Breweries Limited
Tanzania Breweries with a
monopolistic market share
in Tanzania of over 80 per
cent was barring
independent agents, mini-
wholesalers from stocking
competitors’ beer brands
and threatening to punish
by not selling beers to those
who did not obey, on similar
terms with those who
obeyed
The regulations on
how to carry out the
Act are not in place,
and therefore no
case/mandate has
been decided upon.
5/5/1999 Urafiki Textile Mills
vs. Karibu Textile
Mills
Urafiki Textile Mills
complained against Karibu
Textile Mills about fast
copying machines which
copy Urafiki designs and
sell them at a lower price
than the original prints by
Urafiki Textile Mills.
Regarded as a
copyright issue,
which should be
dealt with by the
Commercial Court in
the High Court.
264-301.pmd 26/05/2004, 14:37296

297Godius Kahyarara
positive relationship between competition policy and productivity, investment and
export performances. For the export and investment performances, the results are
stable even when we consider unobserved firm-specific attributes. Regarding the
productivity effect of competition policy, the results are influenced by firm-specific
attributes suggesting that the positive relationship between competition policy and
firm productivity is highly dependent on firm-specific characteristics. But we certainly
have evidence that if competition is one of the three major problems facing an enter-
prise, the enterprise-level performance measured by the productivity will be seri-
ously impaired. This, therefore, calls for some sort of intervention through such meas-
ures as competition policy, to minimize the adverse effect of competition. The analy-
sis of aggregate manufacturing sector statistics undertaken in this chapter does not
show any clear evidence that sector performance measured by export and invest-
5/6/1999 United
Lumber and
Forest
Products
Co. Ltd. vs.
Sao Hill
Timber Ltd.
The Government of Tanzania had
leased a previously run Parastatal
to a Norwegian firm at terms below
the normal commercial rates, and
also it appeared that the
Norwegian Company was
subsidizing the operations of this
firm. Both dispensations were
enabling Sao Hill Timber Ltd. to
outbid all others on tenders and
price offers.
The government is
conducting an
outright sale through
open tender instead
of leasing. The
tender is out but it
took a long time.
1/6/1999 Ministry of
Industry and
Trade vs.
Bonite
Bottlers Ltd.
Bonite Bottler bottles drinking
water under the Kilimanjaro brand.
In their advertisement, they
claimed the water to be bottled
from a “Natural Spring” when
actually the water was from a deep
well, purified and then bottled.
The advertisement
was changed to
“Pure Drinking
Water” with neither
an argument nor a
notification of
compliance.
Recent
Case1
Coca-Cola
vs. Pepsi-
Cola
Coca-Cola provides refrigerators
and chairs to suppliers and
restricts them from selling other
products such as Pepsi-Cola.
Recent
Case2
Traders of
Imported
Wine vs.
TBL
TBL restrict sellers of its products
from selling imported beer.
Source: ESRF, 2003, Wanga (2001) and interview with Trade Practices Commission, Ministry
of Trade and Industry 2001.
264-301.pmd 26/05/2004, 14:37297

298 Competition Policy Manufacturing Exports, Investment and Productivity
ment has been affected adversely by competition policy – indeed all these variables
at some point have shown an up-and-down trend. We have evidence of high concen-
tration in Tanzanian manufacturing and the existence of anti-competitive behaviour,
which have been reported to the fair competition department. It is true that the policy
may have affected the specific firms that were reported to the commission. However,
based on the information about the investment and export behaviour of some of the
firms, we find no major effect, and our data do not provide support for the view that
anti-competitive behaviour, e.g. through false advertisement, is helpful to their per-
formance. In fact, such companies have retained their position and some have had
their performance improved even after being dealt with by the competition laws.
The other important task of the study has been to address the question: what are
the prerequisites for the successful implementation of competition policy in develop-
ing countries and the mechanism through which this may operate? This study points
out that policy makers in developing countries face the challenging task of designing
appropriate competition policies that will bring about economic development in these
countries. In the light of the previous discussion, such a policy must at least be able
to (a) restrain anti-competitive behaviour by domestic privatized large firms, (b) limit
abuses of monopoly power by mega-corporations created by the international merger
movement, and (c) promote development. There are several characteristics in de-
veloping countries that certainly can make the task of competition policy design diffi-
cult. For instance, while market entry and access are the key elements of the market
economies that many developing countries are currently striving to achieve, in prac-
tice, promoting the conditions for wider market access and efficiency through com-
petition has been a difficult challenge. In most developing countries, the market or
invisible hand does not always operate very smoothly and indeed the instances of
market failures are rather frequent. A clear understanding of the sources of the mar-
ket failure is crucial for developing an effective competition policy for developing
countries. The theoretical explanation for market failure in developing countries is
that the high transaction costs and asymmetric information in these countries limit
the occurrence of some transactions which would occur for the sake of economic
efficiency. The other limits to competition policy design in developing countries are
the existence of large informal activities, lack of well-defined property rights, limited
environmental, safety and health standards, underdeveloped consumer protection
institutions and laws, limited capability to verify and check standards, lack of techni-
cal expertise and experience in competition policy and limited institutional capability
in areas of competition and antitrust.
While the optimal competition policy will differ between countries depending on
their stage of development and the effectiveness of their governments, as well as the
supporting institutional framework, there are some prerequisites for the successful
implementation of competition policy in developing countries that can be uniformly
relevant. First, a country implementing a competition policy needs an enforcement
agency with properly trained employees and adequate resources to enforce the policy.
264-301.pmd 26/05/2004, 14:37298

299Godius Kahyarara
This, thus, calls for the developing countries to maintain a well-organized and effi-
cient institutional framework with adequate human, technical and financial resources.
Connected to this point, the institution(s) in charge of competition policy should be
politically independent, and transparent to avoid pressure from possible conflict of
interest and acts such as corruption. It has also been the case that some countries
have developed competition policies in parallel with other existing public policies. But
a well-functioning competition policy needs to be linked with other rules and regula-
tions in the economy. In this case, the design of competition policy must be accom-
panied by efforts to ensure that there is a sound competitive environment in other
economic sectors, and policies that are directly or indirectly linked to competition
policy. A related point is that competition policy should look beyond the domestic
situation. There should be harmonization of the competition policy with those of coun-
tries with similar characteristics,
The proper enforcement of competition policy requires knowledge about compe-
tition policy, and the capacity to investigate and interpret cases related to competi-
tion. Developing countries should, therefore, improve the system of data collection
and reporting on competition matters, e.g. concentration, change in market power,
investment behaviour of the producing firms, and other possible measures of com-
petition, and encourage and facilitate training in disciplines necessary for the compe-
tition policy implementation such as competition law, and economics which has a
strong emphasis on aspects of competition and the related fields. But given limited
financial and technical capabilities, many developing countries left on their own can
hardly afford to establish new institutions equipped with the required expertise and to
institute a well-functioning competition policy. There needs to be technical and finan-
cial assistance to assist developing countries in the design of optimal competition
To sum up, the prerequisites for the successful implementation of competition
policy in developing countries are: a sound competitive environment in other eco-
nomic sectors and policies that are directly or indirectly linked to competition policy;
establishment of production standards; defined property rights; consumer protection
agencies; an organized and efficient institutional framework with adequate human,
technical and financial resources; harmonization of competition policy with those of
countries with similar characteristics and/or economic partners; establishment of pro-
cedures and methods that allow the monitoring of competition; ensuring that compe-
tition is legally protected and the provision of settlement procedures for disputes
through appropriate institutions with adequate knowledge of competition matters;
improving the system of data collection and reporting on competition matters, e.g.
changes in industrial concentration, changes in market power, investment behaviour
of the producing firms and other possible measures of competition; encouragement
and facilitation of training in disciplines necessary for competition policy implementa-
tion such as competition law, and economics with a strong emphasis on aspects of
competition and its related fields.
264-301.pmd 26/05/2004, 14:37299

300 Competition Policy Manufacturing Exports, Investment and Productivity
References
Aghion, P. and Howitt, P. (1997). A Schumpeterian Perspective on Growth and Competition.
In: Kreps, D. and Wallis, K.F. (eds), Advances in Economics and Econometrics: Theory
and Applications. Cambridge University Press, Cambridge MA.
Aghion, P., Dewatripont, M. and Rey, P. (1999). Competition, Financial Discipline, and Growth,
Review of Economic Studies, 66 (4): 825-852.
Aghion, P., Harris, C. and Vickers, J. (1997). Competition and growth with step-by-step inno-
vation; an example, European Economic Review, 41: 771–782.
Anderson, J.H., Lee, Y. and Murrell, P. (2000). Competition and privatization amidst weak
institutions: evidence from Mongolia, Economic Inquiry, 38 (4): 527–549.
Basu, S. and Fernald, J. (1997). Returns to scale in U.S. production estimates and implica-
tions, Journal of Political Economy, 105: 249–283.
Bernard, A. and Wagner, J. (1997). Exports and success in German manufacturing,
Weltwirtschaftliches Archiv, 133: 134–157.
Bernard, A. and Jensen, J.B. (1999). Exceptional exporters performance: cause, effect or
both? Journal of International Economics, 47: 1–25.
Blomström M. and Kokko, A. (1998). Multinational corporations and spillovers, Journal of Eco-
nomic Surveys, 12: 247–277.
Blomström, M. and Sjöholm, F. (1999). Technology transfer and spillovers: Does local partici-
pation with multinationals matter? European Economic Review 43: 915–923.
Caves, R.E. and Barton, D.R. (1990). Efficiency in U.S. Manufacturing Industries. MIT Press,
Cambridge, MA.
Chari, V. and Hoppenhayn, H. (1991). Vintage human capital, growth and the difference of
new technology, Journal of Political Economy; 99: 1142–1165.
DeGhellinck, E., Geroski, P.A. and Jacquemin, A. (1988). Inter-industry variations in the effect
of trade on industry performance, Journal of Industrial Economics, 37 (1), 1–19.
Dutz, M.A. and Vagliasindi, M. (2000a). Rules versus implementation: Determinants of com-
petition policy effectiveness in transition economies, mimeo.
Dutz, M.A. and Vagliasindi, M. (2000b). The impact of competition policy on structural concen-
tration in domestic markets, mimeo.
Ferguson, C.E. (1965). Time-Series Production Functions and Technological Progress in
American Manufacturing Industry, Journal of Political Economy, 73: 135–147.
Griliches, Z. (1963). The sources of measured productivity growth: United States agriculture,
1940–1960, Journal of Political Economy, 71: 331–346.
Geroski, P.A. and Jacquemin, A. (1981). Imports as Competitive Discipline. In: Symposium on
Industrial Organization and International Trade, Recherches Economiques de Louvain,
47 (3–4): 197–208.
Gonenc, R., Maher, M. and Nicoletti, G. (2000). The implementation and the effects of regula-
tory reform: Past experience and current issues, OECD Economics Department Working
Papers, No. 251.
Green, A. and Mayes, D.G. (1991). Technical inefficiency in manufacturing industries, Eco-
nomic Journal, 101: 523–538.
Haddad, M. and Harrison, A. (1993). Are there positive spillovers from direct foreign invest-
ment? Evidence from panel data for Morocco, Journal of Development Economics, 42:
51–74.
264-301.pmd 26/05/2004, 14:37300

301Godius Kahyarara
Hay, D. (1996). Competition policy. In: Jenkinson, T. (ed.), Readings in Microeconomics. Ox-
ford University Press, Oxford
Hicks, J.R. (1935). Annual survey of economic theory: the theory of monopoly, Econometrica,
3: 1–20.
Helpman, E. and Krugman, P.R. (1989). Trade Policy and Market Structure. MIT Press, Cam-
bridge, MA.
Kokko, A. (1994). Technology, market characteristics and spillovers, Journal of Development
Economics, 43: 279–293.
Nickell, S. (1996). Competition and corporate performance, Journal of Political Economy, 104:
724–746.
Nickell, S. (1999). Product markets and labour markets, Labour Economics, 6: 1–20.
Nickell, S., Vainiomaki, J. and Wadhwani, S. (1994). Wages and product market power,
Economica, 61: 457–473.
Ndulu, B. (1986). Investment, output growth, and capacity utilization in an African economy:
the case of the manufacturing sector in Tanzania, East African Economic Review, (Kenya)
2: 4–30.
Mans, D. (1994). Tanzania: Resolute Action. In: Hussain, I. and Faruquee, R. (eds), Adjust-
ment in Africa. The World Bank, Washington DC, pp. 352–426.
Maliyamkono, T. and Kahama, G. (1986). The Challenges of Tanzania’s Economy. Tanzania
Publishing House, Dar es Salaam, Tanzania.
Saunders, R. (1980). The determinants of productivity in Canadian manufacturing industries,
The Journal of Industrial Economics, 29 (2): 167–184.
Schumpeter, J. (1950). Capitalism, Socialism, and Democracy. 3rd ed. Harper and Row, New
York.
Wei, Y.A., Liu, X., Siler, P. and Wang, C. (2000). Productivity spillovers from foreign direct
investment: evidence from U.K. industry level panel data, Journal of International Busi-
ness Studies, 31(3): 407–425.
264-301.pmd 26/05/2004, 14:37301

302 Privatization, Competition Policy, Economic Deregulation
IV.3. PRIVATIZATION, COMPETITION POLICY, ECONOMIC DEREGULATION ANDTHEIR IMPACT ON COMPETITIVENESS: THE CASE OF THE ELECTRIC
POWER MARKET IN PERU
Gonzalo Ruíz1
1. Introduction
After a decade of increasing fiscal problems and macroeconomic instability, the Pe-
ruvian Government initiated a broad set of economic reforms. Among these, the
reforms in infrastructural industries, especially in the telecommunications and en-
ergy sectors, were particularly important in terms of their scope and economic im-
pact. In the electrical power sector, consistent with widespread structural reform around
the world, the reform emphasized three aspects: private participation, industry re-
structuring and competition promotion. On the one hand, the government promoted
a broad privatization program, the vertical and horizontal divestiture of previous state
monopolies, and a combination of regulatory schemes and competition mechanisms.
On the other hand, however, the government created an institutional framework aimed
at minimizing the lack of credibility generated by Peru’s weak institutional framework.
Under the new institutional setting for reform in the electricity sector, different
roles were defined for public institutions. The main normative tasks were assigned to
the Energy Ministry (MEM2
) and the competition policy task to the competition agency
(Indecopi3
), the supervision and administration of tariff regulatory schemes and qual-
ity to the energy regulatory agency (initially the Electric Tariffs Commission and later
Osinerg4
), and the privatization process to the privatization agency (initially COPRI
and later ProInversion).
In this context, the reform established at least three dynamic transmission chan-
nels to economic competitiveness: the design of a credible institutional framework
and, consequently, the promotion of private investment at a lower capital cost, the
ability to adequately manage the cost-based regulatory schemes (with some incen-
tive components), and the ability to promote competition among generators on the
supply side and among the unregulated big customers on the demand side.
One main question regarding the above is the overall effect of the electricity
industry reform on the competitiveness of the economy. The economic literature shows
that competition policy is a key factor in price convergence, which is better obtained
in economies where competition policies have been successfully applied.5
During the 1990s, some developed countries implemented new regulations in
the electricity sector in order to stimulate competition in activities that do not possess
the technological characteristics of a natural monopoly. There is strong evidence that
the general results of these attempts to introduce competition have been positive in
terms of lower prices and use of capacity in generation. Indeed, Steiner (2000) has
shown, for a sample of 19 OECD countries over the 1986–1996 period, that unbundling
302-322.pmd 26/05/2004, 14:41302

303Gonzalo Ruíz
generation and transmission activities, promotion of access to the grid and the intro-
duction of electricity markets have reduced both industrial end-user electricity prices
and the ratio of industrial to residential prices.6
Additionally, Steiner (2000) shows
that the reforms in these countries contributed to improve reserve margins and utili-
zation of capacity in the electricity generation market. This general conclusion is also
supported by specific country studies.7
Compared with the literature regarding reform and promotion of competition in
the electricity sector, research about the impact of performance in the electricity
market on the competitiveness of other economic sectors of the economy is rela-
tively scarce. However, recent studies applied to Latin American countries have shown
that reforms in utilities had a positive impact on welfare and competitiveness. UADE
(2003), for example, using a general equilibrium model for Argentina, demonstrated
that reforms in electric energy among other services8
implemented in this country
had a positive impact on consumers, on GDP and on exports.
In the case of Peru, an empirical evaluation on the effects of reforms in utilities on
the competitiveness of other economic sectors is certainly lacking. In this chapter,
we estimate the effects of competition policy on economy competitiveness. Our re-
search strategy is to estimate a supply function for a number of industries, using an
input-output matrix in order to quantify the effects of changes in prices of electric
power on the prices of other industries, including those which produce tradable and
non-tradable goods and services.
The chapter is divided into six sections. The first section describes the process of
reforms introduced in the electric power market in Peru, since 1994. The second
section introduces the discussion about the effects of competition in the markets of
non-tradable inputs on the competitiveness of the economy and illustrates this rela-
tionship in the context of a simple model. The third section presents the general
methodology for assessing the impact of increased competition in a non-tradable
input on the competitiveness of the economy. The fourth section explains the results
obtained by the estimation. Finally, this chapter includes some final remarks with
comments on possible extensions to other markets and countries and the comple-
mentary roles played by the competition agency, the sectoral regulator and the priva-
tization agency in the case of Peru.
2. The process of reforms in Peru and the deregulation and promotion of
competition in the electricity sector
One of the main effects of the foreign trade reform implemented in Peru during the
last decade was the increase of competition in domestic markets through the reduc-
tion of entry barriers (especially tariff and non-tariff measures9
) to such markets. This
process led to a substantial change in domestic markets structure and the delimita-
tion of domestic markets. As a result, some goods or services, which were consid-
ered as non-tradables10
before the reforms, began to face strong competition from
imported goods and services.
302-322.pmd 26/05/2004, 14:41303

304 Privatization, Competition Policy, Economic Deregulation
Despite the above-mentioned reforms, the technological characteristics of some
economic activities, or the nature of certain goods and services, still remain factors
that limit the entry to domestic markets. This situation may be one of the reasons
why a higher proportion of cases solved by the competition authorities in transition
economies refer to non-tradable goods or services. Indeed, Figure 1 shows that in
Peru, during the last decade, the proportion of cases solved by the Free Competition
Commission in markets of non-tradables was 71 per cent of the total. This reflects
the importance of enforcement activities in such markets, as part of the competition
policy agenda.
Figure 1. Free Competition Commission: cases solved in markets of
tradables and non-tradables (1993–2003).
In the case of the electricity sector, which represented 13 per cent of the cases
solved by the Free Competition Commission mentioned above, since 1992, the Pe-
ruvian Government initiated a process of reform in the electric power market. Be-
tween 1972 and 1992, the electricity sector had been managed exclusively by
Electroperu, a state-owned enterprise which integrated vertically the generation, trans-
mission and distribution activities.
Consistent with the widespread international experience, in the case of Peru,
one of the key objectives of the reform was to introduce competition in potentially
competitive markets and to ensure the access of competitors to transmission and
distribution networks. In order to achieve these objectives, in 1992, through the
302-322.pmd 26/05/2004, 14:41304

305Gonzalo Ruíz
Concessions Law in Electricity,11
the Government proposed the splitting up of the
industry into four activities: generation, transmission, distribution and energy trading.
As mentioned above, the decision and strategy of privatization was in the charge
of the Commission for the Promotion of Private Investment (COPRI).12
In the case of
the electric energy sector, the privatization process was initiated in 1994, with the
auction of 60 per cent of shares from Edelnor and Edelsur, the two electricity distribu-
tion firms located in the north and south of Lima, respectively. In 1995, two genera-
tion firms (Cahua and Edegel) and another distribution company (Edechancay) were
privatized. The process continued during 1996 and 1997, with the transfer of Etevensa
and Eepsa, two generation companies, and other distribution firms, located in the
north of the country.13
During 2001, the transmission net was transferred by conces-
sion (see Table 1).
Since 2001, the privatization process in the electric energy sector has stagnated.
Thus, one of the most important generation companies (Electroperú) still remains in
the ownership of the state. However, the general balance of the privatization process
is positive: privatization not only allowed new investments to be attracted to the sec-
tor (which, only considering the amount obtained through sales, equalled US$ 1.6
billion between 1994 and 2001) but also increased competition in generation, through
the entry of new private players into the market.
Table 1. Privatization in the electric energy sector.
Privatization in Electric Energy Sector
Closing date 1/ Firm Buyer/ concessionerAmount
(US$ thousand)
18-Ago-94 Edelnor Inversiones Distrilima 176,49018-Ago-94 Luz del Sur Ontario Quinta 212,10030-May-95 Cahua Sipesa 41,81030-Nov-95 Edegel Generandes 524,400
15-Dic-95 EdeChancay Inversiones Distrilima 10,36022-Ene-96 Etevensa Consorcio Generalima09-Ago-96 Egenor Inversiones Dominion 228,200
27-Jun-95 EdeCañete Luz del Sur 8,62020-Nov-96 EEPSA Consorcio Elect. Cabo Blanco 19,66025-Mar-97 Electro Sur Medio Consorcio Hica Inversiones 25,64015-Ene-98 TransMantaro Hydro Quebec - G y M Concesión
Electro Norte 22,120Electro Nor Oeste 22,890Electro Centro 32,690
Hidrandina 67,88029-Ene-99 Redesur Red Eléctrica de España Concession
26-Abr-01
BOOT LL.TT. Oroya-
Carhuamayo-Paragsha-Derivación Antamina yAguaytia- Pucallpa
Interconex . Eléctrica ISA Concession
11-Dic-01 Electro Andes Inversiones Elegia S.R.L 2/ 226,360
TOTAL 1,619,220
Note:1/ Closing date: Date of subsciption of the contract.2/ PSEG Global INC was declared winer of the Public International Contest PRI-64-2001.
However, PSEG Global INC transfer its rights to Inversiones Elegia S.R.L.
Source
Osinerg: Reporte de Privatización
http://www.osinerg.org.pe/osinerg/privatizacion/post_privatiza.jsp
22-Dic-98 Grupo Gloria (JORBSA)
Fuente: Osinerg ( www.osinerg.org.pe ), Proinversión
302-322.pmd 26/05/2004, 14:41305

306 Privatization, Competition Policy, Economic Deregulation
As mentioned above, regulatory functions in the electricity market were assigned
to the Electric Tariff Commission (CTE), an institution that years later (1996) was
incorporated into Osinerg. Osinerg has the role of setting prices in regulated mar-
kets, based on the marginal cost of energy production (generation) and the value
added of distribution (VAD). The Concessions Law in Electricity also established the
functions of the System’s Economic Operations Committee (COES), which is com-
posed of all the generators in the system. One of the main functions of COES is to
determine the order of dispatch of generation plants taking into account the respec-
tive marginal cost of energy production.
Regarding competition policy, in September 1997, Law 26876 was enacted which
established a merger review system in the electric power sector. According to this
Law, any concentration transaction made by companies whose market share ex-
ceed 15 per cent, in the case of horizontal mergers, or 5 per cent, in the case of
vertical mergers, must be notified to Indecopi. Indecopi’s role in this procedure is to
evaluate the impact of the transaction on competition conditions in relevant markets
and to decide either the approval, conditioning, or prohibition of the operation. From
302-322.pmd 26/05/2004, 14:41306

307Gonzalo Ruíz
November 199714
to December 2002, only nine authorization requests were approved
by Indecopi (Table 2). In almost all cases, the transactions were authorized without
conditions. There were only two cases in which the authorization was subject to
conditions.15
Despite the fact that no operation was prohibited since the start of this merger
review system, the concentration indexes in the electric power markets have de-
clined. Indeed, Figure 2 shows that the Hirschman–Herfindhal Index (IHH) in the
electric power generation market declined by 25 per cent between 1997 and 2002.16
Figure 2. IHH in the electric power market and the real price to end-users.
Source: Osinerg
The competition analysis in the Peruvian electric power market includes at least
three relevant markets. The first one is the market of non-regulated users, which
includes clients whose energy consumption exceeds 1 MW. Prices in this market are
not regulated. A second market is composed of regulated users and includes trans-
actions between generators and distributors or distributors and regulated clients. In
both cases, prices are regulated by Osinerg. A third relevant market includes spot
transfers of energy and power between generators. This market is governed by regu-
latory rules that establish the merit order dispatch to supply energy.17
In this spot
market, prices are set by COES, which is composed of all the generators, according
to the parameters established by the Concessions Law in Electricity.
Figure 2 shows the evolution of average annual real prices of energy to end-
users during the 1996–2002 period. The cumulative reduction of these prices during
the period has been 18.2 per cent.
Other performance indicators of the industry show significant improvements dur-
ing the period.18
For example, regarding the quality of the service, in 1993 total en-
ergy losses of distributors was 22 per cent of the total amount of energy received by
distribution systems. This percentage declined to 9.1 per cent in 2002. The coverage
302-322.pmd 26/05/2004, 14:41307

308 Privatization, Competition Policy, Economic Deregulation
of the electricity system increased substantially, which has been reflected in the in-
crease in the number of users. While in 1994 the number of users was of the order of
2,309 thousands, in 2002 it was 3,621 thousands.19
Moreover, as a consequence of
a broad program of electrification implemented during the period,20
per capita electri-
fication coefficients were reduced from 52.3 per cent (one of the lowest in Latin
America) to around 75 per cent in 2000.21
Given the results outlined above, the overall balance of the reform implemented
in the Peruvian electricity market during the 1994–2002 period is positive. Even though
levels of concentration in generation in absolute terms still remain relatively high,
prices have been reduced, and quality and coverage have been improved. In con-
trast with the deficit in generation capacity faced in the early 1990s, nowadays the
system exhibits excess capacity as a consequence of the increase of new invest-
ments in the sector.
Even though is not our intention to undertake an exhaustive analysis of the re-
form, the figures and indicators shown above, give us a general overview of the most
important results of this process.22
In the next section, we will address the methodol-
ogy for measuring the impact of one of the variables analysed above (real prices) on
the competitiveness of the economy.
3. A simple model of fixed coefficients for a small economy
Promoting competition in markets of non-tradables may have positive effects from
the perspective of both final and intermediate consumers. From the final consumer
perspective, reducing market power in those markets will be reflected not only in
lower prices of these goods but also in lower prices of other goods and services
which are included in its consumption basket (which uses the non-tradable product
as an input).
From the intermediate consumer perspective, a reduction in market power in the
non-tradable market could also have direct and indirect effects on its competitive-
ness. The direct effect is related to the reduction of the price of the non-tradable input
itself and the indirect effect to the reduction of the price of other inputs which also
consume the non-tradable good.
These effects could be easily illustrated through a simple model. Let’s assume
an economy in which the production vector includes a non-tradable product (N) and
other products (Y).23
These products are used in turn as an input for producing N and
Y. Accordingly, a fraction of Y is used as an input for producing the same good (YY
)
and the other fraction for producing N (YN
). The same assumptions could be made
for the non-tradable good (N):
N
Y
)1(
302-322.pmd 26/05/2004, 14:41308
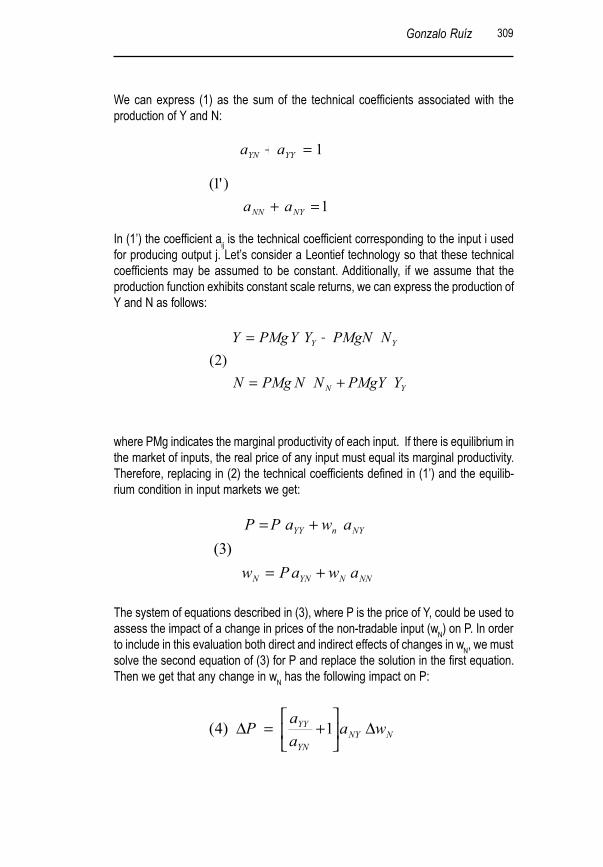
309Gonzalo Ruíz
We can express (1) as the sum of the technical coefficients associated with the
production of Y and N:
In (1’) the coefficient aij
is the technical coefficient corresponding to the input i used
for producing output j. Let’s consider a Leontief technology so that these technical
coefficients may be assumed to be constant. Additionally, if we assume that the
production function exhibits constant scale returns, we can express the production of
Y and N as follows:
where PMg indicates the marginal productivity of each input. If there is equilibrium in
the market of inputs, the real price of any input must equal its marginal productivity.
Therefore, replacing in (2) the technical coefficients defined in (1’) and the equilib-
rium condition in input markets we get:
The system of equations described in (3), where P is the price of Y, could be used to
assess the impact of a change in prices of the non-tradable input (wN
) on P. In order
to include in this evaluation both direct and indirect effects of changes in wN
, we must
solve the second equation of (3) for P and replace the solution in the first equation.
Then we get that any change in wN
has the following impact on P:
1
)'1(
1
=+
=+
NYNN
YYYN
aa
aa
YN
YY
YPMgYNNPMgN
NPMgNYYPMgY
+=
+=)2(
NNNYNN
NYnYY
awaPw
awaPP
+=
+=)3(
NNY
YN
YY
wa
a
a
P ∆
+=∆ 1)4(
302-322.pmd 26/05/2004, 14:41309

310 Privatization, Competition Policy, Economic Deregulation
where the first part in parentheses reflects the indirect effect of a change on the price
of the non-tradable input, while the second indicates the direct effect (which only
depends on technical coefficient aNY
). Notice that the lower the fraction of input Y
used to produce N (and therefore the higher the proportion of this input used to
produce Y), the higher is the indirect effect of a change in price in non-tradables.
According to this simple model, the impact of a change in non-tradable input
could have multiplicative effects on the prices of other products in the economy,
especially when such products consume a significant proportion of inputs from other
sectors of the economy (which is related to aYY
). This multiplicative effect is associ-
ated with the indirect effects of reduction of prices on the non-tradable inputs on
other sectors.
It is important to stress that a price reduction in the non-tradable input will not
always be a consequence of the improvement in competition in that market. Indeed,
a reduction in prices of non-tradables could reflect productivity improvements in its
production or an increase in some resource endowments, among several other fac-
tors.
One method for isolating the impact of competition on DwN
could consist of the
construction of an indicator of market power in the non-tradable market. For exam-
ple, by using a definition of the Lerner Index24
we can estimate the difference be-
tween the actual prices of the non-tradable input and a hypothetical price that would
maintain market power (on average) constant during the period of analysis. The
reduction in the difference between the price of non-tradables and that of constructed
prices could be attributable to the improvement in competition conditions in that market.
A final remark related to the concept of competitiveness used in this chapter – in
the context of this chapter, we will use the concept of competitiveness as the capac-
ity of firms to gain access to markets through reducing production costs (among
other factors). This could be achieved by means of internal or external economies.
Hence, a reduction in the prices of non-tradables helps domestic firms to achieve
external economies contributing to strengthen their ability to compete in domestic
and external markets.
4. Methodology
Based on the theoretical framework described in the last section, we can develop a
general methodology in order to assess the impact of increased competition in elec-
tric power markets on competitiveness in other sectors of the economy. Generalizing
the expression (3) to an economy with M inputs and N products, we get:
[ ]eej
M
i
iijNjPaPaP += ∑
=×
1
1
)5(
302-322.pmd 26/05/2004, 14:41310

311Gonzalo Ruíz
where [Pj
] depicts the vector of prices of products and aij
is the technical coefficient
which relates the input i to the output j. Accordingly, Pe
is the price of the electricity
and aej
is the technical coefficient which relates the input e (electricity) to the output j.
The indirect effects of a change in the price of electricity must be analysed in
another equation, incorporating the impact of changes in the electricity price on the
prices of other inputs.25
Replacing these results in (5) we get:
This equation could be used to quantify the effects of a change in the price of
electricity on the prices of other sectors of the economy. Indeed, the first part of the
right-hand expression in (6) describes the indirect effects and the second the direct
effects of changes in the price of electricity for N different sectors of the economy. In
sectors in which electricity is relatively important as an input, the direct effects will
dominate the indirect effects. The opposite occurs in sectors which consume a high
proportion of inputs other than electricity.
Equation (7), which is a generalization of expression (4), could be used to predict
the impact of changes in the price of energy on the prices of the products of the
economy:
Given that generation is subject to a cost-based regulation, in the case of the
Peruvian market, it is difficult to construct market power indicators for generation
firms based on Lerner Indexes.26
Moreover, in the case of the price of electricity paid
by end-users, in the regulated market, there are components of the end-user price
that are determined exclusively by regulation, such as tariffs for transmission and
distribution.27
For these reasons, instead of using a pure competition indicator (as a
Lerner Index) we will use an indicator of competition and regulation performance.
This indicator will be the real price of electricity sold to final consumers.28
Another important reason for using a “competition and regulation” performance
indicator is the complementary and interdependent role that economic regulation
and competition has played during the process of reform. Economic regulation was
in charge not only of setting transmission and distribution fees (which represent a
[ ]eejM
k
ki
ji
M
i
eei
NjPa
a
aPa
P +−
=∑
∑
=
=×
)1(
)6(
1
1
1
[ ]eejM
k
ki
ji
M
i
ei
NjPa
a
aa
P ∆
+−
=∆∑
∑
=
=×
)1(
)7(
1
1
1
302-322.pmd 26/05/2004, 14:41311

312 Privatization, Competition Policy, Economic Deregulation
component of final price) but also of guaranteeing the access of competitors to distri-
bution and transmission networks. Distribution and transmission fees represent a
significant fraction of the end-user price (which is the actual price paid by custom-
ers). During the last years, for example, the value added of distribution represented
around 35 per cent of the end-user prices. Access policies are also crucial for pro-
moting entry to markets of final customers. A poor performance of these policies
could limit or restrain the effectiveness of deregulation and competition.
In order to address the total potential savings caused by a reduction in energy
prices, we multiply price variations obtained in (7) by Qj
(total production of sector j).
On the right-hand side, we can do the same using the ratio (Qj
/Qej
, where Qej
is the
production of electricity sold to sector j), which is a proxy of productivity of electricity
in this sector.
The input-output matrix, which consists of a double entry table that relates sup-
ply of inputs to demand from each sector of the economy, used for this calculation is
the 1994 matrix, source INEI.29
The dimensions of the matrix are 287 rows of inputs
and 45 columns of products. One advantageous characteristic of this matrix is that
the electric sector is included separately in one of the rows. However, for calculating
the indirect effects, it was necessary to use some ad hoc assumptions to split the 45
columns into 287 sectors30
in order to work with a squared matrix.
5. Results
In this section, we estimate the impact of the reduction in electricity prices during the
1994–2002 period on the competitiveness of the economy. Figure 3 shows the de-
creasing trend in the real prices31
of electricity and the growth of energy sales during
this period. The accumulated percentage of reduction of this price between 1994 and
2002 is 17.6 per cent. Based on this figure, is possible to estimate the amount saved
by consumers as a result of reduction in the real prices of energy.32
Indeed, multiply-
ing the total consumption of energy by the difference between yearly real prices and
the 1994 prices, we get US$ 530.8 million. This amount equals 6.5 per cent of the
total sales of electricity during the 1995–2002 period.
Table 3 shows how this reduction in real prices could be divided between sec-
tors which consume electric energy as an input, according to the input-output matrix
of 1994. Around 45 per cent of the benefits of the reduction in prices of energy during
the 1994–2002 period were directed to households. If total benefit from price reduc-
tion was US$ 530.8 million, the savings for households, during the period, could be
[ ]ej
ej
j
eejM
k
ki
ji
M
i
ei
NjjQ
Q
Q
Pa
a
aa
PQ ∆
+−
=∆∑
∑
=
=×
)1(
)8(
1
1
1
302-322.pmd 26/05/2004, 14:41312

313Gonzalo Ruíz
estimated as US$ 239.1 million. Other sectors that benefited from reduction in en-
ergy prices were commerce (7.8 per cent), metal mining manufacturers (4.9 per
cent), services to companies (3.9 per cent), mineral extraction (3.4 per cent) and
government services (3.3 per cent).
Figure 3. Total sales and real prices of electricity to end-users.
Source: Osinerg, INEI
Table 4 shows the estimates of direct and indirect effects of reduction in prices of
electricity, using the technical coefficients included between the parentheses of ex-
pression (7) obtained from the input-output matrix. The total effect varies between
nearly 0 per cent and 5 per cent. The sectors in which this percentage is most impor-
tant are paper manufacturing (5.0 per cent), chemical basic products (4.8 per cent),
mining manufacturing products (4.8 per cent) and rubber and plastic manufacturing
(nearly 4.0 per cent). Notice that for the final demand of electricity the total estimated
effect is 2.7 per cent.33
As was argued through our simple model presented in section 3, in those sectors
where consumption of inputs other than electricity represents a relatively high share
of the total inputs consumed, the direct effects are higher than the indirect ones.
Indeed, in sectors such as textiles, clothing, pharmaceuticals, inter alia, indirect ef-
fects are higher than direct effects. The number of sectors in which indirect effects
dominate is 26 (nearly 60 per cent of the total). Notice that in the case of final de-
mand for electricity, the indirect effects (1.4 per cent) also dominate the direct effects
(1.29 per cent).
In sectors in which consumption of electric power is relatively important, direct
effects are higher than indirect effects. For example, this is the case for mineral
extraction and production, paper manufacturing and chemical basic products.
302-322.pmd 26/05/2004, 14:41313

314 Privatization, Competition Policy, Economic Deregulation
In order to address the impact of a reduction in prices of electric energy on the
competitiveness of industry, we need to estimate the effects of this reduction on
prices of goods and services. The annual price changes are small. However, when
the latest figures are taken into account, results are quite significant.
6. Final remarks
The lack of competition in the markets of non-tradable goods is a factor that may limit
substantially the competitiveness of industries intensive in the use of non-tradable
inputs. The recent experience of privatization, deregulation and competition promo-
tion applied to the electric power sector in Peru provides an interesting example of
how a combination of these policies can be reflected in a better performance of the
industry, more competition in the electricity generation market (of non-tradable in-
puts), reduced prices of energy, and improved quality conditions for intermediate
and final consumers (including industries of tradable goods and services). The ac-
tual and potential benefits associated with the promotion of competition in electric
power, can be measured through its impact on the competitiveness of other indus-
tries. Indeed, electric energy constitutes an important input for many economic ac-
tivities in Peru (representing around 2 per cent of Peruvian GDP), including the pro-
duction of tradable goods arising from mining industries.
The main goal of this chapter was two-fold. In the first place, it aimed to develop
a general framework, based on the use of the input-product matrix, in order to evalu-
ate the impact of competition and market power in non-tradable markets on other
industries’ competitiveness. The second objective is to apply this methodology to the
electric power market in order to quantify the actual and potential impact of increased
competition and reduced market power on other industries during the 1994–2002
period.
The main results can be summarized as follows:
• From 1994 to 2002, the real prices of energy sold to end-users showed a cumu-
lative reduction of 17.6 per cent. Assuming a Leontief technology, total savings to
electricity consumers associated with reduction in real prices during the 1994–
2002 period were US$ 530 million. This amount equals 6.5 per cent of the total
sales of electricity during the 1995–2002 period. The sectors which benefited
most from this reduction were households, commerce, metal mining manufac-
turers, services to companies, minerals extraction and government services.
• Regarding the impact on competitiveness from reduction in prices of electricity,
the sectors in which the effects were most significant were manufacturing, chemical
basic products, mining manufacturing products, and rubber and plastic manu-
facturing.
• One of the most important lessons from the reform implemented in the electric
energy sector in Peru, during the last decade, is that the success of a process
doesn’t depend exclusively on the individual performance of the competition
agency, the sectoral regulator or the privatization agency. The success of the
302-322.pmd 26/05/2004, 14:41314

315Gonzalo Ruíz
reform will also depend on a combination of antitrust, privatization and regulatory
policies and on the internal consistency and coherence between them. Addition-
ally, the coherence and consistency of the institutional framework will depend
critically on the political commitment of the Government to the process.
For the above-mentioned reasons, the empirical evaluation of the results of the
reform and its impact on consumers, in this chapter, was based on a “regulation and
competition” indicator (real prices of energy sold to consumers), in order to reflect
also the degree of complementarity and consistency between different policies.
The methodology developed in this chapter could be easily extended to other
non-tradable sectors and industries (such as infrastructure, ports, rails, telecom), in
which competition is technically and economically feasible. Indeed, the promotion of
competition on non-tradable markets in developing countries constitutes a priority of
any government engaged in a competitiveness strategy. A foregone conclusion is
that trade and financial liberalization in these countries exposed tradable goods and
services to foreign competition and, consequently, the benefits of competition were
easier to achieve in these markets; non-tradable goods, in contrast, would be sub-
ject to a more stringent scrutiny by the competition authority.
Another important lesson from the reform implemented in the electric energy
sector in Peru, during the last decade, is that the success of a process of competition
promotion doesn’t depend exclusively on the individual performance of the competi-
tion agency, the sectoral regulator or the privatization agency. The success of the
reform will also depend on the combination of antitrust, privatization and regulatory
policies and on the internal consistency and coherence between them. This doesn’t
means that individual performance of public agencies is not an important factor in
determining the success of the reform. Indeed, in the case of the Peruvian electricity
market, for example, the benefits of competition promotion through antitrust policies
and privatization (for example in terms of lower prices of generation) could have
been offset by a poor performance of the sectoral regulator (in terms of high prices in
transmission and distribution). The opposite could also occur: the benefits of an effi-
cient price and quality regulation could have been obscured without an effective
antitrust or privatization policy.
However, the evaluation of the individual performance of the antitrust agency,
the regulatory body or the privatization organization, will depend crucially on their
institutional objectives and goals. In order to guarantee consistency between anti-
trust policy, regulation and privatization, is important not only that functions assigned
to these institutions be clearly defined but also that their goals and objectives be
complementary to the objective of competition promotion.
The coherence and consistency of the institutional framework will depend criti-
cally on the political commitment of the government to the process. In the design of
the institutional setting and the division of powers between different agencies and
public organizations, the government certainly plays a central role. The successful
302-322.pmd 26/05/2004, 14:41315

316 Privatization, Competition Policy, Economic Deregulation
Peruvian experience in the electricity market reform would not be possible without
government support in the approval of the Concessions Law in Electricity, Law 26876
or COPRI’s decision to privatize electric public companies. Conceiving a long-term
vision of the process of reforms and the inclusion of competition policy as a tool that
could contribute to achieving some of its objectives (attracting new investment, in-
creasing welfare, among others) are among the main tasks that government faces in
order to guarantee the success of the reform.
Once the institutional setting is created, a close coordination between the differ-
ent organizations involved in the process must be ensured. The coordination chan-
nels could be formal or informal. In the case of the Peruvian experience in the elec-
tricity sector, for example, during the process of merger reviews Indecopi invited the
regulator (Osinerg), among other entities, to present an opinion about the case. In
other cases, COPRI requested Indecopi’s opinion informally about certain clauses
included in concession contracts. Even though these informal mechanisms have
been used during these years, it would be desirable to strengthen them, establishing
formal procedures for requesting opinions about the privatization process, conces-
sion contracts, etc. These formal mechanisms will contribute not only to improving
the transparency of the process but also to promote consensus about the goals and
objectives pursued by the authority.
References
Borenstein, S. (1999). Understanding Competitive Pricing and Market Power in Wholesale
Electricity Markets, Institute of Business and Economic Research, Working Paper CPC99-
008.
Cáceres, A. and Ruiz, G. (1998). El nuevo marco de competencia y comercio exterior en el
Perú, Marzo, Boletín Latinoamericano de Competencia.
Campodónico, H. (2002). Las reformas estructurales del sector eléctrico peruano y las
características de la inversión 1992–2000, Serie Reformas Económicas, 25. Proyecto
Crecimiento, empleo y equidad: América Latina en los años noventa, Mimeo.
Campodónico, H. (2000). Privatización y conflictos regulatorios: el caso de los mercados de
electricidad y combusibles en el Perú, CEPAL, Serie Recursos Naturales e Infraestructura,
División de Recursos Naturales, Marzo.
Indecopi (1999). Competencia en el mercado de clientes finales de Energía Eléctrica, no
sujetos a regulación de precios, Secretaría Técnica de la Comisión de Libre Competencia,
Mimeo.
Indecopi (2000). Estructura y Funcionamiento del Comité de Operación Económica del Sistema
Eléctrico Peruano, Secretaría Técnica de la Comisión de Libre Competencia. Mimeo.
Joskow, P. (2003). The Difficult Transition to Competitive Electricity Market in the U.S., CMI
Working Paper No. 28, Cambridge Working Papers in Economics, University of Cam-
bridge, MA.
Newbery, D. (2002). Issues and options for restructuring electricity supply industries, DAE
Working Paper WP 0210, University of Cambridge, MA.
302-322.pmd 26/05/2004, 14:41316

317Gonzalo Ruíz
Proyecto BID–CAF–Indecopi (1999). Análisis de Competencia del Sector Electricidad, Informe
Final. Proyecto Fortalecimiento de las funciones de regulación y Promoción de la Economía
de Mercado, Mimeo.
Steiner, F. (2000). Regulation, Industry Structure and Performance in the Electricity Supply
Industry, OECD, Economics Department, ECO/WKP (2000)11.
UADE (2003). Las Empresas Privadas de Servicio Público en la Argentina: Análisis de su
Contribución a la Competitividad del País, Informe Final, Centro de Estudios Económicos
de la Regulación, Mimeo.
UNCTAD (2004). Informe sobre las necesidades y prioridades en el área de defensa de la
competencia. Casi de Peru. Proyecto de la UNCTAD apoyado por SECO (Suiza) sobre
Fortalecimiento de instituciones y capacidades en el área de Políticas de Competencia y
Protección del Consumidor en América Latina.
302-322.pmd 26/05/2004, 14:41317

318 Privatization, Competition Policy, Economic Deregulation
Table 3. Participation in benefits of the reduction of price of electricity.
Source: INEI; Elaboration: Own calculations. Note: In the first column the formula used
was ei
/E, where E is total electricity production and ei
is the share of the demand of
electricity corresponding to sector i. The second column includes the result of
multiplying total savings in energy (US$ 530 million) by ei
/ E.
302-322.pmd 26/05/2004, 14:41318

319Gonzalo Ruíz
Table 4. Indirect and direct effects of changes in electric power prices.
Source: INEI; Elaboration: Own calculations. The first column indicates the indirect
effects according to the following formula, taken from the first part of the parentheses of
the left-hand side of equation (6)
The second column corresponds to coefficient ae.j
.The third column includes the sum of
both effects.
− ∑
∑
=
=
)1(
1
1
M
k
ki
ji
M
i
ei
a
aa
302-322.pmd 26/05/2004, 14:41319

320 Privatization, Competition Policy, Economic Deregulation
Notes
1
Economic Studies Manager of Indecopi. The opinion of the author doesn’t necessarily
reflect the institutional opinion of Indecopi. I would like to thank the criticisms and
suggestions from Jose Gallardo. Also, I want to acknowledge the support and help received
from Julio Aguirre and Fedor Molina. Any error is entirely the responsibility of the author.
2
Ministerio de Energía y Minas.
3
Instituto Nacional de Defensa de la Competencia y Protección de la Propiedad Intelectual.
4
Organismo Supervisor de la Inversión en Energía.
5
For the British telecom and energy industries, see Newbery (2002), for recent experience
in the US, see Joskow (2003), and for a cross-sectional analysis applied to developed
countries see Steiner (2000).
6
However, Steiner (2000) states that a high degree of private ownership and imminence of
both privatization and liberalization tend to increase industrial end-user prices.
7
Individual country studies also support the conclusion that restructuring of the industry
and promotion of competition could improve the performance of the electricity sector.
Newbery (2002) through review of the UK experience, states that increased competition
in electricity generation is necessary in order to reduce prices, emphasizing that this
objective could only be achieved through separation of generation, transmission and
distribution activities. This author also describes the process of reforms in Chile, Argentina
and Mexico, among other developing countries.
In the case of the United States, Joskow (2003) states that competition in well-functioning
wholesale and retail markets in this country is “work in progress”. As a result of the process
of deregulation initiated during the late 1990s, private investment in generation has grown,
competitive markets have developed and access to transmission networks and associated
support services has increased, among other positive outcomes. However, the reform in
the United States has faced many imperfections associated with over-investment in
generation and the persistence of market power in wholesale power markets, among
others. Despite these poor results, there is a wide consensus around the importance of
increasing competition in generation, wholesale and retailing markets as a means of
improving the performance of the industry.
8
Includes also telecom, gas, rail transport and water.
9
For a general analysis of reforms implemented in Peru during the 1990s and their impact
on competition in domestic markets see Cáceres and Ruiz (1998) and UNCTAD (2004).
10
Goods or services which cannot be exported or imported because of tariff or non-tariff
measures, and transport costs, among other factors. In such cases, the geographic
configuration of markets may be restricted to the country territory or even smaller regions.
11
Law Decree Nº25844.
12
Created through Legislative Decree 674, published in September 1991.
13
See Proyecto BID-CAF-Indecopi (1999).
14
In November 1997 Supreme Decree Nº017-97-ITINCI was enacted, which regulates and
implements the provisions contained in Law Nº26876.
15
These cases correspond to a simultaneous vertical and horizontal concentration caused
in the Peruvian market as a consequence of an international acquisition by the Endesa
Group, from Spain. Indecopi’s Free Competition Commission decided to approve the
transaction subject to two conditions: (i) One of the generation companies of the Endesa
Group should resign to participate in decisions of the Board of the System Operator (COES)
302-322.pmd 26/05/2004, 14:41320

321Gonzalo Ruíz
corresponding to the Central-North Interconnected System (Comité de Operación
Económica del Sistema Eléctrico del Sistema Interconectado Centro Norte), until this
system was integrated into the South transmission net; (ii) Edelnor, a distribution firm
from the Endesa Group, must organize public auctions in order to encourage the
participation of generators in areas in which that distribution company operates.
16
According to the methodology used by Indecopi, both state-owned and private companies
are included in calculations of the IHH. Notice that despite the sharp reduction in the IHH
during the period, in absolute terms, this index is relatively high compared with international
standards. One factor that could explain this level of concentration, among others, is the
relatively small size of the Peruvian market.
17
Different studies had reviewed the competition conditions in both the generator merit
order dispatch (Indecopi; 1999), and the unregulated market (Indecopi; 2000).
18
See, for example, Campodónico (2002).
19
It includes 253 non-regulated users.
20
One of the main programmes of electrification implemented was the National Electrification
Program (PEN).
21
See Campodónico (2002: 42).
22
For a more detailed and exhaustive analysis, see Proyecto BID-CAF-Indecopi (1999) Op.
Cit. or Campodónico (2000).
23
These products may be tradable or non-tradable.
24
The Lerner Index (LI) is one of the most frequently used indicators to measure market
power. It consists of the difference between price and marginal cost of production divided
by the marginal cost of production. When this index grows, market power is higher, and
vice versa. It is supposed that when competition in the market is weak this index tends to
be higher and when competition is intense the LI tends to decrease.
25
The equation for other input prices is:
We can iterate over the same expression replacing Pk
and getting the following result:
Replacing this result in (5) we get equation (6).
26
For a discussion about the concept of market power in the electricity generation market
see Borenstein (1999).
27
Competition certainly has been one of the key factors that influenced the reduction in
prices to end-users. Indeed, between 1995 and 2002, according to information from Osiner,
the real prices of generation and energy sold to non-regulated users, declined by 17.8 per
cent and 20.8 per cent, respectively.
28
There are other factors that can influence the price of energy. On the supply side, in the
case of Peru, climatic conditions may influence price through their effects on capacity and
water availability for hydroelectric plants. In the case of thermal electricity, the price of
petroleum is a key variable that influences the costs of generation. On the demand side,
economic activity, especially the evolution of industrial output and the international prices
of some products related to the production of raw materials, such as the mining sector or
mineral refining, among others, could be identified as key variables that influence electric
eei
M
k
kkiiPaPaP += ∑
=1
−
=
∑=
M
k
ki
eei
i
a
Pa
P
1
1
302-322.pmd 26/05/2004, 14:41321

322 Privatization, Competition Policy, Economic Deregulation
energy prices.
29
Instituto Nacional de Estadísticas.
30
To split the columns into 287 sub-sectors, the corresponding technical coefficients of
each product were multiplied by the share of the sub-sector production on total production
of the sector. The assumption behind this transformation is that inside each product sector,
the relative importance of inputs is proportional to the sum of total production of inputs.
31
Calculated as the ratio of the price of electric energy sold to end-users divided by the
Consumer Price Index (IPC). See Anuario Estadístico 1994, 1995, 1996, 1997, 1998,
1999, 2000, 2001, 2002, Osinerg: www.osinerg.gob.pe.
32
Under the assumption of a Leontief technology, the demand for inputs is completely
inelastic. Thus, any increase or decrease in the price of the input will generate an increase
in total excedent of firms and consumers.
33
Final demand includes demand for electricity from both final consumers and firms.
Regarding final consumers, it is important to consider that participation of electricity in the
Consumer Price Index is 2.234 per cent for Lima and 2.255 per cent at national level.
302-322.pmd 26/05/2004, 14:41322