competence accumulation and collaborative ventures ... · competence accumulation and collaborative...
TRANSCRIPT

Competence accumulation and collaborative ventures: evidence from thelargest European electronics firms and implications for the EU
technological policies
Marco Giarratana* Salvatore Torrisi**
*Faculty of Economics, S.Anna School of Advanced Studies, Pisa, Italy email: [email protected]**Faculty of Law, Camerino University, Camerino (MC) and Faculty of Economics, CattaneoUniversity, Castellanza (VA), Italy email: [email protected] (corresponding author)
II draft: Milan, November 2000
AbstractThis paper analyses the association between inter-firm collaborative agreements and the technologicalcapabilities of the largest European electronics firms between 1984 and 1997.To this purpose we collected information about 2,240 R&D agreements sponsored by the EU and1,970 non sponsored agreements signed by the sample firm. We classified agreements into fourteenindustrial sectors by using cluster analysis.Moreover, we selected the most important fourteen technological classes for the sample firms in theperiod 1984-1996 and for each class calculated the sample firms' share in world patent applications.We analysed the effects of agreements on firms' technological capabilities measured by patent shares.Our analysis shows that non-sponsored agreements have significant effects on the technologicalcapabilities of the firm. However, only agreements with extra-European (US and Japanese) partnersproduce significant effects on the technological capabilities of the firm. Finally, EU-sponsoredagreements have insignificant effects on technological capabilities. These results indicate that there isa weak complementarity among European electronics firms and suggest that a reshaping of EUpolicies towards collaborative R&D is required.
Key words: inter-firms alliances, innovation, technological capabilities, electronicsJEL: L21, O32, O38, L63

2
1. Introduction1
This paper analyses the accumulation of technological capabilities of large European firms
operating in the information and communication industries (computers, telecommunications
equipment, semiconductors and consumer electronics) (ICT).
The position of Europe in these sectors is weak compared with the US and Japan. This is
clearly shown by the share of total US patenting in the following technological classes:
electronic capital goods and components, telecommunications equipment and consumer
electronics. With few exceptions (such as Thomson-CSF in electronic components and
Siemens and Philips in telecommunications) the share of European firms among the world
larger innovators is small and declining between 1969 and 1990. Technological specialisation
of European firms in these technologies is also weak and declining (Patel and Pavitt, 1994).
However, more recently, new European firms have reached the technological frontier in these
sectors (e.g., Nokia and Ericsson in mobile communication).
The European firms operating in the information and communication industries (ICT) sectors
have tried to catch up with the US and Japanese world leaders by relying on both in-house
R&D and R&D collaborations. The economics literature has pointed out many potential
benefits of R&D collaborative agreements: risk sharing, exploitation of economies of scale
and scope, reduced duplication of research efforts, access to complementary assets and
reduction of time to market (Teece, 1986; Jorde and Teece, 1990). Through R&D (including
joint R&D) firms may also improve their ability to monitor, absorb and exploit external
knowledge (Cohen and Levinthal, 1989; Rosenberg, 1990).2
Since the 1980s, the European Commission has supported R&D in the ICT sectors, especially
joint R&D. While EU policy aims to stimulate innovation and to enhance the capabilities and
competitiveness of the European industry overall, the ICT sectors have received a particular
attention by the European Commission. This is mainly because the innovative activities of
these sectors are expected to be 'pervasive', i.e., they should yield significant potential
spillovers for many other sectors (CEC, 1993 and 1995).

3
What are the implications of EU-funded R&D programmes for the technological performance
of ICT firms themselves? Given the small amount of EU-supported R&D as a share of total
R&D expenditures of large European firms, we do not expect much direct effect on the
technological performance of these firms. However, we examine whether these effects vary
between EU-sponsored agreements in the firms' core sector versus agreements outside the
core sector. Moreover, we ask whether these publicly supported agreements produce effects
similar to that of non-sponsored alliances.
In order to address these issues this paper analyses the agreements of the largest 15 European
electronics firms listed in Fortune 500 between 1984 and 1997. The paper compares EC-
supported agreements with non-sponsored alliances undertaken by the sample firms.
Moreover, the effects of sponsored and non-sponsored agreements on the firm technological
performance are analysed in fourteen sectors. We use as indicator of technological
performance the number of patents filed by the firm in each of these sectors as a share of the
total World patents in the same sectors.
The paper is organised as follows. Section 2 provides a brief discussion of the literature on
R&D alliances. Section 3 illustrates some description of the data and Section 4 analyses the
effects of inter-firm agreements on the technological capabilities of the sample firms. Section
5 closes the paper.
2. The literature and the research hypotheses
Rapid technical change, the convergence of industries, and the rising internationalisation of
markets spur firms’ restructuring and growth, through M&As and strategic partnership (see,
among others, Mytelka, 1995). The implications of inter-firm alliances for the R&D of the
firm have been debated in the literature. Some scholars argue that such agreements stimulate
opportunistic behaviour and R&D under-investment because of information asymmetries
(Katz and Shapiro, 1985). Moreover, R&D alliances may give rise to problems of
appropriability, information asymmetries, and coordination failures which increase transaction
costs (Pisano, Russo and Teece, 1988; Porter and Fuller, 1986; Bleeke and Ernst, 1992).

4
On the other hand, other scholars point out that R&D collaborations increase the private
incentives to conduct R&D and, therefore, to correct the imperfections in the market for
knowledge (Baumol, 1990). More precisely, the main benefits of R&D collaborative
agreements are represented by risk sharing, exploitation of economies of scale and scope,
reduced duplication of research efforts, access to complementary assets and reduction of time
to market (Teece, 1986; Jorde and Teece, 1990). Finally, another reason for undertaking R&D
collaboration is that firms may acquire new capabilities and improve their ability to monitor,
absorb and exploit external knowledge (Cohen and Levinthal, 1989; Rosenberg, 1990).
The empirical evidence shows that the number of international R&D alliances has grown at an
annual average rate of 10.8% between 1980 and 1994, and the percentage of R&D agreements
has recently reached 10-15 per cent of all agreements (Narula and Hagedoorn, 1998). There is
also evidence of a relative growth in the use of non-equity agreements (strategic alliances)
compared with equity alliances (such as joint ventures) (Hagedoorn, 1996). This can be
explained by the fact that strategic alliances require less fixed costs than JVs and probably
reduce the conflicts between partners that stem from problems of reconciling rent-sharing and
different time horizons. Moreover, EU firms tend to engage in R&D alliances in sectors where
they have not comparative advantages. Finally, in the 1990s non-subsidised agreements
among European firms have dropped while those between European firms and US firms have
increased (Narula and Hagedoorn, 1998).
Given that firms, particularly those operating in high tech sectors, rely increasingly on
international R&D collaboration, why then should the EU sponsor R&D collaborations among
European firms? One reason is the stimulation of collaboration among European firms to help
them to reach a minimum efficient scale of R&D operations and to reduce the technical gap
with the US and Japanese leaders3. The first generation of EU-sponsored programmes
launched between 1984 and 1988 has probably helped European firms, especially small firms,
to gain access to complementary capabilities or join international networks. These EU-
sponsored projects were pre-competitive, fell within the core business areas of the
participating firms and focused on niche technologies (Mytelka, 1995).
In subsequent years, the EU has favoured joint R&D which aims to the development of
‘useful’ technologies, closer to market needs. But this raises the question of why the EU is

5
subsidising R&D activities that firms would probably conduct in any case, given the
proximity of the research with market needs. A rationale for this type of EU intervention is
that the development of applications in new fields such as electronic commerce requires high
costs associated with investments in quasi-public goods (e.g., network facilities and training)
and brings about a high risk of failure because the information about the benefits of these
applications is limited and both users and producers of these applications can be locked into
an inferior technology. A lack of co-ordination between users and producers of these new
applications then could give rise to a market failure that the policy-maker can correct by
subsidising joint R&D that involve users. The problems of co-ordination are particularly
significant in Europe, because of linguistic, cultural and institutional barriers across countries.
It is worth noting that a large share of alliances analysed in this paper concern user-producer
relationships (e.g., electronics equipment firms and chemicals or automobile manufacturers)
where such co-ordination problems are expected to occur.
A key question is whether EU-sponsored agreements have really helped European firms to
coordinate their R&D efforts, to exploit potential synergy and to reduce substantially the gap
with their US and Japanese counterparts.
A recent study on the semiconductor industry shows that, despite the EC support to infra-
European R&D collaboration, European firms have continued to rely mostly on collaborative
linkages with US or Japanese companies, which still represent their main source of technology
(Hobday, 1997). According to Hobday, this suggests that the EU programmes did not affect
the technological strategy of European firms. Moreover, the pattern of international R&D
agreements of the European semiconductor firms between 1980-84 and 1985-1991 suggests
that these firms shifted from passive forms of technological agreements to more active forms
(Hobday, 1997). This evolution in the patterns of technological agreements may indicate a
growth in technological capabilities of the European firms. The evidence provided by Hobday
does not clarify to what extent this improvement of capabilities depends upon the
participation in joint R&D programmes sponsored by the EU or whether it is due to other
factors (in-house R&D and learning associated with non-sponsored agreements). Our paper
aims to test this hypothesis and to accomplish this purpose we compare the patterns of EU-
sponsored agreements with non-sponsored agreements and their implications for the
technological performance of the firm. Moreover, unlike earlier works we adopt a measure of

6
technological performance, which is the share of a firm's patent applications in the total world
patent applications in different technological fields.
3. The empirical analysis
3.1. Data and methodology
We have selected the largest European electronics firms listed in 1997 Fortune 500. For these
15 firms we collected information, from the CORDIS database, on the participation in the EU
programmes centred upon ICT (e.g., ACTS, Advanced Communications Technology and
Services, ESPRIT, European Strategic Programme of Research in Information Technology,
TELEMATICS, and Eureka) (CORDIS, 1998). Between 1984 and 1998 the sample firms
were involved in 2,240 R&D agreements with more than 5,000 partners. It is worth noting
that although in theory non-European firms are allowed to take part into EU-subsidised R&D
programmes, we found only seven US partners and one from Japan.
After elimination of inconsistencies and errors in the original database, we structured a
qualitative data set which contains the following information for each project: the starting
date, the partners involved and their respective home countries, and the main industrial sector
(we assigned each project to a four-digit industry by using the US Standard Industrial
Classification, 1987 revision).
Moreover, we collected information on over 1,970 non-sponsored R&D agreements (JVs,
licensing agreements and other R&D or technology-related agreements) undertaken by the
sample firms during the period 1984-1997. The database called ARGO contains information
about events (agreements, growth operations, and corporate reorganisations) reported in a
large set of trade journals, magazines and other specialised press. Events information was
drawn from IAC's Insite Promt database (http://www.insitepro.com) for the period 1993-1998.
We have collected similar information for the period 1984-1992 from Predicasts F&S Index
database. We also collected information about the number of subsidiaries by industrial sector
from Dun & Bradstreet's Who Owns Whom database for the year 1983. Finally, we collected
information about the technological performance of the sample firms between 1970 and 1996.

7
The technological performance of the firm is measured by US patents as classified by SPRU,
University of Sussex.
In order to analyse the effects of agreements on technological capabilities we classified both
agreements and capabilities in 14 broad sectors. This aggregation has also the advantage of
yielding results which are relatively easy to interpret.
Patent data were grouped into 14 technological sectors by using the SPRU 34 technological
classes (see Table A.1 in the Appendix). The 14 sectors reported in Table A.2 in the Appendix
represent the largest single sectors among the SPRU 34 classes. Overall, they account for
more than 47,000 patents or about 90 per cent of the sample firms' total patents between 1970
and 1996.
As far as agreements are concerned, we obtained 14 sectors by means of cluster analysis. To
this end we drew from the IAC Promt database all the articles which report on all strategic
alliances, licensing agreements, M&As, and new subsidiaries occurred in selected countries in
1998.4 The articles were in total 36,451.
IAC's Insite Promt database attaches to each article one or more four-digit SIC codes to
identify the sector (s) involved in the article. This information allows us to calculate how
many times two distinct SIC sectors are jointly reported in the sample articles. This leads to
3,568 pairs of four-digit sectors and 6,748 joint frequencies on 627 different 4-digit sectors.
To simplify, we focused on 3-digit sectors and obtained 109 pairs of sectors on 227 different
3-digit sectors.5
Since the sample firms have been involved in only 129 3-digit sectors between 1984 and
1997, we focused our analysis on these 129 sectors, which give rise to 5,940 joint frequencies.
We then used these data to obtain 14 groups of related sectors through cluster analysis. The
clusters obtained by using the centroid method and cosine similarity distance maximise the
variance between groups while minimising the variance within groups.

8
Tables A.3 in the Appendix shows the 14 clusters and Table A.4 shows the 3 digit SIC codes
associated to each cluster. For each 3-digit SIC code the number of links with other 3-digit
SIC codes in the same cluster is indicated.
3.2 Preliminary analysis
We classified the collaborative agreements stipulated by the sample firms into two categories:
• Private agreements- AG (technological joint ventures and strategic alliances);
• EU sponsored agreements - CORDIS.
Table 1 and Figure 1 show the evolution of agreements and patents of the sample firms as a
whole. The increase of AG in the 1990s showed by our data is in line with earlier empirical
studies (Hagerdoorn, 1996).6 Also CORDIS agreements increases over time.
Table 1: Patents and agreements
Year 84 85 86 87 88 89 90 91 92 93 94 95 96 97 TotalAG 88 80 88 85 61 68 66 48 132 168 195 351 204 337 1971CORDIS 88 61 113 30 119 213 187 75 375 189 140 174 290 192 2246Patents 1717 1846 1879 2496 2353 2792 2366 2390 2219 2178 2255 2254 2429 - 29147
Figure 1: Evolution of agreements and technological performance
0
50
100
150
200
250
300
350
400
84 85 86 87 88 89 90 91 92 93 94 95 96 97
Year
N°AG-Cordis
0
500
1000
1500
2000
2500
3000
N°Patent
Patent AG Cordis

9
Technological capabilities
Patents are a fairly good proxy for technological capabilities of the firm. Even though in some
technological fields, such as software, patents are not used as an instrument to protect
inventions, they represent indicator strongly correlated with other measures of technological
efforts such as R&D expenditure (Griliches, 1990). Moreover, patent represent the most
codified part of a firm technological knowledge. Technological capabilities, which are a
source of sustained competitive advantage for the firm, rely on both codified knowledge (to
the extent that this can be protected by intellectual property right) and tacit knowledge and
organisational routines, which cannot be patented but are difficult to replicate and imitate
(Barney, 1991). This limitation notwithstanding, however, patents are the most reliable
instrument to measure the diversification of technological activities. Alternative measures
such as the classification of R&D expenditures by line of business are only available for US
firms. Moreover, also R&D-based measures have their limitations, including the classification
criteria adopted, which are based on industrial classification (SIC) rather than technological
classification (e.g., IPC).
Our data show that patents applications of the sample firms overall increased significantly in
the second half of the 1980s and remained stable (if not decreased) afterwards. The only
exceptions to this trend are Nokia and Ericsson, whose patent applications increased steadily
over the period examined.
Table 2 shows the relative importance of each sector in the firms technological and business
activities. The sectors where most of the sample firms’ technological activities were centred
before 1984 are Telecommunication equipment (class 6), Instruments and Controls (class 4),
Electrical Devices and System (class 7) and Image and Sound Equipment (class 5). These four
sectors represent overall about 48% total patents (note that patents do not measure
competencies in software). 7

10
Table 2: Sector statistics
Variables (shares)Sector/Technology
CORDIS(84-97) AG (84 –97) 1983subsidiaries
SPRUclasses
share in totalpatents
(1969-83)1 0.009 0.046 0.046 18 0.0212 0.005 0.001 0.01 16 0.0293 0.034 0.048 0.205 14 0.0834 0.065 0.035 0.179 30 0.1245 0.007 0.07 0.005 28 0.0956 0.249 0.307 0.055 24 0.177 0.015 0.06 0.044 26 0.0988 0.099 0.146 0.013 27 0.0889 0.279 0.116 0.026 9 0.01410 0.173 0.118 0.032 25 0.0611 0.015 0.019 0.019 33 0.00912 0.023 0.003 0.001 4 0.02913 0.01 0.015 0.019 13 0.04314 0.016 0.011 0.325 31 0.015Total 0.999 0.995 0.979 0.878
Tables 3 and 4 show substantial differences across the sample firms in the patterns of
technological activities measured by US patent applications. As expected, Siemens and
Philips appear as the most diversified firms; Ericsson and Racal show a marked concentration
of technological activities in telecommunications. Finally, it is worth noting the increase in
R&D intensity (R&D/sales) for Ericsson and Nokia.
Table 3: Technological Diversification (US patents)Firm Herfindahl Specialisation Ratio Main Sector RTA
1984-90 1991-96 1984-90 1991-96 1984-90 1991-96 1984-90 1991-96ABB 0.135 0.139 0.169 0.194 18 18 0.941 0.967Alcatel 0.170 0.221 0.351 0.426 24 24 0.790 0.805Bull 0.251 0.487 0.483 0.703 27 27 0.816 0.816EMI 0.169 0.166 0.195 0.215 26 25 0.699 0.671Ericsson 0.260 0.474 0.475 0.677 24 24 0.840 0.873GEC 0.181 0.178 0.303 0.331 18 30 0.825 0.619Nokia 0.210 0.286 0.263 0.524 24 24 0.729 0.839Philips 0.145 0.153 0.227 0.258 25 28 0.660 0.631Racal 0.298 0.303 0.494 0.446 24 24 0.846 0.813Schneider 0.258 0.246 0.418 0.359 24 26 0.821 0.794Siemens 0.137 0.118 0.194 0.184 18 18 0.694 0.842Thomson 0.155 0.207 0.235 0.402 24 28 0.705 0.746Average 0.197 0.248 0.317 0.393 0.781 0.785s.e. 0.056 0.122 0.085 0.121 0.057 0.071

11
Table 4: Firm sales and R&D Expenditures ($ millions)Firm Sales R&D Expenditure R&D/Sales
1984-90 1991-96 1984-90 1991-96 1984-90 1991-96ABB 18974 30231 1540 2468 0.08 0.08Alcatel 17232 30347 1497 2019 0.09 0.07Bull 3689 5177 391 372 0.11 0.07EMI 4943 6617 77 30 0.02 0Ericsson 5183 12849 683 2039 0.13 0.16GEC 8889 9953 1042 837 0.12 0.08ICL 1293 2243 222 97 0.17 0.04Nixdorf 2006 936 369 172 0.18 0.18Nokia 3596 6565 215 578 0.06 0.09Olivetti 5286 5662 280 266 0.05 0.05Philips 24377 35367 2026 2113 0.08 0.06Racal 2092 2193 93 125 0.04 0.06Schneider 3042 7390 329 798 0.11 0.11Siemens 26894 55119 2903 4977 0.11 0.09Thomson 10105 13277 653 762 0.06 0.06Average 9173 14928 821 1177 0.09 0.08s.e. 8529 15658 828 1344 0.1 0.09
In general, the technological specialisation of our firms, calculated with the Herfindhal index
(H) and the specialisation ratio (SR), increased between the 1980s and the 1990s. The ranking
of technologies remained mostly the same for the period 1970-83.
Table 5 illustrates patent applications filed by the sample firms as a share of the world patent
applications in selected technological fields during the period 1960-1996. These shares
measure the technological performance of the sample firms. The performance in
telecommunications is significant and stable over time. The performance in electrical devices
and systems is also relatively positive and increasing over time. The performance in
computers and semiconductors is poor and declining over time.8
Table 5: Shares of the sample firms in world patent applications to the US Patent OfficeSpru Classes 1969-83 1984-90 1991-9624 Telecommunications 0.261 0.219 0.27430 Instrum.&control 0.191 0.170 0.21328 Image&sound equipm. 0.152 0.100 0.13426 Electrical devices&syst 0.207 0.226 0.25727 Calculators, computers 0.125 0.070 0.10414 General elect ind appar. 0.179 0.109 0.14625 Semiconductors 0.175 0.079 0.14113 Non electrical ind equip 0.171 0.185 0.15916 Metallurgical equip 0.148 0.094 0.14931 Misc metal products 0.135 0.136 0.18833 Dentistry and surgery 0.159 0.202 0.18118 Nuclear reaction 0.490 0.287 0.2639 Materials 0.071 0.044 0.072

12
12 Apparatus for chem. etc 0.099 0.063 0.104
Agreements
The sectors where most EU-sponsored R&D agreements are concentrated are Software (sector
9), Telecommunications (sector 6), and Semiconductors (sector 10), which represent about
70% of total agreements.
The majority of non-sponsored agreements also centred on these sectors, with
telecommunications (sector 6) emerging as the leading sector, followed by Computers (sector
8), Semiconductors (sector 10) and Software (sector 9) (see Table 2 above).
The commercial activities of the sample firms before 1984, proxied by the number of
subsidiaries in 1983, appear to be more diversified than agreements. The largest four sectors -
Transportation and Electrical Equipment (sector 3), Aircraft and Precision Instruments (sector
4), Telecommunication (sector 6), and Energy (sector 1) - account for about 48% of total
subsidiaries in 1983. But, unlike agreements, a large share of subsidiaries was classified in
miscellaneous sectors (14). This indicates that after 1984 the largest European electronics
firms have focused their activities on fewer core sectors, even though during the period
between 1984 and 1997 both non sponsored and EU-sponsored agreements have become
more diversified over time (see Table 6).
Table 6 Diversification of private and EU-sponsored agreements
Herfindhal Specialisation RatioYear 1984-90 1991-97 Private Agreements (AG) EU Funded Agreements (Cordis)
AG Cordis AG Cordis 84-90 MainSector
91-97 MainSector
84-90 MainSector
91-97 MainSector
ABB 1.000 0.300 0.231 0.153 - - 0.425 1 0.4 14 0.261 14Alcatel 0.550 0.289 0.493 0.278 0.731 6 0.688 6 0.425 6 0.452 6Bull 0.454 0.336 0.312 0.287 0.610 13 0.500 13 0.495 14 0.479 14EMI 0.250 0.280 0.213 0.556 0.375 12 0.316 8 0.4 6 0.667 7Ericsson 0.374 0.632 0.573 0.354 0.571 6 0.746 6 0.773 6 0.541 6GEC 0.136 0.197 0.291 0.148 0.240 6 0.483 6 0.311 14 0.238 14ICL 0.240 0.367 0.366 0.452 0.300 6 0.514 14 0.488 14 0.634 14Nixdorf 0.497 0.355 0.643 0.338 0.607 14 0.786 13 0.529 14 0.509 14Nokia 0.219 0.325 0.343 0.466 0.385 6 0.561 6 0.385 6 0.627 6Olivetti 0.325 0.332 0.244 0.300 0.482 13 0.340 13 0.458 14 0.488 14Philips 0.190 0.171 0.150 0.165 0.311 8 0.223 8 0.254 14 0.249 6Racal 0.438 0.556 0.398 0.375 0.636 6 0.560 6 0.667 14 0.500 14Schneider 1.000 0.556 0.333 0.148 - - 0.500 11 0.667 6 0.231 6Siemens 0.227 0.161 0.151 0.159 0.398 6 0.293 6 0.228 14 0.230 14Thomson 0.228 0.239 0.190 0.187 0.371 14 0.269 6 0.351 14 0.262 6Mean 0.409 0.340 0.329 0.291 0.463 0.480 0.455 0.425
13
St.Err 0.269 0.141 0.148 0.132 0.153 0.173 0.155 0.163
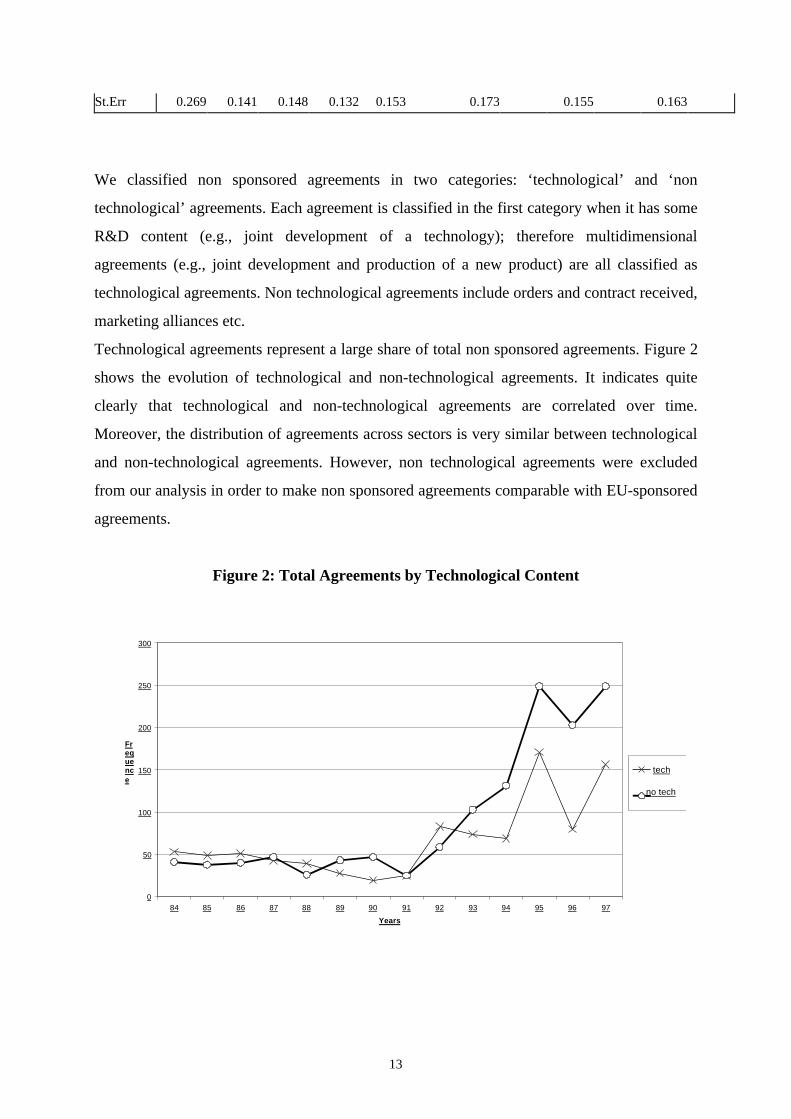
We classified non sponsored agreements in two categories: ‘technological’ and ‘non
technological’ agreements. Each agreement is classified in the first category when it has some
R&D content (e.g., joint development of a technology); therefore multidimensional
agreements (e.g., joint development and production of a new product) are all classified as
technological agreements. Non technological agreements include orders and contract received,
marketing alliances etc.
Technological agreements represent a large share of total non sponsored agreements. Figure 2
shows the evolution of technological and non-technological agreements. It indicates quite
clearly that technological and non-technological agreements are correlated over time.
Moreover, the distribution of agreements across sectors is very similar between technological
and non-technological agreements. However, non technological agreements were excluded
from our analysis in order to make non sponsored agreements comparable with EU-sponsored
agreements.
Figure 2: Total Agreements by Technological Content
0
50
100
150
200
250
300
84 85 86 87 88 89 90 91 92 93 94 95 96 97
Years
Frequence
tech
no tech

14
Finally, as table 7 clearly shows, US and Japanese firms represent the most frequent partners
of our firms in non sponsored alliances.
Table 7: Nationality of partners in non sponsored agreementsCountry
Firm USA Japan UK France Germany Others Total
ABB 18 5 5 0 0 54 82Alcatel 51 11 6 9 7 41 125Bull 47 16 6 17 7 39 132EMI 18 2 6 2 0 6 34Ericsson 93 11 7 4 4 72 191GEC 22 1 28 14 3 24 92ICL 32 4 20 5 7 30 98Nokia 31 9 8 3 3 49 103Olivetti 38 15 4 12 3 70 142Philips 146 72 23 13 19 89 362Racal 14 0 18 1 0 10 43Schneider 3 0 2 2 0 6 13Siemens 205 41 34 25 37 238 580Nixdorf 18 2 1 0 3 26 50Thomson 50 28 20 24 14 61 197Total 786 217 188 131 107 815 2244Shares 0.35 0.10 0.08 0.06 0.05 0.36
4. The association between inter-firm alliances and firms’ technological capabilities
A comparison between sponsored and non-sponsored agreements
This Section explores the effects of EU-sponsored and other non-sponsored agreements on the
sample firms’ technological capabilities within and across the 14 sectors discussed before.
The dependent variable is the share of firm “i” in the world patents filed to the US Patent
Office in sector “j”, year t (PATi,j,t=(Pij/Pwj)t ).9
To analyse the effects of both AG and CORDIS agreements on the technological capabilities
of the firm we distinguished between agreements in the firm's core sector and agreements
outside the core sector. The core sector is defined here as the combination of the two most
important sectors in terms of number of 1983 subsidiaries (at the three-digit SIC level). The
distinction is based on the assumption that R&D agreements in the firm's core sectors reveal a
strategy of incremental competence development along the line of its basic capabilities. By
contrast, R&D agreements outside the core business indicate a strategy of competence
diversification, which can be either offensive or defensive. For instance, a firm like Olivetti

15
during the 1990s has tried to recover from a serious crisis by restructuring and diversifying its
activities.
Patent shares were regressed on the following set of (lagged) explanatory variables:
• AG = Private agreements in the core sectors
• CO= CORDIS agreements in the core sectors
• OTHAG= Private agreements outside the core sectors
• OTHCO= CORDIS agreements outside the core sectors
• PATPERC= Patent Share of sector "j" in firm "i" 1983 patent stock
• RDCORE= annual R&D Expenditures in the core sectors (total R&D expenditures times
the annual share of patents in the core sector).
• LOGSALES= Log of firm's sales
We tested the following econometric model
PATi,j,t+1= β1AGi,t +β2COi,t+β3OTHAGi,t+β4OTHCOi,t
+β5RDCOREi,t+β6LOGSALESi,t+β7PATPERCi,j+ εi,t (4.1)
This is a panel data model of 2,940 observations (14 years, 15 firms and 14 sectors), with the
PATPERC variable capturing the fixed firm effects. Note that, unlike PATPERC, RDCORE
varies over time. Preliminary F-tests rejected the hypothesis of time fixed effects while the
Hausman test rejected the presence of random effects.10
Table 8 shows the results of the regression analysis. The main effects of the regressors can be
summarised as follows.
Table 8: The effects of sponsored and non-sponsored agreements on technologicalperformance
R Square Adj. R Square Std. Error.906 .904 3,113E-03
CoefficientsRegressor B Std. Error t p-value
LOGSALES 2.711 1.892 1.433 0.152AG 1.081 0.803 1.346 0.178
OTHAG 3.238 0.855 3.786 0.000CO 1.134 0.708 1.601 0.109
OTHCO 0.957 0.710 1.349 0.177

16
PATHPERC 1.004 0.068 14.776 0.000RDCORE 1.556 0.771 2.018 0.044
1. The EU sponsored agreements (in the core or in non-core sectors), do not have any
significant effects on the technological performance of the firm. These findings suggest
that the largest European electronics firms do not participate in sponsored network to
conduct new research or to acquire new technological capabilities. They have probably
different purposes such as monitoring new technological startups, to strengthen previously
established collaborative links, to test prototypes and try new applications of their existing
technologies. It is worth noting that when we regressed CORDIS agreements on business
diversification (measured by firm subsidiaries in different three-digit SIC sectors) we
found significant positive effects. This reinforces the idea that EU sponsored agreements
for these firms are probably a way to exploit their knowledge to entry new businesses
rather than a way to explore new technological trajectories. Unfortunately our data do not
allow seeing what the effects are for smaller firms which take part in R&D networks
sponsored by the EU. Moreover, we cannot rule out that EU-sponsored agreements
produce some positive effects on technological capabilities. Many EU-sponsored joint
R&D projects focus on the development of software technology, standards and ‘generic’
architectures for the provision of services (e.g., multimedia services based on mobile
communication platforms). The output of these projects is difficult to protect from
imitation by means of patents. This could explain why the use of EU-sponsored
agreements has weak technological effects measured by patents. Therefore, most probably,
the participants to these EU sponsored projects have also improved their knowledge, but it
is unlikely that these improvements result in patented inventions. For instance, many
participants in TAP (Telematics Applications Programme) expected significant results
from the collaboration in terms of new or improved telematics applications and systems.
As a matter of fact, many demonstrators, prototypes, new and improved products,
subsystems and services have been produced under this Programme. However, the main
technological achievements of TAP are represented by standards, software and services
while new (hardware) products made a negligible contribution to this Programme, as
demonstrated by the insignificant share of patent applications and grants associated to its
various projects (SPRU, 1999).

17
2. Private technological agreements have a significant and strong effect on technological
performance, particularly those in non-core sectors. The estimates clearly indicate that
private agreements outside the firm's core sectors increase the technological performance
of the firm. We analysed the effects of agreements in specific sectors and found that some
positive effects of private R&D agreements on the firms' technological performance can
be clearly associated with technological complementarities and cross-fertilisation among
sectors and technologies11. For instance, we found positive effects by agreements in
'telecommunications on general electrical industrial apparatus' technologies (class 3)
which can be in part explained by the importance of 'energy storage' technologies (which
belong to class 3) for mobile phones. This example shows that our firms set up links in a
downstream sector (mobile phone) to build up capabilities in upstream technologies that
are critical for the competitiveness in the downstream sector itself (other examples are
illustrated in the Appendix).
3. These results confirm the importance of cumulativeness and path-dependence in firms'
technological activities, as showed by the strong effects of past technological activities
(PATPERC and RDCORE) on present technological performance. It is also important to
note that the results discussed before indicate that private agreements have an additional
effects beyond that of internal accumulation of capabilities, measured by R&D
expenditures and the pre-sample patent stock. 12 This indicate that the both internal and
external channels of knowledge accumulation product significant effects on the
technological performance of the firm.
4. Skill Complementarity
How can we explain the different effects of private and sponsored agreements on the
technological performance of the sample firms? Why the technological complementarities
and cross fertilisation discussed before did not show up in joint R&D sponsored by the EU?
As mentioned above, it is possible that with sponsored agreements the sample firms pursue
objectives different than the production of new technological knowledge (exploitation of
existing technologies rather than exploration of new ones). Another possible explanation is
that firms use sponsored agreements to develop knowledge which is not appropriable by
means of patents - e.g., software. As a matter of fact, a large share of EU-sponsored
agreements concerns software technology. Their potential effects on the technological
capabilities of the firm cannot be measured by our indicator. However, the analysis of the

18
effects of EU-sponsored agreements in software reveals that these agreements did not produce
any effect on other related technologies such as telecommunications or computing.
Furthermore, EU-sponsored agreements in other sectors (telecommunications and
semiconductors) where the bulk of these agreements is concentrated do not produce any
technological effect either.
A further explanation of the different effects observed is that private agreements offer greater
opportunities to exploit the knowledge spillovers and technological complementarities
compared with sponsored agreements. These opportunities in turn should arise from a greater
degree of complementarity among the partners. The implications of competence
complementarity for the outcome of joint R&D has been discussed at length in the literature
(see, for example, Teece, 1992). When competence complementarity is high partners tend to
share their capabilities and this in turn favours 'synergy' and innovation. By contrast, partners
with similar technological capabilities tend to sign agreements which aim primarily to share
R&D costs rather than to exploit 'synergy'. This reduces the potential innovative outcome of
these agreements (Sakakibara, 1997).
Complementarity can be defined on a purely technological ground, as in the case of two
partners with co-specialised technical capabilities (e.g., software and semiconductors).
Complementarity can be defined in a broader sense by including non technological
capabilities. For instance, the agreements between a firms specialised in semiconductors and
another one with expertise in system integration and assembling of electronic equipment for a
specific market niche.
Our data do not allow to test directly the hypothesis of complementarity, but we can try an
indirect test by assuming that the level of complementarity (broadly defined) in agreements
between European and non EU firms (US and Japanese) is greater than that in agreements
among European partners. A basic source of complementarity between many European firms
and their US and Japanese counterparts is simply represented by their different specialisation -
marketing and servicing capabilities in the European markets Vs. technological and
organisational capabilities in semiconductors or computers respectively. Another source of
complementarity between EU and non European firms is mostly technical. An example of
such complementarity is represented by the strategic alliance between Ericsson, the world's
largest supplier of switching systems, and Tandem Computers, a market leader in open
parallel processing reliable client server solutions and enterprise networks. The deal signed in

19
1995 enabled Ericsson to integrate Tandem's Unix platform into its future products. The
agreement also concerned the incorporation of present and future Tandem computing
solutions for Unix systems into Ericsson's future AXE solutions.
Since EU-sponsored agreements do not involve extra-European partners we have to focus our
analysis on private agreements and distinguish between infra-European agreements and extra-
European ones. The latter are defined as those alliances with at least one extra-European
partner.
Over 66% of private alliances in our dataset include two partners, 23% three partners and 11%
more than three partners. 59% of agreements with two partners, 63% of agreements with three
partners and 73% of agreements with more than three partners respectively are extra-
European.
We regressed the same dependent variable analysed before (PAT) with the following lagged
regressors:
• RDCORE= R&D Expenditure in the core sector
• LOGSALES= Log sales of firm
• EUAG = Intra-EU private agreements in the core sectors
• EUNOAG = Intra-EU private agreements outside the core sector
• WAG = Extra-EU private agreements in the core sectors
• WNOAG = Extra-EU private agreements outside the core sectors
• PATPERC= Patent Share of Firm "i " in sector "j" calculated with 1983 patent stock
The model tested is the following:
PATi,j,t+1= β1EUAGi,t+β2EUNOAGi,t+β3WAGi,t+β4WNOAGi,t
+β5RDCOREi,t+β6LOGSALESi,t+β7PATPERCi,j + εi,t (4.2)
The results of the regressions reported in Table 9 confirm that extra-European agreements
signed outside the core sector of the firm have a positive and significant effect on
technological performance. These findings support the hypothesis that the level of

20
complementarity among partners drives the effect of non-sponsored agreements on the
technological performance of the firm.

21
Table 9: The effects of agreements with non-EU partners
R Square Adj R Square Std. Error0.906 0.906 3,112E-03
CoefficientsRegressor Beta s.e. t p-valueRDCORE 1.272 0.616 2.065 0.039
LOGSALES 6.800 4.149 1.639 0.101PATHPERC 1.004 0.007 151.330 0.000
EUAG 3.038 2.126 1.429 0.153WNOAG 4.748 1.129 4.206 0.000
WAG 5.160 7.748 0.666 0.505EUNOAG 1.098 1.112 0.987 0.324
5. Conclusions and policy implications
This paper analyses the effects of inter-firm collaboration on the technological capabilities
measured by the patent applications of the largest European electronics firms between 1984
and 1997.
During this period EU firms have continued to rely on non-EU partners, especially North
Americans, despite the rising number of EU-sponsored agreements in the same period. This
suggests that European firms have more incentives to set up links outside the EU in order to
gain access to complementary capabilities and resources (such as technology) which are
mostly possessed by US and Japanese firms.
The regression analysis shows that EU-sponsored agreements have insignificant effects on
technological capabilities.
By contrast, non-sponsored agreements have significant effects on firm ’capabilities in many
technological fields. In particular, agreements with extra European partners signed outside the
core sector show significant effects on the technological capabilities of the sample firms.
How to explain these differences in the effects on the technological capabilities of the firms?
The positive effects of agreements with US and Japanese firms outside the firm's core sector
suggests that the complementarity of capabilities between partners is probably a main factor at
work. By complementarity we mean the presence of co-specialised technical, organisational or
commercial capabilities, e.g. the knowledge of a generic technology such as microelectronic
and the expertise in specific applications such as medical equipment or industrial automation
equipment.
Why non-sponsored agreements among EU firms do not produce in general significant effects
on the technological capabilities of the firm? As in the case of sponsored agreements, the

22
main reason is probably represented by a lack of complementarity among partners. This does
not imply obviously that all non sponsored agreements within the group of European firms
suffer from a lack of complementarity. Consider, for instance, the agreement signed in 1997
by Siemens and EDAP Technomed, a French company specialised in ‘minimally invasive
urological therapy’. This is an example of non-sponsored agreement centred on the
exploitation of skill complementarity. With this alliance the two firms agreed to joint develop
a new urological platform for non invasive diagnosis, combing EDAP’s capabilities in
minimally invasive medical therapies and Siemens’ experience in the field of medical
equipment and image processing. As a result of this agreement in 1998 these two firms were
jointly granted a patent from the US Patent Office concerning a “Method and apparatus for
ultrasound tissue therapy”. Our results however suggest that this example is an exception
more than the rule for non sponsored agreements between European firms.
According to our analysis then two European electronic firms which are identical in all
respects (size, past technological activities etc.) except for the number of Extra-European
agreements, should differ in their technological performance (the firm with a larger number of
agreements should have a larger expected technological performance).
We should warn about some important limitations of our results. One of such limitation is that
our data do not allow observing directly the technological outcome of each agreement. Neither
we can distinguish across agreements of different 'quality', that is agreements with different
technological potentiality or a different degree of complementarity between partners.
Moreover, due to the selection bias of our sample (the largest electronics European firms), we
cannot draw any general conclusion about the effects of EU R&D policies on firms'
technological performance. It is important to remember that the size of EU funds allocated to
joint R&D is very limited compared with the scale of R&D of the largest European electronics
firms. For example, Esprit funds for the period 1984-1994 have an order of magnitude similar
to the R&D expenditures of Siemens in 1990. Moreover, the cumulative contribution of Esprit
to Bull in the 1980s was about 5% of its total R&D expenditures (Mytelka, 1992 and 1995).
Probably, EU-sponsored programmes are more relevant to SMEs and future empirical should
collect more careful information on the implications of these programmes for SMEs. By the
same token, our analysis does not account for the possible effects of EU programmes on users
since we only focus on the generation of technology. If anything, our analysis indicates that

23
EU policies show limited effects on the production of new patented technology. This may
reflect particular problems with the organisation of EU projects in terms of IPR arrangements.
The overall picture emerging from these results suggests that the most successful strategy of
technological learning for large European electronics firms draws on both internal
accumulation of capabilities (as showed by the importance of R&D and past patent
applications) and the acquisition of new knowledge from complementary (and technologically
strong) partners. The evidence presented in this paper suggest that the European Commission
should reconsider carefully its policies towards joint R&D and possibly adopt a more
'outward-looking' approach by allowing the participation of non European firms in EU
programmes. It is worth noting that even though non-European firms are allowed to
participate in EU programmes, the small number of US and Japanese firms involved in these
programmes suggests that extra-EU firms have not enough incentives to join EU R&D
Programmes. And this may be one of the reasons of the poor technological output of these
programmes.
We cannot conclude that the EU policies have distorted the patterns of alliances of the
European electronics firms since these have been involved in a great deal of intra-European
collaboration outside the EU umbrella. However, it is possible that the EU policies have
strengthened the network of intra-European collaboration and therefore reinforced a pattern of
alliances which is not optimal in terms of the accumulation of technological capabilities.
Bibliography
Barney, J. (1991), ‘Firm Resources and Sustained Competitive Advantage’, Journal of
Management, 17 (1), pp. 99-120.
Baumol W.J. (1990), “Technology-sharing cartels”, Working Paper, NY University.
Bleeke J and Ernst W. (1992), “The way to win in Cross Border Alliances”, The McKinsey
Quartely, 1, 113–33
CEC (1993), White Paper on growth, competitiveness, and employment - The challenges and
ways forward into the 21st century, COM(93) 700 final, Commission of the European
Communities, Brussels, 5 December.
CEC (1995), Green Paper on Innovation, Commission of the European Communities,
Brussels.

24
Cohen, W. and Levinthal, D. (1989), “Innovation and Learning: The Two Faces of R&D”,
The Economic Journal, 99, pp. 569–96.
CORDIS, (1998), Programmes’ Database, The Community Research and Development
Information Service, http://apollo.cordis.lu.
Folster S., (1995), “Do subsidies to cooperative R&D actually stimulate R&D investiment and
co-operation ?”, Research Policy, 24, 403–17.
Griliches Z., (1990), "Patent Statistics as Economic Indicators: A Survey", Journal of
Economic Literature, XXVIII, pp. 1661-1707.
Hagedoorn J. And Schakenraad J. (1993), “A Comparison of private and Subsidised R&D
Partnerships in the European Information Technology Industry”, Journal of Common
Market Studies, 31 (3), 373–90
Hagerdoorn J. (1996), “Trend and Patterns in Stategic Technology Partnering Since the early
Seventies”, Review of Industrial Organization, 11, 601–16
Hobday M., (1997), “The technological competence of European semiconductor producers”,
International Journal of Technology Management, Special Issue, pp 1-14.
Information Access Company (1998), Insite Promt Database, http://www.insite.com.
Jorde T.M, Teece D.J. (1990), “Innovation and cooperation: implication for competition and
antitrust”, Journal of Economic Perspective, Vol. 4, N° 3, pp. 75-96
Katz M.L. and Shapiro C. (1985), “On the licensing of innovations” , Rand Journal of
Economics, 16, 504–20.
Malerba, F. and Torrisi, S. (1992), "Internal capabilities and external networks in innovative
activities. Evidence from the software industry", Economics of Innovation and New
Technology, vol. 2, pp. 49-71.
Mytelka L.K. (1995), ‘Dancing with wolves: Global Oligopolies and Strategic Partnerships’,
in Hagerdoorn J. (ed), Technical Change and the World Economy, E. Elgar, Adelshot, 182–
204.
Mytelka, L. R. (1992), 'Strenghening the Relevance of European Science and Technology
Programmes to Industrial Competitiveness: The Case of ESPRIT' in Humber, M. (ed),
European Firms and Industries Copying with Globalisation, Pinter, London, pp. ??.
Narula R. and Hagedoorn J. (1998), “Innovating through Strategic Alliances: moving towards
International Partnerships and contractual agreements”, Working Paper, University of Oslo,
Norway.

25
Patel P., Pavitt K. (1994), “Unever (and Divergent) Technological Accumulation among
Advanced Countries: Evidence and a Framework of Explanation”, Industrial and
Corporate Change, 3, 3, 759-787.
Pisano G.P., Russo M.V. and Teece D.J. (1988), “Joint Venture and Collaborative
Agreements in the Telecommunication Equipment Industry”, in Mowery D. (ed.)
International Collaborative Ventures in US manufacturing, Cambridge, Mass., Ballinger,
23–70.
Porter M . and Fuller M., (1986), “Coalitions and Global Strategies”, in Porter (ed.)
Competition in Global Industries, HBS Press, Boston.
Rosenberg (1990), “Why do Firms do Basic Reasearch (with Their Own Money)?”, Research
Policy, 19, pp. 165–74.
Sakakibara M., 1997, “Heterogenity of Firm Capabilities and Cooperative Research and
Development: An Empirical Examination of Motives”, Strategic Management Journal,
vol. 18, pp. 143-164.
SPRU (1999), An Assessment of the Results of the Fourth Framework Telematics
Applications Programme Projects, Science and Technology, a report prepared for EC
DGXIIIC/E, (Policy Research, University of Sussex, Brighton, April.
Teece, D.J. (1986), “Profiting from Technological Innovation: Implications for Integration,
Collaboration, Licencing and Public Policy”, Research Policy, 15, pp. 285–305.
Teece, D.J. (1992), “Competition, Cooperation and Innovation: Organisational Arrangements
for Regimes of Rapid Technological Progress”, Journal of Economic Behaviour and
Organisation, 18 (1), pp. 44-70.

26
APPENDIX
Table A.1. SPRU patent classes1 Inorganic Chemicals2 Organic Chemicals3 Agricultural Chemicals4 Chemical Processes5 Hydrocarbons, mineral oils, fuels and igniting devices6 Bleaching Dyeing and Disinfecting7 Drugs and Bioengineering8 Plastic and rubber products9 Materials (inc glass and ceramics)10 Food and Tobacco (processes and products)11 Metallurgical and Metal Treatment processes12 Apparatus for chemicals, food, glass etc.13 General Non-electrical Industrial Equipment14 General Electrical Industrial Apparatus15 Non-electrical specialized industrial equipment16 Metallurgical and metal working equipment17 Assembling and material handling apparatus18 Induced Nuclear Reactions: systems and elements19 Power Plants20 Road vehicles and engines21 Other transport equipment (exc. aircraft)22 Aircraft23 Mining and wells machinery and processes24 Telecommunications25 Semiconductors26 Electrical devices and systems27 Calculators, computers, and other office equipment28 Image and sound equipment29 Photography and photocopy30 Instruments and controls31 Miscellaneous metal products32 Textile, clothing, leather, wood products33 Dentistry and Surgery34 Other - (Ammunitions and weapons, etc.)
Table A.2 : Sample firms' most important technologiesSPRU Classes Description
24Telecommunications30Instruments and controls28Image and sound equipment26Electrical devices and systems27Calculators, computers14General Electrical Industrial Apparatus25Semiconductors13General Non-electrical Industrial Equipment
4Chemical Processes16Metallurgical and metal working equipment18Induced Nuclear Reactions33Dentistry and Surgery31Miscellaneous metal products
9Materials (inc glass and ceramics)

27
Table A.3: Sectors resulting from the cluster analysis (agreements)
Sectors Description1 Energy2 Metalworking products and machinery3 Transportation and Electrical Equipment4 Aircraft and Precision Instruments5 Broadcasting, Satellite Comm. and Electronic Equip.6 Telecommunication7 Consumer Electronics8 Office and Computing Machines9 Computer Services10 Semiconductors11 Drugs, Pharmaceuticals and Medical Instruments12 Chemicals13 Special Machinery, Plastics and Non Ferrous Metal14 Miscellaneous
Table A.4: Concordance between industrial clusters and 3 digit SIC sectorsCluster N° links SIC Code Description
1 312 491 Electric Utilities1 196 162 Bridge and Tunnel Contruction1 122 492 Gas Utilities1 116 131 Crude Petroleum and Natural Gas1 98 891 Engineering and Architectural Svcs1 98 291 Petroleum1 58 110 Coal1 56 361 Electrical Power Equipment1 16 458 Air Transport Facilities2 222 331 Primary Iron and Steel2 56 354 Metalworking Machinery2 2 332 Iron and Steel Foundary3 406 371 Motorvehicles and Parts3 108 369 Electrical and Electronics NEC3 80 671 Financial Holding Company3 60 362 Electric Industrial Equip.3 58 731 Advertising3 46 301 Tires and Tubes3 28 351 Engines and Turbines3 24 364 Electric Lighting and Wiring3 22 358 Services Industry Machines3 16 349 Fabricated Metal Products NEC3 12 495 Pollution Control3 8 336 Nonferrous Foundries3 8 326 Ceramics and Related Products4 116 372 Aircraft and Parts4 100 382 Measuring and Control Instruments4 92 383 Optical and Analytical Instruments4 74 508 Machinery Equip. And Supplies Whsle4 46 506 Electrical Goods Whsle4 44 335 Non Ferrous Mill Products4 42 356 General Industry Machinery4 10 300 Rubber and Plastic Products4 8 343 Plumbing and Heating Equip.5 340 483 Radio and TV Broadcasting5 296 360 Electical and Electronic Equip.5 276 386 Photographic Equip. And Supplies

28
5 148 484 Satellite Communication5 74 376 Missiles, Space Vehicles and Parts5 44 998 Diversified Company5 30 380 Instruments and Related Products5 20 573 Radio, TV, Music, Electronics Store5 16 454 Commercial Space Services5 16 374 Railroad Equip.5 12 348 Ordnance and Accessories5 8 910 Public Administration and Finance5 4 381 Engineering and Scientific Instr5 2 370 Transport Equip.5 2 334 Secondary Nonferrous Metal5 2 379 Transport Equip. NEC6 932 481 Telecommunication6 650 366 Communication Equip.6 38 401 Railroads6 32 480 Communications6 26 322 Glass Containers6 20 344 Fabricated Structural6 4 494 Water Supply and Use6 2 490 Electric Gas Utilities7 266 365 Consumer Electronics7 100 363 Household appliance7 40 739 Business Services7 34 519 Wholesalers NEC7 16 373 Ship and Boat building7 8 431 Mail Express and Services7 2 824 Vocational Education8 458 357 Office and Computing Machines9 720 737 Computer Services
10 386 367 Electronic Components11 546 283 Drugs and Pharmaceuticals11 454 280 Chemicals and allied Products11 134 384 Medical Instruments and Supplies11 30 800 Health, Education and Welfare11 22 851 Research and Development11 16 299 Petroleum and Energy Products NEC11 2 385 Ophthalmic Goods11 2 738 Contract Packaging Services12 294 286 Organic Chemicals12 224 282 Plastics, Rubber, Fiber12 108 281 Inorganic Chemicals12 54 285 Paints and Allied Products12 52 289 Misc Chemical Products13 304 307 Plastic Products13 114 355 Special Industry Machinery13 108 333 Non Ferrous Metals13 82 330 Metals13 66 350 Machinery Ex-Electric13 40 602 Commercial Banks13 40 347 Metal Plating and Coating13 32 781 Motion Picture and TV Production13 30 394 Toys and Sporting Goods13 24 260 Paper and Allied Products13 22 220 Textile Mill Products13 18 581 Eating Places13 16 270 Printing and Publishing13 4 154 Non Residential Bulding13 4 375 Motorcycles and Bicycles

29
13 2 274 Publishing NEC14 16 329 Misc Non Metallic Mineral Products14 14 275 Commercial Printing14 12 342 Cutlery Hand Tools and Hardware14 4 783 Motion Picture Theatre14 2 478 Bridge, Tunnel14 1 199 Home Gardening14 1 339 Metals Nec14 1 149 Non Metal Minerals Nec14 1 410 Local Intercity Transit14 1 951 Regional Trade Group14 1 930 Local Government14 1 912 Executive Departments14 1 890 Professional Services14 1 769 Electric Motor Repair14 1 605 Banking Related Services14 1 572 Household Appliance Store14 1 496 Steam Supply14 1 833 Job and Vocational Services14 1 470 Transport Services14 1 762 Repair Services NEC14 1 966 Fishery cooperatives14 1 991 Business Method
1 An erlier draft of this paper was prepare for the 'Dynacom' TSER Project, EC DGXII (contract no.SOE1-CT97-1078). We would like to thank Andrea Ala and Sandro Sergiacomo for their contribution to datacollection. We also thank Piero Cavaleri for his suggestions on the design of the database and Pari Patel forproviding us with patent data collected at SPRU. Finally, Benjamin Coriat, Giovanni Dosi, Mike Hobday and EdSteinmulluer have provided useful comments on earlier drafts of the paper.2 Another dimension of the relationship between innovation and agreements is represented by the effects of firms'innovative capabilities (generic or context-specific) on the ability to set up linkages with different organisations(customers, competitors etc.) (Malerba and Torrisi, 1992).3 The stimulus of cooperation is often mentioned in the literature (see, for instance, Folster, 1995).4 The countries selected are the United States, Japan, Germany and India, because they arise as the mostimportant countries in our database from 1993-97. Among 11,905 selected events in our database, 10.555(88%) include at least one of these countries.5 Obviously, the number of matches observed are much smaller than the theoretical matches. The theoreticalcombinations of N (N=129) 3 digit SIC sectors taken 2 at a time is C=N!/[2!(N-2)!]=8,256.This difference is dueto the fact that our firms are active in a relatively limited number of sectors. COLO!!6 Note that ICL and Nixdorf have been taken over by Fujitsu and Siemens respectively. These two firms havebeeen considered separately even after the acquistion. Post-acquisition data have been drawn from theirrespective non consolidated balance sheets.7 See Tables A.1 and A.2 in the Appendix for patent classification and the most important technological classesfor the sample firms.8 The share of patents in nuclear reaction is largely explained by the importance of energy activities for ABB,Siemens and Alcatel.9 It is worth noting that our independent variables are most probably endogenous. We do not have exogenousvariables to instrument our regressors. However to our purposes here we are not interested in causalrelationships. The association between technological capabilities and agreements is by itself an interesting result.10 The Durbin-Watson tests rejects the hypothesis of serial correlation of residuals (DW=2.11).11 The estimates of these effects are not reported in this paper but can be provided by the authors.12 We tried different specifications of some independent variables (e.g., SALES, SALES**2 and PATPERC**2)to account for possible scale and specialisation effects. The results showed in the tables are robust to alternativespecifications of SALES while the effect of PATPERC**2 is not significant.