compensation transparency and managerial opportunism: a study of supplemental retirement plans
TRANSCRIPT

Strategic Management JournalStrat. Mgmt. J., 30: 405–423 (2009)
Published online 1 December 2008 in Wiley InterScience (www.interscience.wiley.com) DOI: 10.1002/smj.737
Received 15 February 2008; Final revision received 15 September 2008
COMPENSATION TRANSPARENCY ANDMANAGERIAL OPPORTUNISM: A STUDYOF SUPPLEMENTAL RETIREMENT PLANS
PAUL KALYTA*Telfer School of Management, University of Ottawa, Ontario, Canada
Existing research on managerial compensation is based primarily on optimal contracting andmanagerial hegemony theories. Under the optimal contracting theory, observed compensationcontracts are optimally determined, aligning the interests of managers and shareholders. Underthe managerial hegemony theory, observed compensation contracts deviate from the optimumbecause top managers with power over boards are able to influence their own pay. I arguethat the impact of managerial power over boards on managerial pay, and hence the deviation ofcompensation contracts from the optimum, is contingent on the transparency of managerial com-pensation. Within this framework, I investigate the impact of supplemental executive retirementplans (SERPs)—historically the least transparent compensation component—on opportunisticdecision making. An empirical analysis based on a time series sample of CEOs of S&P/TSX60firms provides support of the compensation transparency theory. I find that SERP benefits areprimarily driven by variables proxying for CEO power over the board, whereas more transpar-ent compensation components are primarily driven by economic factors. The results also suggestthat CEOs whose SERPs are contingent on firm performance appear to reduce firm R&D expen-ditures as they approach retirement. Both findings provide important contributions to existingresearch on the impact of managerial compensation on opportunistic decisions. Copyright 2008 John Wiley & Sons, Ltd.
INTRODUCTION
The impact of managerial compensation on man-agerial decisions is an important multidisciplinaryresearch subject, with a significant body of the-oretical and empirical knowledge accumulated instrategic management, finance, accounting, humanresources, and labor economics literature. At theheart of the issue is the conflict of interests of cor-porate shareholders and managers and the propo-sition that compensation contracts may resolve or
Keywords: executive compensation; SERP; managerialopportunism; R&D*Correspondence to: Paul Kalyta, University of Ottawa, TelferSchool of Management, 45 Laurier Avenue East, Ottawa,Ontario, K1N 6N5, Canada. E-mail: [email protected]
alleviate the conflict (e.g., Berle and Means, 1932;Jensen and Meckling, 1976). When designed prop-erly, managerial compensation increases the like-lihood of managerial decisions in the best interestsof shareholders. When designed poorly, manage-rial compensation increases the likelihood of man-agerial opportunistic decisions at the expense ofshareholder value.
A distinct feature of observed managerial com-pensation contracts is the variety of remunera-tion options. However, the variety of choices onthe compensation menu is not fully reflected inacademic studies: while some compensation com-ponents are heavily researched, others are lefton the outskirts, often due to lack of publiclyavailable data, or high costs of data processing.
Copyright 2008 John Wiley & Sons, Ltd.
406 P. Kalyta
For instance, despite significant theoretical andempirical advancements in the understanding ofthe roles of ‘traditional’ pay components (suchas base salary, performance bonuses, and morerecently, stock option grants), the research onthe impact of supplemental executive retirementplans (hereafter, SERPs) on decision making isextremely limited at best. Although sizable, com-mon, and not uniformly distributed across man-agers (e.g., Sundaram and Yermack, 2007; Kalytaand Magnan, 2008), SERP benefits are typicallyignored in compensation research due to the histor-ically poor quality of disclosure and nontrivial datacollection. Even measures of total compensationused in professional articles and academic studiesrarely account for this component of managerialpay, underestimating the magnitude of compensa-tion and distorting comparisons among compensa-tion packages.
Because of the unique nature, structure, andregulatory environment of SERPs, exploring theimpact of SERP benefits on managerial decisionsallows making several important contributions tothe literature. In this study, I provide argumentsand evidence that the structure of SERP bene-fits and the quality of SERP disclosure may leadto managerial opportunism. Two prominent casesof managerial opportunism are considered: extrac-tion of rents and reduction in research and devel-opment (R&D) expenditures. In the first case, Iprovide arguments that the manager’s ability toextract rents has a negative association with thetransparency of compensation disclosure. Hence, Ipredict that the manager’s power over the boardhas a stronger association with less transparentpay schemes. Consistent with the prediction, theresults suggest that more transparent compensa-tion components (such as salaries, cash bonuses,and stock option grants) are driven primarily byeconomic variables, whereas SERP benefits—theleast transparent component of managerial com-pensation—are driven primarily by the manager’spower over the board. In the second case, I pro-vide arguments that the manager whose SERPis contingent on firm performance in preretire-ment years is incited to select projects with lowernet present values but higher current earnings toamplify his or her SERP benefits and maximizepersonal wealth. Consequently, I predict reduc-tions in R&D expenditures in final years prior tothe manager’s retirement when SERP benefits ofthe manager are contingent on firm performance
in these years. The empirical results support theprediction.
In addition to providing empirical evidence onthe impact of SERP benefits on managerial deci-sions, the study makes two significant theoreticalcontributions. First, it extends the literature on thenature and determinants of managerial compensa-tion. Most research in this area is based on optimalcontracting and managerial hegemony paradigms.Under the optimal contracting theory, observedcompensation contracts are optimally determined,aligning the interests of managers and sharehold-ers (e.g., Holmstrom, 1979, 1982; Grossman andHart, 1983). Under the managerial hegemony the-ory, observed compensation contracts deviate fromthe optimum, because managers with power overboards are able to increase their own pay (e.g.,Mace, 1971; Finkelstein and Hambrick, 1996;Bebchuk and Fried, 2004). I extend these theoreti-cal developments by applying the concept of com-pensation transparency and providing argumentsthat the impact of managerial power over boards onmanagerial pay, and hence the deviation of com-pensation contracts from the optimum, is contin-gent on the transparency of managerial compensa-tion. The compensation transparency theory makesan important connection between the two dominantcompensation paradigms, suggesting that the opti-mal contracting framework may be more appropri-ate when managerial compensation is transparent,whereas the managerial hegemony framework maybe more appropriate when managerial compensa-tion is opaque.
Second, the study makes an important contribu-tion to the literature on managerial opportunismin long-term projects. Theoretical developmentsin this research area suggest that the managerapproaching retirement would prefer projects withhighest current earnings to projects with high-est net present values (Smith and Watts, 1982).However, empirical results are mixed and incon-clusive: although several studies find some evi-dence of reductions in firm long-term expendituresas the chief executive officer (CEO) approachesretirement (Dechow and Sloan, 1991; Gibbons andMurphy, 1992), others find no such association(Murphy and Zimmerman, 1993; Cheng, 2004). Iextend the theoretical framework by introducing amoderating factor in the relationship between themanager’s horizon and opportunism and providingarguments that the manager’s incentives to reducelong-term expenditures depend on the structure
Copyright 2008 John Wiley & Sons, Ltd. Strat. Mgmt. J., 30: 405–423 (2009)DOI: 10.1002/smj
Compensation Transparency and Managerial Opportunism 407
of his or her SERP benefits. The latter proposi-tion implies, inter alia, that prior empirical testsmay not find patterns of reductions in long-termexpenditures in CEO preretirement years in gen-eral, when in fact such reductions do exist in somecases and do not exist in others, depending on thestructure of CEO compensation.
THEORETICAL DEVELOPMENT
SERPs
SERPs exist in many countries due to govern-mental regulations that limit the size of regulardefined benefit or defined contribution pensions.For instance, in the United States, the annual com-pensation used as a base for calculating regularpension benefits (hereafter, pensionable earnings)is capped at $230,000.1 Consider an executive whoretires in 2008 with a $1,000,000 preretirementbase salary, 30 years of pensionable service, and apension plan that calls for two percent of the pre-retirement base salary multiplied by the numberof years of pensionable service to be paid to theexecutive annually upon retirement. Because of thecap, the executive’s regular pension is limited to$138,000 ($230, 000 × 2% × 30) or 13.8 percentof his or her preretirement salary. Similar limita-tions on the size of regular pensions exist in theUnited Kingdom, Canada, France, and most otherdeveloped economies.
SERPs increase executive postretirement incomebeyond the regular pension. Under a SERP, thefirm makes ongoing payments to the retired exec-utive on top of the regular pension until his orher death or even until the death of the survivingspouse. A SERP is a noncontributory plan: it iscompletely funded by the employer (i.e., execu-tives do not have to save for their SERP benefitswhile working). In essence, SERP benefits are sim-ilar to a postretirement salary. SERP benefits arepaid to retired executives regardless of firm per-formance in the payout years and constitute a partof firm total pension obligations.
A qualitative analysis of executive compensationdisclosures in proxy statements reveals that in mostcases, firms use the following formula to calculate
1 Source: Sections 401(a)(17), 404(l), 408(k)(3)(C), and 408(k)(6)(D)(ii) of the Internal Revenue Code. Each year, the cap isslightly modified to reflect cost-of-living adjustments.
annual SERP benefits: a certain percentage (mul-tiplier) of uncapped pensionable earnings for eachyear of pensionable service to be paid annually to aretired executive. In other words, executives accu-mulate (‘earn’) SERP benefits while working, butreceive SERP benefits only after retirement. How-ever, despite similar accumulation-payout struc-tures, SERPs differ significantly across executives.For instance, in some cases, pensionable earningsare equal to the preretirement salary. In other cases,pensionable earnings also include annual perfor-mance bonuses, making SERP benefits contingenton firm performance in preretirement years. Thelength of the period over which pensionable earn-ings are determined also differs. In some cases,pensionable earnings are equal to the compensa-tion in the final year prior to retirement. In othercases, pensionable earnings are equal to an averageannual compensation over two or more years priorto retirement. Finally, SERPs differ significantlyin specific details: provision for survivor benefits,provision for early retirement, policy on inflationadjustment, policy on the multiplier size, policy onthe accumulation of years of credited service, andso on.
Until most recently, SERP benefits have beenoften referred to in the literature as hidden or‘stealth’ compensation due to poor quality ofSERP disclosure and lack of transparency (Mur-phy, 1999; Bebchuk and Fried, 2004). Accordingto North American executive compensation disclo-sure regulations implemented in 1992–1993 andin place until 2007–2009, firms had to disclosein annual proxy statements the existence of pen-sion plans for the five highest-paid executives aswell as the methods used to calculate the pen-sions. However, firms were not required to disclosedollar values of actual, projected, or accumulatedexecutive pensions and changes in these valuesfrom one year to another. Furthermore, the for-mat of SERP disclosure was not clearly prescribedleading to vague and cumbersome disclosures inmany cases. In contrast, firms were mandated todisclose dollar values for each ‘traditional’ paycomponent (i.e., base salary, performance bonus,etc.) and report them in straightforward compensa-tion tables. As a result, the transparency of SERPdisclosure was substantially inferior to the trans-parency of disclosure of other executive pay com-ponents. The following excerpt from BombardierInc.’s 2002 proxy statement illustrates a typical
Copyright 2008 John Wiley & Sons, Ltd. Strat. Mgmt. J., 30: 405–423 (2009)DOI: 10.1002/smj
408 P. Kalyta
SERP disclosure resulting from 1992–1993 dis-closure regulations.
Senior Officers, including the Named ExecutiveOfficers, participate in two non-contributorydefined benefit pension plans. Benefits payablefrom the basic plan correspond to 2% of averageearnings in the three continuous years of serviceduring which they were paid their highest salary(up to a maximum salary of $86,111) times thenumber of years of credited service.
Since January 1, 2001, the supplemental plan pro-vides (depending on the management level) foradditional benefits of 1.75% of average earningsin excess of $86,111 times the number of yearsof credited service or 2.25% or 2.50% of averageearnings times the number of years of credited ser-vice, less the pension payable from the basic planand any benefits payable from other pension plansof the Corporation. Benefits are reduced by 1/3 of1% for each month between the date of early retire-ment and the date of a participant’s 60th birthdayor, if earlier, the date at which the participant’s ageplus his years of credited service total 85. No ben-efits are payable from the supplemental plan if aparticipant has not completed five years of service
. . . . Upon the death of a participant, the spouse willbe entitled to a benefit equal to 60% of the ben-efit to which such participant was entitled. If theparticipant has no spouse at the time of retirement,the benefits will be paid, after death, to the desig-nated beneficiary until such time as 120 monthlyinstallments, in the aggregate, have been paid tothe participant and to the designated beneficiary.
All benefits payable from these plans are in addi-tion to government social security benefits. Onlybase salary is taken into consideration in calculat-ing pension benefits.
Years of credited service as at January 31, 2002for each of the Named Executive Officers here-after mentioned are: Robert E. Brown 15 years,Carroll L’Italien 8 years and 1 month, Louis Morin19 years and 4 months. (Bombardier Inc., 2002: 8)
The example clearly shows the lack of SERPtransparency. First, the firm did not disclose dollarvalues of executive pensions. Second, the infor-mation disclosed in the proxy statement was notsufficient to estimate these values. To estimate themagnitude of SERP compensation, one had to col-lect additional information about executives (age,marital status, age of spouse, historical compensa-tion) from other sources, make numerous actuarial
assumptions, and perform actuarial calculations: anontrivial, time-consuming, and costly task.2
As a result of nontransparent disclosure and highcost of data collection, for decades, SERP ben-efits have been omitted from measures of totalexecutive compensation employed in professionaland academic literature. Early exceptions are lim-ited to several publications based on unrepresen-tative samples from the 1960s and 1970s. Burgess(1963), Lewellen (1968), Masson (1971), andAntle and Smith (1985) estimate values of execu-tive pensions and incorporate pension increments(annual changes in accumulated pensions) intototal compensation alongside other compensationcomponents. None of these publications focusesspecifically on executive pensions. More recently,Bebchuk and Jackson (2005) provide a descrip-tive analysis of SERPs for two groups of CEOs ofStandard & Poor’s 500 firms: those already retiredand those expected to retire. The study finds thatSERP benefits are sizable and not uniformly dis-tributed across CEOs. The mean actuarial valueof CEO SERP at retirement is $15.1 million forCEOs already retired and $19.6 million for CEOsabout to retire. Using a sample of CEOs of For-tune 500 firms, Sundaram and Yermack (2007)also confirm that SERP benefits are common andsignificant. Seventy-eight percent of CEOs in thesample have SERP arrangements. The mean pen-sion increment is $0.9 million, which equals thebase salary and represents almost 40 percent oftotal CEO cash compensation. Kalyta and Magnan(2008) obtain similar statistics for a sample of thelargest Canadian firms.
Poorly disclosed SERP benefits provide a uniquecase to study the quality of compensation dis-closure and its impact on managerial decisions.Bebchuk and Fried (2004) argue that due to vaguedisclosure, SERPs may be used by powerful exec-utives to increase their own compensation off theradar screen of shareholders. Kalyta and Magnan(2008) provide preliminary evidence that SERPs
2 On 22 December, 2006, the Securities and Exchange Commis-sion (SEC) adopted new regulations on executive compensationdisclosure in the United States. The regulations taking effect in2007 and replacing the 1992 policies require firms to disclosemore details on executive pay. According to the new regulations,the firm must disclose not only the description of executive pen-sion plans but also the dollar values attached to them. Annualchanges in accumulated pensions must be included in summarycompensation tables alongside other executive compensationcomponents. In Canada, similar executive compensation disclo-sure regulations are to take effect in 2009.
Copyright 2008 John Wiley & Sons, Ltd. Strat. Mgmt. J., 30: 405–423 (2009)DOI: 10.1002/smj
Compensation Transparency and Managerial Opportunism 409
may be related to measures of CEO power. Thisstudy focuses on SERP benefits to provide furthertheoretical and empirical perspective on the role ofcompensation transparency in managerial oppor-tunistic behavior. Two prominent examples ofmanagerial opportunism are considered: the man-ager’s ability to increase his or her own compen-sation, and reductions in firm R&D expenditures.
Managerial opportunism
Rent extraction
Existing research on the nature of managerial com-pensation relies primarily on optimal contractingand managerial hegemony theories. The optimalcontracting theory suggests that managerial com-pensation is a tool that incites the manager to actin the best interest of shareholders, thereby allevi-ating the agency problem (e.g., Holmstrom, 1979,1982; Grossman and Hart, 1983). From the opti-mal contracting perspective, boards and compen-sation committees are assumed to design manage-rial compensation to maximize shareholder value.Hence, various economic factors (firm size, per-formance, etc.) are expected to be dominant inexplaining the variation in the level and structureof managerial pay.3
The managerial hegemony theory builds uponthe optimal contracting concepts, but relaxes theassumption that observed board and ownershipcharacteristics are value-maximizing for share-holders. It suggests that the manager with powerover the board of directors is able to increase his orher own compensation, which leads to rent extrac-tion (e.g., Zajac and Westphal, 1995, 1997; Finkel-stein and Hambrick, 1996; Bebchuk and Fried,2004). In this context, rent is defined as the dif-ference between the manager’s actual compensa-tion and the compensation that would have beenreceived under the optimal contracting scenario.According to the managerial hegemony theory, thevariation in the level and structure of managerialpay is explained not only by economic factors, butalso by the power of the manager over the board.The manager can influence actions or inactions ofboard members in a number of ways, most notablyvia active participation in director nomination andreappointment processes and via social ties with
3 The reader is referred to Hart and Holmstrom (1987) for acomprehensive overview of the optimal contracting literature.
directors (e.g., Mace, 1971; Vancil, 1987; Fredrick-son, Hambrick, and Baumrin, 1988). In the lattercase, the manager’s power may have an impact onall board members including de jure independentoutside directors.
Normally, the extent of the manager’s powerover the board is constrained by mechanisms ofshareholder control. However, if the informationabout firm decisions or policies is not transpar-ent, shareholders may not be able to exercise thecontrol function effectively. Craighead, Magnan,and Thorne (2004) find that in the absence oftransparent compensation disclosure, firms withweak shareholder governance do not tightly linkexecutive compensation to performance. The resultsuggests that without adequate information, share-holders cannot monitor firm compensation prac-tices effectively. In this vein, Bebchuk and Fried(2004) suggest that SERP benefits make an attrac-tive choice for powerful CEOs to extract rents.Due to vague and nontransparent SERP disclosure,shareholder control over SERP benefits is likely tobe weak.
I extend Bebchuk and Fried’s (2004) argu-ment to other compensation forms and formalizeit into testable hypotheses. Based on the discus-sion above, rent extraction is expected to havea negative association with the transparency ofcompensation disclosure. In other words, CEOpower over the board is expected to have moreimpact on less transparent components of CEOpay. To test the prediction, I investigate the varia-tion in different components of CEO compensationexplained by CEO power over the board, therebyextending prior work on SERP determinants byKalyta and Magnan (2008). I define cash pay asthe most transparent compensation component. Idefine SERP benefits as the least transparent com-ponent. I define stock option grants as the mid-dle ground. Although most details on stock optiongrants are publicly available, stock option disclo-sures are not as transparent as straightforward cashpay disclosures. The following predictions are ana-lyzed:
Hypothesis 1: CEO power over the board ismore closely related to less transparent compo-nents of CEO pay.a) CEO power over the board is more closelyrelated to SERP benefits than to cash pay.
Copyright 2008 John Wiley & Sons, Ltd. Strat. Mgmt. J., 30: 405–423 (2009)DOI: 10.1002/smj

410 P. Kalyta
b) CEO power over the board is more closelyrelated to SERP benefits than to stock optiongrants.c) CEO power over the board is more closelyrelated to stock option grants than to cash pay.
R&D expenditures
Opportunism in R&D decisions marks one of themajor topics in the management research literature.One direction of research investigates whether firmR&D is influenced by the manager’s retirement.Smith and Watts (1982) suggest that when theanticipated tenure of the manager is shorter thanthe firm’s optimal investment horizon, the man-ager would prefer projects with lower net presentvalue but higher current earnings. The choice ofthe project with highest current earnings wouldmaximize the manager’s bonus compensation. Thecondition, commonly referred to as the horizonproblem, should be especially pronounced prior tothe manager’s retirement. In this case, the man-ager’s concern about the discipline from manage-rial labor markets becomes weaker or disappears(Gibbons and Murphy, 1992). Based on this logic,firm R&D expenditures are expected to decrease asthe manager approaches retirement. Dechow andSloan (1991) provide some empirical evidence thatthe final years prior to CEO retirement are charac-terized by reduced R&D and advertising expendi-tures. Gibbons and Murphy (1992) show that thegrowth rate of R&D intensity slows down as theCEO approaches retirement. However, later empir-ical studies find little or no association between thehorizon problem and firm long-term investments.According to Murphy and Zimmerman (1993),there is no evidence of managerial opportunismin R&D decisions when the CEO retires as part ofthe normal relay process—that is, when executivechange is an orderly and well-planned event (Van-cil, 1987). Similarly, Cheng (2004) finds no asso-ciation between CEO turnover and R&D expendi-tures.
To summarize, the empirical evidence on theimpact of the horizon problem on R&D expendi-tures is mixed and inconclusive. However, no priortheoretical or empirical study considers the impactof the manager’s retirement arrangements on his orher incentives to reduce R&D expenditures in finalpreretirement years. I suggest that some CEOs aresubstantially more incited to reduce R&D expendi-tures than others due to the structure of their SERP
benefits. To illustrate the point, I classify CEOsinto three groups according to their retirementarrangements: (1) CEOs without SERPs; (2) CEOswith SERPs in which pensionable earnings consistof base salary only and are therefore not directlycontingent on firm earnings; and (3) CEOs withSERP arrangements in which pensionable earningsconsist of base salary and performance bonus andare therefore directly contingent on firm earningsin SERP accumulation years via the bonus compo-nent. A short-term increase in firm earnings is mostbeneficial to a CEO from the third group: in thatcase, an increase in the performance bonus ampli-fies the value of the SERP and increases the pen-sion, thus providing the CEO and his or her fam-ily with monetary benefits that extend over manyyears, often until after the CEO’s death (due toSERP payouts to the surviving spouse). Since pen-sionable earnings are typically determined in thefinal several years prior to retirement, the impactof firm earnings on CEO SERP benefits should beespecially pronounced when such CEOs approachretirement.4 In other words, payoffs from projectswith higher current earnings are particularly sig-nificant for CEOs who approach retirement andwhose SERPs are performance-contingent. SuchCEOs have a strong motivation to reduce invest-ments in long-term projects and amplify their per-sonal wealth via supplemental retirement benefits.
In addition, as discussed earlier, SERPs arenot transparent and shareholder control over thisform of managerial compensation is expected tobe particularly weak. Consequently, any adverse
4 The following example illustrates the potential magnitude ofthe increase in SERP benefits. Consider a retiring CEO, with20 years of credited service, aged 60, whose annual pension is tobe determined by the product of cash compensation (base salaryplus annual bonus) in the last year prior to retirement, years ofcredited service, and a multiplier of two percent. If the salaryof the CEO in the last year prior to retirement is $1 million andthe bonus is $0, the CEO’s annual pension will be $0.4 million($1 million × 20 × 0.02) and the actuarial value of the CEO’sSERP will be $5.6 million, assuming the discount rate of 0.05and no surviving spouse. However, if the salary of the CEO inthe last year prior to retirement is $1 million and so is the bonus,the CEO’s annual pension and the actuarial value of SERP willbe $0.8 million and $11.2 million respectively. In other words,in the example above, $1 million of bonus compensation willactually increase the personal wealth of the CEO by the presentvalue equivalent of $6.6 million and will greatly contribute to theCEO’s retirement security, significantly narrowing down the gapbetween preretirement cash compensation and postretirementincome. Neither CEOs without SERPs nor CEOs with SERPswhere pensionable earnings consist of base salary only will enjoysuch significant increases in their wealth and retirement security.
Copyright 2008 John Wiley & Sons, Ltd. Strat. Mgmt. J., 30: 405–423 (2009)DOI: 10.1002/smj
Compensation Transparency and Managerial Opportunism 411
effects of CEO retirement arrangements on strate-gic decisions may not be easily detected by share-holder control mechanisms. This further increasesthe likelihood of opportunistic decisions, whenprojects with higher current earnings are selected atthe expense of long-term investments with highernet present values. Based on the incentive andtransparency arguments, I expect R&D expen-ditures to decrease as CEOs with performance-contingent SERPs approach retirement. Morespecifically, the likelihood of R&D decreasesshould be higher in the years when performance-based SERP benefits are determined (determina-tion years). In other words, if performance-basedSERP benefits of a given CEO are determinedbased on his or her compensation in the final n pre-retirement years, the likelihood of R&D decreasesin any of these years should be higher than (a) thelikelihood of R&D decreases in nondeterminationyears, and (b) the likelihood of R&D decreasesin determination years when SERP benefits arenot performance-based. Consequently, on average,R&D expenditures are expected to be lower whenCEOs with performance-contingent SERP benefitsare in their determination years. The following pre-diction is analyzed:
Hypothesis 2: Firm R&D expenditures are nega-tively related to the horizon problem when CEOSERP benefits are contingent on firm perfor-mance.
METHODOLOGY
Data
The sample of 60 firms that comprised the S&P/TSX60 Index in 1997 is used in the analysis. TheS&P/TSX60 Index consists of the largest publiclytraded firms listed on the Toronto Stock Exchange(TSX) as measured by market capitalization.5 A
5 See Kalyta and Magnan (2008) for the list of firms. Themajority of firms in the sample are cross-listed on the U.S.stock exchanges and all firms have a significant presence onthe U.S. consumer, capital, and labor markets. Because of ahigh level of economic integration between the United Statesand Canada, governance and compensation disclosure regimesin the two countries have been remarkably similar over time.Typically, regulatory decisions by the SEC have been quicklyfollowed by similar regulatory decisions by Canadian standardsetters. Several studies highlight other similarities between thetwo countries that are relevant to this study. Deshpande and Gol-har (1997) investigate human resources practices of U.S. and
focus on larger firms is essential to investigate therole of SERP benefits. Virtually all empirical stud-ies find that CEO cash compensation is positivelyassociated with firm size (e.g., Jensen and Mur-phy, 1990; Core, Holthausen, and Larcker, 1999).Higher cash compensation translates into a greaterdisproportion between pensionable earnings andregular pension. Consequently, SERP benefits areexpected to play a greater role for CEOs in largerfirms. As a result, the impact of CEO SERP ben-efits on managerial opportunism is expected to beespecially pronounced in such firms.
The data includes nine years of observations:from 1997 to 2005. Since all the data on CEOSERP benefits must be manually collected fromproxy statements, using time series is crucial. First,SERP benefits are estimated based on historicalcash compensation. In other words, to calculatethe value of CEO SERP benefits at the end ofyear t , one needs to find out CEO cash com-pensation in years t , t − 1, . . ., t − n, where n
depends on the terms of the SERP. Second, ‘decod-ing’ SERP disclosures and estimating SERP valuesis an extremely time-consuming exercise: as illus-trated in the previous section, SERP disclosuresare often vague and cumbersome. Consequently,the incremental cost of gathering a cross-sectionalobservation substantially exceeds the incrementalcost of gathering a time series observation.
The remaining data is gathered as follows. Com-pensation, ownership, and board structure vari-ables are collected directly from proxy statements.When CEO and firm age are not disclosed incorporate reports, I retrieve them with Lexis-Nexis and Internet search engines. Death prob-ability tables are taken from Statistics Canadapublications (http://dsp-psd.tpsgc.gc.ca/Collection/Statcan/index-e.html). Financial data is collectedfrom Compustat. Missing observations are re-trieved from Report on Business Top 1000 (pub-lished by The Globe and Mail, a division of BellGlobemedia Publishing Inc.: Toronto, Canada) andcorporate financial statements. To account for infla-tion, all monetary values are converted into 2005dollars using historic Consumer Price Indices.
Canadian firms and find that compensation practices are similaracross countries. Beine and Coulombe (2005) suggest that U.S.and Canadian labor markets are highly integrated. Many otherstudies show various cultural, economic, and regulatory similar-ities between the United States and Canada (e.g., Mittoo, 1992;Doukas and Switzer, 2000).
Copyright 2008 John Wiley & Sons, Ltd. Strat. Mgmt. J., 30: 405–423 (2009)DOI: 10.1002/smj
412 P. Kalyta
Empirical models
Hypothesis 1
To test the rent extraction hypotheses, I regressCEO compensation components on variables thatproxy for CEO power over the board, controllingfor economic and other factors that may have animpact on compensation. Since panel data obser-vations are reasonably expected to be correlated,I use standard panel data models that accountfor CEO-specific and time-specific effects.6 I useannual cash compensation (salary plus bonus),value of annual stock option awards, and pensionincrement as alternative dependent variables.7 Pen-sion increment represents a present value equiva-lent of annual SERP compensation. As in the priorliterature, pension increment in year t is calculatedas the actuarially adjusted difference between thepresent value of the SERP in year t and the presentvalue of the SERP in year t − 1 (Sundaram andYermack, 2007; Kalyta and Magnan, 2008). Pen-sion increment in any given year is calculated inthree steps. In the first step, I estimate the valueof the annual pension already accumulated by theCEO according to the terms of his or her SERP.8 Inthe second step, I apply death probability tables tocalculate the present value of accumulated SERPbenefits. Finally, for any year t , I calculate CEOpension increment by subtracting the present valueof SERP benefits in year t − 1 from the presentvalue of SERP benefits in year t adjusted for one-year discount rate.9
According to the prediction, variables that proxyfor CEO power over the board should have more
6 Alternatively, I control for firm-specific or industry-specificrather than CEO-specific effects in all models. Results remainqualitatively unaffected.7 To compute the value of stock option grants, I use the modelproposed by Smith and Zimmerman (1976) for employee stockoptions: Maximum (0, Stock price at grant date − Present value[Exercise price + Future value {Dividend stream compounded atthe risk-free rate until option expiration}]). The model has beenextensively used in prior executive compensation studies (e.g.,Hemmer, 1993; Magnan and St-Onge, 1997; Craighead et al.,2004; Mahoney and Thorn, 2006).8 In several cases, firms voluntarily reported the accumulatedvalue of CEO annual pension. To ensure that actuarial assump-tions are homogeneous across observations, I use estimatedrather than reported values in such cases. A comparison ofdisclosed and estimated pension values shows high similaritybetween the two measures. I also perform all the analysis withreported pension values. Results remain qualitatively unaffected.9 The reader is referred to Sundaram and Yermack (2007) fordetailed methodology of pension increment estimation.
explanatory power in less transparent compensa-tion schemes. That is, CEO power is expected tohave more impact on CEO annual pension incre-ment than on other compensation components.Table 1 provides details on explanatory variablesused in the analysis. Consistent with prior lit-erature, I use a vector of variables rather thanone variable to proxy for CEO power over theboard (e.g., Zajac and Westphal, 1996; Conyon andHe, 2004; Adams, Almeida, and Ferreira, 2005).Such methodological construct reflects the viewthat the concept of managerial power is multidi-mensional and not easily observable (Finkelstein,1992; Adams et al., 2005). I use eight variables toproxy for CEO power over the board. Most of thevariables are standard in the compensation liter-ature. First, larger boards are more likely to havegreater coordination problems. Hence, CEO poweris expected to be positively related to the size of theboard. Second, inside directors are more likely tobe influenced by the CEO due to career concerns.Hence, CEO power is expected to be negativelyrelated to the proportion of outside directors on theboard. Third, owners of large stakes in the firm aremore likely to be vigilant in their monitoring role.Hence, CEO power is expected to be negativelyrelated to the presence of a large outside block-holder.10 Fourth, the CEO who performs the role ofthe board’s chairman has greater authority over theboard’s decisions. Hence, CEO power is expectedto be positively related to the CEO-chairman dual-ity. Fifth, ownership of a greater stake in the firmprovides additional motivation for outside direc-tors to act in the shareholders’ interest. Hence,CEO power is expected to be negatively relatedto the proportion of the firm’s shares held by out-side directors. Sixth, over time, the CEO is likelyto accumulate more authority over the board espe-cially if the board is an inexperienced one. Hence,CEO power is expected to be positively related toCEO tenure relative to average outside directors’tenure.
In two cases, effects of explanatory variablescannot be predicted. The CEO who served on theboard prior to taking the CEO office is likely to
10 Prior studies typically model blockholder presence as adichotomous variable equal to one if the firm has an outsideshareholder who owns at least five percent of its shares. I use a10 percent cutoff due to data availability issues: firms listed onthe TSX are not required to disclose shareholders who own lessthan 10 percent of their shares outstanding.
Copyright 2008 John Wiley & Sons, Ltd. Strat. Mgmt. J., 30: 405–423 (2009)DOI: 10.1002/smj

Compensation Transparency and Managerial Opportunism 413
Tabl
e1.
Exp
lana
tory
vari
able
sin
CE
Oco
mpe
nsat
ion
regr
essi
ons
Var
iabl
eD
escr
iptio
nE
xp.
sign
Sele
cted
liter
atur
e
CE
Opo
wer
vari
able
sB
OA
RD
Num
ber
ofdi
rect
ors
onth
ebo
ard
+Y
erm
ack
(199
6),
Cor
eet
al.
(199
9),
Gri
nste
inan
dH
riba
r(2
004)
,H
ean
dC
onyo
n(2
004)
,B
rick
,Pa
lmon
,an
dW
ald
(200
6),
Sund
aram
and
Yer
mac
k(2
007)
OU
TSI
DE
Prop
ortio
nof
outs
ide
dire
ctor
son
the
boar
d−
Lam
bert
,L
arck
er,
and
Wei
gelt
(199
3),
Meh
ran
(199
5),
Gri
nste
inan
dH
riba
r(2
004)
,H
ean
dC
onyo
n(2
004)
,B
rick
etal
.(2
006)
,Su
ndar
aman
dY
erm
ack
(200
7)B
LO
CK
1if
the
firm
has
anou
tsid
esh
areh
olde
rw
hoow
nsat
leas
t10
%of
itssh
ares
outs
tand
ing,
0ot
herw
ise
−M
ehra
n(1
995)
,C
ore
etal
.(1
999)
,C
raig
head
etal
.(2
004)
,G
hosh
and
Sirm
ans
(200
4),
He
and
Con
yon
(200
4)C
HA
IRM
AN
1if
CE
Ois
the
Cha
irm
anof
the
boar
d,0
othe
rwis
e+
Cor
eet
al.
(199
9),
Cye
rt,
Kan
g,an
dK
umar
(200
2),
Gho
shan
dSi
rman
s(2
004)
,G
rins
tein
and
Hri
bar
(200
4),
He
and
Con
yon
(200
4),
Bri
cket
al.
(200
6)O
WN
DIR
Prop
ortio
nof
firm
’ssh
ares
held
byan
aver
age
outs
ide
dire
ctor
−C
ore
(200
0),
Cye
rtet
al.
(200
2),
Gho
shan
dSi
rman
s(2
004)
,H
ean
dC
onyo
n(2
004)
TE
NU
RE
Ave
rage
tenu
reof
CE
Odi
vide
dby
aver
age
tenu
reof
outs
ide
dire
ctor
s+
Sing
han
dH
aria
nto
(198
9a.
1989
b),
Wad
e,O
’Rei
lly,
and
Cha
ndra
tat
(199
0),
Mai
n,O
’Rei
lly,
and
Wad
e(1
995)
INT
ER
NA
L1
ifC
EO
serv
edon
the
boar
dbe
fore
appo
intm
ent,
0ot
herw
ise
?B
rick
etal
.(2
006)
,Su
ndar
aman
dY
erm
ack
(200
7)
OW
NC
EO
Prop
ortio
nof
firm
shar
eshe
ldby
CE
O?
Meh
ran
(199
5),
Cor
eet
al.
(199
9),
Har
vey
and
Shri
eves
(200
1),
Gho
shan
dSi
rman
s(2
004)
,H
ean
dC
onyo
n(2
004)
,B
rick
etal
.(2
006)
OW
NC
EO
SQPr
opor
tion
offir
m’s
shar
eshe
ldby
CE
Osq
uare
d?
NA
Eco
nom
icva
riab
les
SIZ
EN
atur
allo
gari
thm
offir
mre
venu
e+
Cor
eet
al.
(199
9),
Mur
phy
(199
9),
Cra
ighe
adet
al.
(200
4),
Gri
nste
inan
dH
riba
r(2
004)
,B
rick
etal
.(2
006)
,Su
ndar
aman
dY
erm
ack
(200
7)P
ER
FO
RM
Ret
urn
onfir
mas
sets
+M
urph
y(1
999)
,C
raig
head
etal
.(2
004)
,G
rins
tein
and
Hri
bar
(200
4),
Bri
cket
al.
(200
6)L
EV
ER
AG
EFi
rmde
bt-t
o-eq
uity
ratio
+H
arve
yan
dSh
riev
es(2
001)
,C
raig
head
etal
.(2
004)
,G
hosh
and
Sirm
ans
(200
4),
Bri
cket
al.
(200
6),
Sund
aram
and
Yer
mac
k(2
007)
Oth
erva
riab
les
AG
EC
EO
Age
ofC
EO
+H
arve
yan
dSh
riev
es(2
001)
,H
ean
dC
onyo
n(2
004)
,B
rick
etal
.(2
006)
AG
EF
IRM
Yea
rssi
nce
foun
ding
ofth
efir
m+
Con
yon
and
He
(200
4),
Sund
aram
and
Yer
mac
k(2
007)
FIR
STY
R1
ifth
eye
aris
the
year
whe
nC
EO
ishi
red,
0ot
herw
ise
+/?
NA
LA
STY
R1
ifth
eye
aris
the
year
whe
nC
EO
retir
es,
0ot
herw
ise
+/?
NA
Not
e:Pr
edic
ted
effe
cts
ofF
IRST
YR
and
LA
STY
Rar
epo
sitiv
ew
hen
pens
ion
incr
emen
tis
used
asth
ede
pend
ent
vari
able
and
unsp
ecifi
edw
hen
cash
pay
and
stoc
kop
tion
gran
tsar
eus
edas
the
depe
nden
tva
riab
le.
Copyright 2008 John Wiley & Sons, Ltd. Strat. Mgmt. J., 30: 405–423 (2009)DOI: 10.1002/smj
414 P. Kalyta
have close ties with directors. However, the out-side CEO is likely to have less knowledge of thefirm than the inside one. Assuming risk aversion,the outside CEO would demand a premium fortaking the risk of running the firm. Consequently,the outside CEO would be more ‘expensive’ thanthe internal one. In other words, the impact ofCEO internality on CEO pay may take either side.Similarly, the effect of CEO ownership is unclear.Greater CEO stake in the firm may align his or herinterests with those of shareholders. Alternatively,it may signify CEO power, influence, and author-ity. Another possibility is a curvilinear relationshipbetween CEO ownership and compensation. Someprior studies suggest that the impact of owner-ship on managerial opportunism is described byan inverted U-shaped curve (e.g., Morck, Shleifer,and Vishny, 1988; Ghosh, Moon, and Tandon,2007). To control for possible nonlinearity, I con-sider CEO ownership squared as an additionalexplanatory factor. To the best of my knowledge,the variable has not been used in executive com-pensation studies before.
Control variables and their predicted effects onCEO pay are specified according to prior studies oncompensation determinants. The group of explana-tory economic variables includes proxies for firmsize (log revenue), performance (return on assets[ROA]), and leverage (debt-equity ratio).11 A pos-itive association of CEO compensation with thesefirm-level factors is well documented in the litera-ture. The last group includes other factors that mayhave an impact on CEO pay. I control for CEOage since one’s concerns about retirement benefitsare expected to grow as the retirement approaches.I also control for firm age. Sundaram and Yer-mack (2007) find a positive association betweenfirm age and the present value of CEO SERP ben-efits. Finally, I consider two dichotomous variablesthat correspond to the first and last years the CEOoccupies his or her position. Anecdotal evidencesuggests that firms grant additional years of cred-ited service to CEOs when they join the firm (asadditional incentive) or immediately prior to retire-ment (to close the gap between preretirement andpostretirement benefits). Hence, a positive relation-ship between the two variables and CEO pensionincrement is expected.
11 Using alternative proxies for firm size (log assets), perfor-mance (return on equity) and leverage (debt-to-assets) does notaffect results.
Hypothesis 2
To test the hypothesis of R&D reduction, I regressa measure of firm R&D expenditures on theinteraction between the horizon problem and theperformance-contingency of CEO SERP benefits.The model, which controls for CEO-specific andtime-specific fixed effects, is specified below:
R&Dt = β0 + β1HORIZONt
× PERFSERPt + β2HORIZONt
+ β3PERFSERPt + β4SIZEt
+ β5PERFORMt−1 + β6LEV ERAGEt
+ β7BLOCKt + β8AGECEOt
+ β9OWNCEOt + β10OWNCEOSQt
+ ε (1)
where t is the year indicator, R&D is firm R&Dexpenditure deflated by firm revenue and relativeto industry average, HORIZON is a dichotomousvariable equal to one if t is a year in whichCEO pensionable earnings are determined, PERF-SERP is a dichotomous variable equal to one ifCEO pensionable earnings are based on the per-formance bonus, and other variables are as definedin Table 1.
The HORIZON × PERFSERP interactioncan be interpreted as a dichotomous variable thattakes the value of one when the CEO is incitedto reduce R&D expenditures, and zero otherwise.According to Hypothesis 2, the β1 coefficient isexpected to be negative and significant. In otherwords, if CEO SERPs are performance-contingent,one would expect lower R&D expenditures in CEOfinal preretirement years, when CEO pension isdetermined.12 Following prior studies, I use a rel-ative measure of R&D expenditures to control forthe variation in R&D across industries and firmsof different sizes (e.g., Dechow and Sloan, 1991;
12 The model implies that the effect of firm performance on CEOcash bonus is greater than its effect on CEO salary: a reasonableassumption due to the very nature of the two pay components.Nonetheless, it is possible that in some cases, CEO cash bonusis a function of a measure over which the CEO has little orno control. It is also possible that CEO salary is increased as aresult of firm performance while CEO bonus is unaffected. Thetwo events are unlikely to be common and would bias againstthe results of the analysis.
Copyright 2008 John Wiley & Sons, Ltd. Strat. Mgmt. J., 30: 405–423 (2009)DOI: 10.1002/smj
Compensation Transparency and Managerial Opportunism 415
Barker and Mueller, 2002; Cheng, 2004).13 Indus-tries are defined by Standard Industrial Classifica-tion codes at the two-digit level.
I control for firm-level factors that may have animpact on R&D expenditures. First, I include thenatural logarithm of firm revenue in the model.Although the dependent variable takes firm sizeinto account, a significant association between sizeand R&D is still possible. Second, I consider firmpast performance.14 Prior studies find conflictingevidence on the association between past perfor-mance and R&D. Hundley, Jacobson, and Park(1996) suggest that firms tend to reduce R&Dspending when unprofitable. Barker and Mueller(2002) also find a positive association between firmpast performance and R&D. However, accordingto Hitt et al. (1991), the association between thetwo variables is negative. The latter result supportsthe argument that poor performance incites firmsto engage in innovation. Third, I control for firmleverage. Prior evidence suggests that firms withhigher levels of debt appear to be less focused onlong-term projects (e.g., Baysinger and Hoskisson,1989; Long and Ravenscraft, 1993). Consequently,R&D expenditures are expected to have a negativeassociation with leverage. Finally, some empiricalstudies find a positive association between institu-tional ownership and R&D (e.g., Hansen and Hill,1991; Barker and Mueller, 2002). The result is inline with the view that institutional investors focuson long-term rather than short-term performance.However, other studies suggest that the focus ofinstitutional investors varies and depends on thenature of institutions (e.g., Kochhar and David,1996; Hoskisson et al., 2002). Since the data onthe extent and structure of institutional ownershipis not publicly available for my sample, I use thepresence of blockholders—large and active exter-nal investors other than institutions—as a controlvariable in the R&D model, recognizing the limi-tations of this proxy.
I also control for CEO-level factors that mayhave an impact on firm R&D expenditures. First, Iinclude CEO age in the model. Earlier studies sug-gest that executives become more conservative andrisk averse with age (e.g., Child, 1974; Hambrick
13 Alternatively, I use relative annual changes in R&D expendi-tures rather than relative R&D levels as the dependent variable.Results remain qualitatively unaffected.14 Using contemporaneous (PERFORMt ) rather than lagged(PERFORMt−1) performance does not affect the results.
and Mason, 1984). Barker and Mueller (2002),among others, find a negative association betweenCEO age and firm R&D spending. I also consider apotential impact of CEO ownership on firm R&D.May (1995) suggests that CEOs with significantstockholdings are more concerned about long-termfirm value. Barker and Mueller (2002) find a posi-tive association between CEO ownership and R&Dexpenditures. However, according to Ghosh et al.(2007), the relationship between the two variablesis nonlinear: R&D investments increase and thendecline as CEO ownership increases. To controlfor CEO ownership and potential nonlinearity, Iinclude the proportion of firm shares held by theCEO and its squared value in the model.
RESULTS
Since some firms from the 1997 S&P/TSX60Index were acquired during the 1998–2005 period,the initial sample contains 472 observations. Also,due to insufficient disclosure, I am unable to calcu-late pension increment in 28 CEO-years. Table 2provides key descriptive statistics (Panel A) andthe correlation matrix (Panel B). Results on thesize of CEO SERP benefits are similar to thosein Kalyta and Magnan (2008). The mean pen-sion increment is C$1.1 million.15 For compar-ison, the mean cash pay is C$1.8 million andthe mean value of annual stock option grants isC$2.4 million. Most other statistics and correlationcoefficients are also consistent with prior compen-sation and governance studies. Although many cor-relations are significant, none approaches a com-mon 0.70 criterion for multicolinearity.
To test Hypothesis 1, I regress the level of CEOcompensation components on CEO power, eco-nomic, and other variables specified in Table 1. Toaccount for possible outliers, all variables in theseand subsequent multivariate models are winsorizedat the one percent level.16 Results are reported inTable 3 (Panel A). A visual comparison of resultsin PENSION, CASH, and OPTIONS models sug-gests that the impact of CEO power on pensionincrements appears to be more substantial thanthe impact of CEO power on cash pay and stock
15 C$ denotes Canadian dollar. During the sample period(1997–2005), rates fluctuated between $0.63 and $0.86 for C$1.16 Winsorizing the data removes several extreme observations ineconomic variables. Results are not qualitatively affected if rawdata is used.
Copyright 2008 John Wiley & Sons, Ltd. Strat. Mgmt. J., 30: 405–423 (2009)DOI: 10.1002/smj

416 P. Kalyta
Tabl
e2.
Des
crip
tive
stat
istic
san
dco
rrel
atio
nsPa
nel
A.
Des
crip
tive
stat
istic
s
Var
iabl
eU
nits
Mea
nSt
.de
v
PE
NSI
ON
C$,
000
1,11
01,
585
CA
SHC
$,00
01,
815
1,86
6O
PT
ION
SC
$,00
02,
442
5,71
9H
OR
IZO
Nn/
a0.
394
0.49
0P
ER
FSE
RP
n/a
0.35
20.
396
R&
Dn/
a1.
077
0.25
2B
OA
RD
Dir
ecto
rs12
.63.
5O
UT
SID
En/
a0.
750
0.15
6B
LO
CK
n/a
0.49
40.
500
CH
AIR
MA
Nn/
a0.
273
0.44
6O
WN
DIR
n/a
0.00
130.
0072
TE
NU
RE
n/a
1.01
10.
986
INT
ER
NA
Ln/
a0.
560
0.48
9O
WN
CE
On/
a0.
0078
0.02
75O
WN
CE
OSQ
n/a
0.00
080.
0054
SIZ
En/
a15
.94
13.9
3P
ER
FO
RM
n/a
0.02
00.
137
LE
VE
RA
GE
n/a
0.76
50.
811
AG
EC
EO
Yea
rs54
.96.
7A
GE
FIR
MY
ears
72.4
56.0
FIR
STY
Rn/
a0.
181
0.38
0L
AST
YR
n/a
0.14
40.
352
Copyright 2008 John Wiley & Sons, Ltd. Strat. Mgmt. J., 30: 405–423 (2009)DOI: 10.1002/smj

Compensation Transparency and Managerial Opportunism 417
Pane
lB
.C
orre
latio
nm
atri
x
#V
aria
ble
AB
CD
∗E
∗F
GH
∗I∗
JK
L∗
MN
OP
QR
S∗
AP
EN
SIO
NB
CA
SH0.
19(0
.00)
CO
PT
ION
S0.
090.
11(0
.20)
(0.1
3)D
∗H
OR
IZO
N0.
360.
060.
07(0
.00)
(0.2
0)(0
.15)
E∗
PE
RF
SER
P0.
230.
030.
040.
46(0
.00)
(0.4
9)(0
.43)
(0.0
0)F
BO
AR
D0.
010.
11−0
.03
0.11
0.18
(0.8
3)(0
.05)
(0.6
0)(0
.04)
(0.0
0)G
OU
TSI
DE
−0.1
3−0
.07
−0.0
80.
080.
12−0
.04
(0.0
1)(0
.17)
(0.1
5)(0
.19)
(0.0
1)(0
.44)
H∗
BL
OC
K−0
.14
−0.0
30.
10−0
.10
−0.1
5−0
.17
−0.4
1(0
.03)
(0.5
6)(0
.09)
(0.0
0)(0
.00)
(0.2
2)(0
.00)
I∗C
HA
IRM
AN
0.22
−0.0
2−0
.06
0.18
0.29
0.25
0.10
−0.2
8(0
.00)
(0.7
6)(0
.28)
(0.0
0)(0
.00)
(0.0
0)(0
.06)
(0.0
0)J
OW
ND
IR0.
15−0
.10
−0.0
3−0
.10
−0.1
20.
050.
08−0
.22
−0.0
4(0
.01)
(0.0
6)(0
.54)
(0.0
5)(0
.02)
(0.3
8)(0
.20)
(0.0
0)(0
.49)
KT
EN
UR
E−0
.07
0.11
0.05
0.10
−0.0
4−0
.18
−0.1
40.
080.
210.
06(0
.25)
(0.0
4)(0
.31)
(0.0
3)(0
.45)
(0.0
0)(0
.01)
(0.1
1)(0
.00)
(0.2
3)L
∗IN
TE
RN
AL
−0.1
00.
09−0
.11
0.19
0.23
0.11
−0.0
9−0
.03
0.33
−0.1
6−0
.02
(0.1
1)(0
.14)
(0.0
4)(0
.00)
(0.0
0)(0
.06)
(0.1
2)(0
.51)
(0.0
0)(0
.02)
(0.7
4)M
OW
NC
EO
−0.0
30.
070.
140.
05−0
.09
0.13
−0.2
80.
02−0
.10
−0.0
50.
220.
13(0
.58)
(0.1
7)(0
.01)
(0.3
4)(0
.05)
(0.0
2)(0
.00)
(0.7
3)(0
.12)
(0.4
0)(0
.00)
(0.0
3)N
SIZ
E0.
150.
260.
190.
200.
310.
390.
16−0
.03
0.15
−0.2
2−0
.23
0.23
−0.1
8(0
.01)
(0.0
0)(0
.00)
(0.0
0)(0
.00)
(0.0
0)(0
.00)
(0.5
4)(0
.01)
(0.0
0)(0
.00)
(0.0
0)(0
.00)
OP
ER
FO
RM
0.01
0.09
0.03
0.02
−0.0
70.
02−0
.02
0.10
−0.0
70.
030.
12−0
.06
0.07
−0.0
4(0
.84)
(0.1
0)(0
.50)
(0.7
1)(0
.16)
(0.7
4)(0
.71)
(0.0
6)(0
.15)
(0.6
0)(0
.02)
(0.2
2)(0
.19)
(0.4
9)P
LE
VE
RA
GE
−0.0
7−0
.10
−0.1
20.
080.
150.
530.
21−0
.28
0.28
−0.0
6−0
.12
0.11
−0.0
60.
27−0
.04
(0.2
3)(0
.05)
(0.0
1)(0
.13)
(0.0
0)(0
.00)
(0.0
0)(0
.00)
(0.0
0)(0
.32)
(0.0
2)(0
.05)
(0.3
0)(0
.00)
(0.4
9)Q
AG
EC
EO
−0.0
5−0
.01
0.07
0.22
0.19
−0.1
9−0
.00
0.04
0.39
0.05
0.23
0.28
−0.1
50.
060.
030.
07(0
.40)
(0.9
0)(0
.21)
(0.0
0)(0
.00)
(0.0
0)(0
.95)
(0.4
2)(0
.00)
(0.4
1)(0
.00)
(0.0
0)(0
.03)
(0.1
9)(0
.50)
(0.1
6)R
AG
EF
IRM
0.08
0.09
0.09
−0.0
30.
070.
320.
35−0
.20
0.26
−0.1
0−0
.19
0.06
−0.1
90.
39−0
.06
0.37
0.05
(0.2
2)(0
.08)
(0.1
6)(0
.47)
(0.2
3)(0
.00)
(0.0
0)(0
.00)
(0.0
0)(0
.06)
(0.0
0)(0
.26)
(0.0
0)(0
.00)
(0.2
4)(0
.00)
(0.3
5)S∗
FIR
STY
R−0
.03
−0.0
40.
02−0
.22
−0.1
50.
02−0
.05
−0.0
2−0
.21
−0.0
1−0
.46
−0.0
5−0
.21
0.04
−0.0
8−0
.03
−0.2
00.
03(0
.56)
(0.4
1)(0
.75)
(0.0
0)(0
.00)
(0.7
2)(0
.32)
(0.7
5)(0
.00)
(0.7
8)(0
.00)
(0.3
4)(0
.00)
(0.4
0)(0
.12)
(0.5
2)(0
.00)
(0.5
9)T
∗L
AST
YR
0.19
0.08
−0.1
80.
210.
12−0
.04
−0.0
80.
020.
070.
03−0
.20
0.01
0.03
−0.0
2−0
.04
−0.0
00.
19−0
.03
−0.1
2(0
.00)
(0.1
2)(0
.01)
(0.0
0)(0
.02)
(0.3
9)(0
.11)
(0.7
1)(0
.19)
(0.6
2)(0
.00)
(0.7
9)(0
.61)
(0.6
3)(0
.40)
(0.9
7)(0
.00)
(0.6
2)(0
.01)
Not
e:P
EN
SIO
Nis
CE
Oan
nual
pens
ion
incr
emen
t,C
ASH
isC
EO
annu
alca
shco
mpe
nsat
ion,
OP
TIO
NS
isC
EO
stoc
kop
tion
gran
ts,
HO
RIZ
ON
isa
dum
my
vari
able
equa
lto
one
for
year
sin
whi
chC
EO
pens
iona
ble
earn
ings
are
dete
rmin
ed,
PE
RF
SER
Pis
adu
mm
yva
riab
leeq
ual
toon
eif
CE
Ope
nsio
nabl
eea
rnin
gsar
eba
sed
onth
epe
rfor
man
cebo
nus,
R&
Dis
firm
tota
lR
&D
expe
nditu
res
defla
ted
byfir
mre
venu
ean
dre
lativ
eto
indu
stry
aver
age.
Oth
erva
riab
les
are
defin
edin
Tabl
e1.
InPa
nel
B,
colu
mns
and
row
sw
ithSp
earm
anra
nkco
rrel
atio
nsar
ede
note
dw
ithan
aste
risk
(∗ );
othe
rwis
e,Pe
arso
nco
rrel
atio
nsar
ere
port
ed.
Copyright 2008 John Wiley & Sons, Ltd. Strat. Mgmt. J., 30: 405–423 (2009)DOI: 10.1002/smj
418 P. Kalyta
Table 3. Determinants of CEO compensationPanel A. Multivariate models of CEO compensation
Variable PENSION CASH OPTIONS %PENSION
CEO power variablesBOARD 1.3 13.7 −14.7 0.012OUTSIDE −1.280∗∗ −224.7 −121.2 −0.287∗∗
BLOCK −397.3∗∗∗ −60.2 48.5 −0.146∗∗
CHAIRMAN 761.9∗∗∗ −398.3 −204.0 0.194∗∗∗
OWNDIR 68.1 −94.7 −61.9 −0.355∗∗
TENURE −90.5 263.5 201.3 0.029INTERNAL −472.0∗∗ −85.4 −89.2 −0.060∗∗
OWNCEO 9.6 11.4 71.3∗∗ −0.002OWNCEOSQ −83.4 79.2 −55.6 −0.028
Partial R2 0.158 0.039 0.071 0.176
Economic variablesSIZE 178.8∗∗ 274.8∗∗∗ 220.2∗∗ 0.033∗∗
PERFORM 171.5 2,315.6∗∗ 440.9 −0.005LEVERAGE −299.2∗∗ −535.5∗∗∗ −353.1∗∗ −0.222
Partial R2 0.056 0.262 0.093 0.069
Other variablesAGECEO −15.2 −22.9 −0.4 0.003AGEFIRM 4.4 −3.3 −8.9 −0.001FIRSTYR −98.0 −14.6 −182.5 −0.025LASTYR 932.3∗∗∗ 143.7 −597.8∗∗ 0.086∗∗
Partial R2 0.095 0.025 0.086 0.088
SUMMARYTotal R2 0.309 0.326 0.250 0.333
% CEO power 51.1% 12.0% 28.4% 52.9%% Economic 18.1% 80.4% 37.2% 20.7%% Other 30.7% 7.7% 34.4% 26.4%
Panel B. Variation in CEO compensation explained by CEO power variables
Prediction Significance Difference
Partial R2 Partial R2/Total R2
PENSIONCEO power > CASHCEO power p < 0.01 0.119 0.391PENSIONCEO power > OPT IONSCEO power p < 0.01 0.087 0.227OPT IONSCEO power > CASHCEO power p < 0.05 0.032 0.164
Note: ∗∗∗ p < 0.01; ∗∗ p < 0.05. Models are estimated with Huber-White standard errors. Two-tailed tests are used. %PENSION isthe proportion of pension increment in total annual compensation. Coefficients on OWNDIR, OWNCEO, and OWNCEOSQ are scaledby 1,000. R2 percentages may not add to 100% due to rounding error.
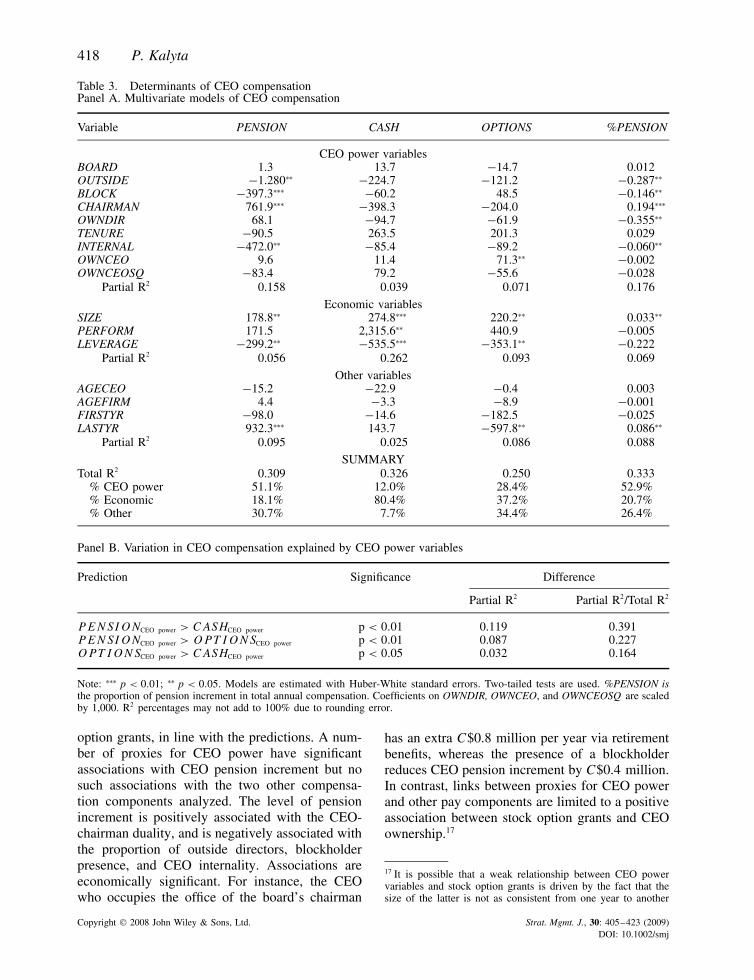
option grants, in line with the predictions. A num-ber of proxies for CEO power have significantassociations with CEO pension increment but nosuch associations with the two other compensa-tion components analyzed. The level of pensionincrement is positively associated with the CEO-chairman duality, and is negatively associated withthe proportion of outside directors, blockholderpresence, and CEO internality. Associations areeconomically significant. For instance, the CEOwho occupies the office of the board’s chairman
has an extra C$0.8 million per year via retirementbenefits, whereas the presence of a blockholderreduces CEO pension increment by C$0.4 million.In contrast, links between proxies for CEO powerand other pay components are limited to a positiveassociation between stock option grants and CEOownership.17
17 It is possible that a weak relationship between CEO powervariables and stock option grants is driven by the fact that thesize of the latter is not as consistent from one year to another
Copyright 2008 John Wiley & Sons, Ltd. Strat. Mgmt. J., 30: 405–423 (2009)DOI: 10.1002/smj
Compensation Transparency and Managerial Opportunism 419
For in-depth analysis, I compare percentages ofvariance explained by CEO power factors in PEN-SION, CASH, and OPTIONS models. In the firststep, I divide all explanatory variables into threesets according to Table 1: CEO Power, Economic,and Other. In the second step, I run hierarchicalmultiple regressions for each of the three com-pensation components. This allows computing thesignificance of each added set of variables andthe proportion of variation in the dependent vari-able explained by a particular set. I find that theCEO Power set explains substantially more varia-tion in the level of pension increment than it doesin the level of cash pay and stock option grants.On average, CEO power over the board explains15.8 percent of the variation in the level of CEOpension increment, 7.1 percent of the variation inthe level of CEO stock option grants, and only3.9 percent of the variation in the level of CEOcash pay.18 In contrast, economic factors explain26.2 percent of the variation in the level of CEOcash pay, 9.3 percent of the variation in the levelof CEO stock option grants, and only 5.6 percentof the variation in the level of CEO pension incre-ment. A relative analysis of partial R2s providesadditional information. The set of CEO power vari-ables accounts for 51.1 percent of total R2 in thepension increment regression, 28.4 percent in thestock options regression, and 12.0 percent in thecash regression. In contrast, the set of economicvariables accounts for 80.4 percent of the total R2
in the cash regression, 37.2 percent in the stockoptions regression, and only 18.1 percent in thepension increment regression.19 Panel B of Table 3
as the size of other compensation components. In other words,the CEO may get a substantial stock option grant in year t ,but no grant at all in year t + 1. To assess this possibility,I conduct additional analysis, aggregating the value of stockoption grants over longer time periods (two, three, or five years),and regressing the resulted measure on explanatory variablesaveraged over the same period. The results remain qualitativelyunchanged. The proportion of each set of variables in totalR2 remains generally constant across models. The relationshipbetween CEO ownership and the value of stock option grantsremains significant when stock option grants are averaged overtwo or three years but becomes marginally significant (p < 0.10)when a five-year period is used. Other proxies for CEO powerremain statistically insignificant in explaining the variation inthe value of stock option grants.18 To ensure that results are robust to the choice of the order ofsets in the model, I run regressions for each possible hierarchy.Results remain qualitatively unchanged.19 Cash pay includes two components: base salary and annualbonus. It is possible that the determinants of the two cashcomponents differ, affecting the results in the CASH model.
summarizes the relationship between CEO powervariables and different compensation components.
To address the possibility that SERP benefits aresubstitutes for some other compensation compo-nent, I deflate pension increment by total compen-sation awarded to the CEO in a given year andinvestigate its determinants. The resulting variablecan be described as the proportion of nontrans-parent pay in the CEO compensation contract. Toperform arcsine root transformation of the depen-dent variable, I remove 22 observations in whichpension increment is negative.20 Results, reportedin the last column of Table 3 (Panel B), are similarto those reported in the PENSION model. Consis-tent with expectations, I find a significant impactof CEO power on the proportion of pension incre-ment in total CEO compensation. To summarize,the results provide support of Hypothesis 1, sug-gesting that less transparent compensation compo-nents are driven primarily by CEO power, whereasmore transparent CEO compensation componentsare driven primarily by economic variables.21
Descriptive statistics in Table 2 suggest thatperformance-contingent SERPs account for 35.2percent of observations in the sample. To testwhether the structure of CEO retirement benefits
To address the possibility, I estimate separate models for basesalary and cash bonus. The conclusions remain unaffected: bothcash pay components are primarily driven by economic factorsand have modest associations with CEO power.20 In contrast to other pay components, pension increment in agiven year can be negative. For instance, the firm may changeone or several SERP provisions in a way that reduces the valueof accumulated SERP benefits (e.g., decrease the multiplier).Removing observations with negative pension increments isnecessary to perform arcsine root transformation (e.g., Sokaland Rohlf, 1995; Zar, 1999) and estimate the model in whichthe dependent variable is the proportion of pension incrementin total CEO compensation. However, a potential downside isan overestimation of the proportion of pension increment intotal CEO compensation. To assess the degree of overestimation,I compare the average pay structure in the full sample withthe average pay structure in the reduced sample. Excludingobservations with negative pension increments overestimates theproportion of pension increment in total CEO compensation byless than one percent only and is not expected to affect theresults.21 I also perform factor analysis of CEO power variables to fur-ther triangulate the findings (unreported for brevity). I combineproxies for CEO power into one factor, estimate factor scores foreach observation, and run compensation regressions with CEOpower factor scores as the dependent variable, controlling foreconomic and other variables from Table 1. Despite insignificantfactor loadings in individual cases (consistent with the results inTable 3), CEO power factor scores are positive and significantin explaining pension increments. In contrast, I find no associ-ation between CEO power scores and other, more transparentcompensation components.
Copyright 2008 John Wiley & Sons, Ltd. Strat. Mgmt. J., 30: 405–423 (2009)DOI: 10.1002/smj

420 P. Kalyta
Table 4. Determinants of firm R&D expenditures
Variable Base sample Matched sample
HORIZON −0.028 −0.043 −0.081 −0.066PERFSERP −0.023 −0.021 −0.008 −0.029SIZE −0.026 −0.030 0.047 0.024PERFORM 0.148 0.120 0.133 0.095LEVERAGE −0.153∗∗ −0.180∗∗ −0.207∗∗∗ −0.220∗∗∗
BLOCK 0.179∗∗ 0.164∗∗ 0.206∗∗ 0.137∗∗
AGECEO −0.019 −0.038 −0.005 −0.020OWNCEO 0.015∗∗∗ 0.013∗∗∗ 0.008∗∗ 0.011∗∗
OWNCEOSQ −0.003 −0.003 0.003 0.002HORIZON × PERFSERP −0.201∗∗∗ −0.305∗∗∗
Adjusted R2 0.209 0.254 0.190 0.249R2 change 0.045∗∗∗ 0.059∗∗∗
n 472 472 332 332
Note: ∗∗∗ p < 0.01; ∗∗ p < 0.05. Models are estimated with Huber-White standard errors. Two-tailed tests are used. Coefficients onOWNCEO and OWNCEOSQ are scaled by 1,000.
affects firm R&D expenditures, Equation 1 is esti-mated. To enhance the reliability of the analysis,I use base sample and matched sample as twoalternatives.22 Results, reported in Table 4, pro-vide empirical support of Hypothesis 2. I findthat firms whose CEOs have short horizons andperformance-contingent SERPs (HORIZON ×PERFSERP = 1) are characterized by lowerR&D expenditures. Also, the inclusion of the inter-action term significantly increases the explanatorypower of the models. In contrast, when consid-ered separately, the horizon problem and SERPstructure have no significant association with firmR&D expenditures. In other words, consistent withprior literature (e.g., Cheng, 2004), I find no impactof CEO turnover on firm R&D in general. How-ever, I find that the association between the hori-zon problem and R&D expenditures is contingenton the structure of CEO SERP benefits. Firmsappear to reduce R&D expenditures when CEOswith performance-contingent SERPs are in theirdetermination years. The result is economicallysignificant: the coefficient on the interaction termsuggests that on average, the ratio of firm R&Dexpenditures relative to the industry mean is lowerby around 20 percent in these years. In contrast,there is no evidence of managerial opportunism inR&D decisions when CEO SERP benefits do not
22 In the latter case, observations with hypothesized reductionsin R&D (i.e., HORIZON × PERFSERP = 1) are matchedwith observations with no hypothesized reductions in R&D (i.e.,HORIZON × PERFSERP = 0) based on the two-digit SICcode, calendar year, and the closest ROA in the previous year.
depend on performance bonuses or when the CEOhas no SERP. The findings are consistent with theprediction that CEOs approaching retirement areincited to select projects with highest current earn-ings at the expense of long-term projects to amplifytheir retirement benefits.
CONCLUSIONS
I argue that shareholder control over poorly dis-closed SERP benefits is substantially weaker thanshareholder control over other, more transparentcompensation components, thus providing fertileground for managerial opportunism. I investigatethe role of SERP benefits in two prominent exam-ples of managerial opportunism: rent extractionand R&D reduction. Overall, the results supportthe predictions. Specifically, I find that the level ofCEO SERP benefits and the proportion of SERPbenefits in total CEO compensation are primarilydriven by variables proxying for CEO power overthe board. In contrast, more transparent compensa-tion components are primarily driven by economicfactors, including firm past performance, and havemodest associations with CEO power. The find-ing supports the prediction that CEOs with powerover boards are able to increase their own compen-sation via SERPs. It also suggests that the CEO’sability to exercise his or her power and extractrents via well-disclosed and transparent compen-sation components is limited. More generally, theassociation between managerial power and rent
Copyright 2008 John Wiley & Sons, Ltd. Strat. Mgmt. J., 30: 405–423 (2009)DOI: 10.1002/smj

Compensation Transparency and Managerial Opportunism 421
extraction appears to be contingent on the trans-parency of managerial compensation.
The study makes a fruitful contribution to exist-ing compensation theories. According to the opti-mal contracting paradigm, observed compensa-tion contracts are optimally determined, aligninginterests of managers and shareholders. Accordingto the managerial hegemony paradigm, observedcompensation contracts deviate from the optimumbecause managers with power over boards extractrents from shareholders. The compensation trans-parency theory makes an important connectionbetween the two dominant paradigms, suggestingthat the optimal contracting framework may bemore appropriate when managerial compensationis transparent, whereas the managerial hegemonyframework may be more appropriate when man-agerial compensation is opaque. Potential impli-cations of this connection extend beyond under-standing the relationship between SERP benefitsand managerial decisions. For instance, the com-pensation transparency theory may serve as a basisfor analyzing the causes of variation in manage-rial compensation contracts across different enti-ties (countries, industries, firms, managerial levels,etc.) in which the transparency of total compen-sation or its specific components differs due toregulatory, operational, or other factors.
I also find patterns of opportunistic R&D reduc-tions in years preceding CEO retirement, whenSERP benefits of the CEO are based on per-formance bonuses in these years. The finding isconsistent with arguments that managers whosesupplemental retirement benefits depend on firmperformance are incited to undertake projects withhighest current earnings, rather than projects withhighest net present values, when approachingretirement in order to amplify their pension andmaximize personal wealth. The finding contributesto the rich literature on adverse selection and man-agerial opportunism in long-term projects. The-oretical developments in this research area sug-gest, inter alia, that managers approaching retire-ment should prefer projects with highest cur-rent earnings—the condition commonly referredto as the horizon problem. However, prior empir-ical evidence on the horizon problem is incon-clusive, with recent studies finding no evidenceof reductions in firm long-term expenditures asCEOs approach retirement (e.g., Cheng, 2004).This study extends the theoretical framework byintroducing a moderating factor in the relationship
between the manager’s horizon and opportunism. Iprovide arguments and evidence that the manager’sincentives to underinvest in long-term projects inpreretirement years depend on his or her retire-ment arrangements. This implies that prior empir-ical tests may not find associations between CEOhorizon and firm long-term expenditures in gen-eral, when in fact such associations exist in somecases and do not exist in others, depending on thestructure of CEO SERPs.
To summarize, the study makes several fruitfultheoretical and empirical contributions to researchon compensation, information transparency, andmanagerial opportunism. I also hope to attractthe attention of researchers to supplemental retire-ment benefits—a common, significant, unique butunderexplored component of executive pay. Man-agerial compensation and its specific componentshave been a subject of hundreds of books andstudies for almost a century. However, despiteapparent interest of professional media in thenature, role, magnitude, and adequacy of postre-tirement benefits, the body of scientific knowledgeon SERPs remains minimal at best, thus provid-ing fertile ground for future studies. Also, withrecent changes in compensation disclosure regula-tions, the cost of SERP data collection and process-ing should become significantly lower. Researchtopics to be considered include, but are not lim-ited to, relationships between SERP benefits andvarious individual-level (e.g., risk aversion, per-sonal wealth) and firm-level (e.g., managementstructure, governance mechanisms, organizationalculture) phenomena, the variation in complexityand transparency of SERPs, specific mechanismsused to inflate SERP benefits, the impact of R&Ddecisions on the magnitude of SERP benefits, andSERPs of top managers other than CEOs. Finally,it is essential that future empirical studies takeSERP benefits into account when measuring andanalyzing total executive compensation.
ACKNOWLEDGEMENTS
I am indebted to Michel Magnan for his guid-ance and support. I am grateful to David Balkin,Emilio Boulianne, Alistair Byrne, Joe Comprix,John Core, Steve Fortin, Jose Garrido, RobertHoskisson, Amin Mawani, Jerold Zimmerman, andanonymous reviewers for their valuable comments.I gratefully acknowledge the financial support from
Copyright 2008 John Wiley & Sons, Ltd. Strat. Mgmt. J., 30: 405–423 (2009)DOI: 10.1002/smj

422 P. Kalyta
Fonds quebecois de la recherche sur la societe etla culture and the suggestions of workshop par-ticipants at the University of Ottawa, ConcordiaUniversity, the BAA Conference, the EFMA Meet-ing, the AAA Meeting, and the ASAC Conference.
REFERENCES
Adams R, Almeida H, Ferreira D. 2005. Powerful CEOsand their impact on corporate performance. TheReview of Financial Studies 18(4): 1403–1432.
Antle R, Smith A. 1985. Measuring executive compensa-tion: methods and an application. Journal of Account-ing Research 23(1): 296–325.
Barker VL, Mueller GC. 2002. CEO characteristics andfirm R&D spending. Management Science 48(6):782–801.
Baysinger B, Hoskisson R. 1989. Diversification strategyand R&D intensity in multiproduct firms. Academy ofManagement Journal 32(2): 310–332.
Bebchuk L, Fried J. 2004. Stealth compensation viaretirement benefits. Berkeley Business Law Journal1(2): 291–326.
Bebchuk L, Jackson R Jr. 2005. Executive pensions.Journal of Corporation Law 30(4): 823–855.
Beine M, Coulombe S. 2005. One market, one money:evidence from Canada-United States economicintegration. The World Economy 28(7): 985–1003.
Berle A, Means G. 1932. The Modern Corporation andPrivate Property . Macmillan: New York.
Bombardier Inc. 2002. Notice of the annual meet-ing of shareholders 2002. Montreal: Canada. Avail-able at: http://www2.bombardier.com/en/0 0/0 0 1 7/0 0 1 7 4/pdf/2002proxy.pdf.
Brick I, Palmon O, Wald J. 2006. CEO compensation,director compensation and firm performance: evidenceof cronyism? Journal of Corporate Finance 12(3):403–423.
Burgess L. 1963. Top Executive Pay Package. Macmillan:New York.
Cheng S. 2004. R&D expenditures and CEO compensa-tion. The Accounting Review 79(2): 305–328.
Child J. 1974. Managerial and organizational factorsassociated with company performance. Journal ofManagement Studies 11(3): 175–189.
Conyon M, He L. 2004. Compensation committees andCEO compensation incentives in U.S. entrepreneurialfirms. Journal of Management Accounting Research16(1): 35–56.
Core J. 2000. The directors’ and officers’ insurancepremium: an outside assessment of the effectivenessof corporate governance. Journal of Law, Economics,and Organization 16(2): 449–477.
Core J, Holthausen R, Larcker D. 1999. Corporategovernance, chief executive officer compensation, andfirm performance. Journal of Financial Economics51(3): 371–406.
Craighead J, Magnan M, Thorne L. 2004. The impactof mandated disclosure on performance-based CEO
compensation. Contemporary Accounting Research21(2): 369–398.
Cyert R, Kang S-H, Kumar P. 2002. Corporate gover-nance, takeovers and top-management compensation:theory and evidence. Management Science 48(4):453–469.
Dechow P, Sloan R. 1991. Executive incentives and thehorizon problem: an empirical investigation. Journalof Accounting and Economics 14(1): 51–89.
Deshpande S, Golhar D. 1997. HRM practices ofCanadian and U.S. manufacturing firms: an empiricalinvestigation. Production Planning and Control 8(3):208–212.
Doukas J, Switzer L. 2000. Common stock returns andinternational listings announcements: conditional testsof the mild segmentation hypothesis. Journal ofBanking and Finance 24(3): 471–502.
Finkelstein S. 1992. Power in top management teams:dimensions, measurement, and validation. Academy ofManagement Journal 35(3): 505–538.
Finkelstein S, Hambrick D. 1996. Strategic Leadership:Top Executives and Their Effects on Organizations .West: St. Paul, MN.
Fredrickson J, Hambrick D, Baumrin S. 1988. A modelof CEO dismissal. Academy of Management Review13(2): 255–270.
Ghosh A, Moon D, Tandon K. 2007. CEO ownershipand discretionary investments. Journal of BusinessFinance & Accounting 34(5–6): 819–839.
Ghosh C, Sirmans C. 2004. On REIT CEO compensa-tion: does board structure matter? Journal of RealEstate Finance and Economics 30(4): 429–445.
Gibbons R, Murphy K. 1992. Does executive compensa-tion affect investment? Journal of Applied CorporateFinance 5(2): 99–109.
Grinstein Y, Hribar P. 2004. CEO compensation andincentives: evidence from M&A bonuses. Journal ofFinancial Economics 73(1): 119–143.
Grossman S, Hart O. 1983. An analysis of the principal-agent problem. Econometrica 51(1): 7–45.
Hambrick D, Mason P. 1984. Upper echelons: theorganization as a reflection of its top managers.Academy of Management Review 9(2): 193–206.
Hansen GS, Hill CWL. 1991. Are institutional investorsmyopic? A time series study of four technology-driven industries. Strategic Management Journal12(1): 1–16.
Hart O, Holmstrom B. 1987. The theory of contracts. InAdvances in Economic Theory: Fifth World Congress ,Bewley T (ed). University Press: Cambridge, UK:71–155.
Harvey K, Shrieves R. 2001. Executive compensationstructure and corporate governance choices. Journalof Financial Research 24(4): 495–512.
He L, Conyon M. 2004. CEO compensation, incentivesand governance in new enterprise firms. Journal ofDerivatives Accounting 1(1): 47–60.
Hemmer T. 1993. Risk-free incentive contracts: elim-inating agency cost using option-based compensa-tion. Journal of Accounting and Economics 16(4):447–474.
Copyright 2008 John Wiley & Sons, Ltd. Strat. Mgmt. J., 30: 405–423 (2009)DOI: 10.1002/smj
Compensation Transparency and Managerial Opportunism 423
Hitt M, Hoskisson R, Ireland R, Harrison J. 1991. Effectsof acquisitions on R&D inputs and outputs. Academyof Management Journal 34(3): 693–706.
Holmstrom B. 1979. Moral hazard and observability. BellJournal of Economics 10(1): 74–91.
Holmstrom B. 1982. Moral hazard in teams. Bell Journalof Economics 13(2): 324–340.
Hoskisson R, Hitt M, Johnson R, Grossman W. 2002.Conflicting voices: the effects of ownership hetero-geneity and internal governance on corporate inno-vation strategies. Academy of Management Journal45(4): 697–716.
Hundley G, Jacobson C, Park S. 1996. Effects of prof-itability and liquidity on R&D intensity: Japanese andU.S. companies compared. Academy of ManagementJournal 39(6): 1659–1674.
Jensen M, Meckling W. 1976. Theory of the firm:managerial behavior, agency cost, and capitalstructure. Journal of Financial Economics 3(4):305–360.
Jensen M, Murphy K. 1990. Performance pay and top-management incentives. Journal of Political Economy98(2): 225–264.
Kalyta P, Magnan M. 2008. Executive pensions, disclo-sure quality, and rent extraction. Journal of Accountingand Public Policy 27(2): 133–166.
Kochhar R, David P. 1996. Institutional investors andfirm innovation: a test of competing hypotheses.Strategic Management Journal 17(1): 73–84.
Lambert R, Larcker D, Weigelt K. 1993. The structureof organizational incentives. Administrative ScienceQuarterly 38(3): 438–461.
Lewellen WG. 1968. Executive Compensation in LargeIndustrial Corporations . Columbia University Pressfor National Bureau of Economic Research: NewYork.
Long WF, Ravenscraft DJ. 1993. LBOs, debt, and R&Dintensity. Strategic Management Journal SummerSpecial Issue 14: 119–135.
Mace ML. 1971. Directors: Myth and Reality . HarvardBusiness School Press: Boston, MA.
Magnan ML, St-Onge S. 1997. Bank performance andexecutive compensation: a managerial discretionperspective. Strategic Management Journal 18(7):573–581.
Mahoney L, Thorne L. 2006. An examination of thestructure of executive compensation and corporatesocial responsibility: a Canadian investigation. Journalof Business Ethics 69(2): 149–162.
Main B, O’Reilly C, Wade J. 1995. The CEO, theboard of directors and executive compensation:economic and psychological perspectives. Industrialand Corporate Change 4(2): 293–332.
Masson R. 1971. Executive motivations, earnings andconsequent equity performance. Journal of PoliticalEconomy 79(6): 1278–1292.
May D. 1995. Do managerial motives influence firmrisk-reduction strategies? Journal of Finance 50(4):1291–1309.
Mehran H. 1995. Executive compensation structure,ownership, and firm performance. Journal of FinancialEconomics 38(2): 163–184.
Mittoo U. 1992. Additional evidence on integration inthe Canadian stock market. Journal of Finance 47(5):2035–2054.
Morck R, Shleifer A, Vishny R. 1988. Managementownership and market valuation. Journal of FinancialEconomics 20(1): 293–315.
Murphy K. 1999. Executive compensation. In Handbookof Labor Economics (Vol. 3), Ashenfelter O, Card D(eds). North Holland: New York; 2485–2563.
Murphy K, Zimmerman J. 1993. Financial performancesurrounding CEO turnover. Journal of Accounting andEconomics 16(1–3): 273–315.
Singh H, Harianto F. 1989a. Management-board rela-tionships, takeover risk, and the adoption of goldenparachutes. Academy of Management Journal 32(1):7–24.
Singh H, Harianto F. 1989b. Top management tenure,corporate ownership structure and the magnitude ofgolden parachutes. Strategic Management Journal ,Summer Special Issue 10: 143–156.
Smith C, Watts R. 1982. Incentive and tax effects ofexecutive compensation plans. Australian Journal ofManagement 7(2): 139–157.
Smith C, Zimmerman J. 1976. Valuing employee stockoption plans using option pricing models. Journal ofAccounting Research 14(1): 357–364.
Sokal R, Rohlf F. 1995. Biometry: The Principles andPractice of Statistics in Biological Research . W.H.Freeman and Co: New York.
Sundaram R, Yermack D. 2007. Pay me later: inside debtand its role in managerial compensation. Journal ofFinance 62(4): 1551–1588.
Vancil R. 1987. Passing the Baton: Managing the Processof CEO Succession . Harvard Business School Press:Boston, MA.
Wade J, O’Reilly C, Chandratat I. 1990. Goldenparachutes: CEOs and the exercise of social influence.Administrative Science Quarterly 35(4): 587–603.
Yermack D. 1996. Higher market valuation for firmswith a small board of directors. Journal of FinancialEconomics 40(2): 185–211.
Zajac E, Westphal J. 1995. Accounting for the explana-tions of CEO compensation: substance and symbolism.Administrative Science Quarterly 40(2): 283–308.
Zajac E, Westphal J. 1996. Who shall succeed? HowCEO/board preferences and power affect the choice ofnew CEOs. Academy of Management Journal 39(1):64–90.
Zajac E, Westphal J. 1997. Managerial incentives in orga-nizations: economic, political, and symbolic perspec-tives. In Organizational Decision Making , Shapiro Z(ed). Cambridge University Press: Cambridge, MA;133–157.
Zar J. 1999. Biostatistical Analysis . Prentice Hall: UpperSaddle River, NJ.
Copyright 2008 John Wiley & Sons, Ltd. Strat. Mgmt. J., 30: 405–423 (2009)DOI: 10.1002/smj