compensation study phase i philosophy discussion · pdf filein terms of performance, relative...
TRANSCRIPT
© 2014 Grant Thornton LLP. All rights reserved.
Compensation Study
Phase I Philosophy Discussion March 15, 2016
Eric Gonzaga, Principal Bill Gentry, Managing Director Executive Compensation Consulting
Agenda Item 7 - Attachment 1 - Page 1 of 31

© Grant Thornton LLP. All rights reserved.
Agenda
• Summary of Findings and Considerations
• Peer Group Analysis and Assessment
• Recommended Total Compensation Philosophy/Design Considerations
• Governance and Next Steps
Agenda Item 7 - Attachment 1 - Page 2 of 31
© 2014 Grant Thornton LLP. All rights reserved.
Summary of
Findings and Considerations
Agenda Item 7 - Attachment 1 - Page 3 of 31
© Grant Thornton LLP. All rights reserved.
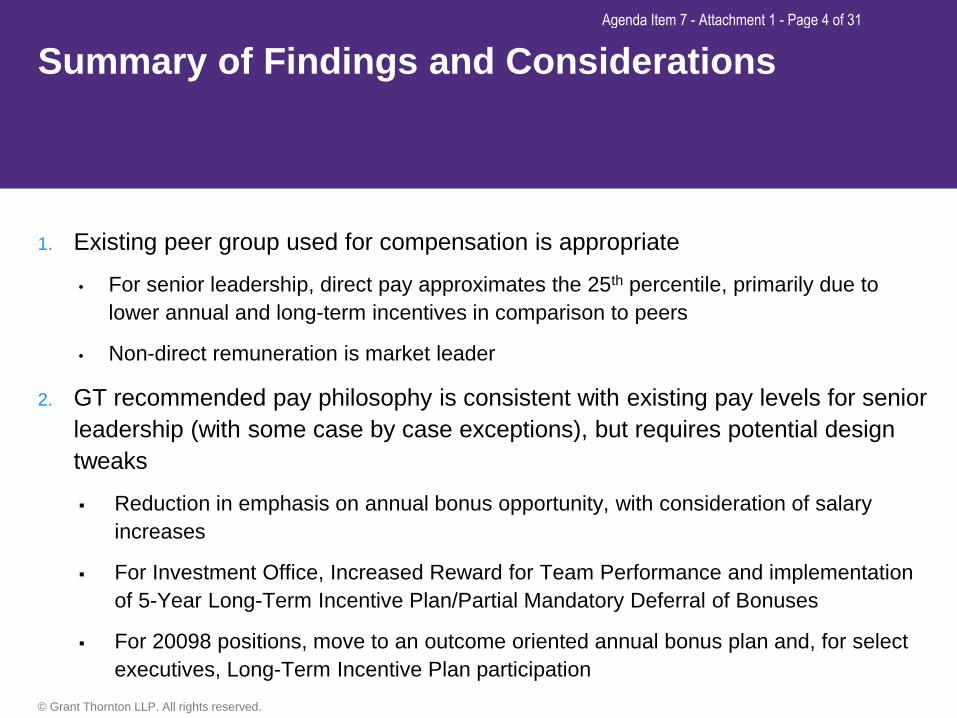
Summary of Findings and Considerations
1. Existing peer group used for compensation is appropriate
• For senior leadership, direct pay approximates the 25th percentile, primarily due to lower annual and long-term incentives in comparison to peers
• Non-direct remuneration is market leader
2. GT recommended pay philosophy is consistent with existing pay levels for senior leadership (with some case by case exceptions), but requires potential design tweaks
Reduction in emphasis on annual bonus opportunity, with consideration of salary increases
For Investment Office, Increased Reward for Team Performance and implementation of 5-Year Long-Term Incentive Plan/Partial Mandatory Deferral of Bonuses
For 20098 positions, move to an outcome oriented annual bonus plan and, for select executives, Long-Term Incentive Plan participation
Agenda Item 7 - Attachment 1 - Page 4 of 31
© Grant Thornton LLP. All rights reserved.
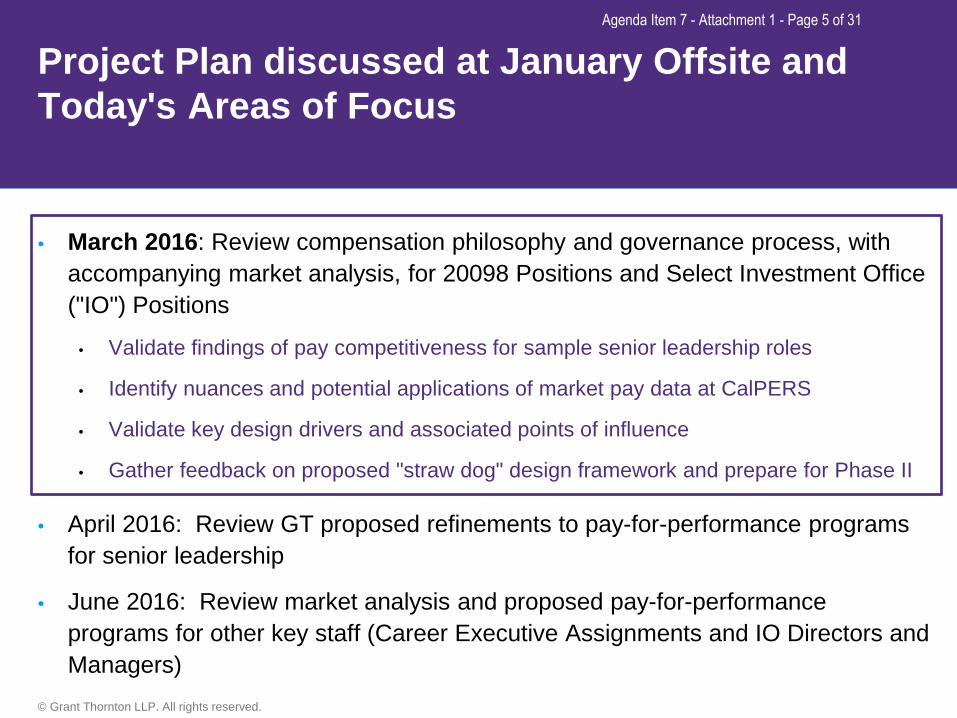
Project Plan discussed at January Offsite and Today's Areas of Focus
• March 2016: Review compensation philosophy and governance process, with accompanying market analysis, for 20098 Positions and Select Investment Office ("IO") Positions
• Validate findings of pay competitiveness for sample senior leadership roles
• Identify nuances and potential applications of market pay data at CalPERS
• Validate key design drivers and associated points of influence
• Gather feedback on proposed "straw dog" design framework and prepare for Phase II
• April 2016: Review GT proposed refinements to pay-for-performance programs for senior leadership
• June 2016: Review market analysis and proposed pay-for-performance programs for other key staff (Career Executive Assignments and IO Directors and Managers)
Agenda Item 7 - Attachment 1 - Page 5 of 31
© Grant Thornton LLP. All rights reserved.
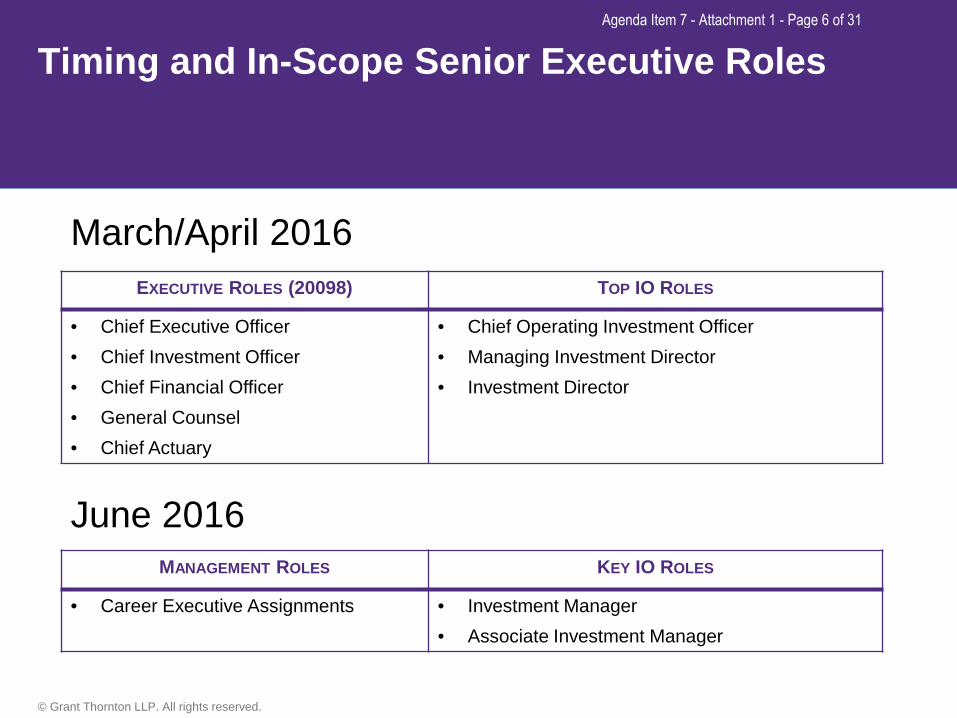
Timing and In-Scope Senior Executive Roles
EXECUTIVE ROLES (20098) TOP IO ROLES
• Chief Executive Officer • Chief Investment Officer • Chief Financial Officer • General Counsel • Chief Actuary
• Chief Operating Investment Officer • Managing Investment Director • Investment Director
March/April 2016
June 2016 MANAGEMENT ROLES KEY IO ROLES
• Career Executive Assignments
• Investment Manager • Associate Investment Manager
Agenda Item 7 - Attachment 1 - Page 6 of 31
© 2014 Grant Thornton LLP. All rights reserved.
Peer Group
Analysis and Assessment
Agenda Item 7 - Attachment 1 - Page 7 of 31

© Grant Thornton LLP. All rights reserved.
Discussion of market data starts with CalPERS compensation peer group
• Existing peer group provides an accurate representation of the value and cost of talent needed to successfully lead CalPERS – no suggested changes
• Multi-category representation of peers creates a broad swath of potential pay outcomes and pay practices to consider – how best to view external data?
― CalPERS is unique among Pension Funds, as reflected by size of membership base and AUM, product and service offerings, and "high touch" customer service levels
― Key is to strike the right balance between "best practice" and "best fit"
― What philosophies and strategies best align with our visibility, 100-year mission, risk tolerances, talent needs, and public agency status?
• CalPERS's unique "filters" support second quartile pay for "top of house"
• CalPERS is able to attract and retain the necessary skill levels in top positions
• Unnecessary to fully match market; intangibles bridge the gap
Agenda Item 7 - Attachment 1 - Page 8 of 31

© Grant Thornton LLP. All rights reserved.
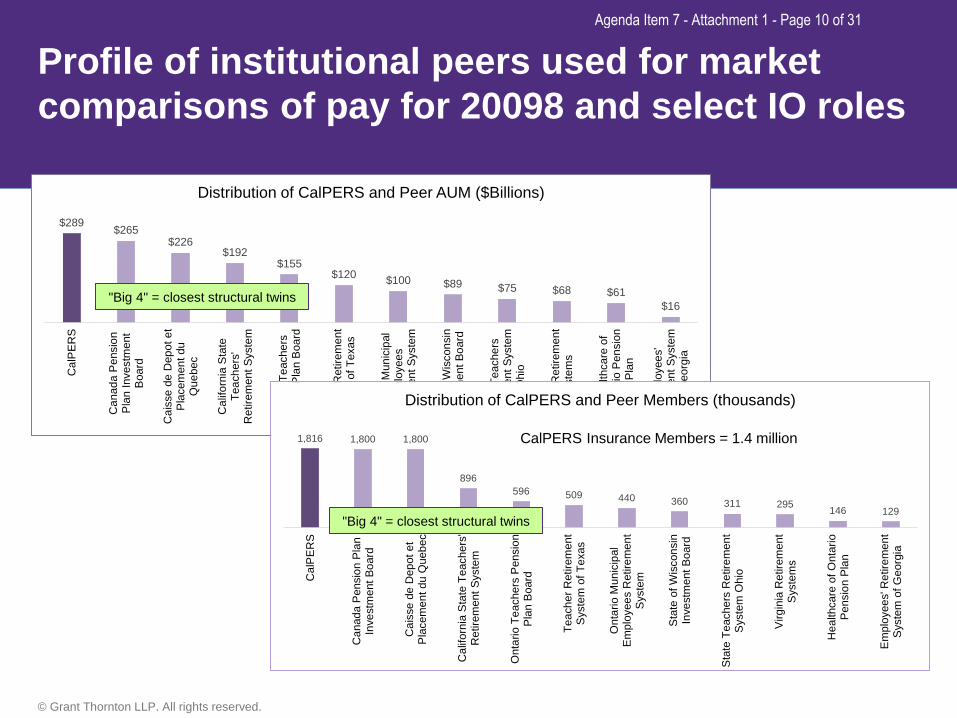
Profile of institutional peers used for market comparisons of pay for 20098 and select IO roles
1 year 3 year 5 year 10 Year
25th Percentile 295,000 $71,224 $3,926 72.2% 5.58% 11.10% 8.55% 6.93%Median 360,000 $100,200 $6,704 80.4% 11.80% 11.88% 11.10% 7.52%75th Percentile 509,310 $173,161 $12,703 90.3% 15.12% 12.00% 11.97% 8.15%CalPERS 1,815,699 $288,900 $7,173 73.3% 2.40% 10.90% 10.70% 6.20%Percent Rank Above Rank Above Rank 55th 29th Below Rank 15th 46th Below Rank
Investment Income
(Millions)
% of Plan Funded
Total Return
Institution Name
Headcount - Members
AUM (Millions)
Data as of 12/31/2015
In terms of performance, relative comparisons oversimplify matters by ignoring CalPERS's 100-year mission, progress against its target rate of return of 7.5%, and the underlying investment strategies. It also fails to recognize risk considerations (e.g., losses, avoidance of significant draw downs).
Details on size comparisons appear on the next slide. The challenges and complexities of managing CalPERS is unsurpassed within the pension fund industry.
Size tends to dictate pay philosophy, with the largest pension funds – those closest to serving as CalPERS's structural twins – more willing to align with private sector pay practices than others
Agenda Item 7 - Attachment 1 - Page 9 of 31
© Grant Thornton LLP. All rights reserved.
$289 $265$226
$192$155
$120 $100 $89 $75 $68 $61$16
Cal
PER
S
Can
ada
Pen
sion
Pla
n In
vest
men
tB
oard
Cai
sse
de D
epot
et
Pla
cem
ent d
uQ
uebe
c
Cal
iforn
ia S
tate
Teac
hers
'R
etire
men
t Sys
tem
Ont
ario
Tea
cher
sP
ensi
on P
lan
Boa
rd
Teac
her R
etire
men
tS
yste
m o
f Tex
as
Ont
ario
Mun
icip
alE
mpl
oyee
sR
etire
men
t Sys
tem
Sta
te o
f Wis
cons
inIn
vest
men
t Boa
rd
Sta
te T
each
ers
Ret
irem
ent S
yste
mO
hio
Virg
inia
Ret
irem
ent
Sys
tem
s
Hea
lthca
re o
fO
ntar
io P
ensi
onP
lan
Em
ploy
ees'
Ret
irem
ent S
yste
mof
Geo
rgia
Distribution of CalPERS and Peer AUM ($Billions)
Profile of institutional peers used for market comparisons of pay for 20098 and select IO roles
"Big 4" = closest structural twins
1,816 1,800 1,800
896596 509 440 360 311 295 146 129
Cal
PER
S
Can
ada
Pen
sion
Pla
nIn
vest
men
t Boa
rd
Cai
sse
de D
epot
et
Pla
cem
ent d
u Q
uebe
c
Cal
iforn
ia S
tate
Tea
cher
s'R
etire
men
t Sys
tem
Ont
ario
Tea
cher
s P
ensi
onP
lan
Boa
rd
Teac
her R
etire
men
tS
yste
m o
f Tex
as
Ont
ario
Mun
icip
alE
mpl
oyee
s R
etire
men
tS
yste
m
Sta
te o
f Wis
cons
inIn
vest
men
t Boa
rd
Sta
te T
each
ers
Ret
irem
ent
Sys
tem
Ohi
o
Virg
inia
Ret
irem
ent
Sys
tem
s
Hea
lthca
re o
f Ont
ario
Pen
sion
Pla
n
Em
ploy
ees'
Ret
irem
ent
Sys
tem
of G
eorg
ia
Distribution of CalPERS and Peer Members (thousands)
"Big 4" = closest structural twins
CalPERS Insurance Members = 1.4 million
Agenda Item 7 - Attachment 1 - Page 10 of 31

© Grant Thornton LLP. All rights reserved.
Comments on Market Data Multi-category representation
Broad swath of pay values (potentially high margin of error)
Ignores variations in environment, mission, strategy, talent needs, risk tolerances, and intangibles
"25P" is not impeding CalPERS's talent acquisition/retention efforts
CalPERS drops to Lowest Quartile when compared against the next four largest Pension Funds ("Big 4")
Market Pay Analysis for in-scope roles identifies competitive pay positioning and the relative cost of management
Note: Total Direct Compensation is defined as the sum of base salary and incentive compensation. Pension funding based on employer's cost (pre and post employment start date of 2013) exceed market but "holding power" or appeal among participants can vary considerably at different points in time.
Maximum
75th Percentile
50th Percentile
25th Percentile
Minimum
Top Quartile
Third Quartile
Second Quartile
Lowest Quartile CalPERS
Pay is within a representative range of observed practices (existing peers)
25P
Agenda Item 7 - Attachment 1 - Page 11 of 31

© Grant Thornton LLP. All rights reserved.
Big 4 share pay philosophy characteristics, appearing more like private companies than public agencies
1.00
1.83
0.81
1.09 1.00 0.98
0.47 0.53
CEO CIO CFO COIO
Total Direct Pay as a Ratio of CEO Pay*
CalPERS Top 4 Pension
Select Characteristics of "Big 4" Pension Funds • Less variation between
CEO and Top IO pay levels
• Stated pay positioning targets/percentiles
• Heavier emphasis on variable pay
• Long-term incentives • Balanced performance
perspectives • Total Fund performance • Enhanced holding power
(retention) and value at risk for claw back
* Market pay ratios reflect composite data
Agenda Item 7 - Attachment 1 - Page 12 of 31
© Grant Thornton LLP. All rights reserved.
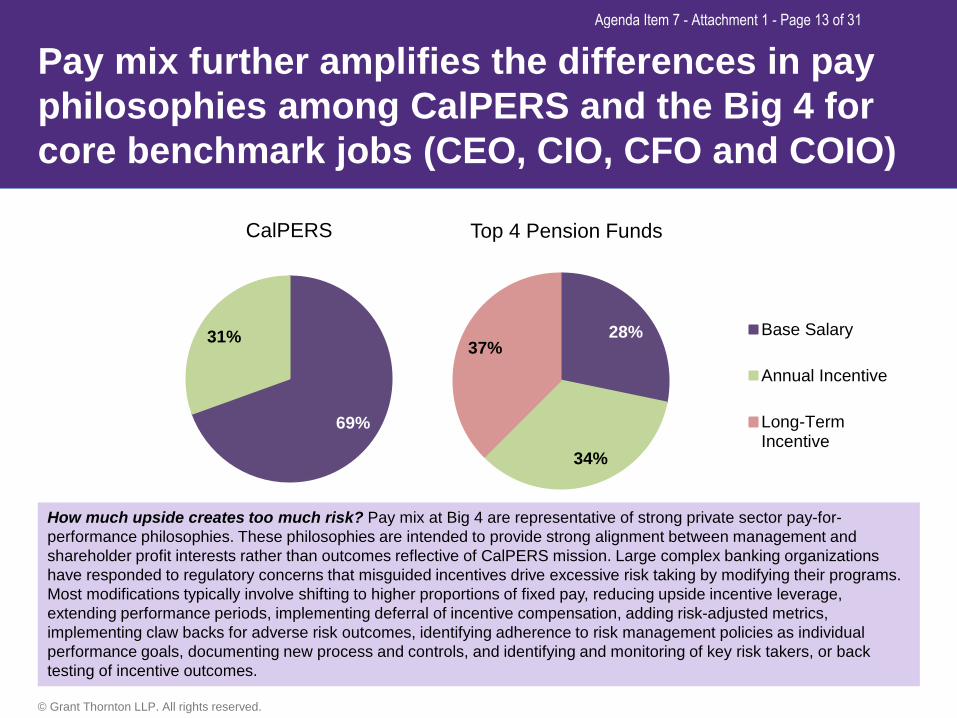
Pay mix further amplifies the differences in pay philosophies among CalPERS and the Big 4 for core benchmark jobs (CEO, CIO, CFO and COIO)
69%
31%
CalPERS
28%
34%
37%
Top 4 Pension Funds
Base Salary
Annual Incentive
Long-TermIncentive
How much upside creates too much risk? Pay mix at Big 4 are representative of strong private sector pay-for-performance philosophies. These philosophies are intended to provide strong alignment between management and shareholder profit interests rather than outcomes reflective of CalPERS mission. Large complex banking organizations have responded to regulatory concerns that misguided incentives drive excessive risk taking by modifying their programs. Most modifications typically involve shifting to higher proportions of fixed pay, reducing upside incentive leverage, extending performance periods, implementing deferral of incentive compensation, adding risk-adjusted metrics, implementing claw backs for adverse risk outcomes, identifying adherence to risk management policies as individual performance goals, documenting new process and controls, and identifying and monitoring of key risk takers, or back testing of incentive outcomes.
Agenda Item 7 - Attachment 1 - Page 13 of 31
© Grant Thornton LLP. All rights reserved.
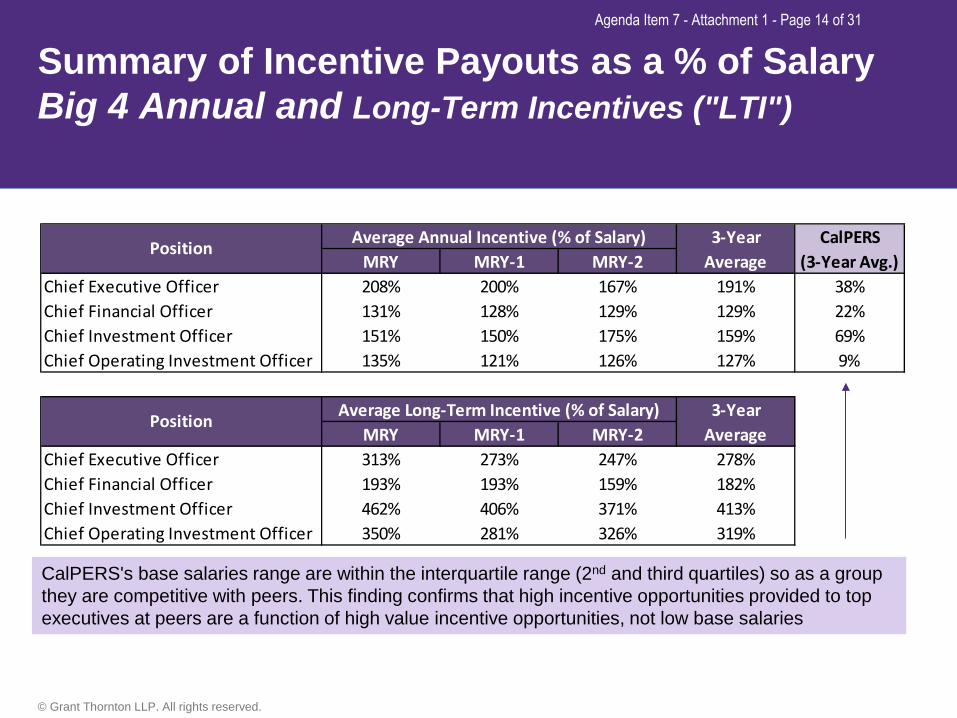
Summary of Incentive Payouts as a % of Salary Big 4 Annual and Long-Term Incentives ("LTI")
MRY MRY-1 MRY-2Chief Executive Officer 208% 200% 167% 191% 38%Chief Financial Officer 131% 128% 129% 129% 22%Chief Investment Officer 151% 150% 175% 159% 69%Chief Operating Investment Officer 135% 121% 126% 127% 9%
MRY MRY-1 MRY-2Chief Executive Officer 313% 273% 247% 278%Chief Financial Officer 193% 193% 159% 182%Chief Investment Officer 462% 406% 371% 413%Chief Operating Investment Officer 350% 281% 326% 319%
Position Average Annual Incentive (% of Salary) 3-Year Average
CalPERS(3-Year Avg.)
Position Average Long-Term Incentive (% of Salary) 3-Year Average
CalPERS's base salaries range are within the interquartile range (2nd and third quartiles) so as a group they are competitive with peers. This finding confirms that high incentive opportunities provided to top executives at peers are a function of high value incentive opportunities, not low base salaries
Agenda Item 7 - Attachment 1 - Page 14 of 31

© Grant Thornton LLP. All rights reserved.
Incentive plan performance metrics and measurement periods as disclosed by peers (including the Big 4)
Organization Short-term Long-term (typically 3-4 years)
Peers • Performance of Total Fund • Balanced scorecard • Individual objectives • Value added investment performance • Performance of division/department fund • Overall investment performance • Performance on strategic planning
objectives
• Cumulative rate of return • Total Fund net value and absolute
return • Investment returns compared to relative
and absolute benchmarks • Achievement of target returns • Asset class performance • Performance factor – 3rd party
committed capital raised and management fee income
• Positive actual returns net of costs
CalPERS • IO – Relative Performance vs. Index • 20098 – Activity-based goals
• Not applicable
CalPERS's value chain and how each business segment creates value appears on slide 19. The identified metrics serve as measurable outcomes that might serve as the basis for migrating from activity-based metrics to output-based metrics
Agenda Item 7 - Attachment 1 - Page 15 of 31

© 2014 Grant Thornton LLP. All rights reserved.
Total Compensation Philosophy
Recommendations and
Impact on Design
Agenda Item 7 - Attachment 1 - Page 16 of 31

© Grant Thornton LLP. All rights reserved.
Relative considerations help give rise to the underpinnings of pay philosophy
Size Annual/Short-term Performance
Long-Term Performance
• To what extent should size (AUM, members) influence total pay competitiveness and the structure and role of each pay elements? Who are our peers?
• Does a role exist for short-term incentives for 20098 and Top IO roles? What is the relevant norm(s)? Do we understand how we create value? Can it be rewarded?
• Does a role exist for long-term incentives to better reflect progress against our 100-year mission? What about our target rate return of 7.5%? What do peers do?
• Is size an appropriate proxy for complexity? What are the implications for talent and retention strategies? What are the sources/destinations of talent?
• Do we pay incentives for the right things? Do we appropriately reward value creation? Should relative performance matter? What do relevant peers do?
• How should risk considerations and ALM principles shape our views of performance and pay?
• How should CalPERS's "filters" influence our thinking on pay structure and competitive positioning?
• Is annual performance (with a three-year look back for IO) the right measurement period? What about the various risks?
• How should pay align with investment strategies to avoid significant "draw downs" of capital?
Agenda Item 7 - Attachment 1 - Page 17 of 31
© Grant Thornton LLP. All rights reserved.
Recap of Key Pay Influencers
• CalPERS is unique, as evidenced by its visibility, size, complexity, and constituencies
• Mission needs to remain at the forefront of all our efforts, guiding how we view performance and risk, defining our talent and workforce needs, and influencing pay design
• Pay philosophy should represent a hybrid approach as compared to market, recognizing the need for thoughtful puts and takes to arrive at a comprehensive and balanced philosophy
• Talent sources and destinations are varied and distinct
• 20098 (and CEAs) sourced from public agencies or private industry following long-term service
• Top IO roles reflect same sources and destinations as 20098
• Middle management IO roles are home grown or sourced from for-profit industry not necessarily subject to pay design parameters under which CalPERS operates
• Alignment with relevant pay reference points will vary – "one size" fits all approach is infeasible; i.e., different targeted market for middle management IO versus most senior leadership
• 100-year mission provides an additional dimension as to how the business is managed
• Big 4 pension funds rely on robust pay packages with significant value to be gained from one-year to as much as four-year returns
• Pay mix at CalPERS should avoid motivating executives to take excessive risks
Agenda Item 7 - Attachment 1 - Page 18 of 31

© Grant Thornton LLP. All rights reserved.
Recap of Key Pay Influencers, continued.
• Pay has evolved along with the organization, creating disconnects with 100-year mission
• Decision to pay incentives outside of IO has been made; eliminating incentives changes the deal; incentives represent a hybrid pay strategy that makes sense for CalPERS provided the value of the opportunity and the metrics under which incentives are paid support business and talent strategies
• Incentive effectiveness can be enhanced to better align with mission and focus and hold participants accountable for the value they create (see Value Chain on slide 19)
• Current metrics for non-IO roles relate to activities rather than measurable outputs
• Long-term total fund return vs goal (7.5%) is the final arbiter of success
• Relative performance assessments do not necessarily map to goal in any given period
• Investment and economic cycles greatly influence total fund performance – investment returns fluctuate as do the associated risks
• Closing the funding shortfall within acceptable risk parameters will take time if investment returns alone are expected to close the gap
• Effective risk management and avoidance of significant draw downs generate value
Agenda Item 7 - Attachment 1 - Page 19 of 31

© Grant Thornton LLP. All rights reserved.
What metrics best reflect value creation? What are the potential "measures that matter"?
Incentive effectiveness can be enhanced by rewarding measureable value creating behaviors. Current state is partially aligned with this principle.
CalPERS Corporate
Insurance
IO
• Governmental & Board Relations • Key Influencer on Important Issues (e.g., ACA) • Cost Effective Management • Member Satisfaction/Service • Employee Engagement (turnover) • Compliance
• Cost Management/Containment • Wellness & Prevention (Member well-being) • Talent development (succession readiness)
• Cross-asset class fund performance • Investment Income • Total fund long-term performance vs. 7.5% • Alignment with corporate philosophy and beliefs • Funding gap • Avoidance of significant draw downs • Talent development (succession readiness)
Bold font identifies potential new incentive metrics
"Value Chain"
Agenda Item 7 - Attachment 1 - Page 20 of 31
© Grant Thornton LLP. All rights reserved.
Sample Compensation Philosophy
1. CalPERS's business needs demand we identify, attract, develop and retain the right talent to meet our objectives, manage our business, and actively support our values
2. The combination of direct and indirect forms of pay help us compete successfully for talent
• Our talent management and pay planning efforts will consider all forms of compensation given our top of market indirect remuneration (e.g., prestige, culture, and benefits)
• For senior most positions, we will target the 25th to 35th percentile of like agencies, with pay as high as the 50th percentile direct compensation for outstanding performance
• For IO middle management, we will target 50th percentile direct compensation of a blend of like agencies and industry-based organizations
3. Our competitive frame for talent (sources and destinations) is diverse, requiring customization in our pay philosophies and the underlying strategies
• Points of commonality: mission, values, adherence to risk management principles
4. CalPERS's business model reflects the needs of our members and recognizes that we create value in different ways – and that it should be rewarded using strategies supportive of our mission and the attainment of long-term objectives
5. Risk management is everyone's job and it will be reflected in our performance assessment process and incentive compensation decisions and outcomes
Agenda Item 7 - Attachment 1 - Page 21 of 31

© Grant Thornton LLP. All rights reserved.
Sample Compensation Philosophy, continued.
6. CalPERS's pays base salaries to reflect the value of each role's skills, as defined by relevant external and internal reference points, and for key risk takers, and as a counterbalance to incentive strategies that otherwise could motivate excessive risk taking or behaviors that are not aligned with our mission or long-term goals
7. CalPERS's relies on incentives to reward and hold leaders and key contributors accountable for value creating outcomes that benefit of all constituents
• Incentive opportunities should strike the right balance between risk and reward
• Only those roles that are accountable for our success should participate
• Shared accountability and the reward of collective success are foundational aspects of our incentive strategies, with individual success secondary
• Short-term incentives provide an effective means to reward performance outcomes that drive our long-term success and make meaningful contributions to operational success
• Long-term incentives reflect our belief that our success resides our business leaders, who anticipate and plan for the future and serve as the drivers of our risk management efforts, and is best measured and rewarded over extended periods of time (5+ years)
Agenda Item 7 - Attachment 1 - Page 22 of 31
© Grant Thornton LLP. All rights reserved.
Sample Compensation Philosophy, continued.
8. Our Chief Executive Officer is instrumental to our success, playing a unique role in the performance and oversight of the enterprise
• Best equipped to assess talent, set short-term goals, develop and approve strategies, etc. and provide credible challenge to management on behalf of the Board of Administration
• Our approach to CEO pay is unique among pension funds, reflecting our expectations, needs and objectives
• Base salary value set equivalent to CIO's base salary • Modest bonus participation, with incentive tied to enterprise-wide annual outcomes • Addition of a five-year long-term incentive opportunity for total fund performance vs. 7.5%
• 50% of earned value paid at the end of five years • 50% of payment deferred and paid on the first and second anniversary of the CEO's
termination date (deferred value subject to ongoing adjustments for total fund's investment returns)
• Sample pay strategies for other employee segments appear on the next slide
Agenda Item 7 - Attachment 1 - Page 23 of 31

© Grant Thornton LLP. All rights reserved.
Translating the Sample Pay Philosophy into hypothetical pay strategies are intended to identify the PCTM's design preferences
Sample Adjustments
23
Desired Outcomes • Raise fixed pay to better align with risk considerations
• Differentiate pay packages within competitive frame for talent (more pay certainty as an offset to high perceived upside of variable pay opportunities)
• Put most key contributors on equal footing in regards to annual incentive compensation (reducing distractions created by winners and losers)
• Simultaneously reduce emphasis on short-term focus and extend long-term focus to better align with mission and economic and investment cycles
• Create alignment of interests by focusing on value creating outcomes
• Create ex poste accountability for performance outcomes by linking LTI/deferred account values to total fund performance
• Align CEO with Board interests as it relates to performance, talent and execution of strategy
Employee Segment
Base Salary
AnnualBonus
Long-term Incentive/ Deferrals
CEO
Top IO Roles
20098
CEAs ― ― ―
IO Middle Management
Agenda Item 7 - Attachment 1 - Page 24 of 31

© Grant Thornton LLP. All rights reserved.
Translating the Sample Pay Philosophy into hypothetical pay strategies
Employee Segment
Approach ("Key Pay Influencers")
Base Salary Data Reference Points
Total Pay Reference Pts & Incentive Elements
Workforce Public Agency or Contract CAL HR or Contract No bonus
CEAs Public Agency + Hybrid CAL HR Structure Bonus of 15% of Salary
20098 Public Agency + Hybrid 85% of Current Target Total Pay
Bonus of 15%, New LTI
CEO Hybrid Same as CIO Bonus of 25%, New LTI
Top IO Roles Hybrid + Industry 75% of Current Target Total Pay
Bonus of 25%, bonus deferral above target, New LTI
IO Middle Management
Industry + Hybrid 75% of Market Total Pay at P50
Bonus of 25%, Bonus deferral above target, New LTI
Hypothetical Pay Strategies
Note: Comments on incentive features appear on the next slide.
24
Agenda Item 7 - Attachment 1 - Page 25 of 31
© Grant Thornton LLP. All rights reserved.
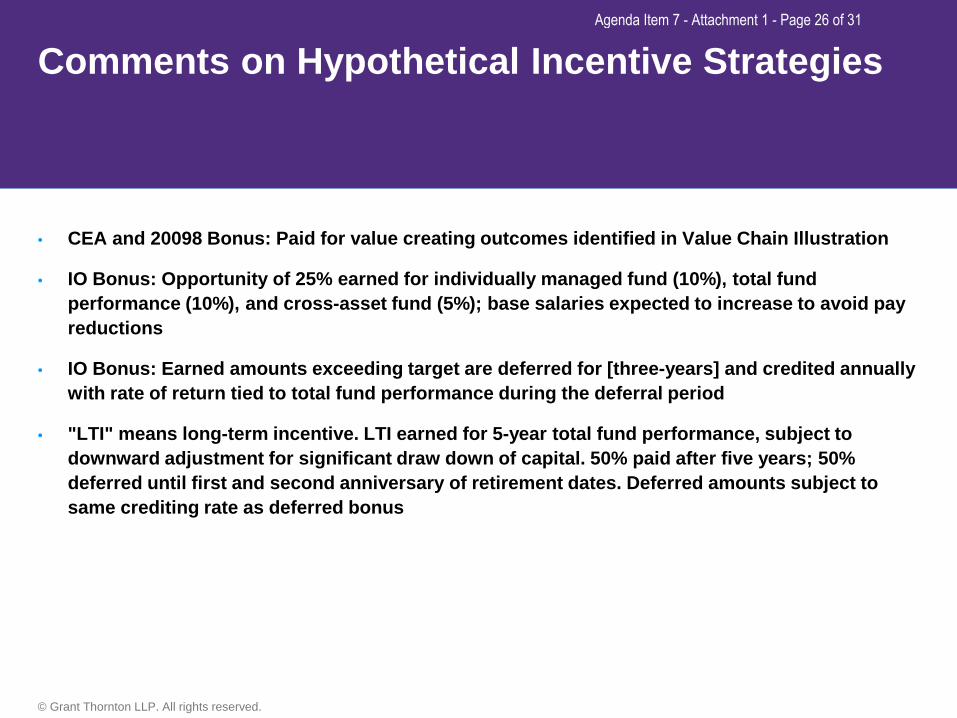
Comments on Hypothetical Incentive Strategies
• CEA and 20098 Bonus: Paid for value creating outcomes identified in Value Chain Illustration
• IO Bonus: Opportunity of 25% earned for individually managed fund (10%), total fund performance (10%), and cross-asset fund (5%); base salaries expected to increase to avoid pay reductions
• IO Bonus: Earned amounts exceeding target are deferred for [three-years] and credited annually with rate of return tied to total fund performance during the deferral period
• "LTI" means long-term incentive. LTI earned for 5-year total fund performance, subject to downward adjustment for significant draw down of capital. 50% paid after five years; 50% deferred until first and second anniversary of retirement dates. Deferred amounts subject to same crediting rate as deferred bonus
Agenda Item 7 - Attachment 1 - Page 26 of 31
© 2014 Grant Thornton LLP. All rights reserved.
Governance and Next Steps
Agenda Item 7 - Attachment 1 - Page 27 of 31
© Grant Thornton LLP. All rights reserved.
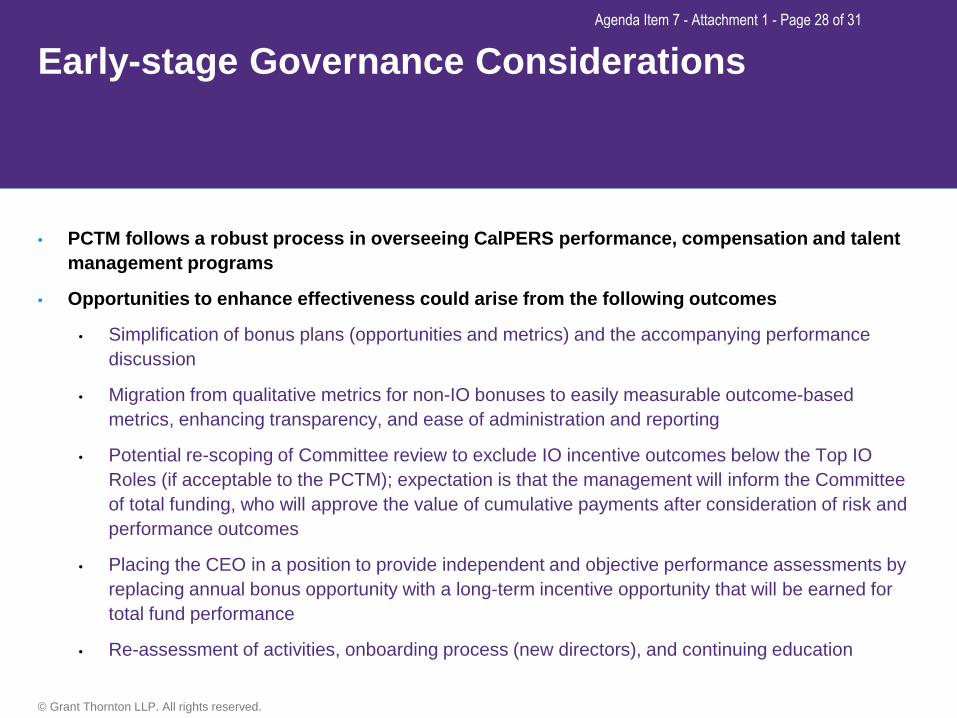
Early-stage Governance Considerations
• PCTM follows a robust process in overseeing CalPERS performance, compensation and talent management programs
• Opportunities to enhance effectiveness could arise from the following outcomes
• Simplification of bonus plans (opportunities and metrics) and the accompanying performance discussion
• Migration from qualitative metrics for non-IO bonuses to easily measurable outcome-based metrics, enhancing transparency, and ease of administration and reporting
• Potential re-scoping of Committee review to exclude IO incentive outcomes below the Top IO Roles (if acceptable to the PCTM); expectation is that the management will inform the Committee of total funding, who will approve the value of cumulative payments after consideration of risk and performance outcomes
• Placing the CEO in a position to provide independent and objective performance assessments by replacing annual bonus opportunity with a long-term incentive opportunity that will be earned for total fund performance
• Re-assessment of activities, onboarding process (new directors), and continuing education
Agenda Item 7 - Attachment 1 - Page 28 of 31
© Grant Thornton LLP. All rights reserved.
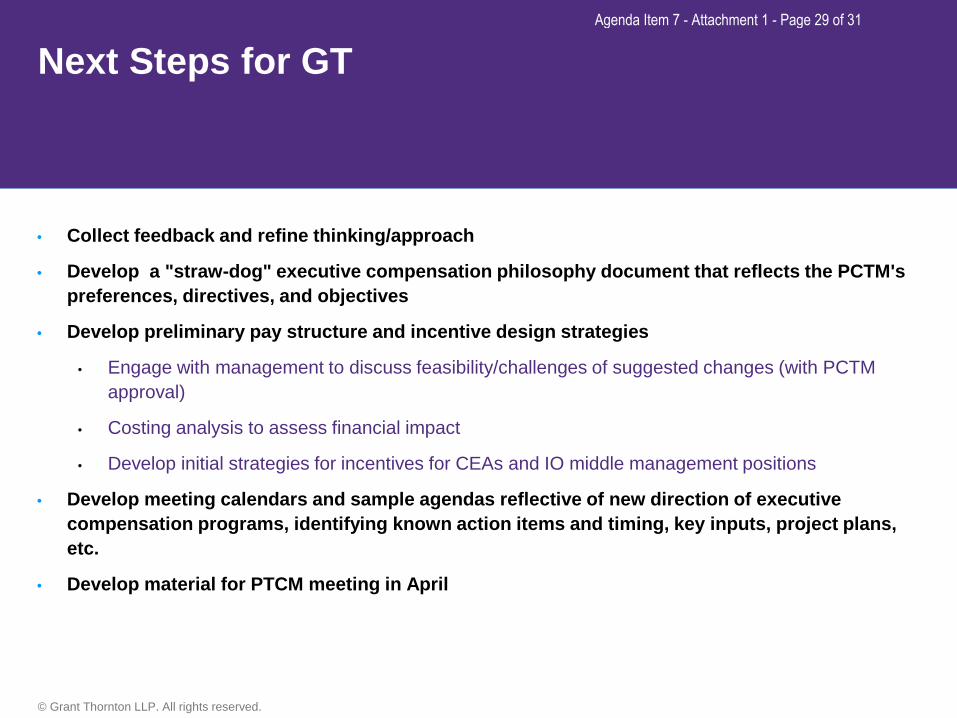
Next Steps for GT
• Collect feedback and refine thinking/approach
• Develop a "straw-dog" executive compensation philosophy document that reflects the PCTM's preferences, directives, and objectives
• Develop preliminary pay structure and incentive design strategies
• Engage with management to discuss feasibility/challenges of suggested changes (with PCTM approval)
• Costing analysis to assess financial impact
• Develop initial strategies for incentives for CEAs and IO middle management positions
• Develop meeting calendars and sample agendas reflective of new direction of executive compensation programs, identifying known action items and timing, key inputs, project plans, etc.
• Develop material for PTCM meeting in April
Agenda Item 7 - Attachment 1 - Page 29 of 31

© Grant Thornton LLP. All rights reserved.
Comments/Questions?
Agenda Item 7 - Attachment 1 - Page 30 of 31
© Grant Thornton LLP. All rights reserved.
Disclaimer
This presentation is not a comprehensive analysis of the subject matters covered and may include proposed guidance that is subject to change before it is issued in final form. All relevant facts and circumstances, including the pertinent authoritative literature, need to be considered to arrive at conclusions that comply with matters addressed in this presentation. The views and interpretations expressed in the presentation are those of the presenters and the presentation is not intended to provide accounting or other advice or guidance with respect to the matters covered. For additional information on matters covered in this presentation, contact your Grant Thornton, LLP adviser.
Agenda Item 7 - Attachment 1 - Page 31 of 31