compensation and workforce trends in the medical … by radford radford is part of aon hewitt, a...
TRANSCRIPT

Prepared by RadfordRadford is part of Aon Hewitt, a business unit of Aon plc.
Compensation and Workforce Trends in the Medical Device IndustryBoston, MAEd Speidel, PartnerRam Kumar, Director

RadfordProprietary & Confidential2
Today’s Topics
US Market and Employment Outlook Labor Trends Short-Term Incentive Practices Private and Public Long-Term Incentive Practices Executive Compensation and Governance Trends

RadfordProprietary & Confidential3
US Unemployment
The unemployment rate in Massachusetts has tracked below the national average for years and stands at 4.7% as of November 2015
Buoyed by the high volume of life sciences jobs, the state emerged strongly out of the recession and experienced solid job growth in recent years
Source: Economic Data, Federal Reserve Bank of St. Louis.
5.04.74.6
0.0
2.0
4.0
6.0
8.0
10.0
12.0
Northeast Massachusetts US

RadfordProprietary & Confidential4
US Equity Market
High-performing life sciences stocks fell into bear territory in September 2015, and though the market has made a slight recovery, some stocks are still stumbling
Source: Yahoo! Finance.
0%
50%
100%
150%
200%
250%
300%
350%
1/2015 2/2015 3/2015 4/2015 5/2015 6/2015 7/2015 8/2015 9/2015 10/2015 11/2015
Dow Jones NASDAQ NASDAQ Healthcare
RadfordProprietary & Confidential5
Behind Today’s Data…
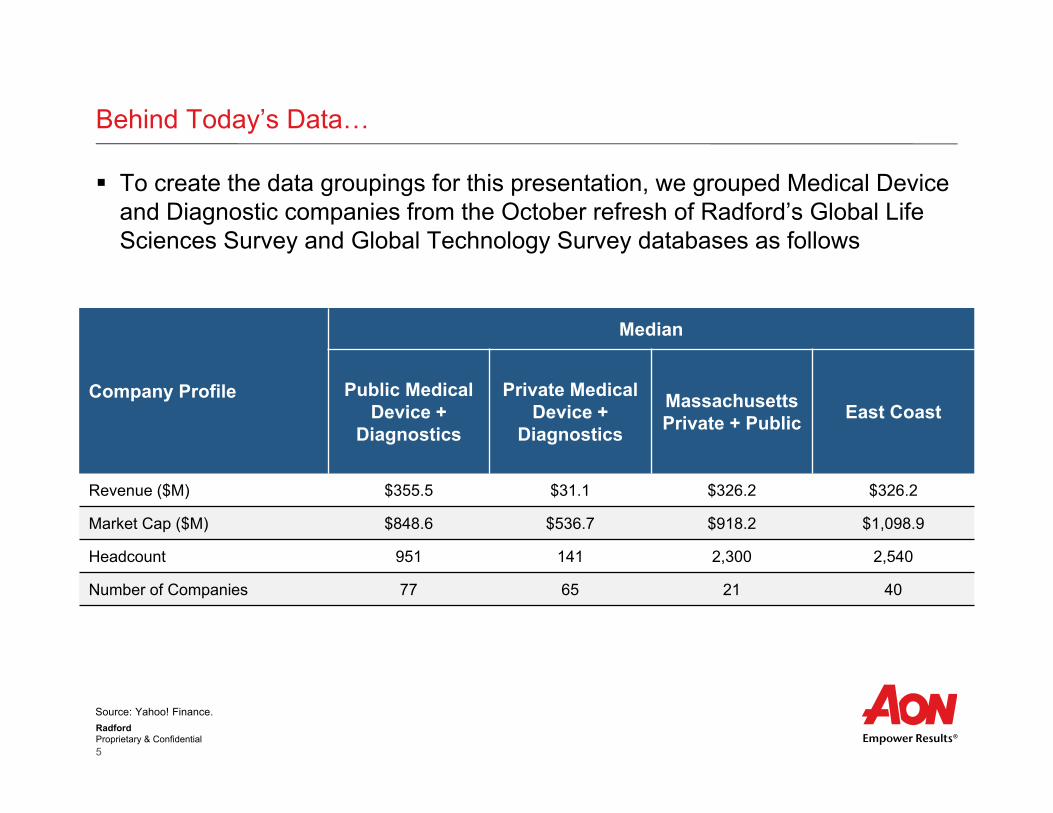
To create the data groupings for this presentation, we grouped Medical Device and Diagnostic companies from the October refresh of Radford’s Global Life Sciences Survey and Global Technology Survey databases as follows
Source: Yahoo! Finance.
Company Profile
Median
Public Medical Device +
Diagnostics
Private Medical Device +
Diagnostics
Massachusetts Private + Public East Coast
Revenue ($M) $355.5 $31.1 $326.2 $326.2
Market Cap ($M) $848.6 $536.7 $918.2 $1,098.9
Headcount 951 141 2,300 2,540
Number of Companies 77 65 21 40

RadfordProprietary & Confidential6
The Medical Device Industry in the Spotlight
Johnson & Johnson to Slash 3000 Jobs in Medtech BizThe healthcare giant is continuing its restructuring of its medical device business by paying off approximately 3000 workers in its medical device unit over the next two years
Why Are Investors Running Away From Medical Devices?“Venture capital for device manufacturers has been drying up for a while…The slowdown in the rise of healthcare spending is also contributing to the drought in venture capital… [Further] the FDA is improving its performance, but the recent history of device failures still looms large, and has energized critics of the device industry.” (December 2015)
With Early Stage Investing Stifled, Things Look Grim for the Medical Device Industry“There’s a marked lack of investing in early stage companies – stifling tech growth in the entire medical device industry…The lack of funding in early stage investment comes from “an increasingly uncertain reimbursement climate, exacerbated by the repetitive nature of medtech innovation, and the resulting pressure for companies to find new ways to demonstrate the value of their products.” (October 2015)
RadfordProprietary & Confidential7
M&A in the Medical Device Industry
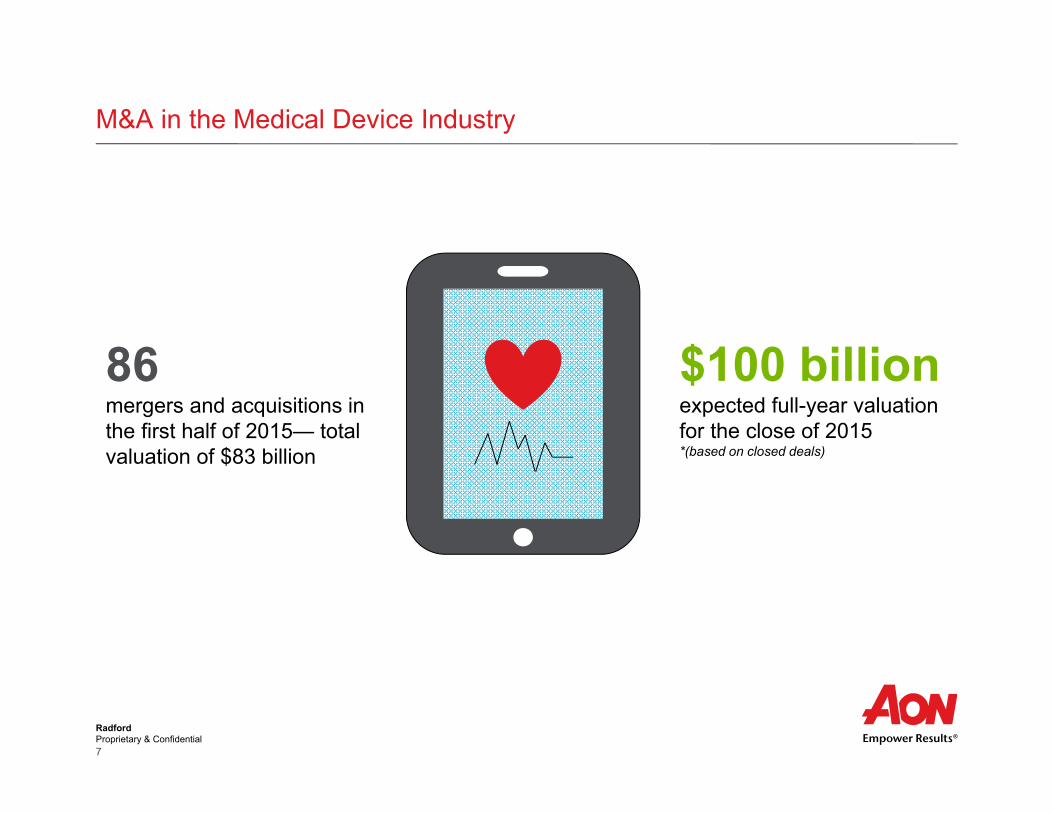
86mergers and acquisitions in the first half of 2015— total valuation of $83 billion
$100 billion expected full-year valuation for the close of 2015 *(based on closed deals)

RadfordProprietary & Confidential8
M&A in the Medical Device Industry
Just in the later months of 2015, the industry snagged the headlines below
Flextronics Expands Medical Design Capabilities With Acquisition Of Farm Design
Medtronic Smacks Down $110 Million Cash for Aircraft Medical
Technimark Acquires Leading Medical Component Manufacturer Ci Medical Technologies
Quest Diagnostics To Acquire Clinical Laboratory Partners' Outreach Laboratory Service Business In Connecticut
Medtronic CEO Ponders Over Sale of Some Covidien Assets Henry Schein Makes Second Purchase in Two Days
Ekso Bionics Acquires Gravity Balancing Arm Technology From Equipois Endologix Ponies Up $211 Million for TriVascular Tech
VC-Backed Kuros Biosurgery Merges with Cytos Biotech St. Jude Medical Completes Acquisition Of Thoratec
Galil Medical Extends Tender Offer Period To Acquire Perseon Johnson & Johnson Execs Hint at Possible M&A Drug or
Medical Device Deals Amid $10 Billion Share Buyback Move
Symmetry Medical Acquires Single-Use, Low Profile Retractor Product From Insightra Medical Inc. Progenics Makes $7 Million Bid for EXINI Diagnostics
RadfordProprietary & Confidential9
3% 2%26%
38% 40%50%
33%22%
48% 31%
60% 40%
45%57%
26% 31%10%
20% 19%
0%10%20%30%40%50%60%70%80%90%
100%
Public Private Massachusetts East Coast Q3 All US Med.Dev.
+ Diagnostics
Q2 All US Med.Dev.
+ Diagnostics
Freeze Selective Normal Aggressive
Hiring Sentiment for the Next 12 Months
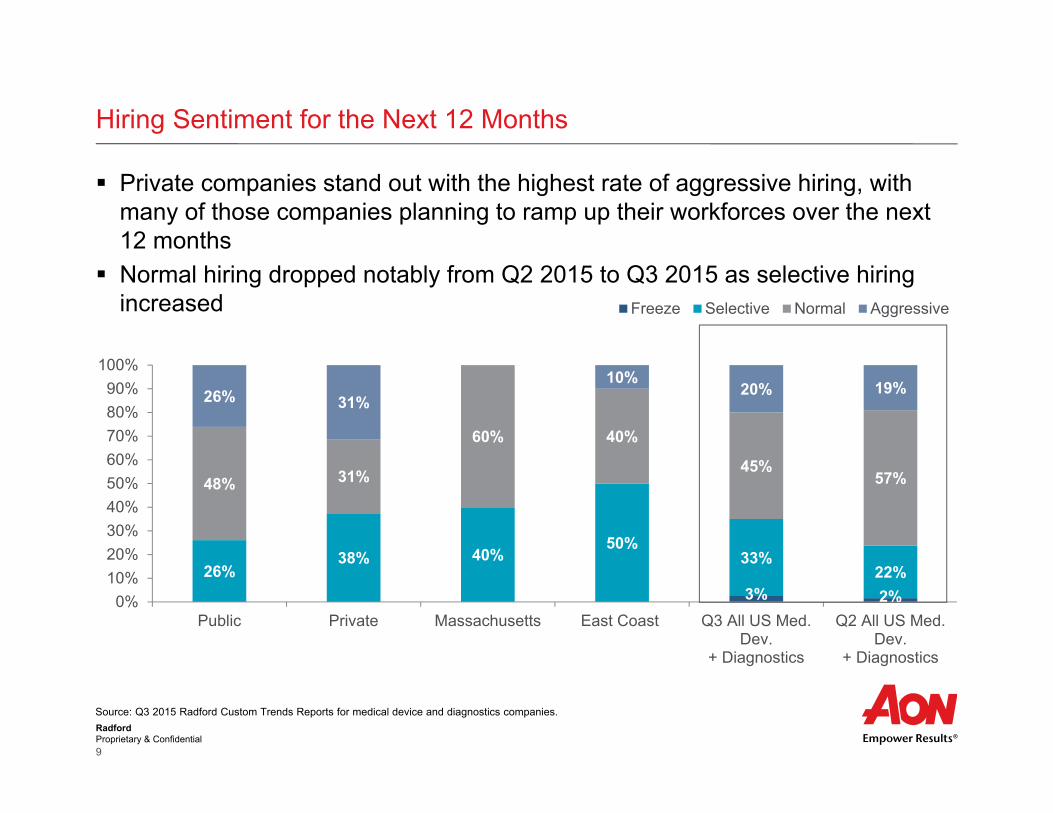
Private companies stand out with the highest rate of aggressive hiring, with many of those companies planning to ramp up their workforces over the next 12 months
Normal hiring dropped notably from Q2 2015 to Q3 2015 as selective hiring increased
Source: Q3 2015 Radford Custom Trends Reports for medical device and diagnostics companies.

RadfordProprietary & Confidential10
Expected Workforce Changes for the Next 12 Months
Interestingly, medical device companies are hardly reporting expected decreases in headcount over the next 12 months
Private companies stand out among Massachusetts, the East Coast and the overall US industry, with 62% of companies planning to increase their workforces over the coming year
Industries &Regions Decrease
Stay The Same Size
Increase by up to
10%
Increase by morethan 10%
Unknown
Public 4% 35% 35% 17% 8%
Private -- 25% 31% 31% 13%
Massachusetts -- 40% 40% -- 20%
East Coast -- 50% 20% 20% 10%
All US Med. Dev. + Diagnostics -- 40% 23% 22% 15%
Source: Q3 2015 Radford Custom Trends Reports for medical device and diagnostics companies.

RadfordProprietary & Confidential11
Historical Turnover in the US Medical Device and Diagnostics Industry
Trailing 12-month voluntary turnover is rising slowly after a post-recession drop and may be stabilizing as we head into 2016
9.3% 9.8% 10.7%
5.9% 4.7%5.9%
0.0%
2.0%
4.0%
6.0%
8.0%
10.0%
12.0%
14.0%
16.0%
18.0%
2013 2014 2015
Voluntary Turnover Involuntary Turnover
15.2% 14.5%16.6%
Source: Radford Trends Reports for medical device and diagnostics companies, Q3 2013, Q3 2014 and Q3 2015.

RadfordProprietary & Confidential12
Turnover
Turnover among private companies is considerably lower than turnover at public companies, however voluntary turnover among the group is relatively high, as many private companies indicate plans to ramp up workforce growth this year
11.4% 9.8% 10.4% 10.7%
5.9%
4.7%5.3% 5.9%
0.0%2.0%4.0%6.0%8.0%
10.0%12.0%14.0%16.0%18.0%20.0%
Public Private Massachusetts East Coast
Voluntary Turnover Involuntary Turnover
17.3%
14.5%16.6%
Source: Q3 2015 Radford Custom Trends Reports for medical device and diagnostics companies.
15.7%
RadfordProprietary & Confidential13
Salary Increases
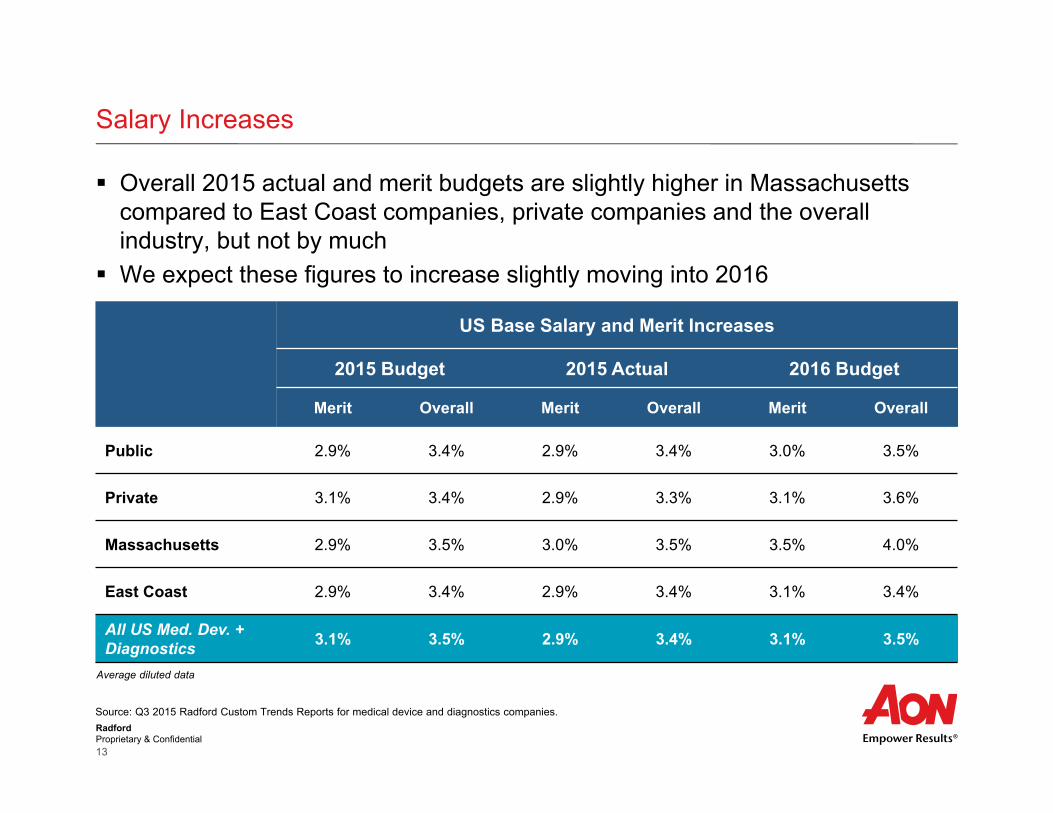
Overall 2015 actual and merit budgets are slightly higher in Massachusetts compared to East Coast companies, private companies and the overall industry, but not by much
We expect these figures to increase slightly moving into 2016
US Base Salary and Merit Increases
2015 Budget 2015 Actual 2016 Budget
Merit Overall Merit Overall Merit Overall
Public 2.9% 3.4% 2.9% 3.4% 3.0% 3.5%
Private 3.1% 3.4% 2.9% 3.3% 3.1% 3.6%
Massachusetts 2.9% 3.5% 3.0% 3.5% 3.5% 4.0%
East Coast 2.9% 3.4% 2.9% 3.4% 3.1% 3.4%
All US Med. Dev. + Diagnostics 3.1% 3.5% 2.9% 3.4% 3.1% 3.5%
Average diluted data
Source: Q3 2015 Radford Custom Trends Reports for medical device and diagnostics companies.

RadfordProprietary & Confidential14
Short-Term Incentive Practices

RadfordProprietary & Confidential15
Types of Incentive Plans
Across all groupings, the majority of companies provide some form of cash incentive plan
Historically the medical device industry has stood out against other life sciences industries with higher rates of discretionary and cash profit sharing bonus plans
Metric Prevalence
Bonus Metric
Public Private MA East CoastAll US Med.
Dev. + Diagnostics
Companies with bonus/incentive compensation plan
95.8% 86.2% 100.0% 100.0% 89.3%
Types of Plans (% companies = of those with any plan)
Formal Bonus 96.7% 73.4% 94.1% 93.1% 83.8%
Discretionary Bonus 31.5% 44.4% 35.3% 41.4% 39.3%
Cash Profit Sharing 9.8% 5.8% -- 3.4% 6.0%
Source: Q3 2015 Radford Custom Practices Reports for medical device and diagnostics companies.

RadfordProprietary & Confidential16
Formal Bonus Plan Participation
Source: Q3 2015 Radford Custom Practices Reports for medical device and diagnostics companies.
% Employees Receiving Formal Bonus
Public Private MA East CoastAll US Med.
Dev. + Diagnostics
Percent of Employees in the US 64.5% 65.9% 65.2% 65.1% 65.2%
Percent of Employees Globally(includes US)
62.9% 64.0% 63.5% 61.6% 63.2%
Across all groupings, most employees are receiving a formal bonus
RadfordProprietary & Confidential17
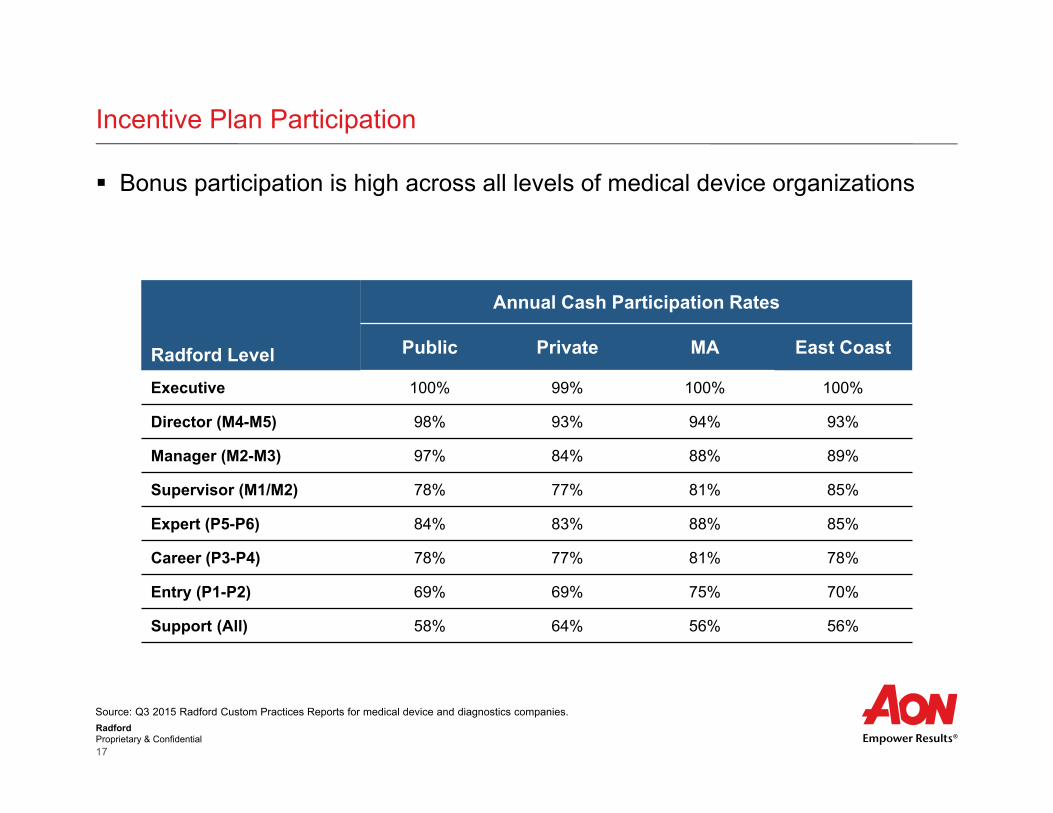
Incentive Plan Participation
Bonus participation is high across all levels of medical device organizations
Radford Level
Annual Cash Participation Rates
Public Private MA East Coast
Executive 100% 99% 100% 100%
Director (M4-M5) 98% 93% 94% 93%
Manager (M2-M3) 97% 84% 88% 89%
Supervisor (M1/M2) 78% 77% 81% 85%
Expert (P5-P6) 84% 83% 88% 85%
Career (P3-P4) 78% 77% 81% 78%
Entry (P1-P2) 69% 69% 75% 70%
Support (All) 58% 64% 56% 56%
Source: Q3 2015 Radford Custom Practices Reports for medical device and diagnostics companies.
RadfordProprietary & Confidential18
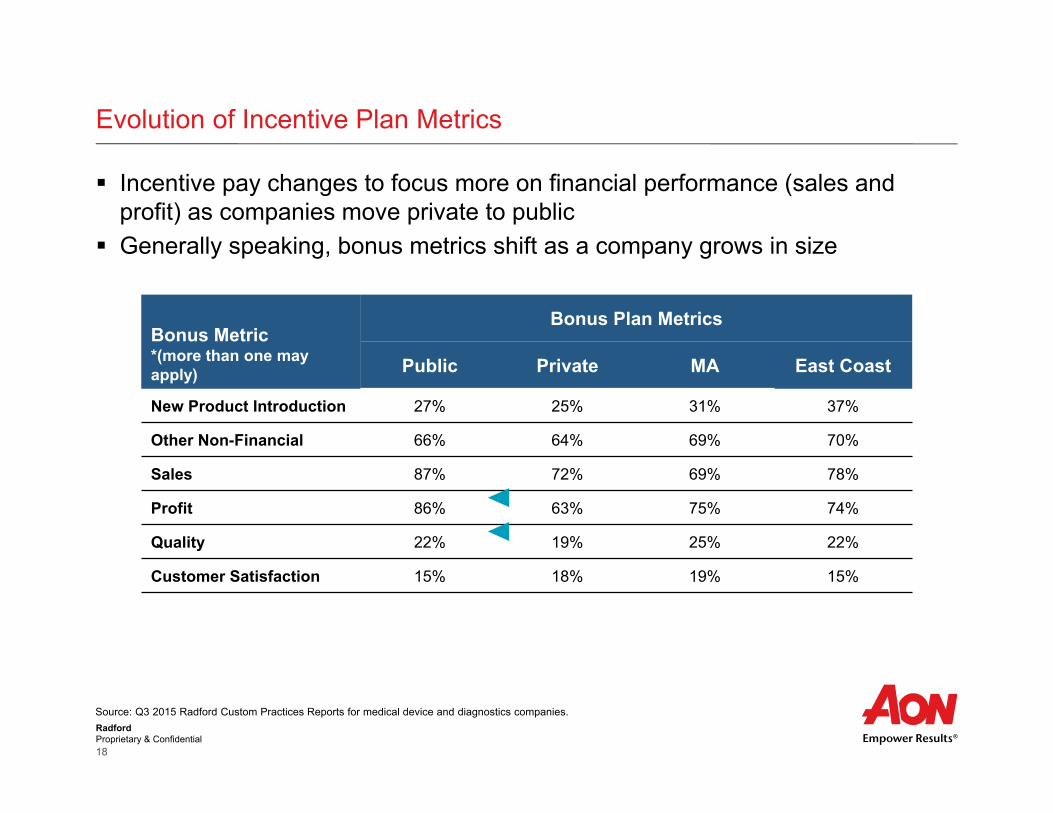
Evolution of Incentive Plan Metrics
Incentive pay changes to focus more on financial performance (sales and profit) as companies move private to public
Generally speaking, bonus metrics shift as a company grows in size
Bonus Metric*(more than one may apply)
Bonus Plan Metrics
Public Private MA East Coast
New Product Introduction 27% 25% 31% 37%
Other Non-Financial 66% 64% 69% 70%
Sales 87% 72% 69% 78%
Profit 86% 63% 75% 74%
Quality 22% 19% 25% 22%
Customer Satisfaction 15% 18% 19% 15%
Source: Q3 2015 Radford Custom Practices Reports for medical device and diagnostics companies.
RadfordProprietary & Confidential19
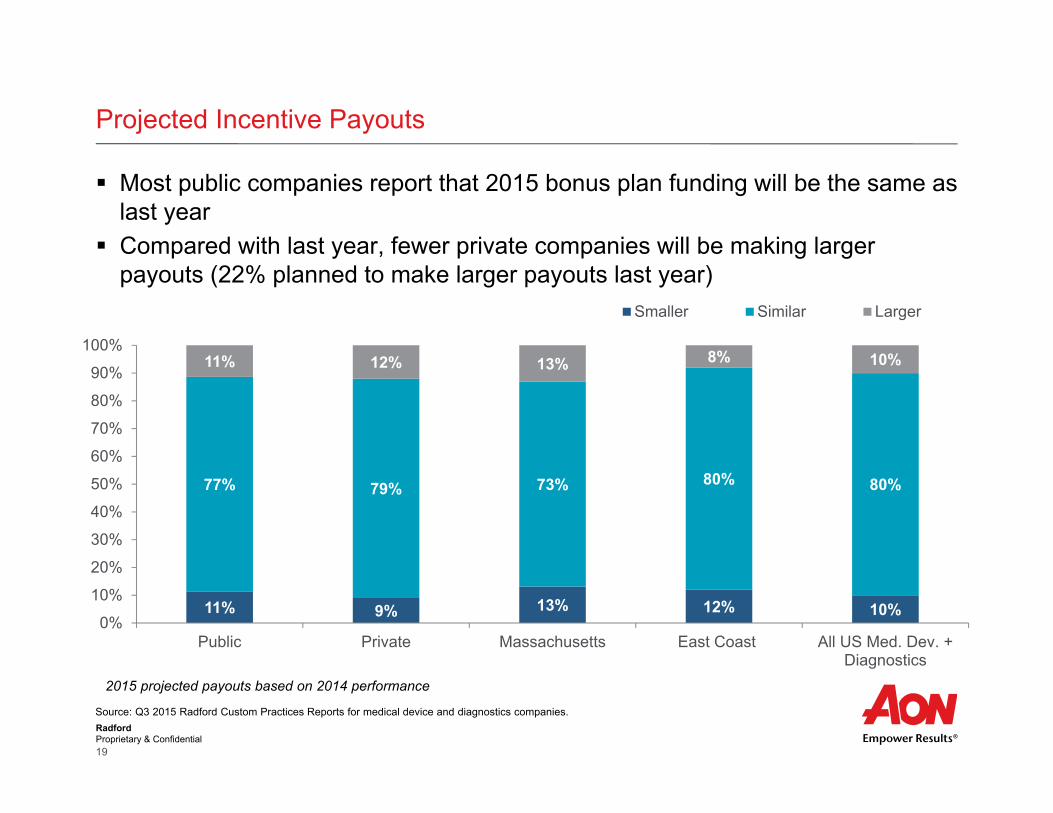
Most public companies report that 2015 bonus plan funding will be the same as last year
Compared with last year, fewer private companies will be making larger payouts (22% planned to make larger payouts last year)
Projected Incentive Payouts
2015 projected payouts based on 2014 performance
Source: Q3 2015 Radford Custom Practices Reports for medical device and diagnostics companies.
11% 9% 13% 12% 10%
77% 79% 73% 80% 80%
11% 12% 13% 8% 10%
0%
10%
20%
30%
40%
50%
60%
70%
80%
90%
100%
Public Private Massachusetts East Coast All US Med. Dev. +Diagnostics
Smaller Similar Larger
RadfordProprietary & Confidential20
Private and PublicLong-Term Incentive Practices
RadfordProprietary & Confidential21
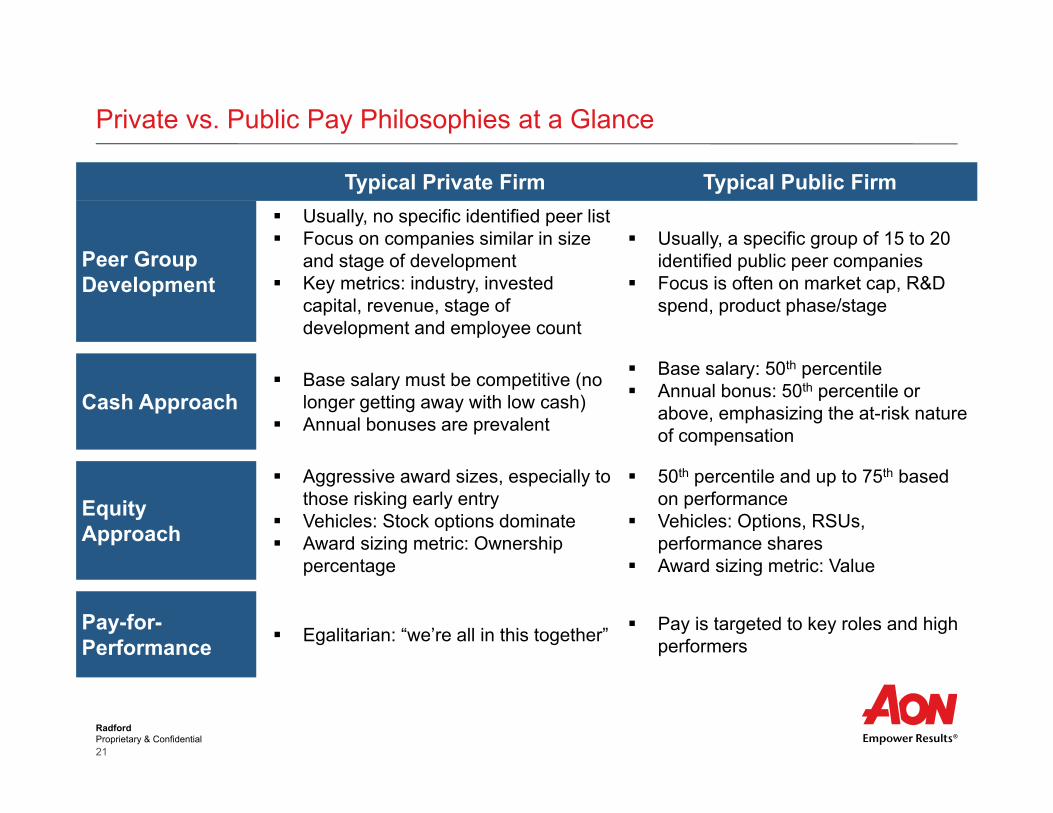
Private vs. Public Pay Philosophies at a Glance
Typical Private Firm Typical Public Firm
Peer Group Development
Usually, no specific identified peer list Focus on companies similar in size
and stage of development Key metrics: industry, invested
capital, revenue, stage of development and employee count
Usually, a specific group of 15 to 20 identified public peer companies
Focus is often on market cap, R&D spend, product phase/stage
Cash Approach Base salary must be competitive (no
longer getting away with low cash) Annual bonuses are prevalent
Base salary: 50th percentile Annual bonus: 50th percentile or
above, emphasizing the at-risk nature of compensation
Equity Approach
Aggressive award sizes, especially to those risking early entry
Vehicles: Stock options dominate Award sizing metric: Ownership
percentage
50th percentile and up to 75th based on performance
Vehicles: Options, RSUs, performance shares
Award sizing metric: Value
Pay-for-Performance Egalitarian: “we’re all in this together” Pay is targeted to key roles and high
performers
RadfordProprietary & Confidential22
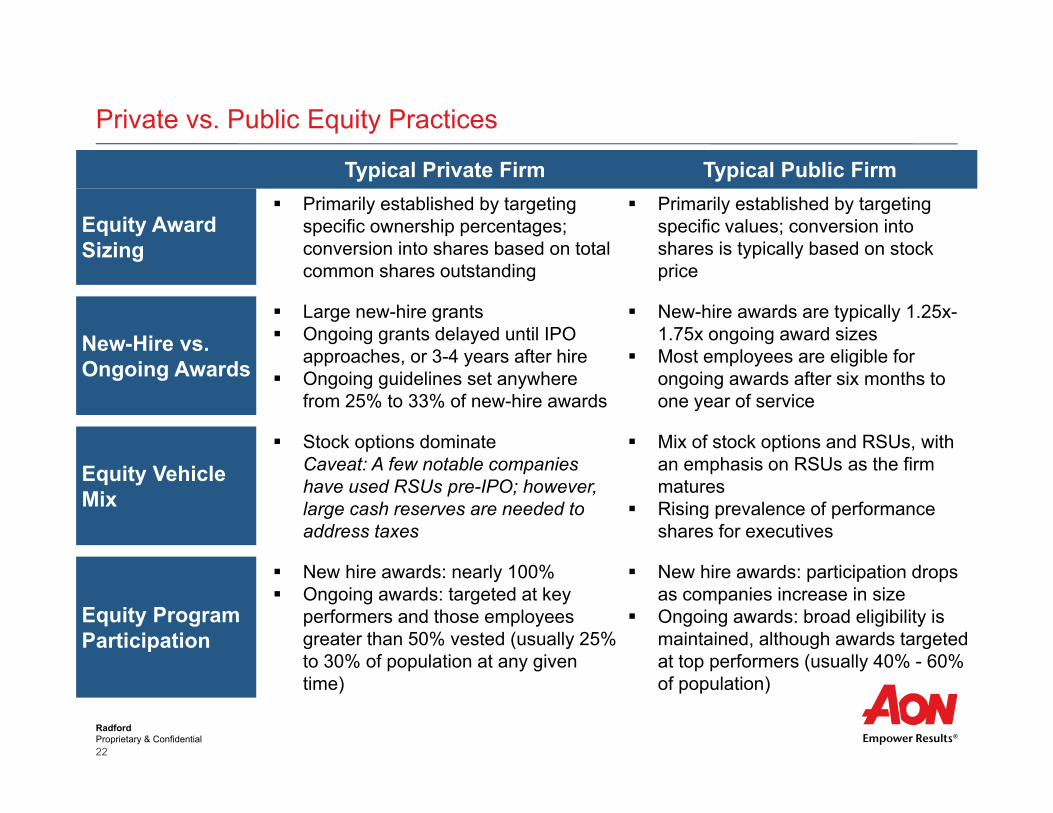
Private vs. Public Equity Practices
Typical Private Firm Typical Public Firm
Equity Award Sizing
Primarily established by targeting specific ownership percentages; conversion into shares based on total common shares outstanding
Primarily established by targeting specific values; conversion into shares is typically based on stock price
New-Hire vs. Ongoing Awards
Large new-hire grants Ongoing grants delayed until IPO
approaches, or 3-4 years after hire Ongoing guidelines set anywhere
from 25% to 33% of new-hire awards
New-hire awards are typically 1.25x-1.75x ongoing award sizes
Most employees are eligible for ongoing awards after six months to one year of service
Equity Vehicle Mix
Stock options dominateCaveat: A few notable companies have used RSUs pre-IPO; however, large cash reserves are needed to address taxes
Mix of stock options and RSUs, with an emphasis on RSUs as the firm matures
Rising prevalence of performance shares for executives
Equity Program Participation
New hire awards: nearly 100% Ongoing awards: targeted at key
performers and those employees greater than 50% vested (usually 25% to 30% of population at any given time)
New hire awards: participation drops as companies increase in size
Ongoing awards: broad eligibility is maintained, although awards targeted at top performers (usually 40% - 60% of population)

RadfordProprietary & Confidential23
Aligning Equity with Stage of Development
Long-Term Incentive Vehicles
Company Profile
Objectives and ImplicationsStartup/ Pre-IPO
Mid-Cap/ Growth Market
Mid-Cap/ Mature Market
Large Cap/Mature Market
Stock Options Only Stock options help employees focus on upside
potential, either stock price growth or company valuation growth
Restricted Shares/ Units Only
Restricted shares/units de-emphasize stock price growth in favor of employee retention and ownership
Stock Options and Restricted Shares/ Units
A mixed approach attempts to balance growth with retention, and typically involves different mixes for different employee levels
PerformanceShares/ Units
Performance shares allow companies to introduce targeted goals (beyond stock price growth) into their equity programs
Long-Term Cash Often used in conjunction with equity, long-term
cash allows for more diversity of performance goals, but requires an ability to set goals over multiple years
Relative Total Shareholder Return
The use of TSR metrics typically reflects alignment with the institutional investor perspective (i.e., portfolio performance) and requires a stable peer group
Emerging Practice Least Common PracticeMost Common Practice

RadfordProprietary & Confidential24
Focus on Individual Ownership
Private companies typically focus on employee ownership percentages as the best apples-to-apples point of comparison for delivering competitive equity packages
Employee Level
Median Individual Ownership by Level of Invested Capital
Under $40M $40M to $80M Over $80M
CEO 7.509% 4.293% 3.803%
Founder 8.623% 5.506% 4.195%
Non-Founder 7.127% 4.195% 3.082%
CFO 0.926% 0.639% 0.825%
Top HR Executive 0.351% 0.347% 0.309%
Vice President 0.688% 0.614% 0.548%
Director 0.254% 0.283% 0.075%
Manager 0.063% 0.120% 0.040%
Professional 0.027% 0.032% 0.012%
Support 0.006% 0.012% 0.005%
Source: Radford’s Pre-IPO/Venture-Backed Survey. Data shown are a roll-up of Radford levels taken at the median.
RadfordProprietary & Confidential25
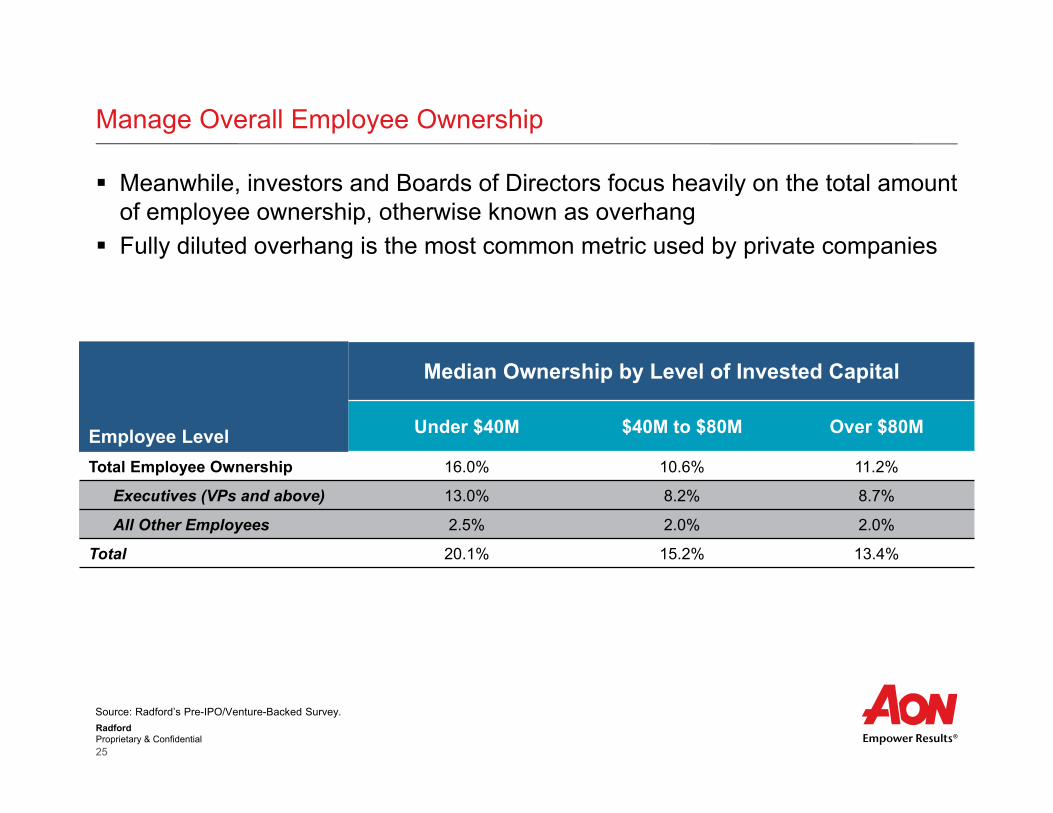
Manage Overall Employee Ownership
Meanwhile, investors and Boards of Directors focus heavily on the total amount of employee ownership, otherwise known as overhang
Fully diluted overhang is the most common metric used by private companies
Employee Level
Median Ownership by Level of Invested Capital
Under $40M $40M to $80M Over $80M
Total Employee Ownership 16.0% 10.6% 11.2%
Executives (VPs and above) 13.0% 8.2% 8.7%
All Other Employees 2.5% 2.0% 2.0%
Total 20.1% 15.2% 13.4%
Source: Radford’s Pre-IPO/Venture-Backed Survey.

RadfordProprietary & Confidential26
Equity Receipt: Public Company Practice
Broad-based ownership remains common in the medical device industry so long as companies can manage dilution
Employee Level
Annual Equity Receipt RatesPublic MA East Coast
CEO 92% 83% 88%
VP 90% 93% 87%
Director (M4-M5) 84% 72% 82%
Manager (M2-M3) 42% 38% 55%
Supervisor (M1) 10% 13% 13%
Expert (P5-P6) 33% 15% 33%
Career (P3-P4) 14% 12% 19%
Entry (P1-P2) 4% 8% 8%
Support (All) 3% 1% 1%
Source: Radford Custom Global Long Term Incentive Reports for medical device and diagnostics companies.

RadfordProprietary & Confidential27
Equity Value: Public Company Practice
Equity values are heavily concentrated at the executive level, with values diminishing toward the lower levels of the organization
Massachusetts companies stand out with higher annual equity values over the overall East Coast, especially at the top levels of the organization
Employee Level
Annual Equity ValuePublic MA East Coast
CEO $2,040.3 $2,286.8 $1,657.6
VP $97.8 $152.9 $117.3
Director (M4-M5) $35.7 $57.7 $53.3
Manager (M2-M3) $16.2 $13.2 $13.3
Supervisor (M1) $10.1 $5.2 $5.0
Expert (P5-P6) $25.2 $26.6 $19.9
Career (P3-P4) $11.7 $6.5 $6.9
Entry (P1-P2) $7.2 $4.3 $4.3
Support (All) $6.7 $1.3 $1.3
Source: Radford Custom Global Long Term Incentive Reports for medical device and diagnostics companies.
RadfordProprietary & Confidential28
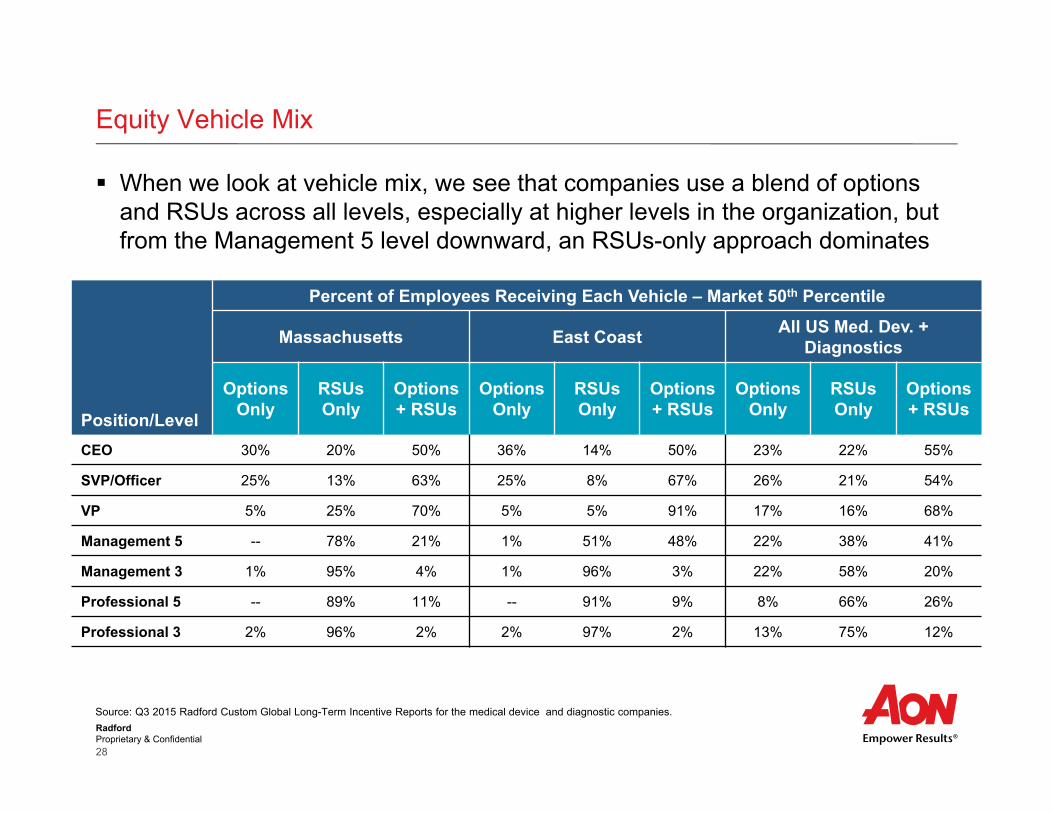
Equity Vehicle Mix
When we look at vehicle mix, we see that companies use a blend of options and RSUs across all levels, especially at higher levels in the organization, but from the Management 5 level downward, an RSUs-only approach dominates
Source: Q3 2015 Radford Custom Global Long-Term Incentive Reports for the medical device and diagnostic companies.
Position/Level
Percent of Employees Receiving Each Vehicle – Market 50th Percentile
Massachusetts East Coast All US Med. Dev. + Diagnostics
Options Only
RSUs Only
Options + RSUs
Options Only
RSUs Only
Options + RSUs
Options Only
RSUs Only
Options + RSUs
CEO 30% 20% 50% 36% 14% 50% 23% 22% 55%
SVP/Officer 25% 13% 63% 25% 8% 67% 26% 21% 54%
VP 5% 25% 70% 5% 5% 91% 17% 16% 68%
Management 5 -- 78% 21% 1% 51% 48% 22% 38% 41%
Management 3 1% 95% 4% 1% 96% 3% 22% 58% 20%
Professional 5 -- 89% 11% -- 91% 9% 8% 66% 26%
Professional 3 2% 96% 2% 2% 97% 2% 13% 75% 12%
RadfordProprietary & Confidential29
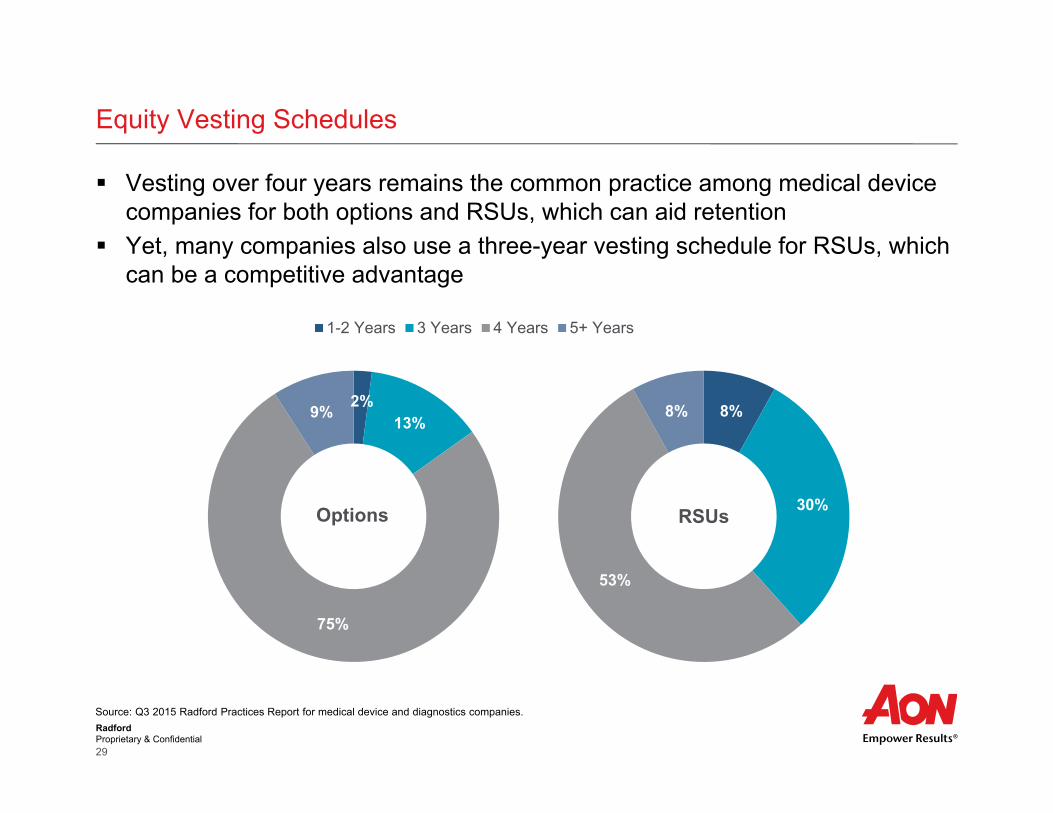
Equity Vesting Schedules
Vesting over four years remains the common practice among medical device companies for both options and RSUs, which can aid retention
Yet, many companies also use a three-year vesting schedule for RSUs, which can be a competitive advantage
8%
30%
53%
8%
RSUs
2%13%
75%
9%
Options
1-2 Years 3 Years 4 Years 5+ Years
Source: Q3 2015 Radford Practices Report for medical device and diagnostics companies.

RadfordProprietary & Confidential30
Burn Rates in the Medical Device Industry
Median last fiscal year (LFY) and 3-year gross burn rates are similar across the full US medical device industry
Relative to the East Coast and overall US medical device industry, Massachusetts medical device companies use the most equity
1.8%2.1%
3.2% 3.3%
4.4%4.9%
0%
1%
2%
3%
4%
5%
6%
LFY 3-Year Average
Gross Equity Burn Rate 25th 50th 75th
4.0%
3.2% 3.2%
0%
1%
2%
3%
4%
5%
Massachusetts East Coast All US Med. Dev +Diagnostics
Median LFY Burn Rate by Industry
Source: Radford proprietary database.
RadfordProprietary & Confidential31
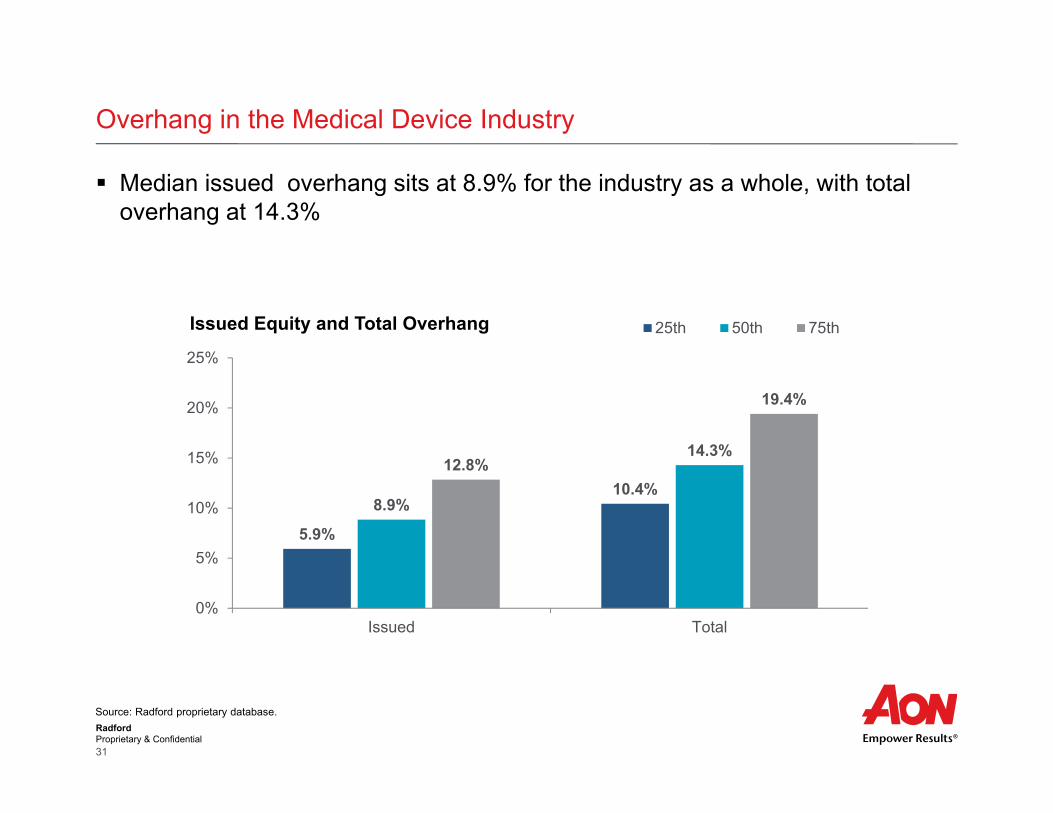
Overhang in the Medical Device Industry
Median issued overhang sits at 8.9% for the industry as a whole, with total overhang at 14.3%
5.9%
10.4%8.9%
14.3%12.8%
19.4%
0%
5%
10%
15%
20%
25%
Issued Total
Issued Equity and Total Overhang 25th 50th 75th
Source: Radford proprietary database.
RadfordProprietary & Confidential32
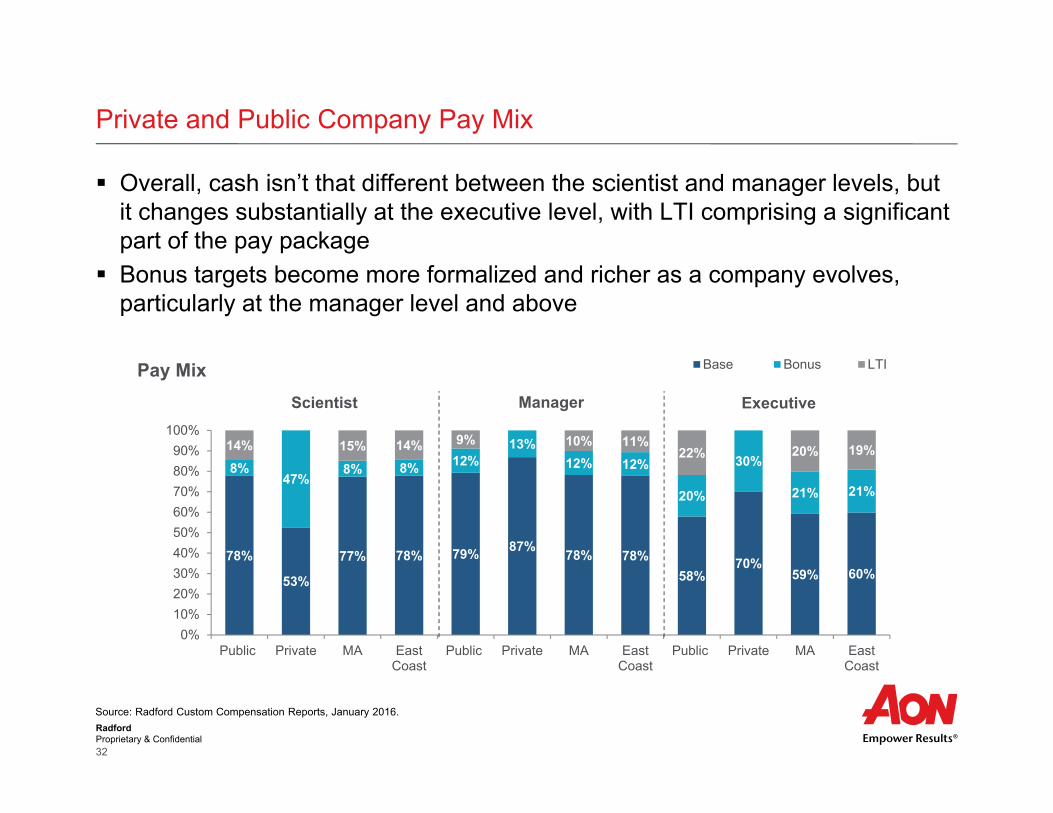
Private and Public Company Pay Mix
Overall, cash isn’t that different between the scientist and manager levels, but it changes substantially at the executive level, with LTI comprising a significant part of the pay package
Bonus targets become more formalized and richer as a company evolves, particularly at the manager level and above
Source: Radford Custom Compensation Reports, January 2016.
78%
53%
77% 78% 79% 87% 78% 78%58%
70%59% 60%
8%47%
8% 8% 12%13%
12% 12%
20%
30%
21% 21%
14% 15% 14% 9% 10% 11%22% 20% 19%
0%10%20%30%40%50%60%70%80%90%
100%
Public Private MA EastCoast
Public Private MA EastCoast
Public Private MA EastCoast
Pay Mix Base Bonus LTI
ExecutiveManagerScientist

RadfordProprietary & Confidential33
Executive Compensation
Unlike broad-based employees, executives are still willing to take a discount on cash for higher ownership
As companies move from private to public and become more established, CEO pay shifts: fixed pay typically gets higher, and long-term incentive values at the executive level become more meaningful as the company gains traction and as market capitalization values increase
Source: Radford Pre-IPO Venture-Backed Survey, Radford Custom Compensation Reports, January 2016.
CEO Public Private MA East Coast
Base Salary $604,135 $350,000 $600,000 $600,000
Target Total Cash $1,126,250 $412,250 $1,200,000 $1,175,000
Annual LTI Value $2,040,278 -- $2,792,350 $2,107,661
RadfordProprietary & Confidential34
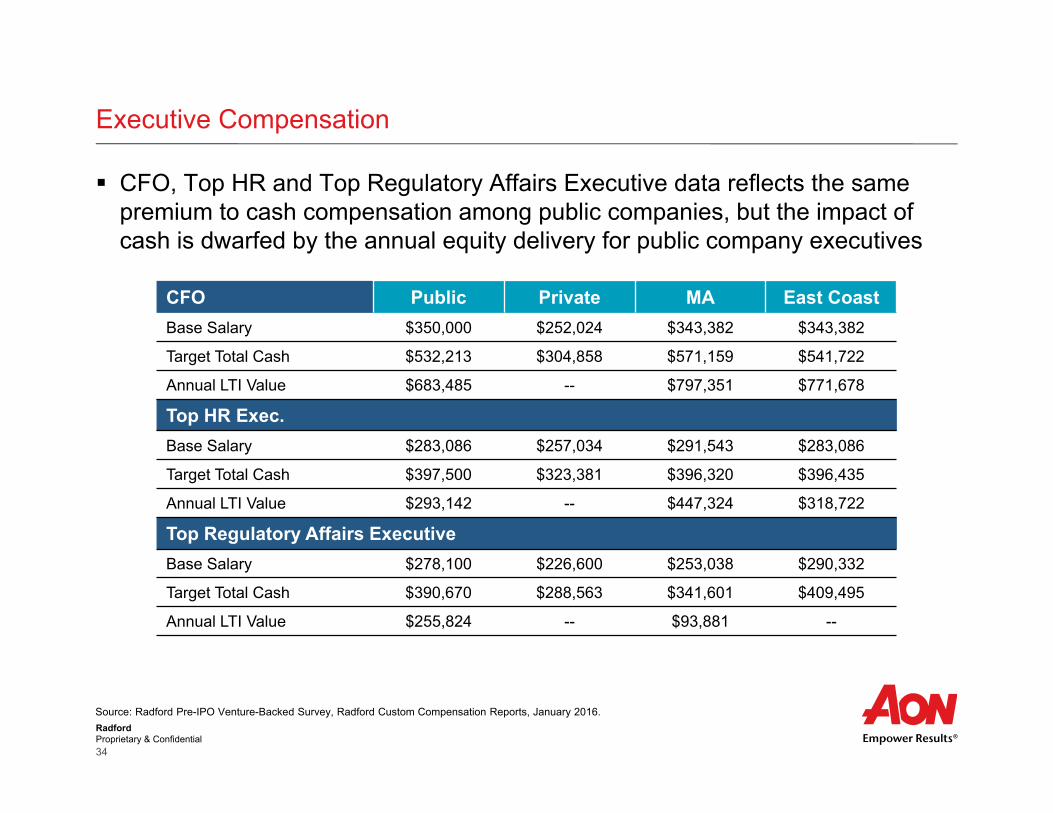
Executive Compensation
CFO, Top HR and Top Regulatory Affairs Executive data reflects the same premium to cash compensation among public companies, but the impact of cash is dwarfed by the annual equity delivery for public company executives
Source: Radford Pre-IPO Venture-Backed Survey, Radford Custom Compensation Reports, January 2016.
CFO Public Private MA East CoastBase Salary $350,000 $252,024 $343,382 $343,382
Target Total Cash $532,213 $304,858 $571,159 $541,722
Annual LTI Value $683,485 -- $797,351 $771,678
Top HR Exec.Base Salary $283,086 $257,034 $291,543 $283,086
Target Total Cash $397,500 $323,381 $396,320 $396,435
Annual LTI Value $293,142 -- $447,324 $318,722
Top Regulatory Affairs ExecutiveBase Salary $278,100 $226,600 $253,038 $290,332
Target Total Cash $390,670 $288,563 $341,601 $409,495
Annual LTI Value $255,824 -- $93,881 --

RadfordProprietary & Confidential35
Medical Device Professional IC Compensation
Source: Radford Pre-IPO Venture-Backed Survey, Radford Custom Compensation Reports, January 2016.
Development Engineer 4 Public Private MA East Coast
Base Salary $123,978 $90,140 $109,847 $109,847
Target Total Cash $140,369 $98,730 $119,732 $119,732
Annual LTI Value $70,166 -- $5,991 --
Scientist 3Base Salary $96,999 $105,000 $101,436 $97,344
Target Total Cash $105,600 $110,549 $112,750 $107,842
Annual LTI Value $18,040 -- $19,480 $18,040
At the Development Engineer 4 position, we see public companies stand out with high annual LTI values
For the Scientist 3 position, base pay is higher at private companies, and total target cash is considerably higher among companies located in Massachusetts

RadfordProprietary & Confidential36
Executive Compensation and Governance Trends
RadfordProprietary & Confidential37
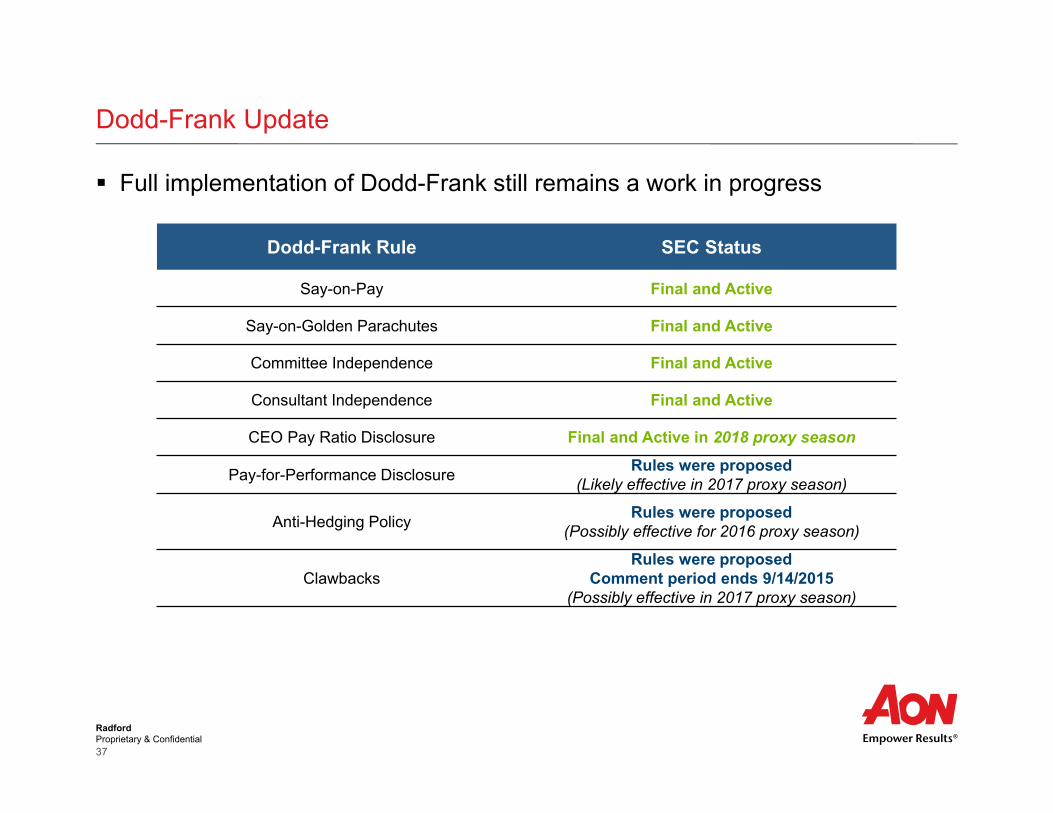
Full implementation of Dodd-Frank still remains a work in progress
Dodd-Frank Update
Dodd-Frank Rule SEC Status
Say-on-Pay Final and Active
Say-on-Golden Parachutes Final and Active
Committee Independence Final and Active
Consultant Independence Final and Active
CEO Pay Ratio Disclosure Final and Active in 2018 proxy season
Pay-for-Performance Disclosure Rules were proposed(Likely effective in 2017 proxy season)
Anti-Hedging Policy Rules were proposed(Possibly effective for 2016 proxy season)
ClawbacksRules were proposed
Comment period ends 9/14/2015(Possibly effective in 2017 proxy season)
RadfordProprietary & Confidential38
Equity Plan Scorecard (“EPSC”) modifications:– ISS increased post-vesting/exercise holding period requirement to receive full points under the
model from 12 months to 36 months or until employment termination. A holding period requirement of 12 months or until stock ownership guidelines are met will continue to receive half points under the revised model Previously, a holding period of at least 12 months resulted in full points under the old scorecard model
– ISS also renamed the “Automatic Single-Trigger Vesting” plan features factor to “CIC Vesting” and modified the scoring levels to take into consideration the treatment of performance-based awards in the event of a CIC
Director Overboarding:– For non-CEO directors, ISS will now note in its report if a director serves on more than five public
company boards during 2016, but will only recommend that shareholders vote against directors who sit on more than six public company boards However, starting on or after February 1, 2017, negative recommendations will be made for non-CEO
directors sitting on more than five public company boards
Unilateral Bylaw and Charter Changes:– Currently, ISS’s existing policy recommends that its subscribers vote against/withhold director
nominees, certain committees, or the entire board if the board amends company bylaws or charter without shareholder approval in a way that materially diminishes shareholder rights.
– ISS now bifurcates its analysis as to how it evaluates newly-public companies and companies with a longer trading history
Summary of Relevant ISS Policy Updates

RadfordProprietary & Confidential39
Possibly effective for proxy season 2016
Take Action: disclose whether your company permits employees (including officers) or directors to engage in hedging activities with respect to shares granted as part of compensation, as well as shares held directly or indirectly
– If some hedging activity is permitted, identify the categories of persons permitted to engage in hedging activities as well as the types of hedging activities that are permitted (or not permitted)
– Technically, these disclosures are required under Item 407 (Corporate Governance), and we would expect companies to provide this disclosure outside the CD&A Since hedging is one of the SEC’s “15 items” to be covered in the CD&A, the proposed rule
would allow companies to reference the Item 407 disclosure within the CD&A
Anti-Pledging
RadfordProprietary & Confidential40
Possibly effective for proxy season 2017
Take Action: include a new “Pay Versus Performance” table in the proxy statement disclosing:
– Total compensation disclosed in the Summary Compensation Table (TCSCT) for each of the past 5 years for the CEO
– Total compensation actually paid (TCAP) to the CEO for each of the past 5 years– Average other NEO TCSCT for each of the past 5 years– Average other NEO TCAP for each of the past 5 years– Total shareholder return (TSR) for each of the past 5 years on a cumulative basis– Peer group TSR for each of the past 5 years on a cumulative basis
Stock options will use a Black-Scholes value as of the vesting date taking into account changes in share price since grant
Pay-for-Performance Disclosure
RadfordProprietary & Confidential41
In addition to the new table, discuss the relationship between (A) the TCAP of the CEO and the average other NEO TCAP and (B) the cumulative total shareholder return (TSR) for each of the last 5 years
Continue to use the CD&A to reinforce how certain elements of pay are tied to corporate performance and/or share price movement and reference that discussion in the pay versus performance disclosure
Reiterate why various financial metrics have been selected
We anticipate that both ISS and Glass Lewis may comment on such disclosures in their say-on-pay evaluations, but will ultimately likely rely on their own existing peer group selection and pay-for-performance methodologies to determine whether a company has a disconnect or linkage in pay versus performance
Pay-for-Performance Disclosure (continued)
RadfordProprietary & Confidential42
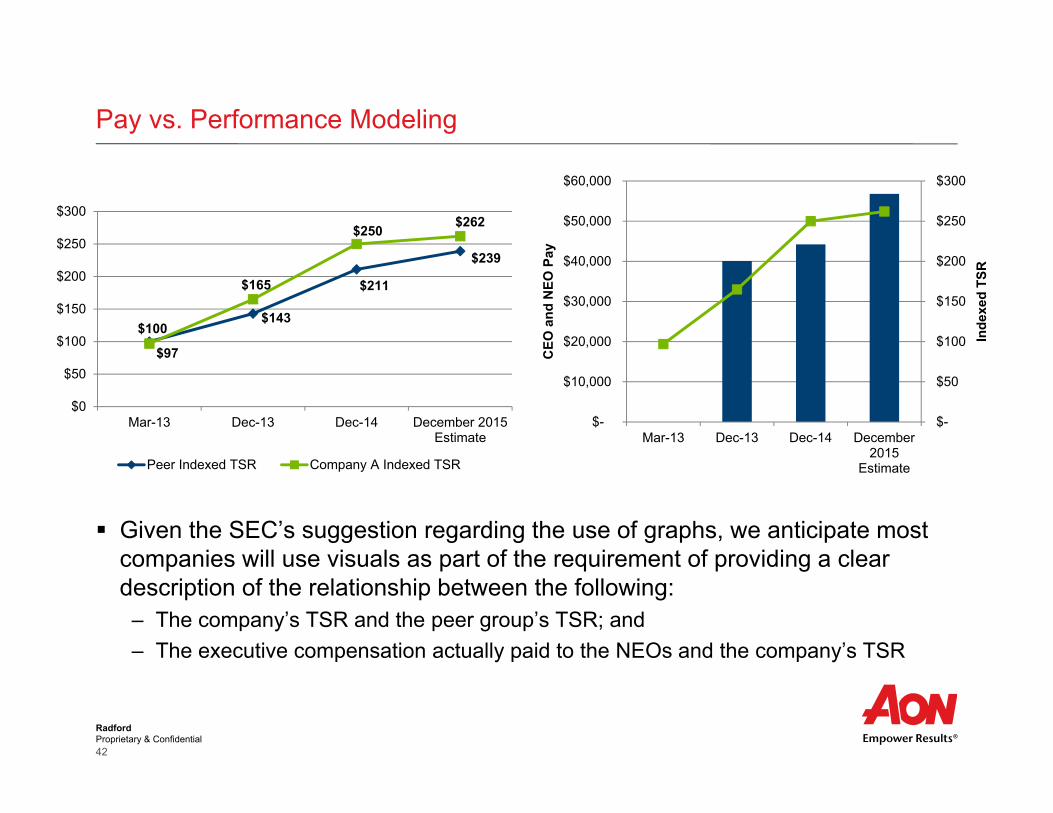
Given the SEC’s suggestion regarding the use of graphs, we anticipate most companies will use visuals as part of the requirement of providing a clear description of the relationship between the following:
– The company’s TSR and the peer group’s TSR; and – The executive compensation actually paid to the NEOs and the company’s TSR
Pay vs. Performance Modeling
$100 $143
$211
$239
$97
$165
$250 $262
$0
$50
$100
$150
$200
$250
$300
Mar-13 Dec-13 Dec-14 December 2015Estimate
Peer Indexed TSR Company A Indexed TSR
$-
$50
$100
$150
$200
$250
$300
$-
$10,000
$20,000
$30,000
$40,000
$50,000
$60,000
Mar-13 Dec-13 Dec-14 December2015
Estimate
Inde
xed
TSR
CEO
and
NEO
Pay

RadfordProprietary & Confidential43
When will the clawback be triggered?– In event of a restatement without any requirement of misconduct or negligence of executives from
whom compensation is being recovered Applies to restatements compelled by error that is material to previously issued financial statements
From whom must compensation be recovered?– All executive officers with a policy-making role; anyone who met the definition of an executive
officer at any point during the incentive compensation’s performance period
What types of compensation are subject to the policy?– All incentive-based compensation, whether short-term or long-term– Based on any financial reporting measure or stock price/TSR– Equity awards are subject to clawback only to the extent the grant, vesting, or the amount of the
award earned is affected by the restated measure or related impact on stock or TSR– Time-based stock options and restricted stock are not incentive compensation subject to
clawback
Board discretion– No board discretion – recovery is compulsory, with the “excess” incentive compensation to be
recovered pro rata from all executive based on their share of the original overstated award
Clawback Overview

RadfordProprietary & Confidential44
We do not expect the policy to become effective earlier than the 2017 proxy season
Under the proposed rules, the listing exchanges must add a listing requirement for companies to adopt a clawback policy that minimally conforms to the SEC’s requirements:
– Clawback is triggered in the event of a restatement due to material non-compliance with GAAP reporting requirements (“no fault”)
– From the date the company is aware or should be aware that a restatement will be required, the company must look back to the 3 most recently completed fiscal years
– If the financial restatement affects the amounts originally determined to be earned under incentive pay programs, the company must clawback the excess compensation
– It is important to note that for life sciences companies, clinical / scientific milestones are not considered financial metrics and therefore plans or portions of plans related to these types of metrics cannot be subject to recoupment
Clawbacks

RadfordProprietary & Confidential45
The effective date for the CEO pay ratio is for fiscal years that begin on or after January 1, 2017 (for calendar-year filers, that would mean the first disclosure would occur in the 2018 proxy season)
Identifying the median employee is only required once every 3 years (provided the employee population has not changed in a way that would significantly affect the ratio (e.g., corporate mergers and acquisitions)
Median Employee can be identified using the employee population as of any date during the last 3 months of the fiscal year
– This includes any full-time, part-time, seasonal, or temporary worker employed by the registrant or any of its consolidated subsidiaries on that day
Nondiscriminatory benefit plans can be added to the numerator and denominator of the ratio
Optional narrative and supplemental ratios are permitted to provide helpful context
CEO Pay Ratio Rule

RadfordProprietary & Confidential46
Determining the CEO to worker pay ratio isn’t so simple…
The SEC has set forth several operational guidelines for determining the median employee, though companies must be sure to disclose and consistently apply the methodology of their choosing
CEO Pay Ratio Modeling
Median Employee Selection Methodology
Base Total Target Cash
Target Total Direct
Compensation
W-2(or int’l equiv.)
Wages
Median Employee Total Pay $95,000 $85,000 $100,000 $90,000
CEO Summary Comp Table Pay $10,500,000 $10,500,000 $10,500,000 $10,500,000
2015 Pay Ratio 11:1 12:1 11:1 12:1

RadfordProprietary & Confidential47
The final rules retained several operational guidelines that give employers flexibility
– Registrants may use (A) a methodology that uses reasonable estimates to identify the median and (B) reasonable estimates to calculate the annual total compensation or any elements of total compensation
– In determining the employees from which the median is identified, a registrant may use (A) its entire employee population or (B) statistical sampling or other reasonable methods
– A registrant may identify the median employee using (A) annual total compensation or (B) any other compensation measure that is consistently applied to all employees included in the calculation, such as amounts derived from the registrant’s payroll or tax records
– A registrant may annualize the total compensation for all permanent employees (other than those in temporary or seasonal positions) that were employed by the registrant for less than the full fiscal year
CEO Pay Ratio Rule

RadfordProprietary & Confidential48
Recently, we have seen increased scrutiny around director compensation, especially on equity awards
Because director compensation is typically set by the Compensation Committee, who also receives the compensation, some are alleging that the compensation constitutes a breach of fiduciary duty
A number of publicly traded companies have recently faced legal action around director compensation, causing many to consider implementing a concrete and meaningful limitation on grants to directors to be included in an equity plan and approved by shareholders
Companies should consider including a hard coded limit on annual equity awards to directors in the text of the next amendment to their plan; alternatively, a standalone policy could be put forth to shareholders for approval
Board of Director Compensation Litigation