compendium of statistics - crefc.org · cre finance council, 30 broad street, 28th floor, new york,...
TRANSCRIPT

CRE Finance Council, 30 Broad Street, 28th Floor, New York, New York
COMPENDIUM OF
STATISTICS
Last Update: October 11, 2011

© 2010 CRE Finance Council, all rights reserved. CRE Finance Council, 30 Broad Street, 28th Floor, New York, New York
TABLE OF CONTENTS
Exhibit Page
1 CMBS Issuance by Month 2006-present .................................................................................. 3 2 CRE CDO Issuance by Month 2000-2008 ................................................................................ 4 3 CMBS Issuance: U.S. / Europe / Other..................................................................................... 5 4 CMBS Issuance by Country ..................................................................................................... 6 5 CMBS Delinquencies – Monthly ............................................................................................... 7 6 CMBS Delinquencies – Quarterly by Property Type ................................................................. 8 7 CMBS Delinquencies – Quarterly by Property Type Chart ....................................................... 9 8 CMBS vs. RMBS Delinquencies ..............................................................................................10 9 Residential Delinquencies by Loan Number ............................................................................11 10 CMBS by Regions ...................................................................................................................12 11 CMBS Breakdowns by Deal and Property Type ......................................................................13 12 Interest Rates and CMBS Issuance .........................................................................................14 13 CMBS Spreads and Swap Spreads .........................................................................................15 14 CMBS Spreads over Treasurys: Investment Grade .................................................................16
15-16 CMBX Prices ..........................................................................................................................17 17 Discontinued ...........................................................................................................................19
18 Top CMBS & CDO Portfolios Among Insurers .........................................................................20 19 Holders of Commercial & Multifamily Mortgage Loans – Historical Data..................................21 20 Holders of Commercial & Multifamily Mortgage Loans – Percentage Distribution ....................22 21 Mortgage Securitization Levels ..............................................................................................23 22 U.S. Property Vacancy Rates .................................................................................................24 23 U.S. Property Returns .............................................................................................................25 24 Global Property Returns ..........................................................................................................26 25 Real Estate Properties Sales Volume – Properties over $5 million ..........................................27 26 Sales of Large Commercial Properties ................................................................................... 28 27 Capitalization Rates – U.S. Core Properties over $5 million ....................................................29 28 Private Residential and Nonresidential Construction in Place ..................................................30
APPENDIX
Exhibit Page
A1 CMBS Issuance – Top Ten .....................................................................................................31 A2 CMBS Issuance by Month 1990 – present ..............................................................................32 A3 CMBS Delinquencies by Year of Securitization .......................................................................39 A4 CMBX Spreads – Through 4/17/2009 ......................................................................................44
COMPENDIUM OF
STATISITICS

Updated September 19, 2011
Monthly Quarterly Monthly Quarterly Monthly Quarterly Monthly Quarterly2011 January 155.9 0.0 207.4 363.3
February 5,178.7 1,103.7 0.0 6,282.4March 3,371.4 0.0 0.0 3,371.4
1Q 8,706.0 1,103.7 207.4 10,017.1April 1,201.4 0.0 0.0 1,201.4May 3,181.3 0.0 0.0 3,181.3June 4,313.2 490.5 645.0 5,448.7
2Q 8,695.9 490.5 645.0 9,831.4July 3,733.7 0.0 453.4 4,187.1August 1,830.3 0.0 440.3 2,270.6September 1,492.0 0.0 0.0 1,492.0
3Q 7,056.0 0.0 893.7 7,949.7October 0.0 0.0 0.0 0.0November 0.0 0.0 0.0 0.0December 0.0 0.0 0.0 0.0
4Q 0.0 0.0 0.0 0.0Year 24,458.0 1,594.2 1,746.1 27,798.3
2010 January 83.1 0.0 0.0 83.1February 52.9 1,654.8 0.0 1,707.7March 150.8 0.0 552.4 703.2
1Q 286.7 1,654.8 552.4 2,493.9April 309.7 470.2 0.0 779.9May 0.0 0.0 0.0 0.0June 1,824.7 1,434.5 0.0 3,259.2
2Q 2,134.4 1,904.7 0.0 4,039.1July 0.0 0.0 0.0 0.0August 1,448.5 0.0 0.0 1,448.5September 632.4 0.0 229.2 861.6
3Q 2,080.8 0.0 229.2 2,310.0October 2,693.8 0.0 0.0 2,693.8November 2,159.1 0.0 67.7 2,226.8December 2,957.1 2,013.0 229.4 5,199.5
4Q 7,810.0 2,013.0 297.1 10,120.1Year 12,311.9 5,572.5 1,078.7 18,963.1
2009 J 0 0 7 648 2 0 0 7 648 2
United States Europe Other Total
Exhibit 1CMBS Issuance by Month: 2008-2011($ millions)
2009 January 0.0 7,648.2 0.0 7,648.2February 0.0 9,660.6 154.7 9,815.3March 0.0 56.3 838.9 895.2
1Q 0.0 17,365.1 993.6 18,358.7April 0.0 0.0 167.6 167.6May 0.0 0.0 0.0 0.0June 558.7 3,844.1 802.4 5,285.0
2Q 558.7 3,844.1 970.0 5,452.6July 250.0 594.1 18.2 862.3August 0.0 0.0 222.9 222.9September 0.0 931.0 13.4 944.4
3Q 250.0 1,525.1 254.5 2,029.6October 80.6 0.0 0.0 80.6November 400.0 0.0 0.0 400.0December 1,704.4 0.0 133.6 1,838.0
4Q 2,185.0 0.0 133.6 2,318.6Year 2,993.7 22,734.3 2,351.7 28,159.6
2008 January 0.0 0.0 0.0 0.0February 1,233.9 3,059.4 0.0 4,293.3March 4,670.6 0.0 1,430.3 6,100.9
1Q 5,904.5 3,059.4 1,430.3 10,394.2April 4,022.9 453.1 4,276.1 8,752.1May 948.8 0.0 221.4 1,170.2June 1,269.7 0.0 181.8 1,451.5
2Q 6,241.4 453.1 4,679.3 11,373.8July 0.0 792.0 879.8 1,671.8August 0.0 0.0 49.8 49.8September 1/ 0.0 4,421.9 207.6 4,629.5
3Q 0.0 5,213.9 1,137.2 6,351.1October 0.0 724.7 67.0 791.7November 0.0 116.6 0.0 116.6December 0.0 0.0 556.2 556.2
4Q 0.0 841.3 623.2 1,464.5Year 12,145.9 9,567.7 7,870.0 29,583.6
1/ As of September 30, 2008Source: Commercial Mortgage Alert. See Appendix - Table 1 for data from 1990 to 2005.© 2010 CRE Finance Council, all rights reserved.
Updated January 20, 2009
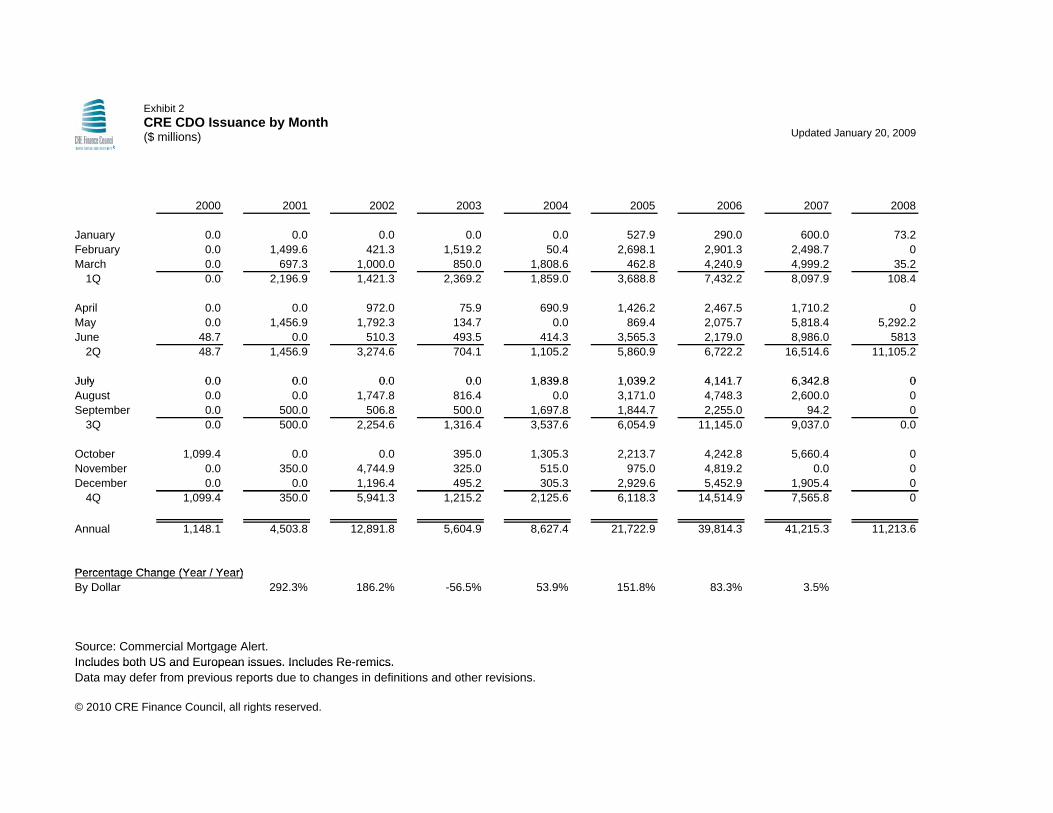
Exhibit 2CRE CDO Issuance by Month($ millions)
2000 2001 2002 2003 2004 2005 2006 2007 2008
January 0.0 0.0 0.0 0.0 0.0 527.9 290.0 600.0 73.2February 0.0 1,499.6 421.3 1,519.2 50.4 2,698.1 2,901.3 2,498.7 0March 0.0 697.3 1,000.0 850.0 1,808.6 462.8 4,240.9 4,999.2 35.2
1Q 0.0 2,196.9 1,421.3 2,369.2 1,859.0 3,688.8 7,432.2 8,097.9 108.4
April 0.0 0.0 972.0 75.9 690.9 1,426.2 2,467.5 1,710.2 0May 0.0 1,456.9 1,792.3 134.7 0.0 869.4 2,075.7 5,818.4 5,292.2June 48.7 0.0 510.3 493.5 414.3 3,565.3 2,179.0 8,986.0 5813
2Q 48.7 1,456.9 3,274.6 704.1 1,105.2 5,860.9 6,722.2 16,514.6 11,105.2
July 0 0 0 0 0 0 0 0 1 839 8 1 039 2 4 141 7 6 342 8 0July 0.0 0.0 0.0 0.0 1,839.8 1,039.2 4,141.7 6,342.8 0August 0.0 0.0 1,747.8 816.4 0.0 3,171.0 4,748.3 2,600.0 0September 0.0 500.0 506.8 500.0 1,697.8 1,844.7 2,255.0 94.2 0
3Q 0.0 500.0 2,254.6 1,316.4 3,537.6 6,054.9 11,145.0 9,037.0 0.0
October 1,099.4 0.0 0.0 395.0 1,305.3 2,213.7 4,242.8 5,660.4 0November 0.0 350.0 4,744.9 325.0 515.0 975.0 4,819.2 0.0 0December 0.0 0.0 1,196.4 495.2 305.3 2,929.6 5,452.9 1,905.4 0
4Q 1,099.4 350.0 5,941.3 1,215.2 2,125.6 6,118.3 14,514.9 7,565.8 0
Annual 1,148.1 4,503.8 12,891.8 5,604.9 8,627.4 21,722.9 39,814.3 41,215.3 11,213.6
Percentage Change (Year / Year)Percentage Change (Year / Year)By Dollar 292.3% 186.2% -56.5% 53.9% 151.8% 83.3% 3.5%
Source: Commercial Mortgage Alert. Includes both US and European issues. Includes Re-remics.Includes both US and European issues. Includes Re remics.Data may defer from previous reports due to changes in definitions and other revisions.
© 2010 CRE Finance Council, all rights reserved.

Updated May 20, 2011
Source: Commercial Mortgage Alert. See Exhibit 1 for underlying data. © 2010 CRE Finance Council, all rights reserved.
4 514 16 15 16
2637
74
5747
67
52
78
93
169
203
230
123
12 10
0.0
50.0
100.0
150.0
200.0
250.0
1990 1991 1992 1993 1994 1995 1996 1997 1998 1999 2000 2001 2002 2003 2004 2005 2006 2007 2008 2009 2010 2011
US Europe Other
Exhibit 3CMBS Issuance($ billions)

Updated May 20, 2011
Total Issuance Recent Years by dollar Recent Years by % Allocation
2011 YTD 2010 2009 2008 2007 2006 2005 2004 2003 2002 2001 2000 2007 2003 2000
United States 1,252,350.3 73.8% 9,907.4 12,311.9 3,073.6 12,145.9 230,193.0 202,654.1 168,734.5 93,306.4 77,848.1 52,073.6 67,149.9 46,894.4 73.0% 72.8% 79.5%United Kingdom 151,609.3 8.9% 1,103.7 1,434.5 3,630.9 1,177.8 19,187.8 38,006.3 35,220.0 15,245.9 7,063.7 5,990.7 10,699.1 4,701.3 6.1% 11.9% 8.0%Japan 59,687.4 3.5% 0.0 229.4 1,259.6 3,348.6 14,806.8 6,861.5 7,517.2 6,887.4 3,172.8 4,630.9 4,804.1 4,009.0 4.7% 5.4% 6.8%Pan-European 64,134.5 3.8% 0.0 1,654.8 10,514.2 6,006.0 22,772.7 12,909.4 2,497.8 2,883.6 939.4 1,123.8 1,536.5 1,296.3 7.2% 2.2% 2.2%Germany 53,726.5 3.2% 0.0 0.0 7,346.2 2,145.3 14,662.5 22,050.0 4,057.4 352.4 1,004.0 601.2 0.0 0.0 4.6% 0.3% 0.0%Italy 24,964.7 1.5% 0.0 2,013.0 0.0 0.0 0.0 2,168.4 9,370.8 180.5 515.2 7,790.3 2,312.6 385.5 0.0% 0.1% 0.7%Canada 20,296.8 1.2% 207.4 0.0 670.0 0.0 3,235.2 4,256.8 2,915.5 1,927.5 2,421.0 1,360.5 1,016.0 886.4 1.0% 1.5% 1.5%France 13,177.1 0.8% 0.0 0.0 0.0 0.0 2,081.6 1,480.5 481.0 1,735.1 2,686.4 882.7 590.0 0.0 0.7% 1.4% 0.0%Netherlands 12,923.5 0.8% 0.0 470.2 0.0 238.6 5,358.7 1,332.0 2,859.6 1,076.5 0.0 1,409.7 178.2 0.0 1.7% 0.8% 0.0%Australia 12,763.2 0.8% 0.0 567.9 222.9 0.0 1,173.6 3,231.6 1,611.2 1,346.3 1,434.8 1,698.8 864.5 283.0 0.4% 1.1% 0.5%Global 4,651.0 0.3% 0.0 0.0 0.0 0.0 0.0 0.0 0.0 717.5 469.0 2,496.1 253.8 0.0 0.0% 0.6% 0.0%Singapore 4,785.4 0.3% 0.0 213.7 167.6 0.0 972.4 838.1 1,112.6 1,175.3 74.6 121.0 110.1 0.0 0.3% 0.9% 0.0%Sweden 3,388.2 0.2% 0.0 0.0 0.0 0.0 0.0 0.0 348.8 926.0 0.0 271.0 241.2 375.4 0.0% 0.7% 0.6%Hong Kong 2,229.8 0.1% 0.0 0.0 0.0 0.0 0.0 0.0 306.7 0.0 0.0 0.0 0.0 179.5 0.0% 0.0% 0.3%South Africa 1,651.7 0.1% 0.0 67.7 31.6 129.6 496.2 560.0 237.8 128.8 0.0 0.0 0.0 0.0 0.2% 0.1% 0.0%Oman 925.0 0.1% 0.0 0.0 0.0 0.0 0.0 925.0 0.0 0.0 0.0 0.0 0.0 0.0 0.0% 0.0% 0.0%Switzerland 805.2 0.0% 0.0 0.0 0.0 0.0 0.0 0.0 0.0 0.0 805.2 0.0 0.0 0.0 0.0% 0.0% 0.0%Spain 668.2 0.0% 0.0 0.0 0.0 0.0 0.0 0.0 668.2 0.0 0.0 0.0 0.0 0.0 0.0% 0.0% 0.0%Thailand 642.3 0.0% 0.0 0.0 0.0 0.0 174.4 218.0 249.9 0.0 0.0 0.0 0.0 0.0 0.1% 0.0% 0.0%Ireland 455.9 0.0% 0.0 0.0 0.0 0.0 0.0 455.9 0.0 0.0 0.0 0.0 0.0 0.0 0.0% 0.0% 0.0%Austria 315.3 0.0% 0.0 0.0 0.0 0.0 0.0 0.0 315.3 0.0 0.0 0.0 0.0 0.0 0.0% 0.0% 0.0%Mexico 301.7 0.0% 0.0 0.0 0.0 0.0 104.2 0.0 0.0 56.6 0.0 0.0 54.2 0.0 0.0% 0.0% 0.1%Malaysia 433.0 0.0% 0.0 0.0 0.0 181.8 132.8 0.0 0.0 0.0 0.0 118.4 0.0 0.0 0.0% 0.0% 0.0%Taiwan 274.6 0.0% 0.0 0.0 0.0 0.0 84.7 0.0 52.6 137.3 0.0 0.0 0.0 0.0 0.0% 0.1% 0.0%China 244.1 0.0% 0.0 0.0 0.0 0.0 0.0 145.0 0.0 99.1 0.0 0.0 0.0 0.0 0.0% 0.1% 0.0%Belgium 184.0 0.0% 0.0 0.0 0.0 0.0 0.0 0.0 0.0 0.0 130.5 0.0 53.5 0.0 0.0% 0.0% 0.1%Poland 86.3 0.0% 0.0 0.0 0.0 0.0 0.0 0.0 0.0 0.0 86.3 0.0 0.0 0.0 0.0% 0.0% 0.0%UAE 63.0 0.0% 63.0 63.0 0.0 0.0 63.0 0.0 0.0 0.0 0.0 0.0 0.0 0.0 0.0% 0.0% 0.0%Other 8,563.7 0.5% 0.0 0.0 0.0 3,950.1 0.0 0.0 0.0 0.0 0.0 210.8 0.0 0.0 0.0% 0.0% 0.0%
0.0Non-US 443,951.5 26.2% 1,374.1 6,714.2 23,843.0 17,177.8 85,306.6 95,438.5 69,822.4 34,875.8 20,802.9 28,705.9 22,713.8 12,116.4 27.0% 27.2% 20.5%Europe 326,438.7 19.2% 1,103.7 5,572.5 21,491.3 9,567.7 64,063.3 78,402.5 55,818.9 22,400.0 13,230.7 18,069.4 15,611.2 6,758.5 20.3% 17.5% 11.5%Total 1,696,301.7 100.0% 0.0 0.0 26,916.6 29,323.7 315,499.6 298,092.6 238,556.9 128,182.2 98,651.0 80,779.5 89,863.7 59,010.8 100.0% 100.0% 100.0%
Total issuance includes years not shown. Excludes agency deals and CRE CDOs. Global issuance distributed based on majority allocation.2008-2010 European Issuance includes ECB deals and TAP issuance only.Source: Commercial Mortgage Alert© 2010 CRE Finance Council, all rights reserved.
Exhibit 4CMBS Issuance by Country($ millions)

Updated June 4, 2010See A3-Appendix for detailed data on delinquencies by vintage year and property type.
Period ALL 30+ 60+ Period ALL 30+ 60+ Period ALL 30+ 60+ Period ALL 30+ 60+ Period ALL 30+ 60+1999 2001 2003 2005 2007
Jan 0.36% 0.21% Jan 0.91% 0.71% Jan 1.67% 1.35% Jan 1.34% 1.15% Jan 0.36% 0.29%Feb 0.45% 0.25% Feb 0.99% 0.76% Feb 1.76% 1.39% Feb 1.29% 1.13% Feb 0.34% 0.26%Mar 0.38% 0.24% Mar 1.02% 0.73% Mar 1.78% 1.44% Mar 1.21% 1.08% Mar 0.29% 0.24%Apr 0.35% 0.22% Apr 0.98% 0.79% Apr 1.80% 1.46% Apr 1.17% 1.01% Apr 0.30% 0.23%
May 0.45% 0.22% May 1.01% 0.78% May 1.81% 1.51% May 1.08% 0.93% May 0.32% 0.23%Jun 0.48% 0.32% Jun 0.95% 0.74% Jun 1.85% 1.60% Jun 1.07% 0.93% Jun 0.31% 0.24%Jul 0.54% 0.36% Jul 0.99% 0.83% Jul 1.87% 1.57% Jul 1.00% 0.87% Jul 0.32% 0.23%
Aug 0.54% 0.37% Aug 1.02% 0.81% Aug 1.86% 1.60% Aug 0.95% 0.81% Aug 0.34% 0.23%Sep 0.54% 0.39% Sep 1.13% 0.93% Sep 1.90% 1.64% Sep 0.91% 0.77% Sep 0.33% 0.23%Oct 0.52% 0.39% Oct 1.18% 0.93% Oct 2.03% 1.65% Oct 1.06% 0.71% Oct 0.40% 0.22%Nov 0.58% 0.38% Nov 1.40% 0.96% Nov 2.01% 1.67% Nov 0.98% 0.71% Nov 0.34% 0.27%Dec 0.58% 0.36% Dec 1.45% 1.12% Dec 2.02% 1.71% Dec 0.84% 0.65% Dec 0.40% 0.28%
2000 2002 2004 2006 2008Jan 0.64% 0.39% Jan 1.57% 1.21% Jan 2.03% 1.66% Jan 0.72% 0.56% Jan 0.40% 0.30%Feb 0.67% 0.42% Feb 1.60% 1.23% Feb 2.02% 1.66% Feb 0.67% 0.54% Feb 0.41% 0.30%Mar 0.73% 0.49% Mar 1.66% 1.35% Mar 1.96% 1.65% Mar 0.61% 0.49% Mar 0.46% 0.33%Apr 0.71% 0.52% Apr 1.66% 1.39% Apr 1.79% 1.53% Apr 0.59% 0.49% Apr 0.48% 0.35%
Exhibit 5CMBS Delinquencies - Monthly
May 0.75% 0.54% May 1.66% 1.43% May 1.77% 1.56% May 0.58% 0.49% May 0.50% 0.39%Jun 0.70% 0.55% Jun 1.71% 1.45% Jun 1.73% 1.51% Jun 0.53% 0.45% Jun 0.51% 0.38%Jul 0.73% 0.53% Jul 1.71% 1.43% Jul 1.58% 1.42% Jul 0.55% 0.43% Jul 0.53% 0.39%
Aug 0.69% 0.56% Aug 1.71% 1.38% Aug 1.50% 1.30% Aug 0.48% 0.40% Aug 0.53% 0.41%Sep 0.77% 0.56% Sep 1.68% 1.37% Sep 1.46% 1.24% Sep 0.54% 0.39% Sep 0.62% 0.45%Oct 0.68% 0.57% Oct 1.62% 1.34% Oct 1.41% 1.22% Oct 0.44% 0.36% Oct 0.75% 0.50%Nov 0.67% 0.55% Nov 1.66% 1.37% Nov 1.43% 1.21% Nov 0.40% 0.33% Nov 1.00% 0.63%Dec 0.85% 0.59% Dec 1.69% 1.38% Dec 1.35% 1.15% Dec 0.36% 0.29% Dec 1.18% 0.83%
2009 2010Jan 1.49% 1.08% Jan 5.96% 4.94%Feb 1.67% 1.22% Feb 7.30% 6.42%Mar 1.89% 1.40% Mar 8.30% 7.20%Apr 2.42% 1.64% Apr 8.33% 7.41%
May 2.73% 2.03% MayJun 4.66% 2.39% JunJul 3.66% 2.88% Jul
Aug 3.92% 2.98% AugSep 4.27% 3.40% SepOct 4.67% 3.64% OctNov 5.02% 4.02% NovDec 5.61% 4.49% Dec
Source:Trepp LLC, CMSA.Data from past periods may differ from previous reports due to updated information. Delinquency rates are fixed-rate, conduit CMBS transactions.
All 30+ include loans 30 60 90-days delinquent performing and non-performing matured loans loans in foreclosure and REO 60+ excludes 30-day delinquencies See CMBS World® for additional delinquency statisticsAll 30+ include loans 30, 60, 90-days delinquent, performing and non-performing matured loans, loans in foreclosure and REO. 60+ excludes 30-day delinquencies. See CMBS World® for additional delinquency statistics

Updated June 4, 2010
See A2-Appendix for detailed data on delinquencies by vintage year and property type.
Period
CMBS Balance
($000,000) ALL 30+ 60+ Chg 60+ Lodging M-Family Office Retail Industrial1Q00 124,100 0.73% 0.49% 0.13% 1.87% 0.32% 0.39% 0.88% 0.71%2Q00 131,478 0.70% 0.55% 0.06% 2.10% 0.30% 0.29% 0.78% 0.64%3Q00 139,806 0.77% 0.56% 0.00% 1.63% 0.35% 0.30% 0.61% 0.79%4Q00 151,668 0.85% 0.59% 0.04% 2.13% 0.46% 0.23% 0.50% 0.71%1Q01 153,708 1.02% 0.73% 0.14% 2.59% 0.56% 0.31% 0.71% 0.76%2Q01 161,169 0.95% 0.74% 0.02% 2.25% 0.38% 0.38% 0.70% 0.70%3Q01 170,132 1.13% 0.93% 0.18% 2.89% 0.51% 0.31% 0.80% 0.62%4Q01 182,031 1.45% 1.12% 0.20% 6.63% 0.79% 0.43% 1.03% 0.76%1Q02 185,335 1.66% 1.35% 0.22% 7.97% 0.76% 0.59% 1.13% 1.35%2Q02 179,936 1.71% 1.45% 0.10% 7.37% 0.72% 0.72% 1.39% 1.54%3Q02 188,197 1.68% 1.37% -0.08% 6.78% 1.02% 0.59% 1.45% 1.34%4Q02 194,060 1.69% 1.38% 0.00% 8.04% 0.92% 0.56% 1.34% 1.44%1Q03 199,030 1.78% 1.44% 0.07% 9.35% 1.03% 0.73% 1.24% 1.50%2Q03 212,377 1.85% 1.60% 0.16% 9.53% 1.14% 0.87% 1.23% 2.04%3Q03 224,411 1.90% 1.64% 0.03% 8.39% 1.36% 1.18% 1.22% 2.01%4Q03 237,391 2.02% 1.71% 0.07% 8.51% 1.86% 1.41% 1.26% 2.11%1Q04 248,457 1.96% 1.65% -0.05% 8.27% 1.94% 1.61% 1.28% 1.76%2Q04 271,184 1.73% 1.51% -0.14% 7.22% 1.91% 1.32% 1.02% 2.18%3Q04 289,207 1.46% 1.24% -0.27% 4.89% 1.89% 1.19% 0.84% 2.02%4Q04 307,732 1.35% 1.15% -0.09% 4.26% 2.14% 0.97% 0.65% 2.09%1Q05 319,213 1.21% 1.08% -0.07% 3.28% 2.12% 0.91% 0.51% 1.77%2Q05 344,235 1.07% 0.93% -0.15% 2.75% 1.97% 0.69% 0.47% 1.38%3Q05 386 758 0 91% 0 77% -0 16% 2 35% 1 70% 0 62% 0 38% 1 43%
Delinquencies by Property Type
Exhibit 6CMBS DelinquenciesQuarterly by Property Type
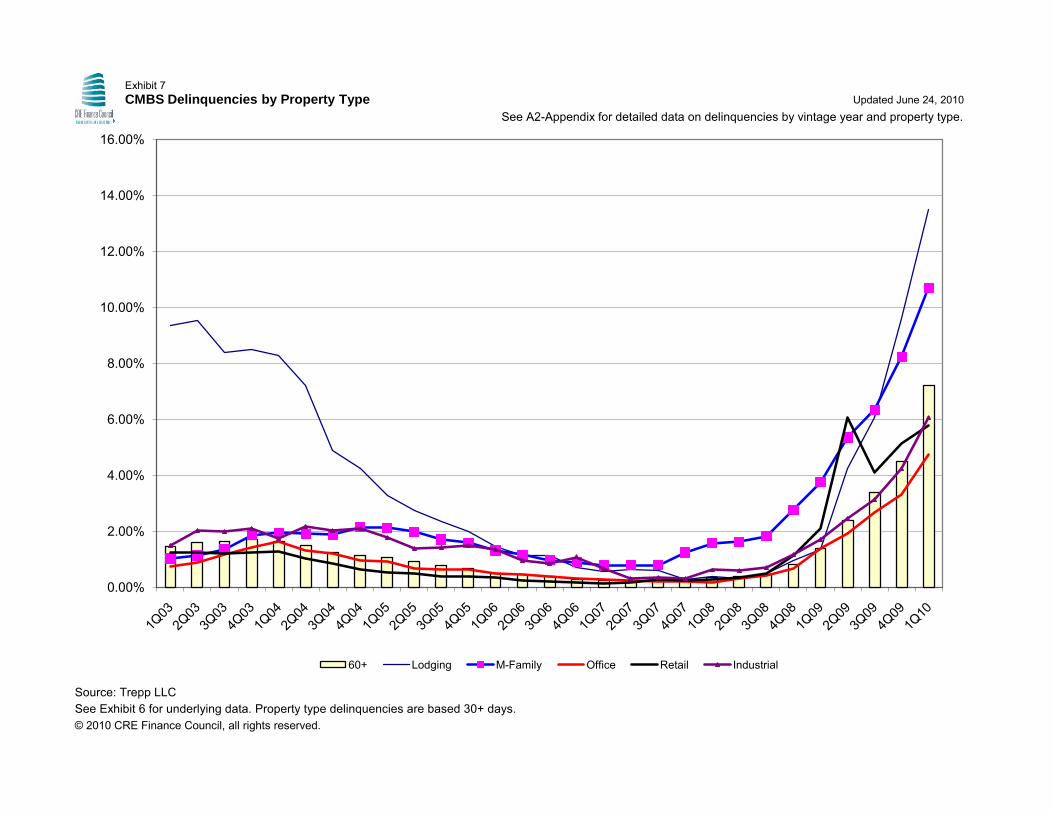
3Q05 386,758 0.91% 0.77% -0.16% 2.35% 1.70% 0.62% 0.38% 1.43%4Q05 416,109 0.84% 0.65% -0.12% 2.00% 1.58% 0.64% 0.39% 1.49%1Q06 475,660 0.61% 0.49% -0.16% 1.44% 1.31% 0.50% 0.35% 1.36%2Q06 502,673 0.53% 0.45% -0.04% 1.13% 1.15% 0.44% 0.24% 0.97%3Q06 535,909 0.54% 0.39% -0.06% 1.14% 0.97% 0.38% 0.20% 0.84%4Q06 591,922 0.36% 0.29% -0.10% 0.70% 0.89% 0.30% 0.19% 1.08%1Q07 637,055 0.29% 0.24% -0.05% 0.56% 0.78% 0.27% 0.15% 0.67%2Q07 633,240 0.31% 0.24% 0.00% 0.63% 0.78% 0.22% 0.17% 0.31%3Q07 686,868 0.33% 0.23% -0.01% 0.60% 0.79% 0.19% 0.26% 0.35%4Q07 707,833 0.40% 0.28% 0.05% 0.29% 1.24% 0.20% 0.25% 0.31%1Q08 706,032 0.46% 0.33% 0.05% 0.37% 1.57% 0.18% 0.29% 0.62%2Q08 693,756 0.51% 0.38% 0.05% 0.32% 1.62% 0.30% 0.35% 0.60%3Q08 685,823 0.62% 0.45% 0.07% 0.48% 1.82% 0.41% 0.48% 0.70%4Q08 668,732 1.18% 0.83% 0.38% 0.95% 2.77% 0.67% 1.14% 1.16%1Q09 661,767 1.89% 1.40% 0.57% 1.37% 3.75% 1.39% 2.10% 1.72%2Q09 653,041 4.66% 2.39% 0.99% 4.23% 5.35% 1.92% 6.05% 2.46%3Q09 642,016 4.27% 3.40% 1.01% 6.08% 6.34% 2.66% 4.10% 3.14%4Q09 639,535 5.61% 4.49% 1.09% 9.59% 8.24% 3.31% 5.14% 4.23%1Q10 660,177 8.30% 7.20% 2.71% 13.50% 10.70% 4.76% 5.77% 6.06%
Source: Trepp LLC, CMSA. Data from past periods may differ from previous reports due to updated information.
Property Type delinqencies are based on 30+ days.
Delinquency rates are for fixed-rate, conduit CMBS transactions. All 30+ include loans 30, 60, 90-daysdelinquent, performing and non-performing matured loans, loans in foreclosure and REO. 60+ excludes30-day delinquencies. See CMBS World® for additional delinquency statistics.
© 2010 CRE Finance Council, all rights reserved.
Updated June 24, 2010See A2-Appendix for detailed data on delinquencies by vintage year and property type.
Source: Trepp LLCSee Exhibit 6 for underlying data. Property type delinquencies are based 30+ days.© 2010 CRE Finance Council, all rights reserved.
0.00%
2.00%
4.00%
6.00%
8.00%
10.00%
12.00%
14.00%
16.00%
60+ Lodging M-Family Office Retail Industrial
Exhibit 7CMBS Delinquencies by Property Type

Updated January 14, 2011Exhibit 8CMBS vs. RMBS Delinquencies
25.0%
30.0%
35.0%
40.0%
45.0%
50.0%
20.0%
25.0%
30.0%
35.0%
40.0%
45.0%
Securitized Mortgages: Residential vs. Commercial (60+ day) by dollar securitized
CMBSAlt-A ResidentialPrime ResidentialTotal ResidentialSubprime Residential
Exhibit 8CMBS vs. RMBS Delinquencies
0.0%
5.0%
10.0%
15.0%
20.0%
25.0%
30.0%
35.0%
40.0%
45.0%
50.0%
0.0%
5.0%
10.0%
15.0%
20.0%
25.0%
30.0%
35.0%
40.0%
45.0%
Securitized Mortgages: Residential vs. Commercial (60+ day) by dollar securitized
CMBSAlt-A ResidentialPrime ResidentialTotal ResidentialSubprime Residential

Source: CMSA, JPMorgan, LoanPerformance,Trepp, Inc.
© 2010 CRE Finance Council, all rights reserved.
Delinquency figures are dollar based (not loan count) and includes loans that are 60+, 90-day delinquent in addition to loans in process of foreclosure and REO. Residential includes loans on residential investment properties, manufactured housing and a limited amount of multifamily holdings. CMBS are commercial mortgages, all properties types, securitized as commercial mortgage backed securities. Historical data subject to quarterly revisions.
Updated May 20, 2011
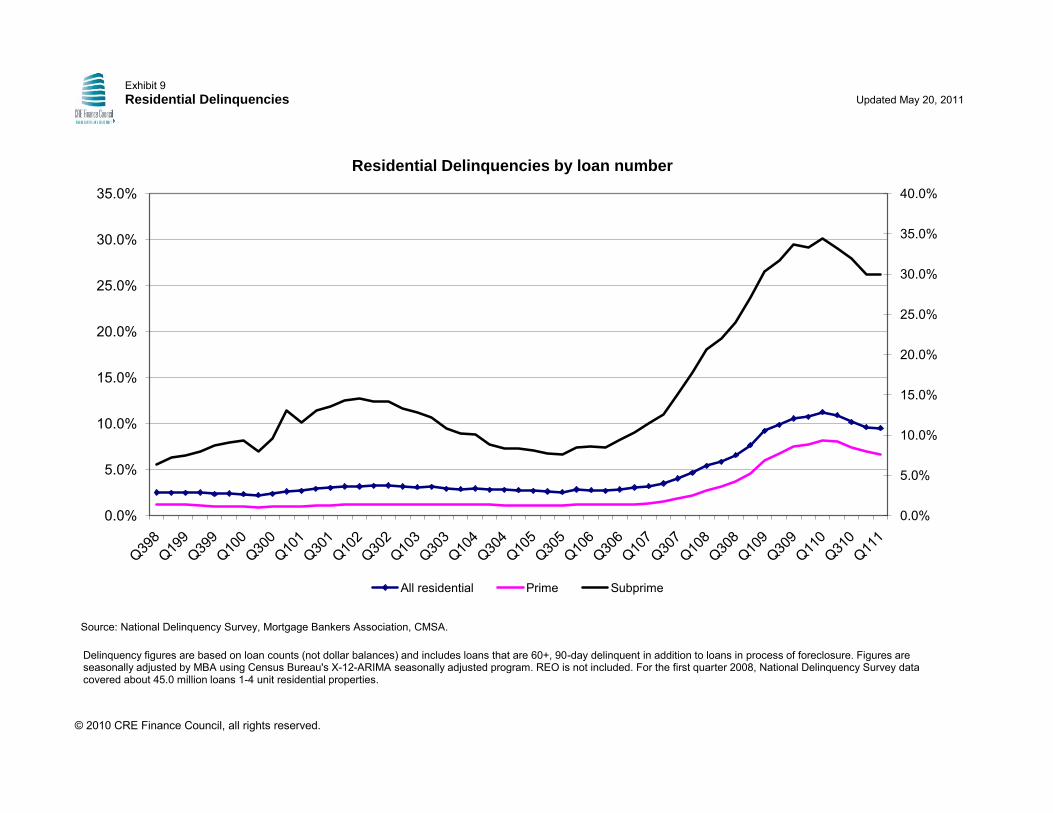
Source: National Delinquency Survey, Mortgage Bankers Association, CMSA.
© 2010 CRE Finance Council, all rights reserved.
Exhibit 9Residential Delinquencies
Delinquency figures are based on loan counts (not dollar balances) and includes loans that are 60+, 90-day delinquent in addition to loans in process of foreclosure. Figures are seasonally adjusted by MBA using Census Bureau's X-12-ARIMA seasonally adjusted program. REO is not included. For the first quarter 2008, National Delinquency Survey data covered about 45.0 million loans 1-4 unit residential properties.
0.0%
5.0%
10.0%
15.0%
20.0%
25.0%
30.0%
35.0%
40.0%
0.0%
5.0%
10.0%
15.0%
20.0%
25.0%
30.0%
35.0%
Residential Delinquencies by loan number
All residential Prime Subprime

Updated May 20, 2011
By US State
Current Balance Allocation By US State
Current Balance Allocation
Alabama 4,565 0.8% Montana 200 0.0%Alaska 593 0.1% Nebraska 1,360 0.2%Arizona 16,550 2.9% Nevada 12,123 2.1%Arkansas 1,839 0.3% New Hampshire 1,548 0.3%California 94,419 16.6% New Jersey 17,697 3.1%Colorado 10,144 1.8% New Mexico 1,917 0.3%Connecticut 8,860 1.6% New York 88,273 15.5%Delaware 2,608 0.5% North Carolina 14,493 2.6%District of Columbia 9,070 1.6% North Dakota 419 0.1%Florida 38,767 6.8% Ohio 13,528 2.4%Georgia 18,295 3.2% Oklahoma 2,536 0.4%Hawaii 5,232 0.9% Oregon 4,591 0.8%Idaho 1,021 0.2% Pennsylvania 18,309 3.2%Illinois 23,191 4.1% Rhode Island 1,130 0.2%Indiana 7,223 1.3% South Carolina 5,230 0.9%Iowa 1,708 0.3% South Dakota 489 0.1%Kansas 2,808 0.5% Tennessee 6,693 1.2%Kentucky 3,444 0.6% Texas 45,428 8.0%Louisiana 4,461 0.8% Utah 3,517 0.6%Maine 960 0.2% Vermont 556 0.1%Maryland 16,638 2.9% Virginia 94 0.0%Massachusetts 14,438 2.5% Washington 10,900 1.9%Michigan 11,483 2.0% West Virginia 863 0.2%Minnesota 6,003 1.1% Wisconsin 4,793 0.8%Mississippi 1,323 0.2% Wyoming 188 0.0%Missouri 5,741 1.0%
Total U.S. by State and Washington, D.C. 568,258 100.0%
Other 1,706Multi-region 81,158Unknown 2,607
Total 653,729
Source: Trepp LLC, CMSA. Due to revisions beginning in July 2008, data allocation may differ from earlier published reports.
© 2010 CRE Finance Council, all rights reserved.
Exhibit 10CMBS by Regions - Detail ($ millions)

Updated September 19, 2011
CMBS by Deal Type
(millions of dollars)
Original Balance Allocation Current Balance Allocation
Conduit 883,267 87.9% 615,073 90.5%HealthCare 159 0.0% 3 0.0%Large Loan 65,846 6.6% 24,158 3.6%Miscellaneous 19,922 2.0% 17,634 2.6%Private 4,597 0.5% 752 0.1%Seasoned 5,043 0.5% 681 0.1%SnglAsset/Borr 25,667 2.6% 21,622 3.2%
Total 1,004,501 100.0% 679,923 100.0%
CMBS by Property Type
(millions of dollars)Original Balance Allocation Current Balance Allocation
Co-op Housing 3,514 0.3% 2,597 0.4%Health Care 6,400 0.6% 2,295 0.3%Industrial 48,574 4.8% 30,364 4.5%Lodging 97,648 9.7% 62,506 9.2%Mixed Use 51,574 5.1% 38,739 5.7%Mobile Home 17,563 1.7% 10,654 1.6%Multi-Family 195,561 19.5% 124,981 18.4%Office 273,951 27.3% 192,643 28.3%Other 10,420 1.0% 6,995 1.0%Retail 280,044 27.9% 194,627 28.6%Self Storage 17,292 1.7% 11,760 1.7%Warehouse 734 0.1% 623 0.1%Unknown 1,226 0.1% 1,140 0.2%Total 1,004,501 100.0% 679,923 100.0%
Source: Trepp LLC, CMSA. Due to revisions beginning in July 2008, data allocation may differ from earlier published reports.
© 2010 CRE Finance Council, all rights reserved.
Exhibit 11 CMBS Breakdowns by Deal and Property Type

Updated May 20, 2011
Source: CMSA, Commercial Mortgage Alert and Federal Reserve© 2010 CRE Finance Council, all rights reserved.
0.00
1.00
2.00
3.00
4.00
5.00
6.00
7.00
8.00
9.00
10.00
0
10
20
30
40
50
60
70
80
Inte
rest
Rate
s
$ B
illi
on
s
US CMBS Issuance 1-Year 5-Year 10-Year
Exhibit 12Interest Rates and CMBS IssuanceQuarterly

Updated May 20, 2011
Source: Morgan Stanley. Generic AAA spreads from August 1996 to December 2004; Super Senior AAA from January 2005 to present. © 2010 CRE Finance Council, all rights reserved.
0
150
300
450
600
750
900
1050
1200
0
150
300
450
600
750
900
1050
1200
basi
s po
ints
Gap Swap Spread CMBS Aaa Spreads Treasurys (10-year)
Exhibit 13CMBS Spreads and Swap SpreadsMonthly

Updated May 20, 2011
Source: Morgan Stanley. Generic AAA spreads from August 1996 to December 2004; Super Senior AAA from January 2005 to present. © 2010 CRE Finance Council, all rights reserved.
0.00
1.00
2.00
3.00
4.00
5.00
6.00
7.00
8.00
0
1000
2000
3000
4000
5000
6000
7000
8000
Inte
rest
Rat
es
basi
s po
ints
10-year Treasurys Aaa/AAA Aa2/AA A2/A Baa2/BBB
Exhibit 14CMBS Spreads Over 10-Year Treasuries: Investment GradeMonthly

Updated May 20, 2011
CMBX.1 Spreads
CMBX.2 Spreads
07/20/1007/30/1008/13/1008/27/1009/03/1009/10/1009/24/1010/01/1010/08/1010/22/1011/05/1011/12/1011/19/1012/10/1012/17/1012/30/10
Source: Markit, CDS IndexCo. AJ tranche added on January 4, 2008.© 2010 CRE Finance Council, all rights reserved.
0
10
20
30
40
50
60
70
80
90
100
0
10
20
30
40
50
60
70
80
90
100 1.AAA
1.AJ
1.AA
1.A
1.BBB
1.BBB-
0
10
20
30
40
50
60
70
80
90
100
0
10
20
30
40
50
60
70
80
90
100
6/4/
2010
6/11
/201
06/
18/2
010
6/25
/201
07/
2/20
107/
9/20
107/
16/2
010
7/23
/201
07/
30/2
010
8/6/
2010
8/13
/201
08/
20/2
010
8/27
/201
09/
3/20
109/
10/2
010
9/17
/201
09/
24/2
010
10/1
/201
010
/8/2
010
10/1
5/20
1010
/22/
2010
10/2
9/20
1011
/5/2
010
11/1
2/20
1011
/19/
2010
11/2
6/20
1012
/3/2
010
12/1
0/20
1012
/17/
2010
12/2
4/20
1012
/31/
2010
1/7/
2011
1/14
/201
11/
21/2
011
1/28
/201
12/
4/20
112/
11/2
011
2/18
/201
12/
25/2
011
3/4/
2011
3/11
/201
13/
18/2
011
3/25
/201
14/
1/20
114/
8/20
114/
15/2
011
4/22
/201
14/
29/2
011
5/6/
2011
5/13
/201
15/
20/2
011
2.AAA
2.AJ
2.AA
2.A
2.BBB
2.BBB-
2.BB
Exhibit 15CMBX Prices Weekly - Friday CloseSpreads through 4/17/09 are in appendix A-4

Updated May 20, 2011
CMBX.3 Spreads
CMBX.4 Spreads
CMBX.5 Spreads
Source: Markit, CDS IndexCo. AJ tranche added on January 4, 2008.© 2010 CRE Finance Council, all rights reserved.
Exhibit 16CMBX Prices Weekly - Friday CloseSpreads through 4/17/09 are in appendix A-4
0102030405060708090100
0102030405060708090
100
3.AAA
3.AJ
3.AA
3.A
3.BBB
3.BBB-
3.BB
0102030405060708090100
0102030405060708090
1004.AAA 4.AJ 4.AA
4.A 4.BBB 4.BBB-
4.BB
0102030405060708090100
0102030405060708090
100 5.AAA 5.AJ 5.AA
5.A 5.BBB 5.BBB-
5.BB

CRE Finance Council, 30 Broad Street, 28th Floor, New York, New York www.crefc.org / 212-509-1844
This page was intentionally left blank.

Ranking Company Name CMBS ($Mil.) CDOs ($Mil.) 12/08 Total ($Mil.) 12/07 Total ($Mil.) 07-'08 Change (%) 12/08 Total As % of Assets1 TIAA-CREF 20,593 1,155 21,748 23,600 -7.8 12.02 M tLif 14 762 168 14 930 17 913 16 7 5 2
Exhibit 18Top CMBS & CDO Portfolios Among InsurersAs of yearend 2008
2 MetLife 14,762 168 14,930 17,913 -16.7 5.23 AIG 13,463 583 14,046 23,224 -39.5 8.34 New York Life 10,861 78 10,939 9,369 16.8 7.15 Prudential Financial 10,652 0 10,652 6,581 61.9 6.06 ING 10,057 0 10,057 10,489 -4.1 11.77 Hartford Life 8,290 1,388 9,678 10,472 -7.6 14.28 Manulife Financial 5,752 0 5,752 6,000 -4.1 3.1, , ,9 Principal Life 5,434 0 5,434 5,158 5.4 8.8
10 Genworth 4,842 0 4,842 5,148 -5.9 8.711 Massachusetts Mutual 3,817 37 3,854 3,741 3.0 4.412 Northwestern Mutual 2,871 699 3,570 4,739 -24.7 2.613 Jackson National 3,222 20 3,242 3,077 5.4 6.714 Great West Lifeco 2,965 0 2,965 2,597 14.2 2.615 AXA Financial 2 888 0 2 888 3 038 -4 9 5 515 AXA Financial 2,888 0 2,888 3,038 -4.9 5.516 Lincoln National 2,529 45 2,574 2,753 -6.5 3.717 Ameriprise/Riversource 2,420 0 2,420 2,708 -10.6 8.318 SunLife Financial 1,889 0 1,889 2,513 -24.8 1.819 Thrivent Financial 1,798 0 1,798 1,889 -4.8 4.220 OM Financial 1,539 163 1,702 2,007 -15.2 10.121 Western & Southern 1,499 0 1,499 2,280 -34.3 6.022 G di Lif 1 195 0 1 195 N/A N/A 3 722 Guardian Life 1,195 0 1,195 N/A N/A 3.723 Pacific Life 1,192 0 1,192 1,370 -13.0 2.824 Protective Life 1,164 0 1,164 1,330 -12.5 4.725 Minnesota Life 976 1 977 1,152 -15.2 9.9
Allstate N/A N/A N/A 8,076 N/A N/AAegon N/A N/A N/A 6,954 N/A N/A
Source: Commercial Mortgage Alert (CMAlert.com)

Updated December 10, 2010
Commercial CMBS Life Savings CMBS IssuersBanks Issuers Companies Institutions GSEs Others Total ex. GSE Pools
1970 26.6 0.1 42.0 41.0 0.9 36.0 146.61980 95.1 6.0 100.2 115.8 6.7 78.6 402.41990 401.8 41.6 244.1 201.0 13.2 207.3 1,109.0 12.9
1991 410.3 44.2 238.8 166.6 14.2 217.9 1,092.0 18.11992 401.9 51.6 221.6 138.0 15.8 206.6 1,035.5 27.81993 394.7 62.5 205.9 128.2 17.5 200.0 1,008.8 40.01994 400.2 70.0 197.6 118.2 18.4 192.4 996.8 47.61995 419.8 81.3 194.6 114.1 18.5 185.7 1,014.0 54.41996 443.0 102.8 191.1 114.3 17.7 188.3 1,057.2 70.31997 472.8 132.4 189.2 110.8 16.2 211.4 1,132.8 94.61998 510.9 205.2 195.5 110.0 16.2 217.5 1,255.3 156.91999 584.0 255.8 211.8 119.4 20.5 246.7 1,438.2 198.32000 660.4 298.5 217.5 128.3 25.0 245.6 1,575.3 232.52001 730.5 358.4 224.0 137.1 33.2 244.7 1,727.9 276.82002 798.2 401.6 231.8 149.3 41.7 243.9 1,866.5 307.12003 867.1 472.1 242.5 167.1 68.2 256.2 2,073.2 357.62004 979.4 527.4 254.6 182.6 82.5 271.1 2,297.6 410.02005 1,128.1 643.3 266.7 198.4 93.0 292.3 2,621.8 522.02006 1,280.8 752.5 281.5 205.4 105.4 324.7 2,950.3 629.02007 1,396.9 919.1 304.0 215.4 147.7 343.9 3,327.0 779.9
2008 Q1 1,427.7 914.6 308.8 226.1 157.7 354.4 3,389.3 771.9Q2 1,463.0 907.7 313.1 230.2 167.7 358.8 3,440.5 761.8Q3 1,521.4 906.3 315.3 191.2 179.4 329.4 3,443.0 757.8
Q4 & YE 1,548.1 895.6 315.5 192.9 189.4 357.1 3,498.6 746.4
Exhibit 19Holders of Commercial & Multifamily Mortgage Loans($ billions)
2009 Q1 1,555.6 890.8 316.4 193.9 191.3 332.8 3,480.8 736.4 Q2 1,552.4 871.4 312.6 194.8 194.6 341.3 3,467.1 714.2Q3 1,532.0 870.7 310.1 190.4 197.4 334.0 3,434.6 708.5
Q4 & YE 1,506.3 855.3 307.4 183.8 197.8 332.4 3,383.0 690.5
2010 Q1 1,488.2 740.3 301.9 184.0 247.8 350.5 3,312.7 679.1 Q2 1,458.3 710.4 298.7 179.8 247.4 348.5 3,243.1 647.2Q3 1,428.0 705.9 298.6 180.1 251.3 338.6 3,202.5 640.0
Q4 & YE
Annual Change 1991 2.1% 6.3% -2.2% -17.1% 7.6% 5.1% -1.5% 40.3%1992 -2.0% 16.7% -7.2% -17.2% 11.3% -5.2% -5.2% 53.6%1993 -1.8% 21.1% -7.1% -7.1% 10.8% -3.2% -2.6% 43.9%1994 1.4% 12.0% -4.0% -7.8% 5.1% -3.8% -1.2% 19.0%1995 4.9% 16.1% -1.5% -3.5% 0.5% -3.5% 1.7% 14.3%1996 5.5% 26.4% -1.8% 0.2% -4.3% 1.4% 4.3% 29.2%1997 6.7% 28.8% -1.0% -3.1% -8.5% 12.3% 7.2% 34.6%1998 8.1% 55.0% 3.3% -0.7% 0.0% 2.9% 10.8% 65.9%1999 14.3% 24.7% 8.3% 8.5% 26.5% 13.4% 14.6% 26.4%2000 13.1% 16.7% 2.7% 7.5% 22.0% -0.4% 9.5% 17.2%2001 10.6% 20.1% 3.0% 6.9% 32.8% -0.4% 9.7% 19.1%2002 9.3% 12.1% 3.5% 8.9% 25.6% -0.3% 8.0% 10.9%2003 8.6% 17.6% 4.6% 11.9% 63.5% 5.0% 11.1% 16.4%2004 13.0% 11.7% 5.0% 9.3% 21.0% 5.8% 10.8% 14.7%2005 15.2% 22.0% 4.8% 8.7% 12.7% 7.8% 14.1% 27.3%2006 13.5% 17.0% 5.5% 3.5% 13.3% 11.1% 12.5% 20.5%2007 9.1% 22.1% 8.0% 4.9% 40.1% 5.9% 12.8% 24.0%2008 10.8% -2.6% 3.8% -10.4% 28.2% 3.8% 5.2% -4.3%
Source: CRE Finance Council, Flow of Funds Accounts of the United States, Federal Reserve, Release Z.1"Other" includes household sector, nonfinancial corporate business, nonfarm noncorporate business, federal, state
Exhibit 19Holders of Commercial & Multifamily Mortgage Loans($ billions)
and local governments, P&C insurance companies, pension funds, finance and mortgages companies and REITs. © 2010 CRE Finance Council, all rights reserved.
Exhibit 19Holders of Commercial & Multifamily Mortgage Loans($ billions)

Updated December 10, 2010
Total Commercial CMBS Life Savings($ Billions) Banks Issuers Companies Institutions GSEs Others
1970 146.6 18.1% 0.1% 28.6% 28.0% 0.6% 24.6%1980 402.4 23.6% 1.5% 24.9% 28.8% 1.7% 19.5%1990 1,109.0 36.2% 3.8% 22.0% 18.1% 1.2% 18.7%
1991 1,092.0 37.6% 4.0% 21.9% 15.3% 1.3% 20.0%1992 1,035.5 38.8% 5.0% 21.4% 13.3% 1.5% 20.0%1993 1,008.8 39.1% 6.2% 20.4% 12.7% 1.7% 19.8%1994 996.8 40.1% 7.0% 19.8% 11.9% 1.8% 19.3%1995 1,014.0 41.4% 8.0% 19.2% 11.3% 1.8% 18.3%1996 1,057.2 41.9% 9.7% 18.1% 10.8% 1.7% 17.8%1997 1,132.8 41.7% 11.7% 16.7% 9.8% 1.4% 18.7%1998 1,255.3 40.7% 16.3% 15.6% 8.8% 1.3% 17.3%1999 1,438.2 40.6% 17.8% 14.7% 8.3% 1.4% 17.2%2000 1,575.3 41.9% 18.9% 13.8% 8.1% 1.6% 15.6%2001 1,727.9 42.3% 20.7% 13.0% 7.9% 1.9% 14.2%2002 1,866.5 42.8% 21.5% 12.4% 8.0% 2.2% 13.1%2003 2,073.2 41.8% 22.8% 11.7% 8.1% 3.3% 12.4%2004 2,297.6 42.6% 23.0% 11.1% 7.9% 3.6% 11.8%
2005 Q1 2,348.0 43.1% 23.6% 11.0% 7.8% 2.9% 11.7%Q2 2,428.7 43.2% 24.0% 10.7% 7.8% 2.9% 11.5%Q3 2,515.5 43.6% 24.0% 10.4% 7.7% 2.9% 11.3%
Q4 & YE 2,621.8 43.0% 24.5% 10.2% 7.6% 3.5% 11.1%
Exhibit 20Holders of Commercial & Multifamily Mortgage LoansPercentage Distribution
,
2006 Q1 2,703.1 43.2% 24.8% 10.0% 7.5% 3.6% 11.0%Q2 2,777.7 43.4% 24.8% 9.9% 7.5% 3.6% 10.9%Q3 2,856.0 43.4% 25.0% 9.8% 7.5% 3.5% 10.8%
Q4 & YE 2,950.3 43.4% 25.5% 9.5% 7.0% 3.6% 11.0%
2007 Q1 3,016.7 42.8% 26.5% 9.4% 6.8% 3.7% 10.7%Q2 3,121.2 42.5% 27.2% 9.3% 6.6% 3.8% 10.6%Q3 3,232.5 42.0% 27.9% 9.1% 6.6% 3.9% 10.5%
Q4 & YE 3,327.0 42.0% 27.6% 9.1% 6.5% 4.4% 10.3%
2008 Q1 3,389.3 42.1% 27.0% 9.1% 6.7% 4.7% 10.5%Q2 3,440.5 42.5% 26.4% 9.1% 6.7% 4.9% 10.4%Q3 3,443.0 44.2% 26.3% 9.2% 5.6% 5.2% 9.6%
Q4 & YE 3,498.6 44.2% 25.6% 9.0% 5.5% 5.4% 10.2%
2009 Q1 3,480.8 44.7% 25.6% 9.1% 5.6% 5.5% 9.6%Q2 3,467.1 44.8% 25.1% 9.0% 5.6% 5.6% 9.8%Q3 3,434.6 44.6% 25.4% 9.0% 5.5% 5.7% 9.7%
Q4 & YE 3,383.0 44.5% 25.3% 9.1% 5.4% 5.8% 9.8%
2010 Q1 3,312.7 44.9% 22.3% 9.1% 5.6% 7.5% 10.6%Q2 3,243.1 45.0% 21.9% 9.2% 5.5% 7.6% 10.7%Q3 3,202.5 44.6% 22.0% 9.3% 5.6% 7.8% 10.6%
Q4 & YESource: CMSA, Flow of Funds Accounts of the United States, Federal Reserve, Release Z.1"Other" includes household sector, nonfinancial corporate business, nonfarm noncorporate business, federal, state and local governments, P&C insurance companies, pension funds, finance and mortgages companies and REITs. © 2010 CRE Finance Council, all rights reserved.

Updated December 10, 2010
1-4 Family ($ billions) Percent SecuritizedABS Total
Total Agencies issuers 1-4 Family Multifamily Commercial Commercial
1970 292.1 2.5 - 0.9% 0.2% 0.0% 0.1%1980 957.9 107.1 - 11.2% 4.2% 0.0% 1.5%1990 2,614.8 991.1 55.2 40.0% 10.3% 1.5% 3.8%
1991 2,783.1 1,130.4 98.2 44.1% 10.5% 1.8% 4.0%1992 2,951.1 1,248.2 146.1 47.2% 11.2% 2.8% 5.0%1993 3,112.8 1,334.3 174.4 48.5% 11.5% 4.3% 6.2%1994 3,292.6 1,449.6 192.4 49.9% 12.0% 5.2% 7.0%1995 3,451.2 1,543.4 193.8 50.3% 14.1% 5.7% 8.0%1996 3,674.7 1,678.8 215.4 51.5% 16.9% 7.0% 9.7%1997 3,909.9 1,788.1 253.8 52.2% 19.5% 8.9% 11.7%1998 4,266.2 1,970.2 321.9 53.7% 24.5% 13.4% 16.3%1999 4,691.5 2,234.7 353.7 55.2% 26.6% 14.7% 17.8%2000 5,118.6 2,425.6 377.5 54.8% 28.1% 15.8% 18.9%2001 5,680.9 2,748.5 463.2 56.5% 30.2% 17.4% 20.7%2002 6,439.4 3,063.7 544.1 56.0% 31.6% 18.0% 21.5%2003 7,232.5 3,211.2 666.0 53.6% 32.1% 19.3% 22.8%2004 8,278.3 3,256.3 1,054.7 52.1% 30.8% 20.1% 23.0%
2005 Q1 8,437.5 3,420.8 1,113.1 53.7% 32.2% 20.5% 23.6%Q2 8,736.1 3,440.8 1,256.2 53.8% 32.0% 21.1% 24.0%Q3 9,077.0 3,487.8 1,435.3 54.2% 31.8% 21.3% 24.0%
Exhibit 21Mortgage Securitization LevelsPercentage Distribution
Q3 9,0 0 3, 8 8 , 35 3 5 % 3 8% 3% 0%Q4 & YE 9,383.8 3,419.7 1,613.1 53.6% 30.6% 22.4% 24.5%
2006 Q1 9,690.7 3,495.9 1,747.2 54.1% 30.5% 22.8% 24.8%Q2 10,012.9 3,557.3 1,887.1 54.4% 30.4% 22.8% 24.8%Q3 10,269.1 3,637.0 2,007.9 55.0% 30.4% 23.1% 25.0%
Q4 & YE 10,463.3 3,710.6 2,133.4 55.9% 30.4% 23.9% 25.5%
2007 Q1 10,670.2 3,826.4 2,215.9 56.6% 31.0% 25.0% 26.5%Q2 10,881.2 3,942.5 2,286.6 57.2% 31.4% 25.8% 27.2%Q3 11,034.2 4,105.9 2,228.1 57.4% 31.8% 26.6% 27.9%
Q4 & YE 11,170.9 4,319.8 2,162.7 58.0% 31.3% 26.4% 27.6%
2008 Q1 11,239.0 4,455.3 2,088.7 58.2% 30.7% 25.7% 27.0%Q2 11,254.2 4,611.3 2,025.3 59.0% 30.2% 25.1% 26.4%Q3 11,166.8 4,741.7 1,931.9 59.8% 29.9% 25.1% 26.3%
Q4 & YE 11,030.2 4,810.8 1,838.6 60.3% 29.3% 24.3% 25.6%
2009 Q1 11,024.3 4,882.8 1,765.0 60.3% 29.5% 24.2% 25.6%Q2 10,951.1 5,011.5 1,680.5 61.1% 29.4% 23.6% 25.1%Q3 10,851.9 5,133.0 1,596.8 62.0% 29.9% 23.7% 25.4%
Q4 & YE 10,785.6 5,213.7 1,525.2 62.5% 30.4% 23.4% 25.3%
2010 Q1 10,749.1 983.5 1,439.9 22.5% 19.8% 23.2% 22.3%Q2 10,644.6 1,004.6 1,386.0 22.5% 20.0% 22.6% 21.9%Q3 10,612.0 1,051.0 1,325.4 22.4% 20.0% 22.8% 22.0%
Q4 & YESource: Flow of Funds Accounts of the United States, Federal Reserve, Release Z.1© 2010 CRE Finance Council, all rights reserved.

Updated January 14, 2011
25.0
Exhibit 22U.S. Property Vacancy Rates Quarterly
20.0
25.0
Exhibit 22U.S. Property Vacancy Rates Quarterly
15.0
20.0
25.0
perc
ent)
Exhibit 22U.S. Property Vacancy Rates Quarterly
Office
10.0
15.0
20.0
25.0
canc
y R
ates
(per
cent
)Exhibit 22U.S. Property Vacancy Rates Quarterly
Industrial
Office
5.0
10.0
15.0
20.0
25.0
Vaca
ncy
Rat
es (p
erce
nt)
Exhibit 22U.S. Property Vacancy Rates Quarterly
Retail
Industrial
Office
0.0
5.0
10.0
15.0
20.0
25.0
1988.1 1989.1 1990.1 1991.1 1992.1 1993.1 1994.1 1995.1 1996.1 1997.1 1998.1 1999.1 2000.1 2001.1 2002.1 2003.1 2004.1 2005.1 2006.1 2007.1 2008.1 2009.1 2010.1
Vaca
ncy
Rat
es (p
erce
nt)
Exhibit 22U.S. Property Vacancy Rates Quarterly
Multifamily
Retail
Industrial
Office
Source: CBRE Econometric Advisors© 2010 CRE Finance Council, all rights reserved.
0.0
5.0
10.0
15.0
20.0
25.0
1988.1 1989.1 1990.1 1991.1 1992.1 1993.1 1994.1 1995.1 1996.1 1997.1 1998.1 1999.1 2000.1 2001.1 2002.1 2003.1 2004.1 2005.1 2006.1 2007.1 2008.1 2009.1 2010.1
Vaca
ncy
Rat
es (p
erce
nt)
Industrial Office Retail Multifamily
Exhibit 22U.S. Property Vacancy Rates Quarterly
Multifamily
Retail
Industrial
Office

Updated May 20, 2011
US Quarterly Returns - By Property Type
Source: National Council of Real Estate Investment Fiduciaries.© 2010 CRE Finance Council, all rights reserved.
16.10
20.4618.09
16.62
9.43
13.1313.8411.24
8.308.009.62
7.77
2.30
-5.59-4.26
1.38
6.397.5410.31
13.9616.24
11.3612.24
7.296.748.99
14.49
20.06
16.6015.80
-6.46
12.55
-10.0
-5.0
0.0
5.0
10.0
15.0
20.0
25.0
Retu
rns
U.S. National Returns - Annual
-10.0
-8.0
-6.0
-4.0
-2.0
0.0
2.0
4.0
6.0
8.0
10.0
Retu
rns
Apartments
-15.0
-10.0
-5.0
0.0
5.0
10.0R
etu
rns
Office
-10.0
-8.0
-6.0
-4.0
-2.0
0.0
2.0
4.0
6.0
8.0
10.0
Retu
rns
Retail
-10.0
-8.0
-6.0
-4.0
-2.0
0.0
2.0
4.0
6.0
8.0
10.0
Retu
rns
Industrial
Exhibit 23U.S. Property Returns

Updated May 8, 2009
Total Returns (%)2001 2002 2003 2004 2005 2006 2007 2008
South Africa 10.5 9.6 15.3 23.4 30.1 27.1 27.7 13Switzerland - 5.6 5.4 5.2 5.2 5.9 7.1 6.1Canada 9.3 8.8 8.3 12.9 18.6 18.4 16.1 3.7Germany 5.3 3.9 2.9 1.1 0.6 1.4 4.5 3.5Netherlands 11.4 8.8 7.1 7.8 10.2 12.5 11.3 3.3Denmark 11.4 9.4 7.2 6.6 18.1 17.3 10.2 3.1Portugal 13.1 13.8 9.8 10.5 10.1 12.0 12.4 2.6Italy - - 10.8 8.3 8.8 8.0 9.2 2France 9.7 8.6 8.0 10.0 15.4 21.9 17.8 -0.9Spain 9.2 8.3 8.4 11.3 17.3 16.9 12.9 -2.8Sweden 4.6 2.4 0.9 5.8 12.7 16.2 14.9 -3.3Norway 10.8 7.0 7.6 10.4 15.2 17.6 18.3 -4.7United Kingdom 6.8 9.6 10.9 18.3 19.1 18.1 -3.4 -22.1Ireland 8.1 2.4 12.4 11.4 24.4 27.2 9.9 -34.2
10.0
20.0
30.0
40.0
rnExhibit 24Global Property Returns(Sorted by 2008 returns)
Source: Investment Property Databank (IPD)© 2010 CRE Finance Council, all rights reserved.
-40.0
-30.0
-20.0
-10.0
0.0
10.0
20.0
30.0
40.0
Tota
l Ret
urn
2005 2006 2007 2008
Exhibit 24Global Property Returns(Sorted by 2008 returns)

Updated May 20, 2011
All Core Apartments% of Total Industrial
% of Total Office
% of Total Retail
% of Total
2001 79.2 20.7 26.1% 13.1 16.5% 30.7 38.7% 14.8 18.7%2002 104.1 23.7 22.8% 12.3 11.8% 41.1 39.5% 27.0 25.9%2003 125.9 31.4 24.9% 14.6 11.6% 49.8 39.6% 30.1 23.9%2004 222.0 54.8 24.7% 25.3 11.4% 78.0 35.1% 63.8 28.8%2005 281.9 87.4 31.0% 39.7 14.1% 104.3 37.0% 50.6 17.9%2006 339.5 90.8 26.7% 48.2 14.2% 146.0 43.0% 54.5 16.0%2007 409.5 96.5 23.6% 49.2 12.0% 196.2 47.9% 67.6 16.5%2008 121.0 33.4 27.6% 19.7 16.3% 50.2 41.5% 17.6 14.6%2009 52.2 15.8 30.2% 8.6 16.5% 15.2 29.2% 12.6 24.1%2010 109.7 31.2 28.4% 16.6 15.2% 42.2 38.5% 19.6 17.9%
2009 Jan 2.6 0.8 31.8% 0.5 17.4% 0.8 31.4% 0.5 19.4%Feb 3.0 0.7 22.3% 0.5 17.6% 1.2 41.1% 0.6 19.0%Mar 2.5 0.9 38.4% 0.5 20.3% 0.5 20.6% 0.5 20.7%
Q1 8.1 2.5 30.3% 1.5 18.3% 2.6 31.7% 1.6 19.6%
Apr 2.9 0.8 26.2% 0.6 20.8% 1.0 33.3% 0.6 19.7%May 5.2 1.6 30.4% 1.3 25.1% 1.3 26.0% 1.0 18.5%Jun 3.8 1.3 34.8% 0.7 17.8% 1.3 34.9% 0.5 12.5%
Q2 11.9 3.7 30.8% 2.6 21.7% 3.6 30.6% 2.0 16.9%
Jul 4.2 0.9 20.3% 0.6 13.6% 1.8 43.2% 1.0 22.9%Aug 4.6 1.5 32.8% 0.5 11.7% 1.7 36.6% 0.9 19.0%Sep 5.5 1.8 33.0% 0.9 15.6% 0.9 17.1% 1.9 34.3%
Q3 14.3 4.2 29.2% 2.0 13.8% 4.4 31.1% 3.7 26.0%
Oct 4.0 1.4 34.6% 0.5 12.3% 1.2 29.1% 1.0 24.1%Nov 9.2 2.1 23.2% 1.1 12.2% 2.5 27.3% 3.4 37.4%Dec 4.8 2.0 41.9% 1.0 20.0% 0.9 19.4% 0.9 18.7%
Q4 18.0 5.5 30.7% 2.6 14.3% 4.6 25.6% 5.3 29.4%
2010 Jan 4.8 2.0 41.9% 1.0 20.0% 0.9 19.4% 0.9 18.7%Feb 3.6 1.2 34.0% 0.5 12.5% 1.5 41.9% 0.4 11.5%Mar 6.0 1.5 24.9% 0.8 13.6% 1.7 28.0% 2.0 33.6%Q1 14.5 4.8 32.9% 2.2 15.4% 4.1 28.6% 3.3 23.1%
Apr 4.6 1.5 33.2% 1.2 25.4% 1.0 21.7% 0.9 19.7%May 5.4 1.7 31.5% 0.8 14.0% 2.2 40.0% 0.8 14.5%Jun 9.9 2.0 20.4% 1.3 13.5% 5.4 54.5% 1.1 11.5%Q2 20.0 5.3 26.4% 3.3 16.4% 8.6 43.0% 2.8 14.2%
Jul 9.4 2.6 27.4% 1.6 17.3% 4.0 43.0% 1.2 12.4%Aug 9.1 2.8 30.8% 1.0 10.5% 1.9 21.2% 3.4 37.5%Sep 10.7 3.9 36.1% 1.5 14.0% 4.1 38.1% 1.3 11.8%Q3 29.2 9.2 31.6% 4.1 13.9% 10.1 34.4% 5.9 20.0%
Oct 9.6 3.1 32.3% 1.2 12.9% 3.1 32.8% 2.1 22.0%Nov 10.5 3.0 28.2% 2.2 20.9% 3.8 36.3% 1.5 14.6%Dec 25.9 5.9 22.6% 3.6 14.0% 12.5 48.2% 3.9 15.2%Q4 46.0 11.9 25.9% 7.0 15.3% 19.5 42.3% 7.6 16.4%
2011 Jan 8.6 2.2 26.0% 0.9 10.8% 3.3 37.8% 2.2 25.5%Feb 6.6 2.0 30.9% 0.8 11.4% 2.2 33.7% 1.6 24.0%Mar 10.0 3.0 30.2% 0.9 9.3% 4.3 42.6% 1.8 17.8%Q1 25.3 7.3 28.9% 2.6 10.4% 9.8 38.6% 5.6 22.1%
AprMayJunQ2
JulAugSepQ3
OctNovDecQ4
Source: Real Capital Analytics. Data from past periods may differ from previous reports due to updated information. © 2010 CRE Finance Council, all rights reserved.
Exhibit 25Real Estate Properties Sales Volume - Properties over $5 millionCore Properties ($ billions)

Updated May 20, 2011
Source: Real Capital Analytics. Limited to properties $5 million or greater. 2009 YTD data as of January 2009. Data from past periods may differ from previous reports due to updated information.© 2010 CRE Finance Council, all rights reserved.
Exhibit 26Sales of Large Commercial Properties
77.8
101.7122.2
191.9
274.8
318.7
427.4
114.6
48.6
72.576.072.0
98.2
124.4112.8111.6
95.2
42.537.632.918.7
9.4 10.412.418.314.019.429.2
46.025.3
0
50
100
150
200
250
300
350
400
450
2001
2002
2003
2004
2005
2006
2007
2008
2009
06Q1
06Q2
06Q3
06Q4
07Q1
07Q2
07Q3
07Q4
08Q1
08Q2
08Q3
08Q4
09Q1
09Q2
09Q3
09Q4
10Q1
10Q2
10Q3
10Q4
11Q1
($ b
illion
s)
All Apartment Office Industrial Retail

Updated May 20, 2011
All Core Apartments Industrial Office Retail
2001 9.18 8.49 9.68 9.56 9.392002 8.76 8.03 9.35 9.10 9.072003 8.03 7.27 8.75 8.53 8.222004 7.41 6.68 8.19 7.81 7.622005 6.78 5.98 7.52 7.21 7.112006 6.65 6.05 7.16 6.87 6.832007 6.44 6.15 6.90 6.40 6.602008 6.88 6.49 7.51 7.12 6.932009 2.17 7.00 8.57 8.33 8.022010 7.37 6.63 8.32 7.41 6.96
2009 Jan 7.49 6.87 8.41 7.85 7.63Feb 7.35 6.78 8.03 7.96 7.25Mar 7.05 6.35 7.96 7.22 7.36
Q1 7.30 6.64 8.12 7.78 7.40
Apr 7.79 7.36 8.70 8.16 7.63May 7.78 7.23 8.43 8.43 8.15Jun 7.84 7.52 8.16 7.88 8.05
Q2 7.80 7.36 8.42 8.16 7.98
Jul 8.00 7.25 9.47 7.95 8.11Aug 7.62 6.47 8.44 8.79 8.15Sep 8.09 7.17 9.37 8.95 8.62
Q3 7.91 6.93 9.15 8.47 8.38
Oct 7.77 7.24 8.40 7.91 8.50Nov 7.87 6.90 8.46 9.16 7.77Dec 7.77 6.89 8.73 8.07 8.15
Q4 7.82 6.98 8.55 8.62 7.97
2010 Jan 7.77 6.89 8.73 8.07 8.15Feb 7.50 6.58 8.42 8.70 8.03Mar 7.92 7.00 8.88 8.15 8.50
Q1 7.77 6.84 8.72 8.33 8.35
Apr 7.78 6.30 8.58 8.35 7.92May 7.40 6.85 8.08 7.41 8.07Jun 7.71 7.11 7.98 8.04 7.97
Q2 7.64 6.79 8.22 7.92 7.98
Jul 7.21 6.85 8.47 7.05 7.47Aug 7.44 6.35 8.96 8.18 7.83Sep 7.22 6.53 8.12 7.20 7.61
Q3 7.28 6.56 8.46 7.33 7.71
Oct 7.30 6.69 8.57 7.03 7.69Nov 7.28 6.44 8.25 7.33 7.54Dec 7.08 6.46 7.98 6.94 7.66
Q4 7.17 6.60 8.16 7.03 7.64
2011 Jan 7.27 6.89 7.69 7.46 7.49Feb 7.14 6.90 7.43 7.37 7.17Mar 6.95 5.99 7.97 7.22 7.48
Q1 7.11 6.52 7.71 7.33 7.40
Apr 0.00 0.00 0.00 0.00 0.00May 0.00 0.00 0.00 0.00 0.00Jun 0.00 0.00 0.00 0.00 0.00
Q2 0.00 0.00 0.00 0.00 0.00
Jul 0.00 0.00 0.00 0.00 0.00Aug 0.00 0.00 0.00 0.00 0.00Sep 0.00 0.00 0.00 0.00 0.00
Q3 0.00 0.00 0.00 0.00 0.00
Oct 0.00 0.00 0.00 0.00 0.00Nov 0.00 0.00 0.00 0.00 0.00Dec 0.00 0.00 0.00 0.00 0.00
Q4 0.00 0.00 0.00 0.00 0.00Source: Real Capital Analytics. Data from past periods may differ from previous reports due to updated information. © 2010 CRE Finance Council, all rights reserved.
Exhibit 27Capitalization Rates - U.S. Core Properties over $5 million

Updated March 4, 2011
300000
400000
500000
600000
700000
800000
$ M
illio
nsExhibit 28Private Residential and Nonresidential Construction in PlaceSeasonally Adjusted Annual Rate
Source: CMSA, U.S. Census© 2010 CRE Finance Council, all rights reserved.
0
100000
200000
300000
400000
500000
600000
700000
800000
1993 1994 1995 1996 1997 1998 1999 2000 2001 2002 2003 2004 2005 2006 2007 2008 2009 2010 2011
$ M
illio
ns
Nonresidential Construction Residential Construction
Exhibit 28Private Residential and Nonresidential Construction in PlaceSeasonally Adjusted Annual Rate

Updated October 10, 2008
Top Ten Deals - Globally
Amount PRICING Distribution Collateral1 Wachovia Bank Commercial Mortgage Trust 7,903.5 03/14/07 US US2 GS Mortgage Securities Trust 7,562.8 06/21/07 US US3 German Residential Asset Note Distributor PLC 6,907.8 07/28/06 Europe Germany4 GS Mortgage Securities Corp. II 6,867.2 06/01/07 US US5 Societa Cartolarizzazione Immobili Pubblici Srl (SCIP) 6,644.3 12/04/02 Europe Italy6 CD Commercial Mortgage Trust 6,640.3 03/14/07 US US7 Greenwich Capital Commercial Funding Corp.2007-GG9 6,575.9 02/21/07 US US8 Wachovia Bank Commercial Mortgage Trust 5,845.5 05/11/07 US US9 Societa Cartolarizzazione Immobili Pubblici Srl (SCIP) 5,647.8 04/21/05 Europe Italy
10 J.P. Morgan Chase Commercial Mortgage Securities Trust 5,414.2 06/28/07 US US
Top Ten Months by Issuance - US1 March 2007 38,477.4 2 June 2007 37,359.7 3 August 2007 29,903.9 4 December 2006 29,865.1 5 March 2006 28,335.0 6 June 2006 25,505.7 7 December 2005 24,421.3 8 September 2006 23,407.3 9 June 2005 22,653.7
10 October 2006 21,852.5
Top Ten Months by Issuance - Europe
Issuer
A1 - AppendixCMBS Issuance - Top Ten($ millions)
p y p1 June 2007 19,574.2 2 July 2006 17,768.9 3 November 2006 13,421.6 4 April 2005 12,177.9 5 December 2006 10,097.3 6 March 2007 10,074.9 7 March 2006 7,979.1 8 December 2002 7,964.8 9 June 2006 7,325.8
10 September 2006 7,222.0
Top Ten Months by Issuance - Total1 June 2007 59,043.5 2 March 2007 49,013.3 3 December 2006 41,821.4 4 March 2006 37,268.8 5 November 2006 35,666.1 6 August 2007 34,381.8 7 June 2006 34,284.2 8 September 2006 32,524.1 9 December 2005 31,487.5
10 May 2007 29,060.5
Source: Commercial Mortgage Alert© 2010 CRE Finance Council, all rights reserved.

Updated May 20, 2011
Monthly Quarterly Monthly Quarterly Monthly Quarterly Monthly Quarterly2011 January 155.9 0.0 207.4 363.3
February 5,178.7 1,103.7 0.0 6,282.4March 3,371.4 0.0 0.0 3,371.4
1Q 8,706.0 1,103.7 207.4 10,017.1April 1,201.4 0.0 0.0 1,201.4May 0.0 0.0 0.0 0.0June 0.0 0.0 0.0 0.0
2Q 1,201.4 0.0 0.0 1,201.4July 0.0 0.0 0.0 0.0August 0.0 0.0 0.0 0.0September 0.0 0.0 0.0 0.0
3Q 0.0 0.0 0.0 0.0October 0.0 0.0 0.0 0.0November 0.0 0.0 0.0 0.0December 0.0 0.0 0.0 0.0
4Q 0.0 0.0 0.0 0.0Year 9,907.4 1,103.7 207.4 11,218.5
2010 January 83.1 0.0 0.0 83.1February 52.9 1,654.8 0.0 1,707.7March 150.8 0.0 552.4 703.2
1Q 286.7 1,654.8 552.4 2,493.9April 309.7 470.2 0.0 779.9May 0.0 0.0 0.0 0.0June 1,824.7 1,434.5 0.0 3,259.2
2Q 2,134.4 1,904.7 0.0 4,039.1July 0.0 0.0 0.0 0.0August 1,448.5 0.0 0.0 1,448.5September 632.4 0.0 229.2 861.6
3Q 2,080.8 0.0 229.2 2,310.0October 2,693.8 0.0 0.0 2,693.8November 2,159.1 0.0 67.7 2,226.8December 2,957.1 2,013.0 229.4 5,199.5
4Q 7,810.0 2,013.0 297.1 10,120.1Year 12,311.9 5,572.5 1,078.7 18,963.1
2009 January 0.0 7,648.2 0.0 7,648.2February 0.0 9,660.6 154.7 9,815.3March 0.0 56.3 838.9 895.2
1Q 0.0 17,365.1 993.6 18,358.7April 0.0 0.0 167.6 167.6May 0.0 0.0 0.0 0.0June 558.7 3,844.1 802.4 5,285.0
2Q 558.7 3,844.1 970.0 5,452.6July 250.0 594.1 18.2 862.3August 0.0 0.0 222.9 222.9September 0.0 931.0 13.4 944.4
3Q 250.0 1,525.1 254.5 2,029.6October 80.6 0.0 0.0 80.6November 400.0 0.0 0.0 400.0December 1,704.4 0.0 133.6 1,838.0
4Q 2,185.0 0.0 133.6 2,318.6Year 2,993.7 22,734.3 2,351.7 28,159.6
United States Europe Other Total
A2 - AppendixCMBS Issuance - Breakdown by Period
($ millions)

Updated May 20, 2011
Monthly Quarterly Monthly Quarterly Monthly Quarterly Monthly QuarterlyUnited States Europe Other Total
A2 - AppendixCMBS Issuance - Breakdown by Period
($ millions)
2008 January 0.0 0.0 0.0 0.0February 1,233.9 3,059.4 0.0 4,293.3March 4,670.6 0.0 1,430.3 6,100.9
1Q 5,904.5 3,059.4 1,430.3 10,394.2April 4,022.9 453.1 4,276.1 8,752.1May 948.8 0.0 221.4 1,170.2June 1,269.7 0.0 181.8 1,451.5
2Q 6,241.4 453.1 4,679.3 11,373.8July 0.0 792.0 879.8 1,671.8August 0.0 0.0 49.8 49.8September 0.0 4,421.9 207.6 4,629.5
3Q 0.0 5,213.9 1,137.2 6,351.1October 0.0 724.7 67.0 791.7November 0.0 116.6 0.0 116.6December 0.0 0.0 556.2 556.2
4Q 0.0 841.3 623.2 1,464.5Year 12,145.9 9,567.7 7,870.0 29,583.6
2007 January 1,554.5 2,372.3 831.0 4,757.8February 21,123.8 4,630.3 1,682.8 27,436.9March 38,477.4 10,074.9 461.0 49,013.3
1Q 61,155.7 17,077.5 2,974.8 81,208.0April 17,318.6 3,853.1 1,283.6 22,455.3May 21,157.2 6,431.6 1,575.9 29,164.7June 37,356.5 19,574.2 2,112.8 59,043.5
2Q 75,832.3 29,858.9 4,972.3 110,663.5July 21,796.8 6,673.7 1,301.6 29,772.1August 29,903.9 3,663.4 1,643.2 35,210.5September 8,238.8 0.0 4,052.2 12,291.0
3Q 59,939.5 10,337.1 6,997.0 77,273.6October 6,271.4 466.5 1,843.4 8,581.3November 17,101.6 4,114.9 3,577.9 24,794.4December 9,892.4 2,208.4 745.1 12,845.9
4Q 33,265.5 6,789.8 6,166.4 46,221.7Year 230,193.0 64,063.3 21,110.5 315,366.8
2006 January 6,197.9 986.1 142.6 7,326.6February 11,926.9 2,333.2 1,136.4 15,396.5March 28,335.0 7,979.1 954.7 37,268.8
1Q 46,459.9 11,298.4 2,233.7 59,992.0April 6,023.2 2,810.2 3,624.7 12,458.1May 10,855.1 2,376.5 317.3 13,548.9June 25,505.7 7,325.8 1,452.7 34,284.2
2Q 42,384.0 12,512.5 5,394.7 60,291.2July 5,903.6 17,768.9 426.8 24,099.3August 12,094.7 2,557.5 285.9 14,938.1September 23,407.3 7,222.0 1,894.8 32,524.1
3Q 41,405.6 27,548.4 2,607.5 71,561.5October 22,267.9 3,704.3 2,788.1 28,760.3November 20,271.5 13,241.6 2,153.0 35,666.1December 29,865.1 10,097.3 1,859.0 41,821.4
4Q 72,404.6 27,043.2 6,800.1 106,247.9Year 202,654.1 78,402.5 17,036.0 298,092.6
1/ As of September 30, 2008Source: Commercial Mortgage Alert

Updated May 20, 2011
Monthly Quarterly Monthly Quarterly Monthly Quarterly Monthly QuarterlyUnited States Europe Other Total
A2 - AppendixCMBS Issuance - Breakdown by Period
($ millions)
2005 January 8,160.7 1,128.3 0.0 9,289.0February 3,855.5 5,404.6 198.8 9,458.9March 20,939.5 2,914.5 1,524.0 25,378.0
1Q 32,955.7 9,447.4 1,722.8 44,125.9April 6,173.5 12,177.9 818.0 19,169.4May 10,600.2 3,313.4 1,074.7 14,988.3June 22,653.7 4,199.8 1,218.7 28,072.2
2Q 39,427.4 19,691.1 3,111.4 62,229.9July 8,026.3 4,639.3 2,191.5 14,857.1August 19,128.4 1,780.7 1,954.8 22,863.9September 11,845.6 4,667.1 909.0 17,421.7
3Q 39,000.3 11,087.1 5,055.3 55,142.7October 21,852.5 2,711.5 2,290.6 26,854.6November 11,077.2 6,603.8 1,035.2 18,716.2December 24,421.3 6,278.0 788.2 31,487.5
4Q 57,351.0 15,593.3 4,114.0 77,058.3Year 168,734.5 55,818.9 14,003.5 238,556.9
2004 January 4,345.8 0.0 1,286.3 5,632.1February 6,428.7 3,048.8 1,588.6 11,066.1March 8,201.7 943.8 1,197.7 10,343.2
1Q 18,976.2 3,992.6 4,072.6 27,041.4April 9,698.7 2,587.2 254.7 12,540.6May 4,615.6 1,109.1 2,082.0 7,806.7June 10,310.8 885.5 850.6 12,046.9
2Q 24,625.1 4,581.8 3,187.3 32,394.2July 8,676.3 1,003.7 297.7 9,977.7August 8,427.6 2,674.9 664.8 11,767.3September 4,441.4 1,594.4 1,461.1 7,496.9
3Q 21,545.3 5,273.0 2,423.6 29,241.9October 8,814.4 6,266.9 841.0 15,922.3November 9,911.8 1,668.3 1,038.4 12,618.5December 9,433.6 1,334.9 195.4 10,963.9
4Q 28,159.8 9,270.1 2,074.8 39,504.7Year 93,306.4 23,117.5 11,758.3 128,182.2
2003 January 2,239.6 0.0 296.6 2,536.2February 1,861.9 572.8 782.9 3,217.6March 10,818.8 0.0 313.8 11,132.6
1Q 14,920.3 572.8 1,393.3 16,886.4April 4,731.1 387.0 425.0 5,543.1May 6,982.7 2,230.8 549.5 9,763.0June 8,491.2 404.0 1,193.8 10,089.0
2Q 20,205.0 3,021.8 2,168.3 25,395.1July 5,223.4 2,327.8 562.2 8,113.4August 5,134.6 0.0 226.3 5,360.9September 7,290.4 1,002.2 451.6 8,744.2
3Q 17,648.4 3,330.0 1,240.1 22,218.5October 4,339.8 978.1 919.1 6,237.0November 12,683.3 3,240.8 1,264.4 17,188.5December 8,051.4 2,556.2 118.0 10,725.6
4Q 25,074.4 6,775.1 2,301.5 34,151.0Year 77,848.1 13,699.7 7,103.2 98,651.0

Updated May 20, 2011
Monthly Quarterly Monthly Quarterly Monthly Quarterly Monthly QuarterlyUnited States Europe Other Total
A2 - AppendixCMBS Issuance - Breakdown by Period
($ millions)
2002 January 1,051.6 0.0 18.7 1,070.3February 2,904.6 1,787.9 465.4 5,157.9March 5,200.0 0.0 1,443.0 6,643.0
1Q 9,156.2 1,787.9 1,927.1 12,871.2April 3,623.9 518.8 714.4 4,857.1May 4,954.0 1,386.3 272.7 6,613.0June 5,765.5 723.6 1,029.1 7,518.2
2Q 14,343.4 2,628.7 2,016.2 18,988.3July 3,036.7 2,220.6 921.4 6,178.7August 5,138.2 2,439.1 176.1 7,753.4September 4,298.8 799.4 429.9 5,528.1
3Q 12,473.7 5,459.1 1,527.4 19,460.1October 4,672.6 2,208.8 683.0 7,564.4November 4,634.3 516.2 1,518.4 6,668.9December 6,793.4 7,964.8 468.3 15,226.5
4Q 16,100.3 10,689.8 2,669.7 29,459.8Year 52,073.6 20,565.5 8,140.4 80,779.5
2001 January 2,449.4 0.0 132.3 2,581.7February 2,687.5 174.1 683.5 3,545.1March 6,877.0 1,728.2 365.2 8,970.4
1Q 12,013.9 1,902.3 1,181.0 15,097.2April 2,811.5 945.0 558.7 4,315.2May 8,806.1 1,239.4 443.7 10,489.2June 4,076.3 1,881.6 177.6 6,135.5
2Q 15,693.9 4,066.0 1,180.0 20,939.9July 7,951.2 694.5 816.8 9,462.6August 6,013.6 804.7 620.6 7,438.9September 1,691.3 241.2 297.6 2,230.1
3Q 15,656.1 1,740.4 1,735.0 19,131.6October 4,003.6 0.0 0.0 4,003.6November 8,777.4 1,945.2 2,364.8 13,087.4December 11,005.0 6,211.0 388.1 17,604.1
4Q 23,786.0 8,156.2 2,752.9 34,695.1Year 67,149.9 15,865.0 6,848.9 89,863.7
2000 January 3,382.6 0.0 0.0 3,382.6February 2,364.5 1,480.4 964.2 4,809.1March 2,172.8 2,211.8 359.1 4,743.7
1Q 7,919.8 3,692.2 1,323.3 12,935.3April 2,164.6 0.0 0.0 2,164.6May 3,447.7 701.5 364.0 4,513.2June 6,675.0 387.0 631.0 7,693.0
2Q 12,287.3 1,088.5 995.0 14,370.8July 2,815.0 0.0 131.6 2,946.6August 2,720.3 349.7 1,385.4 4,455.4September 6,344.5 1,213.0 256.8 7,814.3
3Q 11,879.8 1,562.7 1,773.8 15,216.3October 4,779.9 0.0 928.9 5,708.8November 2,585.1 415.1 185.5 3,185.7December 7,442.4 0.0 151.4 7,593.8
4Q 14,807.4 415.1 1,265.8 16,488.3
Source: Commercial Mortgage Alert

Updated May 20, 2011
Monthly Quarterly Monthly Quarterly Monthly Quarterly Monthly QuarterlyUnited States Europe Other Total
A2 - AppendixCMBS Issuance - Breakdown by Period
($ millions)
Year 46,894.4 6,758.5 5,357.9 59,010.8
1999 January 2,709.7 0.0 0.0 2,709.7February 6,812.1 946.1 657.6 8,415.8March 6,790.6 343.0 55.0 7,188.6
1Q 16,312.4 1,289.1 712.6 18,314.1April 1,883.4 0.0 0.0 1,883.4May 7,480.0 2,520.0 172.7 10,172.7June 2,631.1 0.0 592.2 3,223.3
2Q 11,994.6 2,520.0 764.9 15,279.5July 4,423.6 129.7 0.0 4,553.3August 6,221.4 272.4 243.2 6,737.0September 3,781.0 0.0 528.2 4,309.2
3Q 14,425.9 402.1 771.4 15,599.4October 4,781.0 322.2 239.3 5,342.6November 7,239.2 770.5 718.4 8,728.1December 1,818.0 574.5 0.0 2,392.5
4Q 13,838.2 1,667.2 957.7 16,463.2Year 56,571.1 5,878.4 3,206.6 65,656.1
1998 January 2,306.7 0.0 0.0 2,306.7February 4,650.6 0.0 0.0 4,650.6March 11,213.0 170.1 0.0 11,383.1
1Q 18,170.2 170.1 0.0 18,340.3April 5,502.4 0.0 0.0 5,502.4May 6,537.3 0.0 0.0 6,537.3June 10,120.9 0.0 340.5 10,461.4
2Q 22,160.6 0.0 340.5 22,501.1July 1,294.6 0.0 0.0 1,294.6August 5,104.2 0.0 0.0 5,104.2September 6,058.5 0.0 0.0 6,058.5
3Q 12,457.2 0.0 0.0 12,457.2October 7,168.5 0.0 0.0 7,168.5November 11,641.0 0.0 0.0 11,641.0December 2,734.2 0.0 118.2 2,852.4
4Q 21,543.7 0.0 118.2 21,661.9Year 74,331.7 170.1 458.7 74,960.5
1997 January 766.7 0.0 297.7 1,064.4February 612.0 0.0 0.0 612.0March 3,280.4 284.1 300.0 3,864.5
1Q 4,659.1 284.1 597.7 5,540.9April 1,124.4 0.0 0.0 1,124.4May 1,510.8 229.4 0.0 1,740.2June 6,024.2 193.2 0.0 6,217.4
2Q 8,659.4 422.6 0.0 9,082.0July 530.3 0.0 0.0 530.3August 1,290.3 200.7 0.0 1,491.0September 5,949.0 523.1 0.0 6,472.1
3Q 7,769.7 723.8 0.0 8,493.5October 4,654.4 337.5 0.0 4,991.9November 5,489.3 938.5 0.0 6,427.8December 5,565.8 252.8 0.0 5,818.6
Source: Commercial Mortgage Alert

Updated May 20, 2011
Monthly Quarterly Monthly Quarterly Monthly Quarterly Monthly QuarterlyUnited States Europe Other Total
A2 - AppendixCMBS Issuance - Breakdown by Period
($ millions)
4Q 15,709.5 1,528.8 0.0 17,238.3Year 36,797.7 2,959.3 597.7 40,354.7
1996 January 972.3 0.0 0.0 972.3February 3,154.3 0.0 0.0 3,154.3March 2,827.2 0.0 0.0 2,827.2
1Q 6,953.8 0.0 0.0 6,953.8April 467.8 0.0 0.0 467.8May 1,788.1 0.0 0.0 1,788.1June 2,842.4 186.7 0.0 3,029.1
2Q 5,098.3 186.7 0.0 5,285.0July 233.0 0.0 27.2 260.2August 1,209.8 0.0 0.0 1,209.8September 1,756.5 0.0 0.0 1,756.5
3Q 3,199.3 0.0 27.2 3,226.5October 2,339.1 0.0 135.6 2,474.7November 3,714.2 474.2 0.0 4,188.4December 5,033.4 133.8 0.0 5,167.2
4Q 11,086.7 608.0 135.6 11,830.3Year 26,338.1 794.7 162.8 27,295.6
1995 January 1,045.0 0.0 0.0 1,045.0February 512.1 0.0 0.0 512.1March 791.9 175.3 0.0 967.2
1Q 2,349.0 175.3 0.0 2,524.3April 639.2 380.8 0.0 1,020.0May 576.1 295.4 0.0 871.5June 1,415.4 0.0 0.0 1,415.4
2Q 2,630.7 676.2 0.0 3,306.9July 1,353.4 0.0 0.0 1,353.4August 1,563.1 0.0 0.0 1,563.1September 1,161.7 78.7 120.7 1,361.1
3Q 4,078.2 78.7 120.7 4,277.6October 2,814.0 0.0 0.0 2,814.0November 1,474.9 0.0 0.0 1,474.9December 2,403.0 0.0 0.0 2,403.0
4Q 6,691.9 0.0 0.0 6,691.9Year 15,749.7 930.2 120.7 16,800.6
1994 January 851.0 0.0 0.0 851.0February 650.4 0.0 0.0 650.4March 2,231.7 498.0 0.0 2,729.7
1Q 3,733.1 498.0 0.0 4,231.1April 1,668.6 1,784.7 0.0 3,453.3May 746.9 0.0 0.0 746.9June 557.8 0.0 0.0 557.8
2Q 2,973.3 1,784.7 0.0 4,758.0July 1,563.3 0.0 0.0 1,563.3August 1,761.4 0.0 0.0 1,761.4September 1,278.9 0.0 75.5 1,354.4
3Q 4,603.6 0.0 75.5 4,679.1October 906.0 0.0 0.0 906.0November 2,280.6 0.0 0.0 2,280.6
Source: Commercial Mortgage Alert

Updated May 20, 2011
Monthly Quarterly Monthly Quarterly Monthly Quarterly Monthly QuarterlyUnited States Europe Other Total
A2 - AppendixCMBS Issuance - Breakdown by Period
($ millions)
December 691.7 401.6 59.5 1,152.84Q 3,878.3 401.6 59.5 4,339.4
Year 15,188.3 2,684.3 135.0 18,007.6
1993 January 1,043.8 0.0 0.0 1,043.8February 343.0 0.0 0.0 343.0March 1,819.0 0.0 315.0 2,134.0
1Q 3,205.9 0.0 315.0 3,520.9April 862.3 0.0 0.0 862.3May 968.0 0.0 32.5 1,000.5June 1,674.0 0.0 0.0 1,674.0
2Q 3,504.3 0.0 32.5 3,536.8July 206.1 0.0 0.0 206.1August 1,385.5 0.0 0.0 1,385.5September 697.6 0.0 0.0 697.6
3Q 2,289.2 0.0 0.0 2,289.2October 1,305.8 83.5 0.0 1,389.3November 1,679.2 0.0 0.0 1,679.2December 4,027.7 0.0 0.0 4,027.7
4Q 7,012.7 83.5 0.0 7,096.2Year 16,012.0 83.5 347.5 16,443.0
1992 January 954.9 0.0 0.0 954.9February 678.3 0.0 0.0 678.3March 1,222.9 0.0 0.0 1,222.9
1Q 2,856.1 0.0 0.0 2,856.1April 1,488.5 0.0 0.0 1,488.5May 798.2 0.0 0.0 798.2June 1,986.4 0.0 0.0 1,986.4
2Q 4,273.0 0.0 0.0 4,273.0July 1,060.9 0.0 0.0 1,060.9August 297.0 0.0 0.0 297.0September 1,832.0 0.0 0.0 1,832.0
3Q 3,189.8 0.0 0.0 3,189.8October 1,451.0 0.0 0.0 1,451.0November 1,254.1 0.0 0.0 1,254.1December 842.4 0.0 0.0 842.4
4Q 3,547.5 0.0 0.0 3,547.5Year 13,866.5 0.0 0.0 13,866.5
1991 January 182.3 564.0 0.0 746.3February 399.5 0.0 0.0 399.5March 120.9 0.0 0.0 120.9
1Q 702.7 564.0 0.0 1,266.7April 97.6 0.0 0.0 97.6May 90.0 0.0 0.0 90.0June 157.6 0.0 0.0 157.6
2Q 345.1 0.0 0.0 345.1July 772.3 0.0 0.0 772.3August 629.9 0.0 0.0 629.9September 586.6 0.0 0.0 586.6
3Q 1,988.8 0.0 0.0 1,988.8October 585.3 0.0 0.0 585.3
Source: Commercial Mortgage Alert

Updated May 20, 2011
Monthly Quarterly Monthly Quarterly Monthly Quarterly Monthly QuarterlyUnited States Europe Other Total
A2 - AppendixCMBS Issuance - Breakdown by Period
($ millions)
November 816.8 0.0 0.0 816.8December 892.0 0.0 0.0 892.0
4Q 2,294.1 0.0 0.0 2,294.1Year 5,330.6 564.0 0.0 5,894.6
1990 January 42.0 0.0 0.0 42.0February 465.0 0.0 0.0 465.0March 522.9 135.0 0.0 657.9
1Q 1,029.9 135.0 0.0 1,164.9April 100.0 0.0 0.0 100.0May 127.1 0.0 0.0 127.1June 38.8 0.0 0.0 38.8
2Q 265.9 0.0 0.0 265.9July 193.0 0.0 160.0 353.0August 0.0 0.0 0.0 0.0September 375.0 0.0 0.0 375.0
3Q 568.0 0.0 160.0 728.0October 0.0 0.0 0.0 0.0November 250.5 0.0 0.0 250.5December 636.3 0.0 1,102.0 1,738.3
4Q 886.8 0.0 1,102.0 1,988.8Year 2,750.6 135.0 1,262.0 4,147.6
Source: Commercial Mortgage Alert

Updated May 20, 2011
Monthly Quarterly Monthly Quarterly Monthly Quarterly Monthly QuarterlyUnited States Europe Other Total
A2 - AppendixCMBS Issuance - Breakdown by Period
($ millions)
© 2010 CRE Finance Council, all rights reserved.Source: Commercial Mortgage Alert

Updated : July 11, 2008
Delinquency StatusYear % Tot $ % Tot $ % $ % Tot $ % Tot $ % Tot $ % Tot $All Property Types # ($ Mns) # ($ Mns) # ($ Mns) # ($ Mns) # ($ Mns) # ($ Mns) # ($ Mns) # ($ Mns)
1996 120 525.2 1 1.1 0.21% - - - - - - - - - 1 1.1 0.21% - - - - - -1997 469 2,589.5 7 13.9 0.54% 1 3.5 0.13% - - - - - - 4 7.8 0.30% 3 6.1 0.23% - - -1998 2,456 12,336.7 148 666.6 5.40% 3 7.1 0.06% 1 2.3 0.02% 12 148.7 1.21% 13 65.7 0.53% 18 129.4 1.05% 58 181.5 1.47%1999 4,971 22,360.6 38 109.6 0.49% 8 18.2 0.08% 1 1.9 0.01% 4 14.7 0.07% 8 22.9 0.10% 11 51.1 0.23% 10 14.8 0.07%2000 3,938 20,639.7 42 206.4 1.00% 9 23.8 0.12% 3 10.9 0.05% 11 32.7 0.16% 8 44.3 0.21% 16 100.1 0.49% 2 9.1 0.04%2001 4,196 26,279.5 46 273.9 1.04% 10 86.3 0.33% 4 46.9 0.18% 10 37.4 0.14% 13 68.6 0.26% 16 107.0 0.41% 2 11.0 0.04%2002 3,898 28,866.1 29 179.9 0.62% 5 15.6 0.05% 1 4.3 0.01% 7 57.7 0.20% 11 50.3 0.17% 10 67.7 0.23% - - -2003 5,287 44,558.8 38 238.7 0.54% 6 22.0 0.05% 2 10.6 0.02% 11 90.6 0.20% 4 19.6 0.04% 10 53.6 0.12% 7 35.2 0.08%2004 6,553 68,741.1 38 250.5 0.36% 12 123.8 0.18% 8 20.4 0.03% 15 131.4 0.19% 4 19.1 0.03% 8 52.3 0.08% 2 14.0 0.02%2005 10,433 132,356.4 53 612.7 0.46% 12 104.9 0.08% 3 31.7 0.02% 16 154.5 0.12% 22 316.7 0.24% 8 107.3 0.08% 2 1.3 0.00%2006 11,754 159,661.2 67 631.0 0.40% 23 233.1 0.15% 14 94.5 0.06% 18 174.4 0.11% 26 302.1 0.19% 9 60.0 0.04% - - -2007 12,509 196,911.0 39 249.8 0.13% 27 257.0 0.13% 11 95.0 0.05% 15 84.4 0.04% 13 70.4 0.04% - - - - - -
Total 66,584 715,825.8 546 3,434.2 0.48% 116 895.3 0.13% 48 318.5 0.04% 119 926.4 0.13% 127 988.9 0.14% 109 734.7 0.10% 83 266.8 0.04%
Delinquency StatusProperty Types % Tot $ % Tot $ % $ % Tot $ % Tot $ % Tot $ % Tot $All Years # ($ Mns) # ($ Mns) # ($ Mns) # ($ Mns) # ($ Mns) # ($ Mns) # ($ Mns) # ($ Mns)
Co-op Housing 1,217 2,857.1 0 0.0 0.00% 0 0.0 0.00% - - - - - - - - - - - - - - -Health Care 214 1,868.7 11 150.1 8.03% 1 1.1 0.06% - - - 1 112.2 6.01% 3 14.7 0.78% - - - 4 14.7 0.79%Industrial 5,044 37,189.7 24 163.8 0.44% 4 28.9 0.08% 1 3.9 0.01% 2 12.9 0.03% 8 105.4 0.28% 3 14.3 0.04% 5 13.7 0.04%Lodging 3,606 55,493.3 20 105.8 0.19% 7 59.6 0.11% 1 2.3 0.00% 6 25.6 0.05% 3 18.4 0.03% 6 47.5 0.09% 3 9.5 0.02%Multifamily 14,659 119,012.6 259 1,666.5 1.40% 52 391.2 0.33% 24 158.4 0.13% 74 623.7 0.52% 54 362.8 0.30% 57 378.5 0.32% 27 73.7 0.06%Mobile Home 2,020 12,909.3 10 43.3 0.34% 4 16.7 0.13% 1 8.4 0.07% 5 22.4 0.17% 2 3.1 0.02% - - - 1 4.7 0.04%Mixed Use 1,999 30,331.0 7 25.3 0.08% 4 6.6 0.02% 2 15.5 0.05% - - - 1 7.3 0.02% - - - 2 1.3 0.00%Office 11,670 214,655.1 90 486.2 0.23% 16 170.7 0.08% 10 88.2 0.04% 15 74.5 0.03% 22 116.9 0.05% 18 123.2 0.06% 15 50.8 0.02%Other 719 7,301.3 5 45.9 0.63% 0 0.0 0.00% - - - - - - 1 1.0 0.01% 3 44.6 0.61% 1 0.2 0.00%Retail 22,533 220,151.9 114 734.4 0.33% 25 213.4 0.10% 8 40.9 0.02% 14 48.9 0.02% 31 354.4 0.16% 21 125.5 0.06% 25 98.4 0.04%Self Storage 2,895 14,041.1 6 12.9 0.09% 3 7.0 0.05% 1 0.9 0.01% 2 6.1 0.04% 2 4.9 0.03% 1 1.0 0.01% - - -Warehouse 8 14.7 0 0.0 0.00% 0 0.0 0.00% - - - - - - - - - - - - - - -
Total 66,584 715,825.8 546 3,434.2 0.48% 116 895.3 0.13% 48 318.5 0.04% 119 926.4 0.13% 127 988.9 0.14% 109 734.7 0.10% 83 266.8 0.04%`
© 2008 CMSA - Commercial Mortgage Securities Association, all rights reserved.Source: Trepp LLC, CMSA. Data by year of securitization. Includes fixed-rate conduit loans only. FCL is loans in foreclosure; REO - real estate owned; Mat. Balloon includes performing and non-performing matured loans.
Total 60+ Total 30+ 60+ 90+ FCL REO Mat. Balloon
90+ FCL REO Mat. BalloonTotal 60+ Total 30+ 60+
A3 - AppendixCMBS Delinquencies by Year of Securitization - June 2008($ millions)

Updated : July 11, 2008A3 - AppendixCMBS Delinquencies by Year of Securitization - June 2008($ millions)
Year Delinquency StatusProperty Type % Tot $ % Tot $ % $ % Tot $ % Tot $ % Tot $ % Tot $
# ($ Mns) # ($ Mns) # ($ Mns) # ($ Mns) # ($ Mns) # ($ Mns) # ($ Mns) # ($ Mns)2007
Co-op Housing 50 194.0 0 0.0 0.00% - - - - - - - - - - - - - - - - - -Health Care 19 553.8 0 0.0 0.00% - - - - - - - - - - - - - - - - - -Industrial 976 11,453.4 1 5.4 0.05% - - - - - - - - - 1 5.4 0.05% - - - - - -Lodging 923 19,787.9 5 29.9 0.15% - - - - - - 3 17.2 0.09% 2 12.7 0.06% - - - - - -Multifamily 2,243 33,422.6 15 108.6 0.33% 12 136.1 0.41% 4 43.9 0.13% 7 37.6 0.11% 4 27.1 0.08% - - - - - -Mobile Home 308 2,960.0 0 0.0 0.00% 1 6.9 0.23% - - - - - - - - - - - - - - -Mixed Use 629 12,056.5 1 9.5 0.08% 1 1.2 0.01% 1 9.5 0.08% - - - - - - - - - - - -Office 2,325 62,246.0 4 24.5 0.04% 3 34.0 0.05% 2 13.0 0.02% 2 11.5 0.02% - - - - - - - - -Other 115 2,080.5 0 0.0 0.00% - - - - - - - - - - - - - - - - - -Retail 4,409 49,319.8 13 71.8 0.15% 9 76.7 0.16% 4 28.6 0.06% 3 18.0 0.04% 6 25.3 0.05% - - - - - -Self Storage 510 2,829.6 0 0.0 0.00% 1 2.0 0.07% - - - - - - - - - - - - - - -Warehouse 2 6.9 0 0.0 0.00% - - - - - - - - - - - - - - - - - -
Total 12,509 196,911.0 39 249.8 0.13% 27 257.0 0.13% 11 95.0 0.05% 15 84.4 0.04% 13 70.4 0.04% - - - - - -
2006Co-op Housing 186 475.4 0 0.0 0.00% - - - - - - - - - - - - - - - - - -Health Care 6 292.2 0 0.0 0.00% - - - - - - - - - - - - - - - - - -Industrial 800 7,913.4 3 68.8 0.87% - - - - - - - - - 3 68.8 0.87% - - - - - -Lodging 981 16,202.1 0 0.0 0.00% 2 35.1 0.22% - - - - - - - - - - - - - - -Multifamily 2,205 23,856.7 41 380.4 1.59% 9 62.6 0.26% 7 57.4 0.24% 15 163.1 0.68% 11 103.8 0.44% 8 56.0 0.23% - - -Mobile Home 284 1,939.3 0 0.0 0.00% - - - - - - - - - - - - - - - - - -Mixed Use 389 7,238.6 1 6.0 0.08% - - - 1 6.0 0.08% - - - - - - - - - - - -Office 2,090 48,844.0 9 44.8 0.09% 5 64.3 0.13% 4 23.3 0.05% - - - 5 21.5 0.04% - - - - - -Other 73 1,203.4 0 0.0 0.00% - - - - - - - - - - - - - - - - - -Retail 4,136 48,714.2 13 131.1 0.27% 7 71.0 0.15% 2 7.8 0.02% 3 11.3 0.02% 7 108.1 0.22% 1 4.0 0.01% - - -Self Storage 602 2,978.3 0 0.0 0.00% - - - - - - - - - - - - - - - - - -Warehouse 2 3.7 0 0.0 0.00% - - - - - - - - - - - - - - - - - -
Total 11,754 159,661.2 67 631.0 0.40% 23 233.1 0.15% 14 94.5 0.06% 18 174.4 0.11% 26 302.1 0.19% 9 60.0 0.04% - - -
2005Co-op Housing 245 652.8 0 0.0 0.00% - - - - - - - - - - - - - - - - - -Health Care 7 40.7 0 0.0 0.00% - - - - - - - - - - - - - - - - - -Industrial 599 4,562.6 1 11.8 0.26% - - - - - - - - - 1 11.8 0.26% - - - - - -Lodging 528 9,853.7 0 0.0 0.00% 1 3.9 0.04% - - - - - - - - - - - - - - -Multifamily 2,161 20,045.5 26 316.4 1.58% 5 58.0 0.29% 1 18.8 0.09% 10 124.8 0.62% 11 103.2 0.51% 4 69.5 0.35% - - -Mobile Home 241 1,771.4 0 0.0 0.00% - - - - - - - - - - - - - - - - - -Mixed Use 282 4,884.6 5 9.8 0.20% - - - - - - - - - 1 7.3 0.15% - - - 2 1.3 0.03%Office 1,931 42,920.9 7 50.3 0.12% 2 8.5 0.02% 1 10.1 0.02% 3 18.8 0.04% 3 21.4 0.05% - - - - - -Other 55 1,576.0 1 24.9 1.58% - - - - - - - - - - - - 1 24.9 1.58% - - -Retail 3,740 42,017.5 11 193.5 0.46% 3 31.3 0.07% 1 2.7 0.01% 2 8.2 0.02% 5 169.8 0.40% 3 12.8 0.03% - - -Self Storage 644 4,030.7 2 6.0 0.15% 1 3.3 0.08% - - - 1 2.7 0.07% 1 3.3 0.08% - - - - - -Warehouse 0 0.0 0 0.0 0.00% - - - - - - - - - - - - - - - - - -
Total 10,433 132,356.4 53 612.7 0.46% 12 104.9 0.08% 3 31.7 0.02% 16 154.5 0.12% 22 316.7 0.24% 8 107.3 0.08% 2 1.3 0.00%
© 2008 CMSA - Commercial Mortgage Securities Association, all rights reserved.
Total 30+ 60+ Mat. Balloon90+ FCL REO60+ Total
Source: Trepp LLC, CMSA. Data by year of securitization. Includes fixed-rate conduit loans only. FCL is loans in foreclosure; REO - real estate owned; Mat. Balloon includes performing and non-performing matured loans.

Updated : July 11, 2008A3 - AppendixCMBS Delinquencies by Year of Securitization - June 2008($ millions)
Year Delinquency StatusProperty Type % Tot $ % Tot $ % $ % Tot $ % Tot $ % Tot $ % Tot $
# ($ Mns) # ($ Mns) # ($ Mns) # ($ Mns) # ($ Mns) # ($ Mns) # ($ Mns) # ($ Mns)2004
Co-op Housing 210 473.1 0 0.0 0.00% - - - - - - - - - - - - - - - - - -Health Care 0 0.0 0 0.0 0.00% - - - - - - - - - - - - - - - - - -Industrial 393 2,785.6 2 9.5 0.34% 2 23.8 0.85% 1 3.9 0.14% 1 5.7 0.20% - - - - - - - - -Lodging 141 2,077.6 0 0.0 0.00% - - - - - - - - - - - - - - - - - -Multifamily 1,430 10,473.2 27 191.0 1.82% 6 65.6 0.63% 7 16.6 0.16% 11 116.7 1.11% 1 5.4 0.05% 8 52.3 0.50% - - -Mobile Home 343 2,919.3 2 7.0 0.24% 1 5.5 0.19% - - - 2 7.0 0.24% - - - - - - - - -Mixed Use 158 1,792.4 0 0.0 0.00% - - - - - - - - - - - - - - - - - -Office 1,145 21,740.9 1 5.0 0.02% 2 27.2 0.13% - - - - - - 1 5.0 0.02% - - - - - -Other 34 383.3 0 0.0 0.00% - - - - - - - - - - - - - - - - - -Retail 2,363 24,311.5 6 37.9 0.16% - - - - - - 1 2.0 0.01% 2 8.7 0.04% - - - 2 14.0 0.06%Self Storage 336 1,784.1 0 0.0 0.00% 1 1.7 0.09% - - - - - - - - - - - - - - -Warehouse 0 0.0 0 0.0 0.00% - - - - - - - - - - - - - - - - - -
Total 6,553 68,741.1 38 250.5 0.36% 12 123.8 0.18% 8 20.4 0.03% 15 131.4 0.19% 4 19.1 0.03% 8 52.3 0.08% 2 14.0 0.02%
2003Co-op Housing 237 524.6 0 0.0 0.00% - - - - - - - - - - - - - - - - - -Health Care 0 0.0 0 0.0 0.00% - - - - - - - - - - - - - - - - - -Industrial 399 2,189.6 2 11.5 0.52% 1 4.2 0.19% - - - - - - - - - - - - 1 5.7 0.26%Lodging 84 1,043.2 0 0.0 0.00% 1 9.0 0.86% - - - - - - - - - - - - - - -Multifamily 1,259 7,335.9 29 200.4 2.73% 2 4.2 0.06% 1 2.4 0.03% 9 83.9 1.14% 3 15.7 0.21% 9 49.9 0.68% 4 25.1 0.34%Mobile Home 201 1,188.3 0 0.0 0.00% - - - - - - - - - - - - - - - - - -Mixed Use 130 1,588.3 0 0.0 0.00% - - - - - - - - - - - - - - - - - -Office 886 12,291.4 4 17.0 0.14% - - - 1 8.2 0.07% 1 3.3 0.03% 1 3.9 0.03% - - - 1 1.7 0.01%Other 24 286.3 0 0.0 0.00% - - - - - - - - - - - - - - - - - -Retail 1,883 17,490.1 2 6.4 0.04% 2 4.8 0.03% - - - - - - - - - 1 3.7 0.02% 1 2.7 0.02%Self Storage 184 621.1 1 3.5 0.56% - - - - - - 1 3.5 0.56% - - - - - - - - -Warehouse 0 0.0 0 0.0 0.00% - - - - - - - - - - - - - - - - - -
Total 5,287 44,558.8 38 238.7 0.54% 6 22.0 0.05% 2 10.6 0.02% 11 90.6 0.20% 4 19.6 0.04% 10 53.6 0.12% 7 35.2 0.08%
2002Co-op Housing 132 241.3 0 0.0 0.00% - - - - - - - - - - - - - - - - - -Health Care 2 16.5 0 0.0 0.00% - - - - - - - - - - - - - - - - - -Industrial 388 2,259.1 0 0.0 0.00% - - - - - - - - - - - - - - - - - -Lodging 52 505.0 0 0.0 0.00% 1 3.0 0.60% - - - - - - - - - - - - - - -Multifamily 1,034 5,964.2 20 141.4 2.37% 3 9.2 0.15% 1 4.3 0.07% 4 44.3 0.74% 8 40.3 0.67% 7 52.5 0.88% - - -Mobile Home 130 521.1 1 5.0 0.95% - - - - - - 1 5.0 0.95% - - - - - - - - -Mixed Use 72 517.1 0 0.0 0.00% - - - - - - - - - - - - - - - - - -Office 677 6,985.7 4 20.8 0.30% - - - - - - 1 5.7 0.08% 2 6.1 0.09% 1 9.0 0.13% - - -Other 16 118.9 0 0.0 0.00% - - - - - - - - - - - - - - - - - -Retail 1,260 11,078.3 4 12.8 0.12% 1 3.4 0.03% - - - 1 2.6 0.02% 1 4.0 0.04% 2 6.2 0.06% - - -Self Storage 135 659.1 0 0.0 0.00% - - - - - - - - - - - - - - - - - -Warehouse 0 0.0 0 0.0 0.00% - - - - - - - - - - - - - - - - - -
Total 3,898 28,866.1 29 179.9 0.62% 5 15.6 0.05% 1 4.3 0.01% 7 57.7 0.20% 11 50.3 0.17% 10 67.7 0.23% - - -
© 2008 CMSA - Commercial Mortgage Securities Association, all rights reserved.
Total 60+ Total 30+ 60+ 90+ FCL REO Mat. Balloon
Source: Trepp LLC, CMSA. Data by year of securitization. Includes fixed-rate conduit loans only. FCL is loans in foreclosure; REO - real estate owned; Mat. Balloon includes performing and non-performing matured loans.

Updated : July 11, 2008A3 - AppendixCMBS Delinquencies by Year of Securitization - June 2008($ millions)
Year Delinquency StatusProperty Type % Tot $ % Tot $ % $ % Tot $ % Tot $ % Tot $ % Tot $
# ($ Mns) # ($ Mns) # ($ Mns) # ($ Mns) # ($ Mns) # ($ Mns) # ($ Mns) # ($ Mns)2001
Co-op Housing 60 139.2 0 0.0 0.00% - - - - - - - - - - - - - - - - - -Health Care 6 25.8 0 0.0 0.00% - - - - - - - - - - - - - - - - - -Industrial 441 2,154.1 1 4.3 0.20% - - - - - - - - - 1 4.3 0.20% - - - - - -Lodging 112 1,171.0 1 10.0 0.85% - - - - - - - - - - - - 1 10.0 0.85% - - -Multifamily 1,148 5,434.7 23 107.7 1.98% 6 37.4 0.69% 2 13.3 0.25% 7 21.0 0.39% 6 31.1 0.57% 8 42.2 0.78% - - -Mobile Home 122 475.5 1 2.0 0.42% 1 1.7 0.35% - - - - - - 1 2.0 0.42% - - - - - -Mixed Use 90 737.4 0 0.0 0.00% - - - - - - - - - - - - - - - - - -Office 822 7,410.0 14 127.3 1.72% 2 25.0 0.34% 2 33.5 0.45% 2 15.5 0.21% 4 28.8 0.39% 5 41.5 0.56% 1 7.9 0.11%Other 17 57.1 0 0.0 0.00% - - - - - - - - - - - - - - - - - -Retail 1,247 8,244.6 6 22.6 0.27% 1 22.3 0.27% - - - 1 0.9 0.01% 1 2.4 0.03% 2 13.3 0.16% 1 3.0 0.04%Self Storage 131 429.9 0 0.0 0.00% - - - - - - - - - - - - - - - - - -Warehouse 0 0.0 0 0.0 0.00% - - - - - - - - - - - - - - - - - -
Total 4,196 26,279.5 46 273.9 1.04% 10 86.3 0.33% 4 46.9 0.18% 10 37.4 0.14% 13 68.6 0.26% 16 107.0 0.41% 2 11.0 0.04%
2000Co-op Housing 89 98.9 0 0.0 0.00% - - - - - - - - - - - - - - - - - -Health Care 31 154.0 2 5.3 3.43% - - - - - - - - - - - - - - - 1 2.6 1.72%Industrial 420 1,755.2 2 17.4 0.99% - - - - - - - - - 1 11.1 0.63% 1 6.3 0.36% - - -Lodging 174 1,336.9 1 0.6 0.05% 1 4.4 0.33% - - - 1 0.6 0.05% - - - - - - - - -Multifamily 968 4,290.3 17 71.7 1.67% 4 8.3 0.19% 1 1.6 0.04% 6 19.3 0.45% 2 8.7 0.20% 6 29.1 0.68% 1 6.5 0.15%Mobile Home 149 518.1 1 8.4 1.63% 1 2.6 0.50% 1 8.4 1.63% - - - - - - - - - - - -Mixed Use 70 408.8 0 0.0 0.00% 2 5.0 1.23% - - - - - - - - - - - - - - -Office 747 5,404.7 10 56.1 1.04% 1 3.5 0.06% - - - 3 12.1 0.22% 2 12.2 0.23% 5 31.8 0.59% - - -Other 36 92.5 0 0.0 0.00% - - - - - - - - - - - - - - - - - -Retail 1,113 6,221.8 8 45.9 0.74% - - - - - - 1 0.7 0.01% 3 12.3 0.20% 4 32.9 0.53% - - -Self Storage 140 357.0 1 0.9 0.24% - - - 1 0.9 0.24% - - - - - - - - - - - -Warehouse 1 1.4 0 0.0 0.00% - - - - - - - - - - - - - - - - - -
Total 3,938 20,639.7 42 206.4 1.00% 9 23.8 0.12% 3 10.9 0.05% 11 32.7 0.16% 8 44.3 0.21% 16 100.1 0.49% 2 9.1 0.04%
1999Co-op Housing 6 29.9 0 0.0 0.00% - - - - - - - - - - - - - - - - - -Health Care 68 327.0 1 6.2 1.88% 1 1.1 0.35% - - - - - - - - - - - - 1 6.2 1.88%Industrial 439 1,377.2 2 6.3 0.46% 1 0.9 0.07% - - - - - - 1 4.1 0.30% 1 2.2 0.16% - - -Lodging 300 1,680.9 0 0.0 0.00% - - - - - - - - - - - - - - - - - -Multifamily 1,508 5,692.2 20 37.4 0.66% 4 7.5 0.13% - - - 3 10.4 0.18% 3 4.4 0.08% 5 13.3 0.23% 6 5.9 0.10%Mobile Home 155 407.9 1 4.3 1.04% - - - - - - 1 4.3 1.04% - - - - - - - - -Mixed Use 137 594.2 0 0.0 0.00% 1 0.3 0.05% - - - - - - - - - - - - - - -Office 754 4,600.7 5 37.7 0.82% 1 8.2 0.18% - - - - - - 2 10.8 0.23% 3 26.9 0.58% - - -Other 79 436.2 1 0.2 0.05% - - - - - - - - - - - - - - - 1 0.2 0.05%Retail 1,372 6,949.1 7 16.6 0.24% - - - 1 1.9 0.03% - - - 2 3.6 0.05% 1 7.8 0.11% 2 2.6 0.04%Self Storage 153 265.2 1 1.0 0.39% - - - - - - - - - - - - 1 1.0 0.39% - - -Warehouse 0 0.0 0 0.0 0.00% - - - - - - - - - - - - - - - - - -
Total 4,971 22,360.6 38 109.6 0.49% 8 18.2 0.08% 1 1.9 0.01% 4 14.7 0.07% 8 22.9 0.10% 11 51.1 0.23% 10 14.8 0.07%
© 2008 CMSA - Commercial Mortgage Securities Association, all rights reserved.
REO Mat. Balloon
Source: Trepp LLC, CMSA. Data by year of securitization. Includes fixed-rate conduit loans only. FCL is loans in foreclosure; REO - real estate owned; Mat. Balloon includes performing and non-performing matured loans.
Total 60+ Total 30+ 60+ 90+ FCL

Updated : July 11, 2008A3 - AppendixCMBS Delinquencies by Year of Securitization - June 2008($ millions)
Year Delinquency StatusProperty Type % Tot $ % Tot $ % $ % Tot $ % Tot $ % Tot $ % Tot $
# ($ Mns) # ($ Mns) # ($ Mns) # ($ Mns) # ($ Mns) # ($ Mns) # ($ Mns) # ($ Mns)1998
Co-op Housing 0 0.0 0 0.0 0.00% - - - - - - - - - - - - - - - - - -Health Care 53 366.9 8 138.7 37.80% - - - - - - 1 112.2 30.59% 3 14.7 4.00% - - - 2 5.9 1.60%Industrial 163 620.6 10 28.9 4.65% - - - - - - 1 7.3 1.17% - - - 1 5.7 0.92% 4 7.9 1.28%Lodging 206 1,202.2 12 64.1 5.33% 1 4.2 0.35% 1 2.3 0.19% 2 7.8 0.65% 1 5.7 0.48% 4 36.5 3.03% 3 9.5 0.79%Multifamily 596 2,108.8 39 106.8 5.07% 1 2.3 0.11% - - - 2 2.5 0.12% 3 18.3 0.87% 2 13.6 0.64% 16 36.2 1.72%Mobile Home 59 141.3 3 15.5 11.00% - - - - - - 1 6.2 4.41% - - - - - - 1 4.7 3.30%Mixed Use 36 479.7 0 0.0 0.00% - - - - - - - - - - - - - - - - - -Office 258 1,776.5 31 99.6 5.61% - - - - - - 3 7.6 0.43% 2 7.2 0.41% 3 10.9 0.62% 13 41.2 2.32%Other 215 889.5 2 19.7 2.22% - - - - - - - - - - - - 2 19.7 2.22% - - -Retail 820 4,668.3 42 191.8 4.11% 1 0.5 0.01% - - - 2 5.2 0.11% 3 18.3 0.39% 6 42.9 0.92% 19 76.0 1.63%Self Storage 48 80.7 1 1.5 1.91% - - - - - - - - - 1 1.5 1.91% - - - - - -Warehouse 2 2.2 0 0.0 0.00% - - - - - - - - - - - - - - - - - -
Total 2,456 12,336.7 148 666.6 5.40% 3 7.1 0.06% 1 2.3 0.02% 12 148.7 1.21% 13 65.7 0.53% 18 129.4 1.05% 58 181.5 1.47%
1997Co-op Housing 2 27.7 0 0.0 0.00% - - - - - - - - - - - - - - - - - -Health Care 20 78.1 0 0.0 0.00% - - - - - - - - - - - - - - - - - -Industrial 24 118.0 0 0.0 0.00% - - - - - - - - - - - - - - - - - -Lodging 59 412.6 1 1.1 0.26% - - - - - - - - - - - - 1 1.1 0.26% - - -Multifamily 71 291.9 2 4.8 1.65% - - - - - - - - - 2 4.8 1.65% - - - - - -Mobile Home 13 16.9 0 0.0 0.00% - - - - - - - - - - - - - - - - - -Mixed Use 6 33.4 0 0.0 0.00% - - - - - - - - - - - - - - - - - -Office 29 373.6 1 3.1 0.82% - - - - - - - - - - - - 1 3.1 0.82% - - -Other 55 177.6 1 1.0 0.56% - - - - - - - - - 1 1.0 0.56% - - - - - -Retail 177 1,053.8 2 4.0 0.38% 1 3.5 0.33% - - - - - - 1 2.0 0.19% 1 1.9 0.18% - - -Self Storage 12 5.4 0 0.0 0.00% - - - - - - - - - - - - - - - - - -Warehouse 1 0.5 0 0.0 0.00% - - - - - - - - - - - - - - - - - -
Total 469 2,589.5 7 13.9 0.54% 1 3.5 0.13% - - - - - - 4 7.8 0.30% 3 6.1 0.23% - - -
1996Co-op Housing 0 0.0 0 0.0 0.00% - - - - - - - - - - - - - - - - - -Health Care 2 13.8 0 0.0 0.00% - - - - - - - - - - - - - - - - - -Industrial 2 0.9 0 0.0 0.00% - - - - - - - - - - - - - - - - - -Lodging 46 220.2 0 0.0 0.00% - - - - - - - - - - - - - - - - - -Multifamily 36 96.7 0 0.0 0.00% - - - - - - - - - - - - - - - - - -Mobile Home 15 50.1 1 1.1 2.15% - - - - - - - - - 1 1.1 2.15% - - - - - -Mixed Use 0 0.0 0 0.0 0.00% - - - - - - - - - - - - - - - - - -Office 6 60.8 0 0.0 0.00% - - - - - - - - - - - - - - - - - -Other 0 0.0 0 0.0 0.00% - - - - - - - - - - - - - - - - - -Retail 13 82.8 0 0.0 0.00% - - - - - - - - - - - - - - - - - -Self Storage 0 0.0 0 0.0 0.00% - - - - - - - - - - - - - - - - - -Warehouse 0 0.0 0 0.0 0.00% - - - - - - - - - - - - - - - - - -
Total 120 525.2 1 1.1 0.21% - - - - - - - - - 1 1.1 0.21% - - - - - -
© 2008 CMSA - Commercial Mortgage Securities Association, all rights reserved.
Mat. BalloonTotal 60+ Total 30+ 60+ 90+ FCL REO
Source: Trepp LLC, CMSA. Data by year of securitization. Includes fixed-rate conduit loans only. FCL is loans in foreclosure; REO - real estate owned; Mat. Balloon includes performing and non-performing matured loans.

Updated April 17, 2009
CMBX.1 Spreads
A4-AppendixCMBX Spreads Weekly - Friday Close
45004500
A4-AppendixCMBX Spreads Weekly - Friday Close
2250
3000
3750
4500
2250
3000
3750
4500
1.AAA
1.AJ
1.AA
1.A
1.BBB
1.BBB-
A4-AppendixCMBX Spreads Weekly - Friday Close
0
750
1500
2250
3000
3750
4500
0
750
1500
2250
3000
3750
4500
1.AAA
1.AJ
1.AA
1.A
1.BBB
1.BBB-
CMBX.2 Spreads
A4-AppendixCMBX Spreads Weekly - Friday Close
0
750
1500
2250
3000
3750
4500
0
750
1500
2250
3000
3750
4500
1.AAA
1.AJ
1.AA
1.A
1.BBB
1.BBB-
80008000
A4-AppendixCMBX Spreads Weekly - Friday Close
0
750
1500
2250
3000
3750
4500
0
750
1500
2250
3000
3750
4500
1.AAA
1.AJ
1.AA
1.A
1.BBB
1.BBB-
5000
6000
7000
8000
5000
6000
7000
8000
2.AAA
2.AJ
2.AA
2.A
2.BBB
2.BBB-
A4-AppendixCMBX Spreads Weekly - Friday Close
0
750
1500
2250
3000
3750
4500
0
750
1500
2250
3000
3750
4500
1.AAA
1.AJ
1.AA
1.A
1.BBB
1.BBB-
1000
2000
3000
4000
5000
6000
7000
8000
1000
2000
3000
4000
5000
6000
7000
8000
2.AAA
2.AJ
2.AA
2.A
2.BBB
2.BBB-
2.BB
S M kit CDS I d C AJ t h dd d J 4 2008
A4-AppendixCMBX Spreads Weekly - Friday Close
0
750
1500
2250
3000
3750
4500
0
750
1500
2250
3000
3750
4500
1.AAA
1.AJ
1.AA
1.A
1.BBB
1.BBB-
0
1000
2000
3000
4000
5000
6000
7000
8000
0
1000
2000
3000
4000
5000
6000
7000
8000
10/2
7/06
11/2
4/06
12/2
2/06
1/19
/07
2/16
/07
3/16
/07
4/13
/07
5/11
/07
6/8/
07
7/6/
07
8/3/
07
8/31
/07
9/28
/07
10/2
6/07
11/2
3/07
12/2
1/07
1/18
/08
2/15
/08
3/14
/08
4/11
/08
5/9/
08
6/6/
08
7/3/
08
8/1/
08
8/29
/08
9/26
/08
12/5
/08
1/9/
09
2/9/
09
3/13
/09
2.AAA
2.AJ
2.AA
2.A
2.BBB
2.BBB-
2.BB
Source: Markit, CDS IndexCo. AJ tranche added on January 4, 2008.© 2010 CRE Finance Council, all rights reserved.
A4-AppendixCMBX Spreads Weekly - Friday Close
0
750
1500
2250
3000
3750
4500
0
750
1500
2250
3000
3750
4500
1.AAA
1.AJ
1.AA
1.A
1.BBB
1.BBB-
0
1000
2000
3000
4000
5000
6000
7000
8000
0
1000
2000
3000
4000
5000
6000
7000
8000
10/2
7/06
11/2
4/06
12/2
2/06
1/19
/07
2/16
/07
3/16
/07
4/13
/07
5/11
/07
6/8/
07
7/6/
07
8/3/
07
8/31
/07
9/28
/07
10/2
6/07
11/2
3/07
12/2
1/07
1/18
/08
2/15
/08
3/14
/08
4/11
/08
5/9/
08
6/6/
08
7/3/
08
8/1/
08
8/29
/08
9/26
/08
12/5
/08
1/9/
09
2/9/
09
3/13
/09
2.AAA
2.AJ
2.AA
2.A
2.BBB
2.BBB-
2.BB

Updated April 17, 2009
CMBX.3 Spreads
A4-AppendixCMBX Spreads Weekly - Friday Close
8000
9000
8000
9000
3.AAA
A4-AppendixCMBX Spreads Weekly - Friday Close
0
1000
2000
3000
4000
5000
6000
7000
8000
9000
0
1000
2000
3000
4000
5000
6000
7000
8000
9000
3.AAA
3.AJ
3.AA
3.A
3.BBB
3.BBB-
3.BB
CMBX.4 Spreads
A4-AppendixCMBX Spreads Weekly - Friday Close
0
1000
2000
3000
4000
5000
6000
7000
8000
9000
0
1000
2000
3000
4000
5000
6000
7000
8000
9000
3.AAA
3.AJ
3.AA
3.A
3.BBB
3.BBB-
3.BB
90009000
A4-AppendixCMBX Spreads Weekly - Friday Close
0
1000
2000
3000
4000
5000
6000
7000
8000
9000
0
1000
2000
3000
4000
5000
6000
7000
8000
9000
3.AAA
3.AJ
3.AA
3.A
3.BBB
3.BBB-
3.BB
2000
3000
4000
5000
6000
7000
8000
9000
2000
3000
4000
5000
6000
7000
8000
90004.AAA 4.AJ 4.AA
4.A 4.BBB 4.BBB-
4.BB
CMBX.5 Spreads
A4-AppendixCMBX Spreads Weekly - Friday Close
0
1000
2000
3000
4000
5000
6000
7000
8000
9000
0
1000
2000
3000
4000
5000
6000
7000
8000
9000
3.AAA
3.AJ
3.AA
3.A
3.BBB
3.BBB-
3.BB
0
1000
2000
3000
4000
5000
6000
7000
8000
9000
0
1000
2000
3000
4000
5000
6000
7000
8000
90004.AAA 4.AJ 4.AA
4.A 4.BBB 4.BBB-
4.BB
3000
4000
5000
6000
7000
8000
9000
3000
4000
5000
6000
7000
8000
9000 5.AAA 5.AJ 5.AA
5.A 5.BBB 5.BBB-
5.BB
S M kit CDS I d C AJ t h dd d J 4 2008
A4-AppendixCMBX Spreads Weekly - Friday Close
0
1000
2000
3000
4000
5000
6000
7000
8000
9000
0
1000
2000
3000
4000
5000
6000
7000
8000
9000
3.AAA
3.AJ
3.AA
3.A
3.BBB
3.BBB-
3.BB
0
1000
2000
3000
4000
5000
6000
7000
8000
9000
0
1000
2000
3000
4000
5000
6000
7000
8000
90004.AAA 4.AJ 4.AA
4.A 4.BBB 4.BBB-
4.BB
0
1000
2000
3000
4000
5000
6000
7000
8000
9000
0
1000
2000
3000
4000
5000
6000
7000
8000
9000 5.AAA 5.AJ 5.AA
5.A 5.BBB 5.BBB-
5.BB
Source: Markit, CDS IndexCo. AJ tranche added on January 4, 2008.© 2010 CRE Finance Council, all rights reserved.
A4-AppendixCMBX Spreads Weekly - Friday Close
0
1000
2000
3000
4000
5000
6000
7000
8000
9000
0
1000
2000
3000
4000
5000
6000
7000
8000
9000
3.AAA
3.AJ
3.AA
3.A
3.BBB
3.BBB-
3.BB
0
1000
2000
3000
4000
5000
6000
7000
8000
9000
0
1000
2000
3000
4000
5000
6000
7000
8000
90004.AAA 4.AJ 4.AA
4.A 4.BBB 4.BBB-
4.BB
0
1000
2000
3000
4000
5000
6000
7000
8000
9000
0
1000
2000
3000
4000
5000
6000
7000
8000
9000 5.AAA 5.AJ 5.AA
5.A 5.BBB 5.BBB-
5.BB


CRE Finance Council, 30 Broad Street, 28th Floor, New York, New York