comparisons of the peabody picture vocabulary test and …
TRANSCRIPT
Western Kentucky UniversityTopSCHOLAR®
Masters Theses & Specialist Projects Graduate School
11-1977
Comparisons of the Peabody Picture VocabularyTest and The Wechsler Intelligence Scale forChildren-Revised with Late Elementary AgedChildrenDavid Hughes
Follow this and additional works at: http://digitalcommons.wku.edu/theses
Part of the Pre-Elementary, Early Childhood, Kindergarten Teacher Education Commons, andthe Reading and Language Commons
This Thesis is brought to you for free and open access by TopSCHOLAR®. It has been accepted for inclusion in Masters Theses & Specialist Projects byan authorized administrator of TopSCHOLAR®. For more information, please contact [email protected].
Recommended CitationHughes, David, "Comparisons of the Peabody Picture Vocabulary Test and The Wechsler Intelligence Scale for Children-Revised withLate Elementary Aged Children" (1977). Masters Theses & Specialist Projects. Paper 1686.http://digitalcommons.wku.edu/theses/1686
COMPARI SONS OF THE PEABODY PICTURE VOCABULARY TEST
AND THE WECHSLER INTELLIGENCE SCALE FOR CHILDREN-REVISED
WITH LATE ELEMENTARY AGED CHILDREN
A Thesis
Presented to
t he Faculty of the Depa r tment of Psychology
Western Kentucky Universlty
Bowling Gr een, Kentucky
In Partial Fulfillment
of the Requi r ements for the Degree
.. taster of Arts
by
David G. Hugh l:!s
Nuvl:!:nber 1977
A UTHORIZA TION FOR USE OF THESIS
Permission is hereby
[dJ granted to the Western Kentucky University Library to make, or allow to be made photocopies, microfilm 01' other copie s of this the is for appropriate re.earch or scholarly purposes.
O reserved to the author for the making of any copie s of this the ,is except for brief .ections for re.earch or scholarly purpose s .
Date
Please place an " X" in the appropria c box.
This form will be fil d w ith th ori,lnal of the th sis and ill control Cut ... re use oC the thesi s .
COMPARISONS OF THE PEABODY PICTURE VOCABULARY TEST
AND THE WECHSLER INTELLIGENCE SCALE FOR CHILDREN-REVISED
WITH LATE ELEMENTARY AGED CHILDREN
Approved (Date)
r· Dean of the Gradua'te College
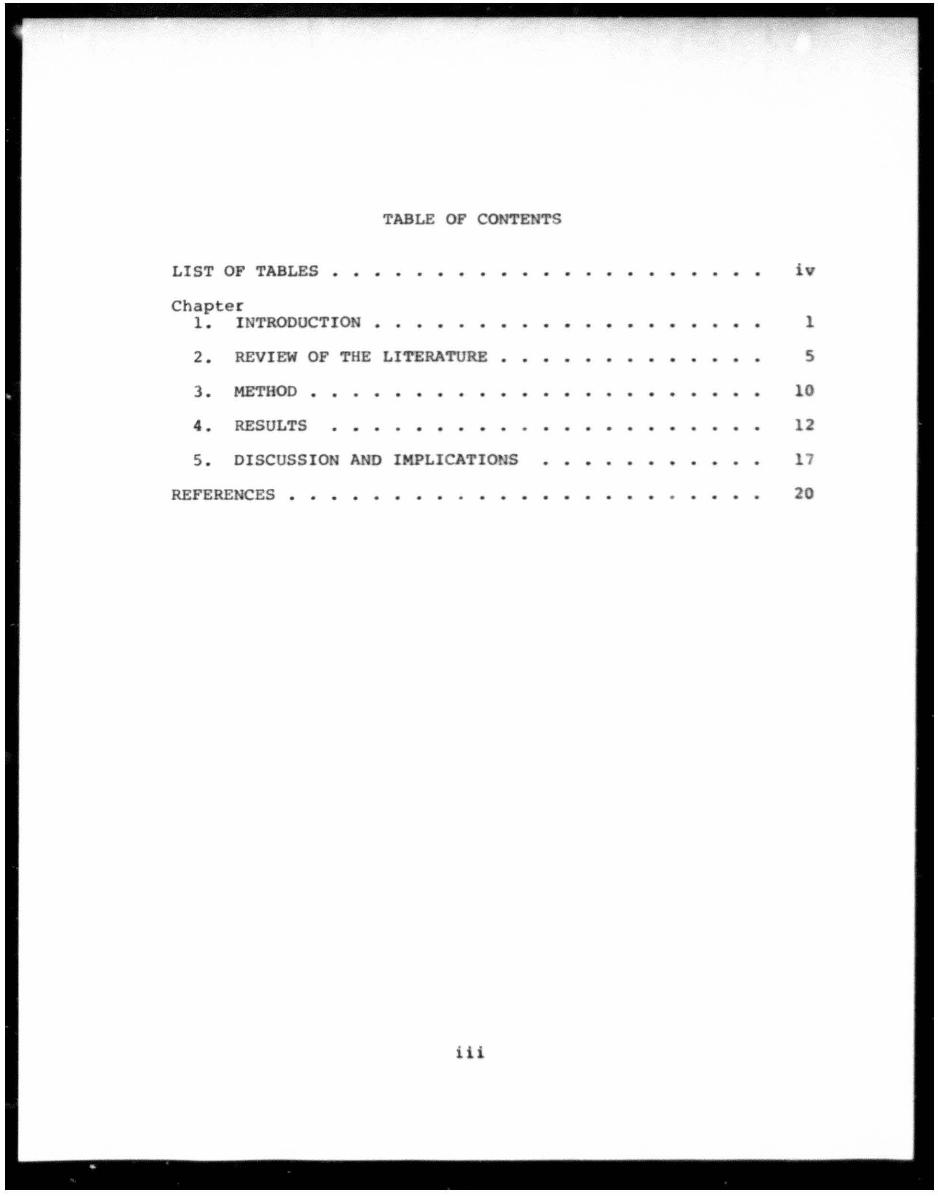
TABLE OF CONTENTS
LIST OF TABLES • • . . . . . . . . . . . . . . . . . . . Chapter
1. I NTRODUCTION . . . . . . . . . . . . . · . . . 2. REVIEW OF THE LITERATURE . . . . . . . . . . . 3. METHOD • . . . . . . . . . . . . . . • • • · . . . 4. RESULTS • • • . . . . . . . . . . . . . . . . 5. DISCUSSION AND IMPLICATIO S . . . . . . . . . .
REFERENCES • • • . . . . . . . . . . . . . · . . .
iii
iv
1
5
10
12
17
20
1.
2.
3.
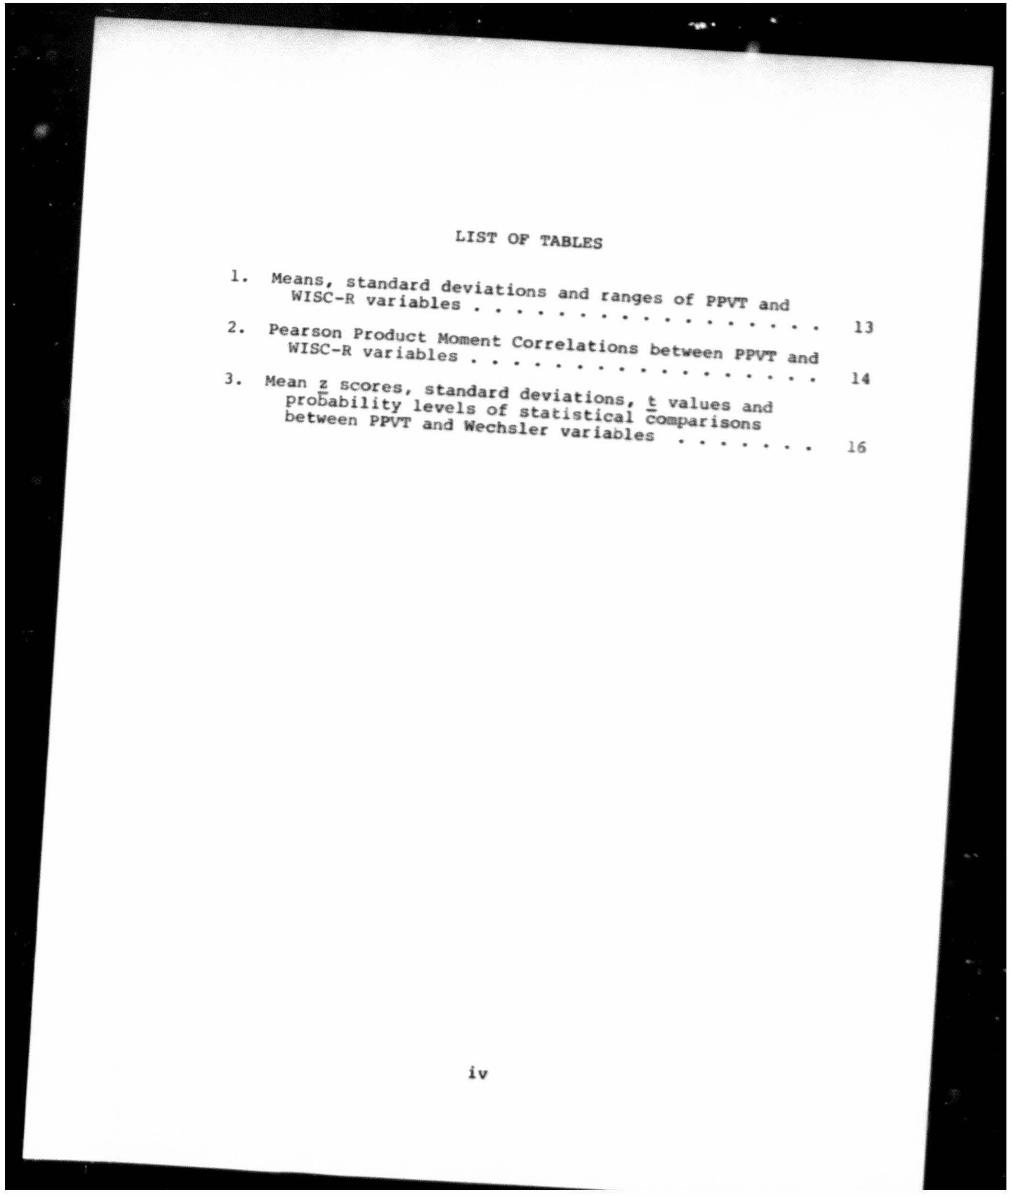
LIST 0 TABLES
d rang s ot PPYT nd Means, stand rd deviations
WISC-R vari ble .••• . . . . . . . .. .. . . .. . Pearson Product nt CorrelatiOna between PPY7 and
WISC-R varl bles • . . .. . . . . . . . .. . . . . . He n Z Score, nd rd de vi tlon , t lu S ad
prob bIlity levels of stat at c 1 c:oa~ri Ons between PPVT nd ~chsl r v rlable . . . .. . .. .
Iv
13
14
6
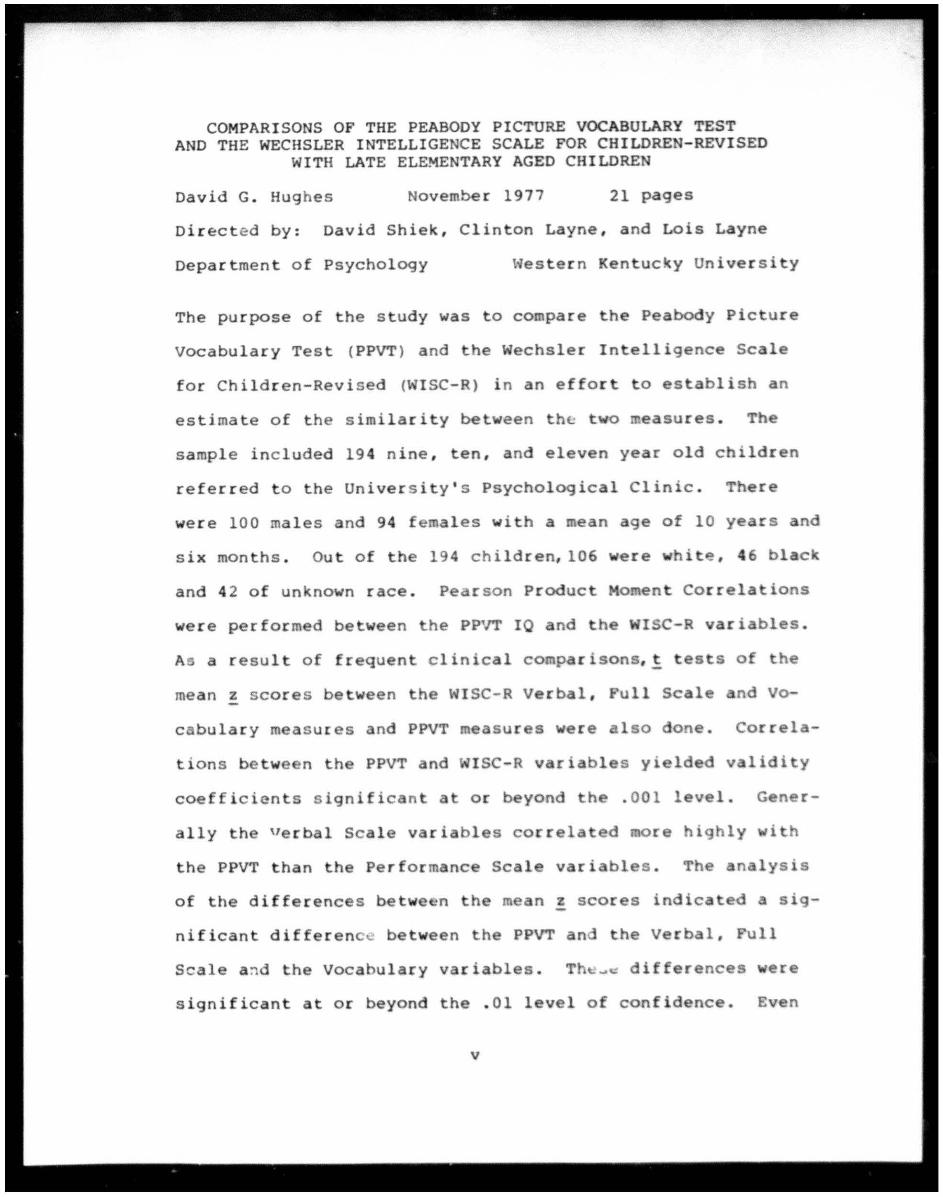
COMPARISONS OF THE PEABODY PICTURE VOCABULARY TEST AND THE WECHSLER INTELLIGENCE SCALE FOR CHILDREN-REVISED
WITH LATE ELEMENTARY AGED CHILDREN
David G. Hughes November 1977 21 pages
Directed by: David Shiek, Clinton Layne, and Lois Layne
Department of Psychology Wes ter n Kentucky Univer si ty
The purpose of the study was to compare the Peabody Picture
Vocabulary Test (PPVT) and the Wechsler Intelligence Scale
for Children-Revised (WISC-R) in an effort to establish an
estimate of the similarity between the two measures . The
sample inc luded 194 nine , ten, and eleven year old children
referred to the University's Psychological Clinic . There
were 100 males and 94 females with a mean age of 10 years and
six months . Out of the 194 children, 106 were white, 46 black
and 42 of unknown race. Pearson Product Mo ent Correlat ions
were performed between he PPVT 10 and t he WISC-R variables.
As a r esult of frequent clinical compa r isons,! t ests of the
mean z score s between the WISC-R Verbal, Full Scale nd Va-
cabulary measures and PPVT measur s were lso done. Correla-
tions be twe n the PPVT and I SC-R variables yielded v lldity
coefficients significan t at or beyond the . 001 level. Gener
ally the "erbal Scale variables correlated more highly with
the PPVT than the Performance Scale variable s . The nalysis
of the differenc s b twe n the mean z scores indic ted a sig-
nificant differenc~ between the PPVT n the Verb 1, Full
Scale a~d the Vocabulary variables. Th ~~ differences were
significant t or beyond the . 01 level of confidence. Even
v
though a significant diffetence was btained between the ean
s cores, for practical use a direct interpretation uld ap
pear possible between the two tests in that the ean scores
were within two 10 points of each other.
vi
CHAPTER 1
INTRODUCTION
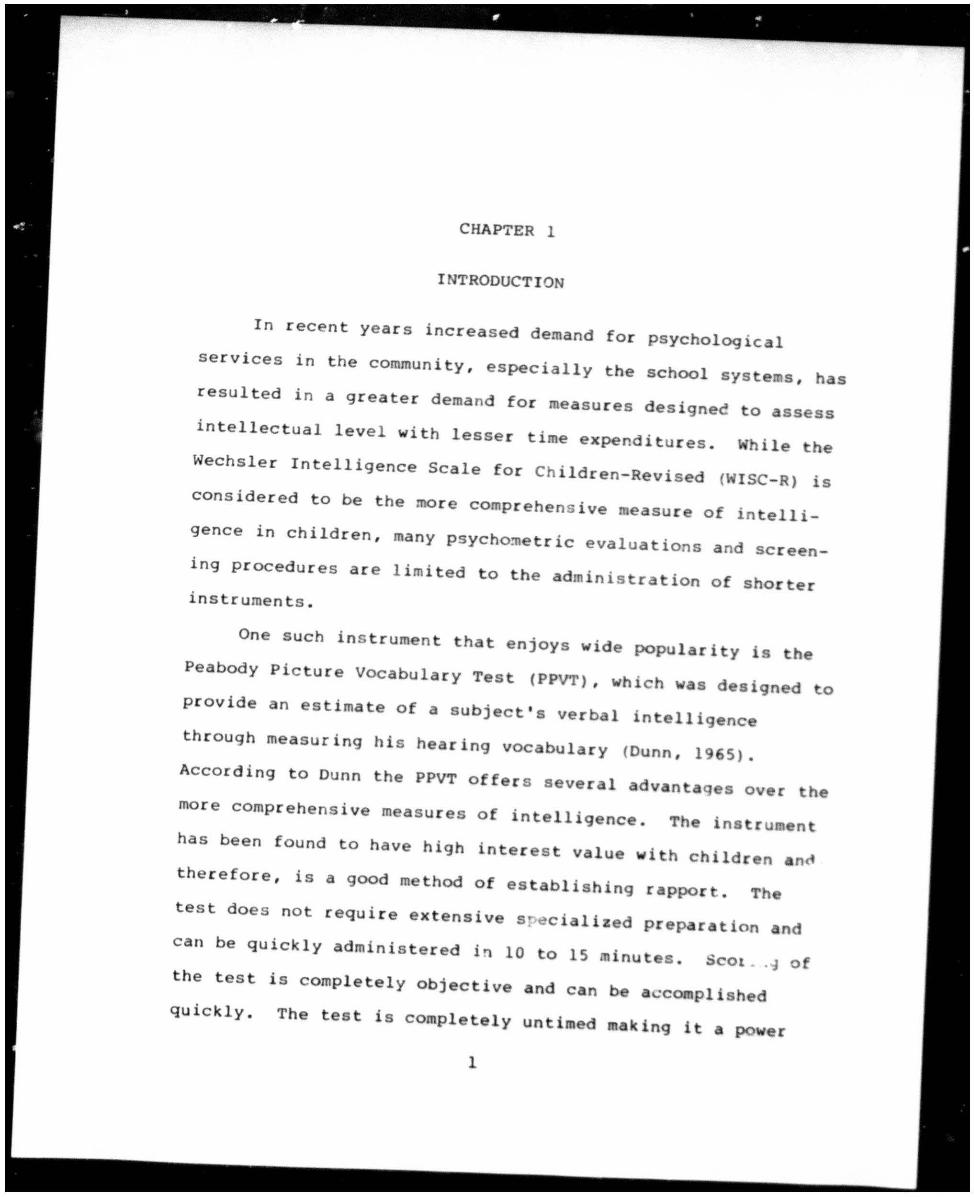
In recent years increased demand for Psychological
services in the community, especially the school syste s, has
resulted in a greater dema nd for measures designee to assess
intellec t ual level with lesser time expenditures. hile the
Wechsler Intelligence Scale for Ch ildren-Revised (WISC-R) is
considered to be the more comprehensive measure of intelli
gence in children, many Psycho~etric evaluations a nd screen
ing procedures are limited to the administration of shorter
instruments.
One Such instrument that enjoys wide popularity i s the
Peabody Picture Vocabulary Test (PPVT), which was desi9ned 0
provide an estimate of a subject ' s verbal intelligence
through measurin9 his hearing vocabulary (Dunn , 1965).
ACCOrding to Dunn the PPVT offers several dv ntaqes over the
more comprehensive measures of intelligence. Th ins ru nt
has been found to have high interes t value with childr n n~ therefore, is a good method of establishin9 rappor Th
test does not require extensive s ~ci lized prep r tion nd
Can be quickly administered i~ 10 to 15 minut s . SCOt .~ of
the test is comple tel y objective and can be a ccomplished
quickly. The test is completely untimed making it a power
1
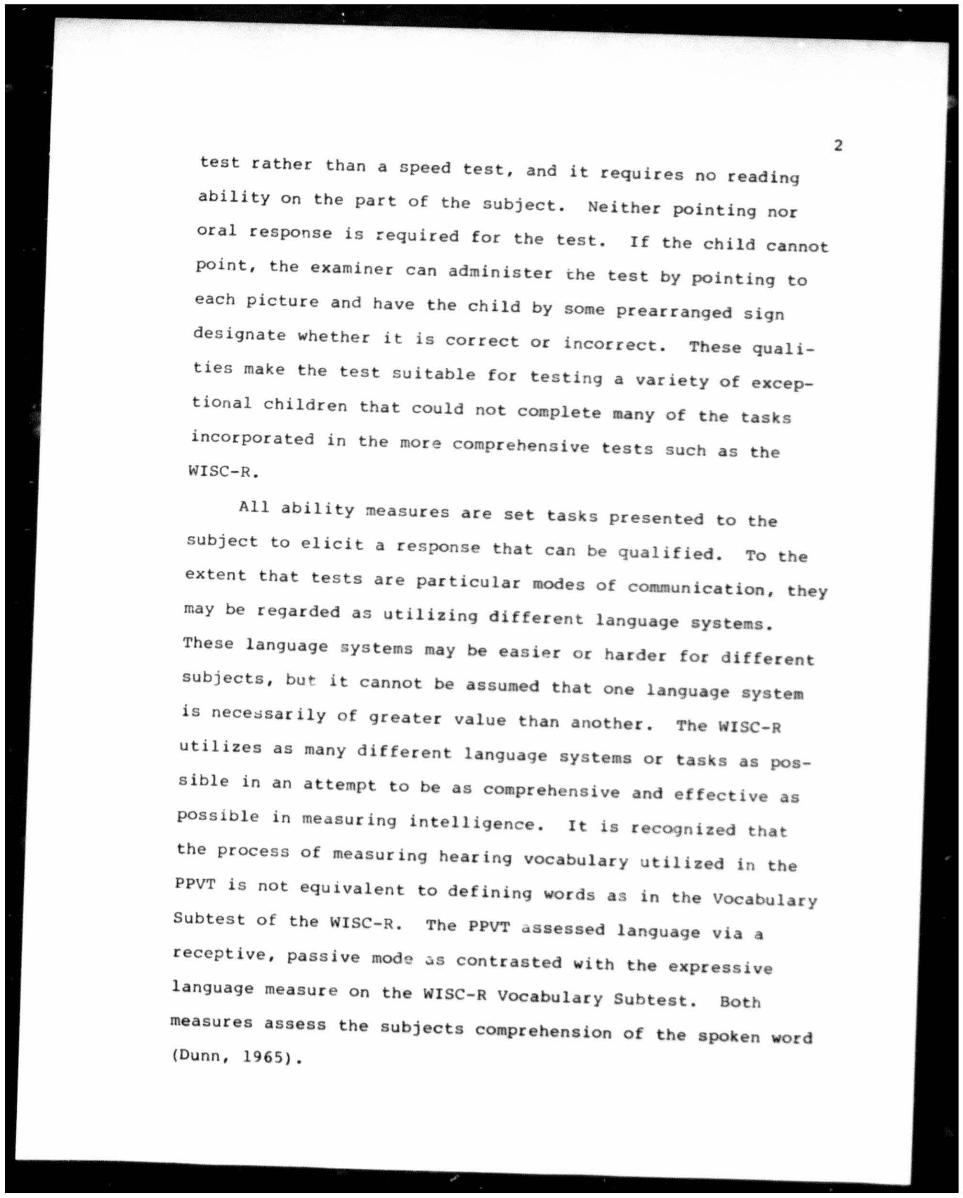
test rather than a speed test, and it requires no reading
ability on the part of the subject. Neither pointing nor
oral response is required for the test. If the child cannot
point , the examiner can administer the test by pointing to
each picture and have the child by some prearranged sign
designate whether it is correct or incorrect . These quali
ties make the test suitable for te s ti ng a variety of excep
tional children that could not complete many of the tasks
incorporated in the more compr ehensive test s such a s the
WISC-R .
All ability measures are set task s presented to the
subject to elicit a response that can be qualified. To the
exte nt that tests are particular modes of commun ication, they
may be regarded as utilizing different language syste s .
These language y s tems may be easier or harder for different
subjects , bu it cannot be as sumed that one 1 nguage system
is nece~sarily of greater value than another. The WISC-R
utilizes as many different language sys tems or ta s 5 as pos
sible in an attempt to be as comprehensive and e fective as
possible in measuring intelligence . It is r ecognized th t
the process of measuring hearing vocabulary utilized in the
PPVT i s not equivalent to defining words as in the Vocabulary
Subtest of the WISC-R. The PPVT assessed language via a
receptive , passive mod~ ~s contrasted with the expressive
language measu r e on the WISC-R Vocabulary Subtest. Both
me asures assess the subjects comprehension of the spoken word
(Dunn , 1965 ).
2
3
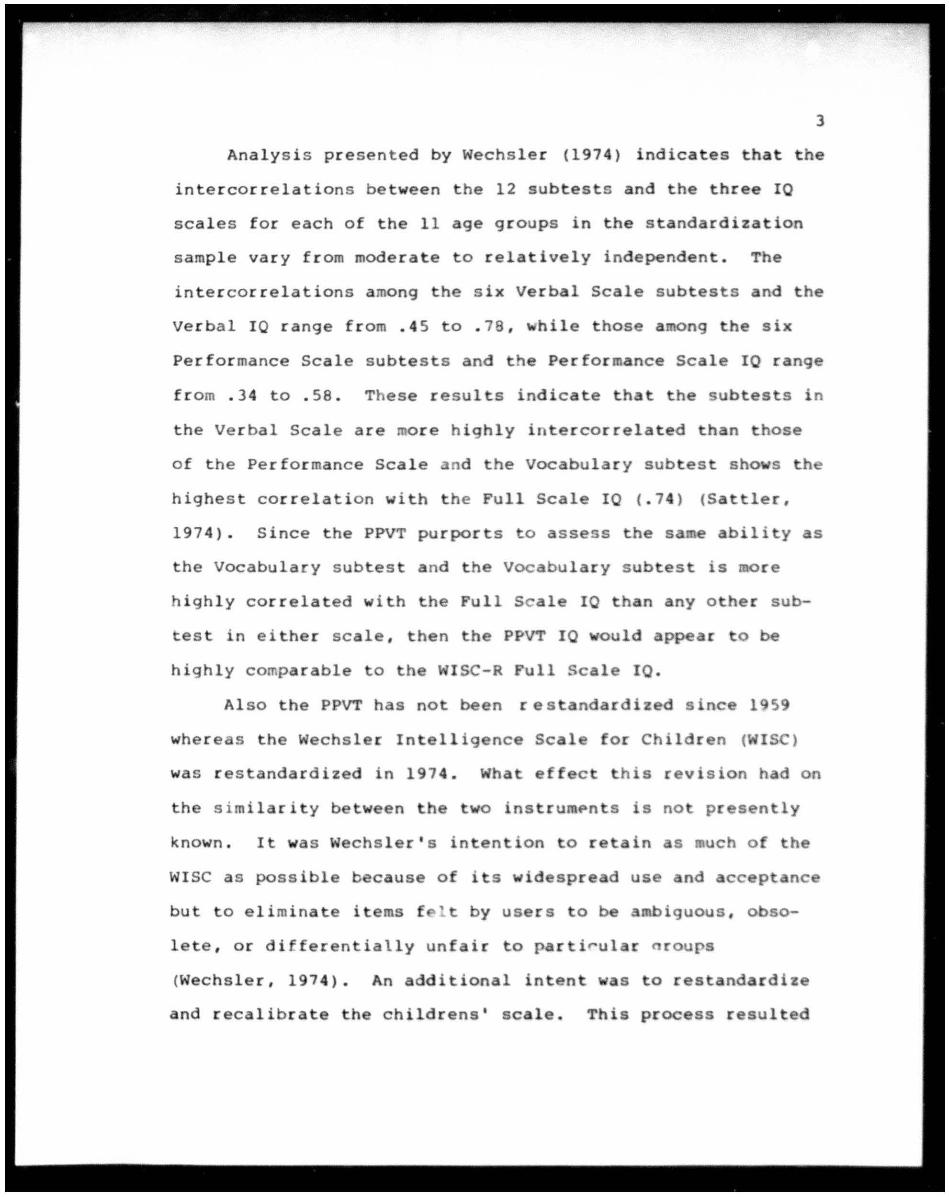
Analysis presented by Wechsler (1974) indicates that the
intercorrelations between the 12 subtests and the three 10
scales for each of the 11 age groups in the standardization
sample vary from moderate to relatively independent. The
intercorrelations among the six Verbal Scale subtests and the
Verbal 10 range from .45 to .78, while those a ong the six
Performance Scale subtests and the Performance Scale 10 range
from . 34 to . 58. These results indicate that the subtests in
the Verbal Scale are more highly intercorrelated than those
of the Performance Scale and the Vocabulary subtest sho s th
highest correlation with the Full Scale 10 (.74) (Sattler,
1974). Since the PPVT purports 0 assess the s e ability as
the Vocabulary subtest a nd the Vocabulary subtest is more
highly correlated with the Full Sale 10 than any other sub
test in either scale, then the PPVT 10 would appear t o be
highly comparable to the WISC-R Full Scale 10.
Also the PPVT has not b en re s tandardized since 1959
whereas the Wechsler Intelligence Scale for Children ( ISC)
was restandardized in 1974. What effect t his revision had on
the similarity b tween the two instrum~nts is no presently
known. It was Wechsler's intention to r t in s much of the
WISC as possible because of its widespre d use nd acc pt nee
but to eliminate items f I t by users to be a iguous, obso
lete, or di ferentiatly unfair to partirul r oroups
(Wechsler, 1974). An additional intent w s to restandardiz
and recalibrate the childrens' scale . This process resulted
in a drop of approximately eight 1Q points for the typical
child in mo~t age groups.
The PPVT and the W1SC-R logically should be asuring
the same constructs. Presently, there has been no reported
research comparing the PPVT and the revised 1SC. T erefor
it is the purpose of this study to compare the PPVT and the
W1SC-R in an effort to establish an esti te of the si.il r
ity be ween he t purportedly ~i.ilar e sures of
intelligence.
CHAPTER 2
REVIEW OF THE LITERATURE
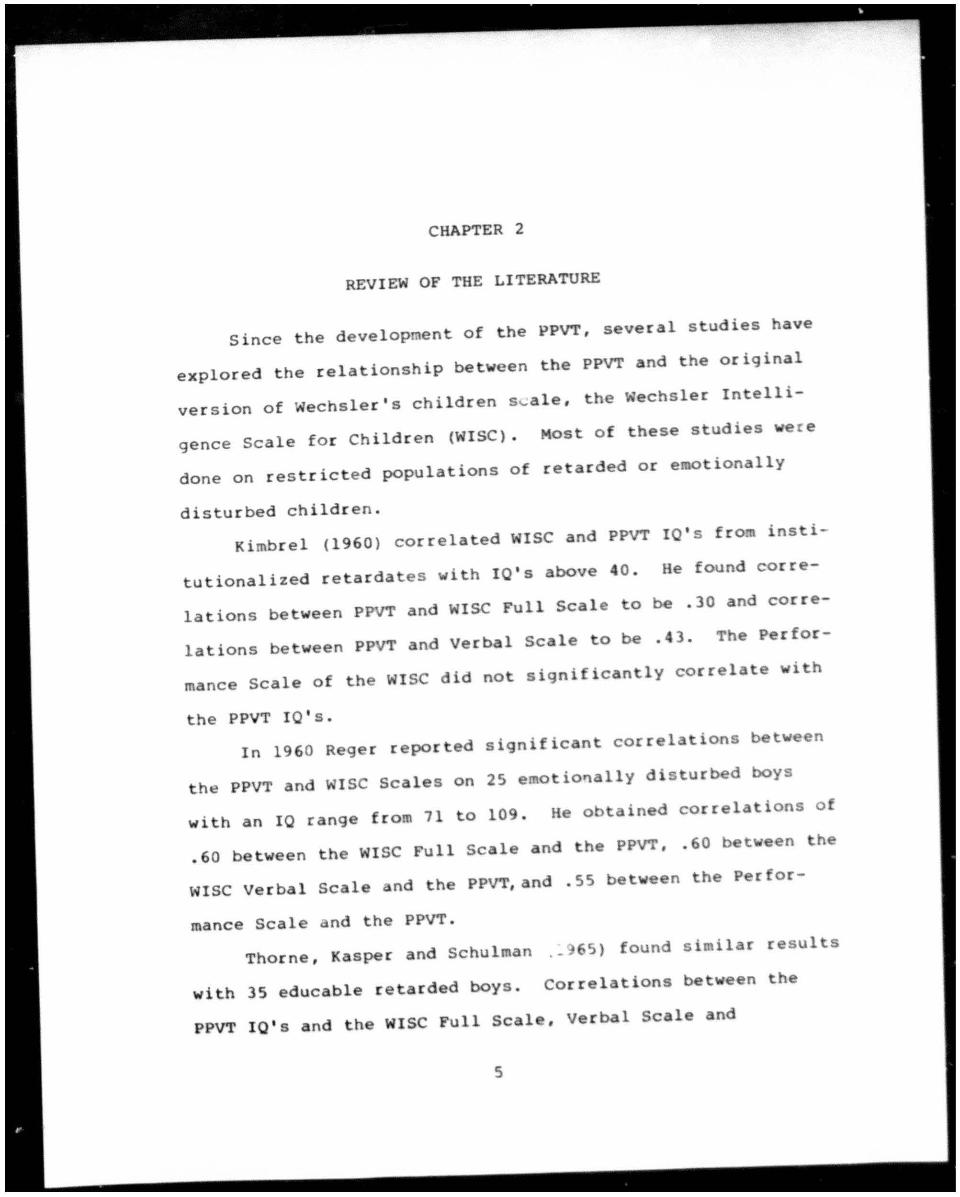
Since the development of the PPVT, several studies have
explored the relationship between the PPVT and the original
version of Wechsler's children s~a le, the Wechsler Intelli
gence Scale for Children (WISC). Most o f these studies e r e
done on restricte d populations of retarded or emotionally
disturbed children.
Kimbrel (1960) correla ted WISC and PPVT IO'S fro insti-
tutionalized retardates with 10'5 above 40. He found corre
lations between PPVT and WISC Full Scale to be .30 and corre
lations between PPVT and Verbal Scale to be .43. The Perfor
mance Scale of the WISC did not significantly correlate with
the PPVT IO's.
In 1960 Reger reported significant correlations between
the PPVT and ISC Scales on 25 emotio'lally disturbed boys
with an 10 range from 71 to 109. He obtained correlations o f
.60 between the WISC Full Scale and the PPVT, .60 b tween the
WISC Verbal Scale and the PPVT,and .55 between the Perfor-
mance Scale and the PPVT.
Thorne, Kasper and Schulman ._ 65) found similar resul ts
with 35 educable retarded boys. Correlations between the
PPVT IO ' s and the WISe Full Scale, Verbal Scale nd
5
6
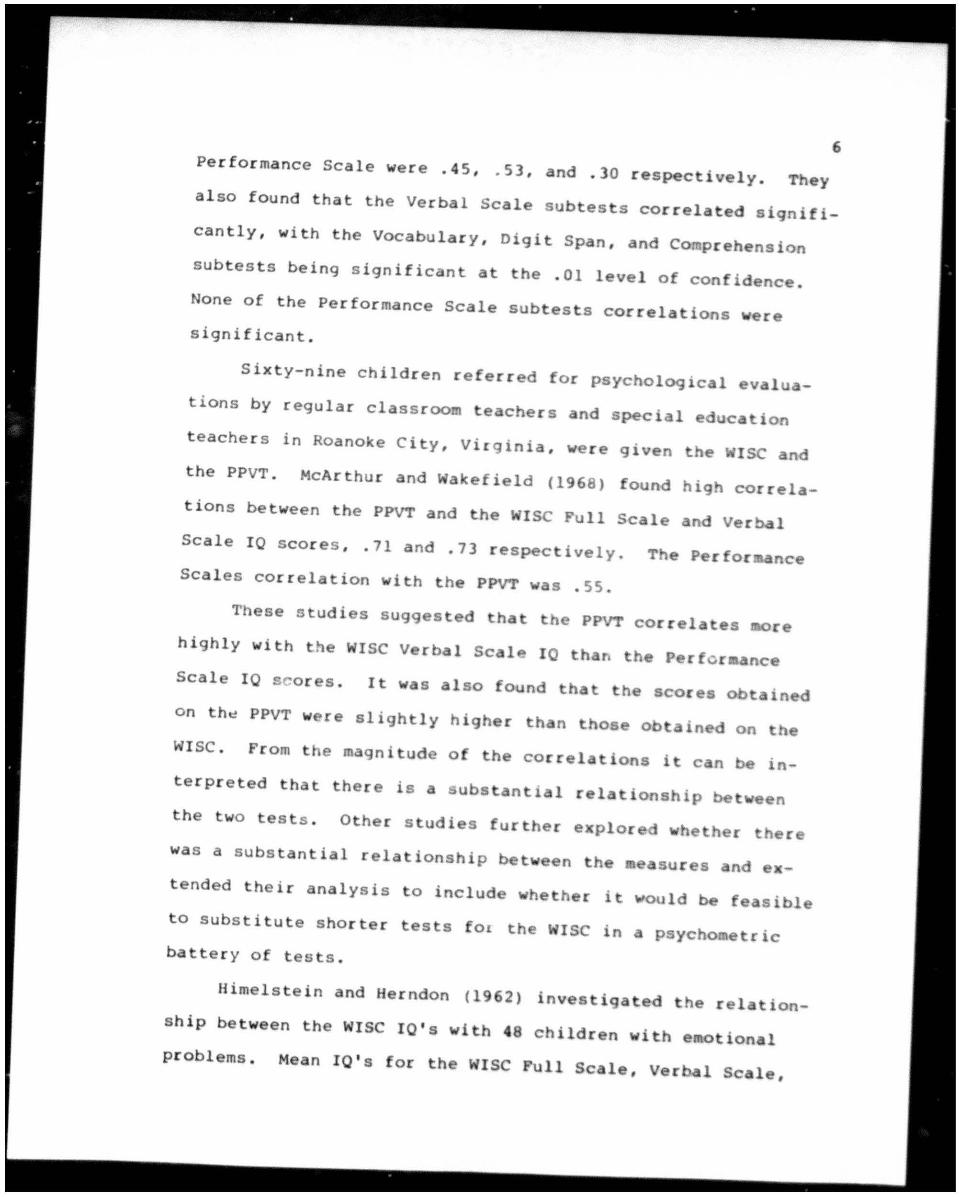
Performance Scale were .45, .53 , and .30 respectively. They
also found that the Verbal Scale subtes t s correlated signifi
cantly, with the Vocabulary, Digit Span, and e~prehension
subtests being signi ficant at the .01 level of confidence.
None of the Performance Scale subtests correlations ere
significant.
Sixty-nine child ren referred for Psychological ev lu _
tions by regular classroo teacher s and special education
teachers in Roanoke City, Virginia , w re given he WISe and
the PPVT. McArthur and Wakefield (1968) found high correla
tions between the PPVT and the WIse Full Scale and Verbal
Scale 10 scores , .71 and .73 respectively. The Perfor nee
Scales correlation ith t he PPVT was . 55 .
These studies suggested h t the PPVT correlates ~re
highly with the WI Se Verb 1 Scale 10 than the P rfo r.ance
Scale 10 s c or s. It wa s also found th the scor es obt ined
on th~ PPVT were slightly highe r th n tho e 0 tined on the
WISe. From the magnitude of the correl tions it can be in
terpreted that the r e is a ubstantial relationship bet n
the two test s . Other studies further explor whether he r
was a substantial relationship betw en t he e su r es nd ex
tended their nalysis to inClude whether it ~Ould be feasible
to substitute shorter tests fO I th Ise in a psych etric
battery of tests.
Himelstein and Herndon (1 962) investig ted the reI tion
ship between th WISe IO's with .8 children with e tional
p r oblems. Mean 10 ' sfor the WISe Full Sc Ie, Ver I Seal,
7
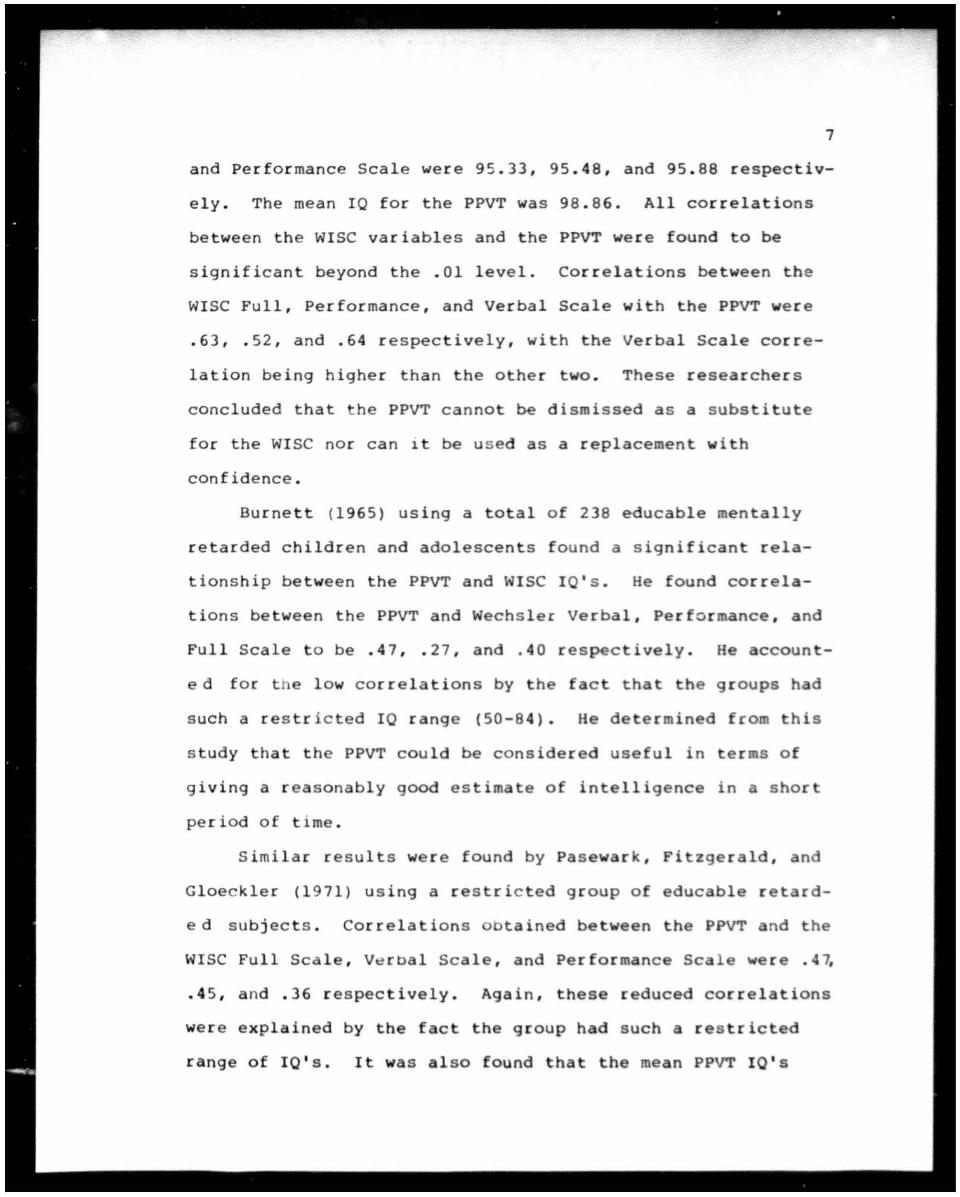
and Performance Scale were 95.33, 95.48, and 95.88 respectiv
ely . The mean 10 for the PPVT was 98.86. All correlations
between the WISC variables and the PPVT were found to be
significant beyond the .01 level. Correlations between the
WISC Full, Performance, and Verbal Scale with the PPVT were
.63, .52, and .64 respectively, with the Verbal Scale corre
lation being higher than the other two. These researchers
concluded that he PPVT cannot be dismissed as a substi tute
for the WISC nor can ~t be us ed as a replacement with
confidence.
Burnett (1965) using a total of 238 educable entally
retarded children and adolescents found a significan t rela
tionship between the PPVT and WISC IO's. He found correla
tions between the PPVT and Wechs le r Verbal, Performance, and
Full Scale t o be .47, .27, and . 40 resp ctively . He account
ed for t he low correlations by t he fact that the groups had
such a res tr ic ted 10 range (50-84). He determined fro this
study that the PPVT could be considered useful in terms of
giving a r e a sonably good es timate of intelligence in a short
period of time.
Similar results were found by Pasewark, Fitzgerald, and
Gloeckler (1971) using a restric ted group of educable retard
ed subjects. Correlations obtained between the PPVT and the
WIse Full Scale, V~roal Scale, and Performance Scale were .4~
.4 5, and .36 respectively. Again, these reduced correlations
were explained by the fact the group had such res tricted
range of 10's. It was also found that the mean PPVT IO's
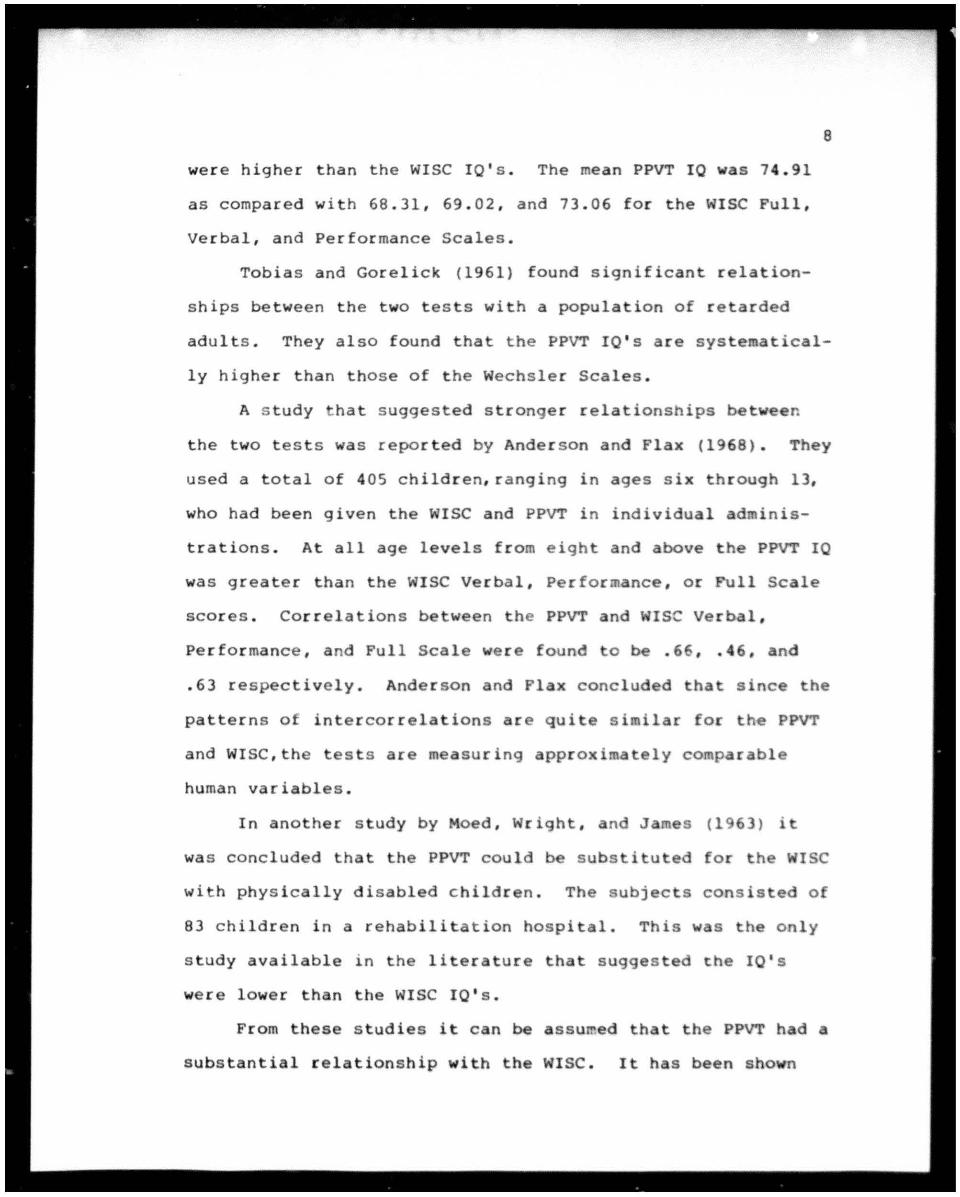
were higher than the wISe IO's. The mean PPVT 10 was 74.91
as compared wi th 68.31, 69.02, and 73.06 for the WISe Full,
Verbal, and Performance Scales.
8
Tobias and Gorelick (1961) found significant relation
ships between the two tests with a population of retarded
adults. They also found that the PPVT IO's are systematical
ly higher than those of the Wechsler Scales.
A s tudy hat suggested stronger relationships between
the two tests was repor ted by Anderson and Flax (1968) . They
used a total of 405 children, ranging in ages six through 13,
who had been given the WIse and PPVT in individual ad inis
trations. At all age levels from eight and above the PPVT 10
was greater than the WISe Verbal, Performance, or Full Scale
scores. Correlations between the PPVT and WISe Verbal,
performance , and Full Scale were found to be .66, .46, and
.63 respectively. Anderson and Flax concluded that s nce the
patterns 0 intercorrelations ar quite similar for the PPVT
and WIse, the tests are measuring approximately comparable
human variable s .
In another study by Moed, Wright, and Jame s (1963) i
wa s concluded that the PPVT could be substituted for the Ise
wi h physically disabled children . The subj ects consisted of
83 children in a rehabilitation hospital. This w s the only
study available in the literature that suggested the 10's
were lower than the WIse IO's.
From these studies it can be assumed that the PPVT had a
substantial relationship with th WIse. It has been shown
9
the measur~s correlate significantly, but the PPVT generally
provided a slightly hiqher estimate of IQ than the WISC. To
date, most studies have use d restricted groups in correlating
the two tests and none have established a correction factor
to compensate for the higher PPVT IQ's. All studies cited
have used the WISC as the criterion measure. None were
available in the literature that used the more recent WISC-R.
It was the purpose of this study to i nvestigate the correlate
relationships between the PPVT a nd WISC-R variables.
Furthermore, differences and directions of differences be
tween the mean levels of functioning were explored.
CHAPTER 3
METHOD
The sample was composed of nine, 10, and 11 year old
students referred to the Psychological Clinic at Western
Kentucky University. The referrals were of wide variety
including many normal children used for training purposes,
questions as to grade placement, and behavior and emotional
problems. The sample included 194 students which had co -
pleted both WISC-R and PPVT measures. The sample which in
cluded nine, 10, and 11 year old students was selected be
cause of the high frequency of subjects in each group and
because the ages fell in the middle of t he chronological age
range for each instrument. There were 100 males and 94 fe
males included in the sample with a mean age of 10 years a d
six months . The sample included 106 white, 46 blac and 42
children of unknown race. The sample was not designed to be
descriptive of the general population but was felt quite sim
ilar to the population with which those instrumen s are fre
quently used by psycholcgjsts.
Each student w~s individually administered the PPVT by
a graduate student in the two year clinical psychology train
ing program at Western Ken Lucky University. The testing
sessions were conducted in individual testing booths in the
10
11
University's Psychological Clinic. The testing sessions were
supervised and observed by doctoral level psychologists.
Standardized procedures were followed for all ad inistrations
and scoring in accordance with the PPVT manual (Dunn, 1965).
Each student was also administered the WISC-R in the same
session as the PPVT under the same conditions. Standardized
procedures were foll owed for all administrations and scoring
in accordance to the WISC-R manual (Wechsler, 1974). Verbal,
Performance, and Full Scale deviation IO's and scaled scores
for each subtest we re used in the analysis.
Pearson Product Moment Correlations were performed be
tween the PPVT 10 scores and the W chsle r Verbal 10, Perfor _
ance 10, Full Scale 10, and the 12 subtests. As a result of
frequent clinical comparison, !-tests between the WISC-R
Verbal, Full Scale , and the Vocabulary easures and the PPVT
measures were done. For the t-test co parisons the v riables
were converted to z scores so a mo r e accurate co parison
could be made. The z scores were based upon the n tional
standar ization sample nd not upon the sample used for this
study. The correlations between the PPVT nd the WISC-R
variables were accepted at or beyond the .01 level of
significance.
11 University's Psychological Clinic. The testin9 sessions were
supervised and observed by doctoral level psychologists.
Standardi=ed procedures were fOllowed for all ad iniatr tlona
and scoring in accordance with the PPVT nual (Dunn , 1965).
Each student was also administered the WISC-R in the sa
session as the PPVT under the s me conditions. Standardized
procedures were followed for all ad inistr tions nd ~cJrln9
in accordance to the WISC-R anual (W chsler, 1974). Verbal,
Performance, and Full Scale deviation IO's and scaled scores
for each subtest were used in the analys is .
Pearson Product Mo ent Correlations ere perforaed be
tween the PPVT 10 scores and the Wechsler Verbal I , Perfor.
nce 10, Full Scale 10. and the 12 subtests. As a result of
frequent clinical comparison, t-tests bet e n th ISC-R Verbal, Full Scale , and the Voc bul ry
sures and th PPVT
m asures w re done. For the !-t st co arisons the v riables
\:ere converted to z scor s so a more ccur t co r SOn
could be made. The z scores ere b sed upon th national
standardization sa pIe and not upon the 5 pIe us d for this
study. The correlations between the PPVT nd th ISC-R
variables were accepted at or beyond the.O level of
significance.
CH~PTER 4
RESULTS
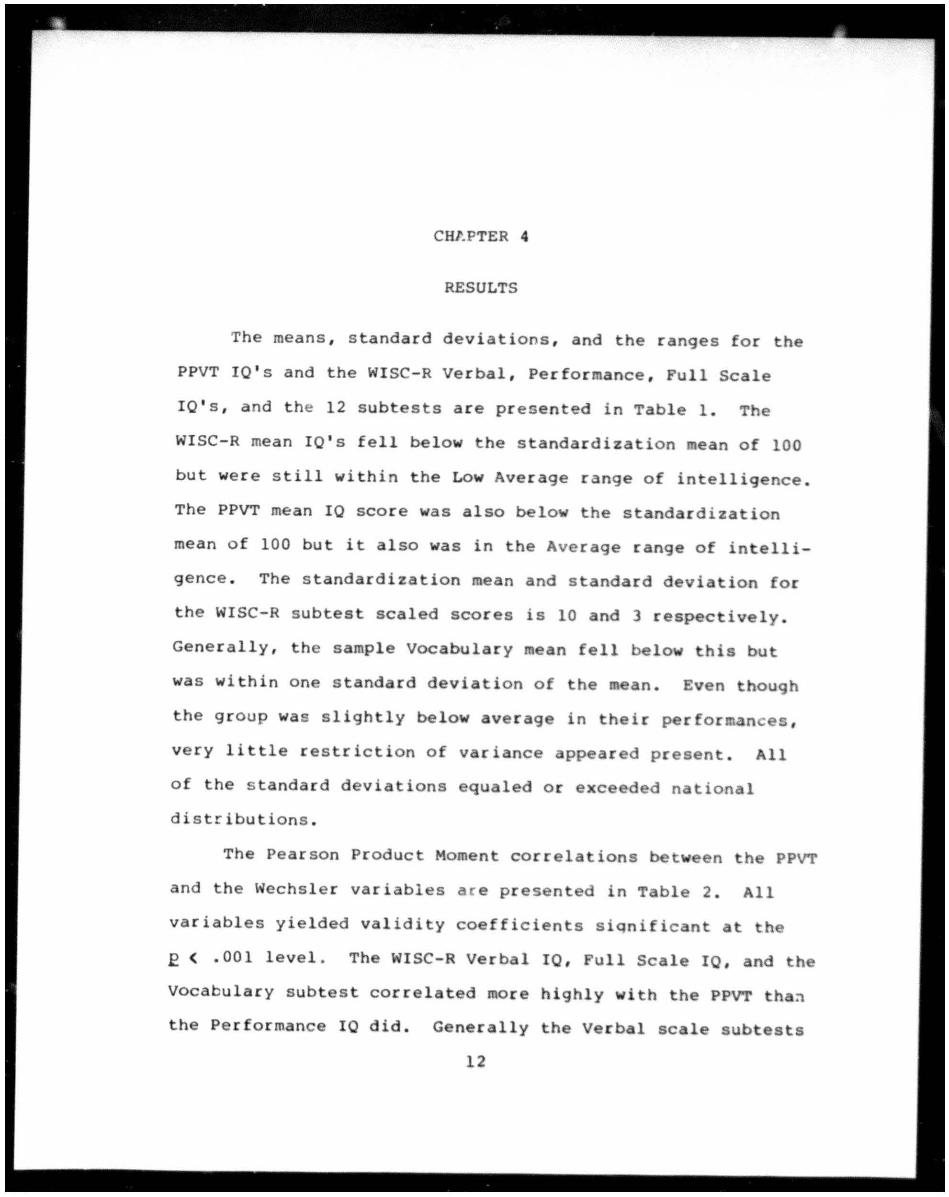
The means, standard deviations, and the ranges for the
PPVT 10's and the WISC-R Verbal, Performance, Full Scale
10 ' s, and the 12 subtests are presented in Table 1. The
WISC-R mean 10's fell below the standardization ean of 100
but were still within the Low Average range of intelligence.
The PPVT mean 10 score was also below the standardization
mean of 100 but it also was in the Average range of intelli
gence . The standardization mean and standard deviation for
the WISC-R subtest scaled scores is 10 and 3 respectively.
Generally, the sample Vocabulary mean fell belo this but
was within one standard deviation of the an. Even though
the group was slightly below average in their performances,
very little restriction of v riance ppeared present. All
of the standard deviations equaled or exceeded nation 1
distributions.
The Pearson Product Moment correlations between the PPVT
and the Wechsler variables are presented in Table 2. All
variables yielded validity coefficients siqnificant t the
E < .001 level . The WISC-R Verbal 10, Full Scale 10, and the
Vocabulary subtest correlated more highly with the PPVT th ~
the Performance 10 did. Generally the Verbal scale subtests
12
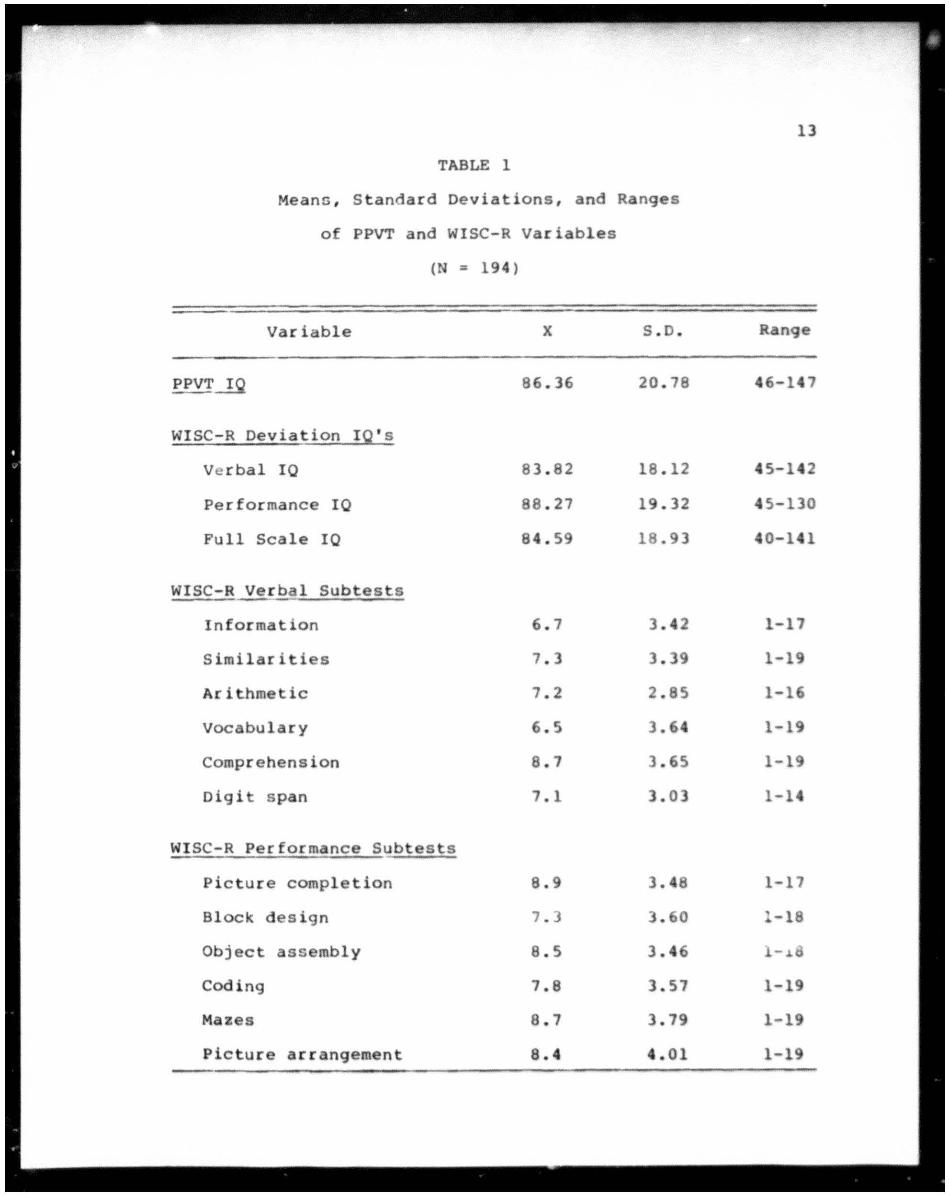
TABLE 1
Means, Standard Deviations, and Ranges
of PPVT and WISC-R Variables
(N :: 194)
Variable X S . D.
~~ 86 .36 20.78
WISC-R Deviation IO's
Ve rbal 10 83 .82 18.12
Performance 10 88.27 19.32
Full Scale 10 84.59 18 .93
WISC::,R Verbal Subtests
Information 6.7 3 .4 2
Similariti s 7 .3 3.39
Arithmetic 7 .2 2 .8 5
Vocabulary 6.5 3.64
Comprehension 8.7 3 .65
Digit s pan 7.1 3.03
WISC-R Performance Subtests
Picture completion 8.9 3.48
Block design 7 . 3 3.60
Object assembly 8.5 3.46
Coding 7.8 3.57
Mazes 8.7 3.79
Picture arrangement 8.4 4.01
13
R nge
46-147
45-142
45-130
40-141
1-17
1-19
1-16
1-19
1-1
1-14
1-17
1-18
-. 1-19
1- 19
1-19
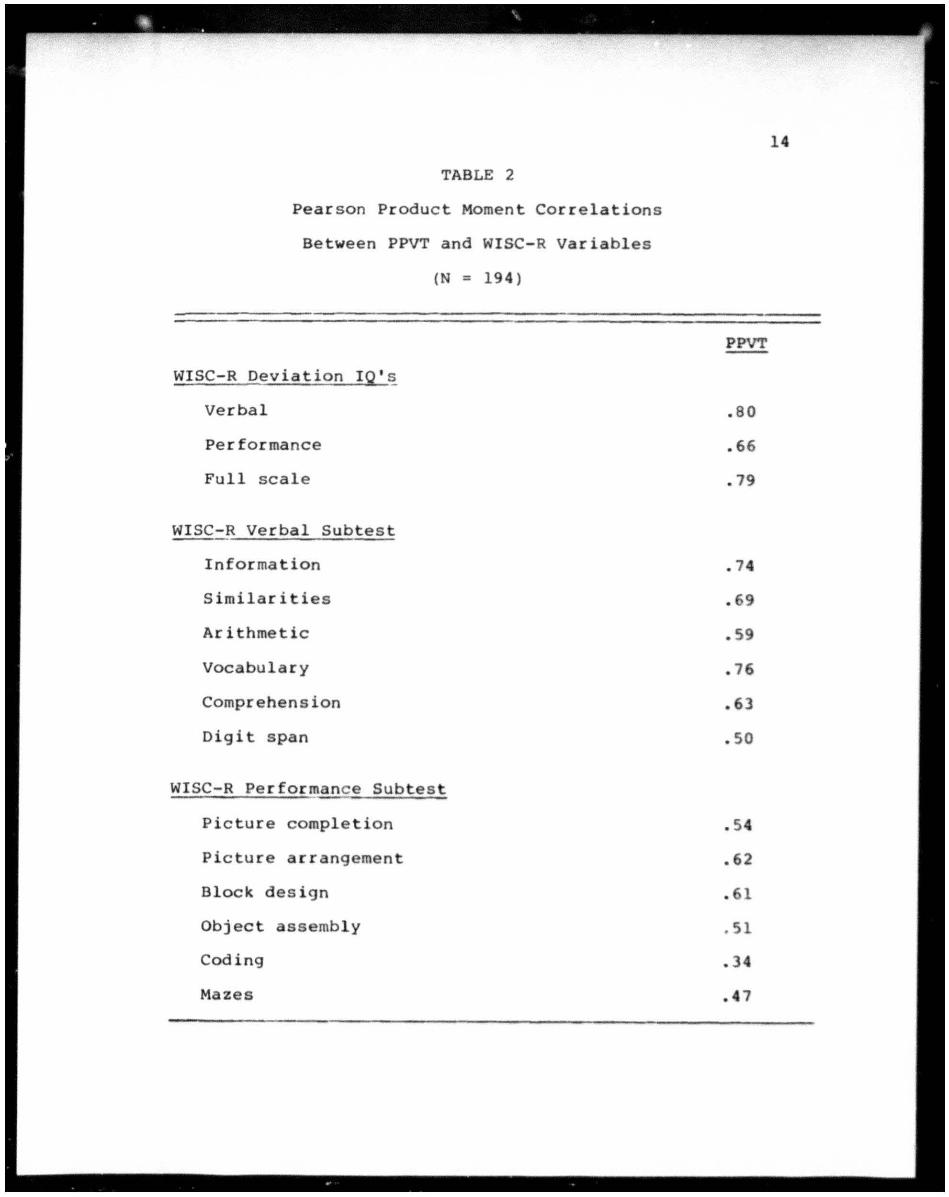
TABLE 2
Pearson Product Moment Correlations
Between PPVT and WISC-R Variables
(N = 194)
WISC-R Deviation IQ's
Verbal
Performance
Full scale
WISC-R Verbal Subtest
Information
Similarities
Arithmetic
Vocabulary
Comprehension
Digit span
WISC-R Performance Subtest
Picture completion
Picture arrangement
Block design
Object assembly
Coding
Mazes
PPVT
.80
.66
.79
.74
.69
. 59
.76
.63
. 50
.54
.62
.61
. 51
.34
.47
correlated more highly with the PPVT than the Performance
Subtests did.
15
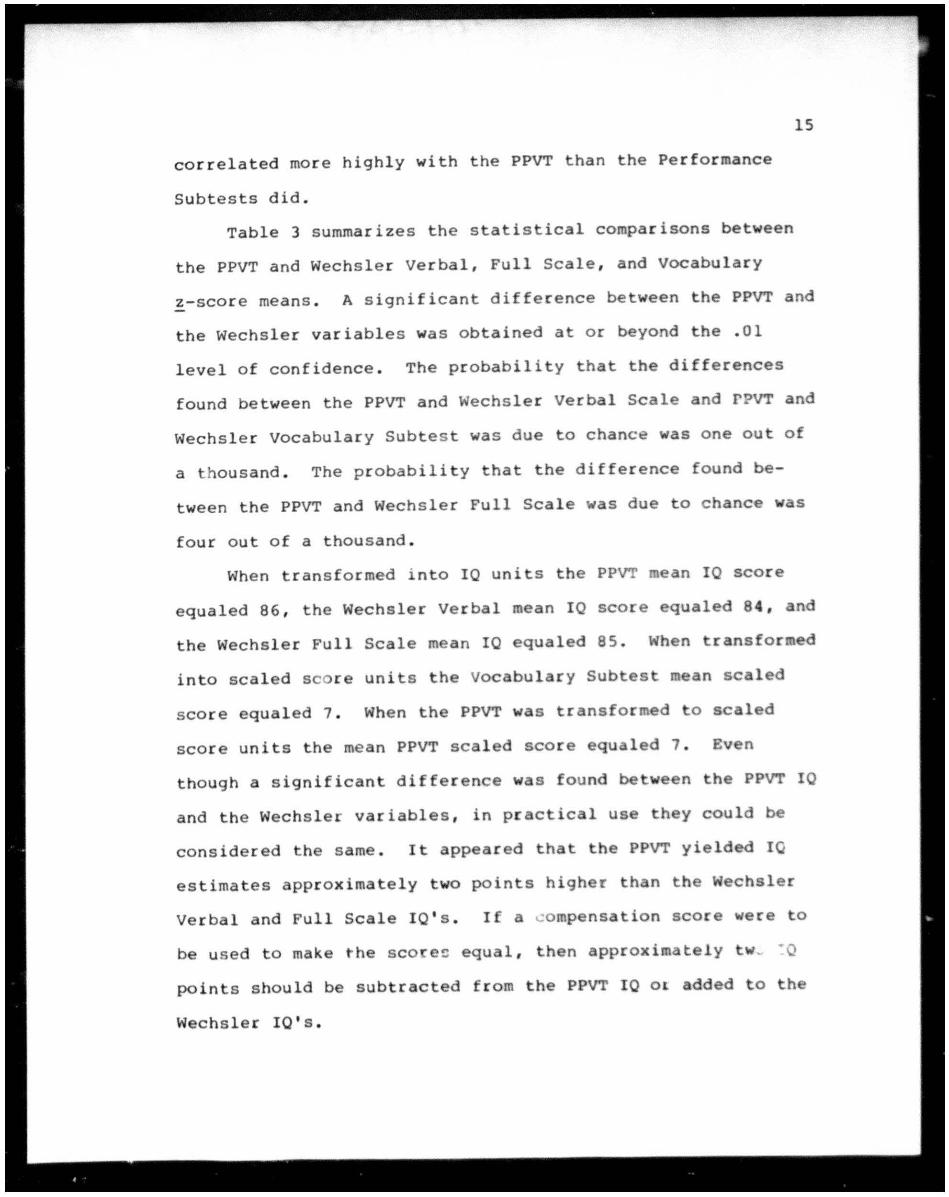
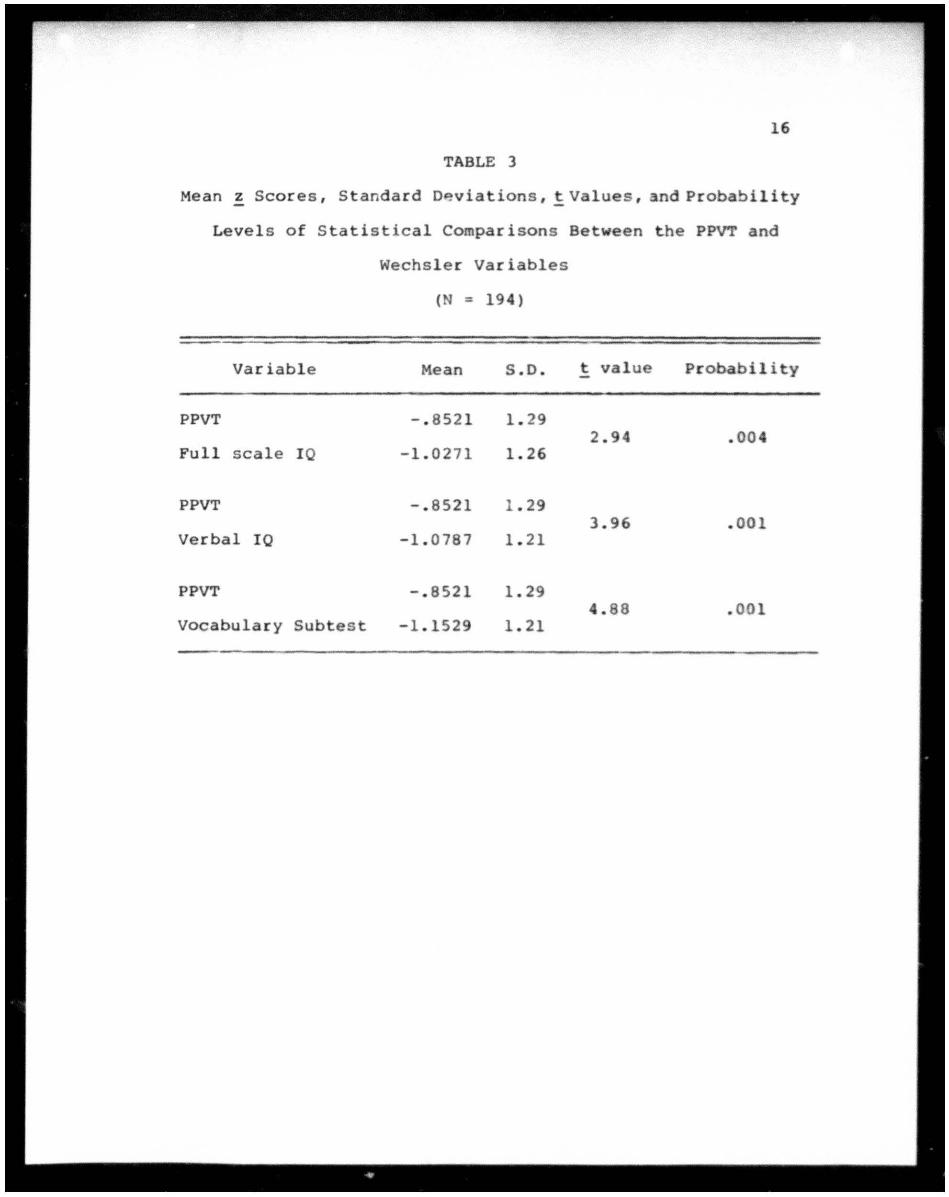
Table 3 summarizes the statistical comparisons between
the PPVT and Wechsler Verbal, Full Scale, and vocabulary
z-score means. A significant difference between the PPVT and
the Wechsler variables was obtained at or beyond the .01
level of confidence . The probability that the differences
found between the PPVT and Wechsler Verbal Scale and rpVT and
Wechsler vocabulary Subtes t was due to chance was one out of
a thousand . The probability that the difference found be
tween the PPVT and Wechsler Full Scale was due to chance w s
four out of a thousand.
When transformed into 10 units the PPVT ean 10 score
equaled 86, the Wechsler Verbal mean 10 scor e equaled 84, and
the Wechsler Full Scale m an 10 equaled 85. When transfor ed
into scaled s c re units the Vocabulary Subtest mean s caled
score equaled 7. When the PPVT was transformed to scaled
score units the mean PPVT scaled score equaled 7. Even
though a significant difference was found between the PPVT 10
and the Wechsler variables, in practic 1 use they could be
considered the same. It appeared that the PPVT yield d 10
estimates approximately two points highe ~ than the Wechsle r
Verbal and Full Scale 10 ' s. If a ~ompensation score were to
be used to make the scorec equal, then approxim tely tw_ "Q
points should be subtracted from the PPVT 10 01 added to th
Wechsler 10 ' s .
16
TABLE 3
Mean! Scores, Standard Op.viations, ! Values, and Probability
Levels of Statistical Comparisons Between the PPVT and
Wechsler Variables
(N = 194)
Variable Mean S.D. t value Probability
PPVT -.8521 1.29 2.94 .004
Full scale 10 -1.0271 1. 26
PPVT - .8 521 1. 29 3.96 .001
Verbal 10 -1.0787 1.21
PPVT - . 8521 1.29 4.88 .001
Vocabulary Subtest -1.1529 1. 21
-
CHAPTER 5
DISCUSSION AND IMPLICATIONS
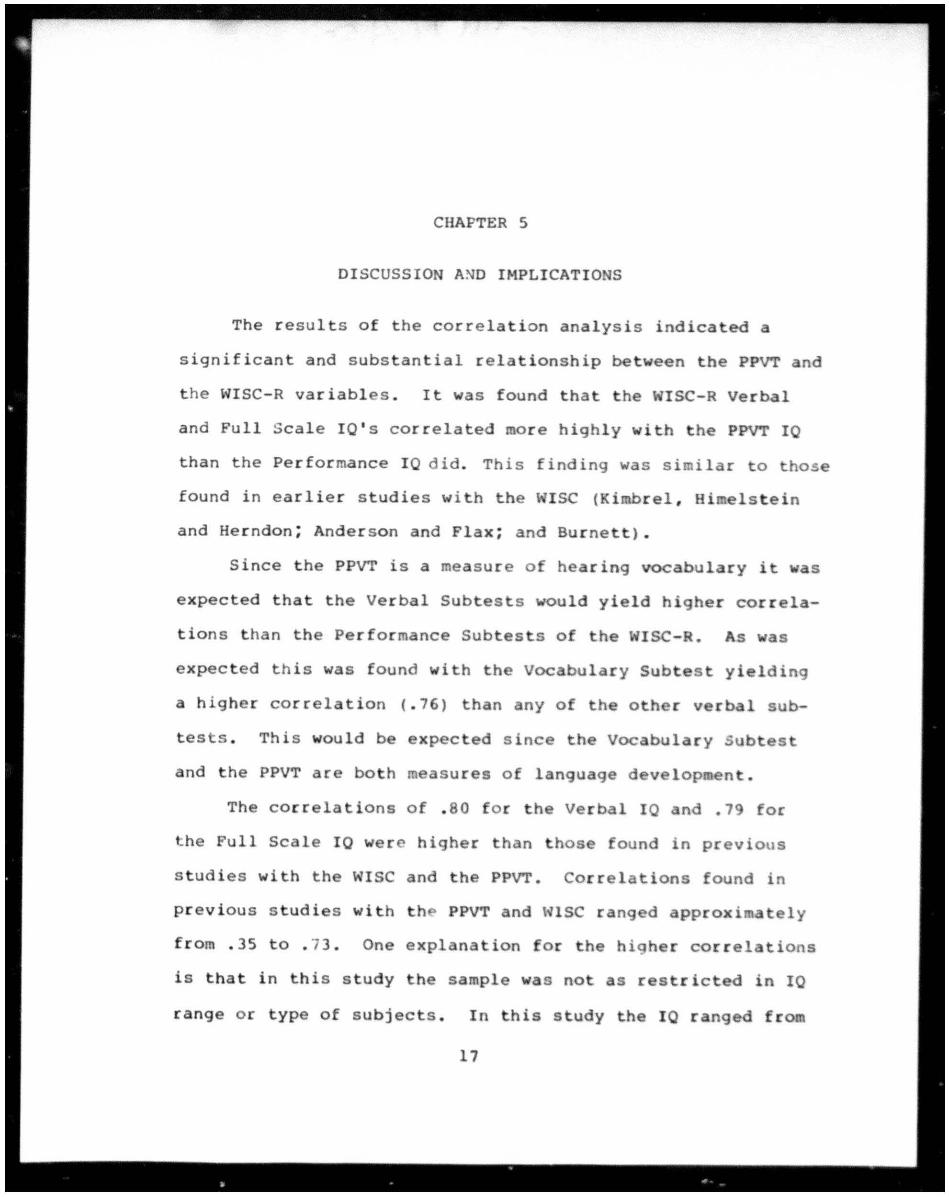
The results of the correlation analysis indicated a
significant and substantial relationship between the PPVT and
t he WISC-R variables. It was found that the WISC-R Verbal
and Full Scale IO's correlated more highly with the PPVT I
than the Performance 10 did . This finding was similar to those
found in earlier studies with the WISC (Kimbrel, Hi elstein
and Herndon; Anderson and Flax; and Burnett).
Since the PPVT is a measure of hearing vocabulary it was
expected that the Verbal Subtests would yield higher correla
tions than the Performance Subtests of the WISC-R. As was
expected this was found with the Vocabulary Subtest yielding
a higher correlation (.76) than any of the oth r verbal sub
tests. This would be expected since the Vocabulary Subtest
and the PPVT are both measures of language develop ent .
The correlations of . 80 for the Verbal 10 nd .79 for
the Full Scale 10 wer higher than those found in previous
studies with the WISC and th PPVT. Correlations found in
previous studi s with th~ PPVT and l~lSC ranged approxi ately
from . 35 to . 7 3. One explanation for the higher correl tions
is that in this study he sample wa s not as restricted in 10
range o r type of subjects. In this study the 10 ranged fro
17
18
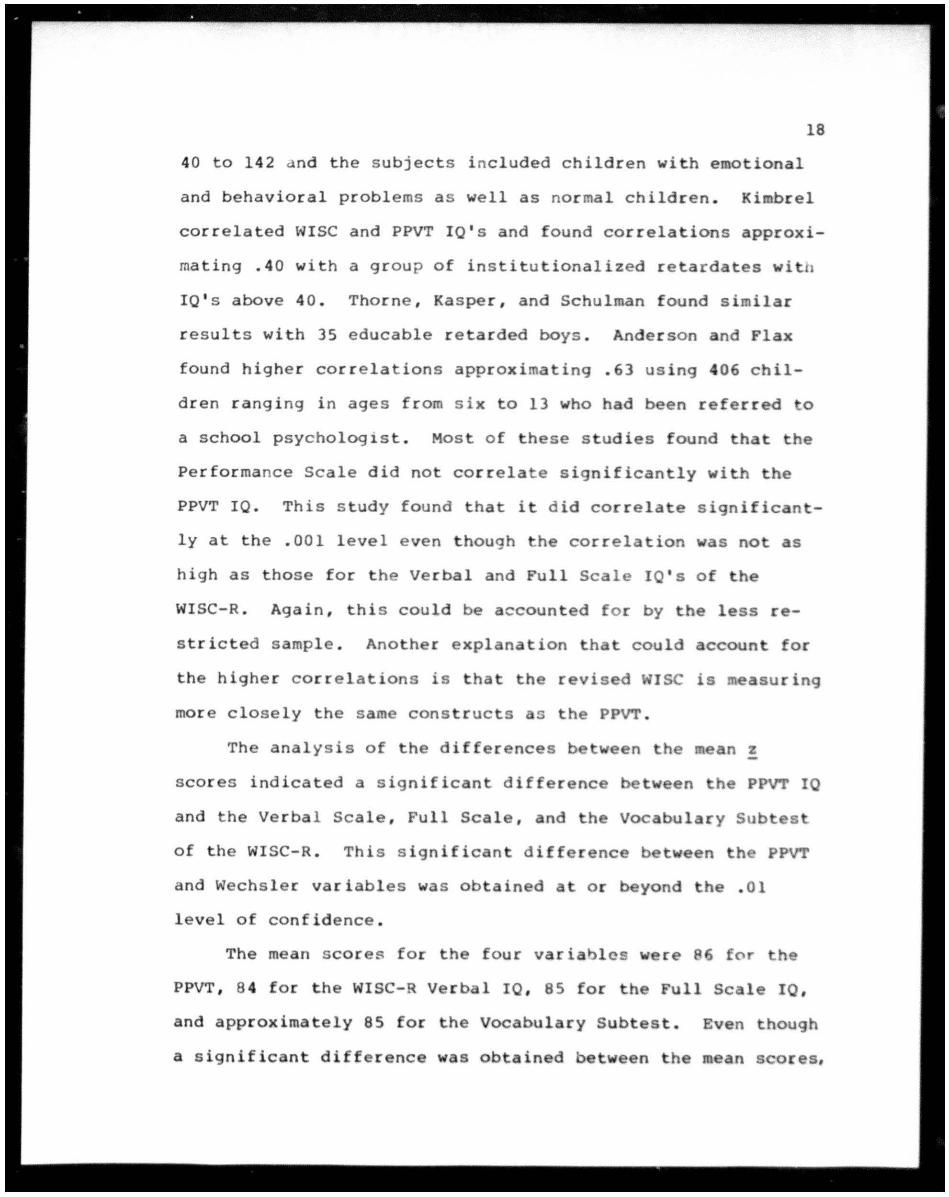
40 to 142 dnd the subjects i ncluded children with emotional
and behavioral problems as well as normal children . Kimbrel
correlated WISC and PPVT 10's and found correlations approxi
mating .40 with a group of institutionalized retardates wi~1
10's above 40. Thorne, Kasper, and Schulman found similar
results with 35 educable retarded boys. Anderson and Flax
found higher correlations approximating .63 using 406 chil
dren ranging in ages from six to 13 who had been referred 0
a school psychologlst. Most of these studies found that the
Performance Scale did not correIa e significantly with the
PPVT 10. This study found that it did correlate significant
ly at the .001 level even though he correlation was not as
high as those for the Verbal and Full Scale 10's of the
WISC-R. Again, this could be accounted f o r by the less re
stricted sample. Another explanation that could account for
the higher correlations is that the revis d WISC is asuring
more closely the same constructs as the PPVT.
The analysis of the differences be ween the m an z
scores indicated a s ignificant difference between the PPVT 10
and the Verba l Scale, Full Scale, and the voc bulary Subtes t
of the WISC-R. This s ignificant difference between the PPVT
and Wechsler variables wa s obtained at or b yond the .01
level of confidence.
The mean scores for the four variables were 86 for he
PPVT , 84 for the WISC-R Verbal 10, 85 for the Full Scale 10,
and approximately 85 for the Vocabulary Subtest. Even though
a significant difference was obtain d between the m an scores,
19
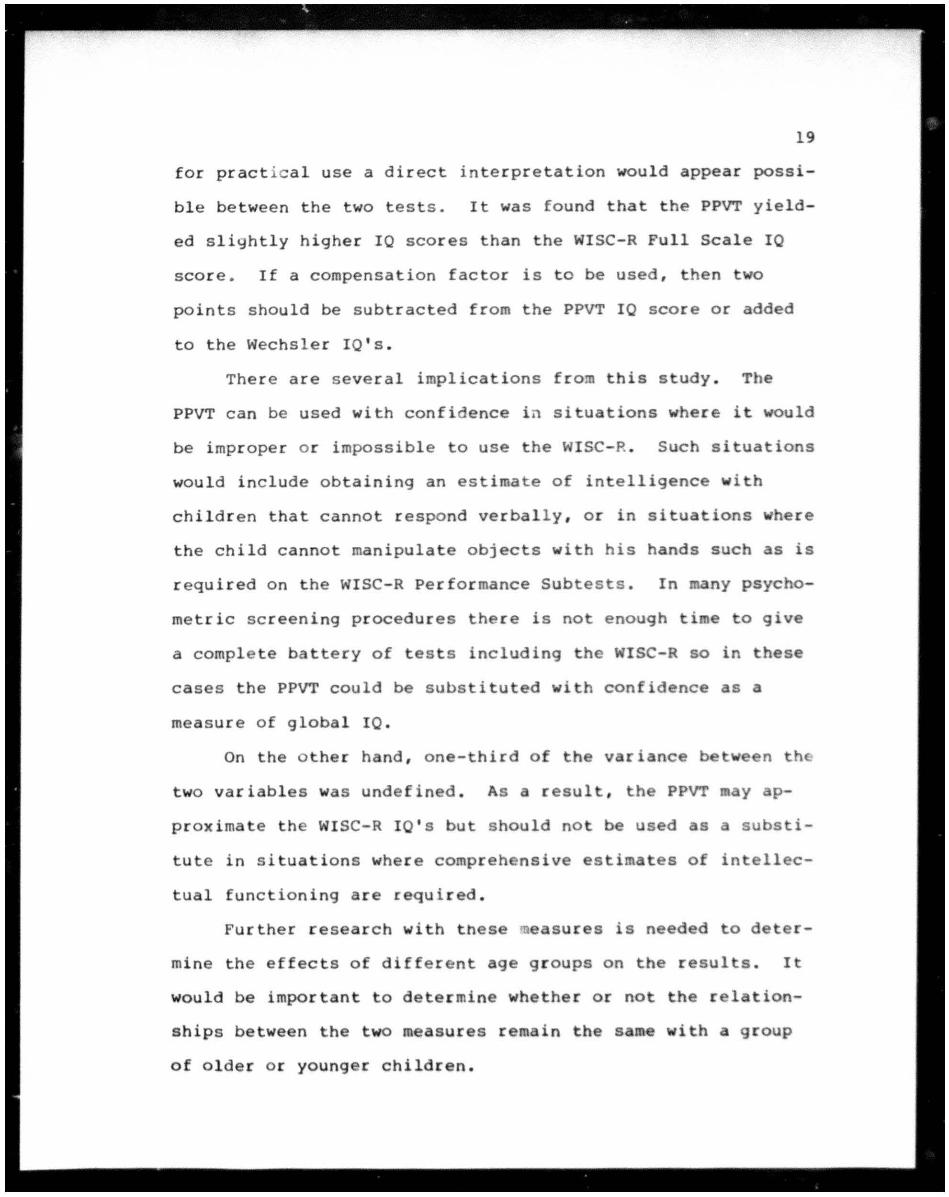
for pract i cal use a direct interpretation would appear possi
ble between the two tests. It was found that the PPVT yield
ed slightly higher 10 scores than the WISC-R Full Scale 10
score. If a compensation factor is to be used, then two
points should be subtracted from the PPVT 10 score or added
to the Wechsler IO's.
There are several implications from this study. The
PPVT can be used with confidence in situations where it would
be improper o r impossible to use the WISC-P.. Such situations
would include obtaining an estimate of intelligence with
children that cannot respond verbal l y, or in situations where
the child cannot manipulate objects with his hands such as is
required on the WISC-R Performance Subtes t s . In any psycho
metric screening procedures there is not e nough ti e to give
a comple te battery of tes t s including the WISC-R so in these
cases the PPVT could be substituted with confidence a s a
measure of global 10.
On the other hand, one-third of the variance betw en t h
two variables was undefined. As a result, the PPVT a y ap
proximate the WISC-R IO's but s hould not be u s ed as a su bs t i
tute in situations where compreh nsive estimate s of intel l ec
tual functioning are required.
Further research with tnese easures is needed to deter
mine the effects of different age groups on the results. It
would be important to determine whether or not the relation
ships between the two measures remain the s m with a group
of older or young r children.
REPERE CES
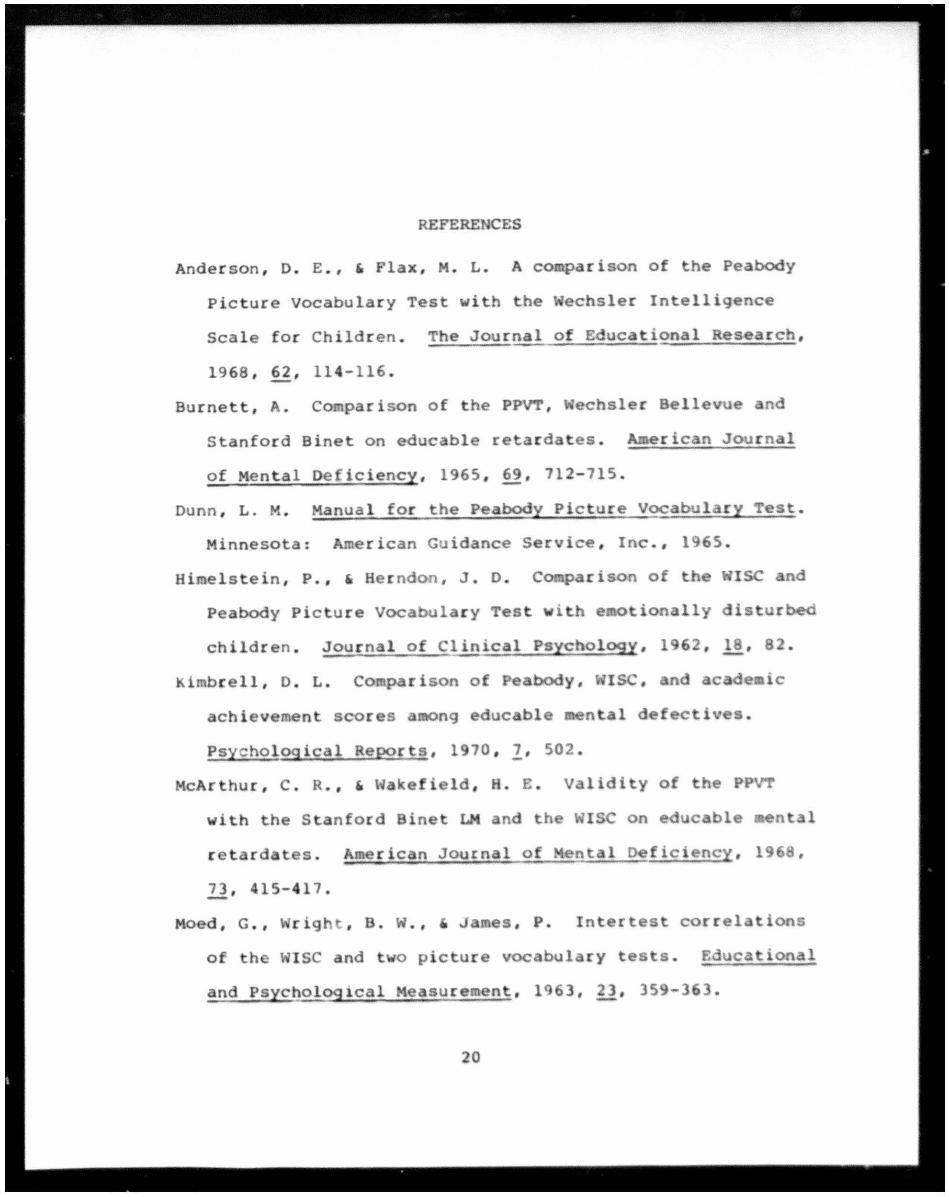
Anderson, D. E., , Flax, M. L. A co parison of the Peabody
Picture Vocabulary Test with the echsler Intellig nce
Scale for Children. The Journal of Educational Rese rch,
1968, ~, 114-116.
Burnett, eo parison of the PPVT, echsler Bellevue and
Stanford Binet on educable retardates.
of Mental Deficiency, 1965, 69, 712-715.
rican Journal
Dunn, L. M. Manual for the Peabody Picture Vocabulary Test.
Minnesota: American Guidance Service, Inc., 1965.
Himelstein, P., , Herndon, J. D. C parison of the ISC nd
Peabody Picture Vocabulary Test v i h emotionally disturbed
children. Journal of Clinic 1 PsychologY, 1962, 1-, 82.
Kimbrell, D. L. Co parison of Peabody, ISC, nd c de Ic
achievement scores mong educ ble ntal d fectiv s .
Psychological Reports, 1970, 2, 502 .
McArthur, C. R., , lakefi Id, H. E . Validity of the PPVT
with the St nford Binet LM nd the WISC on educ ble aent I
retard tes. Americ n Journal of
21, 415-417.
I Deficiency, 196 •
Moed, G., rig , B. W., ,J es, P. Intertest cor r elations
of th WISe and two picture voc bulary tests. Educational
and Psychological n , 1Q63, 23, 359-363.
20
21
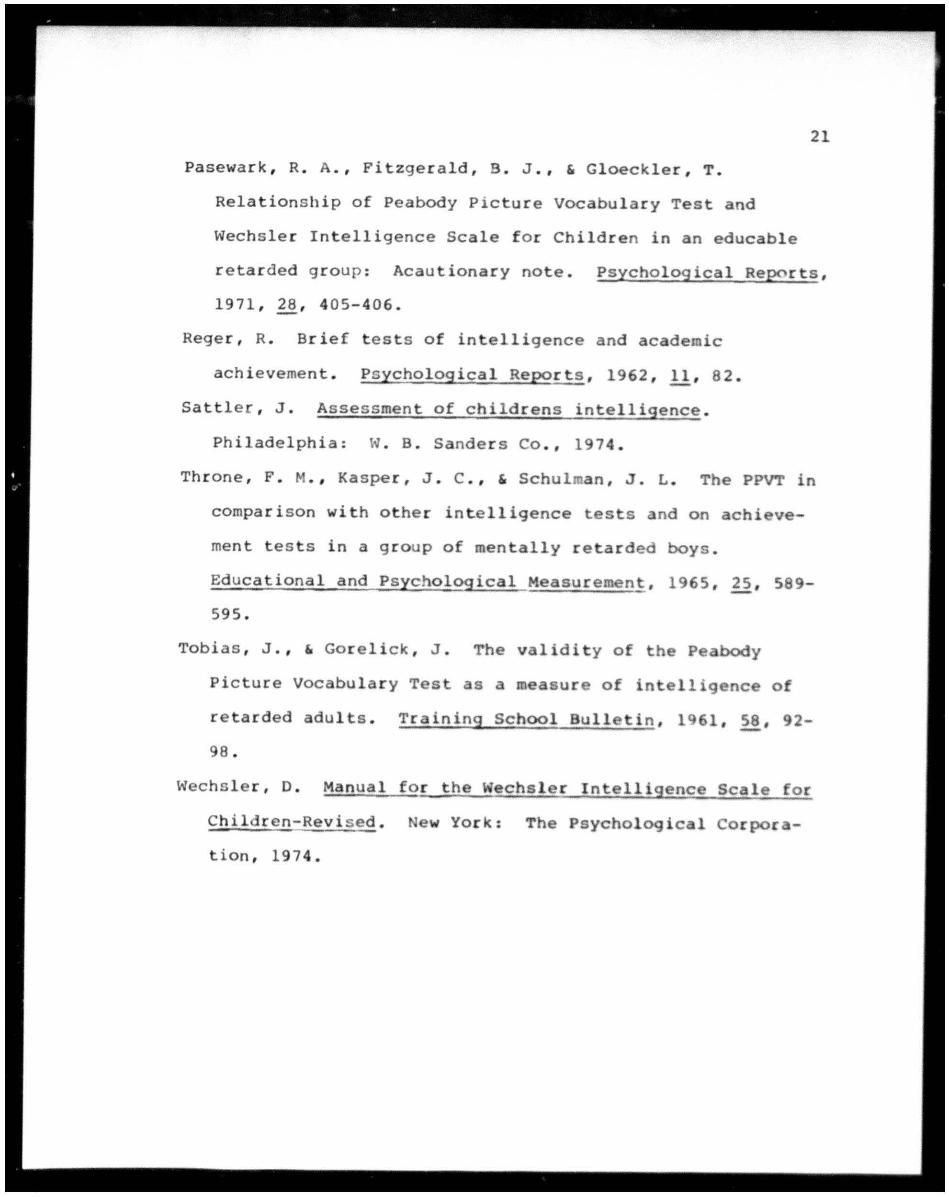
Pasewar k, R. A. , Fitzgerald, B. J ., & Gloeckler, T .
Rela t ionship of Peabody Picture Vocabulary Test and
Wechsle r In t elligence Scale for Children in an educable
retarded group: Acautionary note. Psychological Rep£rts,
1971 , 28 , 405-406 .
Reger , R. Brief tests of intelligence and academic
achievement . Psychological Repo~, 1962, 11 , 82.
Sat t ler , J. Assessment of childrens intelligence.
Philadelphia: W. B. Sanders Co., 1974 .
Th r one , F. M., Kasper, J . C., & Schulman, J. L. The PPVT in
comparison with other intelligence tests and on achieve
ment tests in a group of mentally retarded boys.
Educational and Psychological Measurement, 1965 , 25, 589-
595 .
Tobias , J. , & Gorelick, J. The validity of the Pe body
Picture Vocabulary Test as a easure of intelligence of
retarded adults . Training School Bulletin, 1961, i!, 92-
98 .
Wechsler, D. Manual for th Scale for
Ch ildren-Revi s ed . New York: The Psychological Corpora
tion , 1974.