comparisons of the navy alcohol safety action …
TRANSCRIPT
.,
, '1W-,...,....."H~'.~ .......... ; .. " ~
, 'I
.COMPARISONS OF THE NAVY" ALCOHOL 0
SAFETY ACTION PROGRAM WITH OTHER ALCOHOL REHABILITATION PROGRAMS
c
D. KOLB, P. COBEN, & E.K. E. GUNDERSON
REPORT NO. 79·58
~) NAVAL HEALTH RESEARCH CENTER· P. O. BOX 85122 ""
SAN DIEGO, CALlFORNJA 92138 '
NAVAL MEDICAL RESEARCH AND DEVELOPMENT COMMAND "~
BETHESDA, MARYLAND , ,
D
~ .. ~~-----~------'--
If you have issues viewing or accessing this file, please contact us at NCJRS.gov.

'1
Comparisons of the Navy Alcohol Safety Action Program
with Other Alcohol Rehabilitation Programs
Douglas Kolb, Patricia Coben,
and
E. K. Eric Gunderson
Report Number 79-58
NCJR'S
ACQUISlll0N!t
Research supported by the Bureau of Naval Personnel under Project Order
Number N0002278F088AFZ and the Naval Medical Research and Development Command,
Department of the Navy, under Resear;h Work Unit M0096-PN.001-1034.
The views presented in this paper are those of the authors.
No endorsement by the Department of the Navy
has been given or should be inferred.
SUMMARY
Problem
The Navy Alcohol Safety Action Program (NASAP) is directed toward the early identif~cation
of alcohol abuse among Navy personnel. Individuals in crisis situations because of drinking,
that is, arrested for drunk driving or fighting, are referred to this counseling program which is
conducted during off-duty hours. Through an educational approach the individual is made alvare of
his drinking problem and given the necessal7 help to change his destructive drinking patterns.
As a first step in evaluating the effectiveness of NASAP, a comparative study of NASAP and
other alcohol rehabilitation programs was considered useful.
Obj ectives
The objectives of the study were: (1) to compare post-treatment effectiveness for NASAP and
alcohol rehabilitation participants, (2) to determine correlates of post-treatment effectiveness
for both populations, (3) to estimate the extent of alc0holism among NASAP participants, (4) to
compare outcomes among individual NASAP facilities, and (5) to examine rates of disciplinary dif
ficulties before and after treatment for both NASAP and rehabilitation partiCipants.
Approach
The records of 3,435 Navy enlisted men admitted to NASAP in 1977 or 1978 and 5,481 men admit
ted to alcohol rehabilitation facilities during the same period were analyzed..Each of these
populations Ivas divided into younger (~ 25 years ol~) and older (:?! 26 years old) groups. All par
ticipants completed an extensive biographical questionnaire covering preservice family and social
history, schooling, military disciplinary and achievement history as well as a detailed history
of alcohol use and problems due to alcohol. From the information provided five composite vari
ables were constructed: (1) Alcoholic by Behavioral Criteria, (2) Family Alcoholism, (3) Sociop
athy, (4) Earliest Age Alcohol Problem, and (5) Family Socioeconomic Status. Post-treatment effec
tiveness was determined from Navy personnel records. Effectiveness was defined as being on active
duty or receiving a favorable discharge with no recommendation against reenlistment 6 months or
more follOlving release from rehabilitation. Noneffectiveness \Vas the receipt of an unfavorable
discharge or a favorable discharge with a negative recommendation for reenlistment more than 30
days after the completion of treatment. Analysis of variance \Vas the principal technique used
for analyzing the data.
The number of alcoholics seen in the NASAP program was estimated from responses to questions
contained in the Biographical Questionnaire and from alcohol rehabilitation records.
i
Enlisted medical and service history files maintained at the Naval Health Research Center
were utilized to compute rat~s of hospitalization for alcoholism and disciplinary occurrences
during pre- and post-treatment periods for younger men.
Re:m1ts
Among NASAP participants 88% of the younger men and 97% of the older men were effective. For
rehabilitation participants the percentages were 75% and 92%, respectively. Indicators of longev
ity and achievement in the service--age, pay grade, and years on active duty-- were associated
with effective outcome for both younger and older groups in the two populations. Younger and
older men in both programs \vho were effective reported less utilization of health care services
during the year preceding admission to treatment. Self-reported disciplinary histories were
highly discriminating for younger but not older groups. Similarly, many items covering pre
service family, school, and social history discriminated between effective and noneffective men
in one or both younger groups. In the older groups items reflecting a more stable social adjust
ment discriminated effective from noneffective rehabilitation program participants but not NASAP
participants. For all groups, except the older NASAP group, effectiveness was associated with
10lver Sociopathy scores. Alcohol use and problem histories \vere highly discriminating for both
younger groups although specific items associated ''lith effectiveness differed in each group. In
the older groups less severe alcohol problem histories discriminated effective from noneffective
rehabilitation program participants and to a lesser degree NASAP participants. In both younger
groups and in the older rehabilitation program group effective men scored lower on the Alcoholic
by Behavioral Criteria variable.
When the two effective groups in both younger and older populations were compared, NASAP par
tiCipants presented more favorable profiles than rehabilitation participants"
Many items from the areas of alcohol use and alcohol problem history discriminated betlVeen
noneffective groups for both younger and older men. All differences suggested lesser involvement
lVith alcohol for noneffective NASAP men when compared to noneffective rehabilitation participants.
Of several possible sources for estimating the extent of alcoholism among NASAP participants,
the single best indicator lVas the composite variable Alcoholic by Behavioral Criteria IVhich identi
fied 20% of the NASAP population as alcoholic.
When effectiveness rates among selected indiVidual NASAP facilities lVere determined for
younger and older groups, the differences observ€,d appeared related to differences in the popula
tions of the facilities rather than to program i~iffeY·H\1Ces.
Comparisons of younger subgroups on rates of disciplinary occurrences, promotions, and hos-
ii
I

I I I I I '
I I
I
pitalizations before and after treatment revealed higher rates of desertion and demotion after
treatment for all groups, effective and noneffective. Higher unauthorized absence rates ~lere
observed after treatment for the effective groups but not for the noneffective groups. Promotion
rates were lower for all groups after treatment, and hospitalization rates were lower for effec-
tive and noneffective rehabilitation groups.
Conclusions
1. Effectiveness rates were very high for both NASAP and rehabilitation program participants
using the relatively short follow-up period of this study; NASAP partiCipants, both younger and
older, had significantly higher effectiveness rates than other rehabilitation participants.
2. The higher effectiveness rates for NASAP participants were consistent with more favorable
population characteristics, less severe alcohol problems, and the concept of early treatment inter-
vention.
3. Post-treatment effectiveness in both types of programs was associated with more favorable
preservice histories, more positive achievements in naval serlice, and less severe alcohol use and
alcohol problem-histories.
4. One-fifth of the NASAP partiCipants were considered alcoholic by behavioral criteria and,
therefore, in need of more intensive trea1..-ment. Overall, however, the hlO types of programs
appeared to be receiving appropriate candidates for their services.
5. The rates of diSCiplinary problems among younger men generally were higher after treat-
ment than before. It is not possible to interpret these initial descriptive results, however,
until comparisons can be made with disciplinary rates for untreated controls over similar time
intervals. Such a comparison has been proposed as a future project.
Recommendations
1. The SOCiopathy Scale or an alternate scale reflecting disciplinary history should be
used to screen out younger individuals Ivho are least likely to be effective in naval service.
Such individuals should not be referred to alcohol rehabilitation programs.
2. The composite scale Alcoholic by Behavioral Criteria should be used as a scr0ening tool
to aid in appropriate referral to NASAP or other rehabilitation programs.
3. Longitudinal comparative studies of NASAP and rehabilitation program partiCipants versus
untreated controls are needed to clarify the effects of alcohol treatment on subsequent discipli-
nary history. A detailed proposal to conduct such a study has be8n submitted to the Military
Personnel Command.
iii
-I

I I I ,
I
I r
I ,
I I I I I
INTRODUCTION
Background
In late 1974 the U.S. Navy initiated the Navy Alcohol safety Action Program (NASAP). This
was another in a wide range of services aimed at personnel with alcohol problems. Since the begin-
ning of the 1970s, the Navy has provided several types of alcohol rehabilitation facilities that
provide inpatient or outpatient treatment for alcoholics and alcohol abusers, depending on their
needs. NASAP is directed toward individuals who demonstrate incipient alcohol abuse problems.
Through an Hafter hours!! educational program extending over 6 weeks for several hours each week,
it strives to help individuals become aware of their drinking patterns and encourages more respon-
sible alcohol use behaVior. One major source of identifying candidates for NASAP is arrest for
drunk driving by civilian authorities. HOIvever, men picked up by civilian or military police for
other offenses committed or difficulties encountered while drinking also may be referred as may
any individual believed to be in need of such services by superior officers.
Objective
The objectives of this study are: (1) to compare post-treatment effectiveness of NASAP par-
ticipants and participants in other Navy alcohol rehabilitation programs, (2) to determine corre
lates of post-treatment effectiveness for both populations, (3) to evaluate severity of alcohol
involvement (alcoholism) among NASAP partiCipants, (4) to compare post-treatment outcomes among
individual NASAP facilities, and (5) to examine rates of disciplinary difficulties pre- and post-
treat~ent for NASAP and rehabilitation partiCipants.
METHOD
Samples
Navy enlisted men with a first admission to NASAP or alcohol rehabilitation facilities in
1977 or 1978 l'Iere included in the study. Each of these populations Ivas divided into a Younger
group, 25 years old or younger, and an Older group, 26 years old or older. These divisions
resulted in groups of 2,347 younger and 1,088 older NASAP participants (total N = 3,435) and 3,227
younger and 2,254 older alcohol rehabilitation participants (total N = 5,481).
Procedure
As part of the intake procedure in both NASAP and rehabilitation programs, participants com-
pleted an extensive biographical questionnaire which provided information about pre-service fam-
ily history, school and community adjustment, in-service disciplinary and achievement history as
l'Iell as a history of alcohol use and problems encountered due to alcohol. From the information
provided five composite variables Here created. They were deSignated: (1) Alcoholic by Behavioral
1

Cri'teria, (2) Family Alcoholism, (3) Sociopathy, (4) Earliest Age Alcohol Problem, and (5) Family
Socioeconomic Status. The items used for each of these variables and the computation methods have
been given in a previous report (1).
Post-treatment effectiveness \~as determined from official Navy personnel records indicating
the active duty or discharge status of each individual as of 31 Harch 1979. An individual \'~as
considered effective if he \~as on active duty or had received a favorable discharge and did not
have a recommendation against reenlistment at least 6 months after completing treatment. He was
considered noneffective if he received an unfavorable discharge or a negative recommendation for
reenlistment at the time of discharge any time more than 30 days after release from treatment.
Four groups were compared using one-way analysis of Variance: Younger and Older NASAP par-
ticipants and Younger and Older rehabilitation participants. For items that yielded significant I I ratios, post hoc Scheffe ! tests were computed for the following group comparisons in both
younger and older populations: (1) effective vs. noneffective groups, (2) effective NASAP vs. ,..,
effective rehabilitation groups, and (3) noneffective NASAP vs. noneffective rehabilitation
groups.
Records of disciplinary offenses (unauthorized absences, desertions, and demotions) and
records of promotions were obtained from the Naval Health Research Center Enlisted Service His-
tory file for each participant before and after treatment. Similarly, hospital admissions with
primary diagnoses of alcoholism were extracted from medical history files. Pre- and post-
treatment disciplinary and hospitalization rate~ were computed by multiplying frequencies of
occurrence in each time period by 1,000 and dividing by the number of months (plus one-half month)
served before and after treatment. Rates were computed for four younger groups: effective NASAP,
noneffective NASAP, effective rehabilitation program, and noneffective rehabilitation program par-
ticipants. Analysis of variance was used to test for significance of differences among the four
groups. Where signifi.cant ,K ratios w,ere obtained, post hoc comparisons between pairs of groups I
were made using the Scheffe ! test. A similar analysis was not conducted for older participants
because of incomplete disciplinary and hospitalization records for individuals with more than 12
years of service. Pre-treatment disciplinary and hospitalization rates were compared with post-
treatment rates for each of the four subgroups of younge:.:' men using! tests.
RESULTS
Post-Treatment Effectiveness
Large percentages of both younger and older men in both types of programs were effective
following treatment by the criteria established. Among the younger NASAP participants, 88% were
2
-------------------------------------------------------------------------------------------------------------------~
on active duty or had been discharged under favorable circumstances 6 months or more after com~
pleting treatment; older NASAP men had a 97% effectiveness rate. For the men treated in rehabili-
tation facilities, 75% of the younger men and 92% of the older men were effective.
These differences in post-effectiveness rate between NASAP participants ano other rehabili
tation p:r:ogram participants were highly significant for both younger and older populations (J? <
.001). It should be noted that the effectiveness rates reported here were higher than those
reported in previous studies; this was largely because of the shorter follow-up period used.
Effective-Noneffective Group Comparisons for Younger Men
Effective men differed from noneffective men in both NASAP and alcohol rehabilitation pro-
grams on nearly all biographical items reflecting demography, pre-service history, and military
status and experience. These results are summarized in the first two columns of Table 1. Mean
values for all variables that showed significant differences among younger effective and noneffec-
tive groups in NASAP and alcohol rehabilitation programs are shown in the first part of Appendix A.
Effeci.:ive men were older, had longer service, and had achieved higher pay grades than noneffec-
tive men. Effective men had higher General Classification and Arithmetic Test scores and expressed
more satisfaction with their Navy occupations than noneffective men.
During the year preceding admission to NASAP or alcohol rehabilitation programs, effective
men had reported to sick call less often and had been hospitalized less frequently than noneffec-
tive men. Of those hospitalized, effective men lost fewer days from duty than noneffective men.
For every item reflecting past disciplinary problems--times on report, captain's masts,
courts-martial, times in the brig--the effective groups reported fewer occurrences. Effective
men also less often reported disciplinary action pending at the time of admission to treatment.
Pre-service family and social history discriminated between effective and noneffective men
in both programs. Both effective groups reported more favorable school adjustment than did non-
effective groups, completing more years of schooling and reporting fewer suspensions or expulsions,
courses failed, and times played hooky. Effective NASAP participants also indicated less often
being set back a grade.
A number of items reflecting delinquent behavior discriminated between groups. Effective
men in both groups reported running away from home prior to age 15 less often and spending less
time in jail. Effective NASAP men reported fewer arrests for offenses committed prior to age 16,
arrests for dis demeanors committed since age 16, and adult felony arrests. Effective NASAP par-
ticipants also less often reported having been treated by mental health workers. Effective reha-
bilitation program participants less often had wandered from place to place without a job and had
3

Table J.
Significant Differences between Groups for Younger Populationa
Effective vs. Noneffective Group Comparisons
Demography and Hilitary History:
Age Is the service your career~ Years on active duty Present pay grade Highest pay grade held Times reduced in pay grade Satisfied with specialty What is GCT/ARI score? Hilitary honors Times at siel. call during past year Times hospitalized during past year Total days hospitalized during past year Times on report Captain's masts Times court-martialed Times in the brig Disciplinary action pending? Times dropped from service school
Pre-Service Family and Social History:
Years of schooling Times suspended or expelled Times set back a grade Number of courses failed Hoving traffic violations during past three years Times played hooky Times ran away before age 15 Arrest record prior to age 16 Arrest record for misdemeanor since age 16 Adult arrest record for felony since age 16 Longest time in civilian jail Wandered, no job Times used alias Treated by mental health worker before service Composite variable - Sociopathy Until 18th birthday, number of years raised by:
Real (biologiC) £ather Real (biologic) mother Foster, step-, or adoptive father Foster, step-, or adoptive mother
Father's education Number of close relatives treated in mental hospital Number treated who returned to normal self Number of close relatives seen by mental health worker Number of close relatives convicted of felony Number of close relatives depressed Number of close relatives v"ith drug problems Total number of relatives 'with any of above problems Parents argue or fight Father's attitude toward alcohol Mother's attitude toward alcohol Home broken Importance of religion in childhood Composite variable - FamHy Alcohol History Composite variable - Socioeconomic Status Single vs. other marital status Times married Number of daughters
Alcohol Use and Problem History:
Age \qhen you first drank Trouble in school due to alcohol Number of cups of coffee per day Hissed time on job because of drinking
~
5.06 --3.60
3.96 11.86
8.79 - 7.83
7.66 2.99 3.10
- 6.65 - 3.85 - 3.57 -11.84 - 9.78 - 4.62 - 5.45
5.46
6.50 - 6.57 - 3.40 - 3.81
- 5.55 - 5.17 - 4.69
- 3.37 - 6.45
- 3.47 - 6.45
3.03 b 133
- 3.63
3.15 3.87
Alcohol Rehabilitation
6.89 - 4.01
5.59 14.10 10.19
-10.22 5.76 4.30
- 4.94 - 3.40 - 5.12 -11.35 -10.53 - 6.31 - 7.09
3.96
4.83 - 5.40
- 4.07
- 4.49 - 4.38
- 3.86
- 5.88 - 4.62
- 7.13
- 4.25
- 3.59
3.29
- 3.68 - 3.27
- 3.32 3.02
2.87
Effective Group
Comparisons
- 3.33
5.50 3.01
- 7.04 5.92
- 7.89 - 5.61 - 5.02 -12.18 - 9.92
- 3.00
- 4.61
6.13 - 6.28 - 3.38 - 3,93
3.84 - 7.31 - 5.12 - 5.60 - 5.78 - 3.59 - 3.55 - 4.83 - 5.13 - 6.02 -15.43
4.46 3.13
- 2.87 - 3.07
3.21 2.96
- 2.81 - 6.38 - 3.91 - 6.81
3.92 - 7.04 - 8.07 - 5.78 - 4.04 - 4.37 - 3.13 - 6,82
3.19
2.90
8.01 9.90
-10.12 -21. 83
aScheff~ t-test. All values are significant (£ < .05). individual items are given in Appendix A.
Score ranges, codes, and group mea\lS for
4
Noneffective Group
Comparisons
- 3.84
- 4.86
2.93
- 3.59
- 2.79
- 2.92 - 5.39

Alcohol Use and Problem Hi~tory: (continued)
Demoted because of drinking UA because of drinking Auto accident because of drinking Age had auto accident Picked up for drunk driving Age pickeu up for drunk driving Disciplinary action because of drinking Age disciplinary action Separated or divorced because of drinking Age separated or divorced Hospitalized because of drinking Age hospitalized Doctor told you to stop drinking Tried to stop drinking Age tried to stop Had ddnking problem Years had drinking problem Participated in Alcoholics Anonymous Number of months participated in AA Abstained from drinking Number of months abstained Shakes the "morning after" Number of times had shakes Hallucinations Convu1sions Vomited blood Blackouts Number of blackout,,; Liver problems SaN doctor to help stop drinldng Until 25th birthday, ho\~ bad \~as hangover Past 3 years, hO\~ bad Nas hangover Number of drinks in 24 hours Type of alcohol Desire to see psychiatrist Treated before in ARC, ARU, or ARD Discharge prognosis Self-referral vs. other Composite variable - Alcoholic by Behavioral Criteria Composite va:tiable - Age Najar Problem
5
Effective vs. Noneffecti.ve GrauE ComEarisons
Alcohol ~ Rehabilitation
- 3.22 - 7.04 - 6.07 - 3.75
2.81 5.27 4.77 3.25
- 4.35 - 4.36 3.17
4.03 - 2.99
- 4.12 - 3.89
4.31 - 5,87
- 3.01
- 3.90
- 4.65 - 5.11
- 2.92 - 3.84
- 4.43 - 3,24
3.80 4.30 - 3.73 - 5.47 - 9.56
- 4.67 - 6.49
Effective Noneffective Group Group
COlUearisons Comearisons
- 9.89 - 5.44 -13.24 - 8.67
15.42 7.92
-16.06 - 5.51
- 8.53
-11. 63 - 3.84 - 4.27 -12.33 - 5.64 -26.34 - 7.87
-34.84 - 9.07 - 7.71 -23.57 - 9.64
5.56 4.38 -25.26 7.42
6.89 3.01 -19.04 - 5.39 - 5.97 - 8.87 - 3.81 - 5.88 - 8.62 - 4.09 -22.00 - 4.84 -11.9'1 - 4.12 - 3.46 - 3.26 -19.86 - 5.44 -10.18 - 3.42 -10.81 -19.99 - 3.73 - 6.14 - 2.91 10.25 3.46
- 2.95 -21. 26 - 7.55 -12.32 -14.62 - 5.94
3.03
L, _____ _

---------------------------------------------------------------------------------------------------
fewer arrests for misdemeanors committed since age 16 than did noneffective men. On the derived
variable) Sociopathy (a composite score from delinquency items), effective men in both groups
scored significantly lower than noneffective men.
A num"ber of items indicative of the emotional stability and mental health of participants!
families discriminated between effective and noneffective groups. Effective NASAP participants
spent more of their lives until their 18th birthdays with their natural parents; further, they
reported that felver close relatives had suffered periods of severe depression. Effective rehabil
itation program participants reported that fewer close relatives Ivere treated in mental hospitals,
fe\Ver had seen a mental hi':lalth \Vorker for a nervous problem, and felver had drug problems than did
noneffective men. Furthermore, effective men scored Significantly 10\Ver on the derived family
alcohol history variable (a composite of family alcohol involvement items); they also reported
that religion \Vas more important to them during childhood than noneffective men, and they were
more often married.
Histories of alcohol use and problems associated lVith alcohol use discriminated bet\Veen effec
tive and noneffective men in both types of programs. Both effective NASAP and rehabilitation pro
gram participants had begun drinking at a later age than noneffective men, and felVer had experi
enced major diSCiplinary difficulties--unauthorized absence, demotions, and other diSCiplinary
problems--because of alcohol. Also, effective men in both groups IVho were arrested for drunk
driving were older when first arrested.
Many additional items discriminated for one group but not for both. For NASAP participants,
noneffective men more often indicated having had trouble in school due to drinking, being hospi
talized because of alcohol, having an alcohol problem, trying to stop drinking, and seeking help
from a doctor to stop drinking; more of them reported having had shakes the morning after and
blackouts than did effective men. On the other hand, effective NASAP partiCipants more often
indicated that they had been arrested for drunk driving and reported being older when they had a
first auto accident because of drinking.
For rehabilitation program partiCipants, the earliest ages at which problem behaviors due to
alcohol occurred \Vere as discriminating as \Vhether the behaviors occurred at all. Effective men
were older \Vhen they first had a disciplinary problem, \Vere separated or divorced, or tried to
stop drinking. Tney had less often been told by a doctor to stop drinking, and fewer of them
reported experiencing severe physical symptoms, such as hallucinations and vomiting blood, than
did noneffective men.
The amount of alcohol consumed discriminated effective from noneffective NASAP participants
6

I I
l
------------------------------------------------------------
whereas the type of alcohol consumed was discriminating forrehabilitation program participants.
Effective NASAP men reported 100ver total consumption during a 24-hour period than noneffective
men; effective rehabilitation program men reported drinking more beer or wine as opposed to hard
liquor. In both groups noneffective men more often expressed the desire to see a psychiatrist.
Pdor treatment in an alcohol rehabilitation facility discriminated between effective and
noneffective groups for NASAP participants but not rehabilitation program participants. Effective
men in both NASAP and rehabilitation programs scored 100ver on the derived variable Alcoholic by
Behavioral Criteria (a composite of several items reflecting severity of problems associated l.;ith
alcohol use) and received better prognostic ratings by counselors at the completion of treatment.
Comparisons betlveen Effeotive Groups for Younger Hen
Comparisons between effective NASAP and effective rehabilitation program groups yielded
results very similar to the effective versus noneffective comparisons for the t\vO populations.
That is, effective NASAP participants consistently had more favorable characteristics on many of
the biographical items than effective rehabilitation program partiCipants (see third colum!'! of
Table 1).
Effective NASAP men were slightly younger than effective rehabilitation participants, and,
although there Ivas no difference in length of service between the groups, the NASAP group had
achieved a higher mean pay grade at the time of entering treatment. The General Classification/
Arithmetic Test scores did not discriminate between the groups indicating that they started ser-
vice with equal potential by that measure. A higher mean score on the derived variable Socioeco-
nomic Status (based upon father's and mother's schooling and father's occupation) was noted for
the effective NASAP group, again suggesting a more favorable home environment for this group.
L~rge differences were noted on many of the items reflecting involvement with alcohol and
problems associated with its use. Effective NASAP participants generally indicated that alcohol
was less of a problem for them. An exception was the item "picked up for drunk driving" Ivhich
was reported more frequently and at a later age by NASAP partiCipants. Two items concerned Ivith
efforts to control drinking discriminated between the effective groups but had not differentiated
between effective and noneffective men in either the NASAP or rehabilitation programs. These
items Ivere: "Ever participated in Alcoholics Anonymous" and nEver abstained from drinking"; both
were responded to more of~en affirmatively by effective NASAP men. Further, the number of months
spent in these activities was greater for the effective NASAP group. The effective NASAP group
less often repOl:ted that they were self-referred for treatment.
7
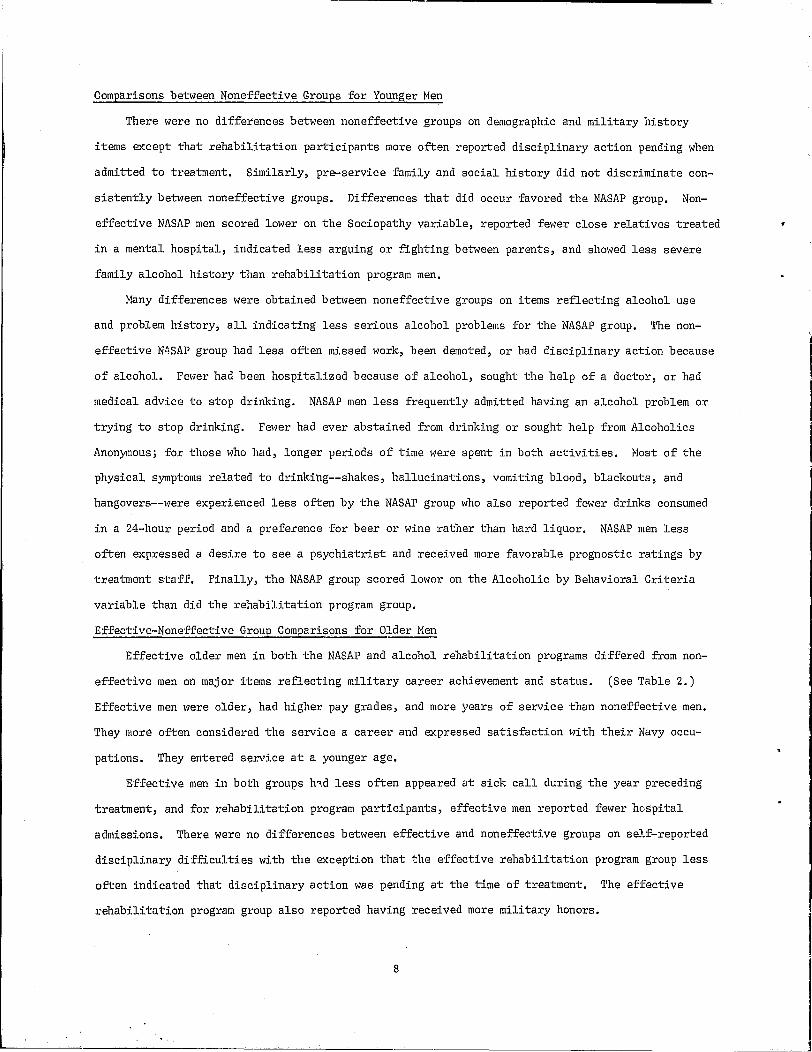
Comparisons between Noneffective Groups for Younger Men
There were no differences between noneffective groups on demographic and military history
items except that rehabilitation participants more often reported disciplinary action pending when
admitted to treatment. Similarly, pre-service family and social history did not discriminate con
sistently between noneffective groups. Differences that did occur favored the NASAP group. Non
effective NASAP men scored lower on the Sociopathy variable, reported fewer close relatives treated
in a mental hospital, indicated less arguing or fighting between parents, and showed less severe
family alcohol history than rehabilitation program men.
Many differences were obtained between noneffective groups on items reflecting alcohol use
and problem history, all indicating less serious alcohol problems for the NASAP group. The non
effective N4SAP group had less often missed I'lork, been demoted, or had disciplinary action because
of alcohol. Fewer had been hospitalized because of alcohol, sought the help of a doctor, or had
medical advice to stop drinking. NASAP men less frequently admitted having an alcohol problem or
trying to stop drinking. Fewer had ever abstained from drinking or sought help from Alcoholics
Anonymous; for those who had, longer periods of time were spent in both activities. Most of the
physical symptoms related to drinking--shakes, hallucinations, vomiting blood, blackouts, and
hangovers--were experienced less often by the NASAP group who also reported fewer drinks consumed
in a 24-hour period and a preference for beer or wine rather than hard liquor. NASAP men less
of~en expressed a desire to see a psychiatrist and received more favorable prognostic ratings by
trea1.1nent staff. Finally, the NASAP group scored lONer on the Alcoholic by Behavioral Criteria
variable than did the rehabilitation program group.
Effective-Noneffective Group Comparisons for Older Men
Effective older men in both the NASAP and alcohol rehabilitation programs differed from non
effective men on major items reflecting military career achievement and status. (See Table 2.)
Effective men Nere older, had higher pay grades, and more years of service than noneffective men.
They more often considered the service a career and expressed satisfaction \Vith their Navy occu
pations. They entered service at a younger age.
Effective men in both groups h,d less often appeared at sick call during the year preceding
treatment, and for rehabilitation program partiCipants, effective men reported fewer hospital
admissions. There I'lere no differences between effective and noneffective groups on self-reported
disciplinary difficulties with the exception that the effective rehabilitation program group less
often indicated that disciplinary action \Vas pending at the time of treatment. The effective
rehabilitation program group also reported having received more military honors.
8

Table 2
Significant Differences beb~een Groups for Older Populationa
Effective vs. Noneffective Group Comparisons
Demography and Hilitary History:
Age Is service your career Years on active duty Present pay grade Age entered service Highest pay grade held Times reduced in pay grade Satisfied with specialty Nilitary honors Times at sick call during past year Times hospitalized during past year Total days hospitalized during past year Times put on report Captain's masts Disciplinary action pending Seasick IVhen ocean calm
Preservice Family and Social History:
Years of schooling Times suspended or expelled Times set back a grade Number of courses failed Time held full-time job Hoving traffic violations past three years Times ran alvay before age 15 Times played hooky Arrest record for misdemeanor since age 16 Adult arrest record for felony since age 16 Longest time in civilian jail \~andered, no job Treated by a mental health Ivorker before service Number of close relatives in mental hospital Number of close relatives seen mental health Ivorker Number of close relatives convicted of felony Number of close relatives depressed Number of close relatives Ivith drug problems Total number of relatives Ivith any of the above problems Parents argue or fight Father's attitude toward alcohol Nother's attitude to\vard alcohol Importance of religion in childhood Times attended church Composite variable - Family Alcohol History Composite variable - Sociopathy
Narital [. ;atus:
Single vs. other marital states Times married Number of daughters Present Idfe have a drinking problem Spouse's income
~lcohol Use and Problem History:
Age Ivhen first drank Trouble in school due to rlcohol Number of cups of coffee per day Hissed time on job because of drinking Demoted because of drinking UA because of drinking Auto accident because of drinking Age had auto accident
NASAP
4.31 - 4.11
6.08 8.50
- 3,49 7.17
- 3.58 4.38
- 3.54
'c' -- 2.82
- 6.50
- 3.60 2.85
- 3.56
Alcohol Rehabilitation
7.20 -14.35
12.90 15.33
- 3.56 12.59
8.16 3.65
- 3.29 - 5.48
3.45
- 2.88
- 4.93 - 3.88
- 2.91
- 3.55 - 8.54 - 3.90
- 3.56
- 4.84
- 5.98 3.76 3.70
5.13
3.63 3.31
- 4.43
- 5.87
4.50
Effective Group
Comparisons
3.61
- 5.51 7.30
- 6.08 - 6.42 - 5.98
6.24 - 6.09
3.60 - 5.34 - 3.28 - 4.72
4.90
- 7.14 - 5.37 - 3.84
- 3.62 - 4.19 - 4.74 - 2.94 - 5.87 - 4.10 - 6.70 - 6.82 - 6.15 - 2.96 - 5.90 - 2.87 - 6.39 - 6.97
2.86
8.31 4.15
- 4.09 -16.84 - 7.78 - 9.53 - 9.31
5.06
Noneffective Group
Comparisons
4.43
aScheff~ t-test. All values are significant (£ < .05). Score ranges, codes, and group means for individual items are given in Appendix A.
9
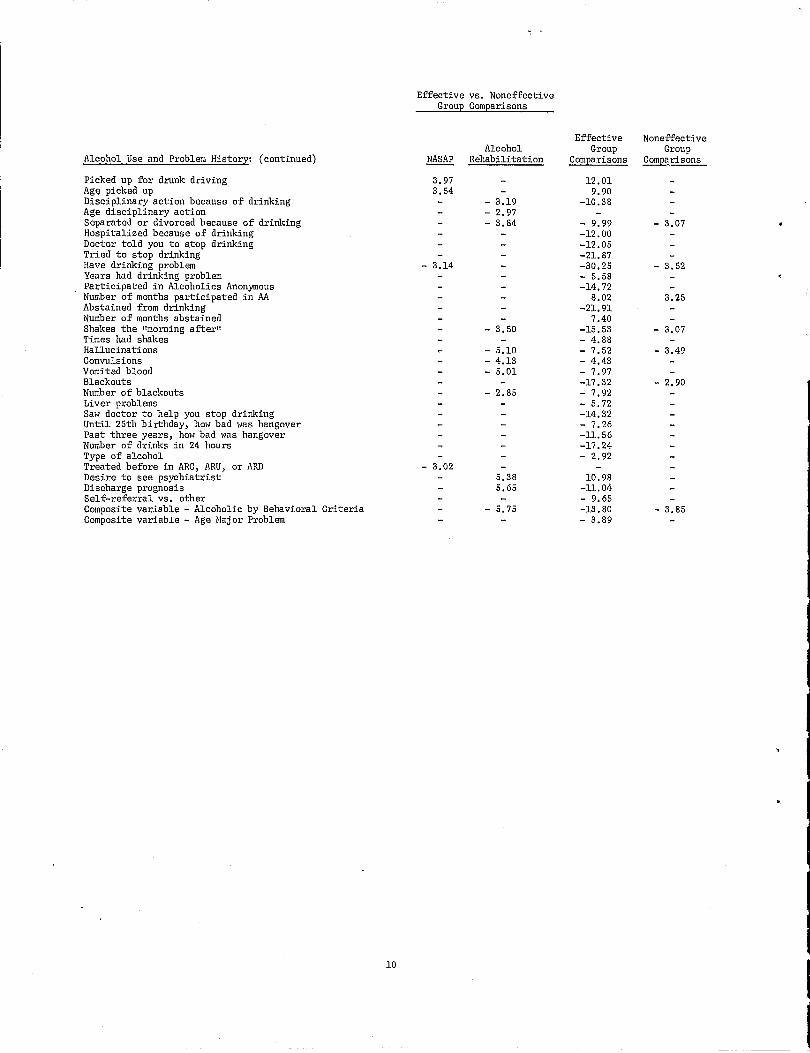
Alcohol Use and Problem History: (continued)
Picked up for drunk driving Age picked up Disciplinary action because of drinking Age disciplinary action Separated or divorced because of drinking Hospitalized because of drinking Doctor told you to stop drinking Tried to stop drinking Have drinking problem Years had drinking problem PartiCipated in Alcoholics Anonymous Number of months participated in AA Abstained from drinking Number of months abstained Shakes the "morning after" Times had shakes Hallucinations Convulsions Vomited blood Blackouts Number of blackouts Liver problems Saw doctor to help you stop drinking Until 25th birthday, hO\~ bad \~as hangover Past three years, how bad was hangover Number of drinks in 24 hours Type of alcohol Treated before in ARC, ARU, or ARD Desire to see psychiatrist Discharge prognosis Self-referral vs. other Composite variable - Alcoholic by Behavioral Criteria Composite variabLe - Age Hajor Problem
10
Effective vs. Noneffective Group Comparisons
Effective Noneffective Alcohol Group Group
~ Rehabilitation Comparisons Comparisons
3.97 12.01 3.54 9.90
- 3.19 -10.38 - 2.97 - 3.84 - 9.99 - 3.07
-12.00 -12.05 -21. 87
- 3.14 -30.25 - 3.52 - 5.58 -14.72
8.02 3.25 -21. 91
7.40 - 3.50 -15.53 - 3.07
- 4.88 - 5.10 - 7.52 - 3.49 - 4.13 - 4.43 - 5.01 - 7.97
-17.32 - 2.90 - 2.85 - 7.92
- 5.72 -14.32 - 7.26 -11.56 -17.24 - 2.92
- 3.02 5.38 10.98 5.65 -11. 04
- 9.65 - 5.75 -13.80 - 3.85
- 3.89

--------------------------------------------------------
Preservice family and social history was essentially nondiscriminating for older NASAP men,
The single exception was that noneffective men reported more often running away from home prior to
age 15, The noneffective rehabilitation program group differed from the effective group on a num
ber of items, all suggesting a less stable social adjustment. They had completed fewer years of
schooling and had held full time jobs for shorter periods before entering service. The noneffec
tive group had more moving traffic violations during the preceding 3-year period, more arrests for
misdemeanors since age 16, and more time in civilian jails. Prior to entering service they had
spent more time wandering from place to place without a job and had more frequently been treated
by a mental health worker. They scored higher on the Sociopathy variable and reported that more
of their close relatives had experienced periods of severe depression than the effective group.
Effective men in both groups were more likely to have married than noneffective men. Effec
tive men in the rehabilitation program reported having more daughters than noneffective men, and,
when their wives worked, the wives earned less than the men,
Items reflecting alcohol use and history were much more discriminating for the rehabilitation
program partiCipants than for the NASAP group. Effective NASAP men had less often missed time on
the job because of alcohol but had been picked up more frequently for drunk driving than noneffec
tive men, and they were older when they had their first drunk driving charges. They less often
believed that they had an alcohol problem and less frequently reported prior treatment for alco
holism than noneffective men. Effective rehabilitation program men reported less trouble in
school, less lost time on the job, fewer unauthorized absences, and fewer separations or divorces
because of drinking than the noneffective group. They were older at the time of their first auto
accident but younger when first disciplined because of alcohol. Effective men drank more cups of
coffee per day and experienced fewer symptoms of alcohol abuse such as shakes the morning after,
hallucinations, convulsions, and vomiting blood. Effective rehabilitation program participants
less often desired to see a psychiatrist, received more favorable prognostic ratings from coun
selors, and scored lower on the Alcoholism by Behavioral Criteria score than noneffective partic~
pants.
Comparisons between Effective Groups for Older Men
Differences between effective NASAP and rehabilitation program groups revealed a more posi
tive service record for NASAP participants. Although men in both groups were of comparable age
and length of service, effective NASAP participants reported higher pay grades, fewer reductions
in pay grade, and fewer times on report and at captain!s masts; they also expressed more satis
faction with their Navy occupations. On all three indicators of the use of medical services--
11
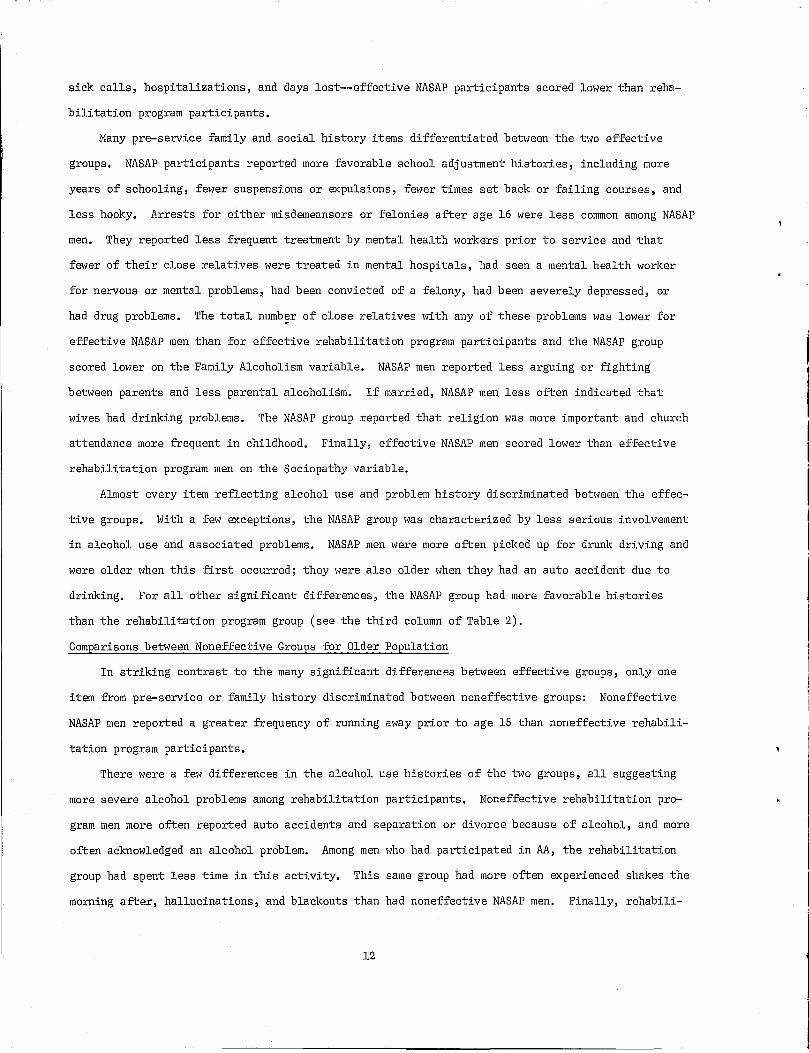
sick calls, hospitalizations, and days lost--effective NASAP participants scored lOlVer than reha
bilitation program participants.
Many pre-service family and social history items differentiated bebveen the tlvO effective
groups. NASAP participants reported more favorable school adjustment histories, including more
years of schooling, felVer suspensions or expulsions, felVer times set back or failing courses, and
less hooky. Arrests for either misdemeansors or felonies after age 16 lVere less common among NASAP
men. They reported less frequent treatment by mental health lVorkers prior to service and that
f~ver of their close relatives lVere treated in mental hospitals, had seen a mental health lVorker
for nervous or mental problems, had been convicted of a felony, had been severely depressed, or
had drug problems. The total number of close relatives lVith any of these problems Ivas 10lver for
effective NASAP men than for effective rehabilitation program pal~icipants and the NASAP group
scored lOlVer on the Family Alcoholism variable. NASAP men reported less arguing or fighting
betlveen parents and less parental alcoholism. If married, NASAP men less often indicated that
lVives had drinking problems. The NASAP group reported that religion lVas more important and church
attendance more frequent in childhood. Finally, effective NASAP men scored lOlVer than effective
rehabilitation program men on the Sociopathy variable.
Almost every item reflecting alcohol use and problem history discriminated betlVeen the effec
tive groups. I-Jith a few exceptions, the NASAP group was characterized by less serious involvement
in alcohol use and associated problems. NASAP men lVere more often picked up for drunk driving and
lVere older IVhen this first occurred; they were also older when they had an auto accident due to
drinking. For all other significant differences, the NASAP group had more favorable histories
than the rehabilitation program group (see the third column of Table 2).
Comparisons between Noneffective Groups for Older Population
In striking contrast to the many significant differences between effective groups, only one
item from pre-service or family history discriminated between noneffective groups: Noneffective
NASAP men reported a greater frequency of running away prior to age 15 than noneffective rehabili
tation program participants.
There were a few differences in the alcohol use histories of the two groups, all suggesting
more severe alcohol problems among rehabilitation participants. Noneffective rehabilitation pro
gram men more often reported auto accidents and separation or divorce because of alcohol, and morn
often acknowledged an alcohol problem. Among men who had participated in AA, the rehabilitation
group had spent less time in this activity. This same group had more of~en experienced shakes the
morning after, hallucinations, and blackouts than had noneffective NASAP men. Finally, rehabili-
12

I I
tation group participants scored higher on the Alcoholic by Behavioral Criteria variable (indicat
ing more severe alcohol problems) than NASAP participants.
Estimation of Alcoholism Incidence among Men Admitted to NASAP
The data available on men admitted to NASAP did not include specif-ic diagnoses of alcoholism.
However, information provided by participam;s and rehabilitation records make possible reasonable
estimates. The specific sources included: Alcoholic by Behavioral Criteria derived from responses
to the biographical questionnaire; a positive response to the question "Have you ever been treated
before in an ARC, ARU, or ARD?1t; a counselor recommending transfer to alcohol rehabilitation upon
release from NASAP or a record of admission to a rehabilitation facility during the 2-year study
period. Of the NASAP participants, 32% met one or more of these four criteria, indicating more
serious problems with alcohol abuse. The best indicator \~as Alcoholic by Behavioral Criteria
which, either singly or in combination \~ith one or more of the other three criteria, identified
20% of the total population as alcoholi~s.
Differences in Post-Treatment Effectiveness among Individual NASAP Facilities for Younger Men
Differences in post-treatment effectiveness \~ere determined for younger men treated in three
of the larger NASAP programs. There were no differences in post-treatment effectiveness for
groups -treated in the smaller programs; further, there were minimal differences among the groups
on items pertaining to family, service, or alcohol use histories prior to treatment. Among the
larger programs, one, designated Group 3, had a 16~6 noneffectiveness rate which was significantly
greater than the 7% rates obtained for each of the other t\~O programs. The items which discrimi-
nated among the groups are shOlm in Table 3. Groups 2 and 3 showed the most differences. Means
for age, pay grade, and years of service were higher for Grollp 2 than Group 3. Additionally,
Group 2 partiCipants were more satisfied with their Navy job specialties and had more favorable
diSCiplinary histories as reflected in lower rates of captain's masts and times on report. Men
in Group 2 had reported to sick call less often and had been hospitalized less frequently than
men in Group 3 during the year preceding cdmission to treatment. Total days in the hospital also
were less for Group 2. Men in Group 2 had been dropped from service schools less often and Here
less likely to have disciplinary actions penuing ~t the time of admission to treatment.
Differences were less evident between Groups 1 and 3 on demographiC and military history
items. Mean age and years of service were comparable for the Uvo groups; however, Group 1 men
had higher pay grades than Group 3. There were n~ differences between Groups 1 and 3 on self
reported disciplinary histories, but Group 1 less ',ften reported disciplinary action pending when
admitted to treatment. Group 1 participants had been dropped from service schools less frequently
13
L _____ ~~~ __ 1

Table 3
Differences among Younger Populations in Three Large NASAP Programs
Progra!l\;3
1 2 3 Group Comparisonsa
Demographl and Hilitarl Historl: Nean ~ Nean F ~ ~ ~ Age 20.92 21.46 20.86 14.95 - 4.25 5.00 Years on active duty .53 .62 .43 8.12 4.03 Present pay grade 3.24 3.50 3.00 26.43 - 3.60 3.19 7.26 Highest pay grade held 3.36 3.58 3.11 23.54 - 2.98 3.41 6.86 Are you a designated striker .83 .95 .80 4.53 2.88 Satisfied with specialty 2.56 2.84 2.36 19.50 - 3.39 6.22 Nilitary honors .63 .79 ;>46 8.82 4.20 Times at sick call during past year 2.85 2.71 3.56 16.22 - 4.18 - 5.39 Time,S hospitalized during past year .57 .41 .74 9.58 - 4.38 Total days hospitalized durIng past year .73 .62 .94 6.15 - 3.46 Times on report 1.98 1.48 2.28 16.96 3.36 - 5.77 Captain's masts 1.07 .82 1.11 6.02 2.62 - 3.22 Disciplinary action pending .74 .74 .63 9.63 3.72 3.82 Ever eKtremely seasick .16 .21 .25 5.29 - 3.25 Seasick when ocean calm .03 .04 .08 7.60 - 3.40 - 3.29 Tim~s dropped from sel~ice school .10 .10 .19 9.06 - 3.61 - 3.70
Preservice Famill and Social Historl:
Years of schooling 3.73 3.88 3.56 12.72 2.54 5.04 High school equivalency test 1.54 1.56 1.33 12.52 3.83 4.67 Times suspended or eKpelled 1.17 .86 1.40 10.17 - 4.49 Times set back a grade .38 .26 .37 6.74 3.10 - 3.17 Number of courses failed 1.08 .89 1.16 4.26 - 2.83 Average grades in high school 1.70 1. 78 1. 86 6.20 - 3.50 Athletic honors 1.31 1.38 1.02 4.65 2.90 Time held full-time job 3.,30 3.68 3.47 3.00 Hoving traffic violation!; past 3 years 1.87 2.24 1.96 5.42 - 3.05 2.50 Times ran away before age 15 .30 .28 .43 3.23 Times played hooky 2.43 2.05 2.57 8.65 2.74 - 4.04 Arrest record for misdemeanor since age 16 .59 .59 .74 3.37 Ever in reform school .93 .87 .87 4.79 :.7f, 2.71 Wandered, no job .21 .12 .24 4.24 - 2.82 Treated by mental health worker before service .32 .23 .50 5.25 3.07 Number of close relatives in mental hospital .21 .14 .26 7.15 - 3.74 Number treated who returned to nonnal self .18 .12 .21 4.52 - 2.96 Number of close relatives seen mental health
worker .16 .14 .25 7.20 - 2.85 - 3.56 Number of close relatives depressed .20 .11 .29 13.56 - 5.21 Total number of relatives with any of above
problems .35 .28 .43 7.37 - 3.84 Parents argue or fight 1. 62 1.52 1.71 3.72 - 2.72 Composite variable - Family Alcohol History 1.85 1.15 1.89 4.72 2.46 - 2.76 Composite variable - Sociopathy .75 .71 1.02 17.96 - 4.54 - 5.61 Harried vs. other marital status .12 .18 .12 4.87 - 2.59 2.73 Times married .19 .28 .21 5.13 - 2.99 Number of sons .09 .16 .09 4.65 2.75
Alcohol Use and Problem Historl:
Age when you first drank .29 .49 .26 32.52 - 6.11 7.47 Trouble in school due to alcohol .89 .92 .81 15.12 3.49 5.40 Number of Cigarettes you smoke a day 2.83 2.43 2.82 10.47 3.78 - 4.02 Hissed time on job because of drinking .29 .15 .38 36.33 4.85 - 3.03 - 8.45 Age missed time on job 2.43 2.61 1.98 12.14 3.52 4.42 Demoted because of drinking .07 .04 .09 5.77 - 3.37 UA because of drinking ,06 .03 .18 35.04 - 5.78 - 8.00 Auto accident because of drinking .35 .22 .27 9.81 4.43 Age bad auto accident 2.52 2.56 2.19 4.43 2.48 2.62 Picked up for drunk driVing .62 .87 .52 85.69 - 8.37 3.54 12.78 Age drunk driving 2.98 3.28 2.86 14.91 - 3.53 5.14 Disciplinary action because of drinking .27 .15 .24 11.01 4.33 - 3.58 Hospitalized because of drinking .06 .04 ,08 4.33 - 2.94 Doctor told you to stop drinking .04 .02 .08 9.68 - 2.75 - 4.33 Tried to stop drinking .26 .18 .34 18.28 3.10 - 2.52 - 6.03 Had a drinking problem .40 .22 .48 39.17 5.72 - 8.62 Abstained from drinking .39 .30 .37 4.07 2.61
aScheff~ !-test; all values are significant (~ < .05).
14

Programs
1 2 3 Grou~ Com~risons
Alcohol Use and Problem Historl: (continued) Mean Mean ~ F ~ ~ ~
Shakes the "morning after" .27 .19 .35 17.78 2.77 - 2.79 - 5.96 Number of times had shakes 3.23 3.01 4.01 8.09 - 2.92 - 3.65 Hallucinations .06 .02 .12 20.17 2.72 - 3.19 - 6.35 Convulsions .04 .03 .07 6.40 - 2.51 - 3.43 Vomited blood .04 .03 .10 11.81 - 3.77 - 4.49 Blackouts .58 .42 .62 24.85 4.99 - 6.71 Number of' blackouts 2.79 2.54 3.48 17.63 - 4.17 - 5.58 Liver problems .01 .00 .02 4.01 - 2.83 Saw doctor to help stop drinking .14 .09 .15 5.65 2.59 - 3.09 Until 25th birthday how bad was hangover 1.68 1.53 1.84 9.77 - 4.42 Past 3 years, how bad was hangover 1. 67 1.47 1.84 14.36 2.74 - 5.35 Number of drinks in 24 hours 4.43 4.02 4.72 18.59 3.38 - 6.06 Type of alcohol 1.13 1.12 1.31 29.55 - 6.13 - 6.99 Desire to see -psychiatrist .86 .94 .79 26.85 - 3.85 2.96 7.30 Discharge prognosis 1.40 .98 1.48 61.40 8.80 - 9.70 Self referral vs. other .17 .06 .18 18.41 4.80 - 5.49 Composite variable - Alcoholic by Behavioral
Criteria .21 .14 .32 13.39 - 2.84 - 5.15
Post-treatment effectiveness (proportion noneffective) .07 .07 .16 15.82 - 4.44 - 5.14
N 392 521 499
15
l

and had reported to sick call during the past year. less frequently than Group 3 men.
Items reflecting preservice family and social history were most often discriminating for the
comparisons between Groups 2 and 3. Group 2 men had completed more years of schooling and had
less often been suspended or expelled, set back a grade, or failed courses. They had less often
played hooky and had received more athletic honors. On the negative side Group 2 reported more
moving traffic violations during the preceding 3 years. Men in Group 2 less often indicated that
either they or their families experienced emotional illness or the need for professional mental
health services. On the composite variable, Family Alcohol History, Group 2 men scored lower
than Group 3 men. Similarly, on the composite variable, Sociopathy, Group 2 had a lower mean
score. Finally, Group 2 men were more often married and had children than men in Group 3.
Differences between Groups 1 and 3 were infrequent on family and preservice items. Group 1
men had completed more years of schooling and reported higher grades than men in Group 3. They
less often indicated that they Ivere ever in reform school and scored lower on the Sociopathy vari
able. Only one item indicative of family emotional health discriminated: Group 1 men reported
felver close relatives had seen a mental health Ivorker.
Nearly all alcohol use items that discriminated among the three groups of younger men also
discriminated beuveen Groups 2 and 3. Men in Group 2 Ivere older when they first drank. They had
less often had trouble in school due to alcohol. They less often reported any of the follolVing
because of dr~nking: missed time on the job, demotion, unauthorized absence, disciplinary action,
hospitalization, or being told by a doctor to stop drinking. The one problem reported more often
by Group 2 than Group 3 !vas being picked up for drunk driving. Men in Group 2 who had experienced
missing time on the job, auto accidents, or drunk driving were older when these events first occur
red than were men in Group 3. Men in Group 2 less often believed that they had. drinking problems
and less frequently had tried to stop drinking. They reported felver experiences of shakes the
morning after, hallucinations, convulsions, vomiting bluod, or blackouts. Group 2 men less of~en
reported shakes or blackouts on a number of occasions than Group 3 men. Liver problems were less
often reported by Group 2 and felver had sought the help of a doctor'to stop drinking. They
reported less severe hangovers, drinking less in 24,-hours, and a preference for beer or wine
rather than hard liquor. While in treatment they less often wanted to see a psychiatrist and more
often received favorable prognostic ratings from staff counselors. Finally, Group 2 scored lower
than Group 3 on the variable Alcoholic by Behavioral Criteria.
Many of the same items reflecting alcohol use histories discriminated between Groups 1 and 3.
All items, with the exception of drunk driving arrests, indicated that alcohol was more of a prob-
16
I

r
I I f
I
I
I
I
lem for the Group 3 men. They reported more trouble in school, time missed on the job, and unau-
thorized absence, as well as shakes, hallucinations, convulsions, and vomiting blood. Group 1 men
were older than Group 3 men when they first missed time on the job, had auto accidents, or were
picked up for drunk driving. They had less often been told by a doctor to stop drinking and had
less often tried to stop. They, like Group 2 men, indicated a preference for beer or wine rather
than liquor. They were less apt to express the desire to see a psychiatrist when in treatment.
Finally, Group 1 scored lower than Group 3 on the variable Alcoholic by Behavioral Criteria.
Differences in Post-T~eatment Effectiveness among Individual NASAP Facilities for Older Men
The same NASAP groups were used to compare outcome for three relatively large programs and
three small programs for older men. Among the larger groups there was no difference in post-
treatment effectiveness. Post-treatment effectiveness differed among the three smaller groups,
! (2, 120) = 3.10, l < .05. However, individual between-group comparisons were not significant.
Comparisons of Pre-Treatment and Post-Treatment Rates of Hospitalization for Alcoholism, Discipli
nary Problems, and Promotions for Young NASAP and Rehabilitation Participants
The differences between groups of younger men on rates of hospitalization for alcoholism,
promotion, and disciplinary occurrences during both pre-treatment and post-treatment periods are
shown in Table 4. (Mean values for these items as well as! ratios are shown in Appendix B.)
When effective and noneffective groups in the two populations were compared for the pre-treatment
period no differences were observed in rates of hospitalization I"ith primary diagnoses of alco-
holism. However, effective groups among both NASAP and rehabilitation partiCipants had signifi~
cantly lower rates of unauthorized absence, desertion, and demotion than noneffective groups.
The effective rehabilitation group had a higher rate of promotion than the noneffective group; no
difference in promotion rates was observed between NASAP groups. In the post-treatment period
both effective NASAP and rehabilitation groups had lower rates of hospitalization as well as lower
UA, desertion, and demotion rates than noneffective groups. Rates of promotion were higher for
both effective groups in the post-treatment period. When the two effective groups were compared,
the NASAP group had lower rates of hospitalization, UA, and demotion and a higher promotion rate
during the pre-treatment period. The effective NASAP group also had lower rates of UA and demo-
tion during the post-treatment period. Only one difference in rates was observed in both pre
and post-treatment periods between noneffective groups and that was a higher rate of desertion
for the noneffective NASAP group during the pre-treatment period.
Comparisons of rates before and after treatment for the various effective and noneffective
groups are ShOIVTI in Table 5. All groups showed higher rates of desertion and demotion and lower
17

Table 4
Significant Differences between Younger Groups in Hospitalization and Disciplinary Rates
Pre-Treatment Rate:
Ho~pitalizations Unauthorized absences Desertions Demotions Promotions
Post-Treatment Rate:
Hospitalizations Unauthorized absences Desertions Demotions Promotions
*p < .05 **£"< .01
***E. < .001
Effective vs. Noneffective Group Comparisons
ns - 7 .05*'~* - 9.46*** - 6.;1.8***
ns
- 3.26* - 4.57*** - 8.75*** - 4.53*"* 10.73*"*
Alcohol Rehabilitation
ns - 9.30"** - 6.93*** - 9.47"'**
3.37**
- 4.30*** - 4.16**" - 7.91*** - 6.60*** 16.49*"*
Table 5
Effective Noneffective Group Group
Comparisons Comparisons
- 7.15*** ns - 4.30*** ns
ns 4.55*"* - 5.941,** ns
3.45** ns
ns ns - 4.28*** ns
ns ns, - 3.40** ns
ns ns
Significant Differences for Younger Groups on Pre-Treatment versus
Post-Treatment Hospitalization and Disciplinary Rates
Hospitalizations Unauthorized absences Desertions Demotions Promotions
::e. < .05 **E. < .01
***2. < .001
Effective Noneffective
ns - 4.30**" - 5.04*** - 5.88***
22.84***
18
ns ns
- 3.34"** - 2.16* 18.66***
Alcohol Rehabilitation
Effective Noneffective
6.62**" - 5.19**1' - 7.55*** - 4.88"**
22.95***
4.14*** ns
- 6.28"** - 2.82**
29.30"**

f I
rates of promotion in the post-treatment period. Both effective groups, but not noneffective
groups, had higher UA rates in the post-treatment period. The effective and noneffective rehabili-
tation groups had lower rates of hospitalization during the post-treatment period.
n;ISCUSSION
The higher effectiveness rates noted for participants in this study compared to those obtained
in previous studies were, in part, due to the fact that admissions were restricted to the more
recent time period, 1977-1978. This resulted in a shorter follow-up period for both populations
than in previous studies, and thus fewer men became ineffective during the reduced post-treatment
observation period. It was also noted that a larger proportion of the alcohol rehabilitation pro-
gram population in the present study was composed of Drydock participants than was the case in
earlier studies. Drydocks treat individuals with less serious problems than GO Alcohol Rehabili-
tation Centers and Services. The high rates of effectiveness found for NASAP participants were
not unexpected. NASAP was designed to provide early intervention for individuals experiencing
some problem associated with alcohol use, especially driving while intoxicated. Men identified
in this way who demonstrated more serious alcohol abuse problems or alcoholism generally would
have been referred to alcohol rehabilitation programs.
Effective post-treatment performance for men in both types of programs and in both age groups
was more often noted for individuals \~ho were older, had higher pay grades, and had more years of
service at the time they were admitted to treatment. These findings are consistent with those of
all previous studies of outcome for men treated in alcohol rehabilitation facilities (1). The
effectiveness criteria used in this study were based on service longeVity and achievement; disci-
plinary difficulties, whether or not associated with alcohol abuse, lead to premature discharge
from service under unfavorable circumstances. This occurs much more frequently among younger,
first enlistment personnel. Disciplinary problems \~ere reported more often by the noneffective,
younger men in both NASAP and rehabilitation programs; when the two noneffective groups were com-
pared, there were no differences between them on disciplinary items despite the indications that
the noneffective rehabilitation participants were more heavily involved in alcohol abuse. Self-
reported diSCiplinary histories did not discriminate between effective and noneffective groups of
older men in either program. It may have been that recall of the longer pre-treatment period for
older men produced a less accurate accounting of past difficulties.
Although it is the men's disciplinary histories during their service careers that largely
determines effectiveness after treatment, it seems apparent from the records of the men in tltis
study that their ineffective performance was not unique to the service. Noneffective men in both
19

of the younger groups had less favOJ:able family, school, and community adjusi.-ment histories than
did effective men. Even among older rehabilitation men, those IVho were noneffective had less
favorable pre-service adjustments.
Differences in alcohol use and problem histories were apparent for all group comparisons.
Effective men, younger and older, in both NASAP and alcohol rehabilitation programs, reported
fewer difficulties due to alcohol than did noneffective men lVith one exception. NASAP pal~ici
pants more often indicated they IVere picked up for driving \~hile intoxicated. This is consistent
with the fact that from its inception NASAP has been considered a possible diversion program for
Navy men arrested for this offense. NASAP men experiencing this problem reported that it occurred
at a later age than did rehabilitation participants. Less severe alcohol problem histories \~ere
characteristic of effective NASAP men when compared to effective rehabilitation participants;
similar trends lVere noted when noneffective groups lVere compared. Thus, it seems clear that, in
the main, men IVho have more serious alcohol problems are being appropriately referred to and
treated in the' rehabilitation programs; men lVith less serious or incipient alcohol problems are
being referred to an educational program designed to help them evaluate their current drinking
behavior and to encourage them to modify destructive trends. On the negative side, the possi
bility that as many as one-fifth of the men seen in NASAP programs could be described as alcoholic
by behavioral criteria suggests the need for more careful screening of those men. Some, but not
all IVho met this criterion, were recommended for transfer to alcohol rehabilitation. It would not
be difficult during the screening period to obtain and evaluate the infonnation necessary to deter
mine alcoholism by the behavioral criteria used in this study. It could be an aid to appropriate
referral and treatment.
When effectiveness rates of individual facilities IVere compared feIV differences IVere obtained.
When they did occur, either significance IVas minimal or differences in outcome appeared related to
the varying characteristics of the populations treated rather than to differences in programs. A
more accurate assessment of effective post-NASAP adjustment IVould be reflected by changes in behav
ior that caused the individuals to be referred for treatment, 1. e., drunk driving arrests, as com
pared to individuals lVith similar records IVho did not undergo treatment.
Differences in rates of hospitalization, disciplinary occurrences, and promotion observed
betIVeen effective and noneffective groups for both NASAP and rehabilitation participants lVere all
in the expected directions. Similarly, comparisons betlVeen effective groups, indicating more
favorable performance for the NASAP group, lVere consistent lVith self-reported information from
biographical questionnaires. The higher desertion rate observed for the noneffective NASAP group
20

in the pre-treatment period is not easily explained and goes contrary to other findings which
indicate few differences between the two noneffective groups of younger men on any of the self
repiJrted disciplinary items.
Higher rates of desertion and demotion were observed af1:er treatment than before for all
yot,nger groups, effective and noneffective. In addition, higher rates of unauthorized absence
occurred after treatment for effective groups. Pe\~er promotions occurred af1:er treatmEnt for all
gr(mps.
The above descriptive re~ults cannot be properly interpreted without further knowledge of
discipli~ary and promotion rates for untreated controls over similar time periods. Studies of
the Navy enlisted population have shmm that unauthorized absence and demotion rates tend to be
highest during the third year of the first enlistment which would roughly coincide with the post
treatment period of the present study. It will be necessary to conduct comparative analyses of
the service histories of NASAP and rehabilitation program participants versus those of untreated
controls in order to determine the effects of alcohol treatment programs on subsequent military
performance.
As expected, rates of hospital admissions for alcoholism Ivere Imver after treatment than
before for both effective and noneffective rehabilitation groups, and noneffective men had higher
hospitalization rates than effective men in both populations,
REPERENCE
1. Kolb, D., Gunderson, E. K. E., & Coben, P. Population differences and correlates of post
treatment effectiveness in alcohol rehabilitation facilities (Report No. 78-48). San Diego,
Calif.: Naval Health Research Center, 1978.
21
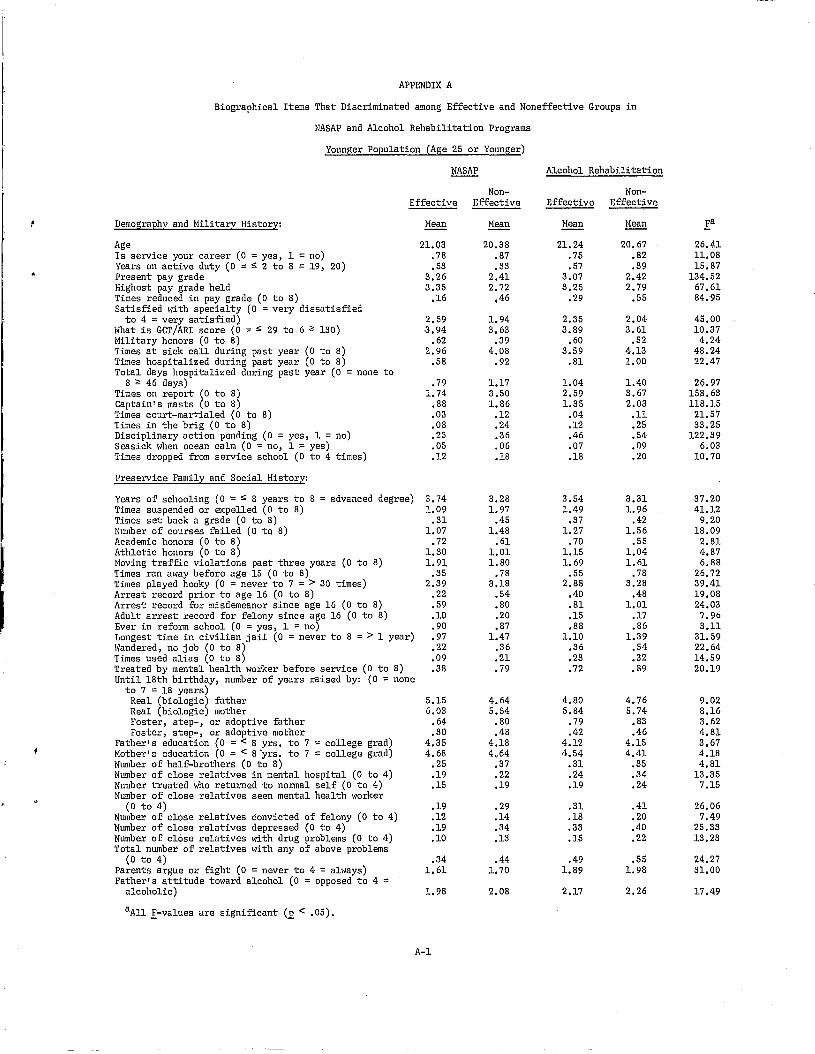
APPENDIX A
Biographical Items That Discriminated among Effective and Noneffective Groups in
NASAP and Alcohol Rehabilitation Programs
Younger Population (Age 25 or Younger)
NonEffective Effective
Demography and Military History:
Age Is service your career (0 = yes, 1 = no) Years on active duty (0 = ~ 2 to 8 = 19, 20) Present pay grade Highest pay grade held Times reduced in pay grade (0 to 8) Satisfied \~ith specialty (0 = very dissatisfied
to 4 = very satisfied) Ivhat is GCT/ARI score (0 = ~ 29 to 6 '" 130) Military honors (0 to 8) Times at sick call during past year (0 to 8) Times hospitalized during past year (0 to 8) Total days hospitalized during past year (0 = none to
8 '" 46 days) Times on report (0 to 8) Captain's masts (0 to 8) Times court-ma1~ialed (0 to 8) Times in the brig (0 to 8) Disciplinary action pending (0-= yes, 1 = no) Seasick \Vhen ocean calm (0 = no, 1 = yes) Times dropped from service school (0 to 4 times)
Preservice Family and Social History:
Years of schooling (0 = ~ 8 years to 8 = advanced degree) Times suspended or expelled (0 to 8) Times set back a grade (0 to 8) Number of courses failed (0 to 8) Academic honors (0 to 8) Athletic honors (0 to 8) Moving traff-ic violations past three years (0 to 8) Times ran a\~ay before age 15 (0 to 8) Times played hooky (0 = never to 7 = > 30 times) Arrest record prior to age 16 (0 to 8) Arrest record for misdemeanor since age 16 (0 to 8) Adult arrest record for felony since age 16 (0 to 8) Ever in reform school (0 = yes, 1 = no) Longest time in civilian jail (0 = never to 8 = > 1 year) Ivandered, no job (0 to 8) Times used alias (0 to 8) Treated by mental health \Vorker before service (0 to 8) Until 18th birthday, number of years raised by: (0 = none
to 7 = 18 years) Real (biologic) father Real (biologic) mother Foster, step-, or adoptive father Foster, step-, or adoptive mother
Father's education (0 = < 8 yrs. to 7 ~ college grad) Mother's education (0 = < 8 ·yrs. to 7 = college grad) Number of half-brothers (0 to 8) Number of close relatives in mental hospital (0 to 4) Number treated \~ho returned to normal self (0 to 4) Number of close relatives seen mental health \~orker
(0 to 4) Number of close relatives convicted of felony (0 to 4) Number of close relatives depressed (0 to 4) Number of close relatives \Vith drug problems (0 to 4) Total number of relatives \~ith any of above problems
(0 to 4) Parents argue or fight (0 = never to 4 = all~ays) Father's attitude to\~ard alcohol (0 = opposed to 4
alcoholic)
aAll I-values are significant (£ < .05).
Mean
21.03 .78 .53
3.26 3.35
.16
2.59 3.94
.62 2.96
.58
.79 1. 74
.88
.03
.08
.23
.05
.12
3.74 1.09
.31 1.07
.72 1.30 1.91
.35 2.39
.22
.59
.10
.90
.97
.22
.09
.38
5.15 6.03
.64
.30 4.35 4.68
.25
.19
.15
.19
.12
.19
.10
.34 1.61
1.98
A-I
20.38 .87 .33
2.41 2.72
.46
1.94 3.63
.39 4.08
.92
1.17 3.50 1.86
.12
.24
.36
.06
.18
3.28 1.97
.45 1.48
.61 1.01 1.80
.78 3.18
.54
.80
.20
.87 1.47
.36
.21
.79
4.64 5.54
.80
.48 4.18 4.64
.37
.22
.19
.29
.14
.34
.13
.44 1. 70
2.08
Alcohol Rehabilitation
NonEffective Effective
Mean
21. 24 .75 .57
3.07 3.25
.29
2.35 3.89
.60 3.59
.81
1.04 2.59 1.35
.04
.12
.46
.07
.18
3.54 1.49
.37 1.27
.70 1.15 1.69
.55 2.88
.40
.81
.15
.88 1.10
.36
.23
.72
4.80 5.84
.79
.42 4.12 4.54
.31
.24
.19
.31
.18
.33
.15
.49 1.89
2.17
Hean
20.67 .82 .39
2.42 2.79
.55
2.04 3.61
.52 4.13 1.00
1.40 3.67 2.03
.11
.25
.54
.09
.20
3.31 1.96
.42 1.56
.55 1.04 1.61
.78 3.28
.48 1.01
.17
.86 1.39
.54
.32
.89
4.76 5.74
.83
.46 4.15 4.41
.35
.34
.24
.41
.20
.40
.22
.55 1.98
2.26
Fa
26.41 11.08 15.87
134.52 67.61 84.95
45.00 10.37 4.24
48.24 22.47
26.97 158.63 118.15 21.57 33.25
122.39 6.03
10.70
37.20 41.12
9.20 18.09
2.81 4.87 6.88
26.72 39.41 19.08 24.03
7.96 3.11
31.59 22.64 14.59 20.19
9.02 8.16 3.62 4.81 3.67 4.18 4.81
13.35 7.15
26.06 7.49
25.33 13.23
24.27 31.00
17.49
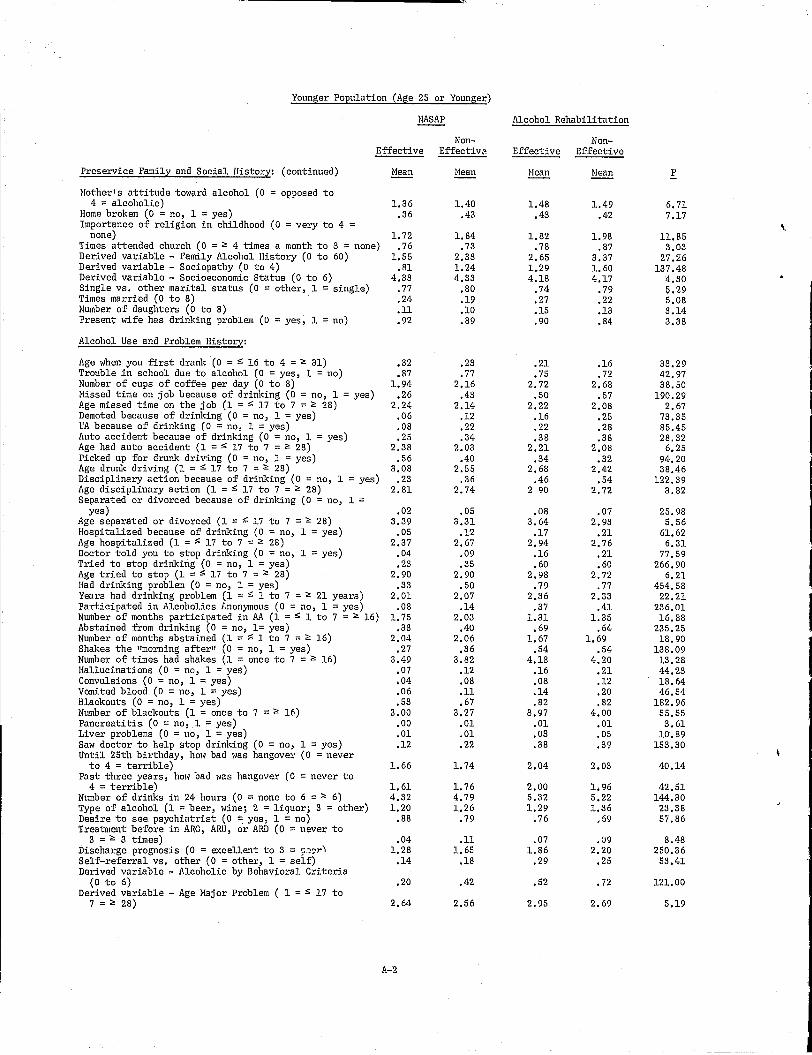
Younger Population (Age 25 or Younger)
NonEffective Effectiv~
Preservice Family and Social History: (continued)
Nother's attitude toward alcohol (0 = opposed to 4 = alcoholic)
Home broken (0 = no, 1 = yes) Importance of religion in childhood (0 = very to 4
none) Times attended church (0 = ~ 4 times a month to 3 = none) Derived variable - Family Alcohol History (0 to 60) Derived variable - SOCiopathy (0 to 4) Derived variable - Socioeconomic Status (0 to 6) Single vs. other marital status (0 = other, 1 = single) Times married (0 to 8) Number of daughters (0 to 8) Present wife has drinking problem (0 = yes, 1 = no)
Alcohol Use and Problem History:
Age when you first drank (0 = ~ 16 to 4 = ~ 31) Trouble in school due to alcohol (0 = yes, 1 = no) Number of cups of coffee per day (0 to 8) Nissed time on job because of drinking (0 = no, 1 = yes) Age missed time on the job (1 = ~ 17 to 7 = ~ 28) Demoted because of drinking (0 = no, 1 = yes) UA because of drinking (0 = no, 1 = yes) Auto accident because of drinking (0 = no, 1 = yes) Age had auto accident (1 = ~ 17 to 7 = ~ 28) Picked up for drunk driving (0 = no, 1 = yes) Age drunk driving (1 = ~ 17 to 7 = ~ 28) Disciplinary action because of drinking (0 = no, 1 = yes) Age disciplinary action (1 = ~ 17 to 7 = ~ 28) Separated or divorced because of drinking (0 = no, 1 =
yes) Age separated or divorced (1 = ~ 17 to 7 = ~ 28) Hospitalized because of drinking (0 = no, 1 = yes) Age hospitalized (1 = ~ 17 to 7 = ~ 28) Doctor told you to stop drinking (0 = no, 1 = yes) Tried to stop drinking (0 = no, 1 = yes) Age tried to stop (1 = ~ 17 to 7 = ~ 28) Had drinking problem (0 = no, 1 = yes) Years had drinking problem (1 = ~ 1 to 7 = ~ 21 years) Participated in Alcoholics Lnonymous (0 = no, 1 = yes) Number of months participated in AA (1 = ~ 1 to 7 = ~ 16) Abstained from drinking (0 = no, 1= yes) Number of months abstained (1 = ~ 1 to 7 = ~ 16) Shakes the "morning after" (0 = no, 1 = yes) Number of times had shakes (1 = once to 7 = ~ 16) Hallucinations (0 = no, 1 = yes) Convulsions (0 = no, 1 = yes) Vomited blood (0 = no, 1 = yes) Blackouts (0 = no, 1 = yes) Number of blackouts (1 = once to 7 = ~ 16) Pancreatitis (0 = no, 1 = yes) Liver problems (0 = no, 1 = yes) Saw doctor to help stop drinking (0 = no, 1 = yes) Until 25th birthday, how bad was hangover (0 = never
to 4 = terrible) Past three years, how bad was hangover (0 = never to
4 = terrible) Number of drinks in 24 hours (0 = none to 6 = ~ 6) Type of alcohol (1 = beer, wine; 2 = liquor; 3 = other) Desire to see psychiatrist (0 = yes, 1 = no) Treatment before in ARC, ARU, or ARD (0 = never to
3 = ~ 3 times) Discharge prognosis (0 = excellent to 3 = p.:J?r) Self-referral vs. other (0 = other, 1 = self) Derived variable - Alcoholic by Behavioral Criteria
(0 to 6) Derived variable - Age Najor Problem ( 1 = ~ 17 to
7 = ~ 28)
Hean
1.36 .36
1.72 .76
1.55 .81
4.33 .77 .24 .n .92
.32
.87 1.94
.26 2.24
.06
.08
.25 2.38
.56 3.08
.23 2.81
.02 3.39
.05 2.37
.04
.23 2.90
.33 2.01
.08 1. 75
.33 2.04
.27 3.49
.07
.04
.06
.53 3.00
.00
.01
.12
1.66
1.61 4.32 1.20
.88
.04 1.28
.14
.20
2.64
A-2
Mean
1.40 .43
1.84 .73
2.33 1.24 4.33
.80
.19
.10
.89
.23
.77 2.16
.43 2.14
.12
.22
.34 2.03
.40 2.55
,36 2.74
.05 3.31
.12 2.67
.09
.35 2.90
.50 2.07
.14 2.03
.40 2.06
.36 3.82
.12
.08
.n
.67 3.27
.01
.01
.22
1. 74
1. 76 4.79 1.26
.79
.n 1. 65
.18
.42
2.56
Alcohol Rehabilitation
NonEffective Effective
Nean
1.48 .43
1.82 .78
2.65 1.29 4.18
.74
.27
.15
.90
.21
.75 2.72
.50 2.22
.16
.22
.38 2.21
.34 2.68
.46 2 90
.08 3.64
.17 2.94
.16
.60 2.98
.79 2.36
.37 1.31
.69 1.67
.54 4.18
.16
.08
.14
.82 3.97
.01
.03
.38
2.04
2.00 5.32 1.29
.76
.07 1.86
.29
.52
2.95
Heall
1.49 .42
1.98 .87
3.37 1. 60 4.17
.79
.22
.13
.84
.16
.72 2.68
.57 2.08
.25
.28
.38 2.08
.32 2.42
.54 2.72
.07 2.93
.21 2.76
.21
.60 2.72
.77 2.33
.41 1.35
.64 1.69
.54 4.20
.21
.12
.20
.82 4.00
.01
.05
.39
2.03
1. 96 5.22 1.36
,69
.09 2.20
.25
.72
2.69
F
6.71 7.17
n.85 3.03
27.26 137.48
4.30 5.29 5.08 3.14 3.38
33.29 42.97 38.50
190.29 2.67
73.35 85.45 28.32
6.25 94.20 38.46
122.39 3.82
25.98 5.56
61.62 6.31
77.59 266.90
6.21 454.58
22.21 236.01 16.88
235.25 18.90
138.09 13.28 44.23 18.64 46.54
182.96 55.55 3.61
10.89 153.30
40.14
42.51 144.30
23.38 57.86
8.48 250.36 53.41
121.00
5.19

Older Population (Age 26 and Older)
NonEffective Effective
Demographic and Hili tary History:
Age Is the service your career (0 = yes, 1 = no) Years on active duty (0 := ~ 2 to 8 := 19, 20) Present pay grade Age entered the service (0 := 17 to 8 := 26) Highest pay grade ever held Times reduced in pay grade (0 to 8) Satisfied Ivith specialty (0 := very dissatisfied to
4 = very satisfied) Hilitary honors (0 to 8) Times at sick call past year (0 to 8) Times hospitalized during past year (0 to 8) Total days hospitalized during past year (0 = none to
8 = .., 46 days) Times put on report (0 to 8) Captain's masts (0 to 8) Disciplinary action pending (0 = yes, 1 := no) Ever extremely seasick (0:= no, 1 = yes) Seasick when ocean calm (0:= no, 1 = yes)
Preservice Family and Social History:
32.46 .12
5.28 5.72 1. 80 5.79
.24
3.23 3.48 2.02
.37
.71 1.82 1. 23
.84
.28
.04
Years of schooling (0 := ~ 8 yrs to 8 := advanced degree) 3.64 Years in trade school (0 to 8) .24 Times suspended or expelled (0 to 8) .37 Times set back a grade (0 to 8) .35 Number of courses failed (0 to 8) .61 Academic honors (0 to 8) .63 Time held full-time job (0 = none to 8 = > 36 months) 3.06 Hoving traffic violations past 3 years (0 to 8) 1.32 Times ran away before age 15 (0 to 8) .18 Times played hooky (0 := never to 7 := > 30 times) 1.03 Arrest record for misdemeanor since age 16 (0 to 8) .50 Adult arrest record for felony since age 16 (0 to 8) .08 Ever in reform school (0:= yes, 1 := no) .89 Longest time in civilian jail (0 = never to 8 = 1 > 1 yr) 1.02 Wandered, no job (0 to 8) .12 rreated by mental health Ivorker before service (0 to 8) .07 Until 18th birthday, years raised by foster, step- or
adoptive father (0 := none to 7 := 18 yrs.) Father's educotion (0 = < 8 years to 7 = college grad) Number of close relatives in mental hospital (0 to 4) Number treated who returned to normal self (0 to 4) Number of close relatives seen mental health worker
(0 to 4) Number of close relatives convicted of felony (0 to 4) Number of close relatives depressed (0 to 4) Number of close relatives with drug pr0blems (0 to 4) Total number of relatives I'lith any of the above problems
(0 to 4) Parents argue or fight (1) = never to 4 = allvays) Father's attitude toward alcohol (0 = opposed to 4 :=
alcoholic) Nother's attitude tOl1ard alcohol (0 = opposed to 4 :=
alcoholic) Home broken (0 = no, 1 := yes) Importance of religion in childhood (0 := very to 4 :=
none) Times attended church (0 = .., 4 times mo. to 3 = none) Derived variable - Family Alcohol History (0 to 60) Derived variable - SOCiopathy (0 to 4)
Harital Status:
Single vs. other marital status (0 = other, 1 := single) Times married (0 to 8) Number of sons you have (0 to 8) Number of dal.lg11ters you have (0 to 8) Present wife has a drinking problem (0:= yes, 1 := no) Spouse's income (0 := more to 2 := less than own)
.54 3.43
.12
.10
.13
.08
.12
.06
.24 1.56
1.99
1.34 .36
1.48 .60
1.41 .53
.16 1.11
.72
.73
.93 1. 69
A-3
29.03 .38
2.62 3.78 3.06 4.31
.74
2.22 2.56 3.48
.67
.65 2.70 1. 79
.68
.44
.15
3.74 .56 .32 .45 .94 .82
3.74 1.29 1.09 1.65
.41
.09
.76 1.29
.35
.35
.84 3.93
.1S
.18
.18
.09
.20
.09
.26 1.39
2.26
1.23 .53
1.65 .79
1.41 .94
.38
.74
.42
.56
.95 1.50
Alcohol Rehabilitation
NonEffective Effective
32.43 .13
5.23 5.54 1. 64 5.67
.40
2.87 3.65 2.56
.64
1.12 2.34 1.65
.87
.31
.06
3.45 .26 .62 .44 .84 .49
3.02 1.07
.26 1.49
.75
.15
.91 1.12
.15
.22
.70 3.16
,18 .15
.21
.13
.23
.12
.40 1.85
2.34
1.46 .41
1.72 .69
2.64 .76
.14 1.14
.75
.78
.90 1.70
29.80 .53
2.65 3.98 2.23 4.51
.57
2.02 2.81 3.19 1.13
1.37 2.51 1.64
.77
.24
.05
3.78 .39 .77 .54
1.06 .70
4.16 1.49
.42 1.71 1.04
.24 ,85
1.44 ,60 .55
.88 3.25
.23
.17
.27
.21
.38
.15
.50 1.97
2.40
1.44 .43
1. 70 .89
3.34 1.10
.31
.91
.60
.50
.83 1.22
K 23.62 76.37 68.71
110.52 9.83
74,62 16,56
50.99 6.17
20.88 28.38
14.76 14.91 12.05
7.58 2.91 4.47
6.36 3.03
12.01 5.70
10.61 3.85 9.22
11.38 17.79 19.64 15.04
7.78 4.44 7.40
28.12 11.46
3.24 2.86 7.19 5.12
8.97 6.45
18.39 6.64
18.27 18.69
15.43
3.30 3.31
11.77 3.44
16.52 29.15
16.43 7.64 3,01 5,24 5.14 9.12

Older Population (Age 26 and Older)
NonEffective Effective
Alcohol Use and Problem History:
Age lvhen first drank (0 = ,;; 16 to 4 = " 31) Trouble in school due to alcohol (0 = yes, 1 = no) Number of cups of coffee per day (0 to 8) Missed time on job because of drinking (0 = no, 1 = yes) Age missed time on job (1 = ,;; 17 to 7 = " 28) Demoted because of drinking (0 = no, 1 = yes) UA 'because of drinking (0 = no, 1 = yes) Age UA (1 = ,;; 17 to 7 = " 28) Auto accident because of drinking (0 = no, J. = yes) Age had auto accident (1 = ,;; 17 to 7 = " 28) Picked up for drunk driving (0 = no, 1 = yes) Age picked up for drunk driving (1 = ,;; 17 to 7 = " 28) Disciplinary action because of drinking (0 = no, 1 =
yes) Age disciplinary action (1 = ,;; 17 to 7 = " 28) Separated or divorced because of drinking (0 = no, 1 =
yes) Hospitalized because of drinking (0 = no, 1 = yes) Doctor told you to stop drinking (0 = no, 1 = yes) Age doctor told you to stop (1 = ,;; 17 to 7 = " 28) Tried to stop d~inking (0 = no, 1 = yes) Have drinking problem (0 = no, 1 = yes) Years had drinking problem (1 = ,;; 1 yr to 7 = " 21 yrs) Participated in Alcoholics Anonymous (0 = no, 1'= yes) Number of months participated in AA (1 = ,;; 1 to 7 = "
16 months) Abstained from drinking (0 = no, 1 = yes) Number of months abstained (1 = ,;; 1 to 7 = " 16 months) Shakes the "morning after" (0 = no, 1 = yes) Times had shakes (1 = once to 7 = " 16) Hallucinations (0 = no, 1 = yes) Convulsions (0 = no, 1 = yes) Vomited blood (0 = no, 1 = yes) Blackouts (0 = no, 1 = yes) Number of blackouts (1 = once to 7 =" 16) Pancreatitis (0 = no, 1 = yes) Liver problems (0 = no, 1 = yes) Saw doctor to help stop drinking (0 = no, 1 = yes) Until 25th birthday, how bad was hangover (0 = never to
4 " terrible) Past three years, hOI" bad was hangover (0 = never to 4 =
terrible) Number of drinks in 24 hours (0 = none to 6 = " 6) Type of alcohol (1 = beer, wine; 2 = liquor; 3 = othe~) Treated before in ARC, ARU, or ARD (0 = never to 3 = .
" 3 times) Desire to see psychiatrist (0 = yes, 1 = no) Discharge prognosis (0 = excellent to 3 = poor) Self-referral vs. other (0 = other, 1 = self) Derive~ variable - Alcoholic by Behavioral Criteria
(0 to 6) Derived variable - Age Major Problem (1 = ,;; 17 to 7 =
" 28)
Mean
.69
.95 4.44
.26 4.35
.07
.09 4.80
.30 5.52
.74 6.26
.23 4.98
.10
.07
.07 5.92
.34
.40 3.20
.17
3.03 .45
3.21 .27
3.91 .05 .03 .05 .49
3.32 .00 .02 .19
1.82
1.71 4.43 1.27
.14
.94 1.13
.22
.34
5.10
A-4
Mean
.50
.85 3.91
.56 4.10
.15
.24 4.25
.29 5.10
.41 4.86
.38 5.46
.15
.12
.20 6.28
.53
.62 2.81
.26
3.89 .59
2.95 .41
4.43 .06 .06 .12 .62
3.90 .03 .03 .35
2.24
2.15 4.91 1.29
.35
.76 1.58
.12
.59
4.80
~ol Rehabilitation
NonEffective Effective
Mean
.48
.91 4.88
.57 4.44
.17
.23 5.14
.47 4.92
.52 5.58
.42 5.00
.26
.24
.25 6.26
.72
.86 3.66
.42
1.98 .81
2.50 .55
4.65 .14 .07 .15 .78
4.20 .01 .07 .44
2.14
2.23 5.40 1.33
.15
.78 1.49
.38
.82
5.66
Mean
.40
.83 4.14
.74 3.90
.24
.42 5.62
.55 4.03
.52 5.48
.54 5.63
.38
.30
.32 5.80
.75
.88 3.62
.49
2.08 .81
2.71 .69
4.68 .26 .15 .29 .86
4.76 .03 .07 .53
2.31
2.40 5.67 1.33
.17
.62 1. 86
.36
1.25
5.36
F
26.25 12.76
8.84 112.11
2.94 25.49 49.01 3.27
34.11 17.87 51.10 36.63
43.95 3.27
43.60 53.47 54.73 3.15
165.99 316.44 12.19 78.74
25.08 165.16 18.44 92.72 8.15
32.79 14.58 34.83
108.80 26.39 3.16
11.34 75.85
20.80
49.08 107.70
2.93
3.26 57.76 59,33 33.64
85.28
5.93
I I

APPENDIX B
Hospitalization and Disciplinary Rates That
Discriminated among Effective and Noneffective Groups
in NASAP and Alcohol Rehabilitation Programs
for the Younger Population
NASAP Alcohol Rehabilitation
Non- Non-Effective effective Effective effective
Pre-Treatment Rate: Mean Mean Mean Mean Fa
Hospitalizations Alb 1.10 2.98 7.74 46.66
Unauthorized absences 9.88 30.06 15.66 32.46 58.1.9
Desertions .75 6.81 .85 3.65 34.37
Demotions 4.64 12.85 8.35 16.29 65.68
Promotions 68.79 63.00 64.69 59.30 1.2.02
Post-Treatment Rate:
Hospitalizations .29 2.75 .70 2.75 10.98
Unauthorized absences 16.04 33.61. 23.78 33.88 20. 7
Desertions 2.84 1.5.43 4.1.6 n.34 48.67
Demotions 8.94 18.26 12.23 20.79 29.40
Promotions 37.71 8,52 37.23 8.93 133.02
N 1,991 274 2,416 808
aAll ~-values are significant (£ < .001)
bThe incidence per 1,000 personnel per month.
B-1

r I
UNCLASSIFIED 'lECUt'lITY CLASSIFICATION OF THIS PAGE (When Data Entered) .
REPORT DOCUMENTATION PAGE READ INSTRUCTIONS BEFORE COMPLETING FORM
1. REPORT NUMBER 12, GOVT ACCESSION NO. 3. RECIPIENT'S CATALOG NUMBER
79-58 4. TITLE (and Subtitle) S. TYPE OF REPORT Ilr PERIOD COVERED
Comparisons of the Navy Alcohol Safety Action Interim Program with Other Alcohol Rehabilitation Programs
6. PERFORMING ORG. REPORT NUMBER
7. AU THOR(~) B. CONTRACT OR GRANT NUMBER(a)
Douglas Kolb, Patricia Coben, and E. K. Eric Gunderson 9. PERFORMING ORGANIZATION NAME AND ADDRESS to. PROGRAM ELEMENT, PROJECT, TASK
Naval Health Research Center ARE.' Ilr WORK UNIT NUMBERS
P. O. #N0002278F088AFZ and P.O. Box 85122 W.U. #M0096-PN.OOI-I034 San Diego, California 92138 II. CONTROLLING OFFICE NAME AND ADDRESS 12. REPORT DATE
Naval Medical Research and Development Conunand March 1980 Bethesda, Maryland 20014 13. NUMBER OF PAGES
32 14. MONITORING AGENCY NAME Ilr ADDRESS(II dl!lerent from ControlllnS Office) 15. SECURITY CLASS. (of tllta report)
Bureau of Medicine and Surgery UNCLASSIFIED Department of the Navy
Washington, D.C. 20372 ISa. DECLASSI FICATIONI DOWNGRADING SCHEDULE
16. DISTRIBUTION STATEMENT (of thts Report)
Approved for public release; distribution unlimited.
17. DISTRIBUTION STATEMENT (of the abstract entered In Block 20, If different (rom Repo,t)
lB. SUPPLEMENTARY NOTES
19. KEY WORDS (Continue on ,ever.,e side If neCfJ8BlU'y and Identify by block number)
Alcohol abuse Counseling Treatment effectiveness Rehabilitation programs Navv enlisted nersonnel
20. ABSTRACT (Continue on reverae "Ide If necessary and Identify by block number)
The Navy Alcohol Safety Action Program (NASAP) is directed toward the early identification of alcohol abuse among Navy personnel. The obj ectives of this study were: (1) to compare post-treatment effectiveness for NASAP and alcohol rehabilitation participants, (2) to determine correlates of post-treatment effectiveness for both populations, (3) to estimate the extent of alcoholism among NASAP partiCipants, (4) to compare outcomes among individual NASAP pro-grams, and (5)
DO FORM I JAN 73 1473
to examine rates of disciplinary difficulties before and after
EDITION OF 1 NOV 65 IS OBSOLETE
SIN Ol02-LF-014-6601 UNCLASSIFIED SECURITY CLASSIFICATION OF THIS PAGE (When D.t. Bnt.r.d)

UNCLASSIFIED SECURITY CLASSIFICATION OF THIS' ?AGE (When Data Entered)
treatment for both NASAP and rehabilitation participants. Effectiveness rates were high for both NASAP and rehabilitation partici
pants; NASAP participants, both younger and older, had significantly higher effectiveness rates than rehabilitation program participants. Effectiveness in both programs was associated with more favorable preservice histories, better military records, and less severe alcohol use and problem histories. Effective NASAP participants presented more favorable profiles than effective rehabilitation participants in terms of preservice characteristics, family and social history, military adjustment and achievement, and alcohol use and problem history.
'--__ ---J UNCLASSIFIED
SECURITY CLASSIFICATION OF-rHIS PAGE(When Dat .. Entered)
L-__________________________________________________________________________________________________ _

,0-"
!<.,'
DE:PARTMENT OF THE NAVY
COMMANDING OFFICER NAVAL HEALTH RESEARCH CENTER
P.O. BOX 85122 SAN DIEGO. CA 92138
OFFICIAL BUSINESS
c PENALTY FOR PRIVATE USE, $300
S. CHIANG .. NCJRS--ACQUISITION DEPT
BOX 6000 ROCKVILLE, MD 20850
.)
'~'
1-118
POSTAGE AND FEES PAID
DEPARTMENT OF THE NAVY
000·316

.... " II'"
/ I ,I
/ I
• I
/ / ('
• I
/