comparison of wind environment criteria against field
TRANSCRIPT
Comparison of wind environment criteria against field observations
Antonios Rofail
Windtech Consultants Pty. Ltd., Wolli Creek, New South Wales, Australia
ABSTRACT: A remedial wind environment study was carried out by Windtech Consultants for a residential and retail complex located in Sydney. In carrying out the remedial study the merits of various comfort criteria were benchmarked against the observations of the retail tenants who are serving the outdoor seating areas that are the subject of the remedial study. KEYWORDS: pedestrian wind environment, criteria, comparison, field observations 1 INTRODUCTION
The complex consists of a tall building at the north-eastern corner of the site of approximately 20 levels in height and a number of medium rise buildings around a central piazza. The site layout is described in Figure 1. The remedial study was triggered by complaints of unsuitable wind conditions in the outdoor seating area represented by Point 12 in Figure 1. In addition, an outdoor seating area, represented by Point 18, which was not yet tenanted, was found to be particularly windy, with breezes felt even on a calm day. No issues were raised with regards to the other areas, including seating areas at Points 11 and 15. Figure 2 provides an outline of the criteria applicable to the different outdoor areas based on the activities being carried out in those areas. The areas where the safety limit is the designated criterion are not normally used by pedestrians.
The weekly maximum mean (probability of exceedance = 0.05) and different variations of a Gust Equivalent Mean (GEM) are compared against mean criteria by Davenport(1972) and Lawson (1973, 1975). The annual maximum 3-second gust is compared against the criteria by Melbourne (1978). The different outcomes based on the various sets of criteria are then related to the observations reported by the outdoor restaurants as well as observations by the author during a number of site visits. 2 METHODOLOGY
A 1:300 scale model was used. The model was placed within an 800m diameter model of the immediate surrounds, including the local land topography. The upstream fetch beyond the 1:300 scale proximity model was modelled as a suburban terrain based on the Deaves and Harris model (1978). Local and reference wind speed measurements were obtained using Dantec hotwire probes.
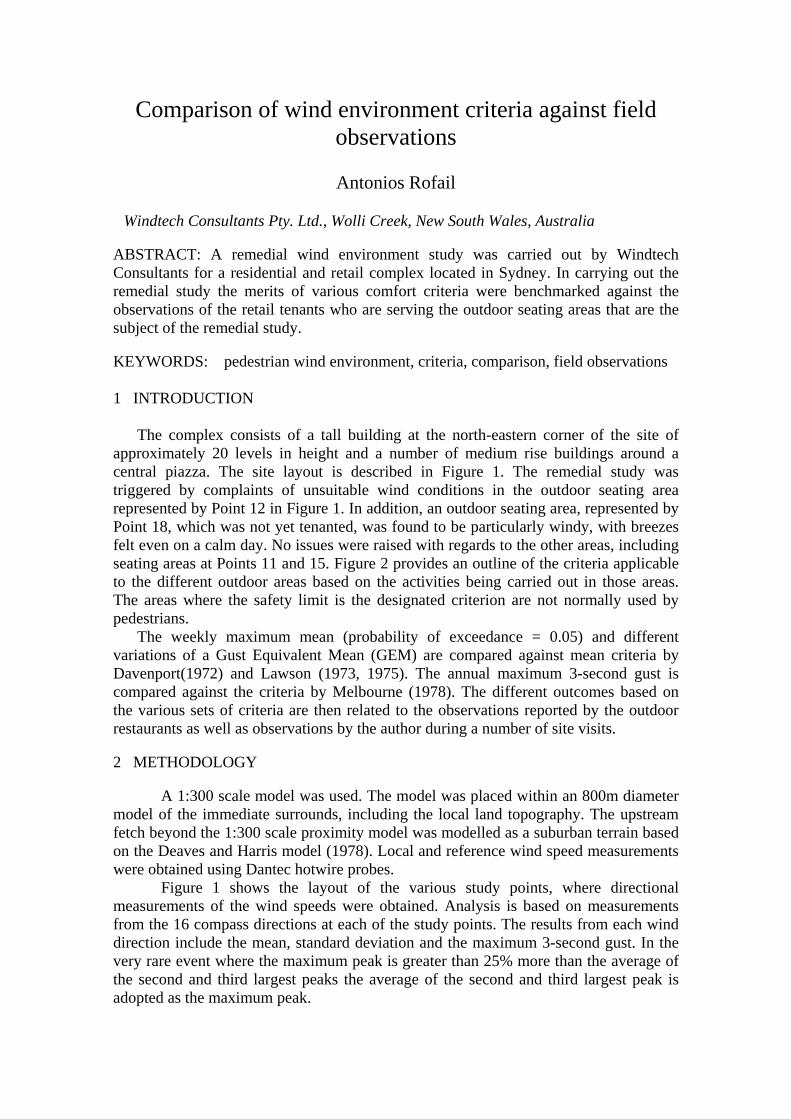
Figure 1 shows the layout of the various study points, where directional measurements of the wind speeds were obtained. Analysis is based on measurements from the 16 compass directions at each of the study points. The results from each wind direction include the mean, standard deviation and the maximum 3-second gust. In the very rare event where the maximum peak is greater than 25% more than the average of the second and third largest peaks the average of the second and third largest peak is adopted as the maximum peak.
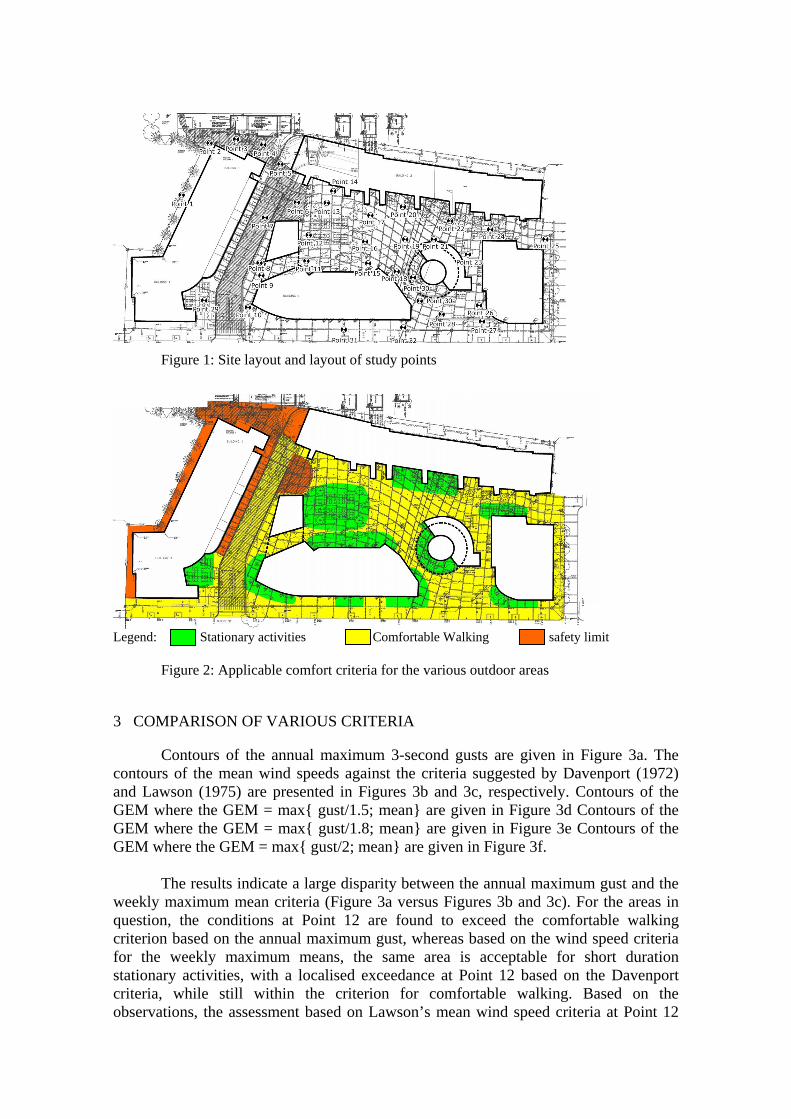
Figure 1: Site layout and layout of study points
Legend: Stationary activities Comfortable Walking safety limit
Figure 2: Applicable comfort criteria for the various outdoor areas
3 COMPARISON OF VARIOUS CRITERIA
Contours of the annual maximum 3-second gusts are given in Figure 3a. The contours of the mean wind speeds against the criteria suggested by Davenport (1972) and Lawson (1975) are presented in Figures 3b and 3c, respectively. Contours of the GEM where the GEM = max{ gust/1.5; mean} are given in Figure 3d Contours of the GEM where the GEM = max{ gust/1.8; mean} are given in Figure 3e Contours of the GEM where the GEM = max{ gust/2; mean} are given in Figure 3f.
The results indicate a large disparity between the annual maximum gust and the weekly maximum mean criteria (Figure 3a versus Figures 3b and 3c). For the areas in question, the conditions at Point 12 are found to exceed the comfortable walking criterion based on the annual maximum gust, whereas based on the wind speed criteria for the weekly maximum means, the same area is acceptable for short duration stationary activities, with a localised exceedance at Point 12 based on the Davenport criteria, while still within the criterion for comfortable walking. Based on the observations, the assessment based on Lawson’s mean wind speed criteria at Point 12
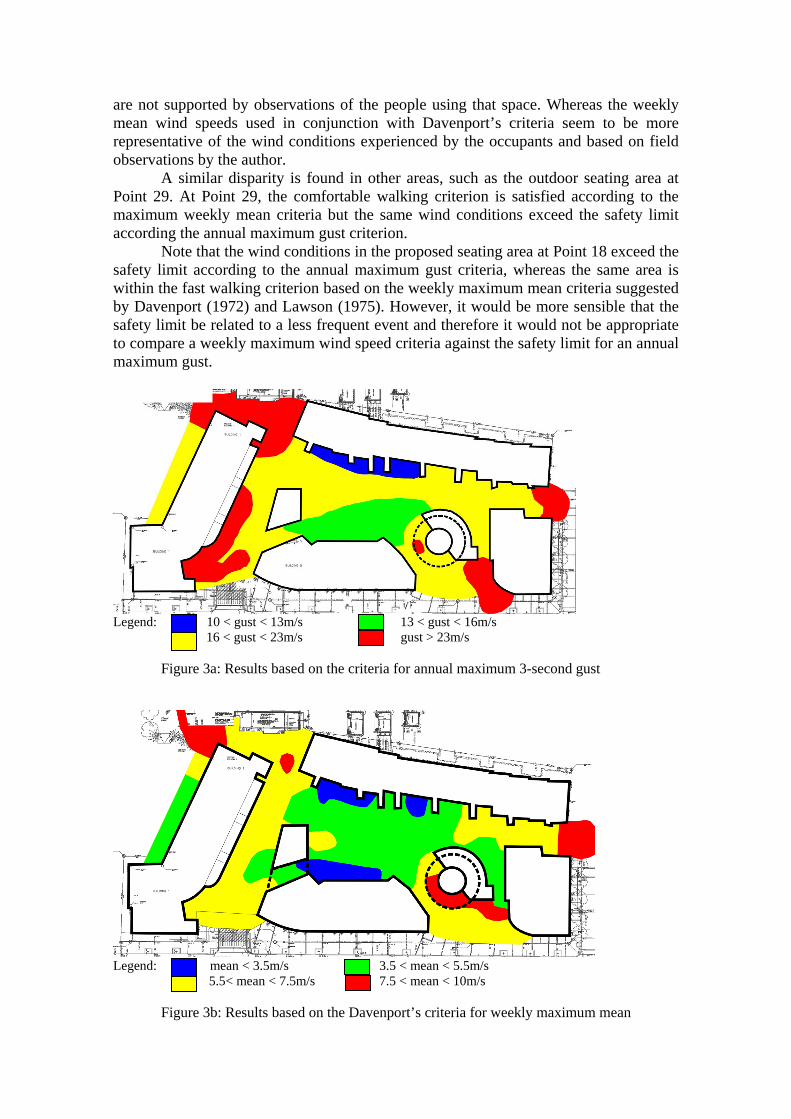
are not supported by observations of the people using that space. Whereas the weekly mean wind speeds used in conjunction with Davenport’s criteria seem to be more representative of the wind conditions experienced by the occupants and based on field observations by the author.
A similar disparity is found in other areas, such as the outdoor seating area at Point 29. At Point 29, the comfortable walking criterion is satisfied according to the maximum weekly mean criteria but the same wind conditions exceed the safety limit according the annual maximum gust criterion.
Note that the wind conditions in the proposed seating area at Point 18 exceed the safety limit according to the annual maximum gust criteria, whereas the same area is within the fast walking criterion based on the weekly maximum mean criteria suggested by Davenport (1972) and Lawson (1975). However, it would be more sensible that the safety limit be related to a less frequent event and therefore it would not be appropriate to compare a weekly maximum wind speed criteria against the safety limit for an annual maximum gust.
Legend: 10 < gust < 13m/s 13 < gust < 16m/s 16 < gust < 23m/s gust > 23m/s
Figure 3a: Results based on the criteria for annual maximum 3-second gust
Legend: mean < 3.5m/s 3.5 < mean < 5.5m/s
5.5< mean < 7.5m/s 7.5 < mean < 10m/s Figure 3b: Results based on the Davenport’s criteria for weekly maximum mean
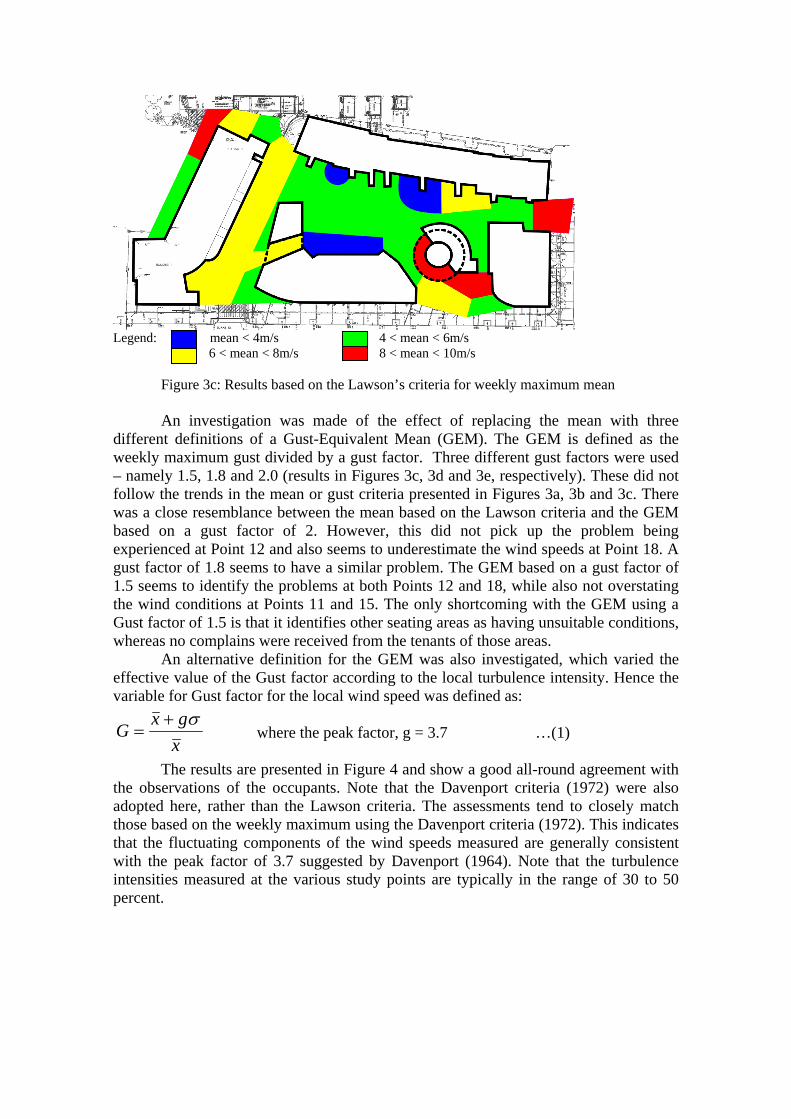
Legend: mean < 4m/s 4 < mean < 6m/s
6 < mean < 8m/s 8 < mean < 10m/s Figure 3c: Results based on the Lawson’s criteria for weekly maximum mean
An investigation was made of the effect of replacing the mean with three
different definitions of a Gust-Equivalent Mean (GEM). The GEM is defined as the weekly maximum gust divided by a gust factor. Three different gust factors were used – namely 1.5, 1.8 and 2.0 (results in Figures 3c, 3d and 3e, respectively). These did not follow the trends in the mean or gust criteria presented in Figures 3a, 3b and 3c. There was a close resemblance between the mean based on the Lawson criteria and the GEM based on a gust factor of 2. However, this did not pick up the problem being experienced at Point 12 and also seems to underestimate the wind speeds at Point 18. A gust factor of 1.8 seems to have a similar problem. The GEM based on a gust factor of 1.5 seems to identify the problems at both Points 12 and 18, while also not overstating the wind conditions at Points 11 and 15. The only shortcoming with the GEM using a Gust factor of 1.5 is that it identifies other seating areas as having unsuitable conditions, whereas no complains were received from the tenants of those areas.
An alternative definition for the GEM was also investigated, which varied the effective value of the Gust factor according to the local turbulence intensity. Hence the variable for Gust factor for the local wind speed was defined as: where the peak factor, g = 3.7 …(1)
The results are presented in Figure 4 and show a good all-round agreement with the observations of the occupants. Note that the Davenport criteria (1972) were also adopted here, rather than the Lawson criteria. The assessments tend to closely match those based on the weekly maximum using the Davenport criteria (1972). This indicates that the fluctuating components of the wind speeds measured are generally consistent with the peak factor of 3.7 suggested by Davenport (1964). Note that the turbulence intensities measured at the various study points are typically in the range of 30 to 50 percent.
xgx
Gσ+
=
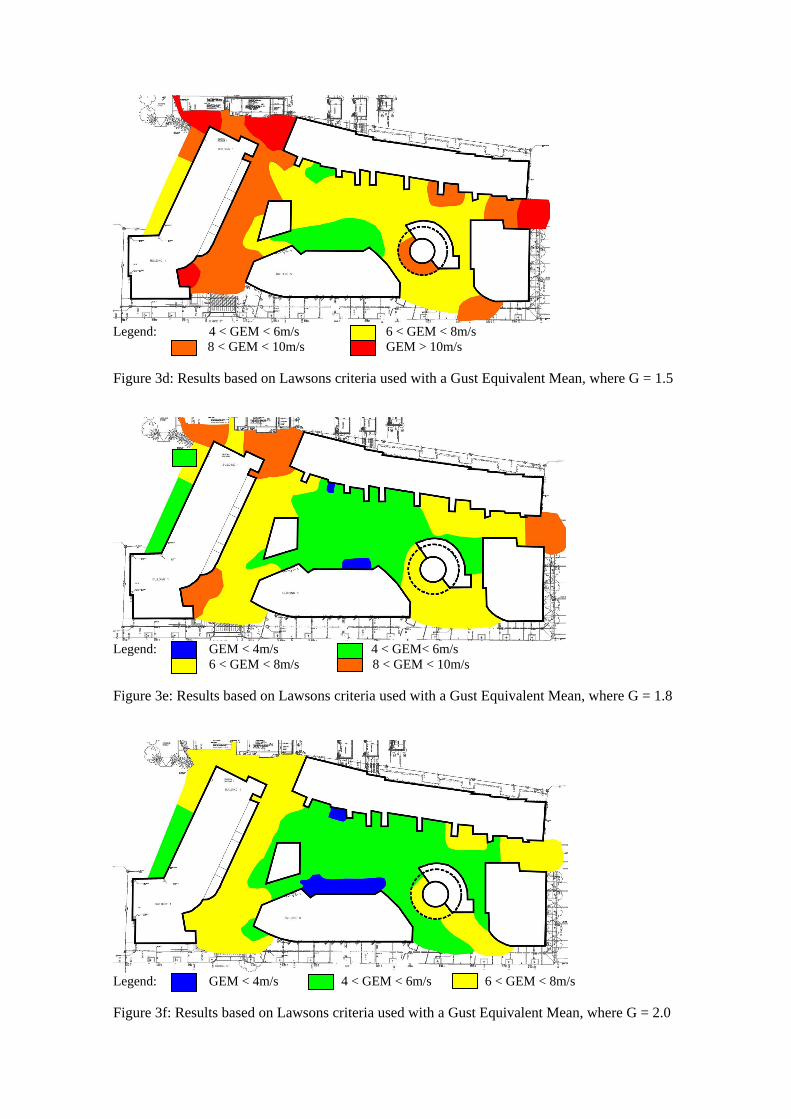
Legend: 4 < GEM < 6m/s 6 < GEM < 8m/s
8 < GEM < 10m/s GEM > 10m/s Figure 3d: Results based on Lawsons criteria used with a Gust Equivalent Mean, where G = 1.5
Legend: GEM < 4m/s 4 < GEM< 6m/s
6 < GEM < 8m/s 8 < GEM < 10m/s Figure 3e: Results based on Lawsons criteria used with a Gust Equivalent Mean, where G = 1.8
Legend: GEM < 4m/s 4 < GEM < 6m/s 6 < GEM < 8m/s Figure 3f: Results based on Lawsons criteria used with a Gust Equivalent Mean, where G = 2.0
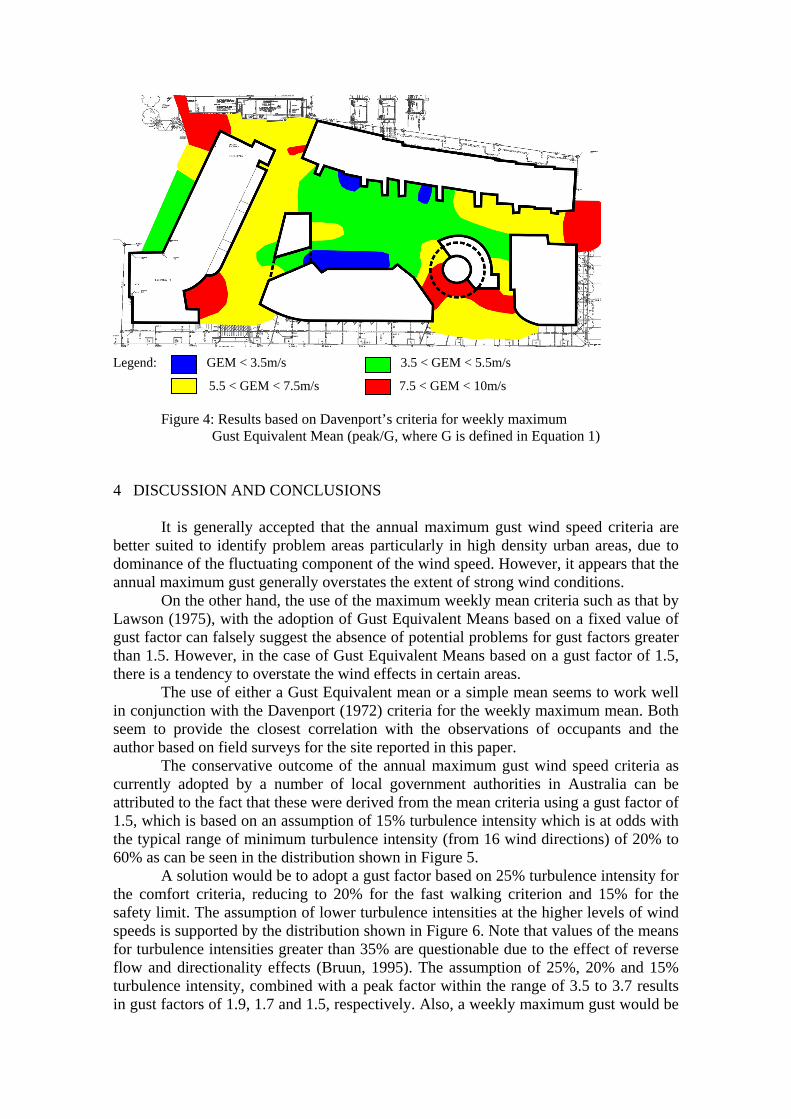
Legend: GEM < 3.5m/s 3.5 < GEM < 5.5m/s
5.5 < GEM < 7.5m/s 7.5 < GEM < 10m/s
Figure 4: Results based on Davenport’s criteria for weekly maximum Gust Equivalent Mean (peak/G, where G is defined in Equation 1) 4 DISCUSSION AND CONCLUSIONS
It is generally accepted that the annual maximum gust wind speed criteria are better suited to identify problem areas particularly in high density urban areas, due to dominance of the fluctuating component of the wind speed. However, it appears that the annual maximum gust generally overstates the extent of strong wind conditions.
On the other hand, the use of the maximum weekly mean criteria such as that by Lawson (1975), with the adoption of Gust Equivalent Means based on a fixed value of gust factor can falsely suggest the absence of potential problems for gust factors greater than 1.5. However, in the case of Gust Equivalent Means based on a gust factor of 1.5, there is a tendency to overstate the wind effects in certain areas.
The use of either a Gust Equivalent mean or a simple mean seems to work well in conjunction with the Davenport (1972) criteria for the weekly maximum mean. Both seem to provide the closest correlation with the observations of occupants and the author based on field surveys for the site reported in this paper.
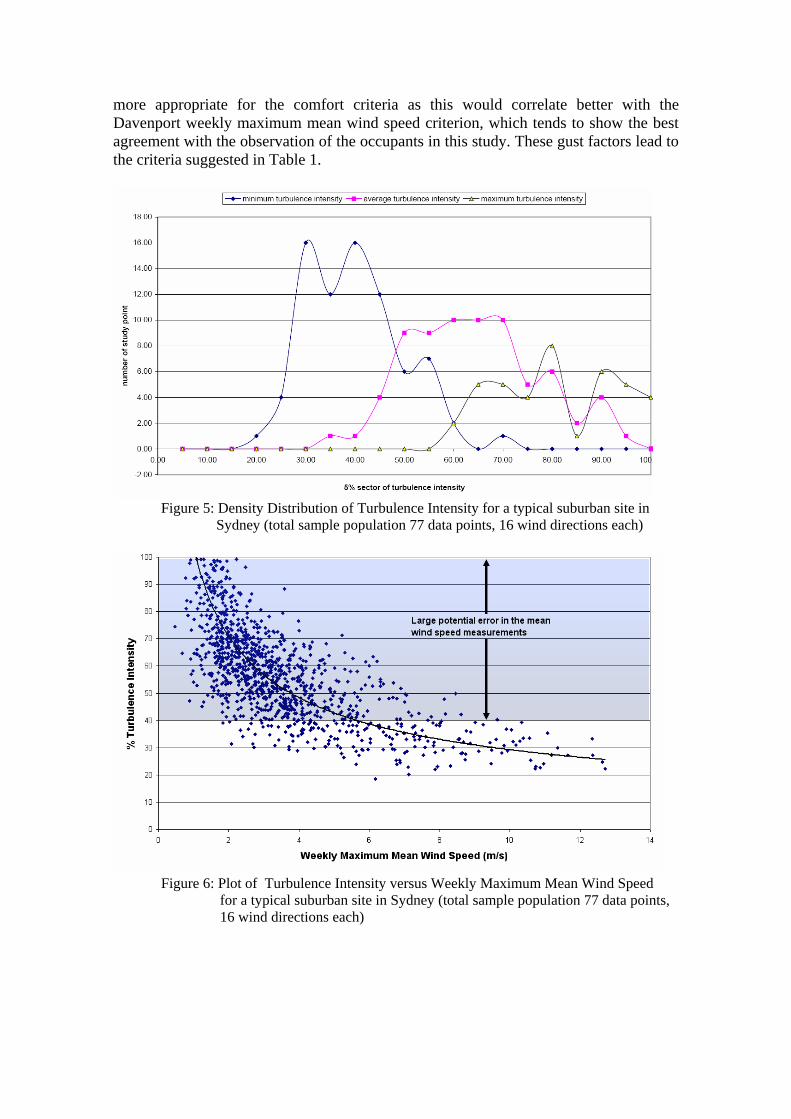
The conservative outcome of the annual maximum gust wind speed criteria as currently adopted by a number of local government authorities in Australia can be attributed to the fact that these were derived from the mean criteria using a gust factor of 1.5, which is based on an assumption of 15% turbulence intensity which is at odds with the typical range of minimum turbulence intensity (from 16 wind directions) of 20% to 60% as can be seen in the distribution shown in Figure 5.
A solution would be to adopt a gust factor based on 25% turbulence intensity for the comfort criteria, reducing to 20% for the fast walking criterion and 15% for the safety limit. The assumption of lower turbulence intensities at the higher levels of wind speeds is supported by the distribution shown in Figure 6. Note that values of the means for turbulence intensities greater than 35% are questionable due to the effect of reverse flow and directionality effects (Bruun, 1995). The assumption of 25%, 20% and 15% turbulence intensity, combined with a peak factor within the range of 3.5 to 3.7 results in gust factors of 1.9, 1.7 and 1.5, respectively. Also, a weekly maximum gust would be
more appropriate for the comfort criteria as this would correlate better with the Davenport weekly maximum mean wind speed criterion, which tends to show the best agreement with the observation of the occupants in this study. These gust factors lead to the criteria suggested in Table 1.
Figure 5: Density Distribution of Turbulence Intensity for a typical suburban site in
Sydney (total sample population 77 data points, 16 wind directions each)
Figure 6: Plot of Turbulence Intensity versus Weekly Maximum Mean Wind Speed
for a typical suburban site in Sydney (total sample population 77 data points, 16 wind directions each)
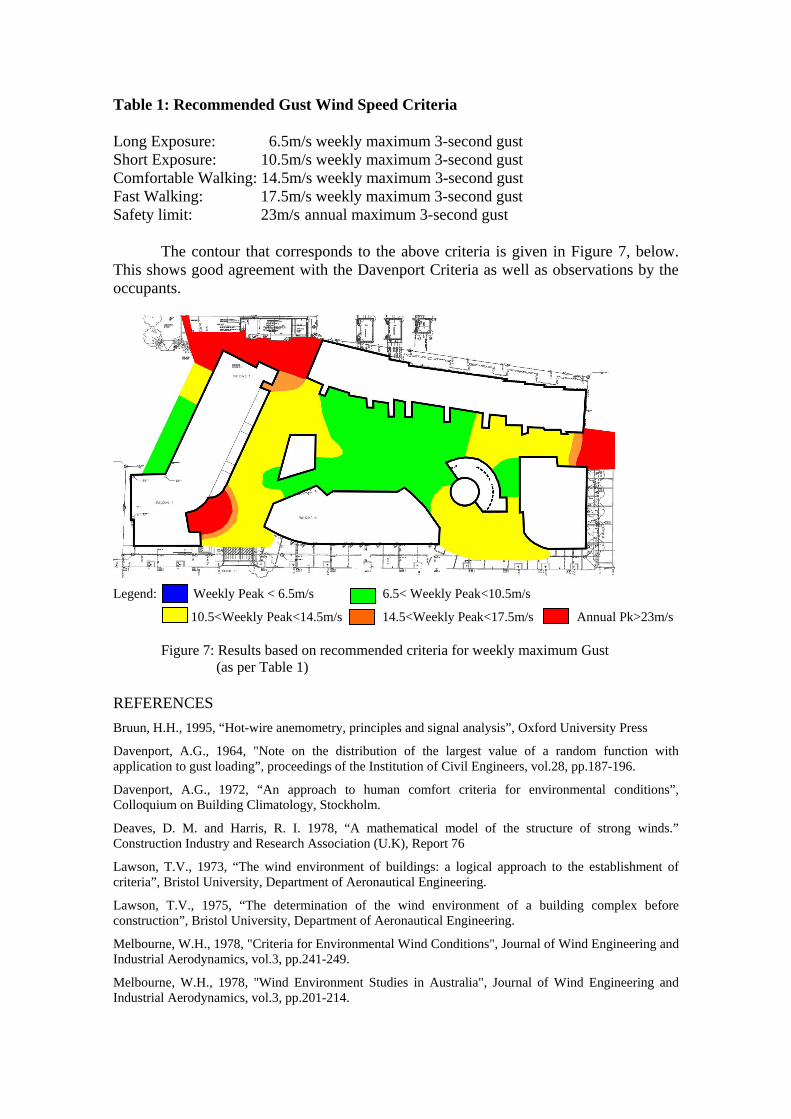
Table 1: Recommended Gust Wind Speed Criteria Long Exposure: 6.5m/s weekly maximum 3-second gust Short Exposure: 10.5m/s weekly maximum 3-second gust Comfortable Walking: 14.5m/s weekly maximum 3-second gust Fast Walking: 17.5m/s weekly maximum 3-second gust Safety limit: 23m/s annual maximum 3-second gust
The contour that corresponds to the above criteria is given in Figure 7, below. This shows good agreement with the Davenport Criteria as well as observations by the occupants.
Legend: Weekly Peak < 6.5m/s 6.5< Weekly Peak<10.5m/s
10.5<Weekly Peak<14.5m/s 14.5<Weekly Peak<17.5m/s Annual Pk>23m/s
Figure 7: Results based on recommended criteria for weekly maximum Gust (as per Table 1) REFERENCES Bruun, H.H., 1995, “Hot-wire anemometry, principles and signal analysis”, Oxford University Press
Davenport, A.G., 1964, "Note on the distribution of the largest value of a random function with application to gust loading”, proceedings of the Institution of Civil Engineers, vol.28, pp.187-196.
Davenport, A.G., 1972, “An approach to human comfort criteria for environmental conditions”, Colloquium on Building Climatology, Stockholm.
Deaves, D. M. and Harris, R. I. 1978, “A mathematical model of the structure of strong winds.” Construction Industry and Research Association (U.K), Report 76
Lawson, T.V., 1973, “The wind environment of buildings: a logical approach to the establishment of criteria”, Bristol University, Department of Aeronautical Engineering.
Lawson, T.V., 1975, “The determination of the wind environment of a building complex before construction”, Bristol University, Department of Aeronautical Engineering.
Melbourne, W.H., 1978, "Criteria for Environmental Wind Conditions", Journal of Wind Engineering and Industrial Aerodynamics, vol.3, pp.241-249.
Melbourne, W.H., 1978, "Wind Environment Studies in Australia", Journal of Wind Engineering and Industrial Aerodynamics, vol.3, pp.201-214.