comparison of the u.s. and fao/who listeria...
TRANSCRIPT

Comparison of the U.S. and FAO/WHO Listeria monocytogenes
Risk Assessments
Robert L. BuchananRobert L. BuchananDHHS Food and Drug AdministrationDHHS Food and Drug Administration
Center for Food Safety and Applied NutritionCenter for Food Safety and Applied Nutrition

Listeria monocytogenesListeria monocytogenesFoodborneFoodborne bacterium that causes a bacterium that causes a relatively rare, life threatening diseaserelatively rare, life threatening disease
Primarily affects neonates, elderly, Primarily affects neonates, elderly, individuals with depressed immunityindividuals with depressed immunity
Associated with readyAssociated with ready--toto--eat foods, eat foods, particularly those refrigerated for particularly those refrigerated for extended periodsextended periods

Risk AssessmentsRisk AssessmentsTwo risk assessments in final stagesTwo risk assessments in final stages
U.S. DHHS (FDA) and USDA (FSIS)U.S. DHHS (FDA) and USDA (FSIS)FAO/WHO (JEMRA)FAO/WHO (JEMRA)
Both are risk ranking risk assessments Both are risk ranking risk assessments focused on readyfocused on ready--to eat foodsto eat foodsDeveloped to answer different risk Developed to answer different risk management questionsmanagement questions

FDA/FSIS Risk FDA/FSIS Risk AssessmentAssessment
The The Listeria Listeria “Problem”“Problem”
Improve public Improve public health by health by determining determining which foods which foods should receive should receive the most the most regulatory regulatory attentionattention
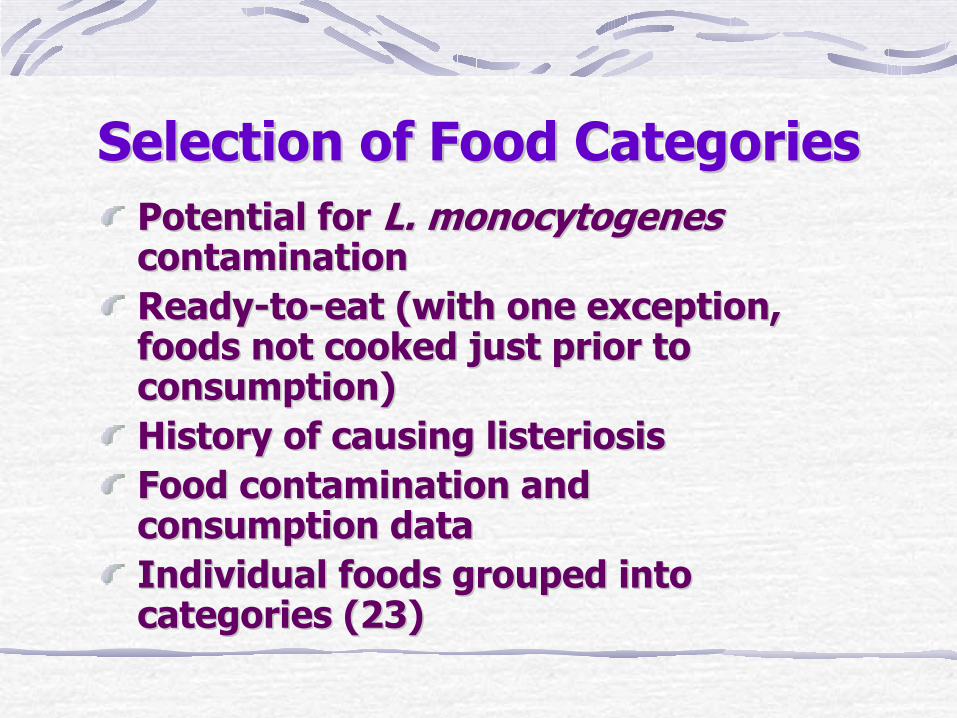
Selection of Food CategoriesSelection of Food CategoriesPotential for Potential for L. L. monocytogenesmonocytogenescontaminationcontaminationReadyReady--toto--eat (with one exception, eat (with one exception, foods not cooked just prior to foods not cooked just prior to consumption)consumption)History of causing listeriosisHistory of causing listeriosisFood contamination and Food contamination and consumption dataconsumption dataIndividual foods grouped into Individual foods grouped into categories (23)categories (23)

Populations StudiedPopulations Studied
PerinatalPerinatal:: 16 weeks after fertilization 16 weeks after fertilization to 30 days after birthto 30 days after birth
Elderly:Elderly: 60 or more years of age60 or more years of age
IntermediateIntermediate--age:age: General General population less than 60 years old, population less than 60 years old, includes healthy people and people includes healthy people and people more susceptible to listeriosismore susceptible to listeriosis

Risk Assessment FrameworkRisk Assessment Framework
Followed guidelines established by Followed guidelines established by Codex Codex AlimentariusAlimentarius, NACMCF, and , NACMCF, and ICMSF for the conduct of a microbial ICMSF for the conduct of a microbial risk assessment:risk assessment:
TransparencyTransparencyBroad scientific and stakeholder inputBroad scientific and stakeholder inputExtensive peer reviewExtensive peer review

Technical and Scientific Reviews of the Technical and Scientific Reviews of the FDA/FSIS Risk AssessmentFDA/FSIS Risk Assessment
Revised Document
Draft for Public Comment
Internal and External ReviewData and Assumptions
ModelDraft Document
Request for Data and InformationFederal Register Notice
Public MeetingsAdvisory Committee (NACMCF)
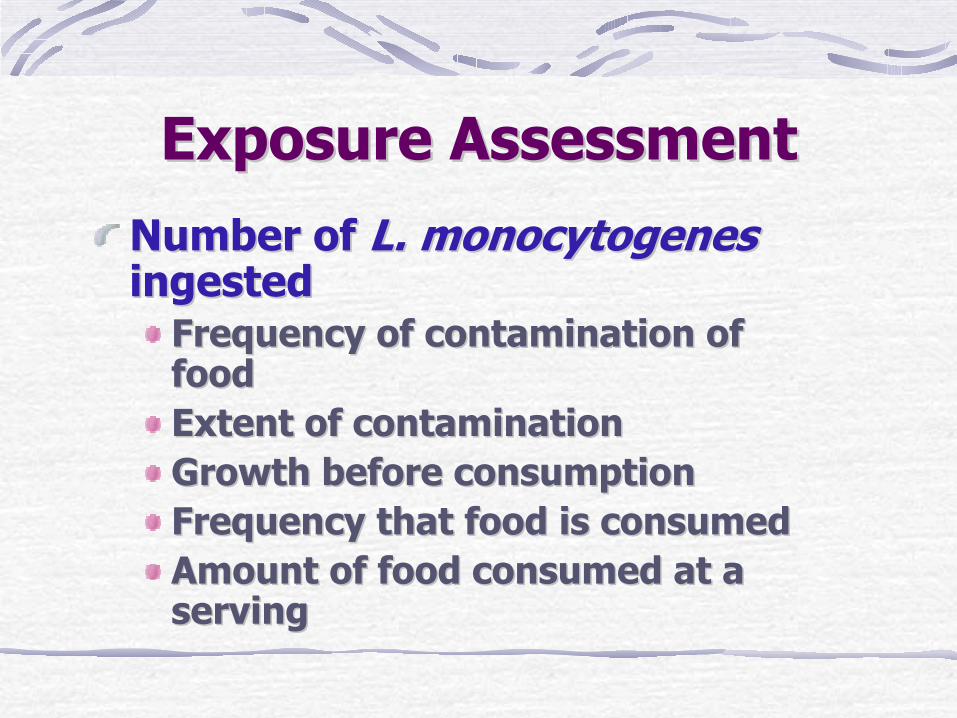
Exposure AssessmentExposure AssessmentNumber of Number of L. monocytogenesL. monocytogenesingestedingested
Frequency of contamination of Frequency of contamination of foodfoodExtent of contaminationExtent of contaminationGrowth before consumptionGrowth before consumptionFrequency that food is consumedFrequency that food is consumedAmount of food consumed at a Amount of food consumed at a servingserving
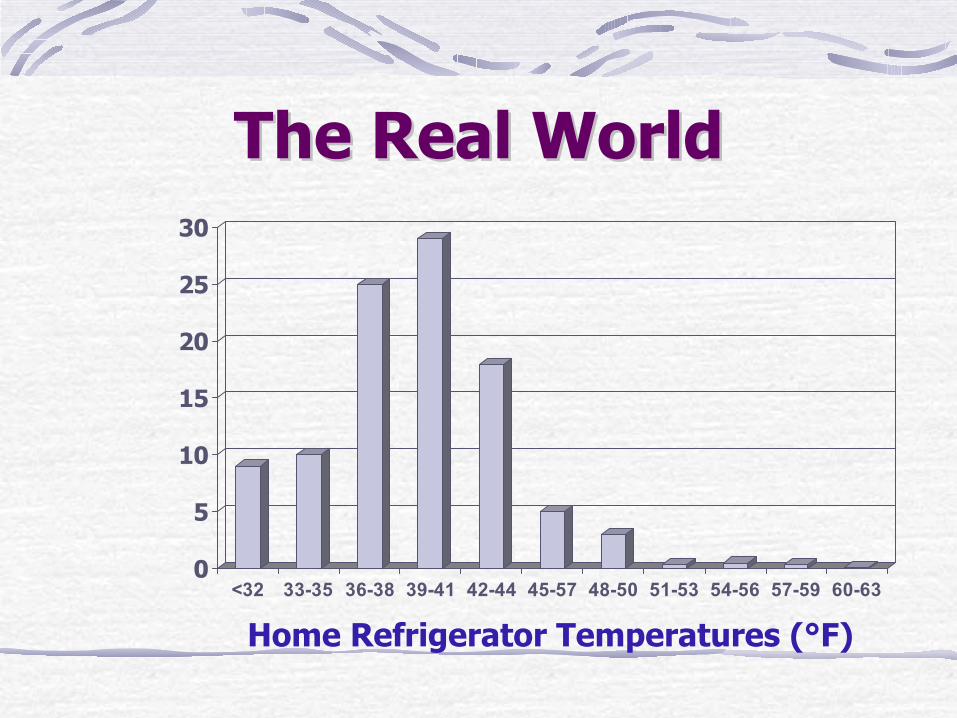
The Real WorldThe Real World
0
5
10
15
20
25
30
<32 33-35 36-38 39-41 42-44 45-57 48-50 51-53 54-56 57-59 60-63
Home Refrigerator Temperatures (°F)

Hazard CharacterizationHazard CharacterizationProbability of illness/mortality as a function Probability of illness/mortality as a function of number of of number of L. monocytogenesL. monocytogenes ingestedingested
DoseDose--response curve “shape” from miceresponse curve “shape” from miceVariation in virulence of Variation in virulence of L. monocytogenesL. monocytogenesisolatesisolatesAccounting for differences in susceptibility of Accounting for differences in susceptibility of mice and men mice and men -- “anchor to health statistics”“anchor to health statistics”Variation in susceptibility within age groupsVariation in susceptibility within age groupsVariation in susceptibility between age groupsVariation in susceptibility between age groups
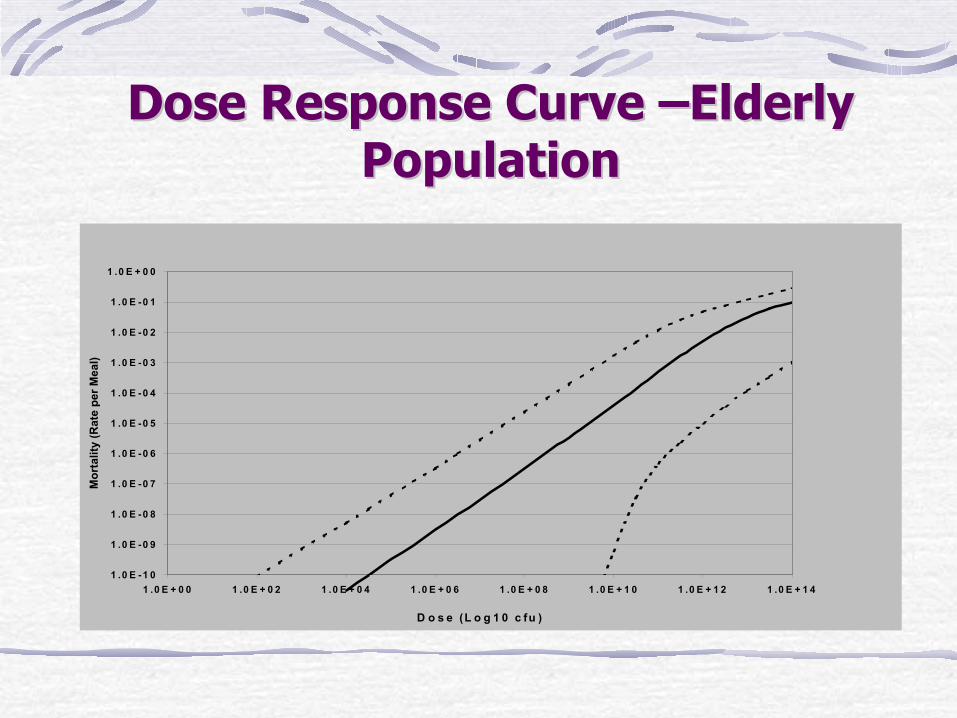
Dose Response Curve Dose Response Curve ––Elderly Elderly PopulationPopulation
1 .0 E -1 0
1 .0 E -0 9
1 .0 E -0 8
1 .0 E -0 7
1 .0 E -0 6
1 .0 E -0 5
1 .0 E -0 4
1 .0 E -0 3
1 .0 E -0 2
1 .0 E -0 1
1 .0 E + 0 0
1 .0 E + 0 0 1 .0 E + 0 2 1 .0 E + 0 4 1 .0 E + 0 6 1 .0 E + 0 8 1 .0 E + 1 0 1 .0 E + 1 2 1 .0 E + 1 4
D o s e (L o g 1 0 c fu )
Mor
talit
y (R
ate
per M
eal)

Risk CharacterizationRisk Characterization
Combine exposure assessment and Combine exposure assessment and hazard characterizationhazard characterization
Frequency of death (mortality)Frequency of death (mortality)Convert to severe cases of listeriosis Convert to severe cases of listeriosis by multiplying by 5by multiplying by 5
Characterize variability and Characterize variability and uncertaintyuncertainty

Risk CharacterizationRisk Characterization
Number of Lm Number of Lm consumed per servingconsumed per serving
Mortality cases per servingMortality cases per serving
Dose Dose --response model response model (mortality)(mortality)
Listeriosis cases per Listeriosis cases per annumannum
Listeriosis cases per Listeriosis cases per servingserving
Frequency of servingsFrequency of servings
++Exposure assessmentExposure assessment Hazard characterizationHazard characterization
X 5X 5
X 5X 5
[30,000 + 300] iterations[30,000 + 300] iterations
Repeat 4,000 times!Repeat 4,000 times!

Risk CharacterizationRisk Characterization
Examined results in light of:Examined results in light of:Quantitative resultsQuantitative results
Data variabilityData variabilityModel uncertaintyModel uncertainty
Consideration of qualitative factorsConsideration of qualitative factorsEpidemiological historyEpidemiological historyFood characteristicsFood characteristics
Extensive discussion of each food Extensive discussion of each food categorycategory

Listeriosis: Predicted Relative Risk per Listeriosis: Predicted Relative Risk per ServingServing––Total PopulationTotal Population
0
5
10
15
20
25
P SS FS DM CR PF DS FF SC PM UM DFS MD RS PC GC V F AC ICFood Category
Med
ian
Pre
dict
ed C
ases
per
100
mill
ion
Ser
ving
s

Listeriosis: Predicted Relative Risk per Annum Listeriosis: Predicted Relative Risk per Annum –– Total PopulationTotal Population
00
200200
400400
600600
800800
10001000
12001200
14001400
16001600
Med
ian
Cas
es p
er A
nn
um
Med
ian
Cas
es p
er A
nn
um
DM PM DS FF MD SS P FS CR PC VDFS PF F SC UM RS GC AC IC

Initial Conclusions and Initial Conclusions and InterpretationInterpretation
Broad themes reemphasized:Broad themes reemphasized:Disease primarily impacts specific “atDisease primarily impacts specific “at--risk” subpopulationsrisk” subpopulationsDisease is rare but severeDisease is rare but severeSubstantial difference in risk among Substantial difference in risk among different food categoriesdifferent food categories

Initial Conclusions and Initial Conclusions and InterpretationInterpretation
Major factors that affect risk:Major factors that affect risk:Amount and frequency of consumptionAmount and frequency of consumptionFrequency and levels of contaminationFrequency and levels of contaminationAbility of food to support growthAbility of food to support growthRefrigerated storage temperatureRefrigerated storage temperatureRefrigerated storage timeRefrigerated storage time

Public commentsPublic comments
Submissions to the docket Submissions to the docket represented represented
Consumer groups, industry, trade Consumer groups, industry, trade associations, expert modelers, associations, expert modelers, manufacturers of food processing manufacturers of food processing equipment, food retailers, marketers equipment, food retailers, marketers for food producers/ processors, and for food producers/ processors, and education/scientific societieseducation/scientific societies

Revised Risk AssessmentRevised Risk Assessment
Revise food categoriesRevise food categoriesWeighting of contamination data Weighting of contamination data based on geography, year, and based on geography, year, and study sizestudy sizeAdd new exposure dataAdd new exposure dataImproved growth modelsImproved growth modelsImproved uncertainty analysisImproved uncertainty analysis

Development of “WhatDevelopment of “What--If” ScenariosIf” ScenariosD e l i M e a t - E ld e r ly
0
5 0
1 0 0
1 5 0
2 0 0
2 5 0
3 0 0
3 5 0
0 5 1 0 1 5 2 0 2 5 3
M a x im u m S to r a g e T im e (D a y s )
Ann
ual M
orta
lity
Effect of Storage TimeEffect of Storage Time
Summary: FDA/FSIS Risk Summary: FDA/FSIS Risk AssessmentAssessment
The revised model is completed The revised model is completed and undergoing scientific and and undergoing scientific and management reviewmanagement reviewThe revised risk assessment report The revised risk assessment report is being prepared for scientific and is being prepared for scientific and organizational reviewsorganizational reviewsAnswers questions on regulatory Answers questions on regulatory focus and research needsfocus and research needs

FAO/WHO Risk FAO/WHO Risk AssessmentAssessment
BackgroundBackground
Codex Codex Alimentarius Alimentarius Committee on Food Committee on Food Hygiene (CCFH) developing guidance Hygiene (CCFH) developing guidance document on document on Listeria monocytogenesListeria monocytogenesConsidering different risk management Considering different risk management options including the development of a options including the development of a Food Safety ObjectiveFood Safety ObjectiveAsked JEMRA (FAO/WHO) to conduct Asked JEMRA (FAO/WHO) to conduct risk assessmentrisk assessment
TheThe ListeriaListeria “Problem”“Problem”
CCFH posed three questions:CCFH posed three questions:What would be the impact of varying What would be the impact of varying “criteria” between absence in 25 g to “criteria” between absence in 25 g to 1000 CFU per gram on the risk of 1000 CFU per gram on the risk of listeriosislisteriosis??

TheThe ListeriaListeria “Problem”“Problem”
CCFH posed three questions:CCFH posed three questions:What would be the impact of varying “criteria” between absence What would be the impact of varying “criteria” between absence in 25 g to 1000 CFU per gram on the risk of in 25 g to 1000 CFU per gram on the risk of listeriosislisteriosis??
What is the difference in risk What is the difference in risk associated with foods that do and do associated with foods that do and do not support growth of not support growth of L. L. monocytogenesmonocytogenes??

TheThe ListeriaListeria “Problem”“Problem”
CCFH posed three questions:CCFH posed three questions:What would be the impact of varying “criteria” between absence What would be the impact of varying “criteria” between absence in 25 g to 1000 CFU per gram on the risk of in 25 g to 1000 CFU per gram on the risk of listeriosislisteriosis??What is the difference in risk associated with foods that do andWhat is the difference in risk associated with foods that do and do do not support growth of not support growth of L. L. monocytogenesmonocytogenes??
What is the relative risk of What is the relative risk of listeriosislisteriosisamong different subpopulations as among different subpopulations as compared to the general population?compared to the general population?

ApproachApproach
Limited time and resourcesLimited time and resourcesComplicated by international nature Complicated by international nature of risk assessment teamof risk assessment teamExtensive hazard characterization Extensive hazard characterization with “simplified” dose response with “simplified” dose response modelmodelLimited exposure assessmentLimited exposure assessmentUsed as basis for answering Used as basis for answering questions as simply as possiblequestions as simply as possible
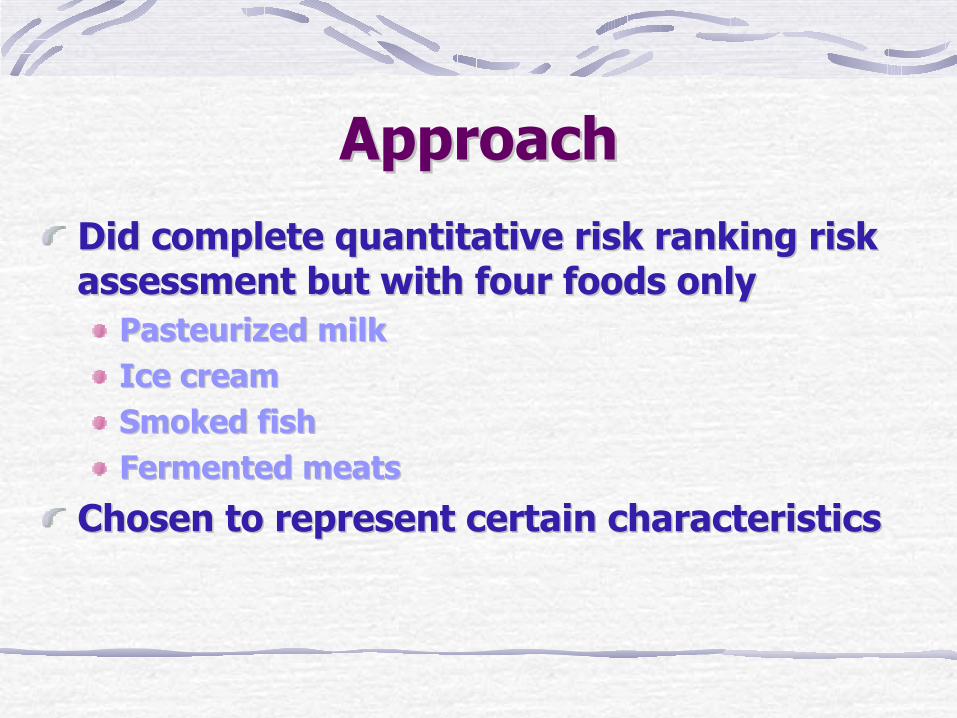
ApproachApproachDid complete quantitative risk ranking risk Did complete quantitative risk ranking risk assessment but with four foods onlyassessment but with four foods only
Pasteurized milkPasteurized milkIce creamIce creamSmoked fishSmoked fishFermented meatsFermented meats
Chosen to represent certain characteristicsChosen to represent certain characteristics

Question 1: “Regulatory Criteria”Answered “simply” based on dose-response models developed in hazard characterizationVaried dose between 0.04 to 1000 CFU/gNon-threshold modelRisk ≥ 25,000 fold higher at 1000 cfu/g compared with absence/25gHowever…….

Predicted Relationships Between Predicted Relationships Between Dose and IncidenceDose and Incidence
82.8982.890.010.01>1,000,000>1,000,000
13.4713.470.020.02100,000100,000
2.852.850.050.0510,00010,000
0.600.600.100.1010001000
0.130.130.210.21100100
0.030.030.430.431010
0.010.010.910.9111
>0.01>0.011.901.900.10.1
0.020.0296.3796.370.040.04
% cases attributable % cases attributable to that levelto that level
% servings annually % servings annually at that levelat that level
Level of Lm in food at Level of Lm in food at consumptionconsumption

Criteria: “Current Levels Scenario”Criteria: “Current Levels Scenario”Level (CFU/g)
Maximum Dose (CFU)
0.04 1 100 0.30.1 3 3.6 0.41 32 1.7 0.510 316 0.8 1.3100 3160 0.4 4.81000 31,600 0.2 21.6
Percentage of servings when maximum l l
Estimated number of listeriosis cases per
Assumption: Distribution of Assumption: Distribution of L. L. monocytogenesmonocytogenes levels as depicted in FDA/FSIS levels as depicted in FDA/FSIS risk assessment, with no servings exceeding the maximum dose.risk assessment, with no servings exceeding the maximum dose.

Criteria: “Worst Case Scenario”Criteria: “Worst Case Scenario”
Level (CFU/g)
Dose (CFU)
Probability of illness per serving
Estimated number of cases per year
0.1 3 1.50 X 10⁻¹¹ 11 32 1.60 X 10⁻¹⁰ 1010 316 1.58 X 10⁻⁹ 101100 3160 1.58 x 10⁻⁸ 1,0131000 31,600 1.58 x 10⁻⁷ 10,128
Assumption: All servings at dose indicated and Assumption: All servings at dose indicated and no servings exceed this value.no servings exceed this value.
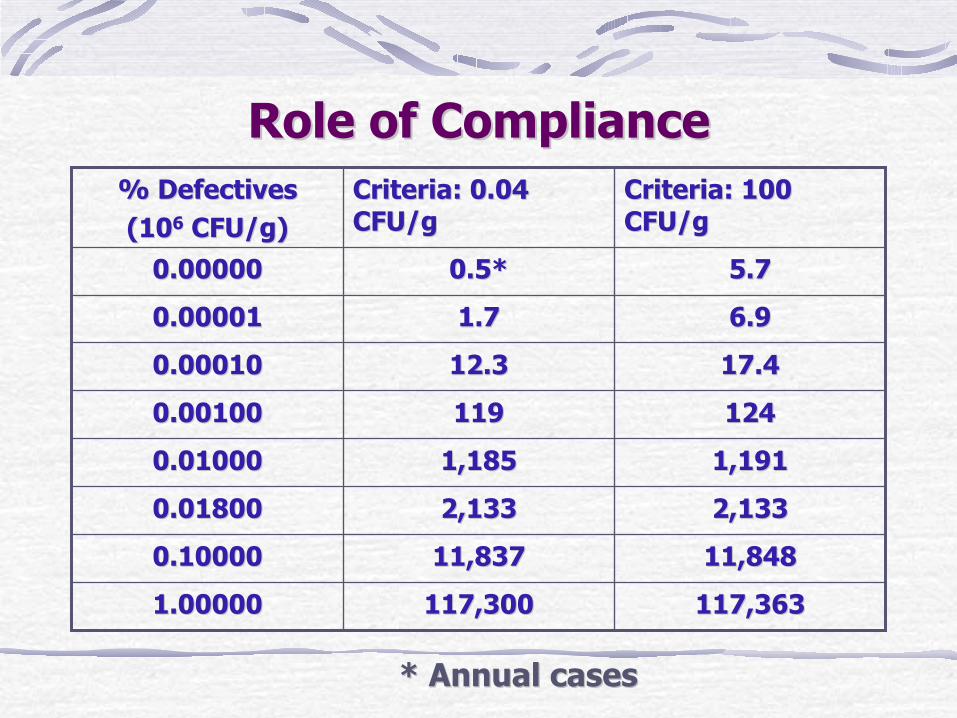
Role of ComplianceRole of Compliance
5.75.70.5*0.5*0.000000.00000
117,363117,363117,300117,3001.000001.00000
11,84811,84811,83711,8370.100000.10000
2,1332,1332,1332,1330.018000.01800
1,1911,1911,1851,1850.010000.01000
1241241191190.001000.00100
17.417.412.312.30.000100.00010
6.96.91.71.70.000010.00001
Criteria: 100 Criteria: 100 CFU/gCFU/g
Criteria: 0.04 Criteria: 0.04 CFU/gCFU/g
% Defectives% Defectives(10(1066 CFU/g)CFU/g)
* Annual cases* Annual cases

Question 2: Increase in Risk Due to GrowthQuestion 2: Increase in Risk Due to Growth
MilkRarely contaminated, allows growth, high consumption
Ice creamRarely contaminated, does not allow growth, high consumption
Smoked fishOften contaminated, allows growth, low consumption
Fermented meatOften contaminated, does not allow growth, low consumption
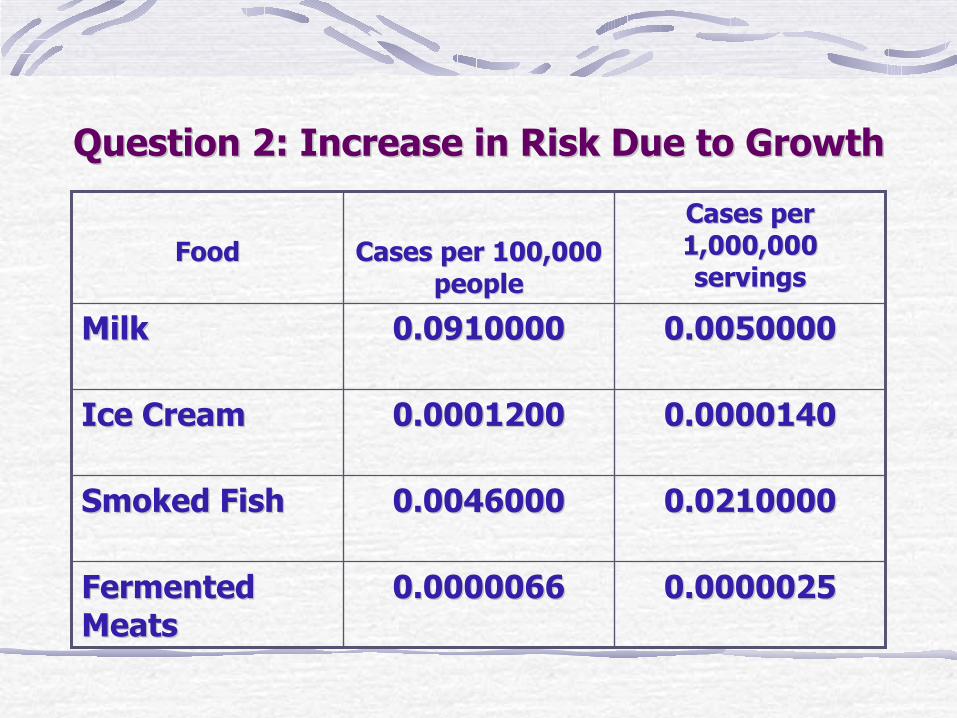
Question 2: Increase in Risk Due to GrowthQuestion 2: Increase in Risk Due to Growth
0.00000250.00000250.00000660.0000066Fermented Fermented MeatsMeats
0.02100000.02100000.00460000.0046000Smoked FishSmoked Fish
0.00001400.00001400.00012000.0001200Ice CreamIce Cream
0.00500000.00500000.09100000.0910000MilkMilk
Cases per Cases per 1,000,000 1,000,000 servingsservings
Cases per 100,000 Cases per 100,000 peoplepeople
FoodFood

Question 3: Relative SusceptibilityQuestion 3: Relative Susceptibility
Developed a quantitative approach Developed a quantitative approach based on dosebased on dose--response model, and response model, and developed relative susceptibility valuesdeveloped relative susceptibility values
Based on extensive epidemiological Based on extensive epidemiological data available from France and United data available from France and United StatesStates

Key Findings: Relative SusceptibilityKey Findings: Relative SusceptibilityCondition Relative susceptibility
Transplant 2584AIDS 865Dialysis 476Cancer-Pulmonary 229Cancer-Bladder and prostate 112Cancer-Gynaecological 66Cancer-Blood 1364Cancer-Gastrointestinal and liver 211Non-cancer liver disease 143Diabetes, non-insulin dependent 25Diabetes, insulin dependent 30Alcoholism 18Over 65 years old 8Less than 65 years, no other condition 1

Summary: FAO/WHO Risk Summary: FAO/WHO Risk AssessmentAssessment
Developed a quantitative risk Developed a quantitative risk assessmentassessment built on the concepts of the built on the concepts of the FDA/FSIS assessment, but focused on a FDA/FSIS assessment, but focused on a somewhat simpler evaluationsomewhat simpler evaluationSuccessfully addressed CCFH questionsSuccessfully addressed CCFH questionsFull document in final editing after Full document in final editing after international peer review.international peer review.

Lessons LearnedLessons LearnedSubstantial differences in the two risk Substantial differences in the two risk assessmentsassessmentsReflect successfully responding to the Reflect successfully responding to the management questions asked of the management questions asked of the risk assessment teamsrisk assessment teamsScientifically support each other while Scientifically support each other while providing unique insightsproviding unique insightsNeed the flexibility to take different Need the flexibility to take different approachesapproaches