comparison of the responses and trauma assessment of the … · 2017-01-10 · comparison of the...
TRANSCRIPT

Comparison of the Responses and Trauma Assessment of The Thor-Lx/HIIIr and
Hybrid III Denton Legs in Frontal Offset
Vehicle Crashes
SAE Government/ Industry Meeting May 2002
James Saunders & Shashi Kuppa National Highway Traffic Safety Administration

Offset Frontal Protection
• Reduce death and injury • Reduce long term impairment, pain
and suffering (especially lower extremities)
• Reduce costs of recovery and rehabilitation

Risk of AIS 2+ Injuries
0%
1%
2%
3%
4%
5%
6%
head neck chest abdmn spine arms legs
Body Regions
Ris
k o
f AIS
2+
Inju
ry
All frontal full frontal left offset right offset
Lower Extremity Injuries
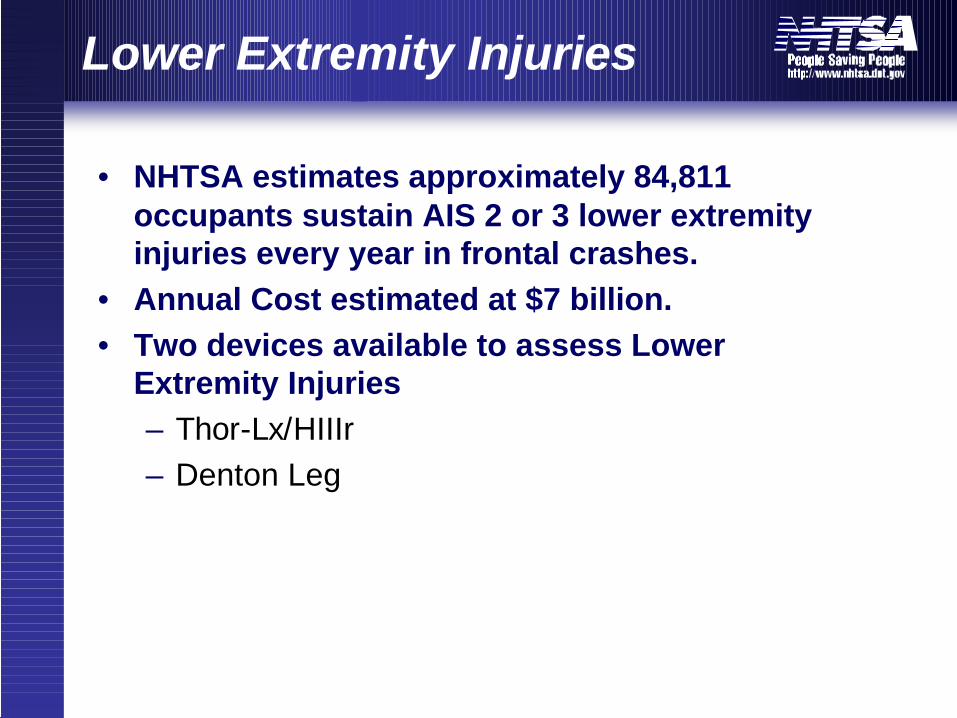
• NHTSA estimates approximately 84,811 occupants sustain AIS 2 or 3 lower extremity injuries every year in frontal crashes.
• Annual Cost estimated at $7 billion. • Two devices available to assess Lower
Extremity Injuries – Thor-Lx/HIIIr – Denton Leg

Thor-Lx
Axial Compliant Element
Accelerometers x,y
Triaxial Accelerometer
Ankle Rotation(x,y,z)
Lower Tibia Load CellFx,Fy,Fz,Mx,My
Upper Tibia Load CellFx,Fz,Mx,My

Denton Leg
Fx, Fz, Mx, My load cell
Fx, Fz, Mx, My load cell
Ankle Accelerometers x,z
Fore-Foot Accelerometer z
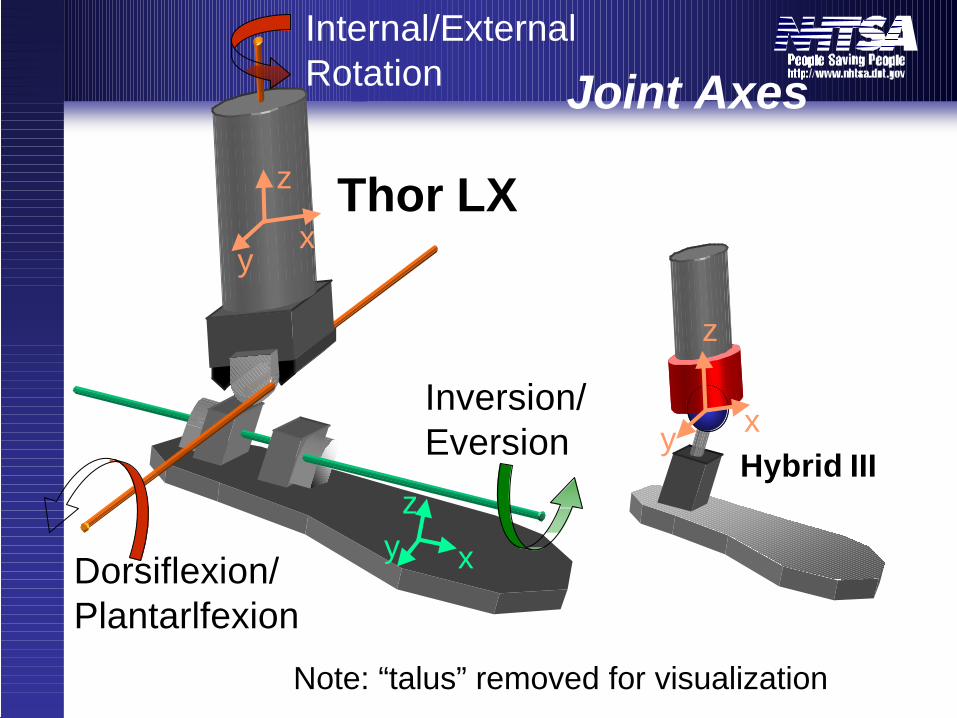
Joint Axes
Inversion/Eversion
Dorsiflexion/Plantarlfexion
xy
z
xyz
Internal/External Rotation
xy
z
Thor LX
Hybrid III
Note: “talus” removed for visualization

Response Characterstics of the HIII/Denton Leg
• Axial force response stiffer than human.
• Tibia offset induces bending moment upon axial loading
• Inversion/eversion range of motion is small
• Torque-angle characteristics of ankle joint are non-continuous
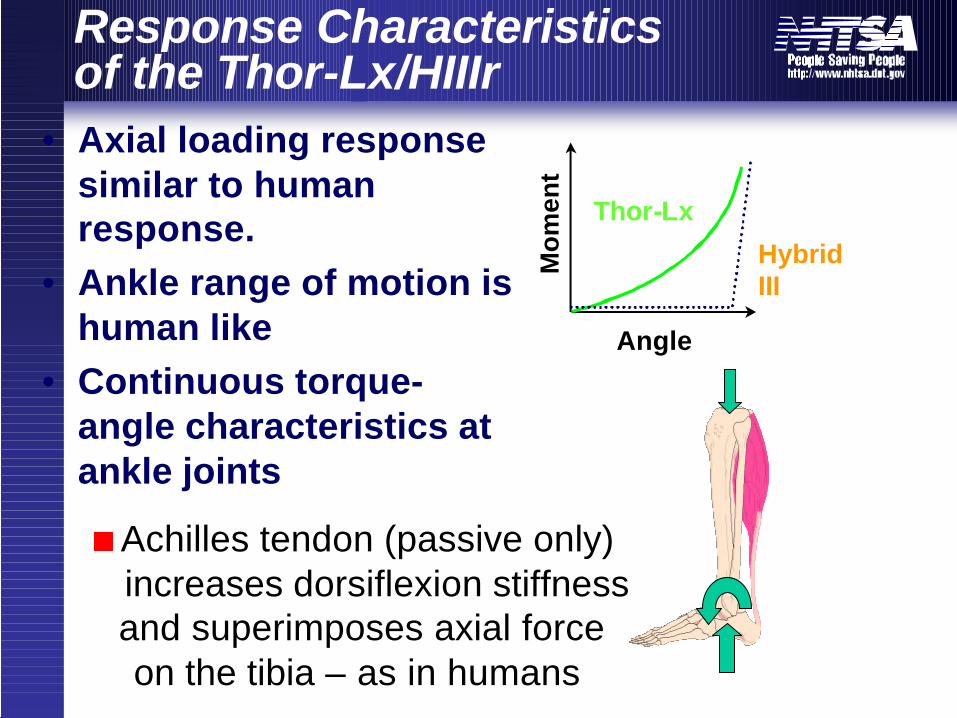
Response Characteristicsof the Thor-Lx/HIIIr
• Axial loading response similar to human response.
• Ankle range of motion is human like
• Continuous torque-angle characteristics at ankle joints
Angle
Thor-Lx
Hybrid III
Mo
men
tAchilles tendon (passive only) increases dorsiflexion stiffness and superimposes axial force on the tibia – as in humans

Injury Criteria for 50th
Percentile Male
Xversion angle = 35 deg
Dorsiflexion angle = 35 degAnkle /malleolus
Lower tibia Fz = 8 kNLower tibia Fz = 5.2 kNCalcaneus, pilon, midfoot
TI(corrected)=F/36+M/225=1RTI=F/12+M/240=0.91Leg Shaft
Upper tibia Fz = 8 kNUpper tibia Fz = 5.6 kNTibia Plateau
Knee shear = 15 mmKnee shear = 15 mmKnee ligament
Femur Fz = 9070 NFemur Fz = 9040 Nknee-thigh-hip
Denton Leg Criteria and LimitsThor-Lx Criteria and LimitsRegion

40% Offset Deformable Barrier Test Setup

2000 Nissan Quest Thor-Lx

Toepan Intrusion Measurements

Max Toepan Intrusion
Max Toepan Intrusion
0
100
200
300
400
96 CAMRY 98 NEON 00 QUEST 00 TAHOE 00 ALTIMA 00 LEGACY
Intr
usi
on
(m
m)
Denton Thor-Lx
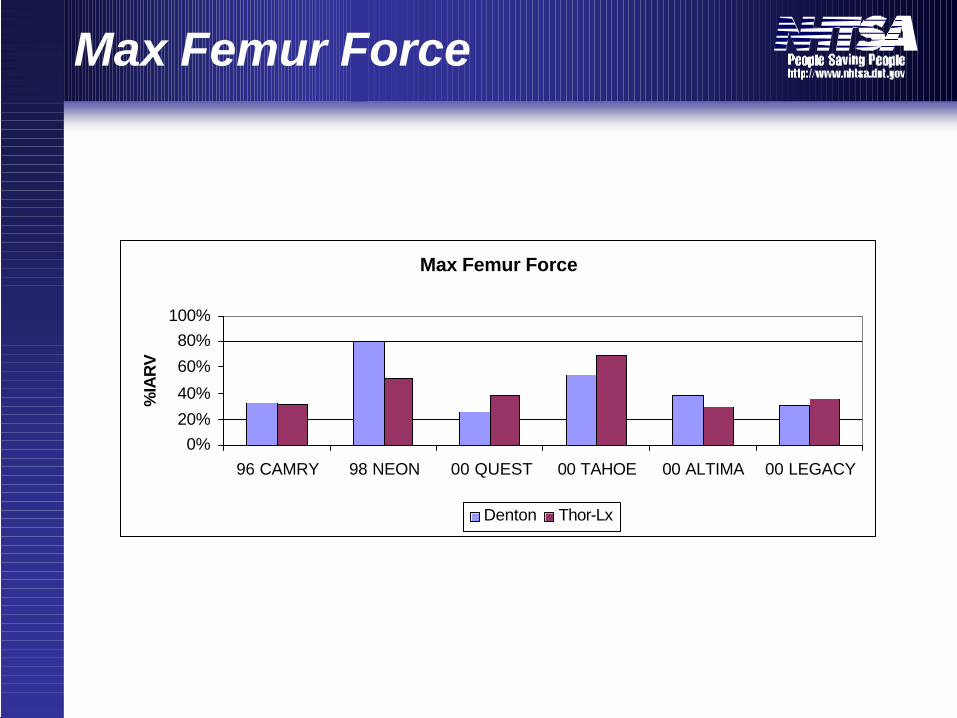
Max Femur Force
Max Femur Force
0% 20%
40%
60%
80% 100%
96 CAMRY 98 NEON 00 QUEST 00 TAHOE 00 ALTIMA 00 LEGACY
%IA
RV
Denton Thor-Lx

Max Knee Shear
Max Knee Shear
0%
50%
100%
150%
96 CAMRY 98 NEON 00 QUEST 00 TAHOE 00 ALTIMA 00 LEGACY
%IA
RV
Denton Thor-Lx

Max Tibia Index
Max Upper Tibia Index
0% 50%
100% 150% 200% 250% 300%
96 CAMRY 98 NEON 00 QUEST 00 TAHOE 00 ALTIMA 00 LEGACY
%IA
RV
Denton Thor-Lx
Max Lower Tibia Index
0% 50%
100% 150% 200% 250%
96 CAMRY 98 NEON 00 QUEST 00 TAHOE 00 ALTIMA 00 LEGACY
%IA
RV
Denton Thor-Lx

Max Tibia Axial Force
Max Upper Tibia Axial Force
0%
50%
100%
150%
96 CAMRY 98 NEON 00 QUEST 00 TAHOE 00 ALTIMA 00 LEGACY
%IA
RV
Denton Thor-Lx
Max Lower Tibia Axial Force
0%
50%
100%
150%
200%
96 CAMRY 98 NEON 00 QUEST 00 TAHOE 00 ALTIMA 00 LEGACY
%IA
RV
Denton Thor-Lx

Thor-Lx Ankle
Thor-Lx Ankle
0% 20% 40% 60% 80%
100% 120%
96 CAMRY 98 NEON 00 QUEST 00 TAHOE 00 ALTIMA 00 LEGACY
%IA
RV
Dorsiflexion Eversion

Implications
• Thor-Lx/HIIIr predicted higher incidence of foot and ankle injuries than leg shaft fractures. This is in accordance with real world crash data
• HIII/Denton leg predicted knee ligament injuries and leg shaft fractures. These constitute only a small percentage of lower limb injuries in real world crashes.

Injury Criteria for 5th
Percentile Female
Xversion angle = 35 deg
Dorsiflexion angle = 35 degAnkle /malleolus
Lower tibia Fz = 5.1 kNLower tibia Fz = 3.8 kNCalcaneu s, pilon, midfoot
TI(corrected)=F/23+M/115=1RTI=F/8.6+M/146=0.91Leg Shaft
Upper tibia Fz = 5.1 kNUpper tibia Fz = 4.0 kNTibia Plateau
Knee shear = 12 mmKnee shear = 13 mmKnee ligament
Femur Fz = 6186 NFemur Fz = 6510 Nknee-thigh-hip
Denton Leg Criteria and LimitsThor-FLx Criteria and LimitsRegion

Injury Assessment Usingthe 5th Denton Leg
Injury limit
left right left right left right left right left right Femur Fz (N)
6186 N 3147.4 1830.513 3804 2535 4170 1563 3721 2942 2964.2 2744.87
Knee Shear (mm)
12 mm ND ND 1.27 2.28 NA NA 0.76 0.84 0.045 0.009
Upper TI
1 0.033 0.626 0.55 0.76 0.81 2.09 0.57 0.43 0.556 1.096
Lower TI
1 0.149 1.845 0.89 2.13 3.34 2.45 0.86 0.78 0.757 1.977
tibia Fz (N) 5104 N 97.71 2210.84 1706 3858 2274 3506 1674 2368 1076.3 3700.86
Quest (60 km/h)Camry (60 km/h) Altima (60 km/h) Neon (60 km/h) Legacy (60 km/h)
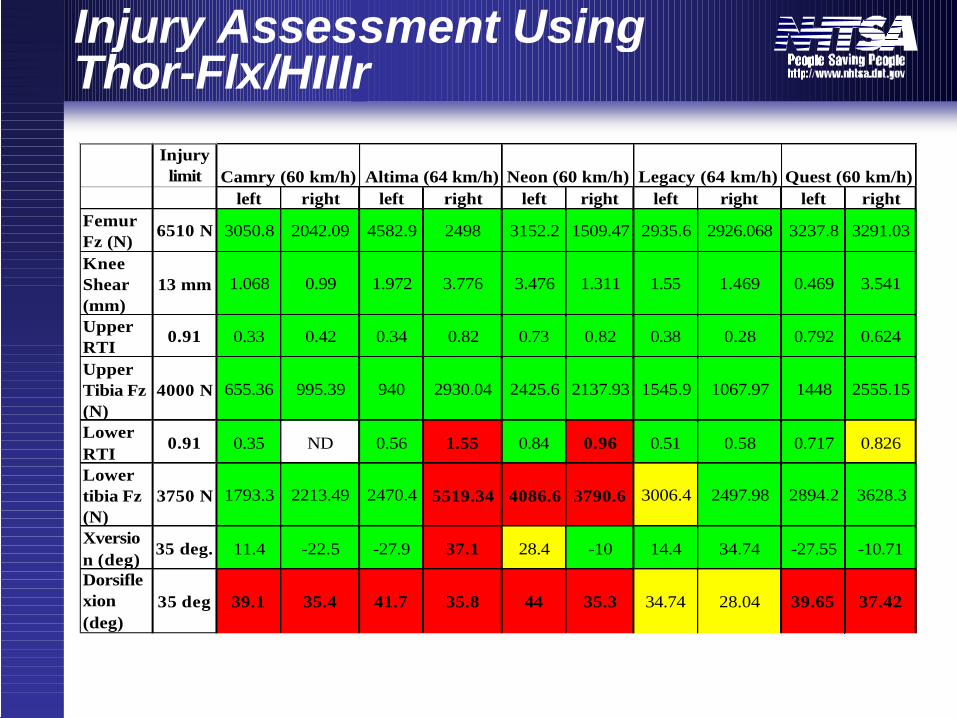
Injury Assessment UsingThor-Flx/HIIIr
Injury limit
left right left right left right left right left right Femur Fz (N)
6510 N 3050.8 2042.09 4582.9 2498 3152.2 1509.47 2935.6 2926.068 3237.8 3291.03
Knee Shear (mm)
13 mm 1.068 0.99 1.972 3.776 3.476 1.311 1.55 1.469 0.469 3.541
Upper RTI
0.91 0.33 0.42 0.34 0.82 0.73 0.82 0.38 0.28 0.792 0.624
Upper Tibia Fz (N)
4000 N 655.36 995.39 940 2930.04 2425.6 2137.93 1545.9 1067.97 1448 2555.15
Lower RTI
0.91 0.35 ND 0.56 1.55 0.84 0.96 0.51 0.58 0.717 0.826
Lower tibia Fz (N)
3750 N 1793.3 2213.49 2470.4 5519.34 4086.6 3790.6 3006.4 2497.98 2894.2 3628.3
Xversio n (deg)
35 deg. 11.4 -22.5 -27.9 37.1 28.4 -10 14.4 34.74 -27.55 -10.71
Dorsifle xion (deg)
35 deg 39.1 35.4 41.7 35.8 44 35.3 34.74 28.04 39.65 37.42
Camry (60 km/h) Altima (64 km/h) Neon (60 km/h) Legacy (64 km/h) Quest (60 km/h)

Implications
• Thor-Flx/HIIIr predicted higher incidence of foot and ankle injuries than leg shaft fractures. This is in accordance with real world crash data
• HIII/Denton leg predicted knee ligament injuries and leg shaft fractures. These constitute only a small percentage of lower limb injuries in real world crashes.

Conclusions
• Both 50th and 5th HIII/Denton and Thor-Lx/HIIIr were durable in crash tests
• Foot rotation measurements provide insight into the interaction of the feet with intruding toe pan.
• Injury assessment with 50th and 5th
Thor-Lx/HIIIr is in accordance with injury distribution seen in real world crashes