comparison of sonic and conventional drilling methods · 2019-05-14 · • establish background...
TRANSCRIPT

A review of sonic drilling and effects of vibrations on SPT values. MATT PRICE - ENGINEERING GEOLOGIST
TIAKI ENGINEERING CONSULTANTS LIMITED
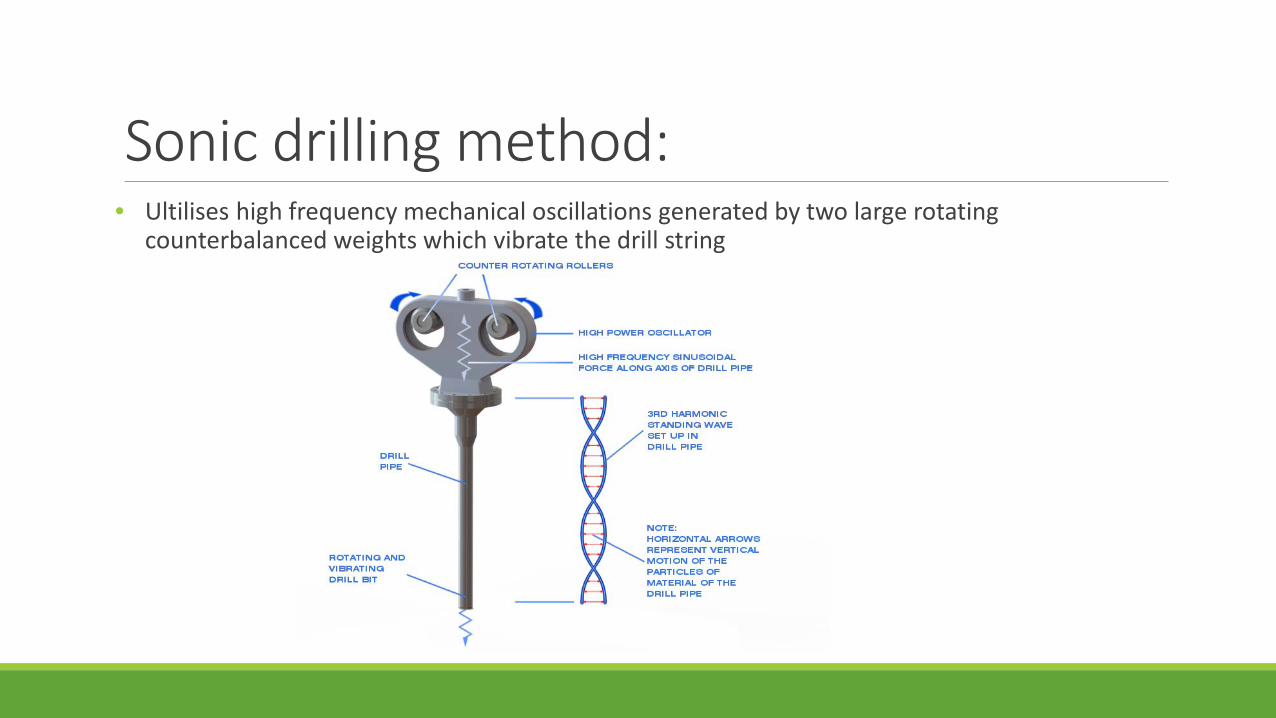
Sonic drilling method: • Ultilises high frequency mechanical oscillations generated by two large rotating
counterbalanced weights which vibrate the drill string
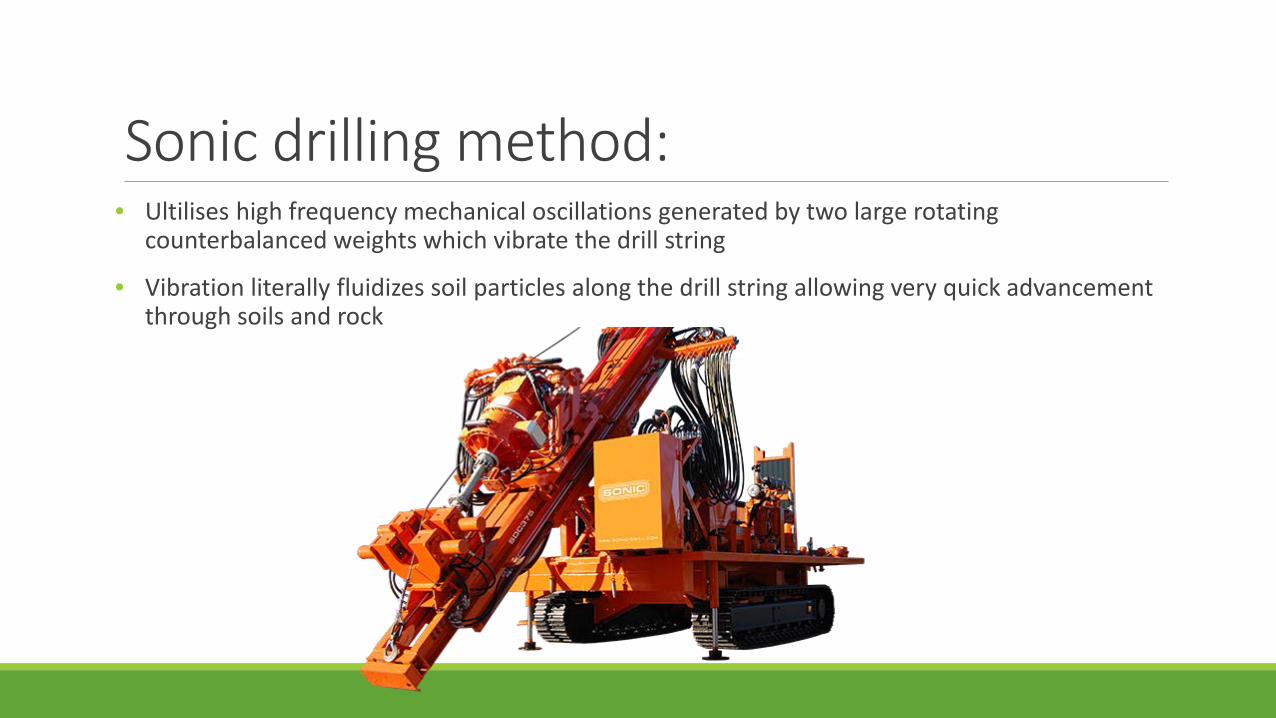
Sonic drilling method: • Ultilises high frequency mechanical oscillations generated by two large rotating
counterbalanced weights which vibrate the drill string
• Vibration literally fluidizes soil particles along the drill string allowing very quick advancement through soils and rock

Pros and cons Pros:
• Considerably faster than conventional drilling methods
• Can drill through unconsolidated sands and gravels and produce continuous core samples
• Can drill without mud or water meaning less mess for the geo to clean up!
• “minimal disturbance to soil sample”
Cons:
• Expensive to set-up rigs and maintain gear
• Dry casing advancement generates heat which can affect environmental sample integrity
• Maximum depth is limited to around 200m
• Relatively new method so minimal research in to quantifying effects of vibrations on soil samples

University of Canterbury research
University of Canterbury research • Aided by Golder Associates (NZ) and undertaken with two class-mates: Charlotte Steele
(AECOM) and Romy Ridl (University of Canterbury)
Research Goals:
• Research historical studies comparing SPT data between drilling methods
• Undertake comparison using data from Golder Associates and Canterbury Geotechnical Database (CGD)
• 11 sites in total where side-by-side sonic and conventional drilling had occurred (between 3 and 40m apart)

University of Canterbury research
Hagley Park
CBD

Comparison procedure • Establish background variance in conventional rotary drilling method from two sites (16
comparative N60 values)
• Compared N60 values from sonic and conventional drilling methods at equivalent depths from 9 sites (49 comparable data points)
• Non-conforming test points such as where lithology different between boreholes removed from dataset
• Quantify difference in N60 values between the drilling methods and inspect what lithology provides the greatest difference
Results • Rotary-rotary comparison yielded average difference in SPT values of 12% (small dataset)
• ASTM D1586 states expected variability is 10%
Results
0
10
20
30
40
50
60
70
80
90
0 10 20 30 40 50 60 70 80 90
Soni
c N
60
Rotary N60
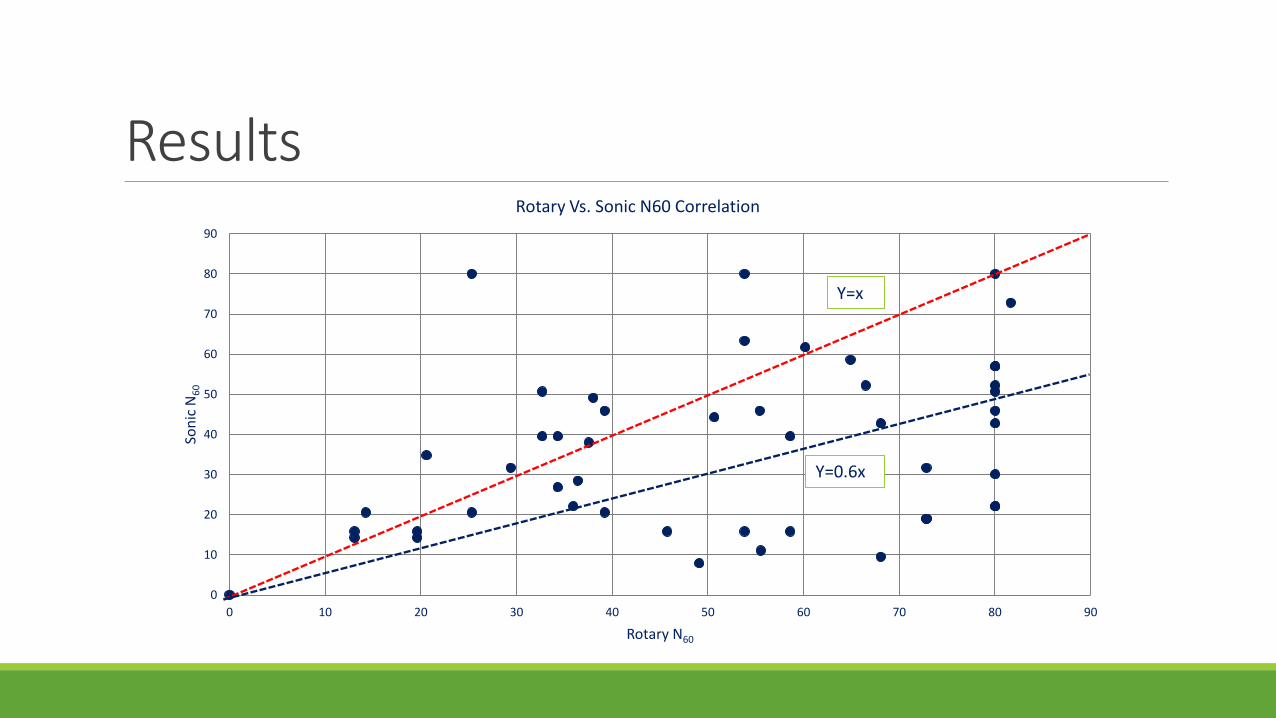
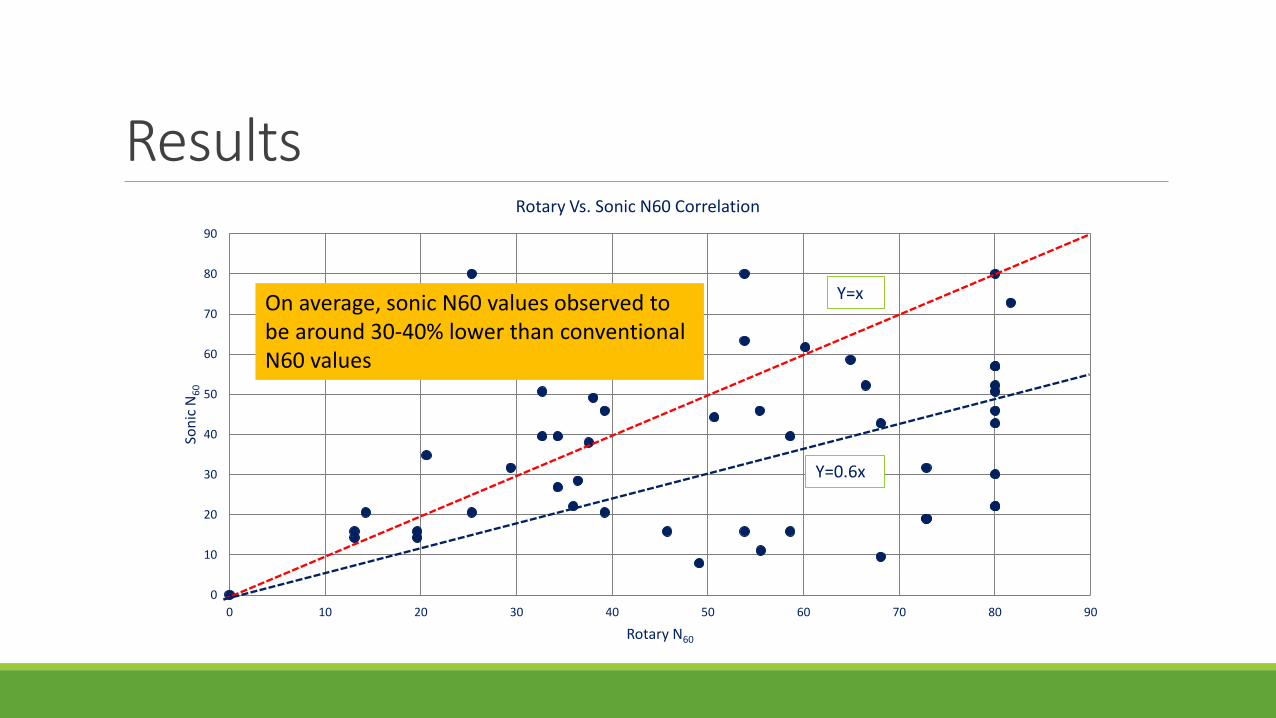
Rotary Vs. Sonic N60 Correlation
Y=x
Y=0.6x
Results
0
10
20
30
40
50
60
70
80
90
0 10 20 30 40 50 60 70 80 90
Soni
c N
60
Rotary N60
Rotary Vs. Sonic N60 Correlation
Y=x
Y=0.6x
On average, sonic N60 values observed to be around 30-40% lower than conventional N60 values
0.00
5.00
10.00
15.00
20.00
25.00
0.1 1.0 10.0
Dep
th (m
)
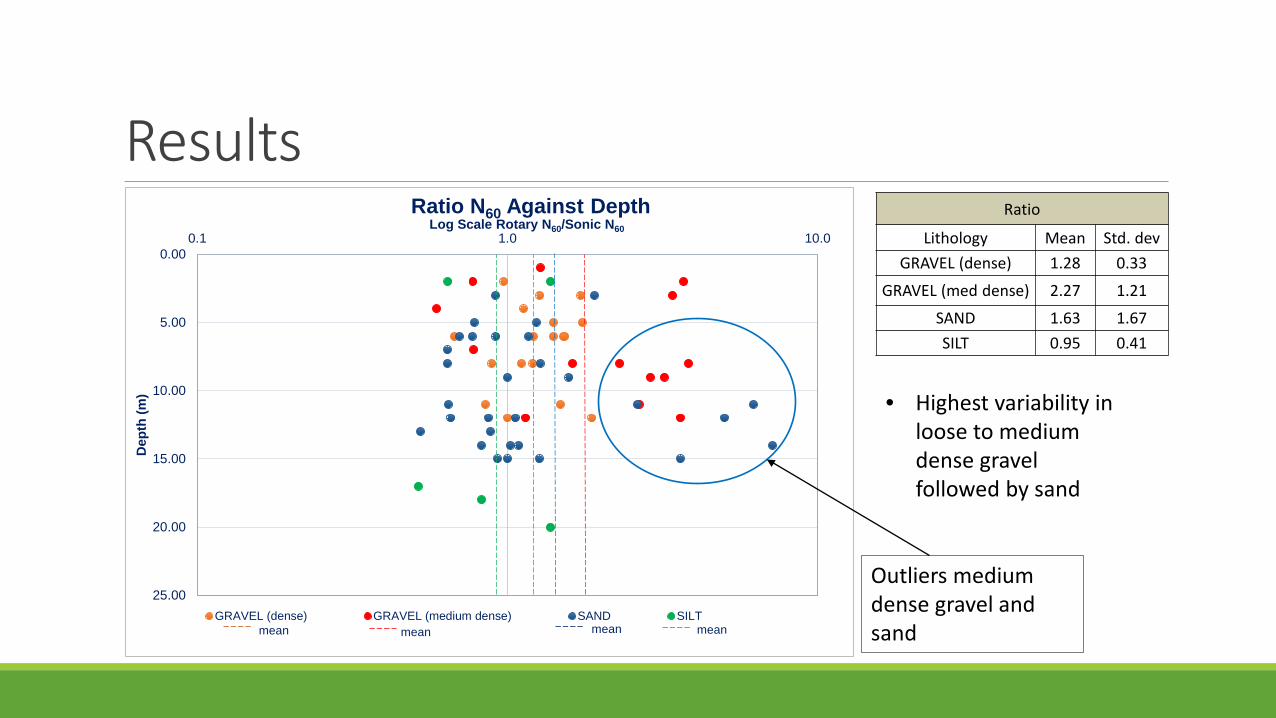
Log Scale Rotary N60/Sonic N60
Ratio N60 Against Depth
GRAVEL (dense) GRAVEL (medium dense) SAND SILTmean mean mean mean
Results Ratio
Lithology Mean Std. dev GRAVEL (dense) 1.28 0.33
GRAVEL (med dense) 2.27 1.21 SAND 1.63 1.67 SILT 0.95 0.41
• Highest variability in loose to medium dense gravel followed by sand
Outliers medium dense gravel and sand

Results Discussion:
• Density
• Particle angularity
Limitations:
• Geological variation in alluvial gravels & sand
• Sample size
• Operator error
• Natural variability in the SPT method
Applicable to local soils? • Sensitive volcanic airfall tephras susceptible to weakening when remoulded – should SPT
values be relied upon here anyway…?
• Fine grained cohesive soils unlikely to propagate ultrasonic vibrations very far = small annulus of effect.
• Should be considered when drilling in alluvial, estuarine, and marine soils.

Contractors with sonic rigs • Geotech Drilling Limited (Taupo)
• PRO-DRILL (Auckland & Christchurch)
• DCN Drilling (Auckland)
• LandTest (Christchurch)
• ACL (Ashburton)
• McNeill Drilling (Christchurch)
• Speight Drilling (West Coast)
• Others…

Thanks for Listening