comparison of small mammal and herpetofauna …
TRANSCRIPT

COMPARISON OF SMALL MAMMAL AND HERPETOFAUNA
COMMUNITY COMPOSITION IN NATURALLY REGENERATED CLEAR-CUTS,
PRE-COMMERCIALLY THINNED, AND SOFT-WOOD PLANTATION FORESTS,
AT TWO DEVELOPMENTAL STAGES
By
Emilie Day
Bachelor of Science, Mount Allison University, 2004.
A Thesis Submitted in Partial Fulfillment of the
Requirements for the Degree of
Master of Science
In the Graduate Academic Unit of Biology
Supervisor: Jeff Houlahan, PhD, Biology
Examining Board: Donald McAlpine, PhD, Research Curator New Brunswick Museum
Keith Dewar, PhD, Business Administration
This thesis is accepted by the
Dean of Graduate Studies
UNIVERSITY OF NEW BRUNSWICK
December 2015
©Emilie Day, 2016.

ii
ABSTRACT
A viable softwood forestry industry relies on intensive forest management
practices to optimize yield, and reduce rotation time. In New Brunswick, Canada, the
primary management strategies are plantations followed by herbicide spraying, or
naturally regenerated stands that are selectively pre-commercially thinned. Forest
managers have both economic and conservation targets so it is critical to understand
(1) how managed stands provide habitat value to native biodiversity relative to natural
Acadian mixed-wood forest and (2) how the succession since the management
intervention (i.e. time since clear-cutting, planting, thinning, etc.) affects habitat
quality. This thesis addresses these questions by estimating and comparing small
mammal and herpetofauna abundance and taxonomic richness in plantations, thinned,
and naturally regenerated stands at two different developmental stages following
clear-cutting. Stand characteristics within these treatment and stage categories were
surveyed, in order to develop hypotheses about the mechanisms underlying
relationships between stand treatment and development stage, and taxonomic
richness or individual species abundances.
Abundance and taxonomic richness of small mammals, and forest dependent
amphibians (wood frog and red-backed salamander), were negatively affected by
intensive forest management practices, with plantations having a greater effect than
pre-commercially thinned stands. Small mammal richness and abundance, and

iii
specifically abundances of Sorex, red-backed voles (Myodes gapperi), wood frogs
(Lithobates sylvatica), and red-backed salamanders (Plethodon cinerus), were greater in
naturally regenerated mixed-wood stands than in pre-commercially thinned and
planted stands. Associations with stand characteristics were species specific, but
deciduous components (i.e. canopy cover, leaf litter, percentage of hardwood) were
important for species negatively affected by management practices. This is particularly
true of canopy cover, which was greatest in naturally regenerated mixed-woods, and
lowest in plantations. The relationship between thinning and native small mammal
and herpetofauna species was relatively subtle and should be further studied to
address the question of whether there are critical thresholds. Contrary to previous
studies, no overall effect of forest management was found for herpetofauna taxonomic
richness, woodland jumping mouse (Napeozapus insignis), short-tailed shrew (Blarina
brevicauda), or deer mouse (Peromyscus maniculatus) abundances, however, this study
may not have had the power to detect small effects. Both small mammals and
herpetofauna were more abundant in the earlier development stage than the later, but
taxonomic richness was similar between stand stages. This highlights the importance of
measuring abundance and taxonomic richness, as particular species may be present
but reduced in abundance in managed stands. Wood frog and red-backed salamander,
two species that are more dependent on a terrestrial life stage than other amphibian
species in the region, were positively associated with stand stage. This is likely due to
increased canopy closure and resulting higher moisture microclimate levels at later
developmental stages. Effective management for small mammal and herpetofauna

iv
habitat will require the conservation of mixed-wood stands with a high amount of
closed canopy cover.

ACKNOWLEDGEMENTS
I would like to thank my supervisor, Dr. Jeff Houlahan for providing me with patient
guidance throughout my project. You are an inspiration to me both personally and
professionally and I am thankful that I had you to learn from through this process. Thank you to
Drs. Kate Frego and Graham Forbes, my supervisory committee, who have given me expert
guidance throughout my thesis project. Thank you to the wildlife and environmental trust
funds available in New Brunswick, which allowed this project and many more like it to take
place. Thank you to the City of Saint John, Marc Doucet and Nona Tilley, who supported me in
finishing this thesis when it wasn’t necessary for my position but important to me. Thank you
to J.D. Irving Ltd., for your input and in-kind GIS assistance, and for graciously being an integral
contributor in critiquing the management practices employed in New Brunswick’s industrial
forests.
Thank you to my parents, who have always impressed on me the importance of an
education, and have supported me in realizing this MSc and for raising someone with
persistence. Thank you to Eva Reinhart, for supporting me by taking the baby so that I can
work, and for making me amazing lunches once I’ve finished. Thanks to Lee Jacobs for being my
cheerleader and moral support. Thank you to my two babies Oakley and Audrey, who were but
a twinkle in their father’s eye when this process began, but who continue to grow and pushed
me to finish this thesis so that I can spend more time with them. Thank you to my horses, who
have provided hours of respite (and procrastination) and have taught me more about life than
anything else. Finally, thank you to my husband Matt for listening to me during this process,
for helping out with the kids, for tolerating a messy house and the horses so that I could work.
You make life exciting -- I’m thankful my muddy field truck caught your eye.

x
TABLE OF CONTENTS
ABSTRACT ........................................................................................................ II
ACKNOWLEDGEMENTS ................................................................................... IX
TABLE OF CONTENTS ........................................................................................ X
LIST OF FIGURES ............................................................................................ XIV
LIST OF TABLES ............................................................................................. XVI
LIST OF SYMBOLS, NOMENCLATURE OR ABBREVIATIONS ............................. XVII
INTRODUCTION ............................................................................................... 1
Forest types in New Brunswick ......................................................................... 2
Native Acadian forest in New Brunswick ............................................................ 2
Managed forests in New Brunswick ................................................................... 4
Effects of forest management techniques on native Acadian forest flora and
fauna. .............................................................................................................. 6
Clear-cutting .................................................................................................... 6
Long-term effects of clear-cutting ...................................................................... 8
Herbicides ........................................................................................................ 9
Mechanical thinning ....................................................................................... 10
Plantations ..................................................................................................... 12

xi
Objective ....................................................................................................... 14
METHODS ...................................................................................................... 16
Study area ..................................................................................................... 16
Stand selection .............................................................................................. 16
Treatments .................................................................................................... 17
Naturally regenerated stands .......................................................................... 17
PCT stands ..................................................................................................... 18
Plantations ..................................................................................................... 18
Small mammal and herpetofauna sampling .................................................... 19
Stand characteristic measurements ................................................................ 22
Statistical analyses ......................................................................................... 24
Small mammal, herpetofauna, and stand characteristic versus stand management
and stage ....................................................................................................... 24
Small mammal and herpetofauna versus stand characteristics ......................... 25
RESULTS ......................................................................................................... 26
Small mammal and herpetofauna trapping results ......................................... 26
Stand-level forest characteristics .................................................................... 27
Small mammal and herpetofauna relationships with forest management
treatments ..................................................................................................... 29

xii
Taxonomic richness ........................................................................................ 29
Abundance ..................................................................................................... 30
Individual taxa ................................................................................................ 31
DISCUSSION ................................................................................................... 33
Effect of management treatments on stand characteristics ............................ 34
Leaf litter and percentage of hardwood ........................................................... 34
Depth to water table between 0 and 0.1m ....................................................... 34
Needle litter ................................................................................................... 35
Canopy cover .................................................................................................. 35
Shrub cover .................................................................................................... 36
Coarse woody debris ....................................................................................... 36
Stand density .................................................................................................. 37
Moss cover ..................................................................................................... 38
Effect of intensive forest management on small mammals ............................. 39
Community-level effects .................................................................................. 39
Species-level effects ........................................................................................ 44
Effects of intensive forest management treatments on herpetofauna ............. 50
Community-level effects .................................................................................. 50
Species-level effects ........................................................................................ 55

xiii
Future research .............................................................................................. 62
Conclusions and management implications .................................................... 65
LITERATURE CITED ......................................................................................... 68
TABLES .......................................................................................................... 93
FIGURES ......................................................................................................... 99
APPENDICES................................................................................................. 110
CURRICULUM VITAE

xiv
LIST OF FIGURES
Figure 1. Sample sites in the Cole’s Island Area of Central New Brunswick.................. .99
Figure 2. Drift fence pit fall trap, Sherman and Tomahawk live traps, and ground cover
quadrats. ...................................................................................................................... .100
Figure 3. Drift fence pit fall trap, point quarter method used to describe stand density,
and spherical densitometer used to describe canopy cover percentage.. ................... 101
Figure 4. Forest stand characteristics within stand types. ........................................... 102
Figure 5. Mean percentage of forest stand characteristics within stage 1 and stage 2
stand development classes. .......................................................................................... 103
Figure 6. Taxonomic richness (# taxa) for total (small mammals and herpetofauna),
small mammal, and herpetofauna with standard error, versus silviculture treatments.
....................................................................................................................................... 104
Figure 7. Abundance (# individuals): total (small mammal and herpetofauna), small
mammal, and herpetofauna (mean +standard error) versus stand stage…… .............. 105
Figure 8. Abundance (# individuals): total (small mammal and herpetofauna), small
mammal, and herpetofauna (mean + standard error) versus silviculture treatments..
....................................................................................................................................... 106
Figure 9. Abundances of Sorex spp. and red-backed vole (mean + standard error)
versus stand treatment. ................................................................................................ 107
Figure 10. Abundances of northern red-back salamander and wood frog (mean +
standard error) versus stand treatment. Letter symbols indicate statistically significant
differences (α=0.1). ....................................................................................................... 108

xv
Figure 11. Abundances of northern red-back salamander and wood frog (mean +
standard error) versus stand development stage. ....................................................... 109

xvi
LIST OF TABLES
Table 1. Abundance of individual small mamal and herpetofauna taxa caught for the
three sampling methods during 2005-2006 sampling periods. ...................................... 93
Table 2. Abundance of individual small mamal and herpetofauna taxa caught in three
forest stand types with differing management at two age classes, during the 2005-2006
sampling periods. ............................................................................................................ 94
Table 3.Mean (per stand) and standard error of small mammal and herpetofauna taxa
per hundred trap nights, and forest stand level vegetation samples within two stand
stages, and three stand treatment types. ....................................................................... 95
Table 4. p values for randomization, interactions between forest stand types, post hoc
analyses, and regressions of small mammal, herpetofauna, and stand characteristics
between stand treatment variables.. ............................................................................. 97
Table 5. Means for small mamal and herpetofauna abundances and characteristics
that were significantly influenced by an interaction between treatment and forest
stand stage. ..................................................................................................................... 98

xvii
LIST OF SYMBOLS, NOMENCLATURE OR ABBREVIATIONS
PCT. ............................................................................................. Pre-Commercial Thinning
IFM ..................................................................................... Intensive Forest Management
DNR............................................................................... Department of Natural Resources
DBH ............................................................................................ Diameter at Breast Height

1
INTRODUCTION
Forest managers are faced with the daunting task of maximizing timber
production (quality and quantity) while maintaining wildlife habitat integrity. Forests
provide valuable ecological, recreational, and aesthetic services, as well as being
essential to the local economy (Nyland, 1996). Intensive forest management (IFM)
practices have been an integral part of the New Brunswick’s sustainable management
plan for its forests, supported by a process of adaptive management (i.e. these
practices are modified in response to ongoing ecological research.) Within the last
couple of decades, increased public scrutiny of practices has challenged forest
managers to employ management techniques that reduce impact on native biodiversity
(Freedman et al., 1994).
Most of the research examining the effects of IFM has focused on differences in
taxonomic richness and abundances between naturally regenerated and managed
stands (Halpern and Spies, 1995; Aubry, 2000; Dieterich et al., 2006). A review of
approximately 50 papers on the effect of IFM on vertebrates suggests that a loss of
forest structure commonly impacts abundance and taxonomic richness, and that these
impacts are potentially cumulative over the long-term (Thompson et al., 2003). There
are still gaps in our understanding of how different forest management strategies (e.g.
pre-commercial thinning and planting) affect ecosystem services provided by naturally
regenerating forests. In particular, little is known about the ability of intensively
managed forests to provide suitable habitat for forest organisms. An ongoing debate in

2
New Brunswick as to whether or not intensively managed forests provide suitable
habitat for the range of species that are associated with naturally regenerated forests
suggests that further research is needed, both at the stand and landscape scales (Betts
et al., 2005). Specifically, Betts et al. (2005) suggest that forest managers in New
Brunswick take a closer look at how older managed stands are used by native species,
as well as possible threshold responses of native species to habitat characteristics
potentially lost to intensive management strategies.
Forest types in New Brunswick
Native Acadian forest in New Brunswick
The Acadian forest biome extends from the north-eastern United States, to Quebec,
and throughout the Maritime provinces of eastern Canada. It consists of both
coniferous and deciduous tree species, variable in assemblage, size, and age (Parks
Canada, 2009) but often characterized by the presence of red spruce (Picea rubens) and
yellow birch (Betula alleghaniensis). The forest assemblage has been influenced by a
long history of clearing for agriculture, logging and subsequent plantations, fire, and
pest outbreaks in New Brunswick, most recently an eastern spruce budworm
(Choristoneura fumiferana) eruption in the 1980’s. These disturbances have resulted in
the majority of forest stands being less than 200 years old (Loo et al., 2010 in McAlpine
and Smith, 2010) with indigenous species that are adapted to take advantage of early
successional forest stand conditions.

3
Natural factors influencing the re-establishment of forest stands following a
disturbance include disturbance type, neighbouring forest stands, facultative species
presence, and site conditions -- thus stands are variable in species composition as well
as rate of establishment (Nyland, 1996; Roberts and Zhu, 2002). Abundant deciduous
tree species within the Acadian forest include red maple (Acer rubrum), sugar maple (A.
saccharum), northern red oak (Quercus rubra), American beech (Fagus grandifolia),
white ash (Fraxinus americana), and white/paper (Betula papyrifera), yellow , and
grey (B. populifolia) birch. Common coniferous tree species include red , black (P.
mariana), and white spruce (P. glauca), eastern white (Pinus strobus) and red pine (P.
resinosa), balsam fir (Abies balsamea), eastern hemlock (Tsuga canadensis), and
eastern white cedar (Thuja occidentalis) (Schneider, 2012). Currently, the Acadian
forest biome contains plant species of conservation concern that require prudent
management in order to ensure their preservation -- the majority of these species are
deciduous (Mosseler et al., 2003).
Commonly found small mammals native to the Acadian forest include the
snowshoe hare (Lepus americanus), northern flying squirrel (Glaucomys sabrinus),
American red squirrel (Tamiasciurus hudsonicus), eastern chipmunk (Tamias striatus),
woodland jumping mouse (Napaeozapus insignis), meadow jumping mouse (Zapus
hudsonius), deer mouse (Peromyscus maniculatus), southern bog lemming
(Synaptomys cooperi ), southern red-backed vole (Myodes gapperi ), star nosed mole
(Condylura cristata), northern short-tailed shrew (Blarina brevicauda), masked shrew
(Sorex cinereus), water shrew (S. palustris), smoky shrew (S. fumeus), pygmy shrew (S.

4
hoyi), and less commonly, the maritime shrew (S. maritimensis), and long tailed shrew
(S. dispar) (Forbes et al., 2010 in McAlpine and Smith, 2010). Herpetofauna species that
have a dependence on permanent or temporary aquatic environments within the
major forest region in New Brunswick include yellow spotted salamander (Ambystoma
maculatum), blue spotted salamander (A. laterale), eastern newt (Notophthalmus
viridescens), American toad (Anaxyrus americanus), spring peeper (Pseudacris crucifer),
green frog (Lithobates clamitans), pickerel frog (L. palustris), bullfrog (L. catesbeiana),
and wood frog (L. sylvatica). Terrestrial herpetofauna include the northern red-backed
salamander (Plethodon cinereus), Maritime garter snake (Thamnophis sirtalis
pallidulus), smooth green snake (Liochlorophis vernalis), Northern ring-necked snake
(Diadophis punctatus edwarsii) and Northern red-bellied snake (Storeria
occipitomaculata occipitomaculata) (Adams and Freedman, 1999; McAlpine, 2010 in
McAlpine and Smith, 2010).
Managed forests in New Brunswick
Balsam fir, black, white, red, and Norway (P. abies)(a non-native species)
spruce, eastern white cedar, white, red, and jack (P. banksiana) pine are selected for,
and intensively managed by the softwood lumber and pulp and paper industries (J.D.
Irving Ltd, 2007). IFM treatments employed by forest managers to obtain the desired
species and stand densities include herbicide release, pre-commercial mechanical
thinning, and planting (J.D. Irving Ltd, 2007). Pressure from the forestry industry has
resulted in an increase in allowable cutting of Crown lands by 20 percent in 2014, with
the license being renewable every 5 years. In order to achieve this quota, the provincial

5
Department of Natural Resources (DNR) has reduced the amount of Crown land that is
protected (i.e. protected natural areas, unique sites, deer winter areas, old forest
wildlife habitat, riparian buffers, wetland buffers, vegetative communities, steep
slopes, inoperable/inaccessible areas, sugar and camp leases) from forestry operations
from 31 to 23 percent (DNR, 2005; J.D. Irving Ltd., 2007). This increase in managed
forest allocation has been met with fierce criticism by scientists, forest enthusiasts,
conservationists, and some of the general public who maintain that a percentage closer
to 30 percent of naturally regenerated stands is integral to maintaining native
biodiversity (CCNB, 2015).
IFM stands are characterized as having a less complex understory stratum of
deciduous vegetation (Roberts and Zhu, 2002), with a more uniform distribution of
trees, and a canopy cover that develops more slowly than in naturally regenerated
stands (Wuest and Betts, 2010). Currently in New Brunswick managed forests fall
predominantly into two types post clear-cutting/harvest: those that regenerate
naturally with a commercially desirable species by seed trees (i.e. desired species and
phenotype left after cutting, as seedlings that were present in the understory, or in
neighbouring stands and then subsequently pre-commercially thinned, PCT), and those
that need to be planted in order to regenerate the desired species (plantations).
Plantations are clear-cut, planted and then treated with herbicide (i.e. chemically
thinned) to reduce competition from deciduous species, while PCT stands are naturally
regenerated managed forests that are mechanically thinned to reduce competition
between coniferous species as well as deciduous species (J.D. Irving, 2007).

6
There is concern amongst some of the general public and scientists that further
reduction of the natural Acadian forest will not be adequate to sustain non-commercial
attributes of New Brunswick forests (Nature NB, 2014). Because it is impossible to
track the responses of all components of biodiversity, it is useful to identify indicators
(i.e. characteristics that are correlated with other measures of overall biodiversity).
Small mammals and herpetofauna are useful as indicator species in studying the long-
term effect of IFM on native biodiversity because they are easily captured in large
numbers on site, they have relatively short life spans and small migration ranges, and
they are often both predators and prey in local food webs (Thompson et al., 2002).
Effects of forest management techniques on native Acadian forest flora
and fauna.
Clear-cutting
Clear-cutting is a commonly used forest harvesting practice in New Brunswick,
where all trees are removed and the site is subsequently planted, or the majority of the
trees are cut but select seed trees are maintained to repopulate the site. Trees are
harvested using tracked machinery, and removed with large trucks via a network of
constructed dirt roads. Clear-cutting has been found to increase light penetration to
the ground as a result of canopy loss (Etcheverry et al., 2005), decrease soil moisture
and nutrients (Bormann et al., 1968; Carey and Johnson, 1995) and subsequently
results in a loss or slow recovery of the understory of angiosperms (Duffy and Meier,
1992; Roberts and Zhu, 2004), and bryophytes associated with wooded moist habitats

7
(Ross-Davis and Frego, 2002; Fenton et al., 2003). A shift to shade intolerant, early
successional, herbaceous species such as fireweed (Chamerion angustifolium), flat-
topped white aster (Doellingeria umbellata), hay-scented fern (Dennstaedtia
punctilobula), red raspberry (Rubus idaeus), common goldenrod (Solidago canadensis),
swamp thistle (Cirsium muticum), and woolly grass bulrush (Scirpus eriophorum)
(Freedman et al., 1993) are common characteristics of recently clear-cut stands within
the Acadian forest. In the years following clear-cutting during which the canopy is
open, predatory and insectivorous birds, large herbivores, pond-breeding amphibians,
and insectivorous mammals prosper as a result of associations with shade intolerant
vegetation and insects (Johnson and Freedman, 2003).
The direct effect of clear-cutting on herpetofauna has been found to be
generally negative, mostly attributed to disruption of breeding ponds, death during the
process of harvesting, decreased soil moisture and leaf litter, and increased
temperature (Pough et al., 1987; Mitchell et al., 1997; Grialou et al., 2000). Small
mammals tend to react in a species-specific manner with many species relatively un-
impacted by clear-cutting (Kirkland, 1990; Etcheverry et al., 2005). When a decrease in
small mammal populations in response to clear-cutting has been detected, it has been
attributed to loss of predator protection, and lack of adequate nesting sites as a result
of the removal of snags and canopy cover (Fuller and DeStefano, 2003). Suggestions
have been made that the retention of mature forest attributes (i.e. coarse woody
debris, snags, riparian buffer strips, etc.) within a clear-cut stand may be beneficial to
small mammals, amphibians, and associated predators, and warrant further research

8
(DeMaynadier and Hunter, 1995; Dupuis et al., 1995; Cole et al., 1998; Wilson and
Carey, 2000; Bowman et al., 2001; Fuller et al., 2004). Furthermore, certain species
appear to be more sensitive to clear-cutting than others. For example, DeMaynadier
and Hunter (1995) conducted a meta-analysis of studies examining the effects of clear-
cutting on amphibians and noted that anurans appeared to be much more tolerant to
increases in temperature than salamanders.
Long-term effects of clear-cutting
Previous studies examining the long-term effects of clear-cutting (10+ years)
indicate that herpetofauna species’ abundances were at least two times higher in older
controls than in more recently clear-cut stands (DeMaynadier and Hunter, 1995), that
abundance increases with age (i.e. time since disturbance), reaching full recovery at
approximately 30-60 years in the Acadian and neighbouring boreal and deciduous
forest regions of Eastern North America (Pough et al., 1987; Bonin, 1991; DeGraaf et
al., 1992; Petranka et al., 1993; Petranka et al., 1994). Pough et al. (1987) compared
several older managed and naturally regenerated stands that had originated by clear-
cut with old growth forests and found that older (~25 years) naturally regenerated
stands supported salamander abundances comparative to old growth, whereas the
older (25 years) managed stands did not. This difference between how older managed
stands and naturally regenerated stands recover as habitat for native species is
attributed to site preparation activities such as herbicide application, burning, and
scarification that are known to set back re-colonization time for certain species
(DeMaynadier and Hunter, 1995; Nyland, 1996; Roberts et al.,2001; Thompson et al.,
9
2003; Roberts and Ramovs, 2005). A critical research gap exists with respect to how
managed stands that reach an over mature stage provide habitat relative to the
naturally regenerated native habitat stands of the same development stage.
Herbicides
Herbicides, primarily glyphosate-based, are applied to reduce competition for
sunlight, soil nutrients, space etc. from secondary succession deciduous vegetation,
both persistent shrubs and tree seedlings and colonizing pioneers, following clear-
cutting. Reduced competition improves survival, growth, and quality of the
merchantable timber species (Freedman et al., 1993; Nyland, 1996). Following the
application of herbicide, stands have shown changes in ground microclimate attributed
to a reduction in leaf litter, shrub vegetation, and over-story vegetation (Sullivan et al.,
1998; Prezio et al., 1999). A temporary reduction in small mammal abundance within
two years of herbicide application has been attributed to habitat loss rather than to
herbicide toxicity (Anthony and Morrison, 1985; Sullivan et al., 1998; Gagné et al.,
1999; Sullivan and Sullivan, 2003; Fuller et al., 2004). In a study examining the effect of
herbicides on small mammals 10 years following application, Sullivan et al. (1997) did
not find any long-term effects on taxonomic richness or diversity. Common shrew
species (masked, pygmy, smoky, short-tailed) have been found to be relatively
unaffected by herbicide treatments (Lautenschlager et al., 1997) and to thrive in
partially harvested mixed stands (Fuller et al., 2004) possibly because they are
opportunistic insectivores and their prey is likely more common in open areas.

10
Direct toxicity of glyphosate-based herbicide spraying at amounts used for
forest management has not been found in terrestrial or larval stages of pond-breeding
herpetofauna (Cole et al., 1998; Harpole and Haas, 1999; Thompson et al., 2004; Edge
et al., 2011; Gertzog et al., 2011). In the short term, terrestrial salamanders are able to
find cover following herbicide application even though there was a loss of leaf litter
(Harpole and Haas, 1999). In a study examining longer term (i.e. 7-13 years) effects,
Homyack and Haas (2009) found that a resulting loss of canopy cover had a negative
effect on salamander abundance. Further negative long-term effects of herbicides on
terrestrial herpetofauna are attributed to indirect effects of loss of leaf litter, canopy
cover, and stand structure (Cole et al., 1998).
Mechanical thinning
Pre-commercial thinning (PCT), which is achieved by selectively cutting
deciduous trees and tightly spaced coniferous trees using saws, and leaving the slash
on-site (Nyland, 1996; Ransome and Sullivan, 2002), is another common technique for
encouraging growth of target species by removing competition. PCT is most commonly
performed following the sapling stage (approx. 8-20 years) and before trees are large
enough to warrant commercial harvest. Thinned stands have some characteristic
structural components of a naturally regenerating forest (i.e. mature trees, snags,
coarse woody debris, herbaceous cover, partial or complete canopy cover) but have
reduced levels of other structural components (i.e. tree density, shrub cover, tree
species diversity, multiple canopy layers) (McComb et al., 1993; Wilson and Carey,
2000; Etcheverry et al., 2005; MacCracken, 2005). A study in New Brunswick, Canada

11
found that negative effects of thinning on native understory plant diversity was
mitigated after fifteen years, suggesting that once a complete canopy cover is
established there are little differences between naturally regenerated and thinned
stand plant understories (Cole et al., 2008).
Small mammal response to PCT treatment is conflicting, and appears to be
species specific (Etcheverry et al., 2005; Fuller et al., 2004; Homyack, 2005; Henderson,
2011; Dracup et al., 2015). Deer mice have been shown to be relatively unaffected by
thinning (Homyack, 2005; Dracup et al., 2015), whereas there are conflicting reports on
red-backed vole response to PCT. Etcheverry et al. (2005) and Henderson (2005) found
red-backed voles to be less abundant in pre-commercially thinned stands at 5, 10, and
20 years after treatment, whereas other studies in Western and Eastern North America
have found no effect of PCT on red-backed voles (Sullivan et al., 2001; Homyack et al.,
2005) . A study by Henderson (2005) within the same forest region found that
structures which provide cover, most specifically an adequate volume of coarse woody
debris, can and should be maintained in managed stands as a potential limiting factor
for small mammals such as red-backed voles. A study conducted 6-16 years post
thinning suggests that thinning may accelerate the development of stand
characteristics prevalent in mature stands (i.e. larger trees, uneven canopy cover)
(Homyack et al., 2005) and therefore could be beneficial to species known to be
associated with older stands, such as deer mice and red-backed voles (Lautenschlager
et al., 1997). Coarse woody debris has been identified as an integral requirement for
red-backed voles, and is maintained and sometimes increased following thinning

12
thereby creating a beneficial habitat (Bowman et al., 2000; Dracup et al., 2015). These
conflicting results may be explained by the fact that a tolerance for thinning is greatest
when habitat requirements such a food sources, predator avoidance, and nesting sites
remain intact following thinning treatments (Lautenschlager et al., 1997; Gagné et al.,
1999; Wilson and Carey, 2000; Carey and Wilson, 2001; Fuller et al., 2004). For
instance, a study by Dracup et al. (2015) found that stands that retained coarse woody
debris following thinning as opposed to those stands where debris was removed,
supported twice as many red-backed voles.
Short-term amphibian response to thinning has generally been negative and
attributed to reduction of aquatic habitat and/or soil moisture (Pough et al., 1987;
Messere and Ducey, 1998; Grialou, 2000; MacCracken, 2005). Grialou et al. (2000)
found that the short term effect of thinning on terrestrial red-backed salamanders was
negative, as a result of a short term reduction in canopy cover and subsequent changes
in soil moisture. Brooks (1999) also concluded that conserving canopy cover can
eliminate the negative effect of thinning on salamanders. The long-term effects of
thinning on herpetofauna have not been well documented but a study by Karraker and
Welsh (2006) did not detect an effect of thinning on abundance of amphibians 10 years
after thinning had occurred.
Plantations
Planting trees is an IFM technique intended to replace the species that are likely
to regenerate in that stand with a more commercially desirable species or combination
of tree species. In the Acadian forest region, plantations produce trees destined for the

13
pulp and paper industry which, depending on the site, are a combination of black
spruce, Norway spruce, white spruce, red spruce, white pine, jack pine, red pine, and
eastern white cedar (J.D. Irving, Ltd., 2007). Tree planting is preceded by clear-cutting
and site preparation (i.e. scarification or burning), and is often followed by chemical
and/or mechanical thinning: In comparison with naturally regenerated mixed-wood
forests, coniferous plantations have fewer snags, leaf litter, and coarse woody debris,
and have a less complex canopy cover and shrub cover because stands are evenly aged.
This results in fewer native species that depend on structure complexity (DeMaynadier
and Hunter, 1998; Waldick et al., 1999, Bowman et al., 2001; Johnson and Freedman,
2003; Thompson et al., 2003; Pearce and Venier, 2005).
There is convincing evidence that plantations support fewer and different bird
(Thompson et al., 2003; Woodley et al., 2006), vascular plant (Ramovs and Roberts,
2005) and bryophyte species (Ross-Davis and Frego, 2002; Thompson et al., 2003) than
naturally regenerated mixed-wood forests, but there is conflicting evidence about the
effects of plantations on amphibian and mammal diversity (Mitchell et al., 1995;
Waldick et al., 1999; Thompson et al., 2003). Furthermore, there are relatively few
studies that explore the relationship between small mammal and herpetofauna and
older (native species) plantations that replace mixed-wood stands. Bowman et al.
(2001) found that small mammals were as abundant in New Brunswick plantations as in
naturally regenerated mixed-wood stands, with the exception of red-backed voles, the
lower abundance of which was attributed to lack of coarse woody debris in plantations.
A study by Atkeson and Johnson (1979) found that a fifteen year old pine plantation in

14
Georgia, USA supported fewer small mammals than younger plantations. They
proposed that older plantations support fewer individuals because they have increased
canopy cover which results in a subsequent reduction in shade intolerant shrub cover-
thought to be important to small mammals. However, no comparison was made to the
native mixed-wood stands. A review by DeMaynadier and Hunter (1995) and a study
by Pough et al. (1987) found that plantations support fewer amphibians than naturally
regenerated mixed-wood forests, which they suggest could be a result of a reduced
litter and coarse woody debris in plantations- characteristics that have been found to
be positively associated with amphibians - and increased soil acidity. A New Brunswick
study by Waldick et al. (1999) found that terrestrial amphibians (i.e. yellow spotted and
red-backed salamanders, spring peeper, and wood frog) are particularly sensitive to the
conversion of mixed-wood stands to plantations because it results in reduced
hardwood debris.
Objective
My objective is to estimate the relative conservation value of intensively
managed forests as habitat for species of small mammals and herpetofauna that are
native to the Acadian forest. The objective of this study was to compare small mammal
and herpetofauna taxonomic richness and abundance in plantations and pre-
commercially thinned stands, relative to naturally regenerated stands of the same
developmental stage in the Acadian forest. I also aimed to determine whether effects
of forest management practices on small mammals and herpetofauna are mitigated as

15
forests mature, by comparing plantations, pre-commercially thinned, and naturally
regenerated stands at two developmental stages, the first stage having an average
softwood tree height of 3-5 metres and between 10 and 26 years old, the second stage
having an average tree height of 10-20 metres and between 17 and 78 years old (age
variability dictated by the organic stand establishment process for naturally
regenerated stands). I correlated data on small mammals and herpetofauna with stand
structure characteristics in order to identify potentially critical stand characteristics.
The results are designed to provide information to forest managers who are tasked
with finding a balance between intensive silviculture practices (IFM) intended to
increase forest productivity, and maintaining ecological integrity for future
sustainability of indigenous species.

16
METHODS
Study area
This study was conducted in the Cole’s Island area of central New Brunswick,
Canada within latitudes of 45° 38’ and 46° 10’, and longitudes of 65° 11’ and 65° 45’
(Figure 1) in 2005 and 2006, between June and September. Annual precipitation is
approximately 1000-1300mm, with an average summer temperature of 19.10C
(Government of Canada: Climate, 2015). The study area falls within the Eastern
Lowlands ecoregion, Castaway ecodistrict, characterized by a flat geology with valley
slopes composed of carboniferous sedimentary sandstone, clay loam, with intermittent
volcanic deposits (ref). Soils are relatively acidic, with poor drainage conducive to
formation of wetlands and vernal pools (DNR, 2005; GNB, 2011). The landscape is a
mosaic of managed and naturally regenerated Crown land composed of wetland
tolerant mixed-wood species, with little residential development.
Stand selection
Stands were separated into three categories of forest management treatments
(naturally regenerated, pre-commercially thinned, and plantation) and two
successional stages of stand development (S1 and S2). Twenty-four stands, 4 of each
treatment combination (i.e. naturally regenerated-S1, naturally regenerated-S2,
thinned-S1, thinned-S2, plantation-S1, plantation-S2) were sampled during the
summers of 2005 and 2006 (June-September). Stands ranged in size from 7-40
hectares, were accessible by vehicle, originated by clear-cut, and contained no large

17
lakes or wetlands (i.e. nothing present on a 1:10,000 metre map)(Table A1). Some
stands contained secondary logging roads. All stands were spatially separated by 1.4
kilometres or more (Figure 1), and were predominantly surrounded by either mid-
rotation or mature (~30 years post clear-cut) stands of hardwood or softwood trees
(Appendix table 2).
Stand development stages were categorized into stage 1 and stage 2 categories
based on a combination of time since clear-cutting/thinning/planting, and average
softwood tree height. This was done to ensure comparability of both stand age and
stage of forest succession. Time since clearing/thinning/planting was extracted from JD
Irving Geographical Information System (GIS) inventory data base and map layers, and
average stand tree height was determined by measuring at least 10 haphazardly
chosen trees (many more when there was variability) on site by the tangent method
(Minnesota Department of Natural Resources, 2015) with a Suunto clinometer and a
measuring tape.
Treatments
Naturally regenerated stands
Stands that were clear-cut and naturally regenerated without any subsequent
management treatment (hereafter referred to as ‘naturally regenerated’) (n=8) were
composed of native Acadian forest mixed-wood species representative of the Eastern
Lowlands eco Region, that colonized the site naturally following clear-cutting. Stage 1
stands, representative of a ‘stand initiation stage’ (Oliver and Larson, 1996), had an

18
average height of measured softwood trees between 3 and 5 metres and were clear-
cut 10-26 years prior to the study. Stage 2 stands, representative of a ‘stem exclusion
stage’ (Oliver and Larson, 1996), had an average height of measured softwood trees
between 10 and 20 metres, and were clear-cut between 17 and 78 years prior to the
study (Appendix table 1).
PCT stands
Pre-commercially thinned stands (n=8) regenerated by natural processes with a
predominantly coniferous tree inventory as a result of intentionally retained seed trees
or coniferous neighbouring stands. Mechanical thinning of competing hardwood trees
and/or high density coniferous trees is conducted approximately 15 years post-harvest.
Stage 1 stands were thinned 5 years prior to the study with measured softwood trees
being between 3 and 5 metres in height at the time of study, while Stage 2 stands were
thinned between 10 and 12 years prior to the study, with measured softwood trees
being within a range of 10-20 metres in height. (Appendix table 1).
Plantations
Plantation stands (n=8) were planted with the desired harvest coniferous species
because conditions were not favourable for the clear-cut stands to regenerate
merchantable coniferous trees through natural processes. Sites that had been partially
naturally colonized and fill planted were also considered plantations. Aerial herbicide
application was done within 5 years of planting to reduce competition with shade
intolerant hardwood species. Stage 1 plantations were established 10-12 years prior to

19
the study, with measured softwood trees within a range of 3-5 metres in height, and
Stage 2 plantations were established 21-23 years prior to the study with measured
softwood trees within a range of 10-20 meters in height (Appendix table 1).
Small mammal and herpetofauna sampling
Both small mammals and herpetofauna were sampled in 2005 and 2005 from June
to August using drift fence/ pit fall arrays for seven consecutive nights (4032 total trap
nights, ~168 trap nights per stand). In addition, small mammals were sampled for
seven consecutive nights using live traps (4368 total trap nights, ~182 trap nights per
stand), and herpetofauna were sampled using natural cover searches (4320 objects,
~180 cover objects per stand) (Table 1).
Two sampling stations were established in each of the twenty four stands, with
each fence greater than 30 metres from the stand edge. A drift fence and pit fall trap
was constructed of silt fence fabric buried in an X formation (each arm of the fence was
7.62 metres) an average of fifteen centimetres into the ground. Ten litre buckets,
punctured for drainage, were buried at the ends and centre of the silt fencing with the
lip flush to the ground, and sponges in the buckets to retain moisture or to act as a raft
if water accumulated (Figure 2). At each sampling station, twelve pitfall buckets and
thirteen live traps were opened for seven consecutive nights. On twelve occasions, pit
fall traps either filled with water or lifted above the ground due to excess water; these
were not counted.

20
In the area of one of the two drift fence/pitfall traps, eighteen 23 L x 7.6W x 9W
cm H.B. Sherman live traps were established in two 3 x 3 arrays with ~ 75 centimetres
between traps. In addition, eight 50L x 15W x 15H cm Tomahawk live traps were
established in two 2x2 arrays with ~1.5 metres between traps. The trap arrays were
placed ~30 metres from the “crooks” of the drift fence array (Figure 2). Both Sherman
and Tomahawk traps were baited using a mixture of seeds commonly used in
commercial small mammal feed. Traps were also filled with natural cotton for comfort.
Most animals were captured at night, and thus traps were checked early in the morning
to minimize the length of time in the trap and to reduce stress. Traps were opened for
7 consecutive nights; closed empty live traps were given a value of 0.5 when calculating
trap nights to account for the fact that we did not know when the trap was closed
(Beauvais and Buskirk, 1999). Once trapped, mammals were identified via
morphological characteristics to either genus (Sorex spp.) or species, marked with an
individually numbered ear tag (except for shrews which were marked with nail polish),
and released.
Six 5-minute natural cover searches were conducted in each stand for a total of
half an hour per stand in September of 2005 and 2006. Natural objects were defined as
any potential cover object (e.g. rocks, stumps, or decomposing logs) at least 20 by 25
cm in size. Decomposing logs or stumps were torn open, searched for salamanders, and
then replaced to reduce habitat disturbance. Herpetofauna were identified to species
and released.

21
For each species and for abundances of small mammals and amphibians an index
of abundance was expressed as capture per 100 corrected trap-nights (Beauvais and
Buskirk, 1999) by dividing the number of captures x 100 by the corrected (0.5 value for
sprung traps) trap-nights. All taxa caught, irrespective of abundance, were used to
calculate taxonomic richness. In addition, analyses examining treatment and/or
developmental stage effects on total herpetofauna or mammal abundance, used
captures across all taxa. However, analyses examining treatment and/or
developmental stage effects on the abundance of individual taxa were only carried out
for taxa with catch numbers > 20 individuals over both sampling years.
All individuals from the genus Sorex were treated as a single taxon because I was
not confident in my ability to distinguish between species. Because small mammals
were captured live and my intention was live release, I was not able to measure
definitive species characteristics such as tooth and skull patterns (van Zyll de Jong,
1983; Churchfield, 1990), necessary for distinguishing species of Sorex shrews.
Furthermore, because shrew species were producing cohorts at different times, both
adults and juveniles were captured throughout the sampling period and size
differences among species were not useful. Often, morphological differences such as
colour were also difficult to distinguish, especially when shrews were wet. Examination
of a subsample of individuals who did not survive the trapping using tooth and skull
patterns indicated that I was only able to correctly identify 75% of shrews to species. I
have therefore chosen to use the term “taxonomic richness” (rather than taxonomic
richness) to describe small mammal and herpetofauna diversity among forest stands.

22
However, since the short-tailed shrew was readily distinguishable, captures of this
species were analyzed separately from other shrew species. All terrestrial species of
shrews present in New Brunswick are potentially sympatric within the Acadian forest
and have varied, but generalist, diets of mainly of fungi and invertebrates (Whittaker
and French, 1983; Mitchell et al., 1997; McCay et al., 2004).
Stand characteristic measurements
Canopy cover, leaf litter, needle litter, coarse woody debris cover, shrub cover,
moss cover, percent hardwood, and density were measured at each of the sites.
Depths to water table (i.e. depth at which soil is 100% saturated with water) were
obtained from digital maps supplied by J.D. Irving Ltd. Areas (m3) within the stand that
had a depth to water table (i.e. distance from the surface to the water table
underground) between 0 and 0.1 metres were classified as ‘wet’ (i.e. more likely to
have seasonal vernal pools and damp soil), and areas that had a depth to water table
between 0.5 and 10 metres were classified as ‘dry’. Sampling of all but canopy cover,
percent hardwood and tree density were done using 1 m2 quadrats (n=40). Five
quadrats were placed in a straight line at each of the four ends of the pitfall trap arrays
with approximately 1 metre between quadrats (Figure 2). Leaf litter, needle litter,
coarse woody debris, shrub cover, and moss cover were assigned to one of 6 categories
in each quadrat: None = 0, >0-20% coverage = 1, 20-40% coverage=2, 40-60%
coverage=3, 60-80% coverage=4, and 80-100% cover=5. The values in all 40 quadrats
(i.e. 20 quadrats at each of the 2 sampling stations) were then averaged to provide a
stand-level value. On-site data were collected in the late summers of 2005 and 2006,

23
when leaves were still on the trees and leaf litter was a result of the previous year’s
abscission. Canopy cover, stand density, and percentage hardwood trees were sampled
at both drift fence/pitfall trap areas outside a 15m radius from each drift fence. This
was done to avoid bias, as areas of lower tree density areas were selected for drift
fence installation. Canopy cover was measured using a spherical densitometer (n=32)
at 4 different locations at each of the ends of the stand density transects for both
fences (Figure 3). Tree density (trunks per hectare) was estimated as counts using a
point-quarter centre method (Mitchell, 2010). Percentage of hardwood trees was
determined by counting all trees (both softwood and hardwood) that fall on the
circumference of the tree density transect, dividing the number of hardwood trees by
the total of trees (Figure 3). Only trees > 10cm diameter at breast height (DBH) were
included in calculations of density and percentage of hardwood.
Stand information gathered by aerial photograph interpolation and historical
geographic information systems (GIS) data (e.g. percentage of canopy cover, overall
stand type, stand maturity stage) available from J.D. Irving Ltd. (land managers) was
gathered in order to compare my collected stand characteristics with what is
commonly used by land managers (Appendix Table 1).

24
Statistical analyses
Small mammal, herpetofauna, and stand characteristic versus stand
management and stage
Randomization tests were used to test the null hypothesis that small mammal,
herpetofauna, and stand characteristic (leaf litter, needle litter, coarse woody debris,
shrub cover, moss cover, canopy cover, percentage of hardwood, density, area with
depth to water table at 0-0.1 metres, and area with depth to water table at 0.5-
10metres) did not differ with stand treatment types (i.e. plantations, pre-commercially
thinned stands, and naturally regenerated controls) or stages (i.e., S1 and S2). A
randomization approach was taken because the data did not always meet the
assumptions (i.e. homogeneous variance and normally distributed error) of parametric
tests. Post hoc pair-wise comparisons, and stand stage and treatment interactions were
also done using randomizations. I conducted post hoc power analyses using the
program G*Power 3.1 (Faul, 2009), which was especially relevant in determining the
chances of a type II error for taxa that had lower catch numbers. I estimated power for
4 different effect sizes: very low effect (f=0.1), low effect (f=0.25), moderate effect
(f=0.4), and large effect (f=0.6) (Appendix figure 1). Alpha was set equal to 0.10 rather
than the traditional 0.05 to minimize the probability of Type II errors. Power analyses
should be treated as approximate because they were estimated based on parametric
tests (t-tests and ANOVA rather than randomizations).

25
Small mammal and herpetofauna versus stand characteristics
Simple linear regressions were used to model relationships between stand
characteristics and small mammals and herpetofauna taxonomic richness and
abundances.

26
RESULTS
Small mammal and herpetofauna trapping results
Eleven small mammal taxa (including pooled Sorex spp.) and eight herpetofauna
species were captured (Tables 2,3). Shrews were the most commonly captured small
mammal, followed by red-backed voles, woodland jumping mice, and deer mice. I do
not have reason to believe that woodland jumping mice were able to jump out of the
pit fall traps. Fewer herpetofauna than small mammals were captured, with the most
abundant herpetofauna captured being the southern red-backed salamander.
Pit fall traps were the most successful trapping method for both small mammals
and herpetofauna (Table 1). Herpetofauna were never caught in live traps, while
Tomahawk traps captured only larger small mammals (i.e. snowshoe hare, northern
flying squirrel, and red squirrel). Short-tailed shrew (0 of 26 individuals), meadow
jumping mouse (0 of 9 individuals), and Sorex spp. (6 of 609 individuals) were rarely, if
ever captured in Sherman traps.
There was a high instance of shrew capture in the pit fall traps. This may have
greatly reduced the recorded capture numbers of herpetofauna as there was evidence
of shrews having eaten other individuals. Carnivorous shrews are known to have a very
high metabolic rate and commonly eat amphibians and other small mammals
(Churchfield, 1990), there was evidence that shrew predation did take place.
Nevertheless, pit fall arrays were the most successful method of capturing
herpetofauna with the exception of red-backed salamanders. This wholly terrestrial

27
species was most readily caught via quadrat natural cover searches, as was also noted
in previous studies (Adams and Freedman, 1999; Smith and Petranka, 2000).
Because of low capture rates, snowshoe hare, eastern chipmunk, meadow
jumping mouse, woodland jumping mouse, star nosed mole, red squirrel, northern
flying squirrel, American toad, eastern newt, yellow spotted salamander, spring peeper,
and garter snake were not used in individual species analyses, but were considered in
taxonomic richness and herpetofauna/mammal abundance analyses.
Stand-level forest characteristics
My results indicate that there are clear differences in the stand characteristics
resulting from the three management strategies examined (i.e. naturally regenerated,
pre-commercially thinned, and planted).
Canopy cover, leaf litter and percent hardwood were highest in naturally
regenerated stands, lowest in planted stands, and intermediate in thinned stands
(Table 4, Figure 4). Post hoc analyses indicate that canopy cover was influenced by an
interaction between stand stage and treatment, being significantly different between
stand types at stage 1 but not stage 2 stands (Tables 4, 5). Post hoc analyses indicate
that differences in leaf litter, and percentage of hardwood, were statistically significant
between naturally regenerated stands and thinned stands, and between naturally
regenerated stands and planted stands, but not between planted and thinned stands
(Table 4). There were no interactions between the stand stage and treatment for leaf

28
litter and canopy cover. Leaf litter, canopy cover, and percentage hardwood were also
found to be positively correlated (Appendix table 3).
Naturally regenerated stands had 3x more area that was wet (depth to water
table at 0-0.1 metres) than plantations, and had 1.8x higher wet area than thinned
stands although this difference was not significant (Table 4, Figure 4).
Needle litter and shrub cover were influenced by an interaction between stand
stage and type, being significantly different between stage 2 pre-commercially thinned
stands and stage 2 naturally regenerated stands (needle litter higher in thinned stands,
shrub cover higher in naturally regenerated stands), but not significantly different
between stage 2 plantations and the other stand types, nor significantly different
among any of the stand types in the stage 1 category (Table 5).
Coarse woody debris was also influenced by an interaction between stand stage
and type. Stage 1 plantations had twice the coarse woody debris as thinned and
naturally regenerated stands of the same stage, but there was no difference in coarse
woody debris between stand types in stage 2 stands. Both moss cover and stand
density were influenced by an interaction between stand stage and type, however,
post hoc analyses did not indicate any significant differences between stand types in
either stand stages (Table 5).
29
Small mammal and herpetofauna relationships with forest management
treatments
Taxonomic richness
Combined and small mammal taxonomic richness was significantly higher in
naturally regenerated stands than in planted stands and thinned stands were
intermediate (Table 4) (Figure 6). The same rank order was found for amphibian
taxonomic richness, but the differences were not significant for stand stage or
treatment. Total, small mammal, and herpetofauna taxonomic richness were not
different between stand stages, however, a post hoc power analysis determined that
the probability of detecting a small or medium effect was very low (Appendix figure 1).
Taxonomic richness was calculated using all taxa caught, regardless of abundance
levels.
Leaf litter, canopy cover, and percentage of hardwood were positively associated
with total and small mammal taxonomic richness (Table 4). Naturally regenerated
forest stands had significantly higher canopy cover, leaf litter, and percentage of
hardwood than the other two forest types (Table 4). Total taxonomic richness was
negatively associated with coarse woody debris but this pattern did not apply to either
small mammal or herpetofauna taxonomic richness (Table 4) (Appendix figure 2). Small
mammal taxonomic richness was also positively associated with stand density and
wetness (depth to water table 0-0.1m) (Table 4) (Appendix figure 3).

30
Abundance
Abundance versus treatment and stand stage
Small mammal abundance was influenced by both stand stage and stand
treatment separately, being higher in stage 1 than stage 2 stands and also higher in
naturally regenerated stands, followed by thinned and planted stands
respectively(Table 4)(Figure 7,8). Total and herpetofauna abundances were influenced
by an interaction between stand stage and treatment (Table 4, Figure 7). Total
abundance, like taxonomic richness, was statistically significantly higher in naturally
regenerated stands than planted stands, however, only in the stage 1 category (Tables
4, 5). Herpetofauna abundance, in contrast, was not significantly different among
treatments in stage 1, but was lower in stage 2 thinned stands.
Abundance versus stand characteristics
Leaf litter and percentage of hardwood were positively associated with total
abundance of combined small mammals and herpetofauna, and of small mammals
alone, comparable to taxonomic richness trends (Table 4) (Appendix figure 4,5). Small
mammal abundance, as with small mammal taxonomic richness, had a positive
relationship with stand wetness (Table 4) (Appendix figure 4). Total, small mammal and
herpetofauna abundances were negatively associated with moss cover (Table 4,
Appendix figures 4,5). Herpetofauna abundance was negatively associated with stand
density and positively associated with canopy cover (Table 4)(Appendix figure 5).
31
Individual taxa
Individual taxon versus treatment and stand stage
The Sorex spp. category (most likely including sympatric species of masked,
pygmy, and smokey shrews) comprised 73% of all small mammal captures. As for both
taxonomic richness and small mammal abundances, Sorex spp. abundance was higher
in naturally regenerated stands followed by pre-commercially thinned stands and then
plantation stands (Figure 9). I found a statistically significant difference in abundance
between naturally regenerated stands and thinned stands, but not naturally
regenerated stands and plantations, although the measured abundance was higher in
naturally regenerated stands than plantations (Tables 3, 4).
Red-backed vole abundance was highest in pre-commercially thinned stands,
followed by naturally regenerated and then plantations; there was a statistical
difference between naturally regenerated and thinned stands, and plantations but not
between naturally regenerated and thinned stands (Table 4)(Figure 9).
Deer mouse was influenced by an interaction between stand stage and treatment,
being greatest in naturally regenerated stands followed by thinned and planted stands
respectively but only in stage 1 stands (Tables 4, 5).
The remaining small mammal species with abundances >20 (i.e. woodland jumping
mouse, short-tailed shrew, etc.) showed no significant effect of treatment or stage.
Red-backed salamander was most abundant in naturally regenerated stands,
followed by thinned stands, and then least abundant in planted stands (Tables 3, 4)

32
(Figure 10), and also positively associated with stand development stage (Table 3, 4)
(Figure 11). Wood frog was more abundant in naturally regenerated stands than both
thinning and plantation managed stands but only in stage 2 stands (Tables 4, 5).
Individual taxa versus stand characteristics
Sorex spp. abundance was negatively correlated with both needle cover and
shrub cover, and positively with leaf litter and hardwood (Table 4) (Appendix figure 6).
Red-backed vole abundance was positively correlated with both percentage of
hardwood forest and stand density (Table 4) (Appendix figure 7). Woodland Jumping
mouse abundance, although not significantly different between stand types or stage,
did have positive associations with leaf litter and canopy cover (Table 4) (Appendix
figure 8). Short-tailed shrew abundance was positively associated with stand wetness
and density, and negatively associated with shrub cover (Table 4) (Appendix figure 9).
Deer mouse abundance was positively associated with canopy cover, wetness (depth to
water table between 0 and 10 cm), as well as dryness (depth to water table between
0.5m and 10 m) (Table 4) (Appendix figure 10).
Both wood frog and red-backed salamander abundances were positively correlated
with leaf litter, canopy cover, and percent hardwood (Table 4) (Appendix figures 11,12)
in keeping with their positive associations with naturally regenerated stands which
have higher levels of these characteristics than the other two stand types (Figure 4).
Red-backed salamander abundance was also negatively associated with shrub cover
and stand dryness (Table 4) (Appendix figure 12).

33
DISCUSSION
I found that managed forests, particularly plantations, had negative impacts on
diversity and total abundance of small mammals. The results were similar, although
not as conclusive, for herpetofauna abundance. These effects are likely due to
fundamental differences in stand characteristics in plantations and stands that have
been pre-commercially thinned. The effect of management appeared to be reduced in
stage 2 managed stands for small mammal abundance, and deer mouse, but not for
small mammal taxonomic richness, Sorex spp., or red-backed voles. No effect of
treatment or stand stage was detected for abundances of woodland jumping mice or
short-tailed shrews. Wood frogs were negatively impacted by both pre-commercial
thinning and plantations, and were 2.5 times more abundant in stage 2 than stage 1
stands. Red-backed salamanders were less abundant in both thinned and planted
stands, and also positively associated with stand development. Taxonomic richness
results suggest that naturally regenerated stands support, on average, 1.7 times more
taxa than plantations, and 1.1 more taxa than thinned stands (and undoubtedly greater
numbers of species). These results suggest that, for some taxa, there are critical stand
attributes that are lost during the conversion of the native Acadian mixed-wood forest
to managed coniferous stands.

34
Effect of management treatments on stand characteristics
Leaf litter and percentage of hardwood
My results were consistent with previous studies which found lower levels of leaf
litter and a lower percentage of hardwood trees in pre-commercially thinned stands
(Etcheverry et al., 2005; Henderson, 2011) and plantations (Waldick et al., 1999; Ross-
Davis and Frego, 2002; Johnson and Freedman, 2003; Ramovs and Roberts, 2003) than
in naturally regenerated stands. These effects are attributed to tree species selection
(PCT), herbicide treatments (plantations), and site preparation (plantations).
There was no difference in leaf litter or percent hardwood between stages,
suggesting that the conversion of the native mixed wood forest to managed stands,
both thinned and planted, results in a permanent loss of deciduous habitat
components.
Depth to water table between 0 and 0.1m
My results were consistent with previous research that found plantations to have
fewer damp (i.e. depth to water table 0 – 0.1m) areas (Bliss and Comerford, 2002;
DeMaynadier and Houlahan year, in Calhoun and DeMaynadier, 2007). This stand
characteristic is important because it would likely result in a drier microclimate, which
could have affected the moisture content and therefore the value as habitat for small
mammals and amphibians, of other stand characteristics such as leaf litter and coarse
woody debris.

35
Needle litter
Needle litter was influenced by both stand stage and treatment. I found it to be
highest in later, stage 2 pre-commercially thinned stands compared to both naturally
regenerated stands and plantations. It is likely that stage 2 stands had more litter
because there has been more time for needles to accumulate, furthermore I suspect
that the difference in needle litter between thinned stands and the other two stand
types is a result of the stand composition prior to clear-cutting. Thinned stands were
regenerated by natural processes with desired softwood species because they were
present as seed trees or in the vicinity of the stand and so likely have had long-term
accumulation of needle litter. By contrast, plantations require planting in order to
achieve the desired softwood species and naturally regenerated unmanaged stands
had a mixed-wood composition and so the long-term contribution of needle litter is
likely lower.
Canopy cover
Within the early stage 1 development stands I found canopy cover to be lowest in
plantations followed by thinned stands but did not detect a difference between stand
types in stage 2. Previous studies have noted a reduction in cover in thinned stands
versus naturally regenerated stands (Fuller et al., 2004; Homyack et al., 2004;
MacCracken, 2005), however a long-term study by Henderson (2011) also found the
difference in canopy cover between stand types to be mitigated by 10 years post
thinning. These results are not surprising as the intent of pre-commercial thinning is to

36
reduce competition by removing hardwood and overly dense coniferous trees; it
therefore stands to reason that canopy would be reduced post-thinning.
My results echo a study by Veinotte et al. (2003), which found canopy cover in
early stage plantations (3 to 8 years) to be lower than reference mixed-wood stands
but equal or greater in percent cover than reference stands at later stage plantations
(13 to 21 years). I suspect that this shift from a comparatively more open canopy to a
closed one in plantations is a result of the accelerated rate at which plantations are
managed to grow.
Shrub cover
There was no difference in shrub cover among treatments in stage 1, but there was
a difference in stage 2 stand. Shrub cover was lowest (overall for both stages) in stage
2 thinned stands and significantly lower than naturally regenerated stands of the same
stage but not significantly lower than plantations. This is contrary to previous studies,
which found understory cover to have a positive response to thinning (Hayes et al.,
1997; Thomas et al., 1999; Sullivan et al., 2000; Fuller et al., 2004; Sullivan et al., 2005).
It does not appear that the observed difference in canopy closure among these stands
is the primary driver of shrub abundance.
Coarse woody debris
My results supported the conclusions of 2 previous studies conducted in Maine
(Fuller et al., 2004; Homyack et al., 2004) that did not find a significant difference in
coarse woody debris between naturally regenerated and thinned stands, but are in

37
contrast to other studies that suggest that thinning has a negative effect on coarse
woody debris (Carey and Johnson, 1995; Etcheverry et al., 2005; MacCracken, 2005) in
all studies, slash was left in-situ. However, these studies often had reference stands
that were much older than the managed stands. I suspect the similarity in CWD
between thinned and naturally regenerated stands in this study is related to the fact
that both stand types had similar origins prior to thinning, were relatively young (i.e.
not to an over-mature stage where natural mortality occurs), and the slash from
thinning (fine woody debris) was not considered in the CWD measurement.
Percentage of CWD was 2 times higher in stage 1 plantations than naturally
regenerated and pre-commercially thinned stands of the same stage, but there was no
significant difference among stand types within stage 2 stands. Presumably, high CWD
in early stage plantations is due to site preparation but this difference is not maintained
in later stages due to decay (Harmon et al., 1986).
Stand density
I did not find a difference in stand density between naturally regenerated and
plantation stands. Ross-Davis and Frego (2002) reached similar conclusions in this
region. By contrast, some previous studies have found tree density to be lower in
plantations (Hansen et al., 1991; Roberts and Ramovs, 2003) and thinned stands (Hayes
et al., 1997; MacCracken, 2005) relative to naturally regenerated reference stands.
However, I did find that stand density was greater at stage 2 for plantation and PCT
stand types, but not for naturally regenerated stands (Table 5). This is probably
because I only included trees with DBH >10 cm in my stand density estimates, and thus

38
many smaller diameter trees would not have been included in stage 1 stand density
estimates.
Moss cover
There was a statistically significant interaction between stand stage and stand
treatment for moss cover but there were no significant differences when I examined
the stages and stand types separately. This can happen when there isn’t enough power
to detect an effect when stand stages are analyzed separately (Table 5).Moss cover was
higher in the stage 2 stands than stage 1 stands (Table 3), which is in contradiction to
Ross-Davis and Frego (2002) who found no relationship between bryophyte cover and
time since disturbance. My results are in keeping with Hill (1979), who suggests moss
cover tends to be greater in a closed canopy, a characteristic that was significantly
greater in stage 2 stands than stage 1 stands in my study. Although not statistically
significant, moss cover was much higher in PCT, and to lesser extent plantations, than
naturally regenerated stands in stage 2 stands, but was similar across all treatments in
the early stage. I found moss cover to be negatively associated with percentage of
hardwood, (Appendix table 4)- which was lowest in plantations (Table 4), which is
consistent with Ross-Davis and Frego (2002), who found bryophyte cover to be higher
in plantations than naturally regenerated clear-cuts. They suggest however, that
estimate of moss cover is largely driven by a subset of robust perennial bryophyte
species, which are likely able to thrive in stands that may not have been ideal habitat
for other moss and vascular plant species.

39
Effect of intensive forest management on small mammals
Community-level effects
Taxonomic richness and abundance in PCT stands
Small mammal taxonomic richness and small mammal abundance were not
significantly different between naturally regenerated stands and thinned stands. These
results are consistent with previous studies, which found no relationship between
thinning and small mammal taxonomic richness (Lautenschlager et al., 1997; Sullivan et
al., 2002; Verschuyl et al., 2011) and abundance (Fuller et al., 2004; MacCracken, 2005).
This is attributed to the fact that the majority of small mammals are resource
generalists (Parker, 1989; Mitchell et al., 1997; Bowman et al., 2001; Sullivan et al.,
2002; Sullivan et al., 2005).
My results are consistent with many previous studies in both eastern and western
North America which found no long-term effect of thinning (10 -16 years post thinning)
on small mammals, compared to both softwood and mixed-wood control sites (Sullivan
et al., 2001; Homyack et al., 2004, 2005; Sullivan et al., 2005). Homyack et al. (2004)
found no detectable effect of PCT during 1-11 years post thinning on small mammals
and suggested that thinning may actually accelerate the development of habitat
characteristics, such as a reduced stand and understory density, more common in old
growth stands. However, Etcheverry et al. (2005) did find a negative long-term effect of
thinning on small mammal taxonomic richness and abundances of many small mammal
species (>10 years post thinning) when compared to mixed-wood stands.

40
Despite reduced leaf litter and percentage of hardwood in stage 2 thinned stands
and identified positive associations of small mammals to these stand characteristics, I
did not detect a long-term effect of thinning on small mammal abundance. It is
possible that the small mammal associations with these stand characteristics are, in
fact, a determining factor of small mammal abundance and taxonomic richness but that
the effect of stand treatment was not sufficient to be detectable, given low power and
high variability in the stand characteristics within thinned stands. It is also possible that
there are multiple factors that influence abundance and diversity and that only some of
those are associated with treatments such as planting and pre-commercial thinning. In
addition, it is possible that small mammals are able to adapt to changes caused by
different treatments. For example, needle litter, which was higher in thinned stands
than naturally regenerated stands, may have offered a substitute for leaf litter in terms
of habitat (e.g. seed caches) for small mammals, as suggested by Abbott and Quink
(1970). I did not detect a relationship between small mammals and needle litter but if
small mammals are able to use both leaf and needle litter we would not expect to see
correlations.
Canopy cover, which was significantly different between stage 1 thinned and
naturally regenerated stands but not stage 2 stands, should be further studied as a
critical limiting factor for small mammals in thinned forests. Etcheverry et al. (2005)
suggest that canopy cover is reduced following thinning, which is essential in providing
cover from predation for small mammals. I detected a positive relationship between
small mammal taxonomic richness and canopy cover, but not abundance. This is

41
probably because shrews (Sorex spp and Blarina brevicauda) comprised 72.5% of all
small mammal individuals and were not among the species that appear to be affected
by canopy cover. That is, the taxa that contributed to reduced taxonomic richness
when canopy cover was reduced were not taxa that I captured in high abundance.
This difference between taxonomic richness and abundance results highlights the
importance of using both measurements to fully understand the impacts of plantations
and pre-commercial thinning. For example, it is possible that the impacts of plantation
and/or PCT may not cause local extirpations, but may lead to declines in abundance –
such impacts would not be detected if abundance was ignored.
Taxonomic richness and abundance in plantations
I found both small mammal taxonomic richness and abundance to be lower in
plantations when compared to naturally regenerated stands. Previous studies have
found small mammal abundance to be lower in plantations than in naturally
regenerated stands (Langley and Shure, 1980; Gagné et al., 1999; Cameron and
Puddister, 2000; Mengak and Guynn Jr., 2003) attributed to a reduction in stand
characteristics such as shrub/canopy complexity (Carey and Johnson, 1995; Bowman et
al., 1999; Bowman et al., 2001; Ramirez and Simonetti, 2011), leaf litter (Kaminski et
al., 2007), and moistness (Miller and Getz, 1977) all of which have been identified in
this study as characteristics that are positively associated with small mammals.
However, two studies in Virginia, USA and New Brunswick, Canada (both of which have
native mixed-wood forests) found that small mammals were as diverse and abundant
in plantations as in native mixed-wood controls (Mitchell et al., 1997; Bowman et al.,

42
2001). The authors attributed this to broad habitat and resource adaptability, but they
also reported variation in species’ abundances among stand types, suggesting that
individual species differ in their tolerance for plantation treatments.
Although few studies have specifically compared plantations to both naturally
regenerated and PCT stands, Mengak and Guynn Jr. (2003) suggested that plantations
were more deleterious for small mammals than thinned stands because herbicide use
reduces deciduous understory plant diversity while thinning increases it. I found a
similar trend of lower small mammal abundance and taxonomic richness in plantations
than PCT stands but the difference was not statistically significant (Table 3).
Structural complexity (e.g. shrub cover, canopy cover, coarse woody debris,
native tree species) has been associated with an increase in small mammal abundance
and taxonomic richness, and is often negatively associated with plantations (DeGraaf
and Rudis, 1990; Hartley, 2002; Ramirez and Simonetti, 2011). The degree to which
these characteristics change with stand stage is dependent on the intensity of forest
management practices such as site preparation, use of non-native species, and
herbicide applications (Carey and Johnson, 1995; Lindenmeyer, 2003). The fact that I
found taxonomic richness to be lower in plantations than naturally regenerated stands
at both early and later stages suggests that there are critical factors missing for a
subset of taxa in plantations even as they develop. These results are in keeping with
Johnson and Freedman (2003), who compared various ages of plantations in New
Brunswick to naturally regenerated (and un harvested) mixed-wood stands in New
Brunswick, and found the comparative loss of characteristics such as snags and

43
percentage of hardwood remained constant as plantations developed. They did,
however, find that canopy cover increased with time since initiation in plantations
while shrub cover and coarse woody debris decreased. Despite this, I found that effects
on small mammal abundance were no longer detectable by the stage 2 of
development. Studies that compared small mammal abundance in early stage
plantations (10 years or younger) with mature plantations (~20 years old) are scarce.
Previous research into stand preparation management techniques indicates that the
use of herbicides, does not have a long-term (10+ years) direct effect on small mammal
taxonomic richness (Sullivan et al., 1997; Gagné et al., 1999; Sullivan and Sullivan, 2003)
but, long-term species specific effects are present, likely as a results of a negative effect
on habitat and food resources (Thompson et al., 2003). A review by Thompson et al.
(2003) noted that there are no long-term studies of the effect of plantations on small
mammals, but that it is theorized that the reduction in a mature forest stage as a result
of IFM rotations would be detrimental to species that require mature forest
characteristics.
My results suggest that CWD and canopy cover are potentially critical factors for
small mammal abundance, which have previously been identified as important factors
for small mammals because they provide shelter from predators, habitat for
invertebrate food sources, as well as a source of moisture (Carey and Harrington, 2001;
Bowman et al., 2000). These characteristics were similar between stage 2 but not stage
1 plantations and naturally regenerated stands.

44
Species-level effects
Shrews in PCT stands
Shrews (Sorex spp. and Blarina brevicauda) were more abundant in naturally
regenerated stands relative to PCT stands. This observation conflicts with studies which
found no difference (Henderson, 2011) or a positive relationship between shrews and
thinning, attributed to reduced canopy which allows for more insects and understory
vegetation (Wilson and Carey, 2000; Homyack at al., 2005; MacCracken, 2005), but
consistent with Fuller et al. (2004) in the Acadian forest in Maine, who found deciduous
stands to be most suitable for shrews, and attributed this to the qualities and
quantities of the leaf litter. Homyack et al. (2004) compared thinned stands to clear-
cut and stands treated with herbicides, while Wilson and Carey (2000) and MacCracken
(2005) compared thinned stands to naturally regenerated coniferous stands, and
therefore the proportion of deciduous components present in my study may not have
been present in these studies. I conclude that there were likely several factors at play
which contribute to shrew abundance, and that shrub cover may have been more
important in stands that are softwood dominated.
Shrew abundance was positively associated with percentage of hardwood and
leaf litter, stand characteristics that are generally greater in naturally regenerated
stands than PCT stands. A positive association between shrews and leaf litter has been
well documented (Getz, 1961; Merritt, 1986; DeGraaf and Healy, 1992; Wilson and
Carey, 2000; DeGraaf and Yamasaki, 2001) as leaf litter maintains a moist microclimate.
In addition, leaf litter is positively associated with invertebrate populations (Haskell

45
2000), and previous studies demonstrated that shrews are positively associated with
food availability (Innes et al., 1990; Bellocq et al., 1994). Like Craig, 1995, McKay and
Komorski, 2003 and Thompson et al., 2003, I found no association between shrew
abundance and coarse woody debris, in contrast with other studies that have found
coarse woody debris to be important as a retainer of moisture (e.g. Davis et al., 2010
and DeGraaf and Yamasaki 2001). McKay and Komorski (2003) suggested that coarse
woody debris may be more necessary in predominantly softwood stands, where its
capacity for moisture retention compensates for the absence of leaf litter.
Shrews in plantations
Shrew (Sorex spp. and Blarina brevicauda) abundance was lower in plantations
than naturally regenerated stands. This is in contrast to previous studies which found
that plantations supported more shrews than mixed-wood controls (Naylor and
Bendell, 1983 in Bellocq and Smith, 2003; Parker, 1989). Hartling (2004) suggested that
shrew abundance was better predicted by stand characteristics such as canopy cover,
moisture, temperature, and coarse woody debris than stand type, which may explain
why my results are different than some previously published findings. I did not find an
association between shrews and canopy cover. These results are consistent with a
review by Zwolak (2009), who found no difference in shrew abundance in plantations
that were >10 years since initiation and those that were 10-20 years old, suggesting
that because shrews are generalist insectivores they are not directly affected by stand
development. I found a positive relationship between shrews and leaf litter and
percentage of hardwood which was more abundant in managed mixed-wood stands

46
than plantations. As was the case with PCT stands, I suspect that reduced leaf litter in
managed stands is a driving factor in the reduced abundance of shrews. Furthermore,
there was a significant difference in the depth to water table (i.e. stand moisture)
between plantations and naturally regenerated mixed-wood stands, the latter having a
higher amount of water closer to the surface (although regression results did not show
an association between shrews and stand wetness). Vernal pools are associated with
an increase in invertebrates and amphibians (Brooks and Doyle, 2001), which are
important food sources for shrews (van Zyll de Jong, 1983; DeGraaf and Yamasaki,
2001).
Although the naturally regenerated stands had greater mean canopy cover,
they had many more canopy gaps than the plantations (pers. obs.) and therefore
provided greater habitat heterogeneity, including open areas suitable for invertebrates.
A more complex canopy provides for cool moist habitat as well as warmer dryer areas,
and large invertebrate populations which are favourable for shrews (Banfield, 1974;
Innes et al., 1990; DeGraaf and Yamasaki, 2001; Whittaker Jr., 2004).
Red-backed voles in PCT stands
My results were consistent with several studies which have documented red-
backed voles to be generally unaffected, or to prefer pre-commercial thinning
treatments to reference stands (Sullivan et al., 2000; Sullivan et al., 2001; Homyack et
al., 2004; Hanley et al., 2005, MacCracken, 2005; Kaminski et al., 2006; Dracup et al.,
2015), but conflicted with others that suggest that red-backed voles are more
abundant in naturally regenerated stands than PCT stands (Etcheverry et al., 2005;

47
Henderson, 2011). Fuller et al. (2004) found that thinning did not negatively affect red-
backed vole density within the Acadian forest in Maine because the thinned stands had
ample amounts of coarse woody debris and downed logs, previously identified as
important to red-backed voles (Carey and Johnson, 1995; Bowman et al., 2000;
Etcheverry et al., 2005; Kaminski et al., 2006; Sullivan et al., 2013; Dracup et al., 2015). I
did not find a difference in coarse woody debris between treatment types nor did I find
an association with red-backed voles and coarse woody debris, however, my
measurements of coarse woody debris did not consider fine woody debris, differences
in decay class, nor the vertical volume of downed wood and therefore my results must
be interpreted with caution. A study in New Brunswick, Canada by Henderson (2011)
suggests that a threshold amount of CWD may be required before it can be of habitat
value to red-backed voles. Furthermore, several studies that did not find association
between red-backed voles and coarse woody debris (Carey and Harrington, 2000;
Sullivan and Sullivan, 2001; Homyack et al., 2004; Henderson, 2011) hint at the
generalized resource use by red-backed voles. It appears that several habitat
characteristics can provide the food, nesting sites, and shelter from predators
necessary for voles (Sullivan et al., 2000; Etcheverry et al., 2005). I found positive
associations between voles and stand characteristics previously identified as important
to voles: adequate canopy cover layer (Pearce and Venier, 2005; Vanderwel et al.,
2010), moist microclimate (Miller and Getz, 1977), and stand density typical in old
growth forests (Klenner and Sullivan, 2003; Pearce and Venier, 2005). These results
suggest that there are several factors at play in predicting red-backed vole abundance,

48
and that it may be possible to maintain an adequate amount of these characteristics
within PCT stands to support red-backed voles.
Red-backed voles in plantations
Current research into the effects of plantations on red-backed voles is
contradictory, suggesting that voles may be more affected by the absence of specific
stand characteristics than by stand type. Based on a review of 50 papers with an
emphasis on the boreal forests of Ontario, Thompson (2003) found that the overall
effect of intensive forest management on red-backed voles was negative, in response
to reduction in coarse woody debris and ground vegetation cover. However, other
studies in the northeast of North America suggest that red-backed vole abundance is
unaffected by plantations (Parker, 1989) and/or are abundant in a variety of stand
types, both mixed-wood and coniferous (DeGraaf et al., 1992; Forbes et al, 2010). I
found red-backed vole abundance to be at least 2 times higher in naturally regenerated
and PCT stands than plantations across stage 1 and stage 2 stands, suggesting that
there is a loss of a critical habitat component in the conversion of native stands to
plantations. This is consistent with the reduced red-backed vole abundance reported in
the New Brunswick Acadian forest in landscapes with relatively large amounts of
plantation (Bowman et al., 2001).
One possible explanation for the negative relationship between red-backed
voles and plantations is reduced tree canopy, which has previously been identified as
important to red-backed voles (Parker, 1989; McLaren et al., 1998; Thompson et al.,
2003; Pearce and Venier, 2005) because it provides cover from predators and increases

49
stand moisture and subsequent fungal food sources (Miller and Getz, 1977; Carey and
Johnson, 1995; Fuller et al., 2004). Canopy cover was significantly lower in plantations
than in thinned stands, and naturally regenerated mixed-wood stands. Red-backed
vole abundance was strongly correlated with canopy cover, suggesting, as other studies
have, that cover is an integral stand characteristic for voles and may be more important
than disturbance type (Keinath and Hayward, 2003; Pearce and Venier, 2005). Red-
backed vole abundance was positively associated with stand wetness (indicative of a
moist microclimate), which was significantly lower in plantations than both PCT and
naturally regenerated stands. Further research should investigate the relationship
between depth to water table (i.e. saturation of soil) and stand characteristics such as
coarse woody debris and fungal food sources as it is possible that stand wetness could
be an integral factor in providing stand characteristics required by red-backed voles.
Furthermore, although I did not find any associations between red-backed voles and
deciduous characteristics such as leaf litter, shrub cover, or percentage of hardwood,
previous studies found red-backed voles to be dependent on shrub cover for survival
from predators and smaller shrubs as a food source (Allen, 1983; Hanley et al., 2005),
and thus herbicides, commonly used on young plantations, have been found to have a
temporary negative effect (D’Anieri et al., 1987; Runciman and Sullivan, 1996; Gagné et
al., 1999; Bowman et al., 2001). It is possible that although I did not find a difference in
shrub cover among treatment types, the negative effect of plantations on red-backed
voles could be a residual effect of herbicide treatments and subsequent loss of earlier
shrub cover.

50
Contrary to previous studies that have identified red-backed voles as positively
associated with stand stage (Zwolak, 2009), I did not detect a difference in red-backed
vole abundance between stage 1 and 2 stands. Stage 2 stands within this study did not
contain trees in an over-mature stage, and therefore were likely not representative of
the ‘old growth’ stands which red-backed voles have been previously identified as
being positively associated with (Sullivan et al., 2000).
Deer mouse versus stand stage and treatment
I found deer mouse abundance to be influenced by both stand stage and
treatment, being 9 times greater in naturally regenerated stands than plantations.
Likewise, deer mouse abundance was greater in PCT stands than plantations, but only
in the stage 1 stands (Table 5), suggesting that the negative effects of management
may be mitigated by stand development. My results are consistent with a study by
Henderson (2011) in New Brunswick, Canada, who found that deer mice are positively
associated with canopy cover, which was significantly different between treatment
types in stage 1, but not stage 2, stands.
Effects of intensive forest management treatments on herpetofauna
Community-level effects
Herpetofauna taxonomic richness and abundance versus stand stage and
treatment
I did not find herpetofauna taxonomic richness to be affected by stand stage,
but I did find abundance to be influenced by an interaction between treatment and

51
stage, being different among treatments in stage 2 stands but not in stage 1 (Table 5).
This suggests that the effects of treatment on herpetofauna do not manifest
themselves until later in stand development. The negative impacts of stand
management at early stages may have been offset by the open canopy of early
plantations and PCT stands, which are ideal habitat for migrating juvenile pond-
breeding herpetofauna species because of a resulting increase in macro invertebrates
as well as air and pond temperature (Bury and Corn, 1988; Skelly et al., 1999; Palik,
2001). Skelly et al. (1999) found that forest succession had a negative effect on hydro-
period, reducing breeding habitat for some amphibian species. Furthermore, Aubry
(2000) found that a partially open canopy cover may be beneficial to amphibians by
allowing understory shrub cover, which provides important foraging opportunities for
food sources. This contradicts some previous studies that found an increase in
herpetofauna abundance (mostly salamanders) with stand stage: these studies looked
at various ages following clear-cutting or burning with no subsequent management
comparative to non- disturbed stands of 30 years and up to 100 years (Pough et al.,
1987; Bonin, 1991; Petranka et al., 1993; Duguay and Wood, 2001; Hicks and Pearson,
2003; Thompson et al., 2008)- an age generally older than stands at commercial
maturity.
Taxonomic richness (although not statistically significant) as well as wood frog
and red-backed salamander abundances, indicated a preference for older stands. This
is attributed to increased coarse woody debris, lower temperatures, and increased
stand moisture (Dupuis et al., 1995; Martin and McComb, 2003; Loehle et al., 2005).

52
This difference between total and species-specific abundance as well as taxonomic
richness responses highlights the importance of using both measurements to assess
forest suitability- a subset of species may thrive in specific environments, but all
possible species may not be represented (Aubry, 2000).
Herpetofauna taxonomic richness and abundance in PCT stands
A review by Verschuyl et al. (2011) of 33 studies concluded that herpetofauna
response to thinning is variable and species specific, but generally neutral within North
America. I did not detect a statistically significant difference in herpetofauna taxonomic
richness between thinned and naturally regenerated stands. Low statistical power,
however, prevented detection of any potential small and moderate effects.
Herpetofauna taxonomic richness trended toward being higher in naturally
regenerated mixed-wood stands than PCT stands, supporting suggestions that loss of
deciduous trees and leaf litter are detrimental, particularly over time to terrestrial
salamanders (Waldick et al., 1999; Ryan et al., 2002; Semlitsch et al., 2009).
Abundance of herpetofauna, conversely, was affected by an interaction
between stand stage and treatment, being significantly higher in older naturally
regenerated stands than PCT stands (yet not plantations), but not statistically different
between treatment types in the stage 1 stands. I suspect that total herpetofauna
abundance (most likely in stage 1 stands) was in part influenced by green frogs,
accounting for 35% of herpetofauna captures. This species favours a more open canopy
(prevalent in younger stands), as it increases pond temperature and invertebrate food
sources (Skelly et al., 2014).

53
Because pre-commercial thinning removes the competitive deciduous tree
component of stands, as canopy cover closes in older stands, shrub cover is reduced
relative to stage 1 stands. The loss of leaf litter and lower percentage of hardwood
have been identified as important to herpetofauna. These factors are likely the
mechanisms behind the reduction of herpetofauna in stage 2 thinned stands,
suggesting herpetofauna could be negatively affected by stand succession. For many
native herpetofauna species, especially salamanders, thinning practices that maintain a
partial canopy and allow leaf litter to persist have been shown to promote the moisture
retention and protection from predators herpetofauna require (Pough et al., 1987;
Harpole and Haas, 1999; Grialou et al., 2000; Karraker and Welsh, 2006; Verschuyl et
al., 2011). The long-term effects of pre-commercial thinning on herpetofauna have not
been well documented. I was not able to locate any previous studies that evaluated
herpetofauna abundance or taxonomic richness in multiple age stands since thinning.
Of the two studies published that explicitly look at amphibian response to thinning
after at least 10 years, neither found a negative effect of thinning. A previous study in
California found no difference in amphibian abundance between previously clear-cut
stands that were either thinned 10 years prior or un-thinned. They suggest that the
thinning treatment in primarily softwood forest types does not have negative long-
term effect on amphibian abundance but may affect body condition (Karraker and
Welsh, 2006). In New England Brooks (1999) found no long term effect of thinning on
red-backed salamanders in oak forest that had been thinned 12-21 years previously
when compared to un-thinned controls. Brooks (1999) attributes an increase in

54
understory vegetation as a result of thinning disturbance to mitigate any effect on red-
backed salamanders.
Herpetofauna taxonomic richness and abundance in plantations
In contrast to several other studies (e.g. Bennett et al., 1980; DeMaynadier and
Hunter, 1998; Waldick et al., 1999; Hanlin and Martin, 2000; Ryan et al., 2002), and two
reviews (DeMaynadier and Hunter, 1995; Palacios et al., 2013), I found no statistically
significant decline in herpetofauna richness or abundance in plantations, nor did I find
any positive associations with stand characteristics. Stand characteristics previously
identified as important to herpetofauna, such as reduction in leaf litter (Pough et al.,
1987; Waldick et al., 1999), canopy cover (Harmon et al., 1984; Dupuis et al., 1995;
Harpole and Haas, 1999), percent hardwood (Degraaf and Rudis, 1990; Thomspon et
al., 2003; Loehle et al., 2005), coarse woody debris (Dupuis et al., 1995; Waldick et al.,
1999) and stand wetness or proximity to vernal pools/ (Fleet and Autrey, 1999; Ryan et
al., 2002) were all lower in plantations compared to naturally regenerated mixed-wood
stands. Herpetofauna taxonomic richness and abundance were reduced in plantations
relative to naturally regenerated stands such that that statistical power prevented the
detection of an effect. However, I did find herpetofauna abundance to be negatively
associated with moss cover, stand density, and canopy cover. This may be because a
preference for increased temperature and reduced canopy cover (Skelly et al., 2002;
Skelly et al., 2014) offset some of the deleterious effects of plantations.
The long-term effects of plantations on herpetofauna have not been well
documented. A study by Means et al. (1996) in Florida over 22 years found a decline in

55
amphibian abundance over 10 generations, and theorized that mechanical alteration of
the terrestrial habitat, loss of vernal pools, and the consistently closed canopy
associated with older plantations, are important factors. It is possible that site
preparation led to a reduction in vernal pools as a result of fewer depressions (pers.
obs.).Combined with older trees requiring more water this may lead to a gradual loss of
available habitat for pond-breeding species. A comparison between means in the
different stand types suggests that herpetofauna were less abundant than unmanaged
naturally regenerated stands among stage 2 stands (although not statistically
significantly different). I suspect that I did not have enough statistical power to detect a
potential effect, but it is possible that older plantations provide a less favourable
habitat for herpetofauna when compared to naturally regenerated stands of the same
age.
Species-level effects
Wood frog versus stand stage and treatment
Wood frogs breed in ponds but then disperse to forests in following the aquatic
larval stage. Previous studies have identified wood frogs as being particularly sensitive
to terrestrial habitat characteristics in their non-water life phase when compared to
other anuran species (DeMaynadier and Hunter, 1998; Guerry and Hunter, 2002;
Patrick et al., 2006; Popescu et al., 2012). I found wood frog abundance to be
influenced by an interaction between stand stage and treatment, with abundances
being highest in stage 2, naturally regenerated stands (Table 5). These results are in

56
keeping with previous research in eastern North America, which found that adult wood
frogs are associated with old stand characteristics – a closed canopy (Gibbs, 1998;
Baldwin et al., 2006) presence of leaf litter and higher percentage of hardwood, all of
which are generally associated with old stands.
Wood frogs in PCT stands
I found wood frogs to be negatively affected by PCT, although literature
examining the effect of thinning on wood frogs is scarce, previous studies suggest the
severity of the effect is dependent on the intensity of reduction in canopy cover (Gibbs,
1997; Patrick et al., 2006; Blomquist and Hunter, 2010; Todd et al., 2014; Semlitsch et
al., 2009). In addition, I found positive relationships between wood frogs and canopy
cover, leaf litter, and percent hardwood (Heatwole, 1961; Skelly et al., 2002; Baldwin et
al., 2006; Thompson et al., 2008; Blomquist and Hunter, 2010), probably because these
characteristics contribute to a comparatively cooler microclimate and increased
moisture than more open stands. Thinned stands had a lower canopy cover, lower
percentage of hardwood, and less leaf litter than naturally regenerated mixed-wood
stands, but did have an average canopy cover of 61%. This is above the previously
suggested critical threshold of 50% cover necessary to maintain wood frog abundance
(Patrick et al., 2006; Blomquist and Hunter, 2010). A review by Semlitsch et al. (2009)
suggests that thinning has the potential to be positive for wood frogs where there is an
increase in shrub cover, with this leading perhaps to increased invertebrate food
sources and a favourable microclimate. However, I was not able to confirm this theory
as I did not detect a difference in shrub cover between the thinned stand and the

57
naturally regenerated mixed-wood stands in this study. Like Patrick et al. (2006), I did
not find coarse woody debris to be important for wood frogs. However, this contradicts
findings by Blomquist and Hunter (2010) who suggested coarse woody debris is
important as it retains moisture. As was noted for red-backed voles, it is possible that
coarse woody debris is more important where characteristics such as leaf litter, vernal
pools, and canopy cover are not providing adequate moisture retention. My findings
suggest that there are potentially several factors at play. Presence of a deciduous
component seems to be important, and the suggested threshold of 50% canopy cover
should be considered conservative for maintaining wood frog populations. Future
research should compare the degree of canopy cover and its impact on shade
intolerant shrub cover.
Wood frogs in plantations
My results are consistent with studies which found wood frogs to be more
abundant in naturally regenerated mixed-wood stands than plantations (Degraaf and
Rudis, 1990; DeMaynedier and Hunter, 1995; Waldick et al., 1999; Baldwin et al., 2006).
Higher wood frog abundance was associated with greater canopy cover and deeper leaf
litterboth of which are features of forests others have found important for wood frogs
(Heatwole, 1961; DeMaynadier and Hunter, 1999; Waldick et al., 1999; Baldwin et al.,
2006; Blomquist and Hunter, 2010). The importance of percent canopy cover, which
differed significantly among naturally regenerated ( =89%), thinned ( =61%), and
planted stands( =33%), is consistent with the suggestion that a threshold of 50% cover
is necessary for wood frogs (Patrick et al., 2006; Blomquist and Hunter, 2010).

58
Red-backed salamanders versus stand stage
DeMaynadier and Hunter (1995, 1998) suggest that because red-backed
salamanders are non-migratory terrestrial breeders and rely on cutaneous respiration,
they are potentially more sensitive to, and a good indicator of, forest management
practices. My results are consistent with current research, which suggests that
salamanders are positively associated with time since clear-cutting (Welsh, 1990; Bonin
1991; DeMaynadier and Hunter, 1995; Dupuis et al., 1995; Herbeck and Larsen, 1999;
Grialou et al.. 1999). Homyak and Haas (2009) suggest that 60+ years are required
following a harvesting disturbance to adequately return the litter layer to a state
suitable for salamander habitat, as opposed to DeMaynadier and Hunter (1995) who
suggests that timeline to be closer to 25 years post-harvest. My study did not have a
comparable ‘old growth’ stand, but does suggest that habitat characteristics previously
identified as important to red-backed salamanders, such as leaf litter (Bonin, 1991;
Pough, 1987) and canopy cover (DeMaynadier and Hunter, 1998; Brooks, 1999;
Harpole and Haas, 1999), are more prevalent in stage 2. Forest managers should
therefore maintain this later stage of forest stand in order to provide habitat for red-
backed salamanders.
Red-backed salamanders in PCT stands
I found red-backed salamander abundance to be 2 times greater in naturally
regenerated stands than PCT stands; however, this result was not statistically

59
significant. Current research in coniferous-dominant stands suggests that red-backed
salamander abundance is reduced initially following thinning, but recovers once a
deciduous shrub cover is established (Brooks, 1999; Grialou et al., 2000). Short-term
and long-term studies in the Appalachian region suggest that, because salamanders
depend on a moist microclimate (Todd et al., 2014), that the strength and duration of
effects are related to the degree to which canopy cover is reduced (Knapp et al., 2003;
Homyak and Haas, 2009). By contrast, Messere and Ducey (1998) found no effect of
thinning on red-backed salamanders, which they attributed to adequate residual leaf
litter. I found red-backed salamanders to be positively associated with increased
canopy cover, increased percent hardwood, and increased leaf litter, which is
consistent with other studies which have identified shaded, moist habitats (Dupuis et
al., 1995; Clay and Brownlie, 1997; Morneault et al., 2004), and leaf litter (Renaldo et
al., 2011) as a critical requirements, all of which were lower in PCT stands than
naturally regenerated ones. Harpole and Haas (1999) noted that thinned stands
provide adequate canopy cover for red-backed salamanders much sooner than stands
completely harvested. My results suggest that forest managers should maintain at least
a 66% (mean PCT canopy cover) cover, and that 33% (mean plantation canopy cover)
cover is inadequate at providing habitat for red-backed salamanders. Future research
should examine the threshold at which canopy cover maintains an equivalent habitat to
naturally regenerated stands.

60
Red-backed salamanders in plantations
The conversion of previously mixed-wood stands to plantations has been
identified as detrimental to red-backed salamanders as a result of a decrease in pH
(Clay and Brownlie, 1997), leaf litter (Pough et al., 1987; Waldick et al., 1999), canopy
cover and moisture (Clay and Brownlie, 1997; Mitchell et al., 1997; Fleet and Autry,
1999). I found that the density of red-backed salamanders was 86% lower in
plantations relative to naturally regenerated mixed-wood stands. Previous studies
found the impacts of harvesting on terrestrial salamanders are temporary and
abundances will be equivalent to naturally regenerated controls over time (Harper and
Guynn, 1999; Duguay and Bohall Wood, 2002). However, my results suggest that the
cumulative effect of initial harvesting, site preparation, and plantations result in a
permanent loss of habitat features integral to re-backed salamander survival. Red-back
salamander abundance was positively associated with leaf litter, canopy cover, and
percentage of hardwood and negatively associated with stand dryness and shrub cover.
The importance of coarse woody debris has been highlighted by several studies
(Freedman et al., 1996; Waldick et al., 1999; Hartley, 2002; Ross-Davis and Frego, 2002;
Johnson and Freedman, 2003; Betts et al., 2005) as an important habitat characteristic
often lost by plantation management and shorter harvest rotations. However, I did not
find significant differences in coarse woody debris among stand types in this study.
Previous studies have noted that coarse woody debris must be moist in order to be
suitable habitat for red-backed salamanders (Dupuis et al., 1995; Waldick et al., 1999).
A negative association with stands that had a depth to water table greater than 50 cm

61
suggests that perhaps a greater in moister in stands (and therefore moist substrate)
may be required, along with adequate coarse woody debris. DeMaynadier and Hunter
(1995) expressed concern about the comparison of relatively young plantations to
natural stands that are much older. The work reported here addresses this concern by
comparing forest stand types that are similar in both relative and seral age. In spite of
this, and after controlling for stage I, I still found effects on salamander abundance.
I was not able to locate any long-term studies on the effect of plantations on
red-backed salamanders, however Pough (1987) noted that red-backed salamander
abundances were lower in older plantations when compared to naturally regenerated
mixed-wood controls. Previous studies have found that abundance was positively
associated with time since clear-cutting (Welsh, 1990; Bonin 1991; DeMaynadier and
Hunter, 1995; Dupuis et al., 1995; Herbeck and Larsen, 1999; Grialou et al., 2000). In
light of the fact that managed forests operate on a ~30 year growth to harvest rotation,
it is recommended that forest managers maintain older stands as part of the forest
landscape in order to sustain red-backed salamander populations. My results suggest
that a deciduous component (i.e. leaf litter and percentage of hardwood) and an
adequate canopy cover should be maintained in order to provide habitat for red-
backed salamanders. Because red-backed salamanders are non-migratory terrestrial
breeders and rely on cutaneous respiration (DeMaynadier and Hunter 1995, 1998),
they are potentially more sensitive to, and a good indicator of, forest management
practices. In light of this reliance on cutaneous respiration, I suspect that depth to

62
water table (i.e. stand wetness), which was greatest in naturally regenerated stands,
followed by PCT, and plantations, is a critical factor for red-backed salamanders.
Future research
Plantations were found to have reduced habitat value for small mammals and
some herpetofauna relative to naturally regenerated areas. Pre-commercially thinned
stands were found to be intermediate in habitat value. In order to identify when/if pre-
commercially thinned stands provide equal habitat value to naturally regenerated
stands, the intensity of thinning should be further studied to assess potential
thresholds of tolerance for species that require deciduous components to forests.
Because all three of the forest types sampled had been clear-cut, further research to
evaluate whether the naturally regenerated stands at both stages provide equivalent
habitat for native small mammals and herpetofauna than undisturbed old growth
Acadian forests is important. Further comparisons between the end of ‘management
rotation’ in previously clear-cut, naturally regenerated, stands and old growth Acadian
forests should be performed to address whether each provides habitat features
necessary to support similar taxonomic richness and abundance of small mammals and
herpetofauna. Finding a term that best described stand ‘age’ required a compromise
between age since clear-cutting and age of establishment. This accommodation posed
significant difficulty for naturally regenerated stands in particular, because of their
variable rate of re-establishment. Future research should study differences in
biodiversity (mycology, flora, fauna) between stands that are established immediately
following clear-cutting and those that have taken longer to establish. This will provide

63
a better perspective as to whether seral stage or actual age is the more appropriate
measure of stand ‘stage’.
Adjacent site context has been identified as important when considering loss of
mature forest habitats as a result of shorter age rotation (Freedman et al., 1994;
Bowman et al., 2000; Thompson et al., 2003) because small mammals and
herpetofauna may be foraging in one stand type but breeding in another, or using
habitat beyond the sampled area. Future research might include a landscape level
approach considering both stand type and stage when considering the effects of forest
management on small mammals and herpetofauna.
I did not have confidence in my identification of live shrews, which, is a
weakness in this study. Future research should address the fact that traps designed for
the live capture and release of individuals present issues of species identification in the
genus Sorex. While euthanizing animals to identify via traditional skull pattern
methods is an option, such an approach may influence the measurement of density
dependent features of small mammal populations (e.g. abundance, age-structure,
associated species, etc.) and increasingly is considered ethically unacceptable. Genetic
approaches involving tissue sampling may be a solution.
I used several sampling techniques (i.e. pitfall traps, cover object searches,
Tomahawk trap and Sherman traps) but it was clear that there were species that were
not well-sampled by any of these techniques. For example, red squirrels may be more
common at these sites than my sampling indicated. Red squirrels were captured more
frequently in other studies even where those studies sampled similar forest types with

64
similar live traps (Etcheverry, 2005; Henderson, 2005; Homyack, 2005). Research
examining how robust my results are to alternative sampling techniques (e.g.
alternative bait type or trap placement) would be a useful complement. That said, I do
not believe that there was any bias in the trapping techniques I employed that would
result in any species being more likely to be trapped in a particular stand type or stage.
My stand characteristics measurements of coarse woody debris and canopy
cover were coarse. When coupled with low power, I cannot discount the possibility of a
type 2 error. Further studies should not only consider overall percentage of canopy
cover, but also canopy structure (composition and layers) and size of gaps, coarse
woody debris should be measured to account for volume and decay class, and small
mammal and herpetofauna trapping effort should be increased to gain further data
(especially important for taxonomic richness results).
Taxonomic richness counts were taken from all species captured in each stand
type irrespective of the abundance of that species. Although I have no reason to
believe there is a sampling bias between sites, there may be concern that rarely caught
species can disproportionately affect the results. In order to address this concern, I
compared taxonomic richness counts including rarely caught species and taxonomic
richness counts using only species with a capture rate of more than 20 individuals, and
compared both sets of figures to stand treatment and stage (Appendix table 5).
However, a comparison between the two methods of calculating taxonomic richness
suggests that total taxonomic richness is negatively affected by plantations,
irrespective of how taxonomic richness is calculated. However, the relationship

65
between small mammal taxonomic richness and treatment is less evident when
considering only species with capture rates greater than 20, whereas herpetofauna
taxonomic richness and treatment is shows greater differences. Method of calculating
taxonomic richness did change the fact that taxonomic richness was not affected by
stand stage.
Conclusions and management implications
Both abundance and taxonomic richness of small mammals, and specifically
Sorex spp., red-backed voles, and red-backed salamanders were found to be negatively
impacted by plantations and to a lesser extent pre-commercial thinning in New
Brunswick. These effects were found in both early and late stage stands. I did not find
an effect of forest management on the woodland jumping mouse, or the short-tailed
shrew.
Total abundance and deer mouse abundance were influenced by an interaction
between stand stage and treatment, being dissimilar within treatment types in stage 1
but not stage 2, suggesting that the effects of treatment may have been mitigated over
time. Herpetofauna and wood frog abundance were also influenced by an interaction
between stand treatment and stage, however, the effect of treatment is significant at
the stage 2 development stage. I suspect that forest management practices do have a
negative impact on herpetofauna but that the effects were skewed by pond-breeding
amphibians, which prefer an open canopy as it increases invertebrate food sources and
pond temperature (Skelly et al., 2002). Both wood frog and red-backed salamander
species, which are known to be more reliant on terrestrial habitat, were negatively

66
affected by forest management, most strongly by plantations. Contrary to previous
research, no relationship between herpetofauna taxonomic richness and intensive
forest management practices or stand stage was detected. However, I saw trends that
were consistent with a negative effect and my study did not have good power to detect
small and/or moderate effects.
The effects of stand management were at least partly due to changes in stand
characteristics- of particular importance were leaf litter, percentage of hardwood and
stand wetness (depth to water table at 0-10cm). Wood frogs and red-backed
salamanders were positively associated with leaf litter, canopy cover, and percentage
of hardwood all of which are lowest in plantations, followed by thinned stands. Small
mammal taxonomic richness also had a positive relationship with canopy cover and
stand density- characteristics that have been previously identified as being important
at maintaining shelter from predators as well as providing a moist microclimate integral
in providing food supply of invertebrates and fungi.
Red-backed salamanders were positively associated with stand development as
well as most abundant in naturally regenerated stands, suggesting that forest
managers should maintain older staged naturally regenerated forests in order to
conserve this species. Small mammal abundance was influenced by stand stage, being
higher in stage 1 than stage 2 stands. By contrast, small mammal taxonomic richness
was not influenced by stand stage. This difference between abundance and taxonomic
richness illustrates the importance of both measures when assessing the relative value
of intensively managed forests as habitat for small mammals.

67
The loss of canopy cover resulting in a dryer microclimate, and a reduced
deciduous component that provides leaf litter has been identified as integral for a
subset of both small mammal and herpetofauna species. Trends indicate that stage 2
successional (>10 years post thinning or planting) managed stands do not provide a
habitat similar to controls for small mammals and herpetofauna, with the exception of
pond-breeding amphibians. This suggests that although canopy cover is greater in stage
2 stands, a deciduous component to stands is more important than canopy cover or
time since disturbance. Forest managers should maintain documented habitat
associations in managed stands in an effort to provide habitat for a greater number of
species endemic to the Acadian forest ecosystem. The challenge of finding a way to
maintain a deciduous component within managed stands, while at the same time
maintaining harvest levels, is significant. This may require a landscape level approach
integrating patches of intensive forest management with patches of naturally
regenerated areas.

68
LITERATURE CITED
Abbott, H. G., & Quink, T. F. (1970). Ecology of eastern white pine seed caches made by small
forest mammals. Ecology, pp. 271-278.
Adams, J. D., & Freedman, B. (1999). Comparative catch efficiency of amphibian sampling
methods in terrestrial habitats in southern New Brunswick. Canadian Field-Naturalist,
113(3), 493-496.
Allen, A. W. (1983). Habitat suitability index models: southern red-backed vole (Western United
States). US Department of the Interior, Fish and Wildlife Service: FWS/OBS-82
Anthony, R. G., & Morrison, M. L. (1985). Influence of glyphosate herbicide on small-mammal
populations in western Oregon. Northwest Science, 59(3), 159-168.
Atkeson, T. D., & Johnson, A. S. (1979). Succession of small mammals on pine plantations in the
Georgia Piedmont. American Midland Naturalist, 10(2), 385-392.
Aubry, K. B. (2000). Amphibians in managed, second-growth Douglas-fir forests. The Journal of
Wildlife Management, 1041-1052. doi: 10.2307/3803215
Baldwin, R. F., Calhoun, A. J., & DeMaynadier, P. G. (2006). Conservation planning for
amphibian species with complex habitat requirements: a case study using movements
and habitat selection of the wood frog Rana sylvatica. Journal of Herpetology, 40(4), 442-
453. doi: 10.1670/0022-1511(2006)40[442:CPFASW]2.0.CO;2
Banfield, A. W. (1974). The mammals of Canada. University of Toronto Press, Ontario, Canada,
438pp.
Beauvais, Gary P., and Steven W. Buskirk (1999). Modifying estimates of sampling effort to

69
account for sprung traps. Wildlife Society Bulletin, pp. 39-43.
Bellocq, M. I., Bendell, J. F., & Innes, D. G. (1994). Diet of Sorex cinereus, the masked shrew, in
relation to the abundance of Lepidoptera larvae in northern Ontario. American Midland
Naturalist, 132(1), 68-73.
Bellocq, M. I., & Smith, S. M. (2003). Population dynamics and foraging of Sorex cinereus
(masked shrew) in the boreal forest of eastern Canada. Annales Zoologici Fennici.
Finnish Zoological and Botanical Publishing Board, 2003, pp. 27-34.
Bennett, S. H., Gibbons, J. W., & Glanville, J. (1980). Terrestrial activity, abundance and diversity
of amphibians in differently managed forest types. American Midland Naturalist, 103,
412-416.
Betts, M. G., Diamond, A. W., Forbes, G. J., Frego, K., Loo, J. A., Matson, B., Roberts, M.R.,
Villard, M., Wissink, R. & Wuest, L. (2005). Plantations and biodiversity: a comment on
the debate in New Brunswick. The Forestry Chronicle, 81(2), 265-269. doi:
10.5558/tfc81265-2
Bliss, C., & Comerford, N. (2002). Forest harvesting influence on water table dynamics in a
Florida flatwoods landscape. Soil Science Society of America Journal, 66(4), 1344-1349.
doi: 10.2136/sssaj2002.1344
Blomquist, S. M., & Hunter Jr, M. L. (2010). A multi-scale assessment of amphibian habitat
selection: wood frog response to timber harvesting. Ecoscience, 17(3), 251-264. doi:
10.2980/17-3-3316
Bonin, J. (1991). Effect of forest age on woodland amphibians and the habitat and status of
stream salamanders in southwestern Quebec. MSc thesis, McGill University, Montreal,
Canada. 85 pp.

70
Bormann, F. H., Likens, G. E., Fisher, D., & Pierce, R. (1968). Nutrient loss accelerated by clear-
cutting of a forest ecosystem. Science, 159, 882-884. doi: 10.1126/science.159.3817.882
Boudreault, C., Bergeron, Y., Gauthier, S., & Drapeau, P. (2002). Bryophyte and lichen
communities in mature to old-growth stands in eastern boreal forests of Canada.
Canadian Journal of Forest Research, 32(6), 1080-1093. doi: 10.1139/x02-027
Bowman, J.(1999). The spatial structure of small-mammal populations in a managed forest.
Ph.D. dissertation, University of New Brunswick, Fredericton, Canada.
Bowman, J., Forbes, G., & Dilworth, T. (2001). Landscape context and small-mammal
abundance in a managed forest. Forest Ecology and Management, 140(2), 249-255. doi:
10.1016/S0378-1127(00)00315-7
Bowman, J. C., Sleep, D., Forbes, G. J., & Edwards, M. (2000). The association of small mammals
with coarse woody debris at log and stand scales. Forest Ecology and Management,
129(1), 119-124. doi: 10.1016/S0378-1127(99)00152-8
Brooks, R. T. (1999). Residual effects of thinning and high white-tailed deer densities on
northern red-backed salamanders in southern New England oak forests. The Journal of
Wildlife Management, 63, 1172-1180.
Brooks, R. T., & Doyle, K. L. (2001). Shrew taxonomic richness and abundance in relation to
vernal pond habitat in southern New England. Northeastern Naturalist, 8(2), 137-148.
doi: 10.1656/1092-6194(2001)008[0137:SSRAAI]2.0.CO;2
Bury, R. B., & P. S. Corn. Responses of Aquatic and Streamside Amphibians to Timber Harvest: A
Review. In: Streamside Management: Riparian Wildlife and Forestry Interactions. Ed.
Seattle: College of Forest Resources, U of Washington, 1988. Contribution 59, pp. 165-
66.

71
Carey, A. B. (1998). Ecological foundations of biodiversity: lessons from natural and managed
forests of the Pacific Northwest. Northwest Science 72(2), 127-133.
Carey, A. B., & Johnson, M. L. (1995). Small mammals in managed, naturally young, and old-
growth forests. Ecological Applications, 5(2), 336-352. doi: 10.2307/1942026
Carey, A. B., & Harrington, C. A. (2001). Small mammals in young forests: implications for
management for sustainability. Forest Ecology and Management, 154(1), 289-309. doi:
10.1016/S0378-1127(00)00638-1
Carey, A. B., & Wilson, S. M. (2001). Induced spatial heterogeneity in forest canopies: responses
of small mammals. The Journal of Wildlife Management,65, 1014-1027.
Churchfield, S. (1990). The natural history of shrews. Ithaca, New York: Cornell University Press.
Clay, D., & Brownlie, J. (1997). Part II. Chapter I. Status of amphibians and reptiles of Fundy
National Park and its greater ecosystem; in Resources of Fundy National Park: A primer of
ecosystem studies. Parks Canada Ecosystem Science Review Report No. 2, 39pp.
Cole, E. C., McComb, W. C., Newton, M., Chambers, C. L., & Leeming, J. (1998). Response of
amphibians to clearcutting, burning, and glyphosate application in the Oregon Coast
Range. The Journal of Wildlife Management, 61, 656-664.
Cole, H., Newmaster, S., Lanteigne, L., & Pitt, D. (2008). Long-term outcome of precommercial
thinning on floristic diversity in north western New Brunswick, Canada. iForest-
Biogeosciences and Forestry, 1(5), 145-156. doi: 10.3832/ifor0470-0010145
Conservation Council of New Brunswick. (2015). Forest Conservation.
http://www.conservationcouncil.ca
2015 May 22.

72
Craig, V. J. (1995). Relationships between shrews (Sorex spp.) and downed wood in the
Vancouver watersheds, BC. Doctoral dissertation, University of British Columbia. 88pp.
D'Anieri, P., Leslie Jr, D., & McCormack Jr, M. (1987). Small mammals in glyphosate-treated
clearcuts in northern Maine. Canadian Field-Naturalist. 101(4),547-550.
Davis, J. C., Castleberry, S. B., & Kilgo, J. C. (2010). Influence of coarse woody debris on the
soricid community in southeastern Coastal Plain pine stands. Journal of Mammalogy,
91(4), 993-999. doi: 10.1644/09-MAMM-A-170.1
De Jong, C. V. Z. (1983). Handbook of Canadian mammals: marsupials and insectivores (Vol. 1):
Ed. Ottawa. Canadian Museum of Nature. 210 pp.
DeGraaf, R. M., & Healy, W. M. (1992). New England wildlife: management of forested habitats.
Ed Radnar. U.S. Dept. of Agriculture, Forest Service, Northeastern Forest Experiment
Station. 271pp.
Degraaf, R. M., & Rudis, D. D. (1990). Herpetofauna species composition and relative
abundance among three New England forest types. Forest Ecology and Management,
32(2), 155-165. doi: 10.1016/0378-1127(90)90167-A
DeGraaf, R. M., & Yamasaki, M. (2001). New England wildlife: habitat, natural history, and
distribution: University Press of New England. 482 pp.
DeMaynadier, P. G., & Hunter Jr, M. L. (1995). The relationship between forest management
and amphibian ecology: a review of the North American literature. Environmental
Reviews, 3(3-4), 230-261. doi: 10.1139/a95-012
DeMaynadier, P. G., & Hunter Jr, M. L. (1999). Forest canopy closure and juvenile emigration by
pool-breeding amphibians in Maine. The Journal of Wildlife Management, 63, 441-450.

73
DeMaynadier, P. G., & Hunter, M. L. (1998). Effects of Silvicultural Edges on the Distribution
and Abundance of Amphibians in Maine. Conservation Biology, 12(2), 340-352. doi:
10.1111/j.1523-1739.1998.96412.x
DeMaynadier, P., Houlahan, J., Calhoun, A,(2007). Chapter 13: Conserving vernal pool
amphibians in managed forests. Science and Conservation of Vernal Pools in
Northeastern North America, 253-280.
Dieterich, M., Woodcock, T., Adams, K., & Mihuc, T. (2006). Indirect effects of forest
management on riparian zone characteristics in the Adirondack uplands of New York.
Northern Journal of Applied Forestry, 23(4), 273-279.
Dracup, E.C., Keppiea, D.M., Forbes, G.J. (2015). Woodland mouse and vole response to
increased structural diversity following midrotation commercial thinning in spruce
plantations. Canadian Journal of Forest Research. 45(8), 1121-1131.
Duffy, D. C., & Meier, A. J. (1992). Do Appalachian Herbaceous Understories Ever Recover from
Clearcutting? Conservation Biology, 6(2), 196-201. doi: 10.1046/j.1523-
1739.1992.620196.x
Duguay, J. P., & Wood, P. B. (2002). Salamander abundance in regenerating forest stands on
the Monongahela National Forest, West Virginia. Forest Science, 48(2), 331-335.
Dupuis, L. A., Smith, J. N. M., & Bunnell, F. (1995). Relation of Terrestrial-Breeding Amphibian
Abundance to Tree-Stand Age. Conservation Biology, 9(3), 645-653. doi: 10.1046/j.1523-
1739.1995.09030645.x
Ecke, F., Löfgren, O., & Sörlin, D. (2002). Population dynamics of small mammals in relation to
forest age and structural habitat factors in northern Sweden. Journal of Applied Ecology,
39(5), 781-792. doi: 10.1046/j.1365-2664.2002.00759.x
74
Edge, C. B., Gahl, M. K., Pauli, B. D., Thompson, D. G., & Houlahan, J. E. (2011). Exposure of
juvenile green frogs (Lithobates clamitans) in littoral enclosures to a glyphosate-based
herbicide. Ecotoxicology and Environmental Safety, 74(5), 1363-1369. doi:
10.1016/j.ecoenv.2011.04.020
Etcheverry, P., Ouellet, J.-P., & Crête, M. (2005). Response of small mammals to clear-cutting
and precommercial thinning in mixed forests of southeastern Quebec. Canadian Journal
of Forest Research, 35(12), 2813-2822. doi: 10.1139/x05-208
Fenton, N. J., Frego, K. A., & Sims, M. R. (2003). Changes in forest floor bryophyte (moss and
liverwort) communities 4 years after forest harvest. Canadian Journal of Botany, 81(7),
714-731. doi: 10.1139/b03-063
Fleet, R., & Autrey, B. (1999). Herpetofauna assemblages of four forest types from the Caddo
Lake area of northeastern Texas. Texas Journal of Science, 51(4), 297-308.
Freedman, B., Morash, R., & MacKinnon, D. (1993). Short-term changes in vegetation after the
silvicultural spraying of glyphosate herbicide onto regenerating clearcuts in Nova Scotia,
Canada. Canadian Journal of Forest Research, 23(10), 2300-2311. doi: 10.1139/x93-284
Freedman, B., Woodley, S., & Loo, J. (1994). Forestry practices and biodiversity, with particular
reference to the Maritime Provinces of eastern Canada. Environmental Reviews, 2(1), 33-
77. doi: 10.1139/a94-003
Freedman, B., Zelazny, V., Beaudette, D., Fleming, T., Johnson, G., Flemming, S., Gerrow, S.,
Forbes, G.J., & Woodley, S. (1996). Biodiversity implications of changes in the quantity of
dead organic matter in managed forests. Environmental Reviews, 4(3), 238-265. doi:
10.1139/a96-013

75
Forbes, G.J., McAlpine, D.F.., Scott, F.W. (2010).Chapter 31: Mammals of the Atlantic Maritime
Ecozone in McAlpine, D. F., & Smith, I. M. (2010). Assessment of species diversity in the
Atlantic Maritime Ecozone. Ottawa, NRC Research Press, pp. 693-718.
Fuller, A. K., Harrison, D. J., & Lachowski, H. J. (2004). Stand scale effects of partial harvesting
and clearcutting on small mammals and forest structure. Forest Ecology and
Management, 191(1), 373-386. doi: 10.1016/j.foreco.2004.01.014
Fuller, T. K., & DeStefano, S. (2003). Relative importance of early-successional forests and
shrubland habitats to mammals in the northeastern United States. Forest Ecology and
Management, 185(1), 75-79. doi: 10.1016/S0378-1127(03)00247-0
Gagné, N., Bélanger, L., & Huot, J. (1999). Comparative responses of small mammals,
vegetation, and food sources to natural regeneration and conifer release treatments in
boreal balsam fir stands of Quebec. Canadian Journal of Forest Research, 29(7), 1128-
1140. doi: 10.1139/x99-095
Gertzog, B. J., Kaplan, L. J., Nichols, D., Smith, G. R., & Rettig, J. E. (2011). Avoidance of three
herbicide formulations by eastern red-backed salamanders (Plethodon cinereus).
Herpetological Conservation and Biology, 6(2), 237-241.
Getz, L. L. (1961). Factors influencing the local distribution of shrews. American Midland
Naturalist, 65,67-88.
Gibbs, J. P. (1998). Distribution of woodland amphibians along a forest fragmentation gradient.
Landscape Ecology, 13(4), 263-268.
Glennon, M. J., & Porter, W. F. (2007). Impacts of land-use management on small mammals in
the Adirondack Park, New York. Northeastern Naturalist, 14(3), 323-342. doi:
10.1656/1092-6194(2007)14[323:IOLMOS]2.0.CO;2

76
Government of New Brunswick, Department of Natural Resources (2005). Objectives and
Standards for the New Brunswick Crown Forest for the 2007-2012 period. 40 pp.
Government of Canada (2015), Environment Canada. Cole’s Island Climate Normals.
http://climate.weather.gc.ca/climate_normals/results_1981_2010
Government of New Brunswick. (2015).Chapter 12: Eastern Lowlands Ecoregion. In Our
Landscape Heritage. Fredericton, New Brunswick. Department of Natural Resources,
Province of New Brunswick. p. 269-311.
Grialou, J. A., West, S. D., & Wilkins, R. N. (2000). The effects of forest clearcut harvesting and
thinning on terrestrial salamanders. The Journal of Wildlife Management, 64, 105-113.
doi: 10.2307/3802979
Guerry, A. D., & Hunter, M. L. (2002). Amphibian Distributions in a landscape of forests and
agriculture: an examination of landscape composition and configuration. Conservation
Biology, 16(3), 745-754. doi: 10.1046/j.1523-1739.2002.00557.x
Halpern, C. B., & Spies, T. A. (1995). Plant species diversity in natural and managed forests of
the Pacific Northwest. Ecological Applications, 5(4), 913-934. doi: 10.2307/2269343
Hanley, T. A., Smith, W. P., & Gende, S. M. (2005). Maintaining wildlife habitat in southeastern
Alaska: implications of new knowledge for forest management and research. Landscape
and Urban Planning, 72(1), 113-133. doi: 10.1016/j.landurbplan.2004.09.016
Hanlin, H. G., Martin, F. D., Wike, L. D., & Bennett, S. H. (2000). Terrestrial activity, abundance
and taxonomic richness of amphibians in managed forests in South Carolina. The
American Midland Naturalist, 143(1), 70-83. doi: 10.1674/0003-
0031(2000)143[0070:TAAASR]2.0.CO;2

77
Hansen, A. J., Spies, T. A., Swanson, F. J., & Ohmann, J. L. (1991). Conserving biodiversity in
managed forests. BioScience, 41 (6), 382-392.
Harmon, M. E., Bratton, S. P., & White, P. S. (1984). Disturbance and vegetation response in
relation to environmental gradients in the Great Smoky Mountains. Vegetation, 55(3),
129-139. doi: 10.1007/BF00045013
Harmon, Mark E., Jerry F. Franklin, Fred J. Swanson, Phil Sollins, S. V. Gregory, J. D. Lattin, N. H.
Anderson et al. (1986). Ecology of coarse woody debris in temperate ecosystems.
Advances in Ecological Research, 5, 133-302.
Harpole, D. N., & Haas, C. A. (1999). Effects of seven silvicultural treatments on terrestrial
salamanders. Forest Ecology and Management, 114(2), 349-356. doi: 10.1016/S0378-
1127(98)00365-X
Hartley, M. J. (2002). Rationale and methods for conserving biodiversity in plantation forests.
Forest Ecology and Management, 155(1), 81-95. doi: 10.1016/S0378-1127(01)00549-7
Hartling, L., & Silva, M. (2004). Abundance and taxonomic richness of shrews within forested
habitats on Prince Edward Island. The American Midland Naturalist, 151(2), 399-407. doi:
10.1674/0003-0031(2004)151[0399:AASROS]2.0.CO;2
Haskell, D. G. (2000). Effects of forest roads on macroinvertebrate soil fauna of the southern
Appalachian mountains. Conservation Biology, 14(1), 57-63. doi: 10.1046/j.1523-
1739.2000.99232.x
Hayes, J. P., Chan, S. S., Emmingham, W. H., Tappeiner, J. C., Kellogg, L. D., & Bailey, J. D. (1997).
Wildlife response to thinning young forests in the Pacific Northwest. Journal of Forestry.
95, 28–33.

78
Heatwole, H. (1961). Habitat selection and activity of the wood frog, Rana sylvatica Le Conte.
American Midland Naturalist, 66, 301-313.
Henderson, J.A. (2011). Long-term effects of pre-commercial thinning on abundance of small
mammals in naturally regenerated black spruce forest stands in New Brunswick. MSC
thesis. University of New Brunswick, Fredericton, New Brunswick. 62 pp.
Herbeck, L. A., & Larsen, D. R. (1999). Plethodontid salamander response to silvicultural
practices in Missouri Ozark forests. Conservation Biology, 13(3), 623-632. doi:
10.1046/j.1523-1739.1999.98097.x
Hicks, N. G., & Pearson, S. M. (2003). Salamander diversity and abundance in forests with
alternative land use histories in the Southern Blue Ridge Mountains. Forest Ecology and
Management, 177(1), 117-130. doi: 10.1016/S0378-1127(02)00319-5
Hill, M. O. (1979) The development of a flora in even-aged plantations. In: Ford, E.D., Malcolm,
D.C., Atterson, J. The Ecology of Even-Aged Forest Plantations. Institute of Terrestrial
Ecology, Cambridge. pp. 175-192.
Homyack, J. A., & Haas, C. A. (2009). Long-term effects of experimental forest harvesting on
abundance and reproductive demography of terrestrial salamanders. Biological
Conservation, 142(1), 110-121. doi: 10.1016/j.biocon.2008.10.003
Homyack, J. A., & Haas, C. A. (2013). Effects of repeated-stand entries on terrestrial
salamanders and their habitat. Southeastern Naturalist, 12(2), 353-366.
Homyack, J. A., Harrison, D. J., & Krohn, W. B. (2005). Long-term effects of precommercial
thinning on small mammals in northern Maine. Forest Ecology and Management, 205(1),
43-57. doi: doi:10.1016/j.foreco.2004.10.005

79
Homyack, J. A., Harrison, D. J., & Krohn, W. B. (2004). Structural differences between
precommercially thinned and unthinned conifer stands. Forest Ecology and
Management, 194(1), 131-143. doi: 10.1016/j.foreco.2003.12.021
Innes, D. G., Bendell, J. F., Naylor, B. J., & Smith, B. A. (1990). High densities of the masked
shrew, Sorex cinereus, in jack pine plantations in northern Ontario. American Midland
Naturalist, 330-341.
J.D. Irving Ltd. (2007). 2007 Crown Land 25-Year Forest Management Plan for the Queens-
Charlotte / Fundy License. 65 pp.
Johnson, G. A., & Freedman, B. (2003). Breeding birds in forestry plantations and natural forest
in the vicinity of Fundy National Park, New Brunswick. Canadian Field-Naturalist, 116(3),
475-487.
Kaminski, J. A., Davis, M. L., Kelly, M., & Keyser, P. D. (2007). Disturbance effects on small
mammal species in a managed Appalachian forest. The American Midland Naturalist,
157(2), 385-397. doi: 10.1674/0003-0031(2007)157[385:DEOSMS]2.0.CO;2
Karraker, N., & Welsh, H. (2006). Long-term impacts of even-aged timber management on
abundance and body condition of terrestrial amphibians in Northwestern California.
Biological Conservation, 131(1), 132-140. doi: 10.1016/j.biocon.2006.02.013
Keinath, D. A., & Hayward, G. D. (2003). Red-backed vole (Clethrionomys gapperi) response to
disturbance in subalpine forests: use of regenerating patches. Journal of Mammalogy,
84(3), 956-966. doi: 10.1644/LBa-065
Kirkland, G. (1990). Patterns of initial small mammal community change after clearcutting of
temperate North American forests. Oikos, 59(3), 313-320. doi: 10.2307/3545141

80
Klenner, W., & Sullivan, T. P. (2003). Partial and clear-cut harvesting of high-elevation spruce fir
forests: implications for small mammal communities. Canadian Journal of Forest
Research, 33(12), 2283-2296. doi: 10.1139/x03-142
Knapp, S. M., Haas, C. A., Harpole, D. N., & Kirkpatrick, R. L. (2003). Initial effects of clearcutting
and alternative silvicultural practices on terrestrial salamander abundance. Conservation
Biology, 17(3), 752-762. doi: 10.1046/j.1523-1739.2003.02061.x
Langley Jr, A. K., & Shure, D. J. (1980). The effects of loblolly pine plantations on small mammal
populations. American Midland Naturalist, 103,59-65.
Lautenschlager, R. A., Bell, F. W., & Wagner, R. G. (1997). Alternative conifer release treatments
affect small mammals in northwestern Ontario. The Forestry Chronicle, 73(1), 99-106.
doi: 10.5558/tfc73099-1
Lesica, P., McCune, B., Cooper, S. V., & Hong, W. S. (1991). Differences in lichen and bryophyte
communities between old-growth and managed second-growth forests in the Swan
Valley, Montana. Canadian Journal of Botany, 69(8), 1745-1755. doi: 10.1139/b91-222
Lindenmayer, D., Hobbs, R., & Salt, D. (2003). Plantation forests and biodiversity conservation.
Australian Forestry, 66(1), 62-66. doi: 10.1080/00049158.2003.10674891
Loehle, C., Wigley, T. B., Shipman, P. A., Fox, S. F., Rutzmoser, S., Thill, R. E., & Melchiors, M. A.
(2005). Herpetofauna taxonomic richness responses to forest landscape structure in
Arkansas. Forest Ecology and Management, 209(3), 293-308. doi:
10.1016/j.foreco.2005.02.007
Loo, J., Cwynar, L., Freedman, B., Ives, N. Chapter 3: Changing forest landscapes in the Atlantic
Maritime Ecozone in McAlpine, D. F., & Smith, I. M. (2010). Assessment of species
diversity in the Atlantic Maritime Ecozone. Ottawa, NRC Research Press, pp. 35-42.

81
Loo, J., & Ives, N. (2003). The Acadian forest: historical condition and human impacts. The
Forestry Chronicle, 79(3), 462-474.
MacCracken, J. G. (2005). Effects of uneven-aged timber harvest on forest floor vertebrates in
the Cascade Mountains of southern Washington. Forest Ecology and Management,
208(1), 123-135. doi: 10.1016/j.foreco.2004.11.020
Martin, K. J., & McComb, B. C. (2003). Amphibian habitat associations at patch and landscape
scales in the central Oregon Coast Range. The Journal of Wildlife Management, 672-683.
Matlack, G. R. (1994). Plant species migration in a mixed-history forest landscape in eastern
North America. Ecology, 75(5), 1491-1502.
McAlpine, D.F. (2010). Chapter 29: Amphibians and reptiles of the Atlantic Maritime Ecozone.
In McAlpine, D. F., & Smith, I. M. (2010). Assessment of species diversity in the Atlantic
Maritime Ecozone. Ottawa, NRC Research Press, pp. 613-632.
McCarthy, B. C., & Bailey, R. R. (1994). Distribution and abundance of coarse woody debris in a
managed forest landscape of the central Appalachians. Canadian Journal of Forest
Research, 24(7), 1317-1329. doi: 10.1139/x94-172
McCay, T. S., & Komoroski, M. J. (2004). Demographic responses of shrews to removal of coarse
woody debris in a managed pine forest. Forest Ecology and Management, 189(1), 387-
395. doi: 10.1016/j.foreco.2003.09.005
McComb, W. C., Spies, T. A., & Emmingham, W. H. (1993). Douglas-fir forests: managing for
timber and mature-forest habitat. Journal of Forestry, 91(12), 31-42.

82
McLaren, M. A., Thompson, I. D., & Baker, J. A. (1998). Selection of vertebrate wildlife
indicators for monitoring sustainable forest management in Ontario. The Forestry
Chronicle, 74(2), 241-248. doi: 10.5558/tfc74241-2
McMullin, R. T., Duinker, P. N., Richardson, D. H., Cameron, R. P., Hamilton, D. C., &
Newmaster, S. G. (2010). Relationships between the structural complexity and lichen
community in coniferous forests of southwestern Nova Scotia. Forest Ecology and
Management, 260(5), 744-749. doi: 10.1016/j.foreco.2010.05.032
Means, D. B., Palis, J. G., & Baggett, M. (1996). Effects of slash pine silviculture on a Florida
population of flatwoods salamander. Conservation Biology, 10(2), 426-437. doi:
10.1046/j.1523-1739.1996.10020426.x
Mengak, M. T., & Guynn, D. C. (2003). Small mammal microhabitat use on young loblolly pine
regeneration areas. Forest Ecology and Management, 173(1), 309-317. doi:
10.1016/S0378-1127(02)00008-7
Merritt, J. F. (1986). Winter survival adaptations of the short-tailed shrew (Blarina brevicauda)
in an Appalachian montane forest. Journal of Mammalogy, 67(3), 450-464. doi:
10.2307/1381276
Messere, M., & Ducey, P. K. (1998). Forest floor distribution of northern redback salamanders,
Plethodon cinereus, in relation to canopy gaps: first year following selective logging.
Forest Ecology and Management, 107(1), 319-324. doi: 10.1016/S0378-1127(97)00348-4
Miller, D. H., & Getz, L. L. (1977). Factors influencing local distribution and species diversity of
forest small mammals in New England. Canadian Journal of Zoology, 55(5), 806-814. doi:
10.1139/z77-105

83
Minnesota Department of Natural Resources. How to use a clinometer.,
http://files.dnr.state.mn.us/education_safety/education/plt/activity_sheets/
howToUseAClinometer.pdf
2015, August 18
Mitchell, J. C., Rinehart, S. C., Pagels, J. F., Buhlmann, K. A., & Pague, C. A. (1997). Factors
influencing amphibian and small mammal assemblages in central Appalachian forests.
Forest Ecology and Management, 96(1), 65-76. doi: 10.1016/S0378-1127(97)00043-1
Mitchell, K. (2010). Quantitative analysis by the point-centered quarter method. arXiv preprint
arXiv:1010.3303. 56 pp.
Mitchell, M. S., Karriker, K. S., Jones, E. J., & Lancia, R. A. (1995). Small mammal communities
associated with pine plantation management of pocosins. The Journal of Wildlife
Management, 49(4) 875-881.
Morneault, A. E., Naylor, B. J., Schaeffer, L. S., & Othmer, D. C. (2004). The effect of
shelterwood harvesting and site preparation on eastern red-backed salamanders in
white pine stands. Forest Ecology and Management, 199(1), 1-10.
Mosseler, A., Lynds, J. A., & Major, J. E. (2003). Old-growth forests of the Acadian Forest
Region. Environmental Reviews, 11(1), S47-S77. doi: 10.1139/a03-015
Nature NB (2014). Our forests-Nos Forêts: Special edition/édition speciale. New Brunswick
Naturalist, 44(1),1-72.
Naylor, B. J., and J. F. Bendell. 1983. Influence of habitat diversity on the abundance and
diversity of small mammals in jack pine forests in Ontario. In Resources and dynamics of
the boreal zone. International symposium on the dynamics of boreal ecosystems (R. W.

84
Wein, R. R. Riewe, and I. R. Methven, eds.). Association of Canadian Universities for
Northern Studies, Ottawa, Ontario, Canada. pp. 295–307.
Oliver, C. and Larson, B. 1996. Forest Stand Dynamics. New York, NY. McGraw-Hill. P. 149.
Palacios, C., Agüero, B., & Simonetti, J. (2013). Agroforestry systems as habitat for
herpetofauna: is there supporting evidence? Agroforestry Systems, 87(3), 517-523. doi:
10.1007/s10457-012-9571-z
Palik, B., Batzer, D. P., Buech, R., Nichols, D., Cease, K., Egeland, L., & Streblow, D. E. (2001).
Seasonal pond characteristics across a chronosequence of adjacent forest ages in
northern Minnesota, USA. Wetlands, 21(4), 532-542. doi: 10.1672/0277-
5212(2001)021[0532:SPCAAC]2.0.CO;2
Parker, G. (1989). Effects of reforestation upon small mammal communities in New Brunswick.
Canadian field-naturalist. Ottawa ON, 103(4), 509-519.
Parks Canada. (2009). The Acadian Forest Region: Home of the Sugar Maple.
http://www.pc.gc.ca/eng/pn-np/ns/cbreton/natcul/natcul1/b/i.aspx
2015, May 22.
Patrick, D. A., Hunter, M. L., & Calhoun, A. J. (2006). Effects of experimental forestry treatments
on a Maine amphibian community. Forest Ecology and Management, 234(1), 323-332.
doi: 10.1016/j.foreco.2006.07.015
Pearce, J., & Venier, L. (2005). Small mammals as bioindicators of sustainable boreal forest
management. Forest Ecology and Management, 208(1), 153-175. doi:
10.1016/j.foreco.2004.11.024

85
Petranka, J. W. (1994). Response to impact of timber harvesting on salamanders. Conservation
Biology, 8(1), 302-304.
Petranka, J. W., Brannon, M. P., Hopey, M. E., & Smith, C. K. (1994). Effects of timber harvesting
on low elevation populations of southern Appalachian salamanders. Forest Ecology and
Management, 67(1), 135-147. doi: 10.1016/0378-1127(94)90012-4
Petranka, J. W., Eldridge, M. E., & Haley, K. E. (1993). Effects of Timber Harvesting on Southern
Appalachian Salamanders. Conservation Biology, 7(2), 363-370. doi: 10.1046/j.1523-
1739.1993.07020363.x
Popescu, V. D., Patrick, D. A., Hunter, M. L., & Calhoun, A. J. (2012). The role of forest
harvesting and subsequent vegetative regrowth in determining patterns of amphibian
habitat use. Forest Ecology and Management, 270, 163-174. doi:
10.1016/j.foreco.2012.01.027
Pough, F. H., Smith, E. M., Rhodes, D. H., & Collazo, A. (1987). The abundance of salamanders in
forest stands with different histories of disturbance. Forest Ecology and Management,
20(1), 1-9. doi: 10.1016/0378-1127(87)90146-0
Prezio, J. R., Lankester, M. W., Lautenschlager, R. A., & Bell, F. W. (1999). Effects of alternative
conifer release treatments on terrestrial gastropods in regenerating spruce plantations.
Canadian Journal of Forest Research, 29(7), 1141-1148. doi: 10.1139/x99-085
Ramírez, P. A., & Simonetti, J. A. (2011). Conservation opportunities in commercial plantations:
The case of mammals. Journal for Nature Conservation, 19(6), 351-355. doi:
10.1016/j.jnc.2011.06.003

86
Ramovs, B., & Roberts, M. (2003). Understory vegetation and environment responses to tillage,
forest harvesting, and conifer plantation development. Ecological Applications, 13(6),
1682-1700. doi: 10.1890/02-5237
Ramovs, B. V., & Roberts, M. R. (2005). Response of plant functional groups within plantations
and naturally regenerated forests in southern New Brunswick, Canada. Canadian Journal
of Forest Research, 35(6), 1261-1276. doi: 10.1139/x05-049
Ransome, D. B., & Sullivan, T. P. (2002). Short-term population dynamics of Glaucomys sabrinus
and Tamiasciurus douglasii in commercially thinned and unthinned stands of coastal
coniferous forest. Canadian Journal of Forest Research, 32(11), 2043-2050. doi:
10.1139/x02-126
Renaldo, K., Murch, C., Riley, J.-N., Helleman, B., Smith, G., & Rettig, J. (2011). Substrate
preference of eastern red-backed salamanders, Plethodon cinereus: A comparison of
deciduous and coniferous substrates. Amphibia-Reptilia, 32(2), 266-269. doi:
doi:10.1163/017353710X550913
Roberts, M. R., & Zhu, L. (2002). Early response of the herbaceous layer to harvesting in a
mixed coniferous–deciduous forest in New Brunswick, Canada. Forest Ecology and
Management, 155(1), 17-31. doi: 10.1016/S0378-1127(01)00544-8
Ross-Davis, A. L., & Frego, K. A. (2002). Comparison of plantations and naturally regenerated
clearcuts in the Acadian Forest: forest floor bryophyte community and habitat features.
Canadian Journal of Botany, 80(1), 21-33. doi: 10.1139/b01-129
Runciman, J. B., & Sullivan, T. P. (1996). Influence of alternative conifer release treatments on
habitat structure and small mammal populations in south central British Columbia.
Canadian Journal of Forest Research, 26(11), 2023-2034. doi: 10.1139/x26-228

87
Ryan, T. J., Philippi, T., Leiden, Y. A., Dorcas, M. E., Wigley, T. B., & Gibbons, J. W. (2002).
Monitoring herpetofauna in a managed forest landscape: effects of habitat types and
census techniques. Forest Ecology and Management, 167(1), 83-90. doi: 10.1016/S0378-
1127(01)00692-2
Schneider, G. (2012). Acadian Forests of Prince Edward Island. Macphail Woods:
http://macphailwoods.org/forestry/the-acadian-forest/
2012, June 10.
Selva, S. B. (1994). Lichen diversity and stand continuity in the northern hardwoods and spruce-
fir forests of northern New England and western New Brunswick. Bryologist, 97 (4), 424-
429.
Semlitsch, R. D., Todd, B. D., Blomquist, S. M., Calhoun, A. J., Gibbons, J. W., Gibbs, J. P., Graeter
, G.J., Harper, E.B., Hocking, D.J., Hunter, M. L., Patrick, D.A., Rittenhouse, T.A.G.,
Rothermel, B.B. (2009). Effects of timber harvest on amphibian populations:
understanding mechanisms from forest experiments. BioScience, 59(10), 853-862. doi:
10.1525/bio.2009.59.10.7
Silva, M., Cameron, J., & Puddister, C. (2000). Small mammal abundance and community
composition in Prince Edward Island National Park. Canadian Field-Naturalist, 114(1), 26-
33.
Skelly, D., Freidenburg, L., & Kiesecker, J. (2002). Forest canopy and the performance of larval
amphibians. Ecology, 83(4), 983-992. doi: 10.1890/0012-
9658(2002)083[0983:FCATPO]2.0.CO;2

88
Skelly, D. K., Bolden, S. R., & Freidenburg, L. K. (2014). Experimental canopy removal enhances
diversity of vernal pond amphibians. Ecological Applications, 24(2), 340-345. doi:
10.1890/13-1042.1
Skelly, D. K., Werner, E. E., & Cortwright, S. A. (1999). Long-term distributional dynamics of a
Michigan amphibian assemblage. Ecology, 80(7), 2326-2337. doi: 10.1890/0012-
9658(1999)080[2326:LTDDOA]2.0.CO;2
St-Laurent, M.-H., Ferron, J., Hins, C., & Gagnon, R. (2007). Effects of stand structure and
landscape characteristics on habitat use by birds and small mammals in managed boreal
forest of eastern Canada. Canadian Journal of Forest Research, 37(8), 1298-1309. doi:
10.1139/X06-295
Sullivan, T. P., Lautenschlager, R. A., & Wagner, R. G. (1999). Clearcutting and burning of
northern spruce-fir forests: implications for small mammal communities. Journal of
Applied Ecology, 36(3), 327-344. doi: 10.1046/j.1365-2664.1999.00408.x
Sullivan, T. P., & Sullivan, D. S. (2003). Vegetation management and ecosystem disturbance:
impact of glyphosate herbicide on plant and animal diversity in terrestrial systems.
Environmental Reviews, 11(1), 37-59. doi: 10.1139/a03-005
Sullivan, T. P., Sullivan, D. S., Lautenschlager, R., & Wagner, R. G. (1997). Long-term influence of
glyphosate herbicide on demography and diversity of small mammal communities in
coastal coniferous forest, Northwest Science, 71(1), 6-17.
Sullivan, T. P., Sullivan, D. S., & Lindgren, P. M. (2000). Small mammals and stand structure in
young pine, seed-tree, and old-growth forest, southwest Canada. Ecological Applications,
10(5), 1367-1383. doi: 10.1890/1051-0761(2000)010[1367:SMASSI]2.0.CO;2

89
Sullivan, T. P., Sullivan, D. S., & Lindgren, P. M. (2001). Stand structure and small mammals in
young lodgepole pine forest: 10-year results after thinning. Ecological Applications, 11(4),
1151-1173.
Sullivan, T. P., Sullivan, D. S., Lindgren, P. M., & Boateng, J. O. (2002). Influence of conventional
and chemical thinning on stand structure and diversity of plant and mammal
communities in young lodgepole pine forest. Forest Ecology and Management, 170(1),
173-187. doi: 10.1016/S0378-1127(01)00775-7
Sullivan, T. P., Sullivan, D. S., Lindgren, P. M., & Ransome, D. B. (2005). Long-term responses of
ecosystem components to stand thinning in young lodgepole pine forest: II. Diversity and
population dynamics of forest floor small mammals. Forest Ecology and Management,
205(1), 1-14. doi: 10.1016/j.foreco.2004.10.001
Sullivan, T. P., Sullivan, D. S., Lindgren, P. M., & Ransome, D. B. (2009). Stand structure and the
abundance and diversity of plants and small mammals in natural and intensively
managed forests. Forest Ecology and Management, 258, 127-141.
Sullivan, T. P., Wagner, R. G., Pitt, D. G., Lautenschlager, R. A., & Chen, D. G. (1998). Changes in
diversity of plant and small mammal communities after herbicide application in sub-
boreal spruce forest. Canadian Journal of Forest Research, 28(2), 168-177. doi:
10.1139/x97-205
Thomas, S. C., Halpern, C. B., Falk, D. A., Liguori, D. A., & Austin, K. A. (1999). Plant diversity in
managed forests: understory responses to thinning and fertilization. Ecological
Applications, 9(3), 864-879. doi: 10.1890/1051-0761(1999)009[0864:PDIMFU]2.0.CO;2
Thompson, D. G., Wojtaszek, B. F., Staznik, B., Chartrand, D. T., & Stephenson, G. R. (2004).
Chemical and biomonitoring to assess potential acute effects of Vision® herbicide on

90
native amphibian larvae in forest wetlands. Environmental Toxicology and Chemistry,
23(4), 843-849. doi: 10.1897/02-280
Thompson, I. D., Baker, J. A., Jastrebski, C., Dacosta, J., Fryxell, J., & Corbett, D. (2008). Effects
of post-harvest silviculture on use of boreal forest stands by amphibians and marten in
Ontario. The Forestry Chronicle, 84(5), 741-747. doi: 10.5558/tfc84741-5
Thompson, I. D., Baker, J. A., & Ter-Mikaelian, M. (2003). A review of the long-term effects of
post-harvest silviculture on vertebrate wildlife, and predictive models, with an emphasis
on boreal forests in Ontario, Canada. Forest Ecology and Management, 177(1), 441-469.
doi: 10.1016/S0378-1127(02)00453-X
Todd, B. D., Blomquist, S. M., Harper, E. B., & Osbourn, M. S. (2014). Effects of timber
harvesting on terrestrial survival of pond-breeding amphibians. Forest Ecology and
Management, 313, 123-131. doi: 10.1016/j.foreco.2013.11.011
Veinotte, C., Freedman, B., Maass, W., & Kirstein, F. (2003). Comparison of the ground
vegetation in spruce plantations and natural forest in the Greater Fundy Ecosystem, New
Brunswick. The Canadian Field-Naturalist, 117(4), 531-540.
Vanderwel, M. C., Malcolm, J. R., Caspersen, J. P., & Newman, M. A. (2010). Fine‐scale habitat
associations of red‐backed voles in boreal mixedwood stands. The Journal of Wildlife
Management, 74(7), 1492-1501. doi: 10.1111/j.1937-2817.2010.tb01276.x
Verschuyl, J., Riffell, S., Miller, D., & Wigley, T. B. (2011). Biodiversity response to intensive
biomass production from forest thinning in North American forests–a meta-analysis.
Forest Ecology and Management, 261(2), 221-232. doi: 10.1016/j.foreco.2010.10.010

91
Waldick, R., Freedman, B., & Wassersug, R. (1999). The consequences for amphibians of the
conversion of natural, mixed-species forests to conifer plantations in southern New
Brunswick. Canadian Field-Naturalist, 113(3), 408-418.
Welsh, H. H. (1990). Relictual Amphibians and Old-Growth Forests. Conservation Biology, 4(3),
309-319. doi: 10.1111/j.1523-1739.1990.tb00293.x
Whitaker Jr, J. O. (2004). Sorex cinereus. Mammalian Species, 743,1-9.
Whitaker Jr, J. O., & French, T. W. (1984). Foods of six species of sympatric shrews from New
Brunswick. Canadian Journal of Zoology, 62(4), 622-626.
Wilson, S. M., & Carey, A. B. (2000). Legacy retention versus thinning: influences on small
mammals. Northwest Science, 74(2), 131-145
Woodley, S. J., Johnson, G., Freedman, B., & Kirk, D. A. (2006). Effects of timber harvesting and
plantation development on cavity-nesting birds in New Brunswick. The Canadian Field-
Naturalist, 120(3), 298-306.
Wuest, L. J., & Betts, M. G. (2010). Quantitative tracking of the vegetative integrity and
distinctness of forested ecological communities: a case study of plantation impacts.
Canadian Journal of Forest Research, 40(2), 330-346. doi: 10.1139/X09-165
Wyman, R. L., & Jancola, J. (1992). Degree and scale of terrestrial acidification and amphibian
community structure. Journal of Herpetology, 26(4), 392-401.
Zwolak, R. (2009). A meta-analysis of the effects of wildfire, clearcutting, and partial harvest on
the abundance of North American small mammals. Forest Ecology and Management,
258(5), 539-545. doi: 10.1016/j.foreco.2009.05.033

92

93
TABLES
Table 1. Total abundance of individual small mammal and herpetofauna species caught for the three sampling methods during 2005-2006 sampling periods. PFT=pit fall trap; LT Tom= Tomahawk live trap; LT Shrm= Sherman live trap; NCS= natural cover search. All species with a total capture of less than 20 individuals were not considered for further individual analysis, but were included in taxonomic richness and total, small mammal, or herpetofauna abundances.
To
tal
nu
mb
er
PF
T
LT
To
m
LT
Sh
rm
NC
S
Small Mammals 840 771 18 51 0
Herpetofauna 244 137 0 0 107
Sorex spp. 609 603 0 6 0
Red back vole 92 78 0 14 0
Woodland jumping mouse 45 37 0 8 0
Short tailed shrew 26 26 0 0 0
Deer mouse 24 12 0 12 0
Snowshoe hare 15 2 13 0 0
Chipmunk 11 1 0 10 0
Meadow jumping mouse 9 9 0 0 0
Star nosed mole 3 3 0 0 0
Red squirrel 4 1 3 0 0
Flying squirrel 2 0 2 0 0
Red back salamander 102 2 0 0 100
Green frog 86 86 0 0 0
Wood frog 21 21 0 0 0
American toad 16 16 0 0 0
Newt 7 5 0 0 2
Yellow spotted salamander 6 1 0 0 5
Peeper 4 4 0 0 0
Garter snake 2 2 0 0 0

94
Table 2. Abundance of individual small mammal and herpetofauna species caught in three stand types with differing management at two age classes, during the 2005-2006 sampling periods. Values are totals? 2005 capture numbers are in the top left corner, 2006 are in the top right and total captures are on the bottom. S1.NR= Stage 1, naturally regenerated sites; S2.NR= Stage 2 naturally regenerated sites; S1.PCT= Stage 1 pre-commercially thinned sites; S2.PCT= Stage 2 pre-commercially thinned sites; S1.RP=Stage 1 plantation; S2.RP=Stage 2 plantation.
S1.N
R
S2.N
R
S1.P
CT
S2.P
CT
S1.R
P
S2.R
P
Small mammal abundance
120 113 74 61 80 69 72 32 69 36 50 64
233 135 149 104 105 114
Herpetofauna abundance
30 11 25 14 41 45 11 1 8 40 11 7
41 39 86 12 48 18
Sorex spp.
89 83 68 39 44 27 56 32 68 23 26 54
172 107 71 88 91 80
Southern red-backed vole
11 12 1 16 10 4 9 14 2 3 6 4
23 17 14 23 5 10
Woodland jumping mouse
7 6 3 5 0 3 1 8 0 1 11 0
13 8 3 9 1 11
Short tailed shrew
4 4 5 0 3 1 3 2 1 1 2 0
8 5 4 5 2 2
Deer mouse
3 6 0 0 3 1 2 5 1 0 0 3
9 0 4 7 1 3
Snowshoe hare
5 0 1 2 3 0 1 0 0 3 0 0
5 3 3 1 3 0
Eastern chipmunk
0 0 1 7 0 0 0 0 0 0 0 3
0 8 0 0 0 3
Meadow jumping mouse
0 0 0 0 6 0 0 0 0 0 3 0
0 0 6 0 0 3
Star nosed mole
1 1 0 0 0 0 0 0 0 1 0 0
2 0 0 0 1 0
American red squirrel
0 1 1 0 0 0 2 0 0 0 0 0
1 1 0 2 0 0
Northern flying squirrel
0 0 0 0 0 0 0 0 0 0 2 0
0 0 0 0 0 2
Northern red-backed salamander
16 5 27 14 4 0 20 7 1 0 7 1
21 41 4 27 1 8
Green frog
6 4 2 19 2 40 2 3 6 0 2 0
10 21 42 5 6 2
Wood frog
2 0 9 4 0 0 2 3 1 0 0 0
2 13 0 5 1 0
American toad
0 2 1 4 1 0 0 0 1 1 1 5
2 5 1 0 2 6
Eastern newt
2 0 0 2 0 0 1 0 0 0 1 1
2 2 0 1 0 2
Yellow spotted salamander
0 0 2 1 1 0 0 0 2 0 0 0
0 3 1 0 2 0
Spring peeper
4 0 0 0 0 0 0 0 0 0 0 0
4 0 0 0 0 0
Garter snake
0 0 0 1 0 0 0 1 0 0 0 0
0 1 0 1 0 0

95
Table 3.Mean (per stand) and standard error of small mammal and herpetofauna per hundred trap nights, and stand level vegetation samples within two stand stages, and three stand treatment types. S1= stage 1 stands, had coniferous trees with an average height between 3-5 metres , whereas S2= stage 2 stands, stands had coniferous trees with an average height of 10-20 metres. NR= Clear-cut and naturally regenerated; PCT= Clear-cut, naturally regenerated, and mechanically pre-commercially thinned; RP= clear-cut, planted with coniferous trees, and sprayed with herbicide. Letters indicate statistically significant (α 0.1) differences between stage or treatment categories.
Mea
nS.E
.M
ean
S.E.
Mea
nS.E
.M
ean
S.E.
Mea
nS.E
.To
tal Ta
xono
mic R
ichne
ss6.1
70.5
86.9
20.8
98.2
5a0.6
56.2
5ab0.9
45.1
25b
0.83
Mam
mal T
axon
omic
Richn
ess
4.17
0.34
4.17
0.44
5.125
a0.3
04.0
0ab0.4
23.3
75b
0.50
Herp
etof
auna
Taxo
nomi
c Rich
ness
2.00
0.37
2.75
0.52
3.13
0.65
2.25
0.90
1.75
0.90
Total
Abun
danc
e55
.17a
5.75
35.17
b4.7
156
.007.5
543
.886.7
335
.636.3
9
Mam
mal A
bund
ance
40.58
a4.6
829
.42b
4.25
46.00
a6.9
431
.625b
3.41
27.37
5b4.5
3
Herp
etof
auna
Abun
danc
e14
.58a
2.97
5.75b
1.34
10.00
1.50
12.25
4.41
8.25
3.24
Sore
x spp
. 8.2
81.4
06.8
21.0
410
.38a
1.53
5.92b
0.94
6.36b
1.56
Shor
ttaile
d shr
ew
0.35
0.11
0.30
0.12
0.48
0.19
0.33
0.12
0.15
0.06
Sout
hern
red-
back
ed vo
le 1.0
40.2
11.2
40.2
61.4
9a0.3
21.3
8a0.2
60.5
6b0.1
6
Deer
mou
se
0.35
0.10
0.25
0.11
0.33
0.15
0.41
0.11
0.15
0.11
North
ern r
ed-b
acke
d sala
mand
er
0.64a
0.28
1.88b
0.46
2.31a
0.57
1.15ab
0.46
0.33b
0.16
Woo
d fro
g 0.0
7a0.0
50.4
5b0.1
40.5
6a0.2
00.1
9b0.1
00.0
4b0.0
4
Leaf
litte
r1.8
20.4
62.2
90.4
93.7
8a0.5
61.0
7b0.1
61.3
2b0.3
3
Need
le lit
ter
0.71a
0.22
1.77b
0.30
0.69a
0.25
1.85b
0.46
1.18ab
0.27
Coars
e woo
dy de
bris
1.08
0.17
1.22
0.13
0.91
0.17
1.16
0.19
1.38
0.17
Shru
b cov
er2.1
7a0.2
61.1
8b0.2
21.6
00.2
11.6
10.4
31.8
10.3
8
Mos
s cov
er0.6
7a0.1
51.6
0b0.3
70.7
30.2
71.6
80.4
50.9
80.3
5
Cano
py co
ver
44.94
a9.6
877
.26b
5.26
88.88
a2.2
661
.22b
10.13
33.20
c8.3
0
% ha
rdwo
od27
.6310
.5526
.428.4
065
.14a
10.09
11.82
b2.9
64.1
2b1.6
6
Tree d
ensit
y0.9
2a0.0
51.1
1b0.0
71.0
40.0
71.0
70.1
00.9
40.0
7
Dept
h to w
ater 0
-10cm
2086
4.58
6541
.6717
899.4
954
55.14
3139
4.62a
9273
.9616
600.5
5ab69
91.42
1015
0.93b
1782
.66
Dept
h to w
ater 5
0cm-
10m
1438
36.68
2769
6.87
1581
08.92
3732
6.60
1612
69.53
5969
9.72
1650
12.44
2838
6.12
1266
36.43
2482
8.12
Stag
e 1Sta
ge 2
NRPC
TRP

96

97
Table 4.Probability (p) values for randomization, interactions between stand types, post hoc analyses, and regressions of small mammal, herpetofauna, and stand characteristics between stand treatment variables. Stand variables are stage, S1=stage 1 (coniferous trees 3-5 metres) and S2=stage 2 (coniferous trees 10-20 metres); and type, NR= Clear-cut and naturally regenerated; PCT= Clear-cut, naturally regenerated, and mechanically pre-commercially thinned; RP= clear-cut, planted with coniferous trees, and sprayed with herbicide. All p values of 0.1 or less are in bold. ‘.’ indicates that the test was not applicable.
Dependent Variable
Interaction
Stage
Treatm
ent
Stag
e&Tr
eatm
ent
PCT-N
RRP
-NR
RP-PC
TLe
afNe
edle
CWD
Shru
bM
oss
Cano
py%H
WDe
nsity
Wat
er0-
10cm
Wat
er50
-10m
TAXO
NOM
IC RIC
HNES
S
Total
0.5
280.0
420.9
240.1
540.0
280.4
480.0
18-0.
056
-0.09
9-0.
310
-0.12
700.0
250.0
440.4
290.1
29-0.
6090
Small
Mam
mal
10.0
180.8
590.1
280.0
140.4
10.0
07-0.
377
-0.15
2-0.
3090
-0.11
700.0
130.0
120.0
980.0
260.5
830
Herp
etofau
na
0.330
0.214
0.713
0.300
0.097
0.592
0.123
0-0.
8480
-0.14
80-0.
4330
-0.25
500.1
300
0.243
00.9
340
0.534
00.1
870
ABUN
DANC
E
Total
Abun
danc
e0.0
230.1
380.0
430.2
600.1
170.4
470.1
010.1
350
-0.39
000.5
370
-0.02
60.7
810.0
74-0.
077
0.221
-0.57
1
Small
Mam
mal
0.095
0.042
0.117
0.066
0.018
0.582
0.021
0.312
00.4
140
0.786
0-0.
106
0.203
0.011
-0.20
70.1
09-0.
567
Herp
etofau
na
0.008
0.718
0.005
0.668
0.732
0.392
-0.77
9-0.
1160
-0.62
700.3
570
-0.03
8-0.
097
0.754
-0.08
80.9
570.7
93
Sorex
spp.
0.451
0.060
0.457
0.028
0.071
0.841
0.044
-0.39
600.5
250
-0.62
10-0.
312
0.214
0.011
-0.99
00.5
80-0.
264
Sout
hern
red-
back
ed vo
le 0.6
170.0
410.5
20.8
520.0
200.0
310.7
020
0.951
00.4
310
-0.46
800.0
520.0
050.1
780.0
590.0
440.0
14
Woo
dland
jump
ing m
ouse
0.3
510.7
530.4
650.4
640.4
800.9
560.0
93-0.
9300
0.978
0-0.
2820
-0.92
000.0
820.2
390
0.731
00.7
690
0.590
0
Shor
ttaile
d shr
ew
0.888
0.222
0.860
0.528
0.087
0.271
0.415
0-0.
9020
0.955
0-0.
069
-0.30
100.1
950.4
150.0
890.0
170.2
79
Deer
mous
e 0.4
280.2
700.0
330.5
90.2
520.1
740.5
750
-0.67
400.7
450
-0.21
100.6
770
0.087
0.575
-0.67
50.0
200.0
28
Woo
d fro
g 0.0
100
0.011
00.0
050.0
540.0
060.5
220.0
750.4
700.5
80-0.
202
0.889
00.0
080.0
930.5
290.5
65-0.
728
North
ern re
d-ba
cked
Salam
ande
r 0.0
470
0.017
00.1
570.1
080.0
030.2
660.0
100.6
77-0.
399
-0.05
0-0.
3610
0.000
0.008
0.384
0.274
-0.04
0
STAN
D CHA
RACT
ERIST
ICS
Leaf
litter
0.492
00.7
080.0
010.0
020.4
97.
..
..
..
..
.
Need
le litt
er0.0
120.0
860.0
250.0
280.3
570.2
01.
..
..
..
..
.
Coars
e Woo
dy D
ebris
0.5
440.2
020.0
350.3
490.0
750.4
05.
..
..
..
..
.
Shru
b cov
er0.0
130.9
040.0
030.9
790.6
830.6
99.
..
..
..
..
.
Mos
s cov
er0.0
220.2
000.0
810.0
770.6
420.1
96.
..
..
..
..
.
Cano
py co
ver
0.009
0.000
0.02
0.067
0.001
0.061
..
..
..
..
..
% Ha
rdwo
od0.8
860.0
000.9
62<1
e-04
<1e-0
40.6
51.
..
..
..
..
.
Tree d
ensit
y0.0
440.5
350.0
460.7
990.4
150.2
59.
..
..
..
..
.
Dept
h to w
ater 0
-10cm
0.763
0.078
0.548
0.165
0.035
0.56
..
..
..
..
..
Dept
h to w
ater 5
0cm-
10m
0.764
0.768
0.818
0.951
0.550
0.533
..
..
..
..
..
Post Hoc
Regression
Randomization

98
Table 5. Means for abundances of small mammals and herpetofauna and forest stand characteristics that were significantly influenced by an interaction between treatment and stand age. S1= stage 1 stands, coniferous trees with an average height between 3-5 metres, S2= stage 2 stands, coniferous trees with an average height of 10-20 metres. NR= Clear-cut and naturally regenerated; PCT= Clear-cut, naturally regenerated, and mechanically pre-commercially thinned; RP= clear-cut, planted with coniferous trees, and sprayed with herbicide.
NR PCT RP NR PCT RP
Total abundance 68.5a
58.75ab
38.25b 43.50 29.00 33.00
Herpetofauna abundance 10.25 21.50 12.00 9.75a
3.00b
4.50ab
Deer mouse 0.67a
0.30ab
0.07b
0 0.52 0.22
Wood frog 0.15 0.00 0.07 0.97a
0.37b
0.00b
Needle litter 0.56 0.92 0.66 0.82a
2.77b
1.70ab
Coarse woody debris 0.83a
0.75b
1.66b 0.98 1.57 1.10
Moss cover 0.60 0.86 0.54 0.86 2.51 1.42
Shrub cover 1.58 2.66 2.28 1.63a
0.57b
1.34ab
Canopy cover 85.89a
36.63b
12.30b 91.86 85.81 54.10
Density 1.04 0.85 0.86 1.03 1.28 1.02
S2S1

99
FIGURES
Figure 1. Sample sites in the Cole’s Island Area of Central New Brunswick. S1.NR= Stage 1, naturally regenerated sites; S2.NR= Stage 2 naturally regenerated sites; S1.PCT= Stage 1 pre-commercially thinned sites; S2.PCT= Stage 2 pre-commercially thinned sites; S1.RP=Stage 1 plantation; S2.RP= Stage 2 plantation.

100
Figure 2. Drift fence pit fall trap, Sherman and Tomahawk live traps, and ground cover quadrats. Not to scale.

101
Figure 3. Drift fence pit fall trap, point quarter method used to describe stand density, and spherical densitometer used to describe canopy cover percentage. Not to scale.

102
Figure 4. Forest stand characteristics within stand types. Bars are mean percentages. NR=Naturally regenerated stands; PCT=pre-commercially thinned stands; RP= planted stands; Leaf, needle, shrub, moss, CWD (coarse woody debris)= rating of cover within a 1m2 quadrat (0 =none ,5= complete cover); Canopy=percentage of canopy cover; HW= percentage of hardwood; density=stand density; water 0-1cm= amount of water that was present between 0 and 10 cm from the surface; water 50cm-10m= amount of water that was present between 50cm and 10m from the surface.
A
A
A
A
A
B
AB
B
B
B
B B
C
B
AB
0.0
10.0
20.0
30.0
40.0
50.0
60.0
70.0
80.0
90.0
NR
RP
PCT
A

103
Figure 5. Mean percentage of forest stand characteristics within stage 1 and stage 2 stand development classes. Stage 1 stands had coniferous trees with an average height between 3-5 metres , whereas stage 2 stands had coniferous trees with an average height of 10-20 metres. Leaf, needle, shrub, moss, CWD (coarse woody debris) = rating of cover within a 1m2 quadrat (0 = none , 5 = complete cover); Canopy = percentage of canopy cover; HW= percentage of hardwood; density=stand density; water 0-1cm = amount of water that was present between 0 and 10 cm from the surface; water 50cm-10m = amount of water that was present between 50cm and 10m from the surface.
A
A
A
A
A
B
B
B
B
B
0.000
10.000
20.000
30.000
40.000
50.000
60.000
70.000
80.000
Stage 1
Stage 2

104
A
Figure 6. Taxonomic richness (# taxa) for total (small mammals and herpetofauna), small mammal, and herpetofauna with standard error, versus silviculture treatments. NR=naturally regenerated; PCT= pre-commercially thinned; RP=plantation. Values with the same letter are not significantly different (α=0.1).
A
AB
B A
AB
B
0
1
2
3
4
5
6
7
8
9
10
NR PCT RP
Taxo
no
mic
Ric
hn
ess
Total Taxonomic Richness
Mammal TaxonomicRichness
Herpetofauna TaxonomicRichness
A

105
Figure 7. Abundance (# individuals): total (small mammal and herpetofauna), small mammal, and herpetofauna (mean +standard error) versus stand stage. Letter symbols indicate statistically significant differences (α=0.1). Stage 1 stands had coniferous trees with an average height between 3-5 metres, whereas stage 2 stands had coniferous trees with an average height of 10-20 metres.
A
B
A
B
A
B
0
10
20
30
40
50
60
70
Stage 1 Stage 2
Ab
un
dan
ce
Stand Stage
Total Abundance
Mammal Abundance
Herp Abundance

106
Figure 8. Abundance (# individuals): total (small mammal and herpetofauna), small mammal, and herpetofauna (mean + standard error) versus silviculture treatments. Letter symbols indicate statistically significant differences (α=0.1). NR=naturally regenerated; PCT= pre-commercially thinned; RP=plantation.
A
AB B
0.0
10.0
20.0
30.0
40.0
50.0
60.0
70.0
NR PCT RP
Ab
un
dan
ce
Stand Treatment
Total Abundance
Mammal Abundance
Herp Abundance

107
Figure 9. Abundances of Sorex spp. and red-backed vole (mean + standard error) versus stand treatment. Letter symbols indicate statistically significant differences (α=0.1). NR=naturally regenerated; PCT= pre-commercially thinned; RP=plantation.
A
B AB
A B
B 0.0
2.0
4.0
6.0
8.0
10.0
12.0
14.0
NR PCT RP
Ab
un
dan
ce
Stand Treatment
Sorex sp.
Redback Vole

108
Figure 10. Abundances of northern red-back salamander and wood frog (mean + standard error) versus stand treatment. Letter symbols indicate statistically significant differences (α=0.1). NR=naturally regenerated; PCT= pre-commercially thinned; RP=plantation.
A
AB
B
A
B B 0
0.5
1
1.5
2
2.5
3
3.5
NR PCT RP
Ab
un
dan
ce
Stand Treatment
Red-backed salamander
Wood frog

109
Figure 11. Abundances of northern red-back salamander and wood frog (mean + standard error) versus stand development stage. Letter symbols indicate statistically significant differences (α=0.1). Stage 1 stands had coniferous trees with an average height between 3-5 metres, whereas stage 2 stands had coniferous trees with an average height of 10-20 metres.
A
B
A
B
0
0.5
1
1.5
2
2.5
3
Stage 1 Stage 2
Ab
un
dan
ce
Stand Stage
Red-backed salamander
Wood frog

110
APPENDICES
Appendix Table 1. Individual forest stand sizes, overall forest stand type, year of establishment, treatment year (if any) as provided by J.D. Irving Ltd., and distance from sample sites to nearest forest stand edge. S1= stage 1 stands, had coniferous trees with an average height between 3-5 metres, whereas S2= stage 2 stands, stands had coniferous trees with an average height of 10-20 metres. NR= Clear-cut and naturally regenerated; PCT= Clear-cut, naturally regenerated, and mechanically pre-commercially thinned; RP= clear-cut, planted with coniferous trees, and sprayed with herbicide; HS=Hardwood dominated mixed-wood stand; SW= predominantly softwood stand; SH=softwood dominated mixed-wood stand; na= information not available. * indicates that there was a discrepancy between the geographic information system data provided by the New Brunswick Department of Natural Resources, and the land manager J.D. Irving, Ltd.. In these instances I deferred to the information provided by J.D. Irving Ltd.
Stand age
Stand treatment
type
Stand size (m2)
Overall stand type
Year Clear Cut
Treatment year
Fence 1- distance
to nearest
edge (m)
Fence 2- distance
to nearest
edge (m)
YOUNG
NR
152520.8 HS 1979 na 109 104
235198.7 SW 1985 na 40 50
211805.7 SH 1988 na 94 70
127157.2 HS 1984 na 71 41
PCT
258768.4 SW 1989 2000 74 42
150052.1 SH 1989 2000 35 40
166259.5 SW 1985 2000 93 68
174665.3 SW 1993 2000 118 87
RP
240775.6 SH 1993 1993 69 53
137910.9 SH 1993 1993 156 35
104160 SH 1994 1994 63 53
105654.6 SH 1995 1995 59 47
OLD
NR
218771 SH 1967 na 120 264
32911.41 UN na na 68 54
144771.5 HW 1927 na 33 99
529217.5 SH 1957 na 105 77
PCT
134959.6 SW 1982 1982 81 66
139129.6 SW 1980 1995 215 191
503131.3 SH 1988 1993 48 37
163140 SW 1979 1993 43 41
RP
178590.2 SH 1988 2001 48 33
142957.4 SW 1988 1988 58 34
410190.1 SH 1987 1998 62 71
77034.6 SH 1985 1985 98 40
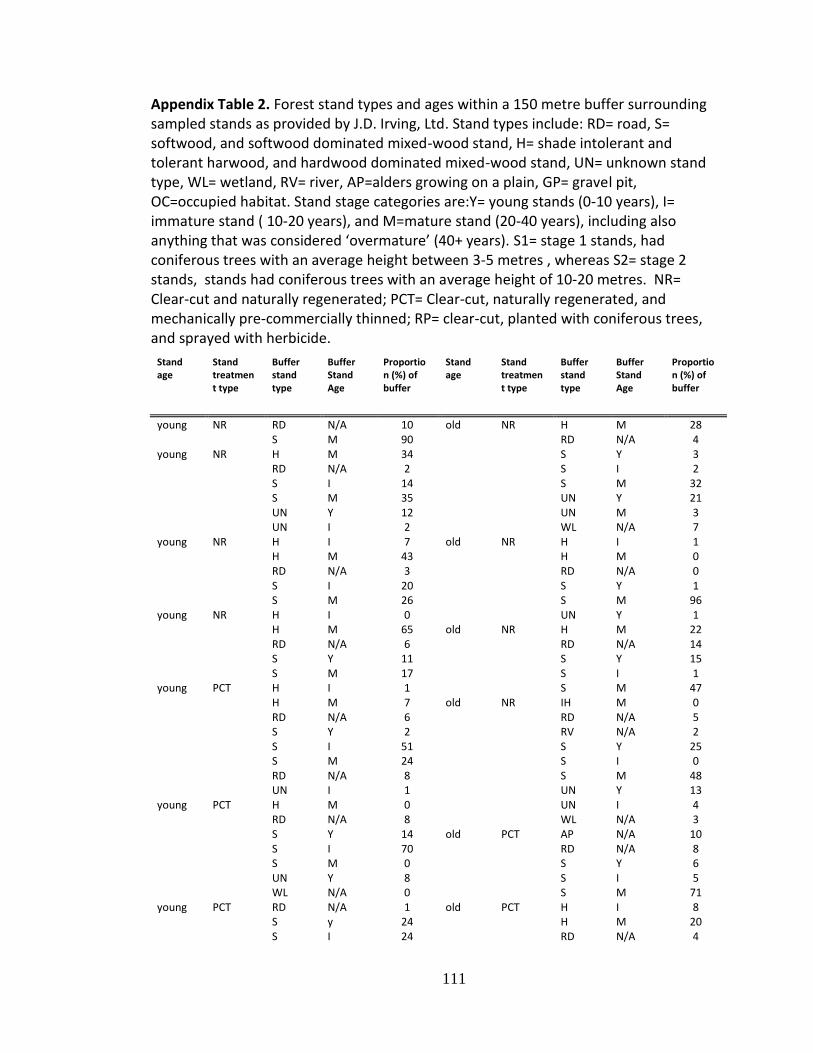
111
Appendix Table 2. Forest stand types and ages within a 150 metre buffer surrounding sampled stands as provided by J.D. Irving, Ltd. Stand types include: RD= road, S= softwood, and softwood dominated mixed-wood stand, H= shade intolerant and tolerant harwood, and hardwood dominated mixed-wood stand, UN= unknown stand type, WL= wetland, RV= river, AP=alders growing on a plain, GP= gravel pit, OC=occupied habitat. Stand stage categories are:Y= young stands (0-10 years), I= immature stand ( 10-20 years), and M=mature stand (20-40 years), including also anything that was considered ‘overmature’ (40+ years). S1= stage 1 stands, had coniferous trees with an average height between 3-5 metres , whereas S2= stage 2 stands, stands had coniferous trees with an average height of 10-20 metres. NR= Clear-cut and naturally regenerated; PCT= Clear-cut, naturally regenerated, and mechanically pre-commercially thinned; RP= clear-cut, planted with coniferous trees, and sprayed with herbicide.
Stand age
Stand treatment type
Buffer stand type
Buffer Stand Age
Proportion (%) of buffer
Stand age
Stand treatment type
Buffer stand type
Buffer Stand Age
Proportion (%) of buffer
young NR RD N/A 10 old NR H M 28
S M 90
RD N/A 4
young NR H M 34
S Y 3
RD N/A 2
S I 2
S I 14
S M 32
S M 35
UN Y 21
UN Y 12
UN M 3
UN I 2
WL N/A 7
young NR H I 7 old NR H I 1
H M 43
H M 0
RD N/A 3
RD N/A 0
S I 20
S Y 1
S M 26
S M 96
young NR H I 0
UN Y 1
H M 65 old NR H M 22
RD N/A 6
RD N/A 14
S Y 11
S Y 15
S M 17
S I 1
young PCT H I 1
S M 47
H M 7 old NR IH M 0
RD N/A 6
RD N/A 5
S Y 2
RV N/A 2
S I 51
S Y 25
S M 24
S I 0
RD N/A 8
S M 48
UN I 1
UN Y 13
young PCT H M 0
UN I 4
RD N/A 8
WL N/A 3
S Y 14 old PCT AP N/A 10
S I 70
RD N/A 8
S M 0
S Y 6
UN Y 8
S I 5
WL N/A 0
S M 71
young PCT RD N/A 1 old PCT H I 8
S y 24
H M 20
S I 24
RD N/A 4

112
S M 26
S I 53
UN Y 15
S M 16
WL N/A 9
UN I 0
young PCT H M 3 old PCT GP N/A 1
RD N/A 5
RD N/A 11
S Y 5
S M 81
S I 43
WL N/A 7
S M 31 old PCT RD N/A 7
UN y 0
S Y 3
UN I 5
S I 22
WL N/A 7
S M 69
young RP H I 4 old RP H M 6
H M 1
RD N/A 6
RD N/A 4
S Y 0
S Y 39
S I 54
S I 35
S M 9
S M 14
UN Y 5
UN Y 2
WL N/A 19
young RP H I 7 old RP H O 16
H M 6
OC N/A 12
RD N/A 6
RD N/A 7
S Y 47
S Y 0
S I 21
S I 20
S M 10
S M 24
UN N/A 3
UN Y 12
young RP I M 21
WL N/A 10
RD N/A 6 old RP H M 20
S Y 8
RD N/A 7
S I 15
RV N/A 3
S M 35
S Y 1
UN Y 1
S I 34
WL N/A 14
S M 25
young RP H M 54
WL N/A 10
RD N/A 19 old RP H M 4
S I 4
RD N/A 9
S M 23
S I 45
S M 42

113
Appendix Table 3. Mean and standard deviation of forest stand characteristics within
the two stand development stages. S1= stage with an average coniferous tree height
between 3-5 metres, S2=stands with an average coniferous tree height of 10-20
metres. S1= stage 1 stands, had coniferous trees with an average height between 3-5
metres , whereas S2= stage 2 stands, stands had coniferous trees with an average
height of 10-20 metres.
S1
S2
mean
standard deviation
mean
standard deviation
leaf 1.82 1.60
2.20 1.70
needle 0.71 0.75
1.36 1.09
CWD 1.08 0.58
1.09 0.67
Shrub 2.17 0.90
1.18 0.76
Moss 0.67 0.52
1.55 1.28
Canopy 44.94 33.53
77.29 18.22
Percent Hardwood 27.63 36.54
25.86 29.11
Density 0.92 0.17
1.10 0.24

114
Appendix Table 4. Correlation matrix of independent forest stand characteristic variables measured at each site. Leaf litter=proportion leaf litter; needle litter=proportion needle cover; Coarse woody debris= proportion of coarse woody debris; shrub cover= proportion shrub cover; moss cover=proportion moss cover; canopy cover= percent canopy cover; density= stand density around trapping sites;depth to water 0-10cm= percent water from 0-0.1 m underground; depth t water 50 cm-10 m=percent water from 0.5-10m underground. ). *** indicates a p-value of less than 0.01, ** indicates a p-value of less than 0.05, and * indicates a p-value of less than 0.1.
Dependent
variableLeaf litter
Needle
litter
Coarse
woody
debris
Shrub cover Moss coverCanopy
cover
%
hardwoodDensity
Depth to
water 0-
10cm
Depth to
water 50cm-
10m
Leaf litter 1
Needle litter -.416** 1
Coarse woody
debris -0.343 0.28 1
Shrub cover -0.004 -0.33 -0.394* 1
Moss cover -0.319 .689*** 0.261 -0.194 1
Canopy cover .565*** 0.123 -0.178 -.542*** 0.218 1
% hardwood .889*** -.485** -0.325 -0.069 -0.303 .658*** 1
Density -0.068 0.309 0.066 -.632*** 0.355* .505** 0.013 1
Depth to water 0-
10cm 0.22 0.048 0.192 -0.322 0.123 .455** 0.303 0.211 1
Depth to water
50cm-10m -0.119 0.173 0.071 -0.012 .558*** 0.211 -0.068 0.361* 0.341 1

115
Appendix Table 5. P values of small mammal and herpetofauna taxonomic richness relationships with stand stage and treatment with all species captured, and excluding rare captures of less than 20 individuals. P values in bold are less than 0.1. TR= taxonomic richness.
Randomization Interaction Post Hoc
Dependent Variable
Stage Treatment
Stage&Treatment
PCT-NR
RP-NR RP-PCT
All species captured
Total TR 0.52
8 0.042
0.924
0.154 0.02
8 0.448
Small Mammal TR
1.000 0.018
0.859
0.128
0.014 0.410
Herpetofauna TR
0.330 0.214
0.713
0.300
0.097 0.592
Capture rates over 20 individuals
Total TR 0.56
8 0.025
0.339
0.051 0.01
1 0.626
Small Mammal TR
0.758 0.128
0.151
0.148
0.177 1.000
Herpetofauna TR
0.970 0.038
0.258
0.192
0.021 0.424
Appendix Figure 1. Post hoc power analysis, effect sizes that can be expected based on various statistical power levels. Effect size (f), or Cohen’s f is defined as f=σmeans /σ and power is defined as 1=β error of probability.
0
0.1
0.2
0.3
0.4
0.5
0.6
0.7
0.8
0.9
1
0 0.2 0.4 0.6 0.8 1
eff
ect
siz
e (
f)
Power (1-β err prob)
very low
large
low
medium

116
Appendix Figure 2. Plot of univariate relationships between forest stand characteristics and total small mammal and herpetofauna taxonomic richness. canopy= percent canopy cover; CWD= proportion of coarse woody debris; density= stand density around trapping sites; water 0-0.1m= percent ground water from 0-0.1 m; water 0.5m-10m =percent ground water from 0.5m-10m; leaf=proportion leaf litter; moss=proportion moss cover; needle=proportion needle cover; shrub= proportion shrub cover.
Appendix Figure 3. Plot of univariate relationships between forest stand characteristics and small mammal taxonomic richness. canopy= percent canopy cover; CWD= proportion of coarse woody debris; density= stand density around trapping sites; water 0-0.1cm= percent ground water from 0-0.1 m; water 10cm-10m =percent ground water from 0.5m-10m; leaf=proportion leaf litter; moss=proportion moss cover; needle=proportion needle cover; shrub= proportion shrub cover.
canopy
CWD
density
leaf
moss needle shrub
water 0-0.1m
water 0.5m-10m
% HW
-1
-0.8
-0.6
-0.4
-0.2
0
0.2
0.4
0.6
0.8
1
R2
Stand Characteristic
canopy
CWD
density
leaf
moss needle shrub
water0-0.1m
water 0.5m-10m
% HW
-1
-0.8
-0.6
-0.4
-0.2
0
0.2
0.4
0.6
0.8
1
R2
Stand Characteristic

117
Appendix Figure 4. Plot of univariate relationships between forest stand characteristics and small mammal taxonomic richness. canopy= percent canopy cover; CWD= proportion of coarse woody debris; density= stand density around trapping sites; water 0-0.1cm= percent ground water from 0-0.1 m; water 10cm-10m =percent ground water from 0.5m-10m; leaf=proportion leaf litter; moss=proportion moss cover; needle=proportion needle cover; shrub= proportion shrub cover.
Appendix Figure 5. Plot of univariate relationships between forest stand characteristics and small mammal taxonomic richness. canopy= percent canopy cover; CWD= proportion of coarse woody debris; density= stand density around trapping sites; water 0-0.1cm= percent ground water from 0-0.1 m; water 10cm-10m =percent ground water from 0.5m-10m; leaf=proportion leaf litter; moss=proportion moss cover; needle=proportion needle cover; shrub= proportion shrub cover.
canopy
CWD density
leaf
moss needle
shrub
water0-0.10m
water0.50m-0m
% HW
-1
-0.8
-0.6
-0.4
-0.2
0
0.2
0.4
0.6
0.8
1
R2
Stand Characteristic
canopy
CWD
density
leaf
moss needle
shrub
water0-0.10m
water0.5m-10m % HW
-1
-0.8
-0.6
-0.4
-0.2
0
0.2
0.4
0.6
0.8
1
R2
Stand Characteristic

118
Appendix Figure 6. Plot of univariate relationships between forest stand characteristics and small mammal taxonomic richness. canopy= percent canopy cover; CWD= proportion of coarse woody debris; density= stand density around trapping sites; water 0-0.1cm= percent ground water from 0-0.1 m; water 10cm-10m =percent ground water from 0.5m-10m; leaf=proportion leaf litter; moss=proportion moss cover; needle=proportion needle cover; shrub= proportion shrub cover.
Appendix Figure 7. Plot of univariate relationships between forest stand characteristics and small mammal taxonomic richness. canopy= percent canopy cover; CWD= proportion of coarse woody debris; density= stand density around trapping sites; water 0-0.1cm= percent ground water from 0-0.1 m; water 10cm-10m =percent ground water from 0.5m-10m; leaf=proportion leaf litter; moss=proportion moss cover; needle=proportion needle cover; shrub= proportion shrub cover.
canopy
CWD density
leaf
moss needle
shrub
water0-0.10m
water0.5m-10m
% HW
-1
-0.8
-0.6
-0.4
-0.2
0
0.2
0.4
0.6
0.8
1
R2
Stand Characteristic
canopy
CWD
density leaf moss
needle
shrub
water0-0.1m water0.5m-10m
% HW
-1
-0.8
-0.6
-0.4
-0.2
0
0.2
0.4
0.6
0.8
1
R2
Stand Characteristic

119
Appendix Figure 8. Plot of univariate relationships between forest stand characteristics and small mammal taxonomic richness. canopy= percent canopy cover; CWD= proportion of coarse woody debris; density= stand density around trapping sites; water 0-0.1cm= percent ground water from 0-0.1 m; water 10cm-10m =percent ground water from 0.5m-10m; leaf=proportion leaf litter; moss=proportion moss cover; needle=proportion needle cover; shrub= proportion shrub cover.
Appendix Figure 9. Plot of univariate relationships between forest stand characteristics and small mammal taxonomic richness. canopy= percent canopy cover; CWD= proportion of coarse woody debris; density= stand density around trapping sites; water 0-0.1cm= percent ground water from 0-0.1 m; water 10cm-10m =percent ground water from 0.5m-10m; leaf=proportion leaf litter; moss=proportion moss cover; needle=proportion needle cover; shrub= proportion shrub cover.
canopy
CWD density
leaf
moss needle
shrub
water0-0.1m
water0.5m-10m
% HW
-1
-0.8
-0.6
-0.4
-0.2
0
0.2
0.4
0.6
0.8
1
R2
Stand Characteristic
canopy
CWD
density
leaf
moss
needle
shrub
water0-0.10m water0.50m-10m
% HW
-1
-0.8
-0.6
-0.4
-0.2
0
0.2
0.4
0.6
0.8
1
R2
Stand Characteristic

120
Appendix Figure 10. Plot of univariate relationships between forest stand characteristics and small mammal taxonomic richness. canopy= percent canopy cover; CWD= proportion of coarse woody debris; density= stand density around trapping sites; water 0-0.1cm= percent ground water from 0-0.1 m; water 10cm-10m =percent ground water from 0.5m-10m; leaf=proportion leaf litter; moss=proportion moss cover; needle=proportion needle cover; shrub= proportion shrub cover.
Appendix Figure 11. Plot of univariate relationships between forest stand characteristics and small mammal taxonomic richness. canopy= percent canopy cover; CWD= proportion of coarse woody debris; density= stand density around trapping sites; water 0-0.1cm= percent ground water from 0-0.1 m; water 10cm-10m =percent ground water from 0.5m-10m; leaf=proportion leaf litter; moss=proportion moss cover; needle=proportion needle cover; shrub= proportion shrub cover.
canopy
CWD leaf moss needle
shrub
water 0-0.5m
water 0.10m-10m
%HW
-1
-0.8
-0.6
-0.4
-0.2
0
0.2
0.4
0.6
0.8
1
R2
Stand Characteristics
density
canopy
CWD density
leaf
moss needle
shrub
water0-0.1m
water0.5m-10m
% HW
-1
-0.8
-0.6
-0.4
-0.2
0
0.2
0.4
0.6
0.8
1
R2
Stand Characteristic

121
Appendix Figure 12. Plot of univariate relationships between forest stand characteristics and small mammal taxonomic richness. canopy= percent canopy cover; CWD= proportion of coarse woody debris; density= stand density around trapping sites; water 0-0.1cm= percent ground water from 0-0.1 m; water 10cm-10m =percent ground water from 0.5m-10m; leaf=proportion leaf litter; moss=proportion moss cover; needle=proportion needle cover; shrub= proportion shrub cover.
canopy
CWD
density
leaf
moss
needle
shrub
water0-0.5m
water0.10m-10m
% HW
-1
-0.8
-0.6
-0.4
-0.2
0
0.2
0.4
0.6
0.8
1
R2
Stand Characteristic

CURRICULUM VITAE
Candidate’s name: Georgie Emilie Day
Universities attended: BSc, Biology and Environmental Science, 2004. Mount Allison University, New Brunswick Canada.