comparison of routing metrics for static multi-hop wireless networks richard draves, jitendra padhye...
Post on 21-Dec-2015
215 views
TRANSCRIPT

Comparison of Routing Metrics for Static Multi-Hop Wireless Networks
Richard Draves, Jitendra Padhye and Brian ZillMicrosoft Research
Presented by Hoang Nguyen
CS598JH - Spring 06
Some slides adopted from the authors and from Professor Robin Kravets
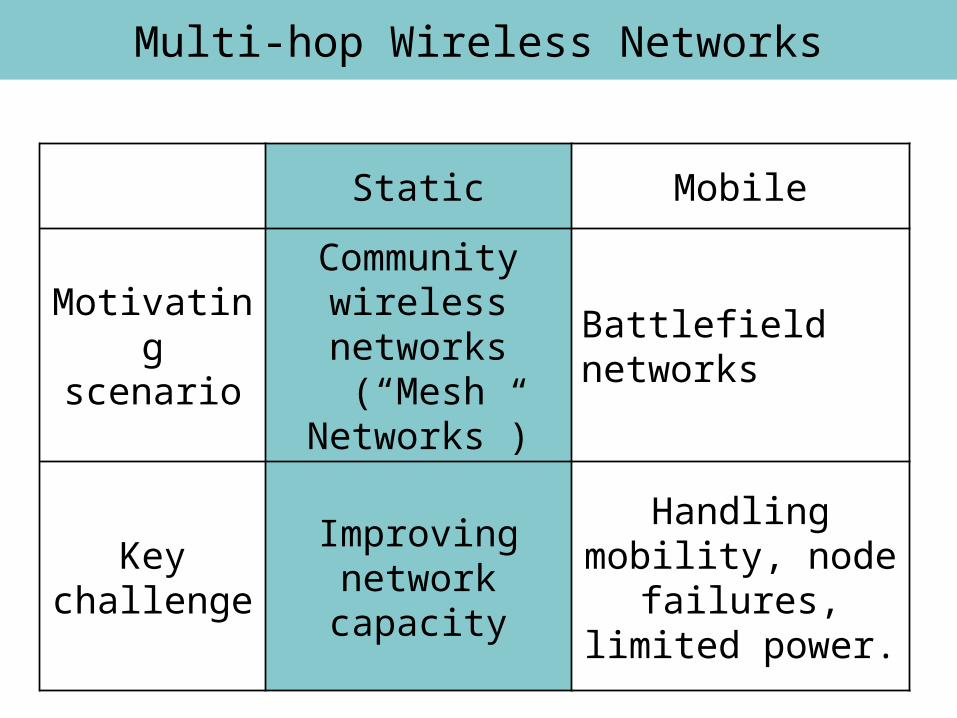
Multi-hop Wireless Networks
Static Mobile
Motivating scenario
Community wireless
networks (“Mesh Networks”)
Battlefield networks
Key challenge
Improving network capacity
Handling mobility, node failures, limited power.

Routing in Multi-hop Wireless Networks
• Mobile Networks– Minimum-Hop– DSR, AODV…
• Static Networks– Minimum-Hop vs. More Hops
• Link-quality Based Routing– Signal-to-Noise ratio– Packet loss rate– Round-trip-time– Bandwidth
Experimental Comparison

Contributions
• Design and Implementation of LQSR (Link Quality Source Routing) protocol– LQSR = DSR with link quality metrics
• Experimental Comparison of link quality metrics:– Minimum-hop (HOP)– Per-Hop Round Trip Time (RTT)– Per-hop Packet Pair (PktPair)– Expected Transmission (ETX)
Outline
• DSR Revisited
• Link quality metrics revisited
• LQSR (Link Quality Source Routing)
• Experimental results
• Conclusion
Outline
• DSR Revisited
• Link quality metrics revisited
• LQSR (Link Quality Source Routing)
• Experimental results
• Conclusion

DSR – Route Discovery
B
A
S EF
H
J
D
C
G
IK
Z
Y
M
N
L
Adopted from Professor Robin Kravets’ lectures

DSR – Route Discovery
Broadcast transmission
[X,Y] Represents list of identifiers appended to RREQ
B
A
S EF
H
J
D
C
G
IK
Z
Y
M
N
L
[S]
Adopted from Professor Robin Kravets’ lectures
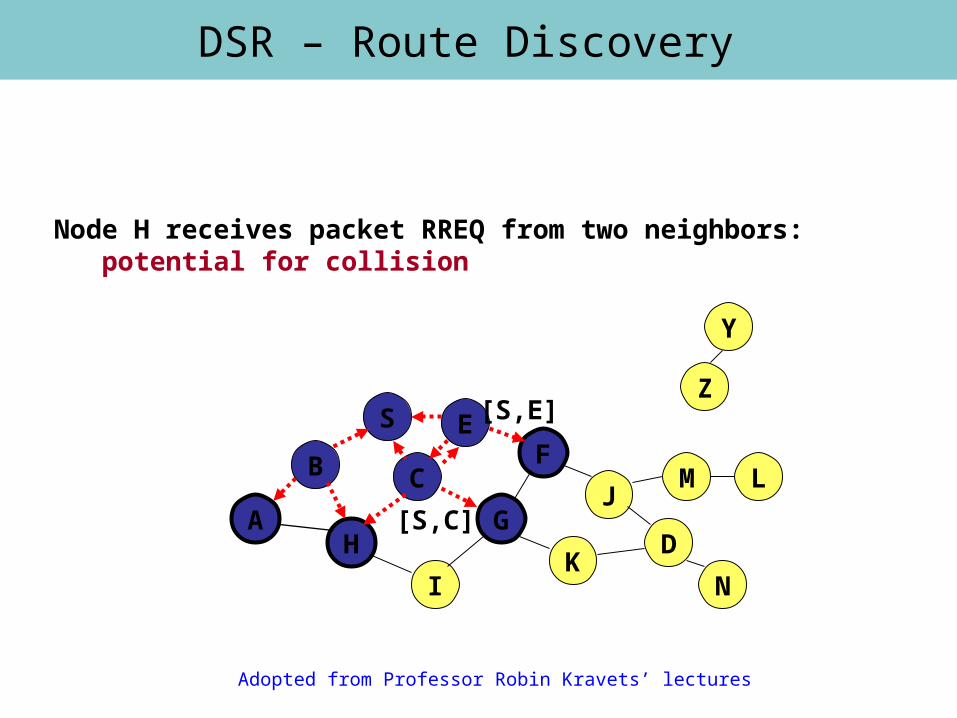
DSR – Route Discovery
Node H receives packet RREQ from two neighbors: potential for collision
B
A
S EF
H
J
D
C
G
IK
Z
Y
M
N
L
[S,E]
[S,C]
Adopted from Professor Robin Kravets’ lectures

DSR – Route Discovery
Node C receives RREQ from G and H, but does not forwardit again, because node C has already forwarded RREQ once
B
A
S EF
H
J
D
C
G
IK
Z
Y
M
N
L
[S,C,G]
[S,E,F]
Adopted from Professor Robin Kravets’ lectures
DSR – Route Discovery
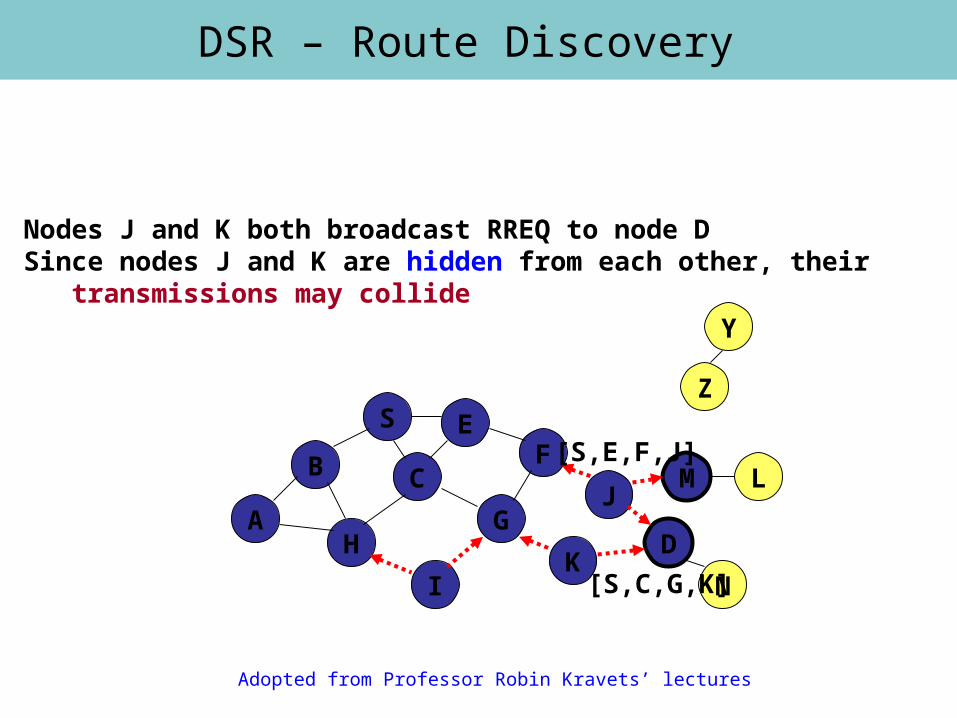
Nodes J and K both broadcast RREQ to node DSince nodes J and K are hidden from each other, their transmissions may collide
B
A
S EF
H
J
D
C
G
IK
Z
Y
M
N
L
[S,C,G,K]
[S,E,F,J]
Adopted from Professor Robin Kravets’ lectures

DSR – Route Discovery
Node D does not forward RREQ, because node D is the intended target of the route discovery
B
A
S EF
H
J
D
C
G
IK
Z
Y
M
N
L
[S,E,F,J,M]
Adopted from Professor Robin Kravets’ lectures

DSR – Route Reply
B
A
S EF
H
J
D
C
G
IK
Z
Y
M
N
L
RREP [S,E,F,J,D]
Adopted from Professor Robin Kravets’ lectures
DSR – Data Delivery
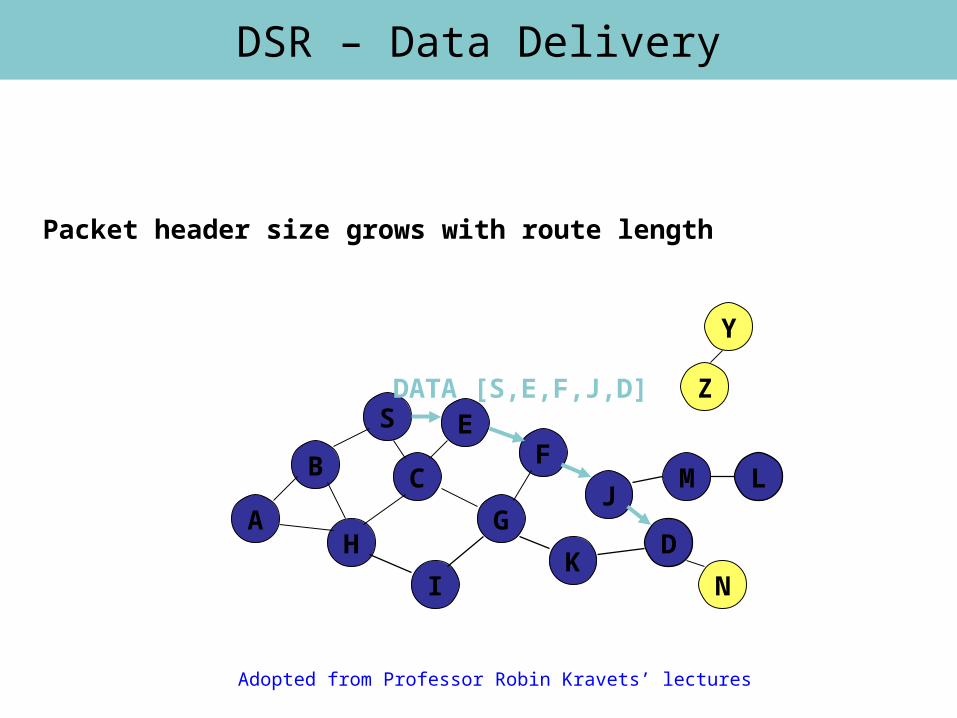
Packet header size grows with route length
B
A
S EF
H
J
D
C
G
IK
Z
Y
M
N
L
DATA [S,E,F,J,D]
Adopted from Professor Robin Kravets’ lectures

DSR – Route Caching
[P,Q,R] Represents cached route at a node (DSR maintains the cached routes in a tree format)
B
A
S EF
H
J
D
C
G
IK
M
N
L
[S,E,F,J,D] [E,F,J,D]
[C,S]
[G,C,S]
[F,J,D],[F,E,S]
[J,F,E,S]
Z
Adopted from Professor Robin Kravets’ lectures

DSR – Route Caching
Assume that there is no link between D and Z.Route Reply (RREP) from node K limits flooding of RREQ.In general, the reduction may be less dramatic.
B
A
S EF
H
J
D
C
G
IK
Z
Y
M
N
L
[S,E,F,J,D] [E,F,J,D]
[C,S][G,C,S]
[F,J,D],[F,E,S]
[J,F,E,S]
RREQ
[K,G,C,S]RREP
Adopted from Professor Robin Kravets’ lectures

DSR – Route Error
J sends a route error to S along J-F-E-S when its attempt to forward the data packet S (with route SEFJD) on J-D failsNodes hearing RERR update their route cache to remove link J-D
B
A
S EF
H
J
D
C
G
IK
Z
M
N
L
RERR [J-D]
Adopted from Professor Robin Kravets’ lectures

Outline
• DSR Revisited
• Link quality metrics revisited
• LQSR (Link Quality Source Routing)
• Experimental results
• Conclusion
Per-hop Round Trip Time (RTT)
• Node periodically pings each of its neighbors
• RTT samples are averaged using exponentially weighted moving average
• Path with least sum of RTTs is selected

Per-hop Round Trip Time (RTT)
• Advantages– Easy to implement– Accounts for link load and bandwidth– Also accounts for link loss rate
• 802.11 retransmits lost packets up to 7 times• Lossy links will have higher RTT
• Disadvantages– Expensive – Self-interference due to queuing
Per-hop Packet Pair (PktPair)
• Node periodically sends two back-to-back probes to each neighbor– First probe is small, second is large
• Neighbor measures delay between the arrival of the two probes; reports back to the sender
• Sender averages delay samples using low-pass filter
• Path with least sum of delays is selected

Per-hop Packet Pair (PktPair)
• Advantages– Self-interference due to queuing is not a
problem– Implicitly takes load, bandwidth and loss rate
into account
• Disadvantages– More expensive than RTT
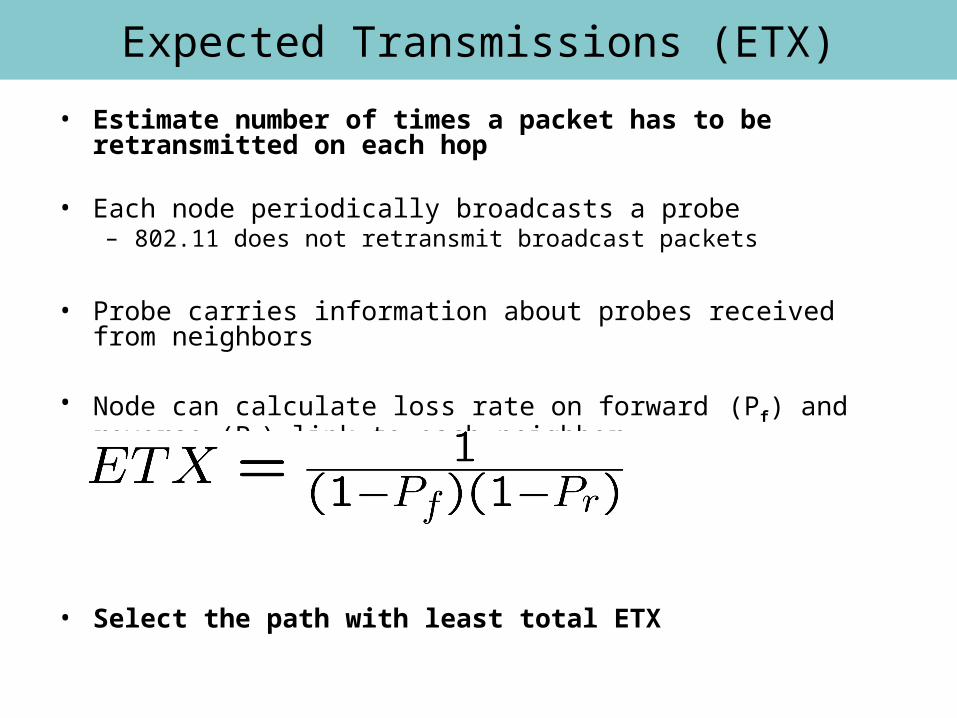
Expected Transmissions (ETX)
• Estimate number of times a packet has to be retransmitted on each hop
• Each node periodically broadcasts a probe– 802.11 does not retransmit broadcast packets
• Probe carries information about probes received from neighbors
• Node can calculate loss rate on forward (Pf) and reverse (Pr) link to each neighbor
• Select the path with least total ETX

Expected Transmissions (ETX)
• Advantages– Low overhead– Explicitly takes loss rate into account
• Disadvantages– Loss rate of broadcast probe packets is not
the same as loss rate of data packets• Probe packets are smaller than data packets• Broadcast packets are sent at lower data rate
– Does not take data rate or link load into account
Outline
• DSR Revisited
• Link quality metrics revisited
• LQSR (Link Quality Source Routing)
• Experimental results
• Conclusion

LQSR
• DSR-like– Route Request, Route Reply and Route Error– Link-quality metrics is appended
• Link-state-like– Link caching (not Route caching)– Reactive maintenance
• On active routes
– Proactive maintenance• Periodically floods RouteRequest-like Link Info

Outline
• DSR Revisited
• Link quality metrics revisited
• LQSR (Link Quality Source Routing)
• Experimental results
• Conclusion

Mesh Testbed
Approx. 61 m
Appro
x.
32
m
23 Laptops running Windows XP. 802.11a cards: mix of Proxim and Netgear.
Diameter: 6-7 hops.

Link bandwidths in the testbed
0
5
10
15
20
25
30
0 5 10 15 20 25 30Higher Bandwidth (Mbps)
Lo
wer
Ban
dw
dit
h (
Mb
ps)
• Cards use Autorate •Total node pairs: 23x22/2 = 253
• 90 pairs have non-zero bandwidth in both directions.
Bandwidths vary significantly; lot of asymmetry.
Experiments
1. Bulk-transfer TCP Flows
2. Impact of mobility
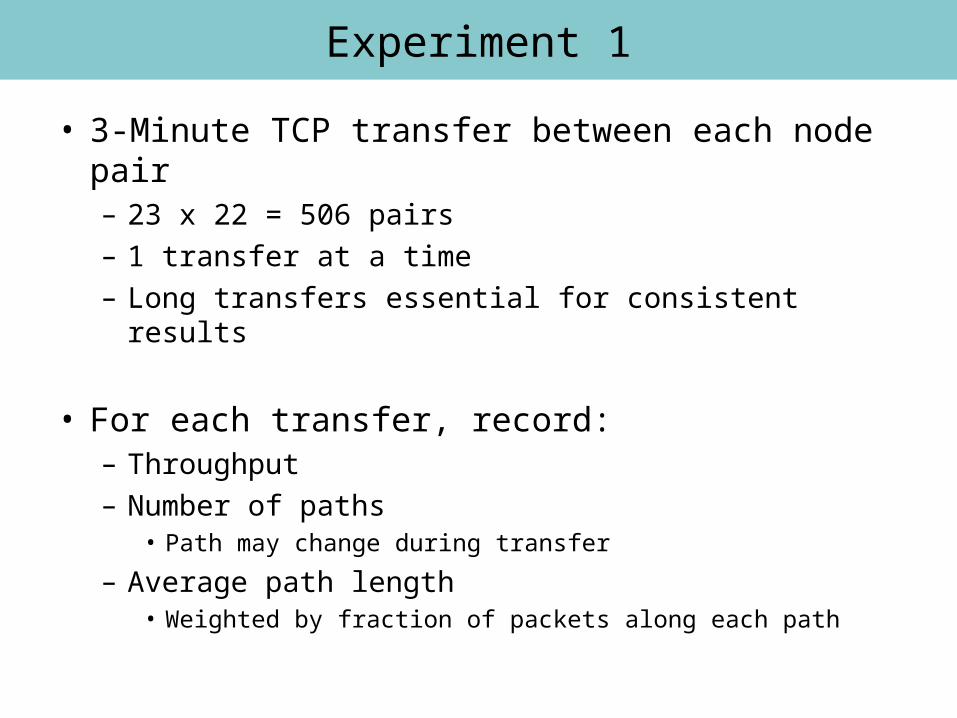
Experiment 1
• 3-Minute TCP transfer between each node pair– 23 x 22 = 506 pairs– 1 transfer at a time– Long transfers essential for consistent results
• For each transfer, record: – Throughput– Number of paths
• Path may change during transfer
– Average path length• Weighted by fraction of packets along each path

Median Throughput
0
200
400
600
800
1000
1200
1400
1600
HOP ETX RTT PktPair
Med
ian
Th
rou
gh
pu
t (K
bp
s)
ETX performs best. RTT performs worst.

Why does ETX perform well?
0
0.2
0.4
0.6
0.8
1
0 2000 4000 6000 8000 10000
Throughput (Kbps)
Cu
mu
lati
ve
Fra
cti
on
ETX
HOP
ETX performs better by avoiding low-throughput paths.

Impact on Path Lengths
0
1
2
3
4
5
6
7
8
0 1 2 3 4 5 6 7 8
Path Length with ETX
Pat
h L
eng
th w
ith
HO
P
Path length is generally higher under ETX.

Why does RTT perform so poorly?
RTT suffers heavily from self-interference
Median Number of Paths
0
5
10
15
20
25
HOP ETX RTT PktPair
Nu
mb
er o
f P
ath
s
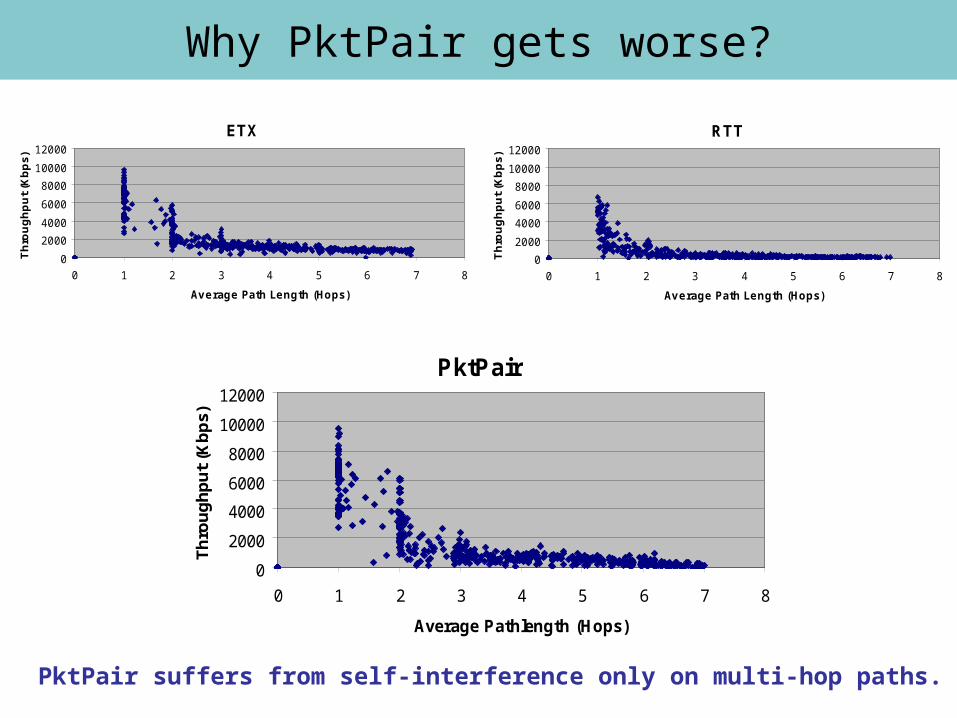
Why PktPair gets worse?
PktPair
0
2000
4000
6000
8000
10000
12000
0 1 2 3 4 5 6 7 8
Average Pathlength (Hops)
Th
rou
gh
pu
t (K
bp
s)
ETX
0
2000
4000
6000
8000
10000
12000
0 1 2 3 4 5 6 7 8
Average Path Length (Hops)
Th
rou
gh
pu
t (K
bp
s)
RTT
0
2000
4000
6000
8000
10000
12000
0 1 2 3 4 5 6 7 8
Average Path Length (Hops)
Th
rou
gh
pu
t (K
bp
s)
PktPair suffers from self-interference only on multi-hop paths.

Summary of Experiment 1
• ETX performs well despite ignoring link bandwidth
• Self-interference is the main reason behind poor performance of RTT and PktPair.

Experiment 2
Approx. 61 m
Appro
x.
32
m

Median
0
100
200
300
400
500
600
HOP ETX
Metric
Me
dia
n T
CP
Th
rou
gh
pu
t (K
bp
s)

Outline
• DSR Revisited
• Link quality metrics revisited
• LQSR (Link Quality Source Routing)
• Experimental results
• Conclusion
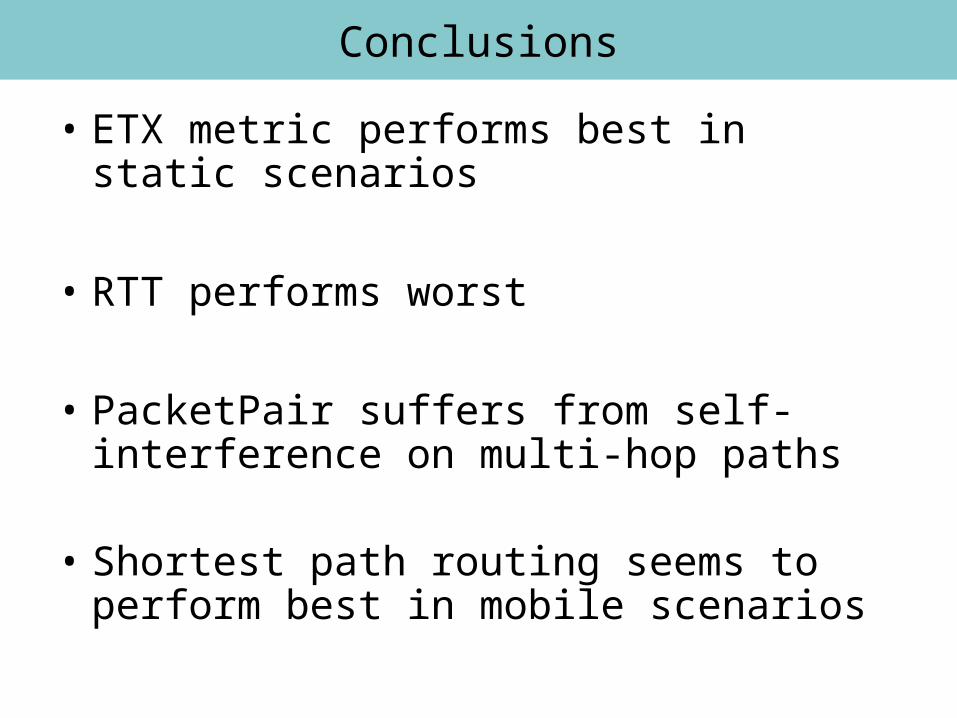
Conclusions
• ETX metric performs best in static scenarios
• RTT performs worst
• PacketPair suffers from self-interference on multi-hop paths
• Shortest path routing seems to perform best in mobile scenarios