comparison of quality of care in va and non-va settings · pdf filecomparison of quality of...
TRANSCRIPT

Evidence-based Synthesis Program Department of Veterans AffairsHealth Services Research & Development Service Evidence-based Synthesis Program
Comparison of Quality of Care in VA and Non-VA Settings: A Systematic Review
Department of Veterans AffairsHealth Services Research & Development Service
September 2010
Investigators:Principal Investigators: Paul G. Shekelle, MD, PhD Steven Asch, MD, MPH
Co-Investigators: Peter Glassman, MBBS, MSc Sierra Matula, MD Amal Trivedi, MD, MPH
Research Associate: Isomi Miake-Lye, BA
Prepared for:Department of Veterans AffairsVeterans Health AdministrationHealth Services Research & Development ServiceWashington, DC 20420
Prepared by:Evidence-based Synthesis Program (ESP) CenterWest Los Angeles VA Medical CenterLos Angeles, CAPaul G. Shekelle, MD, PhD, Director
ii
Comparison of Quality of Care in VA and Non-VA Settings Evidence-based Synthesis Program
PREFACE
HSR&D’s Evidence-based Synthesis Program (ESP) was established to provide timely and accurate syntheses of targeted healthcare topics of particular importance to VA managers and policymakers, as they work to improve the health and healthcare of Veterans. The ESP disseminates these reports throughout VA.
HSR&D provides funding for four ESP Centers and each Center has an active VA affiliation. The ESP Centers generate evidence syntheses on important clinical practice topics, and these reports help:
• develop clinical policies informed by evidence,
• the implementation of effective services to improve patient outcomes and to support VA clinical practice guidelines and performance measures, and
• set the direction for future research to address gaps in clinical knowledge.
In 2009, an ESP Coordinating Center was created to expand the capacity of HSR&D Central Office and the four ESP sites by developing and maintaining program processes. In addition, the Center established a Steering Committee comprised of HSR&D field-based investigators, VA Patient Care Services, Office of Quality and Performance, and VISN Clinical Management Officers. The Steering Committee provides program oversight and guides strategic planning, coordinates dissemination activities, and develops collaborations with VA leadership to identify new ESP topics of importance to Veterans and the VA healthcare system.
Comments on this evidence report are welcome and can be sent to Nicole Floyd, ESP Coordinating Center Program Manager, at [email protected].
Recommended citation: Asch, S, Glassman P, Matula S, Trivedi A, Miake-Lye I and Shekelle P. Comparison of Quality of Care in VA and Non-VA Settings: A Systematic Review. VA-ESP Project # 05-226; 2010.
This report is based on research conducted by the Evidence-based Synthesis Program (ESP) Center located at the West Los Angeles VA Medical Center, Los Angeles, CA funded by the Department of Veterans Affairs, Veterans Health Administration, Office of Research and Development, Health Services Research and Development. The findings and con-clusions in this document are those of the author(s) who are responsible for its contents; the findings and conclusions do not necessarily represent the views of the Department of Veterans Affairs or the United States government. Therefore, no statement in this ar-ticle should be construed as an official position of the Department of Veterans Affairs. No investigators have any affiliations or financial involvement (e.g., employment, consultan-cies, honoraria, stock ownership or options, expert testimony, grants or patents received or pending, or royalties) that conflict with material presented in the report.

iii
Comparison of Quality of Care in VA and Non-VA Settings Evidence-based Synthesis Program
TABLE OF CONTENTSExEcutivE Summary ............................................................................................................................................ iv
Background ................................................................................................................................................... ivMethods ........................................................................................................................................................ ivResults .......................................................................................................................................................... ivConclusions .................................................................................................................................................. vi
introduction .......................................................................................................................................................... 1Background .................................................................................................................................................... 1
mEthodS ................................................................................................................................................................... 1Topic Development ........................................................................................................................................ 1Search Strategy .............................................................................................................................................. 1Study Selection .............................................................................................................................................. 1Data Abstraction ............................................................................................................................................ 2Quality Assessment ....................................................................................................................................... 2Data Synthesis ............................................................................................................................................... 2Peer Review ................................................................................................................................................... 2
rESultS ..................................................................................................................................................................... 3Literature Flow .............................................................................................................................................. 3Description of Evidence ................................................................................................................................ 4Surgical Conditions ....................................................................................................................................... 4
General Surgery ........................................................................................................................................ 5Solid Organ Transplantation ..................................................................................................................... 6Vascular Surgery ....................................................................................................................................... 8Surgical Oncology .................................................................................................................................... 9Cardiac Surgery ...................................................................................................................................... 11Endocrine Surgery .................................................................................................................................. 12
Medical and Other Non-Surgical Conditions .............................................................................................. 13General .................................................................................................................................................... 13Cardiovascular ........................................................................................................................................ 15Diabetes .................................................................................................................................................. 17Hospital and Nursing Home Care ........................................................................................................... 18Mental Health ......................................................................................................................................... 19Other Studies .......................................................................................................................................... 20
Summary and diScuSSion .................................................................................................................................. 22Limitations ................................................................................................................................................... 22
Publication Bias ...................................................................................................................................... 22Study Quality .......................................................................................................................................... 22
Conclusions ................................................................................................................................................. 23Future Research ........................................................................................................................................... 25
rEfErEncES ............................................................................................................................................................ 27
figurESFigure 1 Literature Flow ................................................................................................................................ 4
appEndicESAppendix 1. Evidence Table of Surgical Studies ........................................................................................ 32Appendix 2. Evidence Table of Medical and Non-surgical Studies ............................................................ 38Appendix 3. Screener Form ......................................................................................................................... 51Appendix 4. Data Abstraction Form ............................................................................................................ 53Appendix 5. Data Abstraction Grading Guidelines ..................................................................................... 54Appendix 6. Search Strategy ....................................................................................................................... 55Appendix 7. Peer Review Comments Table ................................................................................................ 55
iv
Comparison of Quality of Care in VA and Non-VA Settings Evidence-based Synthesis Program
EXECUTIVE SUMMARY
BACKGROUNDIt remains unclear where the Veterans Health Administration (VA) finds itself in the spectrum of care currently available in the United States. The quality of care provided by the VA has been subject to debate since, and well before, the VA’s system transformation starting in the mid-90s. Media and entertainment vehicles have, rightly or wrongly, not infrequently portrayed VA care in less than optimal light, although there have been notable exceptions1. Regardless of media views, the VA has established itself as an innovative healthcare system, including implementation of its advanced electronic medical record, with broad clinical and educational missions.
The immediate objective of this project is to conduct a systematic literature review of the published literature comparing the quality of medical and surgical care provided by the VA to relevant non-VA healthcare facilities and systems.
The Key Question was:Compare and contrast studies that assess VA and non-VA quality of care for surgical, non-surgical and other medical conditions.
METHODSWe were first given a list of articles by VA Central Office that represented examples of articles addressing possible VA and non-VA comparisons. Once these were reviewed, we then completed a Medline search for similar types of articles. Between the initial list and the subsequent search, we retrieved 222 articles. These were then screened by two physicians trained in the critical analysis of literature. Articles that both agreed were to be included were then reviewed, and all data were narratively summarized. When differences in the initial assessment (inclusion vs not) occurred, the specific articles were then discussed with at least one other senior member of the review team.
RESULTSOf the 222 articles, mentioned above, 175 unique articles were identified and screened. Of these, 98 articles were initially rejected because there was no comparison of quality in VA and non-VA settings in the United States. After 22 articles were excluded because the comparisons were found to be non-contemporaneous, or had unequal or unrepresentative samples, used dissimilar or indirect measures of quality, had methodological problems, or were published before 1990 (which was used as an a priori cut off point), our first data abstraction included 55 articles. The 55 articles were categorized as either addressing surgical conditions (n=17) or medical and other non-surgical conditions (n=38).
Surgical Conditions
Ten of the seventeen articles, or more than half the available studies, came from the Patient Safety and Surgery Study, which was performed between 2001 and 2004, and grew out of collaboration between the American College of Sugeons and VA’s National Surgical Quality Improvement Program.
Of four general surgery studies, three revealed no significant differences in adjusted postoperative
v
Comparison of Quality of Care in VA and Non-VA Settings Evidence-based Synthesis Program
morbidity rates while one found significantly lower rates of postoperative morbidity in the VA setting compared with the private sector. Three of the four studies assessed risk adjusted mortality rates and of these, two found no significant difference across settings. One study found significantly higher risk adjusted rates of postoperative mortality among male patients at the VA compared with the private sector. All four of these studies were part of the Patient Safety in Surgery Study.
Of three solid organ transplant articles, two found no significant differences in patient survival when comparing VA patients with non-VA patients. Additionally, one of these found no significant difference in graft survival between these two groups. This study also included a sub-analysis of health related quality of life (HRQOL) among heart and liver transplant recipients and found no significant difference in functional status or mental component scoring, but noted a trend toward lower physical component scores among VA patients by 7 years post-transplant. One study found that compared with privately insured patients, VA patients with end-stage renal disease were both less likely to be listed for a kidney transplant and less likely to receive a transplant when listed.
Of the three vascular surgery studies, two found significantly lower risk adjusted rates of postoperative morbidity in the VA and one found no significant difference in morbidity rates. There were no significant differences in risk adjusted mortality rates throughout these three studies. Two of the three vascular surgery studies were part of the Patient Safety in Surgery Study.
Of the three studies pertaining to surgical oncology, two focused on pancreatic cancer and one focused on breast cancer. One of the pancreatic cancer studies based on the National Cancer Data Base (NCDB) found no significant difference in postoperative mortality. The other study on pancreatic cancer based on the Patient Safety in Surgery Study found increased risk adjusted postoperative rates of morbidity and mortality in VA. The breast cancer study found no significant difference in risk adjusted postoperative morbidity among female patients. Two of the three surgical oncology studies came from the Patient Safety in Surgery Study (one pancreatic cancer study, one breast cancer study).
Two articles pertained to cardiac surgery. Of these, one focused on patient perceptions of numerous aspects of patient care after coronary artery bypass grafting in VA and non-VA hospitals. This study found that, after risk adjustment, VA patients were more likely than non-VA patients to report a problem with patient care. The second article compared severity adjusted mortality rates after CABG among VA and non-VA hospitals. After adjusting for patient-level predictors and hospital volume, the study found that the odds of death were higher in VA patients than in private sector patients.
In both of the endocrine surgery studies, there were no significant differences in postoperative morbidity or adverse event rates. Both endocrine surgery studies came out of the Patient Safety in Surgery Study.
Medical and Other Non-surgical Conditions
Of 10 general comparative studies assessing use of preventive services, acute and chronic care for multiple medical acute and chronic medical conditions, changes in broad health status including risk-adjusted morality, and patient satisfaction, each showed superior performance, as measured by greater adherence to accepted processes of care, better health outcomes or improved patient ratings of care, for care delivered in the VA compared with care delivered outside the VA. The studies used
vi
Comparison of Quality of Care in VA and Non-VA Settings Evidence-based Synthesis Program
data from 1995 to 2004.
Of the 6 studies that assessed cardiovascular outcomes, 5 studies of mortality following an acute myocardial infarction or percutaneous coronary transluminal angioplasty found no clear survival differences between VA and non-VA settings and one study found greater control of blood pressure in the VA. Of the 3 studies that assessed use of processes of care following an acute myocardial infarction, all three found greater rates of evidence-based drug therapy in VA, and one study found lower use of clinically-appropriate angiography in the VA. Of note, all of these cardiovascular studies use data that are between 7 to 18 years old.
Four studies of the quality of diabetes care demonstrate a performance advantage on some measures for the VA compared with commercial managed care and other non-VA populations.
Studies of the quality of hospital and nursing home care demonstrate similar risk-adjusted mortality rates in VA facilities compared with non-VA facilities. VA hospitals had somewhat better patient safety outcomes compared with non-VA hospitals. Veterans in VA nursing homes were less likely to develop a pressure ulcer but more likely to experience functional decline compared to veterans in community nursing homes. In addition, the VA had higher use of infection control practices, but greater readmission rates and equivalent racial mortality differences.
Studies of the quality of mental health care demonstrate that the quality of antidepressant prescribing is slightly better in VA compared to private sector settings. One study of national data found VA patients with schizophrenia were more likely to receive an antipsychotic medication in the outpatient setting, but a study of data from two states found VA outpatients were less likely to receive an antipsychotic medication and psychosocial services. Among patients discharged after a hospitalization for schizophrenia, readmission and outpatient visit follow-up rates were worse in the VA, but continuity of care was better compared to the private sector.
Elderly VA patients were less likely to be prescribed potentially inappropriate medications than elderly patients in Medicare managed care plans. A study of survival following a diagnosis of lung carcinoma in Pennsylvania found worse survival for VA patients in that state. Stroke patients receiving rehabilitation in VA settings were discharged with better functional outcomes. VA patients had greater satisfaction with hearing aid fittings and somewhat greater self-reported benefit from hearing aid placement.
CONCLUSIONSOverall, the available literature suggests that the care provided in the VA compares favorably to non-VA care systems, albeit with some caveats. Studies that used accepted process of care measures and intermediate outcomes measures, such as control of blood pressure or hemoglobin A1c, for quality measurements almost always found VA performed better than non-VA comparison groups. Studies looking at risk-adjusted outcomes generally have found no differences between VA and non-VA care, with some reports of better outcomes in VA and a few reports of worse outcomes in VA, compared to non-VA care. The studies of processes of care are mostly those about medical conditions, while the studies of outcomes are mostly about surgical conditions and interventional procedures.
1
Comparison of Quality of Care in VA and Non-VA Settings Evidence-based Synthesis Program
INTRODUCTION
BACKGROUND As noted by Ashton et al, VA healthcare system transformation began in 1995, moving from a hospital-based system to a more comprehensive healthcare model with the goal of providing the best health care in America2. There have been numerous reports comparing VA health care quality with non-VA care, both scholarly and in the lay media1, 3-5. However, there has not been a systematic evaluation of the published evidence comparing care across systems. Therefore, VA Central Office asked the Evidence Synthesis Program located at the VA Greater Los Angeles Healthcare System, West Los Angeles campus to perform such a review.
METHODS
TOPIC DEVELOPMENTThis project was nominated by William Duncan, Associate Deputy Undersecretary of Health for Quality and Safety.
The final key question was:
Compare and contrast studies that assess VA and non-VA quality of care for surgical, non-surgical and other medical conditions.
SEARCH STRATEGYWe were first given a list of articles by VA Central Office that represented examples of articles addressing possible VA and non-VA comparisons. Once these were reviewed, we then completed a Medline search for similar types of articles. Between the initial list and the subsequent search, we retrieved 222 articles. These were then screened by two physicians trained in the critical analysis of literature. Articles that both agreed were to be included were then reviewed, and all data were narratively summarized. When differences in the initial assessment (inclusion vs not) occurred, the specific articles were then discussed with at least one other senior member of the review team. Because of the focus on US health care, we searched Medline only. The search strategy is listed in Appendix 6.
STUDY SELECTIONArticles were reviewed utilizing a two page screening form (see Appendix 3). Each article was reviewed by two physicians, one with a surgical background and the other specializing in internal medicine. To be included in our report, the article had to present a comparison of quality of clinical data in VA and United States (US) non-VA settings, and had to have been published no earlier than 1990. The screening form also collected basic information about the articles: whether or not the data for the comparison was sufficiently contemporaneous (within 1 to 2 years of each other); how VA and non-VA data were assembled; from what geographical area(s) VA and non-VA data were collected and analyzed; what conditions were covered in the quality assessment;

2
Comparison of Quality of Care in VA and Non-VA Settings Evidence-based Synthesis Program
what features of quality were measured (structure, process, and/or outcomes); and how similar were the specifications for the quality assessments comparing VA and non-VA samples.
DATA ABSTRACTION Data were independently abstracted using a one-page abstraction form (see Appendix 4). Data for surgically related articles were abstracted by our surgical reviewer, and for non-surgical articles the internal medicine reviewer completed the abstraction process. Once the forms were completed, all data were reviewed by the review team. The following data were abstracted from included trials: sample size for both VA and non-VA sources, years of data collection covered for both VA and non-VA sources; control variables; primary outcomes; and secondary or associated findings.
QUALITY ASSESSMENT Each article was given an overall assessment, which was based on the following criteria: time frames; samples (both VA and non-VA); quality measurements; outcomes; importance of measures; and statistical methods. Each of these factors was assigned a grade (A, B, or C) based on the data abstraction grading guidelines developed (see Appendix 5). The overall assessment was predicated on the global assessment of the article, considering the individual components, but was not an average. Thus an article that had, for example, a critical flaw in methodology would be a “C,” even if other issues were satisfactory. During this phase, or during the initial assessment or data abstraction phases, disagreements or questions about the articles or information were discussed with at least one senior member of the team in order to reach concurrence.
DATA SYNTHESISWe first classified articles as dealing with surgical or medical therapy. Within these categories, we further grouped articles according to their clinical content area, for example, one group contained medical studies about the quality of cardiovascular disease care. Within these categories, studies were still sufficiently heterogenous to preclude meta-analysis. Consequently, our synthesis is narrative.
PEER REVIEwA draft version of this report was sent to six peer reviewers, of which one responded. Her comments and our responses are presented in Appendix 7. Peer Review Comments Table.
3
Comparison of Quality of Care in VA and Non-VA Settings Evidence-based Synthesis Program
RESULTS
LITERATURE FLOwIn total, we examined 222 articles, from the “VHA Clinical Quality and Patient Safety: A review of the medical literature” and our second systematic literature search.
Of the titles identified in the review, 47 articles were rejected as duplicates. This left 175 articles to be screened.
From this initial screening, 98 articles were rejected because there was no comparison of quality in VA and US non-VA settings. Four more articles were rejected for falling before the cutoff date of 1990. Our data abstraction thus included 73 articles, 18 of which were rejected, having received a grade of C or having failed to meet the initial inclusion criteria upon further inspection.
Upon categorization, these final 55 articles were divided between surgical articles (n=17) and non-surgical/medical articles (n=38). Within the surgical category, there were 4 general surgury, 3 vascular surgery, 3 oncologic surgery, 3 solid organ transplantation, 2 cardiac surgery, and 2 endocrine articles. Within the medical category there were 10 general, 8 cardiovascular, 8 hospital care, 4 diabetes, 4 mental health care, and 4 other articles (See Figure 1).
4
Comparison of Quality of Care in VA and Non-VA Settings Evidence-based Synthesis Program
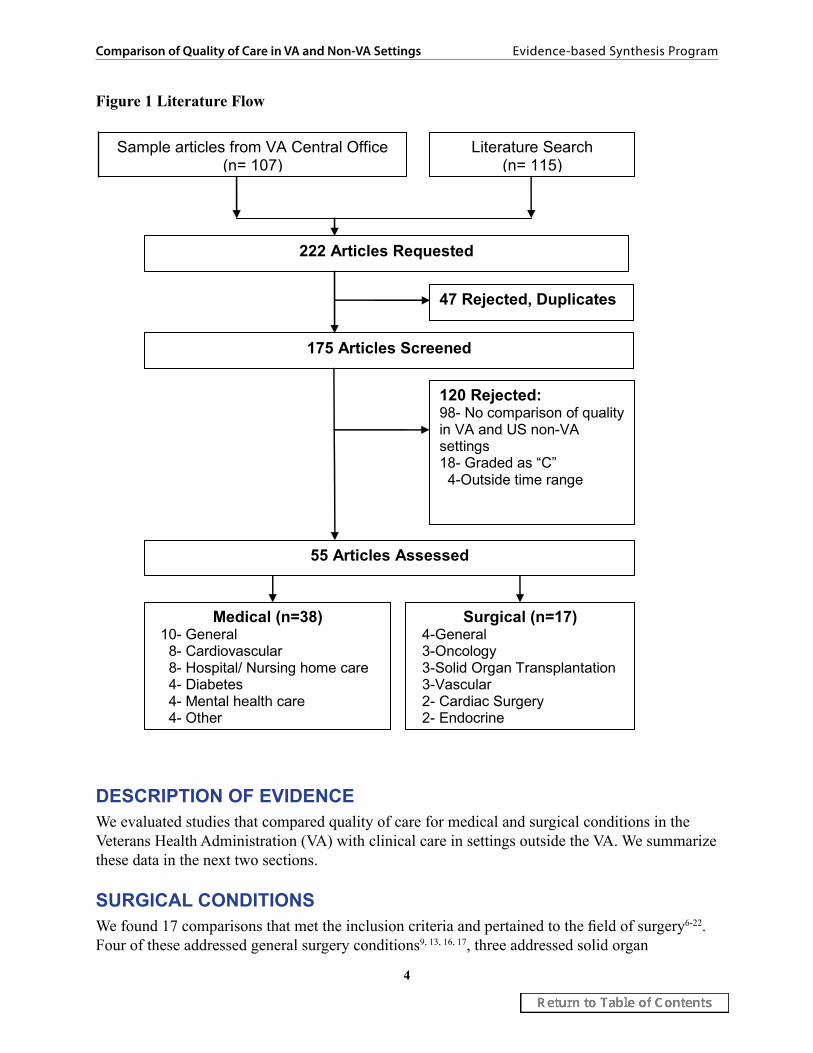
Figure 1 Literature Flow
47 Rejected, Duplicates
222 Articles Requested
175 Articles Screened
120 Rejected: 98- No comparison of quality in VA and US non-VA settings 18- Graded as “C” 4-Outside time range
55 Articles Assessed
Surgical (n=17) 4-General 3-Oncology 3-Solid Organ Transplantation 3-Vascular 2- Cardiac Surgery 2- Endocrine
Medical (n=38) 10- General 8- Cardiovascular 8- Hospital/ Nursing home care 4- Diabetes 4- Mental health care 4- Other
Sample articles from VA Central Office (n= 107)
Literature Search (n= 115)
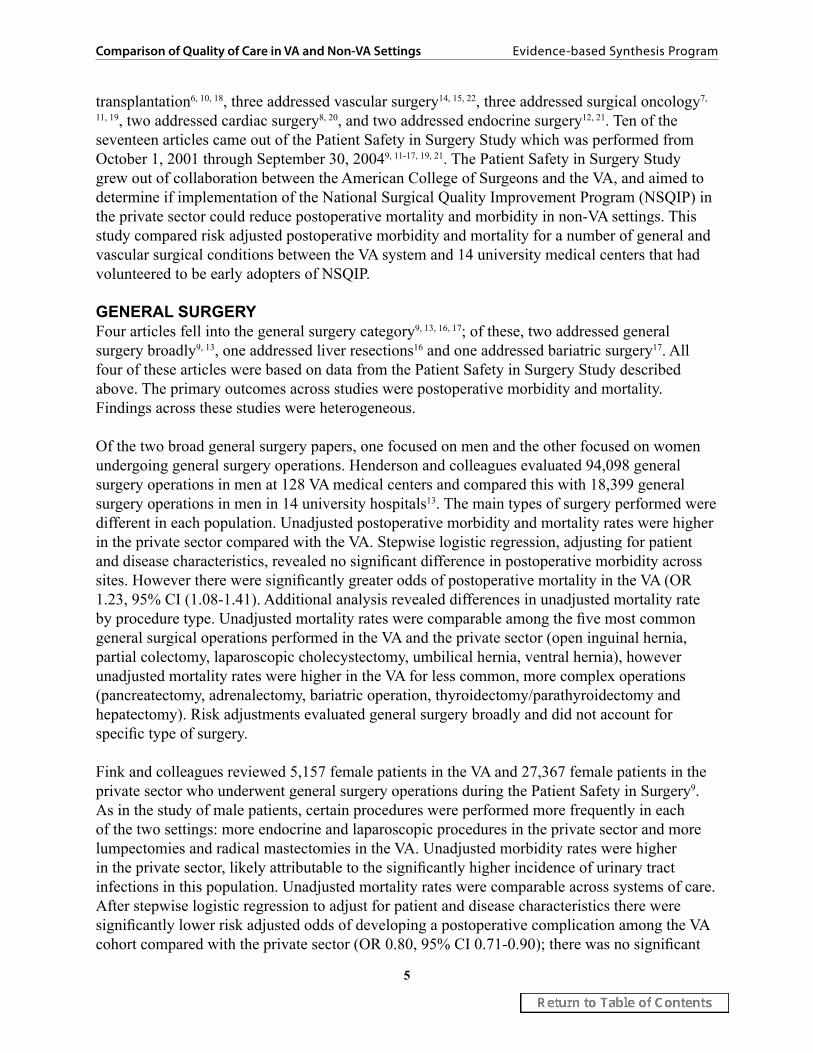
DESCRIPTION OF EVIDENCE We evaluated studies that compared quality of care for medical and surgical conditions in the Veterans Health Administration (VA) with clinical care in settings outside the VA. We summarize these data in the next two sections.
SURGICAL CONDITIONSWe found 17 comparisons that met the inclusion criteria and pertained to the field of surgery6-22. Four of these addressed general surgery conditions9, 13, 16, 17, three addressed solid organ
5
Comparison of Quality of Care in VA and Non-VA Settings Evidence-based Synthesis Program
transplantation6, 10, 18, three addressed vascular surgery14, 15, 22, three addressed surgical oncology7,
11, 19, two addressed cardiac surgery8, 20, and two addressed endocrine surgery12, 21. Ten of the seventeen articles came out of the Patient Safety in Surgery Study which was performed from October 1, 2001 through September 30, 20049, 11-17, 19, 21. The Patient Safety in Surgery Study grew out of collaboration between the American College of Surgeons and the VA, and aimed to determine if implementation of the National Surgical Quality Improvement Program (NSQIP) in the private sector could reduce postoperative mortality and morbidity in non-VA settings. This study compared risk adjusted postoperative morbidity and mortality for a number of general and vascular surgical conditions between the VA system and 14 university medical centers that had volunteered to be early adopters of NSQIP.
GENERAL SURGERYFour articles fell into the general surgery category9, 13, 16, 17; of these, two addressed general surgery broadly9, 13, one addressed liver resections16 and one addressed bariatric surgery17. All four of these articles were based on data from the Patient Safety in Surgery Study described above. The primary outcomes across studies were postoperative morbidity and mortality. Findings across these studies were heterogeneous.
Of the two broad general surgery papers, one focused on men and the other focused on women undergoing general surgery operations. Henderson and colleagues evaluated 94,098 general surgery operations in men at 128 VA medical centers and compared this with 18,399 general surgery operations in men in 14 university hospitals13. The main types of surgery performed were different in each population. Unadjusted postoperative morbidity and mortality rates were higher in the private sector compared with the VA. Stepwise logistic regression, adjusting for patient and disease characteristics, revealed no significant difference in postoperative morbidity across sites. However there were significantly greater odds of postoperative mortality in the VA (OR 1.23, 95% CI (1.08-1.41). Additional analysis revealed differences in unadjusted mortality rate by procedure type. Unadjusted mortality rates were comparable among the five most common general surgical operations performed in the VA and the private sector (open inguinal hernia, partial colectomy, laparoscopic cholecystectomy, umbilical hernia, ventral hernia), however unadjusted mortality rates were higher in the VA for less common, more complex operations (pancreatectomy, adrenalectomy, bariatric operation, thyroidectomy/parathyroidectomy and hepatectomy). Risk adjustments evaluated general surgery broadly and did not account for specific type of surgery.
Fink and colleagues reviewed 5,157 female patients in the VA and 27,367 female patients in the private sector who underwent general surgery operations during the Patient Safety in Surgery9. As in the study of male patients, certain procedures were performed more frequently in each of the two settings: more endocrine and laparoscopic procedures in the private sector and more lumpectomies and radical mastectomies in the VA. Unadjusted morbidity rates were higher in the private sector, likely attributable to the significantly higher incidence of urinary tract infections in this population. Unadjusted mortality rates were comparable across systems of care. After stepwise logistic regression to adjust for patient and disease characteristics there were significantly lower risk adjusted odds of developing a postoperative complication among the VA cohort compared with the private sector (OR 0.80, 95% CI 0.71-0.90); there was no significant
6
Comparison of Quality of Care in VA and Non-VA Settings Evidence-based Synthesis Program
difference in risk adjusted postoperative mortality among women undergoing general surgery operations. Risk adjustments evaluated general surgery broadly and did not account for specific type of surgery.
Lancaster and colleagues reviewed 237 VA and 783 private sector hepatectomies as part of the Patient Safety in Surgery Study16. Unadjusted morbidity and mortality rates were higher in the VA. After adjusting for pre-operative patient characteristics, lifestyle factors and intra-operative characteristics, morbidity and mortality rates were not significantly different between the VA and private sector university hospitals studied (morbidity 0.940, 95% CI 0.623-1.421and mortality OR 1.623, 95% CI 0.609-4.324).
Lautz and colleagues evaluated 374 patients who underwent bariatric surgery in 12 VA hospitals and 2,064 patients who underwent bariatric surgery in the 12 private sector hospitals as part of the Patient Safety in Surgery Study17. Male and female VA patients were significantly more likely to undergo an open operation, had surgeries with higher mean relative value units and were hospitalized longer than private sector patients. Unadjusted morbidity and mortality rates were comparable in women across cohorts. After risk adjustment, there were still no significant differences in postoperative morbidity among women in the VA versus private sector. Unadjusted and adjusted morbidity rates were higher among men treated at the VA compared with the private sector (adjusted OR 2.99, 95% CI 1.28-4.10). Unadjusted mortality rates were significantly higher among men treated at the VA compared with the private sector. There were too few deaths to allow for determination of risk adjusted rates.
Summary: Of four general surgery studies, three revealed no significant differences in adjusted postoperative morbidity rates while one found significantly lower rates of postoperative morbidity in the VA setting compared with the private sector. Three of the 4 studies assessed risk adjusted mortality rates and of these, two found no significant difference across settings. One study found significantly higher risk adjusted rates of postoperative mortality among male patients at the VA compared with the private sector.
SOLID ORGAN TRANSPLANTATIONThree articles addressed solid organ transplantation in VA and non-VA patients. Of these, one addressed orthotopic liver transplant only6, one addressed renal transplantation10, and one evaluated outcomes after liver, heart, renal and lung transplant18. Two studies compared survival. Of these, one evaluated mortality at one, three and five years post-OLT6, and one evaluated graft survival and patient survival after heart, lung, kidney and liver transplant18. The latter study also evaluated health related quality of life as a secondary outcome. The final study assessed differences in time to renal transplantation10.
Austin and colleagues studied 149 VA patients and 285 private sector patients who underwent orthotopic liver transplantation (OLT) at a single medical center between September 1991 and December 20006. They aimed to determine whether there was a difference in mortality after OLT in US veterans compared with non-veterans and to evaluate what, if any, factors made a difference. Veterans received their pre and post transplant care at the Portland Veterans Affairs Medical Center (PVAMC) and non-Veterans received pre and post transplant care at the Oregon
7
Comparison of Quality of Care in VA and Non-VA Settings Evidence-based Synthesis Program
Health and Science University hospital; however, all patients were transplanted in the operating rooms of the VA and received initial postoperative intensive care at the VA. The outcome of interest was mortality at one, three and five years post transplant. Veterans had increased mortality rates as assessed by Kaplan-Meier curves. After adjusting for gender, donor age, recipient age, etiology of liver disease and MELD score, hospital status was not a significant predictor of mortality RR 1.15 (95% CI 0.94-1.43). In multivariate analysis, donor age was most predictive of survival. Austin et al found no significant difference between patient groups when evaluating time spent on the waiting list between evaluation and treatment. At the time of initial evaluation, patients who were veterans had lower average serum albumin levels and a higher percentage of patients with Child’s class C liver disease suggesting that perhaps veterans were referred later in the disease course. This study was limited in its retrospective nature, and in its inability to account for cause of death or account for pre transplant comorbidities. Additionally, use of the MELD score became standard during the course of the study, and thus the patient population included across this ten year time period may not be representative of patients who are eligible for or undergo transplant today. Due to missing data, 60 patients (43 university patients and 17 veterans) were excluded from the analyses. Five year survival was significantly different between the included and excluded patients overall (50% versus 73% respectively) potentially causing a bias in the results. Finally, this study was unable to account for post transplant substance abuse.
Moore et al were interested in comparing comprehensive outcomes in VA transplant patients compared with non-VA transplant patients18. They studied all adult patients from Vanderbilt University Medical Center and the VA Tennessee Valley Healthcare System who underwent a primary liver, kidney, heart or lung transplant between 1990 and 2002. All patients received heart, liver and lung transplants at VUMC; renal transplants were performed at both centers. VA patients received up to 3 months of postoperative care at VUMC prior to transfer back to the VA setting. Groups were distinguished primarily by payer status. Primary outcomes were graft survival and patient survival. Additionally, health related quality of life (HRQOL) was assessed in a subset of patients using Karnofsky functional performance and the SF-36. A total of 380 VA patients (141 liver, 54 heart, 183 kidney, 2 lung) were compared with 1,429 non-VA patients (280 liver, 246 heart, 749 kidney, 154 lung). Due to the limited number of lung transplant recipients, comparisons of outcomes were not performed in this subgroup. Cumulative graft survival was not significantly different between the two patient populations for liver transplant (p=0.97), heart transplant (p=0.67) or renal transplant (p=0.84). Similarly, cumulative patient survival was not significantly different between the two populations for liver (p=0.94, heart (p=0.75) or renal (p=0.12) transplant patients. HRQOL was assessed in a subset of 77 liver and 70 heart transplant recipients. Overall, there were significant improvements in functional performance from pre-transplant to 2 years post-transplant ((49+2 versus 90+2; (p<0.001. However, there was no significant difference in functional performance between VA and non-VA patients from the pre to post-transplant state (p=0.065). Additionally, there was no significant difference in functional performance between VA and non-VA patients at three (p=0.50) or seven years (p=0.17) post-transplant. SF-36 mental component scores measured post-transplant were not significantly different between the two patient populations. However, physical component scales diverged after 7 years post-transplant, with VA patients reporting slightly worse physical component scale (PCS) scores compared with non-VA patients (35+2 versus 39+1, p=0.05); mental component
8
Comparison of Quality of Care in VA and Non-VA Settings Evidence-based Synthesis Program
scale scores remained similar over time (47+2 versus 49+1, p=0.29 at 7 years post transplant). This study was limited in its cross sectional nature regarding HRQOL data; in addition, the patient populations were restricted to a single transplant program, potentially limiting the generalizability of the findings. Recurrence of hepatitis C and other patient level characteristics over time could not be taken into account, thus limiting ability to interpret the meaning behind the PCS scores long term. Additionally, the article does not make clear how the subset of heart and liver transplants was selected in order to evaluate HRQOL nor is the breakdown specified of VA and non-VA patients in this subset.
Gill et al used national data from the US Renal Data System from April 1, 1995 through December 31, 2004 to compare the time to transplantation among ESRD patients either covered by VA or insured by private insurance or Medicare/Medicaid10. A total of 7,395 VA patients were compared with 144,651 privately insured patients and an additional 357,345 insured by Medicare or Medicaid. After adjusting for patient demographics, clinical characteristics and state rates of transplantation, they found that VA-covered and Medicare/Medicaid-insured patients were approximately 35% less likely to receive transplants than patients with private insurance (hazard ratio [HR] 0.65; 95% CI 0.60 to 0.70; P < 0.0001). VA patients were less likely to be placed on the wait-list (HR 0.71; 95% CI 0.67 to 0.76). VA patients who were on the wait list also received transplants less frequently than privately insured patients (HR 0.89; 95% CI 0.82 to 0.96). VA patients with supplemental private insurance had the same likelihood of transplantation as non-VA patients with private insurance. Study limitations included unmeasured variables and inability to account for VA covered patients who had access to transplantation outside of the VA.
Summary: Of three solid organ transplant articles, two found no significant differences in patient survival when comparing VA patients with non-VA patients. Additionally, one of these found no significant difference in graft survival between these two groups. This study also included a sub-analysis of health related quality of life (HRQOL) among heart and liver transplant recipients and found no significant difference in functional status or mental component scoring, but noted a trend toward lower physical component scores among VA patients by 7 years post-transplant. One study found that compared with privately insured patients, VA patients with end-stage renal disease were both less likely to be listed for a kidney transplant and less likely to receive a transplant when listed.
VASCULAR SURGERYThree studies compared quality of care in the VA and the private sector in vascular surgery14,
15, 22. Two were from the Patient Safety in Surgery Study looking at male and female patients respectively14, 15. Hutter and colleagues evaluated 30,058 operations in men in the VA and 5174 in the private sector as part of the Patient Safety in Surgery Study14. The two populations had significantly different preoperative risk profiles. There were significantly different types and frequencies of vascular surgeries in the groups; for example, there were more carotid endarterectomies in the VA and more open abdominal aortic aneurysm repairs in the private sector. Unadjusted postoperative morbidity and mortality rates were higher in the private sector. After stepwise logistic regression adjusting for preoperative and intraoperative variables there was a significantly lower odds of perioperative complications in the VA (OR 0.84, 95% CI 0.78-0.92). There was no significant difference in risk adjusted mortality between the VA and private

9
Comparison of Quality of Care in VA and Non-VA Settings Evidence-based Synthesis Program
sector (p=0.195), although it was not clear how the relevant indicator variable for system of care was used in the model.
Johnson and colleagues used data from the Patient Safety in Surgery Study to compare 458 female VA patients and 3,535 non-VA female patients who underwent vascular surgery15. The two populations differed across many categories in assessing preoperative risk profile with private sector patients having a greater incidence of various preoperative morbidities. Private sector vascular operations were more likely to be emergencies. Types and frequencies of vascular surgery operations differed considerably across hospital type. For example VA patients had carotid endarterectomies, saphenous vein ligation and arteriovenous fistulas more commonly than private sector patients; private sector patients underwent above the knee amputations, femoral popliteal bypass with artificial graft material, femorotibial bypass and open abdominal aortic aneurysm more frequently than VA patients. Unadjusted postoperative morbidity and mortality were higher in the private sector. After stepwise logistic regression adjusting for patient and intra-operative characteristics, there was no significant difference in 30 day mortality rates among VA and PS female vascular patients; there was a significantly lower odds of experiencing a postoperative complication among VA patients compared with private sector patients (OR 0.60, 05%CI 0.44-0.81). Both the Hutter and Johnson studies were unable to account for endovascular procedures performed outside the operating room (such as in the radiology or cardiology suites).
Weiss and colleagues evaluated perioperative mortality, stroke and cardiac complications in patients undergoing carotid endarterectomy in Connecticut from October 1997-September 22. VA data was derived from the Connecticut VA database that comprised data submitted to the VA-NSQIP. Private sector data was derived from the Connecticut Hospital Association database. They evaluated 140 carotid endarterectomies in the VA setting and 6,949 CEAs in the private sector. Based on a modified Charlson comorbidity score, patients in the VA had higher comorbidities than patients in the private sector. Unadjusted rates of mortality, stroke and cardiac complications were higher in the VA, though these differences were not significant. After adjusting for patient and disease characteristics, there were no significant differences in postoperative mortality, stroke or rate of cardiac complications. This study was limited by the small sample size and narrow geographic region and thus may not be generalizable to other VA or private sector settings. Additionally, the data sources were different for each cohort with VA data taken from NSQIP which includes chart abstraction while private sector data were derived from inpatient registries.
Summary: Of the three vascular surgery studies, two found significantly lower risk adjusted rates of postoperative morbidity in the VA and one found no significant difference in morbidity rates. There were no significant differences in risk adjusted mortality rates throughout these three studies.
SURGICAL ONCOLOGYOf the three articles on surgical oncology7, 11, 19, two focused on pancreatic cancer7, 11 and one focused on breast cancer19. The pancreatic cancer papers were derived from two data sources. Bilimoria and colleagues used the National Cancer Data Base (NCDB) to evaluate 513 VA patients, 12,576 academic hospital patients and 18,299 community hospital patients who underwent treatment for stage I and II pancreatic cancer from 1985-20047. The cohorts differed significantly in the distributions of age, gender, race, disease stage, income, insurance and

10
Comparison of Quality of Care in VA and Non-VA Settings Evidence-based Synthesis Program
Charlson comorbidity score. The outcomes assessed included 60 day and 3 year mortality, as well as stage appropriate treatment including receipt of neoadjuvant therapy and resection. After adjusting for patient, surgical, disease and hospital characteristics, they found that mortality rates were comparable between the VA, academic and community hospital settings for resection of stage I and II pancreatic cancer. After risk adjustment, there was no difference in use of surgery or adjuvant chemotherapy between VA and academic hospitals (p=0.54), however VA hospitals were significantly more likely to use surgery and adjuvant chemotherapy than community hospitals (p<0.001). The use of NCDB only accounts for hospitals accredited by the American College of Surgeons Commission on Cancer thus there is a potential selection bias; additionally, this limits the generalizability of the findings to participating centers. Comorbidity data was only available through the NCDB starting in 2003, thus risk adjustment on patient characteristics was limited to the tail end of the study period. Finally, the reference group in the analyses was the VA which was also the smallest sample size.
The second article on pancreatic cancer was by Glasgow and colleagues; they used the Patient Safety in Surgery Study to compare postoperative morbidity and mortality after pancreatectomy for pancreatic cancer at 83 VA hospitals and 14 private sector hospitals11. Three hundred and seventy seven VA patients and 692 private sector patients were included. There were considerable differences in preoperative comorbidity profiles across cohorts. VA patients were less likely to be admitted from home and more likely to receive a blood transfusion intraoperatively. Using stepwise logistic regression to adjust for case mix differences, patient characteristics and intra-operative variables, they found higher rates of both 30 day postoperative morbidity (OR 1.58, 95% CI 1.08-2.31) and mortality (OR 2.53, 95% CI 1.02-2.38) in the VA compared with the private sector. These findings persisted after stratifying analyses by Whipple procedure or pancreaticoduodenectomy.
The final article pertaining to surgical oncology was done by Neumayer and colleagues as part of the Patient Safety in Surgery Study to compare postoperative morbidity from breast cancer surgery in the VA and private sector19. There were 644 VA patients and 3,179 private sector patients identified. The majority of the patients were female (n=3,634) and results were stratified by gender. Both male and female VA patients had more preoperative comorbidities, higher rates of mastectomy and higher unadjusted complication rates than their private sector counterparts. Stepwise logistic regression was done in the female cohort, adjusting for patient factors, disease characteristics, surgeon traits and type of surgery. There was no significant difference in risk adjusted 30 day morbidity between female patients in the VA and private sector (OR 1.40, 95% CI 0.89-2.20). Risk adjusted outcomes were not reported for the male cohort of breast cancer patients.
Summary: Of the three studies pertaining to surgical oncology, two focused on pancreatic cancer and one focused on breast cancer. One of the pancreatic cancer studies based on the National Cancer Data Base (NCDB) found no significant difference in postoperative mortality. The other study on pancreatic cancer based on the Patient Safety in Surgery Study found increased risk adjusted postoperative rates of morbidity and mortality in VA. The breast cancer study found no significant difference in risk adjusted postoperative morbidity among female patients. Two of the three surgical oncology studies came from the Patient Safety in Surgery Study (one pancreatic cancer study, one breast cancer study).
11
Comparison of Quality of Care in VA and Non-VA Settings Evidence-based Synthesis Program
CARDIAC SURGERYTwo articles pertained to cardiac surgery8, 20. Of these, one focused on patient perceptions of numerous aspects of patient care after coronary artery bypass grafting in VA and non-VA hospitals8. The second article compared severity adjusted mortality rates after CABG among VA and non-VA hospitals20. Feria et al compared perceptions of aspects of patient care among male patients undergoing coronary artery bypass graft (CABG) in both VA and non-VA settings between 1995 and 19988. The domains of patient care that were examined included respect for patient preferences, emotional support, patient education and communication, coordination of care, concern for physical comfort, family participation, transition to discharge, access, and courtesy. The VA sample consisted of 808 patients who underwent CABG at 43 VA hospitals. Perceptions were evaluated in postoperative surveys collected through the VA National Performance Feedback Center. The non-VA sample consisted of 2271 patients who underwent CABG at 102 non-VA hospitals. Data were extracted from routine postoperative surveys by the Picker Institute; hospitals were included only if they had contracted with the Picker Institute. After controlling for age, race, self-reported health status, and diagnosis related group, VA patients were more likely than non-VA patients to note a problem with patient care in 8 of the 9 dimensions with the exception of transition to discharge (p<0.001). Adjusted differences in the percentage of questions for which VA patients reported a problem relative to non-VA patients were significant in these 8 domains, including access (3.2, 95% CI 1.5-4.8), coordination of care (4.8, 95% CI 3.0-6.6), courtesy (2,9, 95% CI 1.4-4.5), patient education and information (7.1, 95% CI 4.4-9.8), emotional support (5.5, 95% CI 2.7-8.3), family participation (5.5, 95% CI 2.3-8.7), concern for physical comfort and(3.9, 95% CI 2.3-5.5) respect for patient preferences (6.2, 95% CI 3.6-8.7). A sub-analysis limited to teaching hospital settings found that VA patients remained more likely to note a problem with care in 5 dimensions including coordination of care, courtesy, patient education and information, emotional support and concern for physical comfort. Adjusted differences in percentage of questions for which VA patients reported a problem relative to non-VA patients were significant across 7 of the 9 dimensions of care including access (2.7, 95% CI 0.4-5.3), coordination of care (4.1, 95% CI 1.3-6.9), courtesy (2,3, 95% CI 0.5-4.2), patient education and information (6.0, 95% CI 2.9-9.1), emotional support (4.0 95% CI 0.9-7.1), concern for physical comfort and(3.0, 95% CI 1.2-4.8) respect for patient preferences (5.1, 95% CI 2.2-8.0). Limitations to this study included the many unmeasured variables, such as socioeconomic status, education level, literacy, patient autonomy in selecting providers, type and severity of comorbidities, emergency or elective surgery and hospital size and location. The non-VA sample was limited to hospitals contracting with the Picker Institute which accounted for only about 9% of US non-VA hospitals; the overall analysis was limited to a male population. Given these issues, the results may not be generalizable.
Rosenthal et al compared severity adjusted mortality after CABG among VA hospitals and private sector in two geographic regions between October 1993 and December 199620. They studied 19,266 patients from 43 VA hospitals using data from the VA Continuous Improvement in Cardiac Surgery Program. An additional 44,247 patients from 32 New York state hospitals were studied using data from the New York State Cardiac Surgery Reporting System and 9,696 patients from 10 hospitals in the northeast Ohio were studied using data from the Cleveland

12
Comparison of Quality of Care in VA and Non-VA Settings Evidence-based Synthesis Program
Health Quality Choice. Each of these well established data sources contains slightly different information pertaining to patient and disease related traits; the VA CICSP contains about 90 components; the Cleveland Health Quality Choice collects about 250 items and the NY State Cardiac Surgery Reporting System collects data on 100 elements. VA patients were more likely to have congestive heart failure, chronic obstructive pulmonary disease, cerebrovascular disease, peripheral vascular disease and diabetes requiring medication than private sector patients. After adjusting for patient-level predictors and hospital volume, the study found that the odds of death were higher in VA patients than in private sector patients (OR, 1.34; 95% CI, 1.11-1.63; P <0.001). When comparing VA patients with those from NY State hospitals, a similar difference was found. However the comparison between VA and Northeast Ohio hospitals did not find a statistically significant difference in mortality rates. After stratifying by hospital volume, the odds of death among hospitals that performed 500 to 1000 CABG procedures annually were higher in VA hospitals than in private hospitals (OR 1.50, 95% CI 1.16-1.92, p=0.002) though this was not noted for lower CABG volumes (i.e., < 500) Limitations of this study included dependence on administrative data, unmeasured variable bias, potential systematic differences in data collection by the three data repositories used and geographic limitations to comparison groups potentially limiting generalizability of the findings. Additionally, the study period of 1993 to1996 may not represent current outcomes or performance.
Summary: Two articles pertained to cardiac surgery. Of these, one focused on patient perceptions of numerous aspects of patient care after coronary artery bypass grafting in VA and non-VA hospitals. This study found that, after risk adjustment, VA patients were more likely than non-VA patients to report a problem with patient care. The second article compared severity adjusted mortality rates after CABG among VA and non-VA hospitals. After adjusting for patient-level predictors and hospital volume, the study found that the odds of death were higher in VA patients than in private sector patients.
ENDOCRINE SURGERYTwo articles addressed issues in endocrine surgery12, 21. Each of these was from the Patient Safety in Surgery Study. One looked at 30 day postoperative morbidity and mortality after adrenalectomy21, the other looked at the same outcomes after thyroidectomy or parathyroidectomy12. Turrentine and colleagues evaluated 178 patients in 81 VA hospitals and 371 patients in 14 private sector hospitals who underwent adrenalectomy21. VA patients were more likely to be older, male and to have greater preoperative risk profiles. VA operations were less likely to be laparoscopic. Unadjusted morbidity and mortality rates were higher in the VA compared with the private sector, however after adjusting for patient characteristics (including demographics, comorbidities, lab values), provider characteristics and wound class, there was no significant difference in postoperative morbidity among VA patients compared with private sector patients (OR 1.55, 95% CI 0.49-1.36). The mortality rate was too low for adjustment.
Hall and colleagues used the Patient Safety in Surgery Study to evaluate 2,814 VA patients and 4,268 patients in the private sector who underwent thyroidectomy or parathyroidectomy12. There were significantly different distributions of types of surgery at different sites with proportionally more parathyroid operations done at the VA. Unadjusted morbidity and mortality rates were significantly higher in the VA. Because the event rates for morbidity and mortality were very

13
Comparison of Quality of Care in VA and Non-VA Settings Evidence-based Synthesis Program
low, a combined variable was built for an outcome of ‘any adverse event’. Stepwise logistic regression evaluated adverse event rates, accounting for disease type, surgical specialty and patient characteristics. Risk adjusted adverse event rates did not differ significantly across sites (OR 1.25, 95% CI 0.87-1.78).
Summary: In both of the endocrine studies, there were no significant differences in postoperative morbidity or adverse event rates.
MEDICAL AND OTHER NON-SURGICAL CONDITIONSWe identified 38 studies that compared quality of care for medical or other non-surgical conditions in the VA with clinical care in settings outside the VA23-54 26, 55-57 25, 27, 58-61. Of these, 10 studies (classified into a “general” category) assessed primary preventive services, multiple medical conditions, health status (including risk-adjusted mortality), or patient satisfaction 23, 28-30,
32, 40-42, 45, 46; 8 studies assessed cardiovascular conditions24, 34-36, 38, 47-49; 4 studies assessed diabetes31,
39, 50, 51; 8 studies assessed hospital and nursing home care33, 37, 43, 44, 53, 54, 60, 61; 4 studies assessed mental health care26, 55-57; and 4 studies assessed other conditions25, 27, 58, 59.
GENERAL We identified 3 studies of preventive services and all found substantially higher rates of influenza and pneumococcal vaccination for the elderly in the VA compared to samples drawn from outside the VA28, 30, 32. These studies rely on self-reported survey data from the Medicare Current Beneficiary Survey (MCBS) and the Behavioral Risk Factor Surveillance System (BRFSS). The MCBS, sponsored by the Centers for Medicare and Medicaid Services, is a survey of the health status, health care utilization, and demographic characteristics of a nationally-representative sample of aged, disabled, or institutionalized Medicare beneficiaries. The BRFSS, sponsored by the Centers for Disease Control and Prevention, is an annual state-based system of health surveys that collects information on the health risk behaviors, preventive health practices, and health care access of a nationally representative sample of nearly 350,000 adults.
Keyhani et al. used data from the 2000 to 2003 MCBS to examine use of pneumococcal and influenza vaccination and serum cholesterol screening among veterans age 65 and older using the VA exclusively compared to veterans age 65 and older using the Medicare fee-for-service and the Medicare managed care programs32. In this study, veterans using the VA reported 10% greater use of influenza vaccination (P< 0.05), 14% greater use of pneumococcal vaccination (P< 0.01), and a non-significant 6% greater use of serum cholesterol screening (P= 0.1), than did veterans receiving care through Medicare HMOs. Veterans receiving care through the Medicare fee-for-service program reported lower use of all three of these preventive services compared to veterans using the VA.
Jha et al. also assessed rates of vaccination using quality of care data abstracted from VA medical records among persons 65 and older in the VA compared to a similar age group of community-dwelling persons responding to the BRFSS30. Influenza and pneumonia vaccination rates were significantly greater in the VA compared to those reported in the BRFSS. In 2003, the absolute differences between the VA and the community based sample were approximately 10 percentage
14
Comparison of Quality of Care in VA and Non-VA Settings Evidence-based Synthesis Program
points for influenza vaccination and 30 percentage points for pneumococcal vaccination. The study was limited by non-equivalent methods of assessment of vaccination; chart review was used in the VA sample and self-report was used in the non-VA sample.
Finally, Chi et al used data from the 2003 BRFSS to assess influenza and pneumonia vaccination rates for veterans using the VA, veterans not using the VA, and non-veterans28. They found that for both influenza and pneumococcal vaccination, veterans using the VA had higher vaccination rates than both veterans not using the VA and non-veterans. Compared to veterans not using the VA, veterans using the VA had an 8 percentage point greater adjusted rate of receiving an influenza vaccination (72% vs. 80%, P < 0.001)) and a 17 percentage point greater rate of receiving pneumococcal vaccination (64% vs. 81%, P < 0.001)
We identified 3 studies that compared quality of care for multiple acute and chronic medical conditions23, 29, 40. Jha et al. compared quality of care in the VA and Medicare fee-for-service using 13 equivalent process of care measures29. The study assessed care for patients with diabetes, acute myocardial infarction, and congestive heart failure using data from the VA’s External Peer Review Program (EPRP), a previously published study of Medicare quality, and the Behavioral Risk Factor Surveillance System. The VA had statistically significant greater performance rates than the Medicare fee-for-service program on all 11 similar indicators from 1997 to 1999 and of 12 of 13 indicators in 2000. The exception was eye exams for patients with diabetes. In 2000, the VA equaled or exceeded 90% on 8 of 13 indicators while Medicare’s highest performance on any indicator was 84%.
Asch et al. assessed clinical performance on over 300 process of care indicators in a sample of 596 VA patients in 2 VISNs and a random sample of 992 adults from 12 communities that were selected to be representative of non-rural communities in the United States23. The authors found that, overall, VA patients were more likely than patients in the national sample to receive the care specified by the indicators (67% vs. 51%; difference, 16 percentage points [CI, 14 to 18 percentage points]). The VA outperformed the non-VA sample for both chronic care (72% vs. 59%; difference, 13 percentage points [CI, 10 to 17 percentage points]) and preventive care (64% vs. 44%; difference, 20 percentage points [CI, 12 to 28 percentage points]), but not for acute care. The biggest difference was in performance measures targeted by the VA (adjusted scores, 67% vs. 43%; difference, 24 percentage points [CI, 21 to 26 percentage points]).
Finally, Ross et al. compared self-reported use of 17 preventive services for cancer prevention, cardiovascular risk reduction, diabetes mellitus management, and infectious disease prevention among insured adults receiving and not receiving care in the VA40. The data were derived from the 2000 and 2004 BRFSS. The study found that in 2000, persons receiving VAMC care were more likely to receive 6 of the 17 services; in 2004, persons receiving VAMC care reported greater use of 12 of the 17 services. In 2004, the performance advantage for the VA among these 12 services ranged from 10% greater use of cholesterol screening to 40% greater use of colorectal cancer screening. In 2004, there were no services for which rates of use were significantly greater for insured populations outside the VA than for patients using the VA.
We identified 3 studies that assessed changes in risk adjusted mortality and health status for
15
Comparison of Quality of Care in VA and Non-VA Settings Evidence-based Synthesis Program
elderly VA patients compared to elderly patients enrolled in Medicare Advantage (MA) plans41,
42, 46. Selim et al. surveyed a cohort of VA and MA enrollees at baseline and then 2 years later using the Short Form 36, a validated measure of health status42. They also linked these surveys to the death master file to assess status. In analyses adjusting for demographic characteristics, clinical conditions, and baseline health status, MA enrollees had a greater risk of 2 year mortality compared to VA patients (9.2% vs. 7.5% HR 1.363 (95%CI 1.275-1.458). The adjusted probability of being alive with the same or better physical health after 2 years was similar in both systems. However, the VA cohort had a slightly higher adjusted probability of being alive with the same or better mental health score at 2 years (71.8% in the VA vs. 70.1% in MA). Using similar methods, another study by these authors extended the analysis to an approximately five year time frame, with similar results41. They found that risk-adjusted mortality rates over an approximately five year period was 26.0% for male VA patients and 28.8% for male Medicare Advantage patients (HR 1.404; 95% CI 1.383–1.426). Among female patients, the unadjusted mortality rates were 20.2% for the VA and 23.4% for the Medicare Advantage program (HR 1.244; 95%CI 1.168–1.324). In a separate analysis, the adjusted rate of 3 year mortality was higher for MA enrollees eligible for Medicaid than in VA enrollees eligible for Medicaid (HR, 1.260 [95% CI, 1.044–1.520])46.
Harada et al. examined patient satisfaction with outpatient care among VA users compared to non-users in southern California and southern Nevada45. VA users were 2 to 8 times more satisfied than VA non-users on 5 of 10 measures of satisfaction. VA users were less satisfied than non-VA users on one measure: the number of days waited for an appointment.
Summary: Of 10 general comparative studies assessing use of preventive services, acute and chronic care for multiple medical acute and chronic medical conditions, changes in broad health status including risk-adjusted morality, and patient satisfaction, each showed superior performance, as measured by greater adherence to accepted processes of care, better health outcomes or improved patient ratings of care, for care delivered in the VA compared with care delivered outside the VA. The studies used data from 1995 to 2004.
CARDIOVASCULARWe identified 8 studies that assessed quality of care for cardiovascular conditions24, 34-36, 38,
47-49. Three studies by Petersen et al. assessed risk-adjusted mortality rates, use of clinically-appropriate coronary angiography, and receipt of effective cardiovascular medications following an acute myocardial infarction among male enrollees in the Medicare fee-for-service program compared to elderly male veterans treated in VA facilities during 1994 and 199535, 47. The authors studied 19,305 male Medicare beneficiaries hospitalized in 1530 nonfederal acute care hospitals for myocardial infarction and 1665 elderly male veterans with myocardial infarction who were treated in 81 VA medical centers. In analyses adjusting for demographic and clinical characteristics, the authors found no difference in mortality for Medicare patients compared with the VA at 30 days (OR 0.94, 95% CI 0.82-1.07) and at one year (OR 0.94, 95% CI 0.84-1.05). Patients in the VA were less likely to receive angiography when clinically needed (43.9 percent vs. 51.0 percent; odds ratio, 0.75; 95% CI, 0.57 to 0.96). After controlling for the availability of on-site cardiac procedures, there was no difference in the rate of angiography36.
16
Comparison of Quality of Care in VA and Non-VA Settings Evidence-based Synthesis Program
Of the patients who survived their hospitalization, more VA patients than Medicare patients received beta-blockers (49.7 percent vs. 41.6 percent, P<0.001), angiotensin-converting-enzyme inhibitors (44.6 percent vs. 32.5 percent, P<0.001), or aspirin (77.2 percent vs. 68.6 percent, P<0.001) at discharge. Among a subset of patients deemed to be ideal recipients of these medications, VA patients were more likely than Medicare patients to undergo thrombolytic therapy at arrival (OR 1.40 [1.05, 1.74]) or to receive ACE inhibitors (OR 1.67 [1.12, 2.45]) or aspirin (OR 2.32 [1.81, 3.01]) at discharge and equally likely to receive beta-blockers (OR 1.09 [1.03, 1.40]) at discharge47.
Landrum et al. studied mortality following acute myocardial infarction for elderly male veterans hospitalized in the VA and a matched set of male Medicare beneficiaries treated in non-VA hospitals between 1996 and 199934. The study found that in 1999 there were no significant differences in adjusted 30 day and one year mortality following myocardial infarction between the VA and Medicare. However, in earlier years of the study (1997 and 1998) there were higher adjusted mortality rates in the VA compared to Medicare.
Ritchie et al. compared 10 and 30 day mortality rates and use of cardiac bypass surgery among patients receiving percutaneous coronary angioplasties in a national sample of VA medical centers and a sample of private sector hospitals in the state of Washington48. In this study, mortality and bypass surgery rates were largely similar for patients treated in the VA and private sector.
Wright et al. examined mortality rates following an acute myocardial infarction for Medicare-eligible VA-users initially admitted to a VA medical center compared with VA users initially admitted to a Medicare-financed hospital49. There were no significant differences in 30 day and 1 year mortality rates for VA users initially admitted to VA medical centers compared to Medicare hospitals. Another study by Bansal et al. of quality of care for acute myocardial infarction compared use of aspirin, beta-blockers, ace-inhibitors, heparin, and other specified anti-thrombotic agents among patients with an acute myocardial infraction in the Little Rock VA (n=117) compared to patients with acute myocardial infarction in a national sample derived from the National Registry of Myocardial Infarction 24. The study found higher use of all of these agents in patients at the Little Rock VA compared to those obtaining care elsewhere in Arkansas and to those in the national sample.
Finally, Rehman et al. studied rates of blood pressure control in VA compared to non-VA setting using data from the National Health and Nutrition Examination Survey (NHANES) from 1999 to 200038. The NHANES is a survey of a nationally-representative sample of 5000 persons that is administered by the Centers for Disease Control and Prevention. The survey combines detailed demographic, socioeconomic, nutrition, and health-related questions with a physical examination and laboratory testing by trained medical personnel. The authors found that while blood pressure control to below 140/90 mmHg was comparable among white hypertensive men at VA (55.6%) and non-VA (54.2%) settings (P=.12), blood pressure control was higher among African American hypertensive men at VA (49.4%) compared with non-VA (44.0%) settings (P< 0.01), even after controlling for age, numerous co-morbid conditions, and rural-urban classification.
17
Comparison of Quality of Care in VA and Non-VA Settings Evidence-based Synthesis Program
Summary: Of the 6 studies that assessed cardiovascular outcomes, 5 studies of mortality following an acute myocardial infarction or percutaneous coronary transluminal angioplasty found no clear survival differences between VA and non-VA settings and one study found greater control of blood pressure in the VA. Of the 3 studies that assessed use of processes of care following an acute myocardial infarction, all three found greater rates of evidence-based drug therapy in VA, and one study found lower use of clinically-appropriate angiography in the VA. Of note, all of these cardiovascular studies use data that are between 7 to 18 years old. DIABETESWe identified 4 studies that focused exclusively on comparing quality of care for diabetes in the VA and outside the VA31, 39, 50, 51. Kerr et al. compared clinical performance on 7 diabetes care processes, 3 diabetes intermediate outcomes, and 4 measure of patient satisfaction in 5 VA medical centers and in 8 commercial managed care organizations in matched geographic regions31. The study sample included 1285 patients in the VA and 6920 patients in commercial managed care plans. The VA outperformed commercial managed care plans on all measures of care processes. Intermediate outcome of blood pressure control was comparable between the two cohorts; however, the VA cohort had a significantly greater percentage of patients with tight blood sugar and cholesterol control. Patients reported similar overall satisfaction in the two cohorts, though there was significantly greater satisfaction with diabetes care in the VA.
Reiber et al. assessed use of preventive services among veterans with self-reported diabetes using the VA compared with diabetic veterans and non-veterans receiving care outside the VA39. The study sample included 535 veterans using VA care, 1848 veterans using non VA care and 9055 nonveterans responding to the 2000 BRFSS. The study found that veterans who used the VA had higher rates of foot exams, diabetes education, and sigmoidoscopy and a lower rate of a1c testing compared to veterans who did not use the VA. There were non-significant differences between these two groups in the receipt of eye exams, blood pressure measurements, cholesterol testing and fecal occult blood testing.
Nelson also examined 2000 BRFSS data and compared use of preventive services among VA enrollees with diabetes compared to persons with diabetes with other sources of insurance coverage50. The authors found that persons who received care through the VA were more likely to report taking a diabetes education class than those covered by private insurance The adjusted odds ratio for receipt of diabetes education among persons receiving all of their care through the VA was 3.5 (95% CI 1.6-7.8).
Piette studied satisfaction with care among patient with diabetes treated in 4 VA outpatient clinics compared with patients with diabetes receiving care in a 2 county-funded clinics51. The authors found that VA patients were more satisfied than were county patients overall and with 5 of 6 dimensions of their care. These dimensions include access, technical quality, communication, interpersonal care, and quality of outcomes.
Summary: Four studies of the quality of diabetes care demonstrate a performance advantage on some measures for the VA compared with commercial managed care and other non-VA populations.
18
Comparison of Quality of Care in VA and Non-VA Settings Evidence-based Synthesis Program
HOSPITAL AND NURSING HOME CAREWe identified 8 studies that compared the quality of hospital care in the VA with care outside the VA33, 37, 43, 44, 53, 54, 60, 61.
Polsky et al. examined racial differences in 30 day mortality for patients in VA and non-VA hospitals who were hospitalized for one of six conditions (pneumonia, congestive heart failure, gastrointestinal bleeding, hip fracture, stroke, or acute myocardial infarction)37. The data were derived from hospital discharge abstracts from California and Pennsylvania. The study found that among patients less than age 65 years, black patients in VA and non-VA hospitals had similar 30 day mortality rates to whites for gastrointestinal bleeding, hip fracture, and stroke. Among patients 65 years and older, blacks patients in VA and non-VA hospitals had significantly lower odds of 30 day mortality compared to white patients for all conditions except pneumonia. Racial mortality differences for these conditions were similar in VA and non-VA settings.
Weeks et al. compared readmission rates for hospitalized VA enrollees who received care in a VA hospital compared with rates for VA enrollees who were hospitalized in non-VA hospitals43. The study included 111,854 patients residing in New York State. Among persons less than age 65, there were no significant differences in 30 day readmission rates for veterans admitted to a VA hospital compared with veterans initially admitted to a non-VA hospital. However, for veterans 65 and older, persons initially admitted to a VA hospital had a significantly higher odds of readmission within 30 days than persons not initially admitted to a VA hospital (OR 2.79, 95%CI 1.4-5.6). In another similar study, Weeks et al. assessed 15 indicators of patient safety for inpatient care provided in VA hospitals compared to care provided outside the VA system44. The study found lower risk-adjusted rates of decubitus ulcer, postoperative sepsis, nosocomial infection, postoperative respiratory failure, and postoperative metabolic derangement for VA enrollees hospitalized in VA hospitals compared with rates among VA enrollees treated in hospitals outside the VA. The VA performed worse on one patient safety indicator: mortality rates for low-risk diagnoses. For 9 of the 15 patient safety indicators, there were no significant differences in rates between VA and non-VA hospitals.
Krein et al. assessed the use of central venous catheter bloodstream infection prevention practices in VA and non-VA hospitals using data from survey of a random sample of infection control coordinators in 516 hospitals33. The study found that compared with non-VA hospitals, VA hospitals reported greater use of maximal sterile barrier precautions, chlorhexidine gluconate for insertion site antisepsis, and a composite approach using multiple safety practices.
Three similar studies compared hospital mortality rates in a single VA medical center with moratlity rates in different samples of private sector hospitals53, 54, 61. Gordon et al. found no significant difference in adjusted mortality rates for the VA medical center compared to a national sample of non-VA hospitals53. The actual in-hospital mortality rate was 4.0%, compared with the predicted mortality rate based on the private sector sample of 4.4% (95%CI 4.0% – 4.9%)
Rosenthal also found that risk-adjusted in-hospital mortality was similar in the VA medical center compared with private sector hospitals in the same metropolitan area (OR 1.07 95%CI 0.74-1.54)60. Mortality among patients admitted to an intensive care unit was also similar in the VA medical center compared with hospitals in the same metropolitan area61.

19
Comparison of Quality of Care in VA and Non-VA Settings Evidence-based Synthesis Program
Finally, Berlowitz examined risk-adjusted rates of pressure ulcer development, functional decline, behavioral decline, and mortality in VA nursing homes compared with community nursing homes54. Veterans in VA nursing homes were less likely to develop a pressure ulcer (OR 0.62 95%CI 0.47-0.83) but more likely to experience functional decline (OR 1.6 95%CI 1.2-2.1) compared to veterans in community nursing homes. Risk-adjusted mortality and rates of behavioral decline were not different for veterans in VA and community nursing homes.
Summary: Studies of the quality of hospital and nursing home care demonstrate similar risk-adjusted mortality rates in VA facilities compared with non-VA facilities. VA hospitals had somewhat better patient safety outcomes compared with non-VA hospitals. Veterans in VA nursing homes were less likely to develop a pressure ulcer but more likely to experience functional decline compared to veterans in community nursing homes. In addition, the VA had higher use of infection control practices, but greater readmission rates and equivalent mortality rates for racial minorities.
MENTAL HEALTHWe identified 4 studies assessing the quality of mental health care in VA and non-VA settings26,
55-57. Busch et al. compared the quality of antidepressant pharmacotherapy in the VA and private sector using identical performance indicators26. The authors determined the proportion of patients with a new diagnosis of depression who received a prescription for an antidepressant and remained on antidepressant therapy for the first 84 days following the diagnosis (known as the acute phase of treatment) and for the first 181 days following the diagnosis (known as the maintenance phase of treatment). The VA slightly outperformed the private sector in the prescription of antidepressants during the acute phase of treatment (84.7 compared with 81 percent; p<0.001) and during the maintenance phase of treatment (53.9 compared with 50.9 percent; p<0.001). The findings persisted when assessed by age and gender.
Leslie et al. compared care for hospitalized patients with schizophrenia in the VA and private sector55. Rates of readmission were lower and rates of timely follow-up visits after discharge were higher in the private sector compared to the VA. The VA had better continuity of care, defined as the number of two-month periods in which the patient had two or more outpatient visits in the six months after discharge. In an analysis of the quality of antipsychotic prescribing among patients with schizophrenia, Leslie et al. found that VA patients were more likely to receive a prescription for an antipsychotic and equally likely to be dosed in accordance with accepted clinical guidelines compared to private sector patients with schizophrenia56.
Finally, Rosenheck examined adherence to 26 treatment guidelines recommended by the Patient Outcomes Research Team (PORT) for patients with schizophrenia57. In an analysis of care for patients with schizophrenia in two states in the southeast and Midwest, the study found non-significant differences in adherence to PORT recommendations between VA and non-VA patients for 21 of the 26 measures. Significant differences were found in the following areas: VA outpatients were less likely to receive an antipsychotic medication and to be taking doses outside of the recommended range; VA inpatients were less likely to receive treatment that addressed psychosocial issues than non-VA inpatients; VA outpatients were less likely to participate in work therapy or job training than non-VA outpatients, and both VA inpatients and outpatients were less likely to receive case management services than non-VA patients.
20
Comparison of Quality of Care in VA and Non-VA Settings Evidence-based Synthesis Program
Summary: Studies of the quality of mental health care demonstrate that the quality of antidepressant prescribing is slightly better in VA compared to private sector settings. One study of national data found VA patients with schizophrenia were more likely to receive an antipsychotic medication in the outpatient setting, but a study of data from two states found VA outpatients were less likely to receive an antipsychotic medication and psychosocial services. Among patients discharged after a hospitalization for schizophrenia, readmission and timely outpatient visit follow-up rates after discharge were worse in the VA, but continuity of care in the outpatient setting was better compared to the private sector.
OTHER STUDIESWe classified 4 additional studies into an ‘other’ category25, 27, 58, 59.
Barnett et al. compared the use of potentially inappropriate medications among elderly patients in the VA and Medicare managed plans and 10 distinct geographic regions25. The authors identified 33 medications that in previously published studies have been generally considered inappropriate when given to the elderly because these medications may pose more risk than benefit. The 33 medications were classified into the following 3 categories: “always avoid”, “rarely appropriate” and “some indications’. Compared with Medicare managed care patients, VA patients were less likely to receive any inappropriate medication (21% vs. 29%, P <0.001), and in each classification: always avoid (2% vs. 5%, P <0.001), rarely appropriate (8% vs. 13%, P<0.001), and some indications (15% vs. 17%, P <0.001). The rate of inappropriate drug use was lower in the VA compared with the private sector for both males (21% vs. 24%, P <0.001) and females (28% vs. 32%, P <0.001). Differences were consistent when stratified by age.
Campling et al. examined the survival of Pennsylvania patients diagnosed with lung carcinoma between 1995 and 1999 who were treated in VA medical centers compared to patients treated in other medical centers in the state27. The median survival was 6.3 months for VA patients compared with 7.9 months for patients in the rest of the state, and the 5-year overall survival rate was 12% for VA patients compared with 15% for patients in the rest of the state. The Cox model showed a hazard ratio for VA patients compared with non-VA patients of 1.22 (P< 0.001) after adjusting for age, disease stage, and race, meaning that VA patients had a 22% greater odds of dying over the same time period.
Stineman studied functional outcomes following a stroke for patients admitted to 60 VA and 467 non-VA rehabilitation facilities58. Across 20 different types of functional impairments, VA patients had significantly better motor outcomes on 8 impairments and worse outcomes for 2 impairments compared to non-VA patients.
Cox et al. compared satisfaction with hearing aid fittings and perceived benefit from hearing aid placement among VA and non-VA patients59. VA patients reported greater satisfaction with the fitting of the hearing aid. Using three survey instruments to assess the perceived benefit of using the hearing aid in comparison to unaided hearing, VA patients reported greater benefit on all three instruments. In multivariate analysis of variance adjusting for baseline level of hearing loss, VA had significantly greater benefit from hearing aid placement on a composite measure of all three instruments. When the instruments were examined separately, VA patients reported greater

21
Comparison of Quality of Care in VA and Non-VA Settings Evidence-based Synthesis Program
benefit on one instrument but not the other two.
Summary: Elderly VA patients were less likely to be prescribed potentially inappropriate medications than elderly patients in Medicare managed care plans. A study of survival following a diagnosis of lung carcinoma in Pennsylvania found worse survival for VA patients in that state. Stroke patients receiving rehabilitation in VA settings were discharged with better functional outcomes. VA patients had greater satisfaction with hearing aid fittings and somewhat greater self-reported benefit from hearing aid placement.

22
Comparison of Quality of Care in VA and Non-VA Settings Evidence-based Synthesis Program
SUMMARY AND DISCUSSION
LIMITATIONS
PUBLICATION BIASPublication bias refers to the lack of publication of studies based on their findings. In its traditional sense, it refers to lack of publication of studies failing to show a statistically significant benefit for an intervention, either because authors feel such results are not newsworthy or because journals are less likely to publish studies that reach null results. In this context, it is not clear whether the specific directionality of a comparison of quality of care between VA and non-VA facilities would lead authors or journal editors to not publish a study. So the potential for publication bias, while always a concern in any systematic review, is not qualitatively the same for this review as in reviews of medical interventions.
However, there is still concern that we identified all published studies of VA care compared to non-VA care. We searched broadly using a literature search strategy designed to identify such articles, but there is never any guarantee that all relevant studies have been found. The consistency of our findings, though, means that any studies that are unpublished would have to be both numerous and have results contrary to the published studies in order to substantively influence our conclusions.
STUDY QUALITY An important limitation common to systematic reviews is the quality of the original studies. We defined a minimum threshold of design and execution that must have been present for inclusion in our review. Criteria considered included the time frames of the quality measurement in VA and non-VA samples, the similarity of the measures of quality in both samples, the types of measures used, and the statistical methods. Above this threshold, we distinguished between studies based on a global assessment of quality. However, other factors not considered may also have influenced the results of studies in ways we cannot account for.
Ten of the seventeen articles included from the surgical literature were part of the Patient Safety in Surgery Study briefly described previously that used NSQIP methodology to compare care that was provided in the VA setting with that provided in 14 private sector, university hospitals9, 11-17, 19, 21. The NSQIP is the first validated, risk adjusted program evaluating outcomes and allowing for measure-ment of quality of care across surgical settings62. However, there are some potential limitations to the Patient Safety in Surgery Study that should be acknowledged. The 14 private sector hospitals in this study may not be generalizable to the private sector at large. Risk adjusted outcomes were assessed in most cases with stepwise logistic regression evaluating the impact of all variables col-lected on postoperative morbidity and mortality. A potential limitation includes omitted variable bias. For example, risk adjustment models were not able to account for stage of disease in the on-cology studies or for indications for surgery in a number of other studies such as those evaluating outcomes after hepatectomy, adrenalectomy, thyroidectomy or parathyroidectomy. The omission of cases may have affected the findings in some studies, as well. For example, in the vascular surgery analyses, endovascular procedures performed outside of the operating room, such as in a radiology
23
Comparison of Quality of Care in VA and Non-VA Settings Evidence-based Synthesis Program
suite, were not accounted for. Additionally, in Hall et al’s study on thyroidectomies and parathyroi-dectomies, surgeries performed by otolaryngologists were not captured in the private sector data although they accounted for up to 50% of the operations in the VA12. Another limitation was inabil-ity to account for specific structural components of the care delivery system. For example, in the Lancaster paper assessing hepatectomy outcomes, the data did not take into account if the hospital had a transplant program, if they were able to perform veno-veno bypass, whether or not specialists in hepatology were on staff and available, ability to perform radiofrequency ablation or the quality of the intensive care units16. Finally, morbidity analyses across these studies were based on standard NSQIP assessment of morbidity. Disease and procedure specific outcomes could not be assessed with this data in some instances such as leak rate after pancreatectomy11, nerve injury after thyroi-dectomy or parathyroidectomy12, or disease recurrence after oncologic surgery11, 19.
An additional limitation is that all but one of the studies was either supported by VA research funding or had VA investigators performing some or all of the work. This may be natural as the VA has more interest than non-VA systems in comparing VA care with non-VA care. However, the possibility of bias must still be kept in mind.
Yet an additional limitation of the non-surgical comparisons is that they are either a narrow set of quality measures applied to a broad set of patients, or a broad set of quality measures applied to a limited sample of patients. In other words, for medical conditions, there is no study that assesses a broad set of quality measures on a national sample of patients. However, the results from the narrow-measures-broad-sample studies and the broad-measures-narrow-sample studies support each other, lessening the likelihood that a broad set of measures applied to a national sample of patients would yield results different from what we report here. Other limitations include lack of comparisons using data collected within the past five years, the use of self-reported data which may be subject to recall error, and the potential for inadequate assessment of clinical risk in studies comparing patient outcomes.
CONCLUSIONSWith the above caveats in mind, we reached the following conclusions for the fifty five articles included in our synthesis. The seventeen surgery articles addressed a variety of conditions and procedures. Primary measures of quality tended to be outcomes measures such as morbidity, mortality, graft survival and occurrence of adverse events. The findings among these seventeen studies were heterogeneous with nine studies reporting no significant difference in quality outcomes, three studies reporting improved quality in the VA compared with the non-VA setting and five reporting improved quality in the non-VA setting. The majority of the surgical studies were based on the Patient Safety in Surgery Study.
Of four general surgery studies, three revealed no significant difference in adjusted postoperative morbidity rates; one found significantly lower rates of postoperative morbidity in the VA setting compared with the private sector. Only 3 of the 4 studies assessed risk adjusted mortality rates; of these two found no significant difference across settings and one found significantly higher risk adjusted rates of postoperative mortality among male patients at the VA compared with the private sector.
24
Comparison of Quality of Care in VA and Non-VA Settings Evidence-based Synthesis Program
Of three solid organ transplant articles, two found no significant difference in patient survival when comparing VA patients with non-VA patients. Additionally, one of these found no significant different in graft survival between these two groups. This study also included a sub-analysis of HRQOL among heart and liver transplant recipients and found no significant different in functional status or mental component scoring, but noted a trend toward lower physical component scores among VA patients after 7 years post-transplant. One study found that VA patients with end-stage renal disease were both less likely to be listed for a kidney transplant and less likely to receive a transplant when listed compared with privately insured patients.
Two of the three vascular surgery studies found significantly lower risk adjusted rates of postoperative morbidity; the final vascular surgery study found no significant difference in morbidity rates. There were no significant differences in risk adjusted mortality rates throughout these three studies.
The studies pertaining to surgical oncology consisted of two that focused on pancreatic cancer and one that focused on breast cancer. One of the pancreatic cancer studies based on the NCDB found no significant difference in postoperative mortality. The other study on pancreatic cancer based on the Patient Safety in Surgery Study found increased risk adjusted postoperative rates of morbidity and mortality. The breast cancer study found no significant difference in risk adjusted postoperative morbidity.
Of the two studies that addressed quality of care related to CABG in VA and non-VA hospitals, one found that, after risk adjustment, VA patients were more likely than non-VA patients to report a problem with patient care. This was based on self-reported data about many aspects of patient care. The second study focused on mortality and found that the odds of death was higher in VA patients relative to private sector patients after accounting for patient level predictors and hospital volume.
In both of the endocrine studies, there were no significant differences in postoperative morbidity or adverse events.
Of 10 general comparative studies assessing use of preventive services, acute and chronic care for multiple medical acute and chronic medical conditions, changes in broad health status including risk-adjusted morality, and patient satisfaction, each showed superior performance, as measured by greater adherence to accepted processes of care, better health outcomes or improved patient ratings of care, for care delivered in the VA compared with care delivered outside the VA. Of the 6 studies that assessed cardiovascular outcomes, 5 studies of mortality following an acute myocardial infarction or percutaneous coronary transluminal angioplasty found no clear survival differences between VA and non-VA settings and one study found greater control of blood pressure in the VA. Of the 3 studies that assessed use of processes of care following an acute myocardial infarction, all three found greater rates of evidence-based drug therapy in VA, but one study found lower use of clinically-appropriate angiography in the VA. Four studies of the quality of diabetes care demonstrate a performance advantage on some measures for the VA compared with commercial managed care and other non-VA populations.

25
Comparison of Quality of Care in VA and Non-VA Settings Evidence-based Synthesis Program
Studies of the quality of hospital and nursing home care demonstrate similar risk-adjusted mortality rates in VA facilities compared with non-VA facilities. VA hospitals had somewhat better patient safety outcomes compared with non-VA hospitals. Veterans in VA nursing homes were less likely to develop a pressure ulcer but more likely to experience functional decline compared to veterans in community nursing homes. In addition, the VA had higher use of infection control practices, but greater readmission rates and equivalent mortality rates across racial groups. Studies of the quality of mental health care demonstrate that the quality of antidepressant prescribing is slightly better in VA compared to private sector settings. One study of national data found VA patients with schizophrenia were more likely to receive an antipsychotic medication in the outpatient setting, but a study of data from two states found VA outpatients were less likely to receive an antipsychotic medication and psychosocial services. Among patients discharged after a hospitalization for schizophrenia, readmission and outpatient visit follow-up rates were worse in the VA, but continuity of care was better compared to the private sector.
Elderly VA patients are less likely to be prescribed potentially inappropriate medications than elderly patients in Medicare managed care plans. A study of survival following a diagnosis of lung carcinoma in Pennsylvania found worse survival for VA patients in that state. Stroke patients receiving rehabilitation in VA settings were discharged with better functional outcomes. VA patients had greater satisfaction with hearing aid fittings and somewhat greater self-reported benefit from hearing aid placement.
Of note, some of the studies compare a narrow band of practice(s), such as vaccinations or a specific type of surgery, across a broader population and other studies compare a wide spectrum of practices in a smaller sample (e.g., Asch et al.)23. Moreover, many of the studies are quite dated, with 16 articles using data prior to 2000, and more than likely practices have changed over time inside and outside of the VA.
Overall, the available literature suggests that the care provided in the VA compares favorably to non-VA care systems, albeit with some caveats. Studies that used accepted process of care measures and intermediate outcome measures, such as control of blood pressure or hemoglobin A1c, for quality measurements almost always found VA performed better than non-VA comparison groups. Studies looking at risk-adjusted outcomes generally have found no differences between VA and non-VA care, with some reports of better outcomes in VA and a few reports of worse outcomes in VA, compared to non-VA care. The studies of processes of care are mostly those about medical conditions, while the studies of outcomes are mostly about surgical conditions.
FUTURE RESEARCH Going forward, further research should be considered to address contemporary comparisons in the quality of care between the VA and the private sector. For example, most of the studies that compared the quality of surgical care in the VA with that in non-VA settings are based on data that is over five years old. The ACS-NSQIP has grown substantially from the original
26
Comparison of Quality of Care in VA and Non-VA Settings Evidence-based Synthesis Program
demonstration group of 14 university hospitals in the Patient Safety in Surgery Study to over 180 non-VA hospitals today. The data management for the ACS-NSQIP program has advanced, as well, with more surgical specialties being evaluated and with continually evolving data-fields for collection allowing for more detailed analysis. To further address the quality of care in the VA and non-VA settings, it may be worthwhile to repeat some of these studies using this larger sample; and consideration could be given to merging the VA and ACS NSQIP systems to allow for ongoing comparisons at the institutional and systems level. In areas of medical care, many studies are, as noted with the surgical literature, limited by their age, and newer projects would be worthwhile if benchmarking is considered important. If so, consideration should also be given to determining which healthcare systems the VA should benchmark against (e.g., other managed care organizations, local centers of excellence).
27
Comparison of Quality of Care in VA and Non-VA Settings Evidence-based Synthesis Program
REFERENCE LIST
1. Longman, P., Best Care Anywhere: Why VA Health Care Is Better Than Yours. 2007, Sausalito: PoliPointPress.
2. Ashton, C. M., et al., Hospital use and survival among Veterans Affairs beneficiaries. N Engl J Med, 2003. 349(17): p. 1637-46.
3. Maslin, J. (March 13, 1992) Article 99: Idealism Meets Iodine and Illogic in a Veterans Hospital. New York Times, 99.
4. Canby, V. (December 20, 1989) Born on the Fourth of July: How an All-American Boy Went to War and Lost His Faith. New York Times.
5. Bogdanich, W. (June 29, 2009) Oncologist Defends His Work at a V.A. Hospital. New York Times.
6. Austin, G. L., et al., Comparative analysis of outcome following liver transplantation in US veterans. Am J Transplant, 2004. 4(5): p. 788-95.
7. Bilimoria, K. Y., et al., Quality of pancreatic cancer care at Veterans Administration com-pared with non-Veterans Administration hospitals. Am J Surg, 2007. 194(5): p. 588-93.
8. Feria, M. I., M. V. Sarrazin and G. E. Rosenthal, Perceptions of care of patients undergo-ing coronary artery bypass surgery in Veterans Health Administration and private sector hospitals. Am J Med Qual, 2003. 18(6): p. 242-50.
9. Fink, A. S., et al., Comparison of risk-adjusted 30-day postoperative mortality and mor-bidity in Department of Veterans Affairs hospitals and selected university medical cen-ters: general surgical operations in women. J Am Coll Surg, 2007. 204(6): p. 1127-36.
10. Gill, J. S., et al., Access to kidney transplantation among patients insured by the United States Department of Veterans Affairs. J Am Soc Nephrol, 2007. 18(9): p. 2592-9.
11. Glasgow, R. E., et al., Pancreatic resection in Veterans Affairs and selected university medical centers: results of the patient safety in surgery study. J Am Coll Surg, 2007. 204(6): p. 1252-60.
12. Hall, B. L., et al., Thyroid and parathyroid operations in veterans affairs and selected university medical centers: results of the patient safety in surgery study. J Am Coll Surg, 2007. 204(6): p. 1222-34.
13. Henderson, W. G., et al., Comparison of risk-adjusted 30-day postoperative mortality and morbidity in Department of Veterans Affairs hospitals and selected university medical centers: general surgical operations in men. J Am Coll Surg, 2007. 204(6): p. 1103-14.
14. Hutter, M. M., et al., Comparison of risk-adjusted 30-day postoperative mortality and morbidity in Department of Veterans Affairs hospitals and selected university medical centers: vascular surgical operations in men. J Am Coll Surg, 2007. 204(6): p. 1115-26.
28
Comparison of Quality of Care in VA and Non-VA Settings Evidence-based Synthesis Program
15. Johnson, R. G., et al., Comparison of risk-adjusted 30-day postoperative mortality and morbidity in Department of Veterans Affairs hospitals and selected university medical centers: vascular surgical operations in women. J Am Coll Surg, 2007. 204(6): p. 1137-46.
16. Lancaster, R. T., et al., Liver resection in veterans affairs and selected university medical centers: results of the patient safety in surgery study. J Am Coll Surg, 2007. 204(6): p. 1242-51.
17. Lautz, D. B., et al., Bariatric operations in Veterans Affairs and selected university medi-cal centers: results of the patient safety in surgery study. J Am Coll Surg, 2007. 204(6): p. 1261-72.
18. Moore, D., et al., Survival and quality of life after organ transplantation in veterans and nonveterans. Am J Surg, 2003. 186(5): p. 476-80.
19. Neumayer, L., et al., Breast cancer surgery in Veterans Affairs and selected university medical centers: results of the patient safety in surgery study. J Am Coll Surg, 2007. 204(6): p. 1235-41.
20. Rosenthal, G. E., M. Vaughan Sarrazin and E. L. Hannan, In-hospital mortality following coronary artery bypass graft surgery in Veterans Health Administration and private sector hospitals. Med Care, 2003. 41(4): p. 522-35.
21. Turrentine, F. E., et al., Adrenalectomy in Veterans Affairs and selected university medi-cal centers: results of the patient safety in surgery study. J Am Coll Surg, 2007. 204(6): p. 1273-83.
22. Weiss, J. S., et al., Safety of carotid endarterectomy in a high-risk population: lessons from the VA and Connecticut. J Am Coll Surg, 2006. 203(3): p. 277-82.
23. Asch, S. M., et al., Comparison of quality of care for patients in the Veterans Health Ad-ministration and patients in a national sample. Ann Intern Med, 2004. 141(12): p. 938-45.
24. Bansal, D., et al., Trends in the care of patients with acute myocardial infarction at a university-affiliated Veterans Affairs Medical Center. J Cardiovasc Pharmacol Ther, 2005. 10(1): p. 39-44.
25. Barnett, M. J., et al., Comparison of rates of potentially inappropriate medication use ac-cording to the Zhan criteria for VA versus private sector medicare HMOs. J Manag Care Pharm, 2006. 12(5): p. 362-70.
26. Busch, S. H., D. L. Leslie and R. A. Rosenheck, Comparing the quality of antidepressant pharmacotherapy in the Department of Veterans Affairs and the private sector. Psychiatr Serv, 2004. 55(12): p. 1386-91.
27. Campling, B. G., et al., A population-based study of lung carcinoma in Pennsylvania: comparison of Veterans Administration and civilian populations. Cancer, 2005. 104(4): p. 833-40.
29
Comparison of Quality of Care in VA and Non-VA Settings Evidence-based Synthesis Program
28. Chi, R. C., G. E. Reiber and K. M. Neuzil, Influenza and pneumococcal vaccination in older veterans: results from the behavioral risk factor surveillance system. J Am Geriatr Soc, 2006. 54(2): p. 217-23.
29. Jha, A. K., et al., Effect of the transformation of the Veterans Affairs Health Care System on the quality of care. N Engl J Med, 2003. 348(22): p. 2218-27.
30. Jha, A. K., S. M. Wright and J. B. Perlin, Performance measures, vaccinations, and pneu-monia rates among high-risk patients in Veterans Administration health care. Am J Public Health, 2007. 97(12): p. 2167-72.
31. Kerr, E. A., et al., Diabetes care quality in the Veterans Affairs Health Care System and commercial managed care: the TRIAD study. Ann Intern Med, 2004. 141(4): p. 272-81.
32. Keyhani, S., et al., Use of preventive care by elderly male veterans receiving care through the Veterans Health Administration, Medicare fee-for-service, and Medicare HMO plans. Am J Public Health, 2007. 97(12): p. 2179-85.
33. Krein, S. L., et al., Use of central venous catheter-related bloodstream infection preven-tion practices by US hospitals. Mayo Clin Proc, 2007. 82(6): p. 672-8.
34. Landrum, M. B., et al., Care following acute myocardial infarction in the Veterans Ad-ministration Medical Centers: a comparison with Medicare. Health Serv Res, 2004. 39(6 Pt 1): p. 1773-92.
35. Petersen, L. A., et al., Outcome of myocardial infarction in Veterans Health Administra-tion patients as compared with medicare patients. N Engl J Med, 2000. 343(26): p. 1934-41.
36. Petersen, L. A., et al., Regionalization and the underuse of angiography in the Veterans Affairs Health Care System as compared with a fee-for-service system. N Engl J Med, 2003. 348(22): p. 2209-17.
37. Polsky, D., et al., Is lower 30-day mortality posthospital admission among blacks unique to the Veterans Affairs health care system? Med Care, 2007. 45(11): p. 1083-9.
38. Rehman, S. U., et al., Ethnic differences in blood pressure control among men at Veterans Affairs clinics and other health care sites. Arch Intern Med, 2005. 165(9): p. 1041-7.
39. Reiber, G. E., et al., Diabetes in nonveterans, veterans, and veterans receiving Depart-ment of Veterans Affairs health care. Diabetes Care, 2004. 27 Suppl 2: p. B3-9.
40. Ross, J. S., et al., Use of recommended ambulatory care services: is the Veterans Affairs quality gap narrowing? Arch Intern Med, 2008. 168(9): p. 950-8.
41. Selim, A. J., et al., Risk-adjusted mortality as an indicator of outcomes: comparison of the Medicare Advantage Program with the Veterans’ Health Administration. Med Care, 2006. 44(4): p. 359-65.

30
Comparison of Quality of Care in VA and Non-VA Settings Evidence-based Synthesis Program
42. Selim, A. J., et al., Change in health status and mortality as indicators of outcomes: com-parison between the Medicare Advantage Program and the Veterans Health Administra-tion. Qual Life Res, 2007. 16(7): p. 1179-91.
43. Weeks, W. B., et al., Comparing the characteristics, utilization, efficiency, and outcomes of VA and non-VA inpatient care provided to VA enrollees: a case study in New York. Med Care, 2008. 46(8): p. 863-71.
44. Weeks, W. B., et al., Comparing measures of patient safety for inpatient care provided to veterans within and outside the VA system in New York. Qual Saf Health Care, 2008. 17(1): p. 58-64.
45. Harada, N. D., V. M. Villa and R. Andersen, Satisfaction with VA and non-VA outpatient care among veterans. Am J Med Qual, 2002. 17(4): p. 155-64.
46. Selim, A. J., et al., Differences in risk-adjusted mortality between medicaid-eligible patients enrolled in medicare advantage plans and those enrolled in the veterans health administration. J Ambul Care Manage, 2009. 32(3): p. 232-40.
47. Petersen, L. A., et al., Comparison of use of medications after acute myocardial infarction in the Veterans Health Administration and Medicare. Circulation, 2001. 104(24): p. 2898-904.
48. Ritchie, J. L., et al., A comparison of percutaneous transluminal coronary angioplasty in the Department of Veterans Affairs and in the private sector in the State of Washington. Am J Cardiol, 1998. 81(9): p. 1094-9.
49. Wright, S. M., et al., Increasing use of Medicare services by veterans with acute myocar-dial infarction. Med Care, 1999. 37(6): p. 529-37.
50. Nelson, K. M., et al., The association between health insurance coverage and diabetes care; data from the 2000 Behavioral Risk Factor Surveillance System. Health Serv Res, 2005. 40(2): p. 361-72.
51. Piette, J. D., Satisfaction with care among patients with diabetes in two public health care systems. Med Care, 1999. 37(6): p. 538-46.
52. Weeks, W. B., et al., Veterans Health Administration and Medicare outpatient health care utilization by older rural and urban New England veterans. J Rural Health, 2005. 21(2): p. 167-71.
53. Gordon, H. S., et al., Using severity-adjusted mortality to compare performance in a Veterans Affairs hospital and in private-sector hospitals. Am J Med Qual, 2000. 15(5): p. 207-11.
54. Berlowitz, D. R., et al., Purchasing or providing nursing home care: can quality of care data provide guidance. J Am Geriatr Soc, 2005. 53(4): p. 603-8.
55. Leslie, D. L. and R. A. Rosenheck, Comparing quality of mental health care for public-sector and privately insured populations. Psychiatr Serv, 2000. 51(5): p. 650-5.
31
Comparison of Quality of Care in VA and Non-VA Settings Evidence-based Synthesis Program
56. Leslie, D. L. and R. A. Rosenheck, Benchmarking the quality of schizophrenia pharma-cotherapy: a comparison of the Department of Veterans Affairs and the private sector. J Ment Health Policy Econ, 2003. 6(3): p. 113-21.
57. Rosenheck, R. A., et al., Benchmarking treatment of schizophrenia: a comparison of ser-vice delivery by the national government and by state and local providers. J Nerv Ment Dis, 2000. 188(4): p. 209-16.
58. Stineman, M. G., et al., Inpatient rehabilitation after stroke: a comparison of lengths of stay and outcomes in the Veterans Affairs and non-Veterans Affairs health care system. Med Care, 2001. 39(2): p. 123-37.
59. Cox, R. M., G. C. Alexander and G. A. Gray, Hearing aid patients in private practice and public health (Veterans Affairs) clinics: are they different? Ear Hear, 2005. 26(6): p. 513-28.
60. Rosenthal, G. E., et al., Mortality and length of stay in a veterans affairs hospital and pri-vate sector hospitals serving a common market. J Gen Intern Med, 2003. 18(8): p. 601-8.
61. Kaboli, P. J., et al., Length of stay as a source of bias in comparing performance in VA and private sector facilities: lessons learned from a regional evaluation of intensive care outcomes. Med Care, 2001. 39(9): p. 1014-24.
62. Khuri, S. F., et al., The Department of Veterans Affairs’ NSQIP: the first national, validat-ed, outcome-based, risk-adjusted, and peer-controlled program for the measurement and enhancement of the quality of surgical care. National VA Surgical Quality Improvement Program. Ann Surg, 1998. 228(4): p. 491-5.
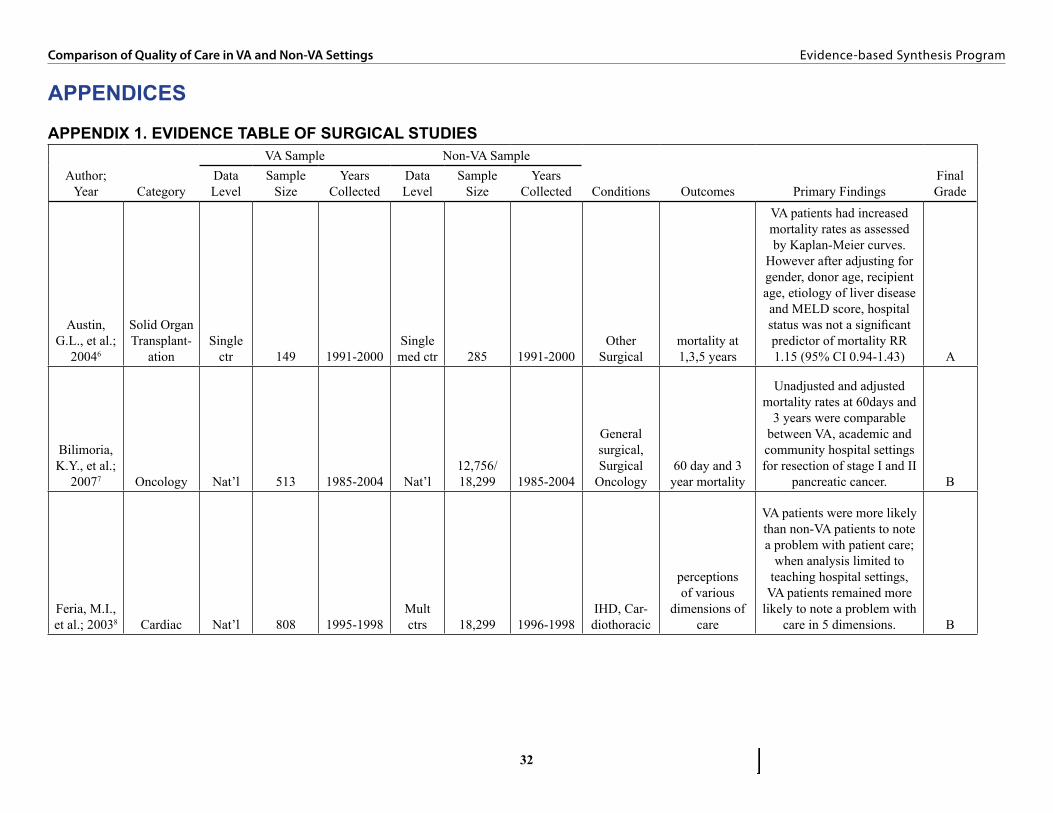
32
Comparison of Quality of Care in VA and Non-VA Settings Evidence-based Synthesis Program
APPENDICES
APPENDIX 1. EVIDENCE TABLE OF SURGICAL STUDIES
Author; Year Category
VA Sample Non-VA Sample
Conditions Outcomes Primary FindingsFinal Grade
Data Level
Sample Size
Years Collected
Data Level
Sample Size
Years Collected
Austin, G.L., et al.;
20046
Solid Organ Transplant-
ation Single
ctr 149 1991-2000Single med ctr 285 1991-2000
Other Surgical
mortality at 1,3,5 years
VA patients had increased mortality rates as assessed by Kaplan-Meier curves.
However after adjusting for gender, donor age, recipient age, etiology of liver disease and MELD score, hospital status was not a significant predictor of mortality RR 1.15 (95% CI 0.94-1.43) A
Bilimoria, K.Y., et al.;
20077 Oncology Nat’l 513 1985-2004 Nat’l12,756/18,299 1985-2004
General surgical, Surgical
Oncology60 day and 3 year mortality
Unadjusted and adjusted mortality rates at 60days and
3 years were comparable between VA, academic and community hospital settings for resection of stage I and II
pancreatic cancer. B
Feria, M.I., et al.; 20038 Cardiac Nat’l 808 1995-1998
Mult ctrs 18,299 1996-1998
IHD, Car-diothoracic
perceptions of various
dimensions of care
VA patients were more likely than non-VA patients to note a problem with patient care;
when analysis limited to teaching hospital settings,
VA patients remained more likely to note a problem with
care in 5 dimensions. B

33
Comparison of Quality of Care in VA and Non-VA Settings Evidence-based Synthesis Program
Author; Year Category
VA Sample Non-VA Sample
Conditions Outcomes Primary FindingsFinal Grade
Data Level
Sample Size
Years Collected
Data Level
Sample Size
Years Collected
Fink, A.S., et al.; 20079 General Nat’l 5157 2001-2004
Mult. Ctrs 27467 2001-2004
General surgical
30 day postoperative morbidity and
mortality
Risk adjusted mortality rates are comparable between PS and VA patients, although
setting of care did not enter the mortality regression
model. Risk adjusted morbidity was higher in the PS compared with the VA
OR 0.8 (CI 0.71-0.90) B
Gill, J.S., et al.; 200710
Solid Organ Transplan-
tation Nat’l 7395 1995-2004 Nat’l144651/357345 1995-2004
Other surgical
time to treatment
Both VA-insured and Medicare/Medicaid-insured patients were approximately
35% less likely to receive transplants than patients with
private insurance (hazard ratio [HR] 0.65; 95% CI 0.60 to 0.70; P _ 0.0001).
Most of this difference was explained by the fact that VA patients were less likely to be placed on the wait-list (HR 0.71; 95% CI 0.67 to 0.76), but even listed VA patients received transplants less
frequently than those insured privately (HR 0.89; 95% CI
0.82 to 0.96). A
Glasgow, R.E., et al.;
200711 Oncology Nat’l 377 2001-2004Mult. Ctrs 692 2001-2004
Other surgical
postoperative outcomes (primarily
morbidity and mortality)
Adjusting for case mix differences, postoperative
morbidity and mortality rates for pancreatectomy were
higher in the VA compared with the PS (OR 1.581,
95% CI 1.084-2.307 and 2.533 95% CI 1.020– 6.290
respectively). A/B

34
Comparison of Quality of Care in VA and Non-VA Settings Evidence-based Synthesis Program
Author; Year Category
VA Sample Non-VA Sample
Conditions Outcomes Primary FindingsFinal Grade
Data Level
Sample Size
Years Collected
Data Level
Sample Size
Years Collected
Hall, B.L., et al.; 200712 Endocrine Nat’l 2814 2001-2004
Mult. Ctrs 357345 2001-2004
General surgical, head and
neck
30 day morbidity
and mortality; specific adverse
event rates, LOS
Overall 30day morbidity and mortality do not differ significantly in the VA vs PS in risk adjusted model. Mortality event rate is too low to accurately evaluate,
odds ratio for morbidity associated with VA care is 1.25 ( 95% CI 0.87-1.78) B
Henderson, W.G., et al.;
200713 General Nat’l 9409818 2001-2004Mult. Ctrs 18399 2001-2004
General surgical
30 day postoperative morbidity and
mortality
After risk adjustment for patient comorbidities and
severity of illness, the odds of mortality at 30days were higher in the VA compared
with the PS (OR 1.23, 95% CI ). There was no significant difference in
morbidity at 30days among the sites. A/B
Hutter, M.M., et
al.; 200714 Vascular Nat’l 5174 2001-2004Mult. Ctrs 30058 2001-2004 Vascular
30 day postoperative morbidity and
mortality
Risk adjusted mortality was comparable among the two groups, although hospital site/type did not enter the
stepwise regression model. Accounting for comorbidities
and severity of illness, postoperative morbidity
rates were lower in the VA population, OR 0.84 (95%
CI 0.78-0.92) A/B
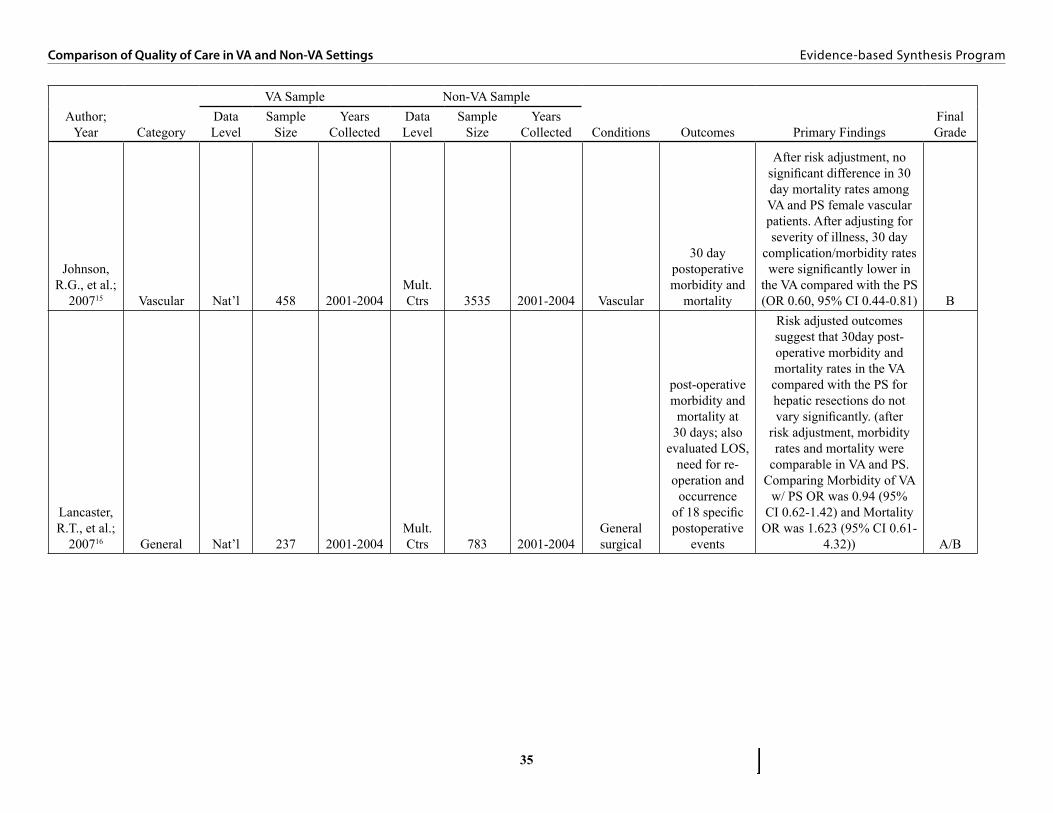
35
Comparison of Quality of Care in VA and Non-VA Settings Evidence-based Synthesis Program
Author; Year Category
VA Sample Non-VA Sample
Conditions Outcomes Primary FindingsFinal Grade
Data Level
Sample Size
Years Collected
Data Level
Sample Size
Years Collected
Johnson, R.G., et al.;
200715 Vascular Nat’l 458 2001-2004Mult. Ctrs 3535 2001-2004 Vascular
30 day postoperative morbidity and
mortality
After risk adjustment, no significant difference in 30 day mortality rates among VA and PS female vascular patients. After adjusting for severity of illness, 30 day
complication/morbidity rates were significantly lower in
the VA compared with the PS (OR 0.60, 95% CI 0.44-0.81) B
Lancaster, R.T., et al.;
200716 General Nat’l 237 2001-2004Mult. Ctrs 783 2001-2004
General surgical
post-operative morbidity and mortality at
30 days; also evaluated LOS,
need for re-operation and
occurrence of 18 specific postoperative
events
Risk adjusted outcomes suggest that 30day post-operative morbidity and mortality rates in the VA compared with the PS for hepatic resections do not vary significantly. (after
risk adjustment, morbidity rates and mortality were
comparable in VA and PS. Comparing Morbidity of VA
w/ PS OR was 0.94 (95% CI 0.62-1.42) and Mortality
OR was 1.623 (95% CI 0.61-4.32)) A/B

36
Comparison of Quality of Care in VA and Non-VA Settings Evidence-based Synthesis Program
Author; Year Category
VA Sample Non-VA Sample
Conditions Outcomes Primary FindingsFinal Grade
Data Level
Sample Size
Years Collected
Data Level
Sample Size
Years Collected
Lautz, D.B., et al.;
200717 General Nat’l 374 2001-2004Mult. Ctrs 2064 2001-2004
Other surgical
30 day postoperative
outcomes: morbidity (overall,
specific adverse events, #
complications), mortality, LOS
No significant difference in postop morbidity or
mortality among women in the VA versus non-VA
settings (16.07 vs 12.02 % p =0.21 and 0.89 vs 0.42%,
p=0.47). Unadjusted and adjusted morbidity rates were higher among men treated at the VA versus
non-VA (OR 2.77, 95% CI 1.78-4.31 unadjusted and OR 2.29, 95% CI 1.28-
4.10 adjusted). Unadjusted mortality rates significantly higher among men treated at VAversus non-VA((1.91% vs
0.25% p=0.03). A/B
Moore, D., et al.;
200318
Solid Organ Transplant-
ationSingle
ctr 380 1990-2002Single med ctr 1429 1990-2002
Other surgical
graft survival; patient survival,
Karnofsky score, SF36
No significant difference in graft or patient survival in liver, heart, or kidney between veteran and nonveteran patients, and survival statistics were consistent with recently published national data A
Neumayer, L., et al.; 200719 Oncology Nat’l 644 2001-2004
Mult. Ctrs 3179 2001-2004
General surgical
30day postoperative morbidity and mortality, LOS
After adjusting for comorbidities and
preoperative factors, there was no significant difference
in 30day morbidity or mortality in female patients
at the VA compared with the PS (OR 1.404, 95% CI
0.894-2.204). B

37
Comparison of Quality of Care in VA and Non-VA Settings Evidence-based Synthesis Program
Author; Year Category
VA Sample Non-VA Sample
Conditions Outcomes Primary FindingsFinal Grade
Data Level
Sample Size
Years Collected
Data Level
Sample Size
Years Collected
Rosenthal, G.E., et al.;
200320 Cardiac Nat’l 19266 1993-1996Lrg geo
area44247/ 9696 1993-1996
Cardio-thoracic
in hospital mortality
Adjusting for patient-level predictors and volume, the odds of death was higher in VA patients, relative to
private sector patients (OR, 1.34; 95% CI, 1.11-1.63; P
<0.001). A
Turrentine F.E., et al.;
200721 Endocrine Nat’l 178 2001-2004Mult. Ctrs 371 2001-2004
Other surgical
30 day morbidity and
mortality
Unadjusted morbidity and mortality rates were higher in VA compared
with PS (16.3% vs 6.7%, p=0.003 and 2.8% vs.
0.4%, p=0.0074). Mortality event rate was too low for adjustment. Adjusting for comorbidities, the 30day postoperative morbidity
ratio in the VA versus the PS was no longer significant (adjusted OR1.33, 95%CI 0.49-3.6 compared with
unadjusted OR 2.75, 95% CI: 1.55-4.91). B
Weiss, J.S., et al.;
200622 VascularOne
VISN 140 1997-2002 Lrg geo 6949 1997-2002 Vascular
perioperative mortality, stroke and
cardiac complications
After risk adjustment, having surgery at the VA was not a significant predictor of death (OR 2.98, 95% CI
0.51-17.6), stroke (OR .95, 95% CI 0.3-3.4 ) or cardiac complications(OR 1.07 95%
CI 0.37-3.1) B
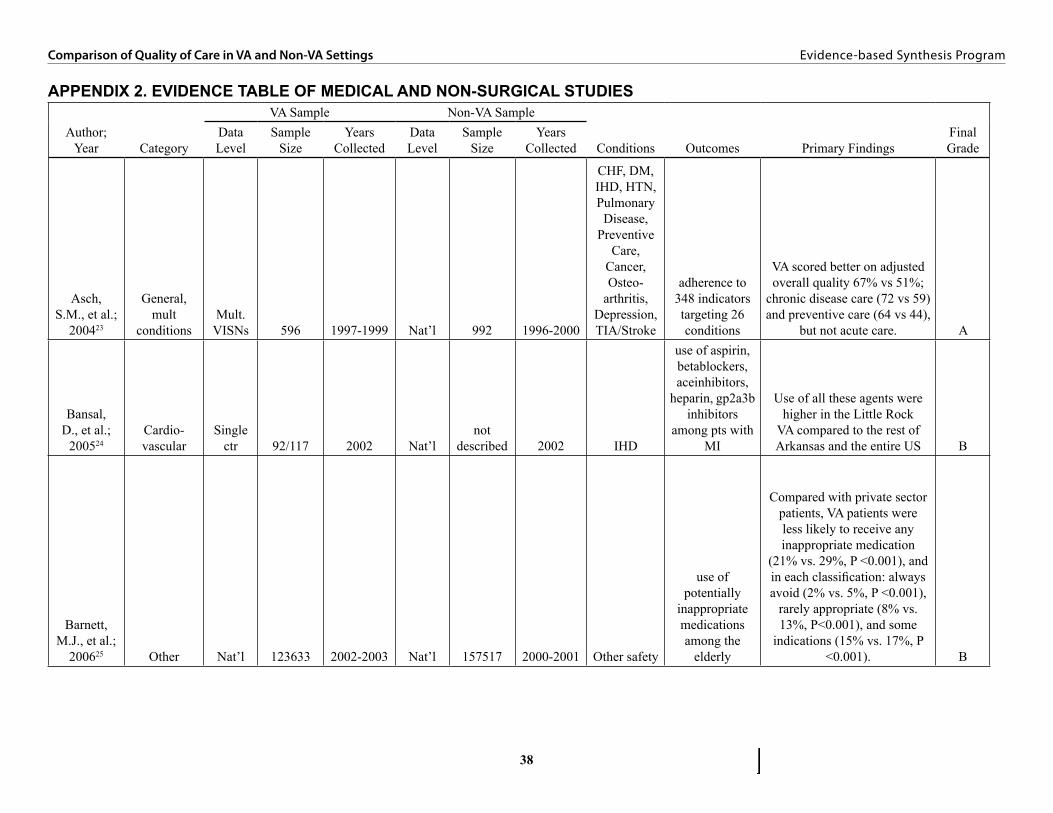
38
Comparison of Quality of Care in VA and Non-VA Settings Evidence-based Synthesis Program
APPENDIX 2. EVIDENCE TABLE OF MEDICAL AND NON-SURGICAL STUDIES
Author; Year Category
VA Sample Non-VA Sample
Conditions Outcomes Primary FindingsFinal Grade
Data Level
Sample Size
Years Collected
Data Level
Sample Size
Years Collected
Asch, S.M., et al.;
200423
General, mult
conditionsMult.
VISNs 596 1997-1999 Nat’l 992 1996-2000
CHF, DM, IHD, HTN, Pulmonary
Disease, Preventive
Care, Cancer, Osteo-
arthritis, Depression, TIA/Stroke
adherence to 348 indicators targeting 26 conditions
VA scored better on adjusted overall quality 67% vs 51%;
chronic disease care (72 vs 59) and preventive care (64 vs 44),
but not acute care. A
Bansal, D., et al.;
200524Cardio-vascular
Single ctr 92/117 2002 Nat’l
not described 2002 IHD
use of aspirin, betablockers, aceinhibitors,
heparin, gp2a3b inhibitors
among pts with MI
Use of all these agents were higher in the Little Rock
VA compared to the rest of Arkansas and the entire US B
Barnett, M.J., et al.;
200625 Other Nat’l 123633 2002-2003 Nat’l 157517 2000-2001 Other safety
use of potentially
inappropriate medications among the
elderly
Compared with private sector patients, VA patients were less likely to receive any inappropriate medication
(21% vs. 29%, P <0.001), and in each classification: always avoid (2% vs. 5%, P <0.001),
rarely appropriate (8% vs. 13%, P<0.001), and some
indications (15% vs. 17%, P <0.001). B

39
Comparison of Quality of Care in VA and Non-VA Settings Evidence-based Synthesis Program
Author; Year Category
VA Sample Non-VA Sample
Conditions Outcomes Primary FindingsFinal Grade
Data Level
Sample Size
Years Collected
Data Level
Sample Size
Years Collected
Berlowitz, D.R., et al.;
200554
Hospital and nursing home care
One VISN 3802/961 1997-1999
Lrg geo area
52986/142452 1997-1999
Other medical/
nonsurgical condition
Risk-adjusted rates of
pressure ulcerdevelopment,
functional decline,
behavioral decline, andmortality.
Veterans in VA nursing homes were significantly
(Po.05) less likely to develop a pressure ulcer (odds ratio
(OR)50.63) but more likely to experience functional decline
(OR51.6) than veterans in community nursing homes.
Veterans in VA nursing homes were also less likely to die
but more likely to experience behavioral decline, but these differences did not achieve
statistical significanceafter risk adjustment. A
Busch, S.H., et al.;
200426Mental
health care Nat’l 27713 2000-2001 Nat’l 4852 2000-2001 Depression
Receipt of 84, 140, and 181 of antidepressant therapy among patients with
initial diagnosis of depression
The VA slightly outperformed the private sector in the
prescription of antidepressants during the acute phase
of treatment, the first 84 days (84.7 compared with
81 percent) and during the maintenance phase of
treatment, the first 181 days (53.9 compared with 50.9 percent). The findings persisted after adjustment for age and sex but lost
significance after adjustment for comorbid conditions. A

40
Comparison of Quality of Care in VA and Non-VA Settings Evidence-based Synthesis Program
Author; Year Category
VA Sample Non-VA Sample
Conditions Outcomes Primary FindingsFinal Grade
Data Level
Sample Size
Years Collected
Data Level
Sample Size
Years Collected
Campling, B.G., et al.;
200527 OtherOne
VISN 862 1995-1999 Lrg geo 27936 1995-1999 Cancer
survival following
diagnosis of lung cancer
The median survival was 6.3 months for VA patients compared with 7.9 months
for patients in the rest of the state, and the 5-year overall survival rate was 12% for
VA patients compared with 15% for patients in the rest of the state. The Cox model
showed a hazard ratio for VA patients compared with non-
VA patients of 1.22 (P_ 0.001) after adjusting for age, disease
stage, and race. B
Chi, R.C., et al.; 200628
General, prevention Nat’l 3265 2003 Nat’l
10677/40331 2003
Preventive Care
Influenza and pneumococcal
vaccination
Among veterans, Influenza and vccinatin rates highers for
VA users compared to non-users. For veterans, VA care
was independently associated with influenza vaccination (adjusted OR 1.8; 95%CI
1-5-2.2) and pneumococcal vaccionation (adjusted OR
2.4; 95%CI 2.0-2.9). A
Cox, R.M., et al.; 200559 Other
Mult VISNs 151 2000-2003
Mult ctrs 79 2000-2003
Other medical/
nonsurgical condition
satisfaction with hearing
aid fitting
Three weeks after thefitting, VA patients reported
more satisfaction withtheir hearing aids. On some
measures VA patientsreported more benefit, but
different measures ofbenefit did not give completely
consistent results. B

41
Comparison of Quality of Care in VA and Non-VA Settings Evidence-based Synthesis Program
Author; Year Category
VA Sample Non-VA Sample
Conditions Outcomes Primary FindingsFinal Grade
Data Level
Sample Size
Years Collected
Data Level
Sample Size
Years Collected
Gordon, H.S., et al.;
200053
Hospital and nursing home care
Single ctr 5016 1993 Nat’l 850000 1991
Other medical/
nonsurgical condition
hospital mortality
Adjusted death rates were similar in the VA and a private
sector sample B
Harada, N.D., et al.;
200245
General, patient
satisfactionOne
VISN1262/ 840
dual 2000Lrg geo areao 550 2000
Other medical/
nonsurgical condition
patient satisfaction
with outpatient care
VA users were 2-8 times more satisfied than va non-users on 5 of 10 measures of satisfaction. VA users
were less satified than non-VA users on one measure –
number of days waited for an appointment. B
Jha, A.K., et al.; 200329
General, mult
conditions Nat’l48505-84503 1994-2000 Nat’l
diff. to ascertain 1997-2001
CHF, DM, IHD, Preventive
care
3 preventive measures, 3 diabetes
measures, 5 ami measures, 2 chf measures
The VA outperformed the Medicare fee-for-service program on all 11 similar
indicators from 1997 to 1999 and of 12 of 13 indicators in
2000. A
Jha, A.K., et al.; 200730
General, prevention Nat’l
48505-84503 1994-2000 Nat’l
diff. to ascertain 1997-2001
Preventive Care
3 preventive measures, 3 diabetes
measures, 5 ami measures, 2 chf measures
The VA outperformed the Medicare fee-for-service program on all 11 similar
indicators from 1997 to 1999 and of 12 of 13 indicators in
2000. A
Kaboli, P.J., et al.;
200161
Hospital and nursing home care
Single ctr 1142 1994-1995
Mult ctrs 51249 1994-1995
Other medical/
nonsurgical condition
risk adjusted mortality
Using logistic regression to adjust for severity, the odds of death was similar in VA patients, relative to private sector patients (OR 1.16,
95% CI 0.93-1.44; P = 0.18). Using proportional hazards regression and censoring
patients at hospital discharge, the risk for death was lower in VA patients (hazard ratio 0.70; 95% CI 0.59-0.82; P <0.001). B
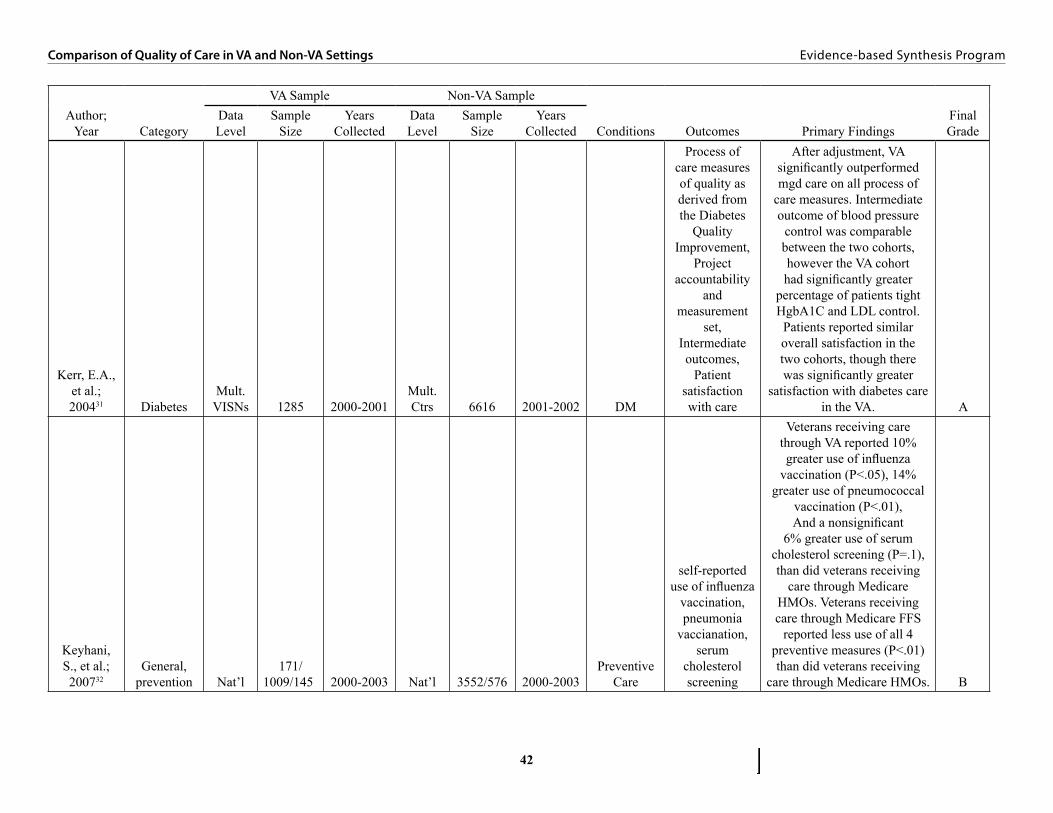
42
Comparison of Quality of Care in VA and Non-VA Settings Evidence-based Synthesis Program
Author; Year Category
VA Sample Non-VA Sample
Conditions Outcomes Primary FindingsFinal Grade
Data Level
Sample Size
Years Collected
Data Level
Sample Size
Years Collected
Kerr, E.A., et al.; 200431 Diabetes
Mult. VISNs 1285 2000-2001
Mult. Ctrs 6616 2001-2002 DM
Process of care measures of quality as derived from the Diabetes
Quality Improvement,
Project accountability
and measurement
set, Intermediate outcomes,
Patient satisfaction with care
After adjustment, VA significantly outperformed mgd care on all process of
care measures. Intermediate outcome of blood pressure
control was comparable between the two cohorts, however the VA cohort had significantly greater
percentage of patients tight HgbA1C and LDL control.
Patients reported similar overall satisfaction in the two cohorts, though there was significantly greater
satisfaction with diabetes care in the VA. A
Keyhani, S., et al.; 200732
General, prevention Nat’l
171/1009/145 2000-2003 Nat’l 3552/576 2000-2003
Preventive Care
self-reported use of influenza
vaccination, pneumonia
vaccianation, serum
cholesterol screening
Veterans receiving care through VA reported 10% greater use of influenza
vaccination (P<.05), 14% greater use of pneumococcal
vaccination (P<.01), And a nonsignificant
6% greater use of serum cholesterol screening (P=.1), than did veterans receiving
care through Medicare HMOs. Veterans receiving care through Medicare FFS
reported less use of all 4 preventive measures (P<.01) than did veterans receiving
care through Medicare HMOs. B
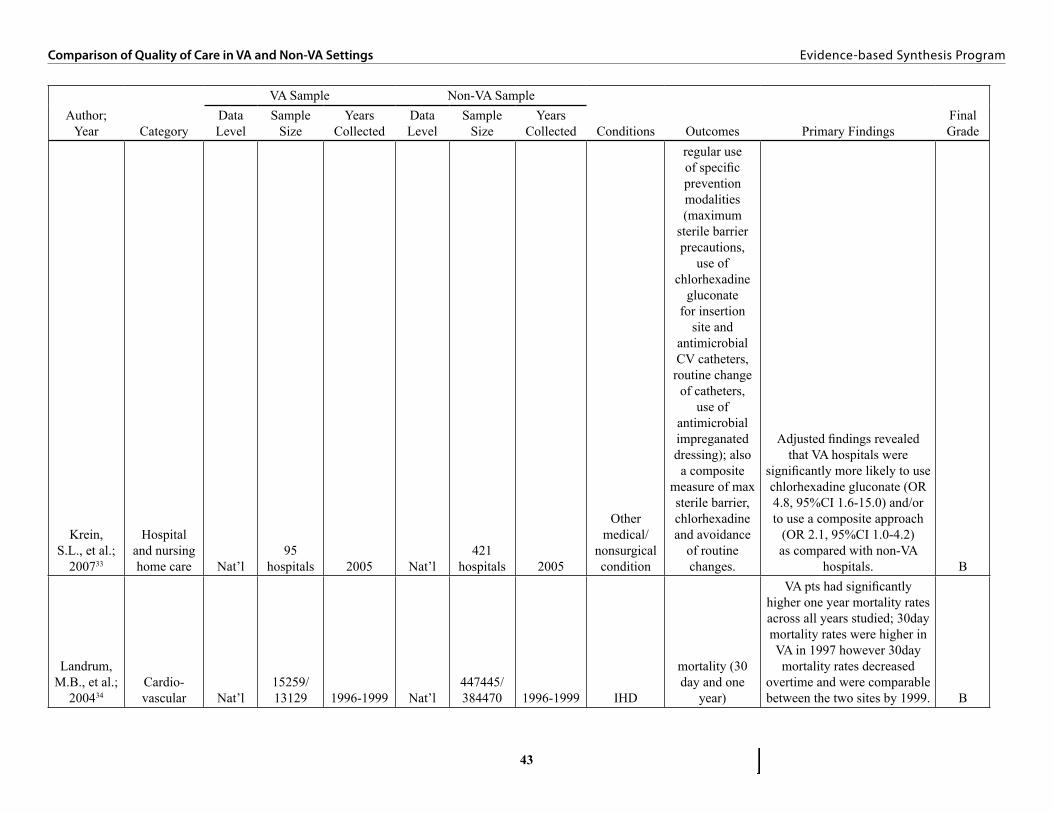
43
Comparison of Quality of Care in VA and Non-VA Settings Evidence-based Synthesis Program
Author; Year Category
VA Sample Non-VA Sample
Conditions Outcomes Primary FindingsFinal Grade
Data Level
Sample Size
Years Collected
Data Level
Sample Size
Years Collected
Krein, S.L., et al.;
200733
Hospital and nursing home care Nat’l
95 hospitals 2005 Nat’l
421 hospitals 2005
Other medical/
nonsurgical condition
regular use of specific prevention modalities (maximum
sterile barrier precautions,
use of chlorhexadine
gluconate for insertion
site and antimicrobial CV catheters, routine change
of catheters, use of
antimicrobial impreganated dressing); also a composite
measure of max sterile barrier, chlorhexadine and avoidance
of routine changes.
Adjusted findings revealed that VA hospitals were
significantly more likely to use chlorhexadine gluconate (OR 4.8, 95%CI 1.6-15.0) and/or to use a composite approach
(OR 2.1, 95%CI 1.0-4.2) as compared with non-VA
hospitals. B
Landrum, M.B., et al.;
200434Cardio-vascular Nat’l
15259/13129 1996-1999 Nat’l
447445/384470 1996-1999 IHD
mortality (30 day and one
year)
VA pts had significantly higher one year mortality rates across all years studied; 30day mortality rates were higher in VA in 1997 however 30day mortality rates decreased
overtime and were comparable between the two sites by 1999. B

44
Comparison of Quality of Care in VA and Non-VA Settings Evidence-based Synthesis Program
Author; Year Category
VA Sample Non-VA Sample
Conditions Outcomes Primary FindingsFinal Grade
Data Level
Sample Size
Years Collected
Data Level
Sample Size
Years Collected
Leslie, D.L., et al.;
200055Mental health Nat’l 181132 1993-1997 Nat’l 12163 1993-1995
Depression, Psychosis/
schizo-phrenia,
other medical/
nonsurgical condition
Readmission rates and outpatient follow-up
care following hospitalization
for a psychiatric or
substance abuse disorder
This study found that, overall, private-sector mental health
inpatients had shorter lengths of stay, more days to the
next inpatient readmission, and lower readmission rates within 14, 30, or 180 days of discharge compared with VA
mentalhealth inpatients. Although
VA patients had higher continuity-of-care scores,
moderately higher proportions of private-sector patients had an outpatient visit within 30 and 180 days after discharge. Private-sector patients also had fewer days to the first outpatient visit and more outpatient visits in the six months after discharge. B
Leslie, D.L., et al.;
200356Mental health Nat’l 2636 2000 Nat’l 1318 2000
Psychosis/schizo-phrenia
adherence to treatment
guidelines for antipsychotic prescribing
Patients in the VA and private sector were equally likely to receive an antipsychotic regimen that complied with
PORT guidelines. B
Nelson, K.M., et al.;
200550 Diabetes Nat’l 254/281 2000 Nat’l 10632 2000 DM
They studied five self-reported
measures of diabetes self-management
and preventive care practices
Persons who received care through the VA were more
likely to report taking a diabetes education class and
HbA1c testing than those covered by private insurance. B
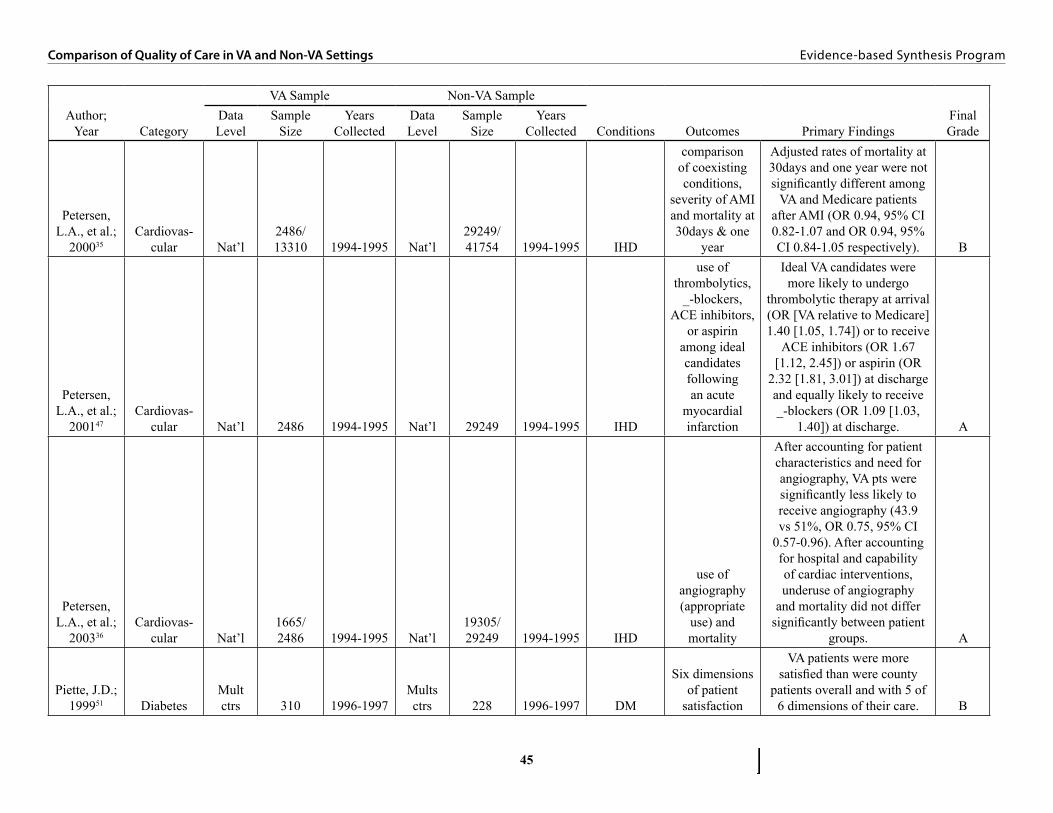
45
Comparison of Quality of Care in VA and Non-VA Settings Evidence-based Synthesis Program
Author; Year Category
VA Sample Non-VA Sample
Conditions Outcomes Primary FindingsFinal Grade
Data Level
Sample Size
Years Collected
Data Level
Sample Size
Years Collected
Petersen, L.A., et al.;
200035Cardiovas-
cular Nat’l2486/13310 1994-1995 Nat’l
29249/41754 1994-1995 IHD
comparison of coexisting conditions,
severity of AMI and mortality at 30days & one
year
Adjusted rates of mortality at 30days and one year were not significantly different among
VA and Medicare patients after AMI (OR 0.94, 95% CI 0.82-1.07 and OR 0.94, 95% CI 0.84-1.05 respectively). B
Petersen, L.A., et al.;
200147Cardiovas-
cular Nat’l 2486 1994-1995 Nat’l 29249 1994-1995 IHD
use of thrombolytics,
_-blockers, ACE inhibitors,
or aspirin among ideal candidates following an acute
myocardial infarction
Ideal VA candidates were more likely to undergo
thrombolytic therapy at arrival (OR [VA relative to Medicare] 1.40 [1.05, 1.74]) or to receive
ACE inhibitors (OR 1.67 [1.12, 2.45]) or aspirin (OR
2.32 [1.81, 3.01]) at discharge and equally likely to receive _-blockers (OR 1.09 [1.03,
1.40]) at discharge. A
Petersen, L.A., et al.;
200336Cardiovas-
cular Nat’l1665/2486 1994-1995 Nat’l
19305/29249 1994-1995 IHD
use of angiography (appropriate
use) and mortality
After accounting for patient characteristics and need for angiography, VA pts were significantly less likely to receive angiography (43.9 vs 51%, OR 0.75, 95% CI
0.57-0.96). After accounting for hospital and capability of cardiac interventions, underuse of angiography
and mortality did not differ significantly between patient
groups. A
Piette, J.D.; 199951 Diabetes
Mult ctrs 310 1996-1997
Mults ctrs 228 1996-1997 DM
Six dimensions of patient
satisfaction
VA patients were more satisfied than were county
patients overall and with 5 of 6 dimensions of their care. B
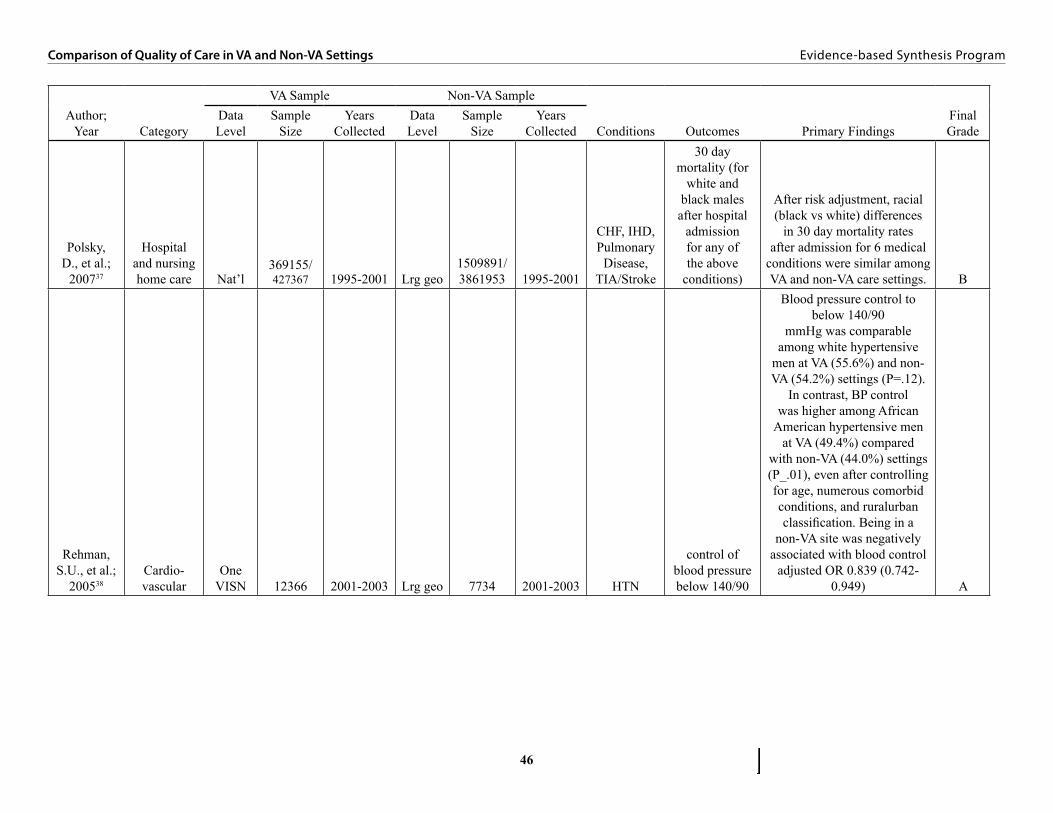
46
Comparison of Quality of Care in VA and Non-VA Settings Evidence-based Synthesis Program
Author; Year Category
VA Sample Non-VA Sample
Conditions Outcomes Primary FindingsFinal Grade
Data Level
Sample Size
Years Collected
Data Level
Sample Size
Years Collected
Polsky, D., et al.;
200737
Hospital and nursing home care Nat’l
369155/427367 1995-2001 Lrg geo
1509891/3861953 1995-2001
CHF, IHD, Pulmonary
Disease, TIA/Stroke
30 day mortality (for
white and black males after hospital
admission for any of the above
conditions)
After risk adjustment, racial (black vs white) differences
in 30 day mortality rates after admission for 6 medical
conditions were similar among VA and non-VA care settings. B
Rehman, S.U., et al.;
200538Cardio-vascular
One VISN 12366 2001-2003 Lrg geo 7734 2001-2003 HTN
control of blood pressure below 140/90
Blood pressure control to below 140/90
mmHg was comparable among white hypertensive
men at VA (55.6%) and non-VA (54.2%) settings (P=.12).
In contrast, BP control was higher among African
American hypertensive men at VA (49.4%) compared
with non-VA (44.0%) settings (P_.01), even after controlling for age, numerous comorbid conditions, and ruralurban classification. Being in a
non-VA site was negatively associated with blood control
adjusted OR 0.839 (0.742-0.949) A
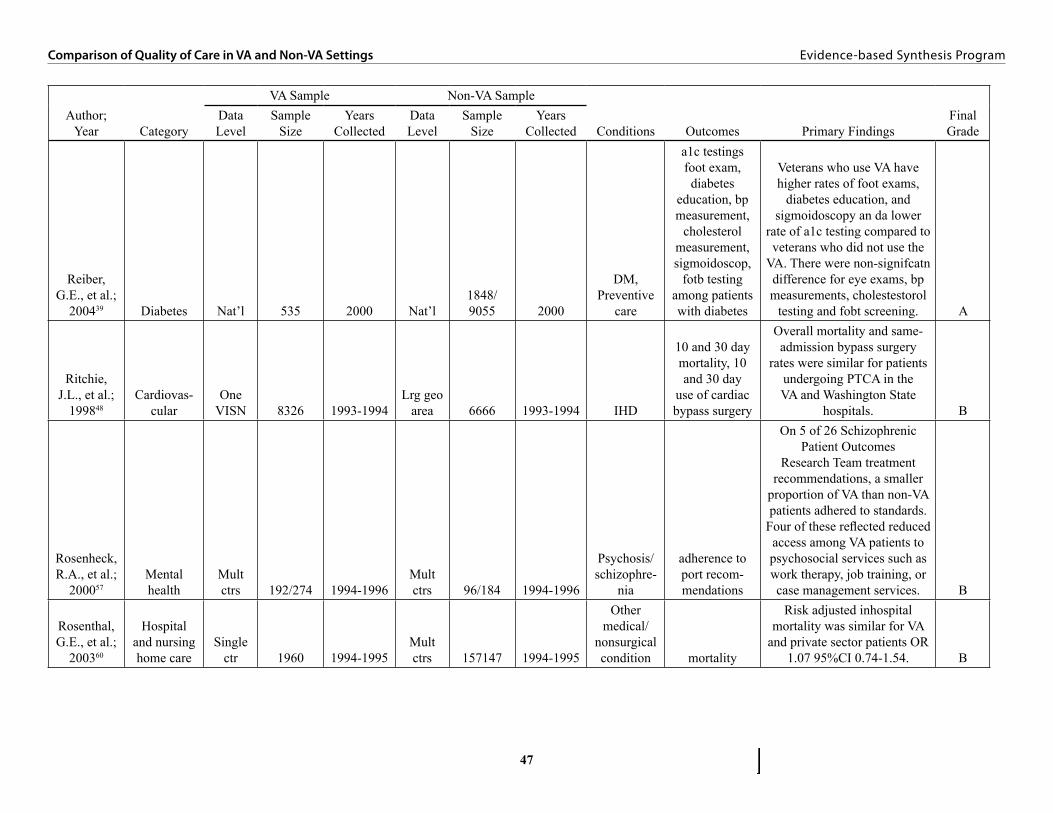
47
Comparison of Quality of Care in VA and Non-VA Settings Evidence-based Synthesis Program
Author; Year Category
VA Sample Non-VA Sample
Conditions Outcomes Primary FindingsFinal Grade
Data Level
Sample Size
Years Collected
Data Level
Sample Size
Years Collected
Reiber, G.E., et al.;
200439 Diabetes Nat’l 535 2000 Nat’l1848/9055 2000
DM, Preventive
care
a1c testings foot exam, diabetes
education, bp measurement,
cholesterol measurement, sigmoidoscop,
fotb testing among patients with diabetes
Veterans who use VA have higher rates of foot exams,
diabetes education, and sigmoidoscopy an da lower
rate of a1c testing compared to veterans who did not use the
VA. There were non-signifcatn difference for eye exams, bp measurements, cholestestorol
testing and fobt screening. A
Ritchie, J.L., et al.;
199848Cardiovas-
cularOne
VISN 8326 1993-1994Lrg geo
area 6666 1993-1994 IHD
10 and 30 day mortality, 10 and 30 day
use of cardiac bypass surgery
Overall mortality and same-admission bypass surgery
rates were similar for patients undergoing PTCA in the VA and Washington State
hospitals. B
Rosenheck, R.A., et al.;
200057Mental health
Mult ctrs 192/274 1994-1996
Mult ctrs 96/184 1994-1996
Psychosis/schizophre-
nia
adherence to port recom-mendations
On 5 of 26 Schizophrenic Patient Outcomes
Research Team treatment recommendations, a smaller
proportion of VA than non-VA patients adhered to standards.
Four of these reflected reduced access among VA patients to psychosocial services such as work therapy, job training, or case management services. B
Rosenthal, G.E., et al.;
200360
Hospital and nursing home care
Single ctr 1960 1994-1995
Mult ctrs 157147 1994-1995
Other medical/
nonsurgical condition mortality
Risk adjusted inhospital mortality was similar for VA
and private sector patients OR 1.07 95%CI 0.74-1.54. B

48
Comparison of Quality of Care in VA and Non-VA Settings Evidence-based Synthesis Program
Author; Year Category
VA Sample Non-VA Sample
Conditions Outcomes Primary FindingsFinal Grade
Data Level
Sample Size
Years Collected
Data Level
Sample Size
Years Collected
Ross, J.S., et al.; 200840
General, mult
conditions Nat’l 10007 2000-2004 Nat’l 393873 2000-2004
DM, IHD, HTN,
Preventive Care
self reported use of 17
recommended health care
services including
cancer prevention,
cardiovascular risk reduction,
diabetes management and infection prevention.
VAMC care was associated with greater use of
recommended services in both years of study (6/17 services
more used in 2000, 12/17 more used in 2004) B
Selim, A.J., et al.;
200641
General, mortality and health
status Nat’l420514/
1.5m 1999-2004 Nat’l584294/879202 1998-2004
Other medical/
nonsurgical condition
Risk adjusted mortality
After adjusting for case-mix, the HR for mortality in the MAP was significantly higher than that in the VA
(HR, 1.404; 95% CI _ 1.383–1.426). B
Selim, A.J., et al.;
200742
General, mortality and health
status Nat’l12177/16725 1998-2000 Nat’l
26225/62614 1998-2000 None
Risk-adjusted 2 year mortality,
change in physical and mental health
status
Higher risk-adjusted mortality in the VA compared to
Medicare Advantage (2 year mortality 7.6% in VA vs.
9.2% in MA); There were no significant differences in the
probability of being alive with the same or better PCS except for the South (VA 65.8% vs. MAP 62.5%, P = .0014).VA patients had a slightly higher
probability than MAP patients of being alive with the same or better MCS (71.8% vs. 70.1%,
P = .002) B
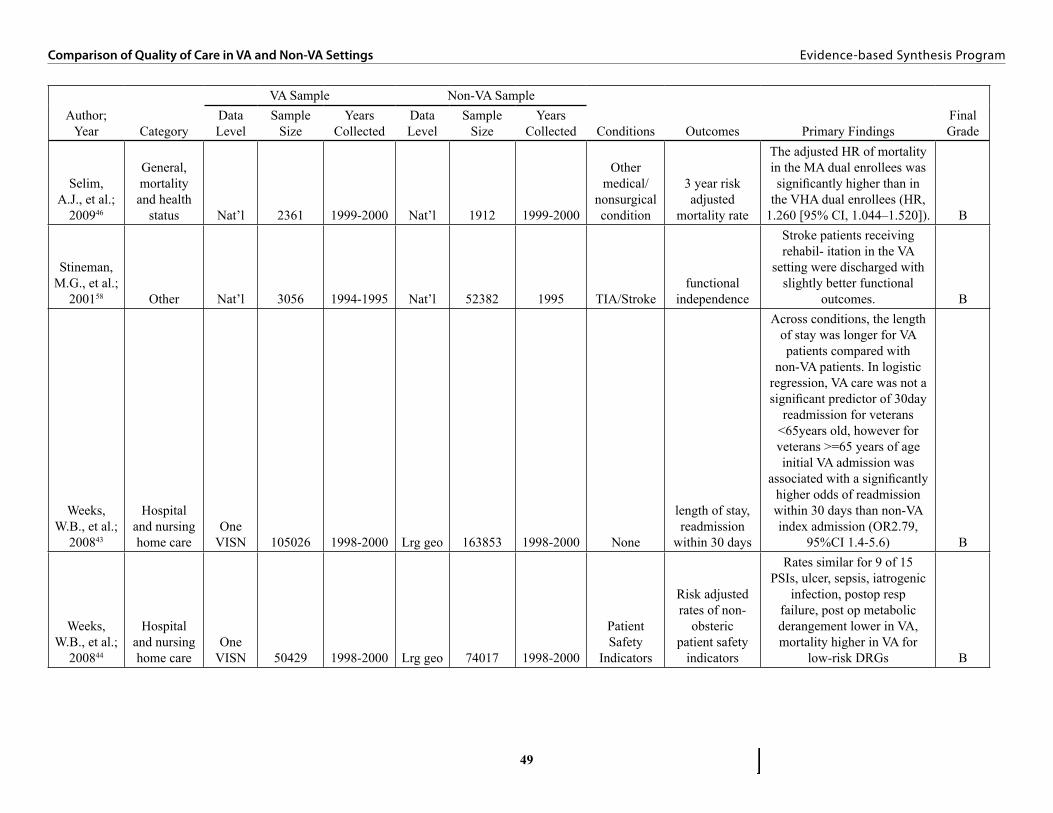
49
Comparison of Quality of Care in VA and Non-VA Settings Evidence-based Synthesis Program
Author; Year Category
VA Sample Non-VA Sample
Conditions Outcomes Primary FindingsFinal Grade
Data Level
Sample Size
Years Collected
Data Level
Sample Size
Years Collected
Selim, A.J., et al.;
200946
General, mortality and health
status Nat’l 2361 1999-2000 Nat’l 1912 1999-2000
Other medical/
nonsurgical condition
3 year risk adjusted
mortality rate
The adjusted HR of mortality in the MA dual enrollees was significantly higher than in
the VHA dual enrollees (HR, 1.260 [95% CI, 1.044–1.520]). B
Stineman, M.G., et al.;
200158 Other Nat’l 3056 1994-1995 Nat’l 52382 1995 TIA/Strokefunctional
independence
Stroke patients receiving rehabil- itation in the VA
setting were discharged with slightly better functional
outcomes. B
Weeks, W.B., et al.;
200843
Hospital and nursing home care
One VISN 105026 1998-2000 Lrg geo 163853 1998-2000 None
length of stay, readmission
within 30 days
Across conditions, the length of stay was longer for VA patients compared with
non-VA patients. In logistic regression, VA care was not a significant predictor of 30day
readmission for veterans <65years old, however for veterans >=65 years of age initial VA admission was
associated with a significantly higher odds of readmission within 30 days than non-VA index admission (OR2.79,
95%CI 1.4-5.6) B
Weeks, W.B., et al.;
200844
Hospital and nursing home care
One VISN 50429 1998-2000 Lrg geo 74017 1998-2000
Patient Safety
Indicators
Risk adjusted rates of non-
obsteric patient safety
indicators
Rates similar for 9 of 15 PSIs, ulcer, sepsis, iatrogenic
infection, postop resp failure, post op metabolic derangement lower in VA, mortality higher in VA for
low-risk DRGs B

50
Comparison of Quality of Care in VA and Non-VA Settings Evidence-based Synthesis Program
Author; Year Category
VA Sample Non-VA Sample
Conditions Outcomes Primary FindingsFinal Grade
Data Level
Sample Size
Years Collected
Data Level
Sample Size
Years Collected
Wright, S.M., et al.;
199949Cardio-vascular Nat’l 14853 1992-1995 Nat’l 32745 1992-1995 IHD
30 day and 1 year adjusted mortality rates
After adjusting for patient characteristics, the odds of 30-day mortality were not
significantly different between patients admitted to VA basic service hospitals (reference) and patients admitted to any other type of hospital within either system of care. The
odds of 1-year mortality were significantly lower in patients admitted to Medi- care cardiac
surgery hospitals (OR 0.88, 95% CI 0.79-0.98) compared
to patients admitted to VA basic service hospitals B
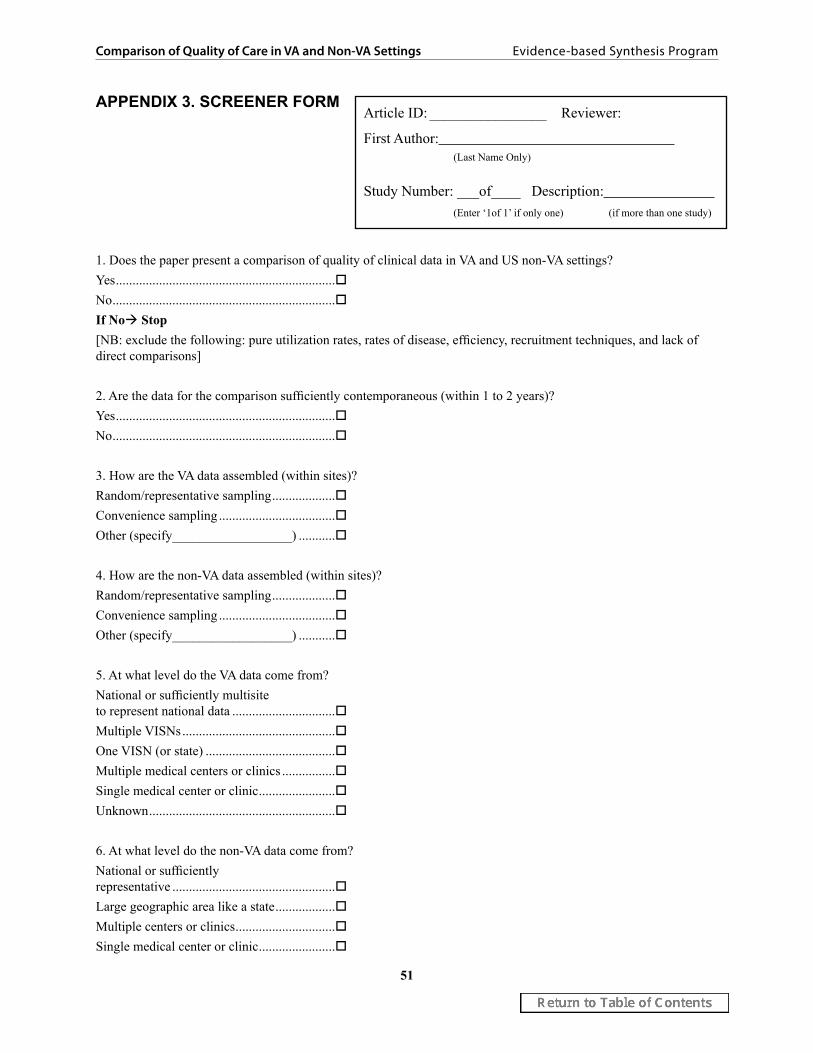
51
Comparison of Quality of Care in VA and Non-VA Settings Evidence-based Synthesis Program
APPENDIX 3. SCREENER FORMArticle ID: ________________ Reviewer:
First Author: (Last Name Only)
Study Number: ___of____ Description: (Enter ‘1of 1’ if only one) (if more than one study)
1. Does the paper present a comparison of quality of clinical data in VA and US non-VA settings?Yes ..................................................................No ................................................................... If No Stop[NB: exclude the following: pure utilization rates, rates of disease, efficiency, recruitment techniques, and lack of direct comparisons]
2. Are the data for the comparison sufficiently contemporaneous (within 1 to 2 years)?Yes ..................................................................No ...................................................................
3. How are the VA data assembled (within sites)? Random/representative sampling ...................Convenience sampling ...................................Other (specify__________________) ...........
4. How are the non-VA data assembled (within sites)? Random/representative sampling ...................Convenience sampling ...................................Other (specify__________________) ...........
5. At what level do the VA data come from?National or sufficiently multisite to represent national data ...............................Multiple VISNs ..............................................One VISN (or state) .......................................Multiple medical centers or clinics ................Single medical center or clinic .......................Unknown ........................................................
6. At what level do the non-VA data come from?National or sufficiently representative .................................................Large geographic area like a state ..................Multiple centers or clinics ..............................Single medical center or clinic .......................
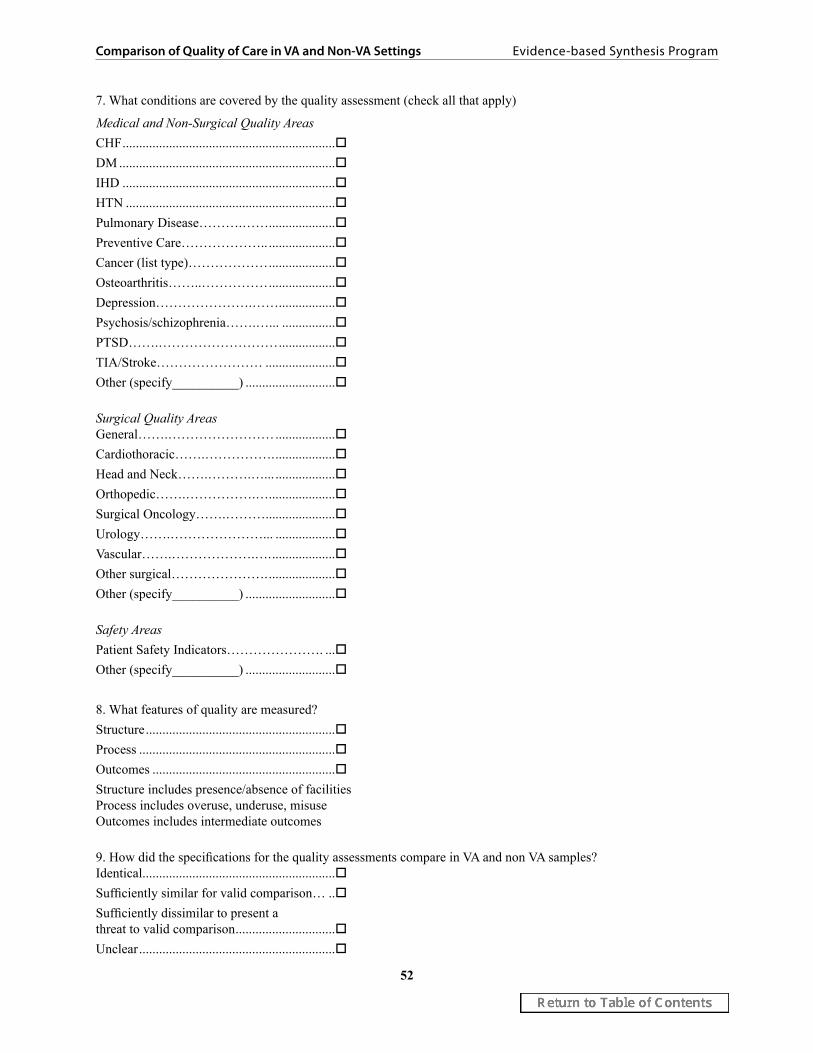
52
Comparison of Quality of Care in VA and Non-VA Settings Evidence-based Synthesis Program
7. What conditions are covered by the quality assessment (check all that apply)
Medical and Non-Surgical Quality AreasCHF ................................................................DM .................................................................IHD ................................................................HTN ...............................................................Pulmonary Disease……….…… ....................Preventive Care……………….. ....................Cancer (list type)……………… ....................Osteoarthritis……..…………… ....................Depression………………….…… .................Psychosis/schizophrenia…….…... ................PTSD…….……………………… .................TIA/Stroke…………………… .....................Other (specify__________) ...........................
Surgical Quality AreasGeneral…….…………………… ..................Cardiothoracic…….……………. ..................Head and Neck…….……….…... ..................Orthopedic…….…………….….. ..................Surgical Oncology…….……….....................Urology…….…………………... ..................Vascular…….……………….…. ...................Other surgical…………………. ....................Other (specify__________) ...........................
Safety AreasPatient Safety Indicators…………………. ...Other (specify__________) ...........................
8. What features of quality are measured?Structure .........................................................Process ...........................................................Outcomes .......................................................Structure includes presence/absence of facilitiesProcess includes overuse, underuse, misuseOutcomes includes intermediate outcomes
9. How did the specifications for the quality assessments compare in VA and non VA samples?Identical ..........................................................Sufficiently similar for valid comparison… ..Sufficiently dissimilar to present a threat to valid comparison ..............................Unclear ...........................................................

53
Comparison of Quality of Care in VA and Non-VA Settings Evidence-based Synthesis Program
APPENDIX 4. DATA ABSTRACTION FORM
Data Abstraction Form: Round Two
Article ID: <<Pre-filled from database>>Reviewer: <<Pre-filled from database>>Author/ Year: <<Pre-filled from database>>VA sample: <<Pre-filled from database>> (random/rep, convenience AND national, multisite, etc.)Non-VA sample: <<Pre-filled from database>> (same two sets of information)Conditions: <<Pre-filled from database>>
Sample size used VA: Non-VA:Years of data collection covered VA: Non-VA:Control variables:Primary outcomes:Findings (adjusted if possible):Secondary/associated findings (optional):Assessment (grade each of the following with A/B/C scale): ___1. Time frames ___2. Samples (both VA and non-VA) ___3. Quality measurements ___4. Outcomes ___5. Importance of measures ___6. Statistical methodsOther/notes:Overall assessment/assignment of level:Rejected (Graded C or lower, or failed to meet prior criteria):

54
Comparison of Quality of Care in VA and Non-VA Settings Evidence-based Synthesis Program
APPENDIX 5. DATA ABSTRACTION GRADING GUIDELINES Assessment (grade levels detailed below):
1. Time framesA. Contemporaneous time framesB. All between A and CC. non-contemporaneous
2. Samples (both VA and non-VA) A. representative or national samples (both VA and non-VA)B. All between A and CC. small, limited, unequal or non-representative samples
3. Quality measurements A. specified and identical measures with a similar assessment format for those measuresB. All between A and CC. dissimilar measures and/or dissimilar assessment methods
4. Outcomes A. outcomes are either well established clinical endpoints or processes strongly associated with well-established clinical endpoints B. All between A and CC. outcomes are structures, processes or clinical endpoints that are not well- established or are indirect measures of quality
5. Importance of measures (e.g. number of clinically relevant indicators, potential impact of indicators)
A. HighB. MediumC. Low
6. Statistical methodsA. Sufficient sample size and/or methods appropriate to address hypothesis(ses)B. All between A and CC. Insufficient sample size and/or methods questionable to address hypothesis(ses)
Overall assessment/assignment of level: Measured as an average of grades assigned above

55
Comparison of Quality of Care in VA and Non-VA Settings Evidence-based Synthesis Program
APPENDIX 6. SEARCH STRATEGY
TOPIC: Veterans Hospitals and Non-Veterans Hospitals Quality of Care – Search Methodology
NOTE: Search strategy was derived from subject terms used in 34 articles provided by the project
Database: PubMedYears Covered: 1996- 2009 (August)Number of results: 432
Search Strategy:hospitals, veterans[MeSH Terms] OR hospitals, veterans[majr] OR hospitals, veterans/standards OR hospitals, veterans/statistics and numerical data OR united states department of veterans affairs OR united states department of veterans affairs/standards OR united states department of veterans affairs/statistics and numerical data OR united states department of veterans affairs/utilization
APPENDIX 7. PEER REVIEw COMMENTS TABLE
Location Comment ChangeExecutive Summary, Background
I am curious about why you do not mention the “Best Care Anywhere” book and others, and only focus upon negative?
Background updated to incorporate suggested
citation.Executive Summary, Conclusion
Might clarify that medication process of care showed VA was better, but procedural process of care not uniformly better (ie angiography).
“…and interventional procedures” added for
clarification.
Hospital and Nursing Home Care, Summary
“Racial mortality differences” to “mortality rates for racial minorities”
Change incorporated
Mental Health, Summary It wasn’t clear in the summary how outpatient follow-up rates could be worse when outpatient continuity was better, so I tried to clarify: “…and [timely] outpatient visit follow-up rates [after discharge] were worse in the VA, but continuity of care [in the outpatient setting]…”
Change incorporated
Conclusions, paragraph 9 Same comments as in the mental health section above: “…equivalent racial mortality differences…” to “equivalent mortality rates across racial groups”
Change incorporated