comparison of piping products among market players using
TRANSCRIPT

IOSR Journal of Business and Management (IOSR-JBM)
e-ISSN: 2278-487X, p-ISSN: 2319-7668. Volume 20, Issue 12. Ver. III (December. 2018), PP 01-17
www.iosrjournals.org
DOI: 10.9790/487X-2012030117 www.iosrjournals.org 1 | Page
Comparison of piping products among market players using
MCDM Techniques: A case study
Dr.Sweta Rani1, Jagdev Singh
2,*
Assistant Professor1, MBA Student
2
Department of MBA, Army Institute of Management, Kolkata, West Bengal, India
Corresponding Author: Jagdev Singh
ABSTRACT: The purpose of this paper is to compare piping products among market players using MCDM
techniques. The main aim of this paper is to know about the category of pipes which are preferred by the
builders and contractors in the Kolkata region and their opinion regarding CPVC pipes and Flow guard
Technology. The central focus is to study the change in trend of PVC/ GI pipes to CPVC/ UPVC and trend in
future and to find out the major influencing factors in currently used product and the major factors taken into
consideration while choosing plumbing piping material by builders and contractors. The study was carried
across major areas in Kolkata region with builders and contractors.
Keywords: Multi Criteria Decision Making (MCDM), criteria,plumbing market, composite score, influencing
factors
----------------------------------------------------------------------------------------------------------------------------- ---------
Date of Submission: 30-11-2018 Date of acceptance: 15-12-2018
----------------------------------------------------------------------------------------------------------------------------- ---------
I. Introduction
Pipes which are commonly used in water supply system are Cast Iron (CI) pipes, Steel pipes,
Galvanized Iron (GI) pipes, Copper pipes, Plastic or Polythene or PVC pipes, Asbestos Cement (AC) pipes,
Concrete pipes. Cast Iron pipes are most commonly used in water distribution system mainly because of high
resistance to corrosion, high durability and are cost effective. Special care has to be taken during transportation
and making connection of these pipes to prevent damage. Usage of steel pipes in water supply system is
suggested when pipes are subjected to a very high pressure (i.e. above 7kg/cm2) and large diameter pipes are
required. Compared to C.I. pipes, Steel pipes are stronger and lighter in weight. Galvanized Iron (GI) pipes are
wrought steel pipes provided with zinc coating and is used for water supply work inside the building. GI pipes
are available in light, medium and heavy grades depending on the thickness of the metal. Copper pipes are used
in hot water installation and have high tensile strength and can therefore have thin walls and can be bent easily.
Plastic or Polythene or PVC pipes are used increasingly these days for supply of cold water in external
and internal plumbing work as these pipes are light in weight, non-corrosive, lower in cost and do not require
any threading for connections. There are 3 common types of plastic pipes available in market. Unplasticized
PVC (UPVC) or rigid pipes are used with cold water and distribution of water with temperature below 450 C.
Plasticized PVC pipes are plasticized with addition of rubber and has lower strength and lower working
temperature than UPVC pipes. Chlorinated PVC (CPVC) pipes can withstand higher temperatures upto 1200and
used to carry hot water. These pipes are costlier than AC pipes but cheaper than GI pipes. Asbestos Cement
(AC) pipes are used for drainage of rainwater from roofs, soil and waste and also for ventilation. AC pipes come
in length of 3 meters and are cheaper than PVC pipes. The principal defects of these pipes are that they are
heavy and they break easily. Unreinforced pipes of small diameters as well as reinforced and prestressed
concrete pipes of large diameters are available for water supply and other uses.
II. Statement Of Problem There is tough competition among the various brands i.e. Supreme, Ashirvad, Astral, Finolex, Prince,
Skipper etc. in the piping industry and each brand is trying to capture the market by providing better products
than its competitors. Ashirvad pipes and Finolex Industries are providing plumbing products which suits the
customer’s requirements better but for the last 3- 4 year, Ashirvad pipes and Finolex industries have been facing
tough competition and is not getting any escape from it and have not been getting much idea of product
differentiation to compete with its competitors. This study helps the company to handle competition in plumbing
market.
Comparison of piping products among market players using MCDM Techniques: A case study
DOI: 10.9790/487X-2012030117 www.iosrjournals.org 2 | Page
III. Objective Fixing the objective is like identifying the star. The objective decides where we want to go, what we want to
achieve and what is our goal or destination. Every study is carried out for the achievement of certain objectives.
Theobjective of this study is:
To find the category of pipes i.e. PVC, CPVC, UPVC, PPR/ PB or GI that is preferred by builders and
contractors.
To evaluate the decision making factors which are affecting builders and contractors regarding CPVC pipes.
To examine the change in trend of preference of PVC/ GI pipes to CPVC/ UPVC and trend in future.
To find out the major influencing factors in currently used product and in choosing plumbing piping material by
builders and contractors.
IV. Scope Of The Study The focus of this study is on increasing the market share of Ashirvad and Finolex pipes within the
piping industry. Company can design its plumbing products as per the needs of the customer and earn customer
satisfaction by serve better than competitors. Ashirvad and Finolex can work on product differentiation and can
differentiate its product with the competitor’s product. Company can measure its performance into plumbing
industry.
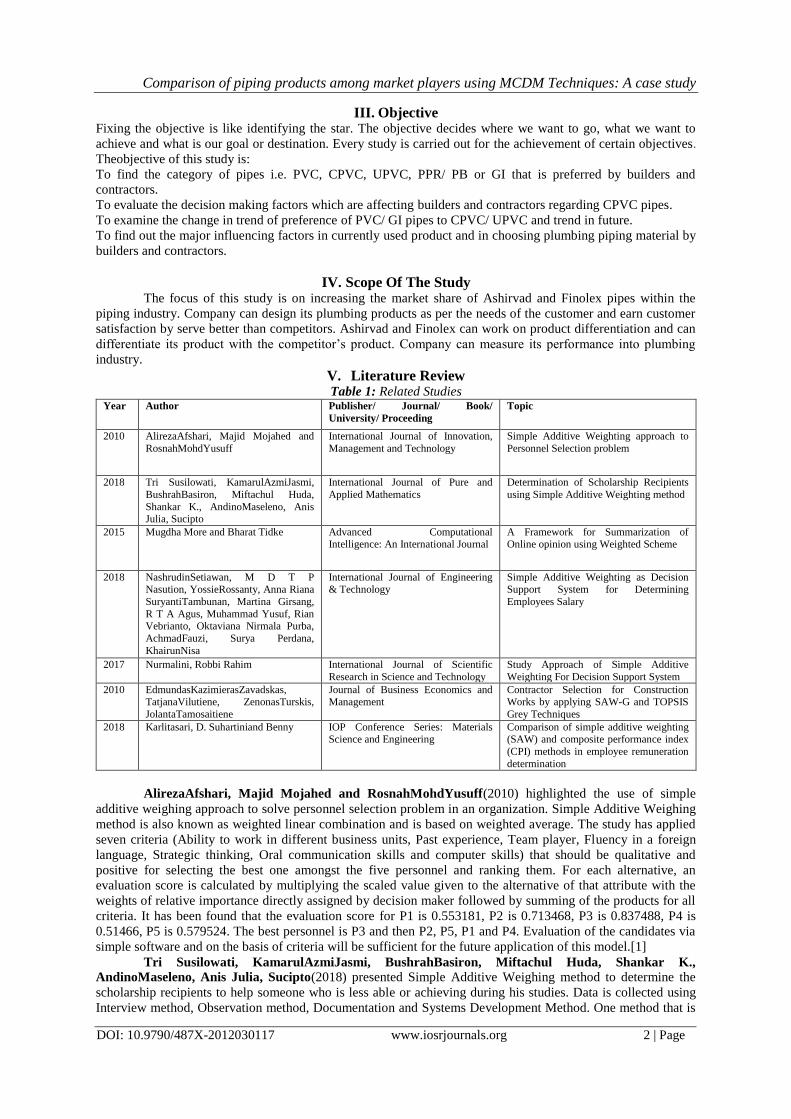
V. Literature Review Table 1: Related Studies
Year Author Publisher/ Journal/ Book/
University/ Proceeding
Topic
2010 AlirezaAfshari, Majid Mojahed and
RosnahMohdYusuff
International Journal of Innovation,
Management and Technology
Simple Additive Weighting approach to
Personnel Selection problem
2018 Tri Susilowati, KamarulAzmiJasmi,
BushrahBasiron, Miftachul Huda,
Shankar K., AndinoMaseleno, Anis Julia, Sucipto
International Journal of Pure and
Applied Mathematics
Determination of Scholarship Recipients
using Simple Additive Weighting method
2015 Mugdha More and Bharat Tidke Advanced Computational Intelligence: An International Journal
A Framework for Summarization of Online opinion using Weighted Scheme
2018 NashrudinSetiawan, M D T P Nasution, YossieRossanty, Anna Riana
SuryantiTambunan, Martina Girsang,
R T A Agus, Muhammad Yusuf, Rian Vebrianto, Oktaviana Nirmala Purba,
AchmadFauzi, Surya Perdana,
KhairunNisa
International Journal of Engineering & Technology
Simple Additive Weighting as Decision Support System for Determining
Employees Salary
2017 Nurmalini, Robbi Rahim International Journal of Scientific
Research in Science and Technology
Study Approach of Simple Additive
Weighting For Decision Support System
2010 EdmundasKazimierasZavadskas, TatjanaVilutiene, ZenonasTurskis,
JolantaTamosaitiene
Journal of Business Economics and Management
Contractor Selection for Construction Works by applying SAW-G and TOPSIS
Grey Techniques
2018 Karlitasari, D. Suhartiniand Benny IOP Conference Series: Materials Science and Engineering
Comparison of simple additive weighting (SAW) and composite performance index
(CPI) methods in employee remuneration
determination
AlirezaAfshari, Majid Mojahed and RosnahMohdYusuff(2010) highlighted the use of simple
additive weighing approach to solve personnel selection problem in an organization. Simple Additive Weighing
method is also known as weighted linear combination and is based on weighted average. The study has applied
seven criteria (Ability to work in different business units, Past experience, Team player, Fluency in a foreign
language, Strategic thinking, Oral communication skills and computer skills) that should be qualitative and
positive for selecting the best one amongst the five personnel and ranking them. For each alternative, an
evaluation score is calculated by multiplying the scaled value given to the alternative of that attribute with the
weights of relative importance directly assigned by decision maker followed by summing of the products for all
criteria. It has been found that the evaluation score for P1 is 0.553181, P2 is 0.713468, P3 is 0.837488, P4 is
0.51466, P5 is 0.579524. The best personnel is P3 and then P2, P5, P1 and P4. Evaluation of the candidates via
simple software and on the basis of criteria will be sufficient for the future application of this model.[1]
Tri Susilowati, KamarulAzmiJasmi, BushrahBasiron, Miftachul Huda, Shankar K.,
AndinoMaseleno, Anis Julia, Sucipto(2018) presented Simple Additive Weighing method to determine the
scholarship recipients to help someone who is less able or achieving during his studies. Data is collected using
Interview method, Observation method, Documentation and Systems Development Method. One method that is

Comparison of piping products among market players using MCDM Techniques: A case study
DOI: 10.9790/487X-2012030117 www.iosrjournals.org 3 | Page
used for Decision Support System is Fuzzy MADM (Multi Attribute Decision Making). Criteria and weights are
required to select the best alternative using Fuzzy Multiple Decision Making (FMADM) method with Simple
Additive Weighing (SAW) method. This study has applied six criteria(Age, Parental income amount, Number of
dependents people, Achievement, Average rating, Personality) and the weights consist of six fuzzy numbers,
very low(SR), low(R), medium(S), middle(T1), high(T2) and very high(ST). The result of analysis shows that
the evaluation score for Student 1 is 2.0, Student 2 is 2.23 and Student 3 is 2.1. Student 2 is chosen as the best
alternative as the greatest score is for Student 2. The built system can assist the selection team to determine the
scholarship receipt.[2]
Mugdha Moreand Bharat Tidke (2015) developed a framework for summarization of online opinion
using weighing scheme. There is a wide use of social media includes various opinion sites, complaints sites,
government sites, question- answering sites ets through which customer gets services, opinion, information etc.
People get confused while taking any decision about particular problem or services due to huge amount of data
on social media. In this study summarization concept is introduced that only show the short and concise manner
summary about service or product so that customer or organization easily understand and take right decision
fast. Summarization framework contain three main phases or steps. In first phase, preprocessing is done in
which stop words are removed and stemming is performed. In second phase, two techniques weight constraint
and association rule are used to identify frequent features. In the last phase, this framework find semantics and
generate the summary so that the customer will be able to take step without confusion. The summary is shown
in form of graphs and in text which are easily understandable.[3]
NashrudinSetiawan, M D T P Nasution, YossieRossanty, Anna Riana SuryantiTambunan,
Martina Girsang, R T A Agus, Muhammad Yusuf, Rian Vebrianto, Oktaviana Nirmala Purba,
AchmadFauzi, Surya Perdana, KhairunNisa(2018) carried an experiment on 62 samples of data to determine
the level of salary increase which greatly affects the motivation and productivity of employees in implementing
and completing the work using Simple Additive Weighing method. This method helps managers to make
quicker and more accurate decision making and is able to select the best alternative from a number of
alternatives that exist based on the criteria specified. The study has specified four criteria i.e. Achievement,
Discipline, Attitude, Years of service and weights 35%, 25%, 25%, 15% respectively. Weights consists of five
fuzzy numbers Very Bad(1), Bad(2), Enough(3), Good(4), Very Good(5). Weighted sum of criteria at each
alternative and at attribute is calculated using normalization decision matrix and then process of raking up is
done to determine the alternative which get increase salary of 5%, 10%, 15% or not at all get a raise.[4]
Nurmalini, Robbi Rahim (2017) studied the approach of Simple Additive Weighing for Decision
Support System. Decision making is the process of selecting the alternative actions to achieve goals or
objectives in an organization. Decision support system is aimed at generating system information which assist
managers in making decisions. Simple Additive Weighing is a method used to solve the problem of multi-
attribute decision making. In this method, sum of the weighted performance rating for each alternative on all
attributes is calculated. It requires a process of normalizing the decision matrix to a scale that can be compared
with all the ratings of existing alternatives. Result of the analysis shows that a decision support system using
Simple Additive Weighing capable of displaying results of the weighing and calculation based on the criteria is
an easy and straightforward and can be done easily due to the simple calculation.[5]
EdmundasKazimierasZavadskas, TatjanaVilutiene, ZenonasTurskis, JolantaTamosaitiene(2010)
applied SAW- G and TOPSIS Grey Techniques to select the contractor for construction works as selection of
right contractor is very important task in construction and choosing from numerous applicants is a complicated
problem. The study uses a well known model of TOPSIS(Technique for Order Preference by Similarity to Ideal
Solution) and Simple Additive Weighting with Grey relations. The study analyzed the effectiveness of MADM
approach method to rank five contractors for the construction works of the wooden houses based on criteria i.e.
Experience of executives, Number of constructed houses, Turnover, Number of executives, Market share,
Production method of wooden houses and weights are established based on the survey that has been carried out
and rating was done on a scale from 1 to 6, where 6 meant “very important” and 1 “not important at all”. It has
been found that the priority order based on the evaluation scores by TOPSIS grey and SAW-G methods for each
contractor is A1>A2>A3>A5>A4 and first alternative contractor must be selected as best performing contractor.
Results of the study showed that TOPSIS grey and SAW-G techniques can be successfully applied for
assessment of alternatives described by multiple criteria.[6]
Karlitasari, D. Suhartiniand Benny (2018) compared the simple additive weighing (SAW) and
composite performance index (CPI) methods in employee remuneration determination. Currently in PT Sepatu
Mas Idaman, Microsoft Excel based spreadsheet where there is the value of criteria that must be calculated for
every employee is used to determine the employee remuneration. This process is time consuming. Simple
Additive Weighting (SAW) method is used to ease the determination of employee remuneration and the criteria
used are ability to work, human relations, job responsibility, discipline, creativity, work, achievement of targets,
and absence. Evaluation score for each and every alternative is calculated taking into account the various

Comparison of piping products among market players using MCDM Techniques: A case study
DOI: 10.9790/487X-2012030117 www.iosrjournals.org 4 | Page
attributes. It has been found that SAW method is faster than the CPI method because SAW method does not
depend on the data pattern while the CPI method depends on data pattern to be processed.[7]
VI. Methodology This research is based on mixed methodology in research where sources of information are collected
from questionnaires. Quantitative research is being used to find the statistical differences between data and
qualitative research is used to examine feelings, attitudes and motivation behind respondents. To achieve the
objectives of the survey, a structured questionnaire was designed to gather primary data from respondents. The
given insights by builders and contractors were analyzed using, multi criteria decision making techniques i.e.
Simple Additive Weighting (SAW) and Population Rating Score or Composite Score. This study is interested in
describing the characteristics of population or phenomenon, thus the study is descriptive study.
Simple Additive Weighting (SAW) is a simple and most often used multi attribute decision technique
and is based on the weighted average. For each alternative, an evaluation score is calculated by multiplying the
scaled value given to the alternative of that attribute with the weighs of relative importance directly assigned by
the decision maker followed by summing of the products for all criteria.
Data Collection Method:
The data were collected from the major areas in South Kolkata region. The methods of collecting data
were being used in study are primary and secondary sources. A structured questionnaire was designed and face
to face interviews with builders and contractors were conducted to gather primary data from respondents.
Database by Indian Institute of Architects (IIA), Builders listed in CREDAI, Various websites like
proptiger.com, just dial, google search, 99acres, magic bricks, housing.com etc were the secondary sources of
data collection. A face to face survey was conducted across 209 respondents which consists of 122 builders and
87 contractors. The techniques used for conducting the study were convenience sampling technique as sample of
respondents was chosen according to convenience.Statistical tools like mean score, percentage, average etc.
were used in study for analysis of data. Charts, figures and graphs were also used to make the data more
represent able and easy to understand. The tools used in this study were MS-EXCEL, multi criteria decision
making techniques i.e. Simple Additive Weighting (SAW) and Population Rating Score or Composite Score.
VII. Data Analysis And Interpretation Category I
The sample size of the following data is 122 builders in the South Kolkata region.
1.Ranking of PVC, CPVC, PPR/ PB, GI and UPVC pipes
In order to find the ranking of PVC, CPVC, PPR/ PB, GI and UPVC pipes, the probability rating score or
composite score for each type of pipe is calculated based on insights by builders. Pipe having the lowest
composite score is ranked first, then second and so on.
Table 2: Probability Rating Score for PVC, CPVC, PPR/ PB, GI and UPVC pipes
PVC CPVC PPR / PB
Rank Freq. Prob. Score Freq. Prob. Score Freq. Prob. Score
1 24 0.20 0.20 62 0.51 0.51 0 0.00 0.00
2 48 0.39 0.79 42 0.34 0.69 0 0.00 0.00
3 46 0.38 1.13 14 0.11 0.34 0 0.00 0.00
4 2 0.02 0.07 4 0.03 0.13 34 0.28 1.11
5 2 0.02 0.08 0 0.00 0.00 88 0.72 3.61
Sum 122 1 2.26 122 1 1.67 122 1 4.72
GI UPVC
Rank Freq. Prob. Score Freq. Prob. Score
1 2 2 0.02 34 0.28 0.28
2 4 4 0.07 28 0.23 0.46
3 14 14 0.34 48 0.39 1.18
4 70 70 2.30 12 0.10 0.39
5 32 32 1.31 0 0.00 0.00
Sum 122 122 4.03 122 1 2.31

Comparison of piping products among market players using MCDM Techniques: A case study
DOI: 10.9790/487X-2012030117 www.iosrjournals.org 5 | Page
Table 3: Ranking of different type of pipes by builders
Item Composite Score Ranking
CPVC 1.67 First
PVC 2.26 Second
UPVC 2.31 Third
GI 4.03 Fourth
PPR/ PB 4.72 Fifth
Analysis: From Table 2, it is found that composite score for PVC is 2.26, CPVC is 1.67, PPR/ PB is 4.72, GI is
4.03 and UPVC is 2.31.
Interpretation: It is found that CPVC has been ranked first, PVC second, UPVC third, GI fourth and PPR/ PB
fifth by builders in the South Kolkata region(Table 3).
2. Opinion about CPVC pipes
The probability rating score or composite score for various attributes i.e. quality, availability, pricing, durability,
ease of use, awareness, communication from company and schemes/offers of the CPVC pipes is calculated
based on the insights by builders and the opinion regarding CPVC pipes is made on basis of calculated
composite score.
Table 4: Opinion regarding CPVC pipes by builders
Quality Availability Pricing
Rank Freq. Prob. Score Freq. Prob. Score Freq. Prob. Score
1 108 0.89 0.89 72 0.59 0.59 14 0.11 0.11
2 14 0.11 0.23 42 0.34 0.69 96 0.79 1.57
3 0 0.00 0.00 8 0.07 0.20 12 0.10 0.30
Sum 122 1 1.11 122 1 1.48 122 1 1.98
Durability Ease of Use Awareness
Rank Freq. Prob. Score Freq. Prob. Score Freq. Prob. Score
1 94 0.77 0.77 92 0.75 0.75 38 0.31 0.31
2 28 0.23 0.46 18 0.15 0.30 48 0.39 0.79
3 0 0.00 0.00 12 0.10 0.30 36 0.30 0.89
Sum 122 1 1.23 122 1 1.34 122 1 1.98
Communication from company Schemes/ Offers
Rank Freq. Prob. Score Freq. Prob. Score
1 58 0.48 0.48 26 0.21 0.21
2 36 0.30 0.59 24 0.20 0.39
3 28 0.23 0.69 72 0.59 1.77
Sum 122 1 1.75 122 1 2.38
Table 5: Composite Score for various attributes with reference to CPVC pipes
Attributes Composite Score
Quality 1.11
Availability 1.48
Pricing 1.98
Durability 1.23
Ease of Use 1.34
Awareness 1.98
Communication from Company 1.75
Schemes/ offers 2.38

Comparison of piping products among market players using MCDM Techniques: A case study
DOI: 10.9790/487X-2012030117 www.iosrjournals.org 6 | Page
Analysis:From Table 4 and Table 5, it is found that composite score for Quality is 1.11, Availability is 1.48,
Pricing is 1.98, Durability is 1.23, Ease of Use is 1.34, Awareness is 1.98, Communication from Company is
1.75, Schemes/ offers is 2.38.
Interpretation: Quality of CPVC pipes is good. Builders have found CPVC pipes to be durable and easy to use.
Pricing, awareness and Schemes/ offers are matter of concerns among the builders(Table 5).
3. Opinion about Flow guard Technology
Sum of weighted score for each attribute i.e. Quality, Availability, Pricing, Durability, Ease of Use, Awareness,
Communication from company and Schemes/ offers of pipes other than Ashirvad and Finolex using Flowguard
Technology is calculated based on the insights given by builders.
Table 6: Sum of weighted score for each attribute(Si)
Weight 1 2 3 Si
Good/ High Okay/ Medium Low/ Bad
Quality 30 10 8 74
Availability 22 20 6 80
Pricing 4 32 12 104
Durability 34 4 10 72
Ease of Use 34 2 12 74
Awareness 14 10 24 106
Communication from
Company 8 10 30 118
Schemes/ Offers 6 8 34 124
In table 6, each attribute regarding Flowguard Technology is rated under one of 3 categories and weights are
assigned(1 represents Good/ High, 2 represents Okay/ Medium, 3 represents Low/ Bad) by builders who know
about Flowguard Technology and sum of weighted score for each attribute is calculated.
Analysis:From Table 6, it is found that Sum of weighted score for Quality is 74, Availability is 80, Pricing is
104, Durability is 72, Ease of Use is 74, Awareness is 106, Communication from Company is 118, Schemes/
Offers is 124.
Interpretation: Based on the analysis, it is found that pipes other than Ashirwad and Finolex having Flowguard
Technology used by builders are durable, easy to use and of good quality.
4. Change in trend of PVC/ GI pipes
Change in trend of PVC/ GI pipes means to find the number of builders who see any change in trend of PVC/ GI
pipes usage, like CPVC pipes replacing PVC/ GI pipes or any other Piping System.
Table 7: Change in trend of PVC/ GI pipes
Particular Total N(%)
0 20(16.4)
1 102(83.6)
Fig. 1. Change in trend of PVC/ GI pipes
In table 7, N depicts the total number of builders who have been interviewed(N=122). “1” represents the number
of builders who see CPVC replacing PVC/ GI pipes and “0” represents number of builders who see UPVC
replacing PVC/ GI pipes.
Interpretation: From the Figure 1, it is found that84% of the builders see CPVC replacing PVC/ GI pipes and
16% of the builders see UPVC replacing PVC/ GI pipes.
16%
84%
Change in trend of PVC/ GI pipes(N=122)
UPVC
CPVC
Comparison of piping products among market players using MCDM Techniques: A case study
DOI: 10.9790/487X-2012030117 www.iosrjournals.org 7 | Page
5. Shift of usage from PVC to CPVC and trend in future.
Shift of usage from PVC to CPVC and trend in future means to find out how much shift of usage from PVC to
CPVC the builders see in their projects in the last 1-2 years and to find out the number of builders who see this
trend to grow, steady or decline in future.
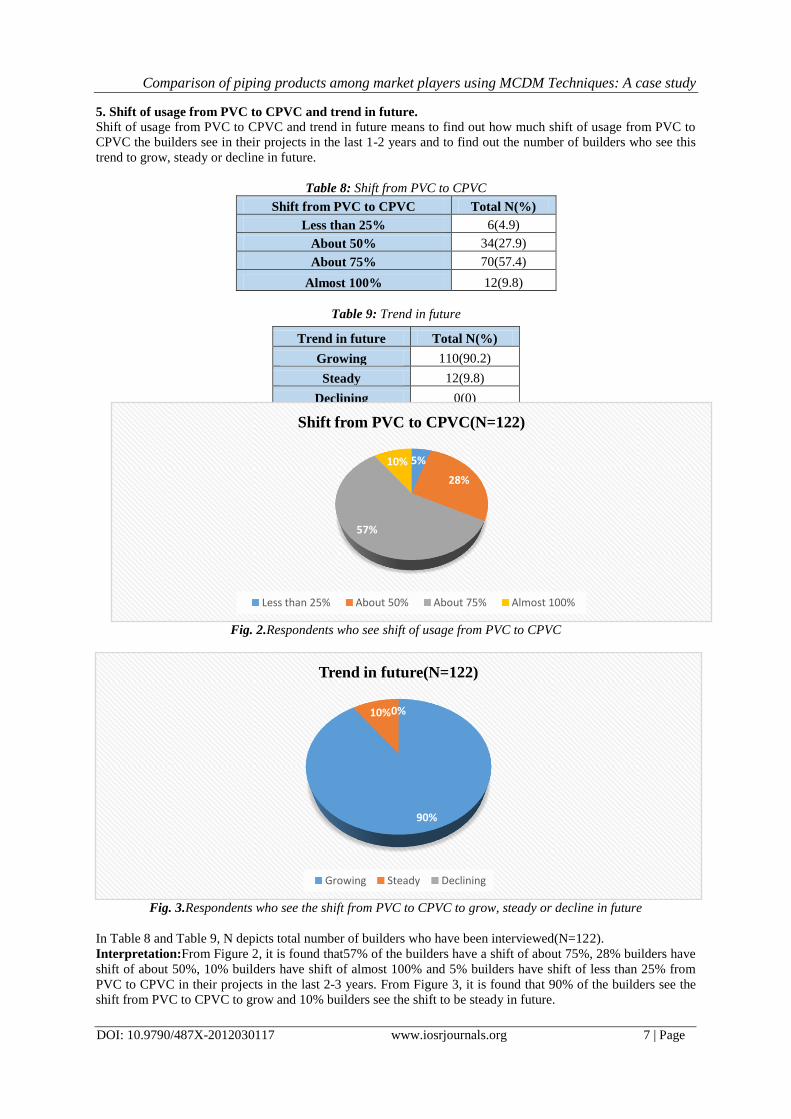
Table 8: Shift from PVC to CPVC
Shift from PVC to CPVC Total N(%)
Less than 25% 6(4.9)
About 50% 34(27.9)
About 75% 70(57.4)
Almost 100% 12(9.8)
Table 9: Trend in future
Fig. 2.Respondents who see shift of usage from PVC to CPVC
Fig. 3.Respondents who see the shift from PVC to CPVC to grow, steady or decline in future
In Table 8 and Table 9, N depicts total number of builders who have been interviewed(N=122).
Interpretation:From Figure 2, it is found that57% of the builders have a shift of about 75%, 28% builders have
shift of about 50%, 10% builders have shift of almost 100% and 5% builders have shift of less than 25% from
PVC to CPVC in their projects in the last 2-3 years. From Figure 3, it is found that 90% of the builders see the
shift from PVC to CPVC to grow and 10% builders see the shift to be steady in future.
90%
10%0%
Trend in future(N=122)
Growing Steady Declining
Trend in future Total N(%)
Growing 110(90.2)
Steady 12(9.8)
Declining 0(0)
5%
28%
57%
10%
Shift from PVC to CPVC(N=122)
Less than 25% About 50% About 75% Almost 100%

Comparison of piping products among market players using MCDM Techniques: A case study
DOI: 10.9790/487X-2012030117 www.iosrjournals.org 8 | Page
6. Major influencing factors in currently used product by builders
The probability rating score or composite score for various attributes i.e. Habit, Trust, Convenience,
Dealer Push, Branding, Quality, Price, Pre- Sales Technical Services, Post- Sales Technical Services and
Promotions in currently used product is calculated based on the insights by builders and the attributes with the
lowest composite score are the major influencing factors in currently used product.
Table 10: Major influencing factors in currently used product Habit Trust Convenience Dealer Push
Rank Freq. Prob. Score Freq. Prob. Score Freq. Prob. Score Freq. Prob. Score
1 22 0.18 0.18 42 0.34 0.34 62 0.51 0.51 12 0.10 0.10
2 100 0.82 1.64 80 0.66 1.31 60 0.49 0.98 110 0.90 1.80
Sum 122 1 1.82 122 1 1.66 122 1 1.49 122 1 1.90
Branding Quality Price
Rank Freq. Prob. Score Freq. Prob. Score Freq. Prob. Score
1 50 0.41 0.41 114 0.93 0.93 110 0.90 0.90
2 72 0.59 1.18 8 0.07 0.13 12 0.10 0.20
Sum 122 1 1.59 122 1 1.07 122 1 1.10
Pre- Sales Technical Services Post Sales Technical Services Promotions
Rank Freq. Prob. Score Freq. Prob. Score Freq. Prob. Score
1 14 0.11 0.11 14 0.11 0.11 18 0.15 0.15
2 108 0.89 1.77 108 0.89 1.77 104 0.85 1.70
Sum 122 1 1.89 122 1 1.89 122 1 1.85
Table 11: Composite Score for various attributes
Attributes Composite Score
Habit 1.82
Trust 1.66
Convenience 1.49
Dealer Push 1.9
Branding 1.59
Quality 1.07
Price 1.1
Pre- Sales Technical Services 1.89
Post Sales Technical Services 1.89
Promotions 1.85
Analysis: It is found that composite score for Habit is 1.82, Trust is 1.66, Convenience is 1.49, Dealer Push is
1.9, Branding is 1.59, Quality is 1.07, Price is 1.1, Pre- Sales Technical Services is 1.89, Post Sales Technical
Services is 1.89, and Promotions is 1.85(Table 10).
Interpretation: From Table 11, it is found that Quality, Price and Convenience are the major influencing
factors for builders in the currently used product based on the analysis.
7. Importance and factors taken into consideration while choosing plumbing piping material
The probability rating score or composite score for various attributes i.e. Quality, Convenience, Technology,
Brand Name, Availability, Pricing, Durability, Ease of Use, Awareness, Communication from Company,
Schemes/ offers is calculated based on the insights by builders and the attributes with the lowest composite
score are the major factors taken into consideration while choosing plumbing piping material by builders.
Table 12: Importance of plumbing piping material
Importance of plumbing piping material Total N(%)
Not very Important 0(0)
Important 28(23.0)
Moderately Important 18(14.8)
Extremely Important 76(62.3)

Comparison of piping products among market players using MCDM Techniques: A case study
DOI: 10.9790/487X-2012030117 www.iosrjournals.org 9 | Page
Fig. 4.Importance of Plumbing Piping Material among the respondents
In Table 13, N depicts the total number of builders who have been interviewed (N=122).
Table 13:Factors influencing the builders in choosing plumbing material Quality Convenience Technology Brand Name
Rank Freq. Prob. Score Freq. Prob. Score Freq. Prob. Score Freq. Prob. Score
1 100 0.82 0.82 12 0.10 0.10 62 0.51 0.51 46 0.38 0.38
2 22 0.18 0.36 110 0.90 1.80 60 0.49 0.98 76 0.62 1.25
Sum 122 1 1.18 122 1 1.90 122 1 1.49 122 1 1.62
Availability Pricing Durability Ease of Use
Rank Freq. Prob. Score Freq. Prob. Score Freq. Prob. Score Freq. Prob. Score
1 72 0.59 0.59 82 0.67 0.67 80 0.66 0.66 58 0.48 0.48
2 50 0.41 0.82 40 0.33 0.66 42 0.34 0.69 64 0.52 1.05
Sum 122 1 1.41 122 1 1.33 122 1 1.34 122 1 1.52
Awareness Communication from Company Schemes/ Offers
Rank Freq. Prob. Score Freq. Prob. Score Freq. Prob. Score
1 24 0.20 0.20 26 0.21 0.21 8 0.07 0.07
2 98 0.80 1.61 96 0.79 1.57 114 0.93 1.87
Sum 122 1 1.80 122 1 1.79 122 1 1.93
Table 14: Composite Score for various attributes
Attributes Composite Score
Quality 1.18
Convenience 1.9
Technology 1.49
Brand Name 1.62
Availability 1.41
Pricing 1.33
Durability 1.34
Ease of Use 1.52
Awareness 1.8
Communication from company 1.79
Schemes/ offers 1.93
Analysis:From Table 13, it is found that composite score for Quality is 1.18, Convenience is 1.9, Technology is
1.49, Brand Name is 1.62, Availability is 1.41, Pricing is 1.33, Durability is 1.34, Ease of Use is 1.52,
Awareness is 1.8, Communication from company is 1.79, Schemes/ offers is 1.93.
Interpretation: From Figure 4, it is found that 62% of the builders finds the plumbing piping material
extremely important, 15% builders finds it moderately important and 23% builders finds it important. Quality,
Pricing and Durability are the major factors taken into consideration while choosing Plumbing Piping Material
by builders (Table 14).
0%23%
15%62%
Importance of Plumbing Piping Material(N=122)
Not very Important Important Moderately Important Extremely Important

Comparison of piping products among market players using MCDM Techniques: A case study
DOI: 10.9790/487X-2012030117 www.iosrjournals.org 10 | Page
Category II The sample size of the following data is 87 contractors in the South Kolkata region.
1.Ranking of PVC, CPVC, PPR/ PB, GI and UPVC pipes
In order to find the ranking of PVC, CPVC, PPR/ PB, GI and UPVC pipes, the probability rating score or
composite score for each type of pipe is calculated based on insights by contractors. Pipe having the lowest
composite score is ranked first, then second and so on.
Table 15: Probability Rating Score for PVC, CPVC, PPR/ PB, GI and UPVC pipes
PVC CPVC PPR / PB
Rank Freq. Prob. Score Freq. Prob. Score Freq. Prob. Score
1 13 0.15 0.15 46 0.53 0.53 0 0.00 0.00
2 28 0.32 0.64 33 0.38 0.76 0 0.00 0.00
3 40 0.46 1.38 6 0.07 0.21 1 0.01 0.03
4 3 0.03 0.14 1 0.01 0.05 27 0.31 1.24
5 3 0.03 0.17 1 0.01 0.06 59 0.68 3.39
Sum 87 1 2.48 87 1 1.60 87 1 4.67
GI UPVC
Rank Freq. Prob. Score Freq. Prob. Score
1 1 0.01 0.01 27 0.31 0.31
2 2 0.02 0.05 24 0.28 0.55
3 11 0.13 0.38 29 0.33 1.00
4 51 0.59 2.34 5 0.06 0.23
5 22 0.25 1.26 2 0.02 0.11
Sum 87 1 4.05 87 1 2.21
Table 16: Ranking of different type of pipes by contractors
Item Composite Score Ranking
CPVC 1.6 First
PVC 2.48 Third
UPVC 2.21 Second
GI 4.05 Fourth
PPR/ PB 4.67 Fifth
Analysis: From Table 15, it is found that composite score for PVC is 2.48, CPVC is 1.6, PPR/ PB is 4.67, GI is
4.05 and UPVC is 2.21.
Interpretation: It is found that CPVC has been ranked first, UPVC second, PVC third, GI fourth and PPR/ PB
fifth by contractors in the South Kolkata region(Table 16).
2. Opinion about CPVC pipes
The probability rating score or composite score for various attributes i.e. quality, availability, pricing, durability,
ease of use, awareness, communication from company and schemes/offers of the CPVC pipes is calculated
based on the insights by contractors and the opinion regarding CPVC pipes is made on basis of calculated
composite score.
Table 17: Opinion regarding CPVC pipes by contractors
Quality Availability Pricing
Rank Freq. Prob. Score Freq. Prob. Score Freq. Prob. Score
1 80 0.92 0.92 54 0.62 0.62 11 0.13 0.13
2 7 0.08 0.16 29 0.33 0.67 66 0.76 1.52
3 0 0.00 0.00 4 0.05 0.14 10 0.11 0.34
Sum 87 1.00 1.08 87 1.00 1.43 87 1.00 1.99

Comparison of piping products among market players using MCDM Techniques: A case study
DOI: 10.9790/487X-2012030117 www.iosrjournals.org 11 | Page
Durability Ease of Use Awareness
Rank Freq. Prob. Score Freq. Prob. Score Freq. Prob. Score
1 65 0.75 0.75 66 0.76 0.76 31 0.36 0.36
2 22 0.25 0.51 13 0.15 0.30 26 0.30 0.60
3 0 0.00 0.00 8 0.09 0.28 30 0.34 1.03
Sum 87 1.00 1.25 87 1.00 1.33 87 1.00 1.99
Communication from company Schemes/ Offers
Rank Freq. Prob. Score Freq. Prob. Score
1 39 0.45 0.45 15 0.17 0.17
2 26 0.30 0.60 18 0.21 0.41
3 22 0.25 0.76 54 0.62 1.86
Sum 87 1.00 1.80 87 1.00 2.45
Table 18: Composite Score for various attributes with reference to CPVC pipes
Attributes Composite Score
Quality 1.08
Availability 1.43
Pricing 1.99
Durability 1.25
Ease of Use 1.33
Awareness 1.99
Communication from Company 1.8
Schemes/ Offers 2.45
Analysis: From Table 17 and Table 18, it is found that composite score for Quality is 1.08, Availability is 1.43,
Pricing is 1.99, Durability is 1.25, Ease of Use is 1.33, Awareness is 1.99, Communication from Company is
1.8, Schemes/ offers is 2.45.
Interpretation: Quality of CPVC pipes is good. Contractors have found CPVC pipes to be durable and easy to
use. Pricing, Awareness and Schemes/ Offers are matter of concerns among the contractors(Table 18).
3. Opinion about Flowguard Technology
Sum of weighted score for each attribute i.e. Quality, Availability, Pricing, Durability, Ease of Use, Awareness,
Communication from company and Schemes/ offers of pipes other than Ashirvad and Finolex using Flowguard
Technology is calculated based on the insights given by contractors.
Table 19: Sum of weighted score for each attribute (Si)
Weight 1 2 3 Si
Good/ High Okay/ Medium Low/ Bad
Quality 23 5 4 45
Availability 11 18 3 56
Pricing 2 20 10 72
Durability 19 4 9 54
Ease of Use 19 7 6 51
Awareness 7 9 16 73
Communication from Company 10 5 17 71
Schemes/ Offers 3 6 23 84
In table 19, each attribute regarding Flowguard Technology is rated under one of 3 categories and
weights are assigned(1 represents Good/ High, 2 represents Okay/ Medium, 3 represents Low/ Bad by
contractors who know about Flowguard Technology and sum of weighted score for each attribute is calculated.

Comparison of piping products among market players using MCDM Techniques: A case study
DOI: 10.9790/487X-2012030117 www.iosrjournals.org 12 | Page
Analysis: From Table 19, it is found that Sum of weighted score for Quality is 45, Availability is 59, Pricing is
72, Durability is 54, Ease of Use is 51, Awareness is 73, Communication from Company is 71, Schemes/ Offers
is 84.
Interpretation: Based on the analysis, it is found that pipes other than Ashirvad and Finolex having Flowguard
Technology used by contractors are of good quality, easy to use and durable.
4. Change in trend of PVC/ GI pipes
Change in trend of PVC/ GI pipes means to find the number of contractors who see any change in trend of PVC/
GI pipes usage, like CPVC pipes replacing PVC/ GI pipes or any other Piping System.
Table 20: Change in trend of PVC/ GI pipes
Particular Total N(%)
0 29(33.3)
1 58(66.7)
Fig. 5. Change in trend of PVC/ GI pipes
In table 20, N depicts the total number of contractors who have been interviewed(N=87). Under particulars, “1”
represents the number of contractors who see CPVC replacing PVC/ GI pipes and “0” represents number of
contractors who see UPVC replacing PVC/ GI pipes.
Interpretation: From the Figure 5, it is found that 67% of the contractors see CPVC replacing PVC/ GI pipes
and 33% of the contractors see UPVC replacing PVC/ GI pipes.
5. Shift of usage from PVC to CPVC and trend in future.
Shift of usage from PVC to CPVC and trend in future means to find out how much shift of usage from PVC to
CPVC the contractors see in their projects in the last 1-2 years and to find out the number of contractors who see
this trend to grow, steady or decline in future.
Table 21: Shift from PVC to CPVC
Shift from PVC to CPVC Total N(%)
Less than 25% 5(5.7)
About 50% 25(28.7)
About 75% 45(51.7)
Almost 100% 12(13.8)
Table 22: Trend in future
33%
67%
Change in trend of PVC/ GI pipes(N=87)
UPVC
CPVC
Trend in future Total N(%)
Growing 81(93.1)
Steady 6(6.9)
Declining 0(0)

Comparison of piping products among market players using MCDM Techniques: A case study
DOI: 10.9790/487X-2012030117 www.iosrjournals.org 13 | Page
Fig. 6. Respondents who see shift of usage from PVC to CPVC
Fig. 7.Respondents who see the shift from PVC to CPVC to grow, steady or decline in future
In Table 21 and Table 22, N depicts total number of contractors who have been interviewed(N=87).
Interpretation: From Figure 6, it is found that51% of the contractors have a shift of about 75%, 29%
contractors have shift of about 50%, 14% contractors have shift of almost 100% and 6% contractors have shift
of less than 25% from PVC to CPVC in their projects in the last 2-3 years. From Figure 7, it is found that 93%
of the contractors see the shift from PVC to CPVC to grow and 7% contractors see the shift to be steady in
future.
6. Major influencing factors in currently used product by contractors
The probability rating score or composite score for various attributes i.e. Habit, Trust, Convenience, Dealer
Push, Branding, Quality, Price, Pre- Sales Technical Services, Post- Sales Technical Services and Promotions in
currently used product is calculated based on the insights by contractors and the attributes with the lowest
composite score are the major influencing factors in currently used product.
Table 23: Major influencing factors in currently used product Habit Trust Convenience Dealer Push
Rank Freq. Prob. Score Freq. Prob. Score Freq. Prob. Score Freq. Prob. Score
1 17 0.20 0.20 41 0.47 0.47 39 0.45 0.45 10 0.11 0.11
2 70 0.80 1.61 46 0.53 1.06 48 0.55 1.10 77 0.89 1.77
Sum 87 1 1.80 87 1 1.53 87 1 1.55 87 1 1.89
Branding Quality Price
Rank Freq. Prob. Score Freq. Prob. Score Freq. Prob. Score
1 39 0.45 0.45 83 0.95 0.95 79 0.91 0.91
2 48 0.55 1.10 4 0.05 0.09 8 0.09 0.18
Sum 87 1 1.55 87 1 1.05 87 1 1.09
6%
29%
51%
14%
Shift from PVC to CPVC(N=87)
Less than 25%
About 50%
About 75%
Almost 100%
93%
7% 0%
Trend in future(N=87)
Growing
Steady
Declining
Comparison of piping products among market players using MCDM Techniques: A case study
DOI: 10.9790/487X-2012030117 www.iosrjournals.org 14 | Page
Pre- Sales Technical Services Post Sales Technical Services Promotions
Rank Freq. Prob. Score Freq. Prob. Score Freq. Prob. Score
1 9 0.10 0.10 11 0.13 0.13 17 0.20 0.20
2 78 0.90 1.79 76 0.87 1.75 70 0.80 1.61
Sum 87 1 1.90 87 1 1.87 87 1 1.80
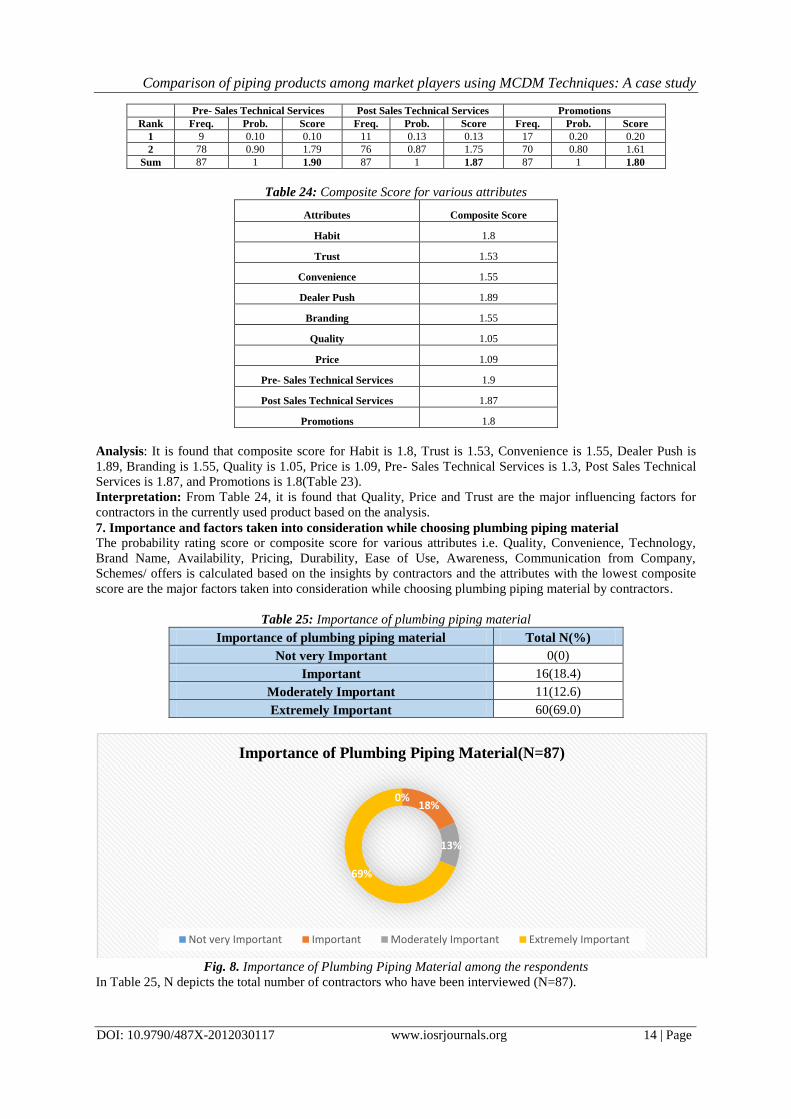
Table 24: Composite Score for various attributes
Attributes Composite Score
Habit 1.8
Trust 1.53
Convenience 1.55
Dealer Push 1.89
Branding 1.55
Quality 1.05
Price 1.09
Pre- Sales Technical Services 1.9
Post Sales Technical Services 1.87
Promotions 1.8
Analysis: It is found that composite score for Habit is 1.8, Trust is 1.53, Convenience is 1.55, Dealer Push is
1.89, Branding is 1.55, Quality is 1.05, Price is 1.09, Pre- Sales Technical Services is 1.3, Post Sales Technical
Services is 1.87, and Promotions is 1.8(Table 23).
Interpretation: From Table 24, it is found that Quality, Price and Trust are the major influencing factors for
contractors in the currently used product based on the analysis.
7. Importance and factors taken into consideration while choosing plumbing piping material
The probability rating score or composite score for various attributes i.e. Quality, Convenience, Technology,
Brand Name, Availability, Pricing, Durability, Ease of Use, Awareness, Communication from Company,
Schemes/ offers is calculated based on the insights by contractors and the attributes with the lowest composite
score are the major factors taken into consideration while choosing plumbing piping material by contractors.
Table 25: Importance of plumbing piping material
Importance of plumbing piping material Total N(%)
Not very Important 0(0)
Important 16(18.4)
Moderately Important 11(12.6)
Extremely Important 60(69.0)
Fig. 8. Importance of Plumbing Piping Material among the respondents
In Table 25, N depicts the total number of contractors who have been interviewed (N=87).
0%18%
13%
69%
Importance of Plumbing Piping Material(N=87)
Not very Important Important Moderately Important Extremely Important

Comparison of piping products among market players using MCDM Techniques: A case study
DOI: 10.9790/487X-2012030117 www.iosrjournals.org 15 | Page
Table 26: Factors influencing the contractors in choosing plumbing material Quality Convenience Technology Brand Name
Rank Freq. Prob. Score Freq. Prob. Score Freq. Prob. Score Freq. Prob. Score
1 74 0.85 0.85 12 0.14 0.14 43 0.49 0.49 31 0.36 0.36
2 13 0.15 0.30 75 0.86 1.72 44 0.51 1.01 56 0.64 1.29
Sum 87 1 1.15 87 1 1.86 87 1 1.51 87 1 1.64
Availability Pricing Durability Ease of Use
Rank Freq. Prob. Score Freq. Prob. Score Freq. Prob. Score Freq. Prob. Score
1 50 0.57 0.57 67 0.77 0.77 54 0.62 0.62 45 0.52 0.52
2 37 0.43 0.85 20 0.23 0.46 33 0.38 0.76 42 0.48 0.97
Sum 87 1 1.43 87 1 1.23 87 1 1.38 87 1 1.48
Awareness Communication from Company Schemes/ Offers
Rank Freq. Prob. Score Freq. Prob. Score Freq. Prob. Score
1 12 0.14 0.14 21 0.24 0.24 6 0.07 0.07
2 75 0.86 1.72 66 0.76 1.52 81 0.93 1.86
Sum 87 1 1.86 87 1 1.76 87 1 1.93
Table 27: Composite Score for various attributes
Attributes Composite Score
Quality 1.15
Convenience 1.86
Technology 1.51
Brand Name 1.64
Availability 1.43
Pricing 1.23
Durability 1.38
Ease of Use 1.48
Awareness 1.86
Communication from company 1.76
Schemes/ offers 1.93
Analysis: From Table 26, it is found that composite score for Quality is 1.15, Convenience is 1.86, Technology
is 1.51, Brand Name is 1.64, Availability is 1.43, Pricing is 1.23, Durability is 1.38, Ease of Use is 1.48,
Awareness is 1.86, Communication from company is 1.76, Schemes/ offers is 1.93.
Interpretation:From Figure 8, it is found that 69% of the contractors finds the plumbing piping material
extremely important, 13% contractors finds it moderately important and 18% contractors finds it important.
Quality, Pricing and Durability are the major factors taken into consideration while choosing Plumbing Piping
Material by contractors(Table 27).
VIII. Findings CPVC has been ranked first, PVC second, UPVC third, GI fourth and PPR/ PB fifth by builders and
CPVC has been ranked first, UPVC second, PVC third, GI fourth and PPR/ PB fifth by contractors in the South
Kolkata region.
Builders have found CPVC pipes to be durable, easy to use and of good quality as composite score for
Quality is 1.11, Durability is 1.23 and Ease of Use is 1.34(lowest composite score of all the
attributes).Contractors have found CPVC pipes to be durable, easy to use and of good quality as composite score
for Quality is 1.08, Durability is 1.25, Ease of Use is 1.33((lowest composite score of all the attributes).
49% of the builders and 52% of the contractors have heard about Flowguard Technology while 51% of
the builders and 48% of the contractors have not heard about Flowguard Technology.
Pipes other than Ashirvad and Finolex having Flowguard Technology used by builders are durable,
easy to use and of good quality as Sum of weighted score for Quality is 74, Durability is 72, Ease of Use is
74(lowest of all the attributes) while pipes used by contractors are of good quality, easy to use and durable as
Sum of weighted score for Quality is 45, Durability is 54, Ease of Use is 51(lowest of all the attributes).
84% of the builders and 67% of the contractors see CPVC replacing PVC/ GI pipes and 16% of the
builders and 33% of the contractors see UPVC replacing PVC/ GI pipes.

Comparison of piping products among market players using MCDM Techniques: A case study
DOI: 10.9790/487X-2012030117 www.iosrjournals.org 16 | Page
Quality, Price and Convenience are the major influencing factors for builders in the currently used
product as composite score for Convenience is 1.49, Quality is 1.07, Price is 1.1. For contractors, Quality, Price
and Trust are the major influencing factors for the currently used product as composite score for Trust is 1.53,
Quality is 1.05, Price is 1.09.
Quality, Pricing and Durability are the major factors taken into consideration while choosing Plumbing
Piping Material by builders as composite score for Quality is 1.18, Pricing is 1.33, Durability is 1.34. For
contractors, Quality, Pricing and Durability are the major factors taken into consideration while choosing
Plumbing Piping Material ascomposite score for Quality is 1.15, Pricing is 1.23, Durability is 1.38.
IX. Suggestions
There are 51% of the builders and 48% of the contractors who have not heard about Flowguard
Technology. Company should use internal and external sources of promotion to spread awareness about its
products and technology among the builders and contractors.
Sales and Marketing team should be sent on sites and offices on a regular basis, in order to identify the
customer requirements and building a strong relationships with builders and contractors.
Like most of its competitors, Company should conduct some promotional program on a regular basis.
Company should focus more on selling CPVC, PVC and UPVC pipes than GI and PPR/ PB pipes as
CPVC, PVC and UPVC pipes are preferred by builders and contractors. Strong retail and distributor network
should be set up by the company.
Company should hire a team of self-motivated sales person, who can sell the product of the company
by personal selling and can built strong and long lasting relationships with the customers.
Company can reduce its margin to get potential customers on board.
Company should focus on providing good quality pipes at reasonable price as quality and pricing are
the major factors taken into consideration while choosing Plumbing Piping Material by builders and contractors.
X. Conclusion The purpose of current research was to compare piping products among market products using MCDM
techniques. The study concludes that CPVC, PVC and UPVC pipes are preferred by the builders and contractors
in the South Kolkata region. Based on the analysis, CPVC pipes are durable, easy to use and are of good quality.
The research established that there are many builders and contractors who are not aware about Flowguard
Technology so, company should do something for that. Pipes other than Ashirwad and Finolex having
Flowguard Technology used by builders and contractors are durable, easy to use and of good quality. Majority
of the builders and contractors see CPVC replacing PVC/ GI pipes and see this trend to grow in future. The
study concludes that Quality and Pricing are the major influencing factors in the currently used product by
builders and contractors. The study further concludes that Quality, Pricing and Durability are the major factors
taken into consideration while choosing Plumbing Piping Material by builders and contractors in South Kolkata
region.
References [1]. AlirezaAfshari, Majid Mojahed, RosnahMohdYusuff, “Simple Additive Weighting approach to Personnel Selection problem”,
December 2010, International Journal of Innovation, Management and Technology, Volume 1, Issue 5, ISSN 2010-0248, pp. 511-
515
[2]. Tri Susilowati, KamarulAzmiJasmi, BushrahBasiron, Miftachul Huda, Shankar K., AndinoMaseleno, Anis Julia, Sucipto, “Determination of Scholarship Recipients using Simple Additive Weighting method”, 2018, International Journal of Pure and
Applied Mathematics, Volume 119, Issue 15, ISSN 1314-3395, pp. 2231-2238
[3]. Mugdha More, Bharat Tidke, “A Framework for Summarization of Online opinion using Weighted Scheme”, July 2015, Advanced Computational Intelligence: An International Journal, Volume 2, Issue 3, ISSN 2454-3934, pp. 13-21
[4]. NashrudinSetiawan, M D T P Nasution, YossieRossanty, Anna Riana SuryantiTambunan, Martina Girsang, R T A Agus,
Muhammad Yusuf, Rian Vebrianto, Oktaviana Nirmala Purba, AchmadFauzi, Surya Perdana, KhairunNisa, “Simple Additive Weighting as Decision Support System for Determining Employees Salary”, 2018, International Journal of Engineering &
Technology, Volume 7, Issue 2.14, ISSN 2227-524X,pp. 309-313
[5]. Nurmalini, Robbi Rahim, “Study Approach of Simple Additive Weighting For Decision Support System”, March-April 2017, International Journal of Scientific Research in Science and Technology, Volume 3, Issue 3, ISSN 2395-6011, pp. 541-544
[6]. EdmundasKazimierasZavadskas, TatjanaVilutiene, ZenonasTurskis, JolantaTamosaitiene, “Contractor Selection for Construction
Works by applying SAW-G and TOPSIS Grey Techniques”, 2010, Journal of Business Economics and Management, Volume 11, Issue 1, ISSN 1611-1699, pp. 34-55
[7]. Karlitasari, D. Suhartini, Benny, “Comparison of simple additive weighting (SAW) and composite performance index (CPI)
methods in employee remuneration determination”, February 2017, IOP Conference Series: Materials Science and Engineering, Volume 166, ISSN 757-899X , pp. 1-8
[8]. https://www.proptiger.com/kolkata/all-builders(consulted in June-July 2018)
[9]. https://www.justdial.com/Kolkata/Builders-Developers/nct-10059258(consulted in June-July 2018) [10]. https://www.magicbricks.com/Real-estate-property-builders/ALL-RESIDENTIAL-builder-in-Kolata (consulted in June-July 2018)
[11]. https://www.mouthshut.com/builders-and-developers/kolkata(consulted in June-July 2018)
[12]. https://www.realestateindia.com/builders-developers-in-kolkata.htm(consulted in June-July 2018)
Comparison of piping products among market players using MCDM Techniques: A case study
DOI: 10.9790/487X-2012030117 www.iosrjournals.org 17 | Page
[13]. https://www.makaan.com/kolkata/all-builders(consulted in June-July 2018)
[14]. http://property.sulekha.com/property-builders-in-kolkata(consulted in June-July 2018)
[15]. https://www.justdial.com/Kolkata/Building-Contractors/nct-10059338(consulted in June-July 2018)
[16]. https://www.99acres.com/Kolkata-Real-Estate.htm(consulted in June-July 2018) [17]. https://www.researchgate.net/(consulted in October 2018)
[18]. https://www.academia.edu/(consulted in October 2018)
Jagdev Singh.”, Comparison of piping products among market players using MCDM
Techniques: A case study.. ” IOSR Journal of Business and Management (IOSR-JBM), Vol. 20,
No. 12, 2018, pp. -.01-17