comparison of optical quality metrics to predict
TRANSCRIPT
Comparison of Optical Quality Metrics to Predict Subjective Quality of Vision after LASIK
Bühren J, Yoon GY, Martin T, Strenger A, Kohnen T

Background
image stimulus (object)
resolution
contrast sensitivity
anatomy optical properties function (subjective)
perception
or
or
Kohnen T et al.: Essentials of Ophthalmogy. Vol. 2: Cataract and Refractive Surgery. Berlin 2004: Springer
Objective
• What image quality metric / wavefront error representation is capable best of predicting subjective Quality of Vision ?
Objective
• What image quality metric / wavefront error representation is capable best of predicting subjective Quality of Vision ?
• How could predictability be increased ?
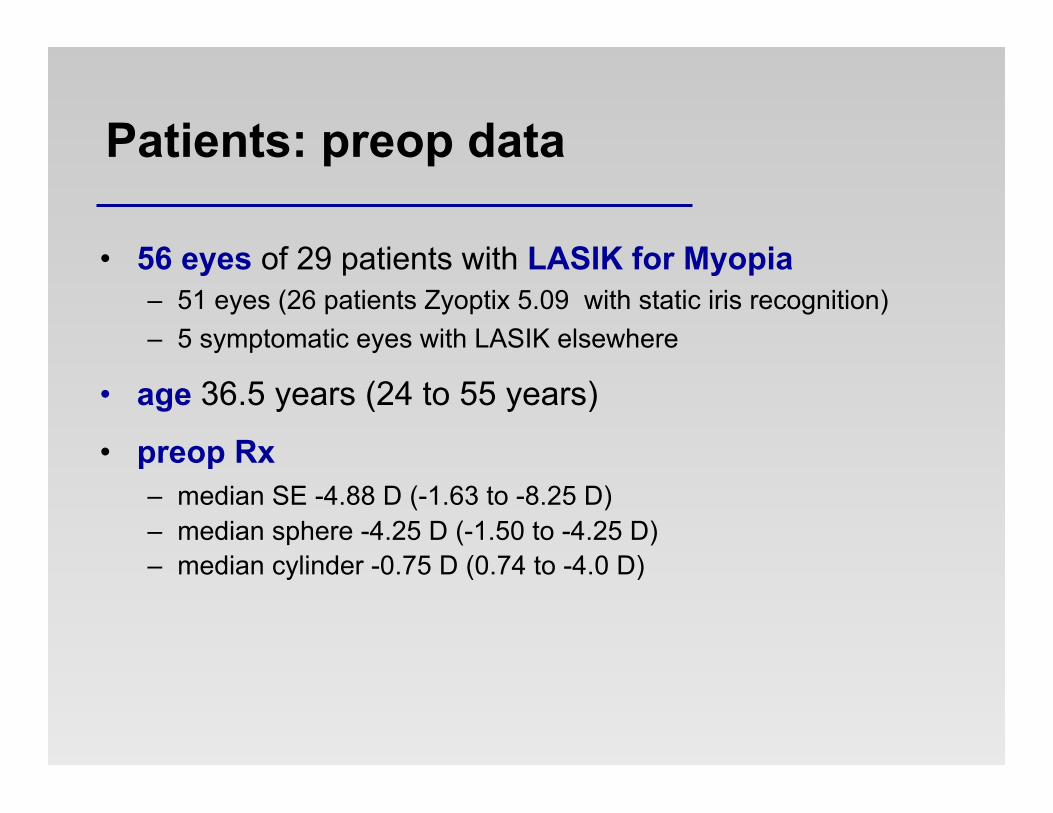
Patients: preop data
• 56 eyes of 29 patients with LASIK for Myopia – 51 eyes (26 patients Zyoptix 5.09 with static iris recognition) – 5 symptomatic eyes with LASIK elsewhere
• age 36.5 years (24 to 55 years)
• preop Rx – median SE -4.88 D (-1.63 to -8.25 D) – median sphere -4.25 D (-1.50 to -4.25 D) – median cylinder -0.75 D (0.74 to -4.0 D)

Patients and Methods
• Aberrometry 1 month postoperatively – Hartmann-Shack sensor (ZywaveTM, B & L)
• Questionnaire 1 month postoperatively – rating of „optical quality“ for three illuminance levels: photopic („bright light“). high-mesopic („indoors“) low-mesopic
(„dusk“) – visual analogue scale 0-100
20 40 60 80 100 0
perfect extremely bad
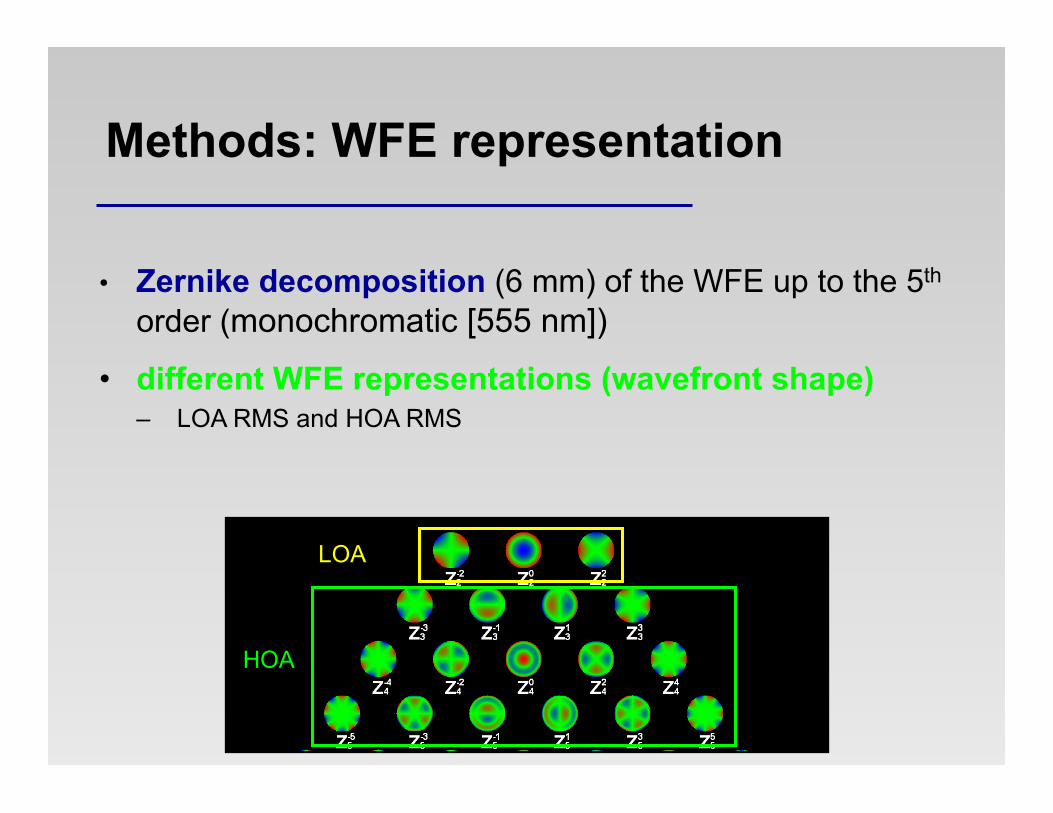
• Zernike decomposition (6 mm) of the WFE up to the 5th
order (monochromatic [555 nm])
• different WFE representations (wavefront shape) – LOA RMS and HOA RMS
Methods: WFE representation
LOA
HOA
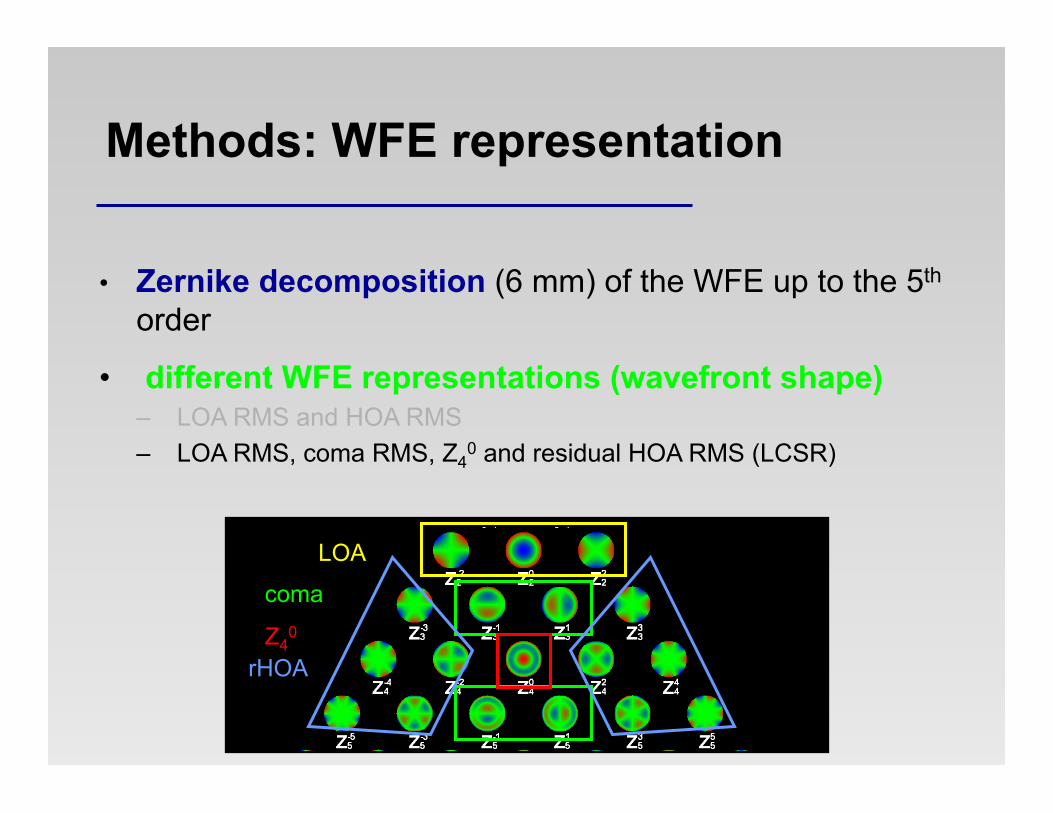
• Zernike decomposition (6 mm) of the WFE up to the 5th
order
• different WFE representations (wavefront shape) – LOA RMS and HOA RMS – LOA RMS, coma RMS, Z4
0 and residual HOA RMS (LCSR)
Methods: WFE representation
LOA
coma
Z40
rHOA

• Zernike decomposition (6 mm) of the WFE up to the 5th
order
• PSF-based single-value metrics – Strehl ratio (SR) – volume under the cross correlation coefficient function (VXC)
Methods: WFE representation

• Zernike decomposition (6 mm) of the WFE up to the 5th
order
• PSF-based single-value metrics – Strehl ratio (SR) – volume under the cross correlation coefficient function
• OTF-based single-value metrics – volume under the MTF (VMTF) – Strehl ratio based on the volume under the MTF (SRMTF) – visual Strehl ratio based on the OTF (VSOTF)
Methods: WFE representation

• different conditions/simulations: – lighting conditions „photopic“, „high-“ and „low-mesopic“ – uncorrected / best-corrected (VSOTF-based or HOA RMS) – 6 mm PD / physiological PD (0.4 lux)
Methods: WFE representation
2.0
4.0
6.0
8.0
10.0
0.0 0.1 1.0 10.0
illuminance [lux]
pupi
l dia
met
er [m
m]

• linear regression analysis – SQV: dependent – WFE parameters: predictors – if more than one predictor: MRA w/ backwards
decomposition – R2 (coefficients of determination)
Methods: statistical analysis
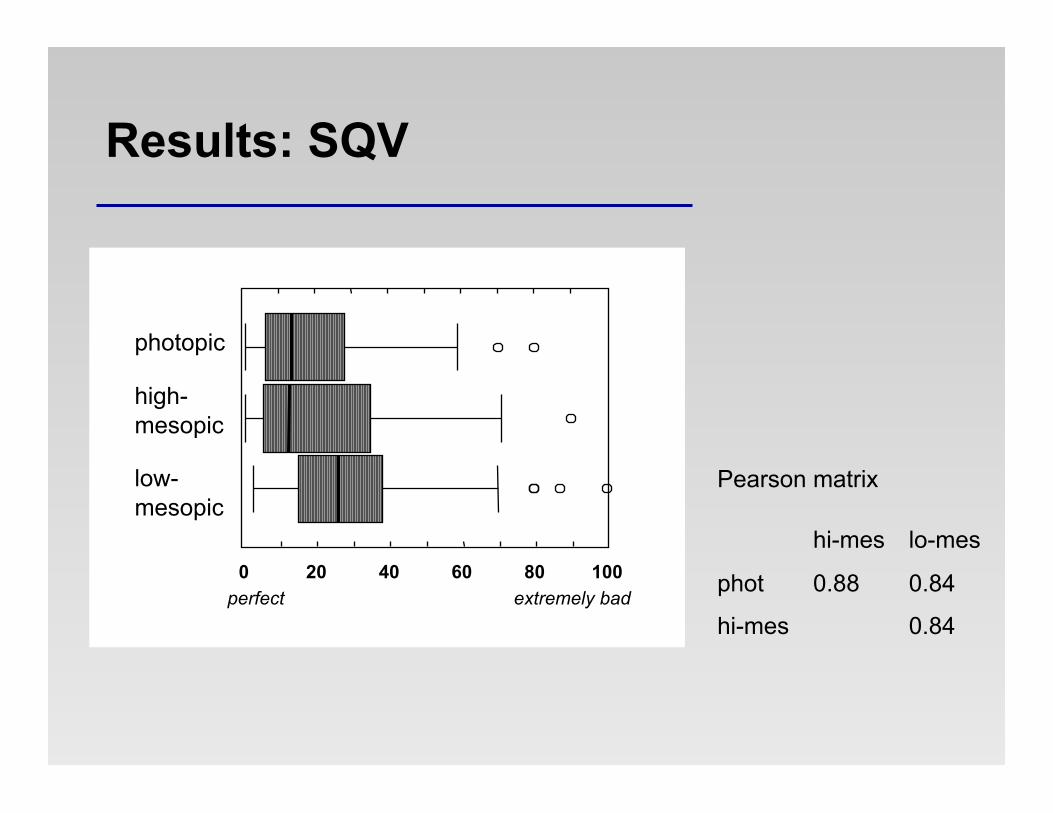
Results: SQV
20 40 60 80 100 0 perfect extremely bad
photopic
high- mesopic
low- mesopic
hi-mes lo-mes
phot 0.88 0.84
hi-mes 0.84
Pearson matrix

Results: R2 values (6 mm PD)
0
0.1
0.2
0.3
0.4
0.5
total RMS HOA RMS LCSR
wavefront shape
R2
PSF-derived
log UC Strehl
log BC Strehl
log UCXC log BCXC log UCVXC log BCVXC
phot hi-mes lo-mes
0
0.1
0.2
0.3
0.4
0.5 phot hi-mes lo-mes
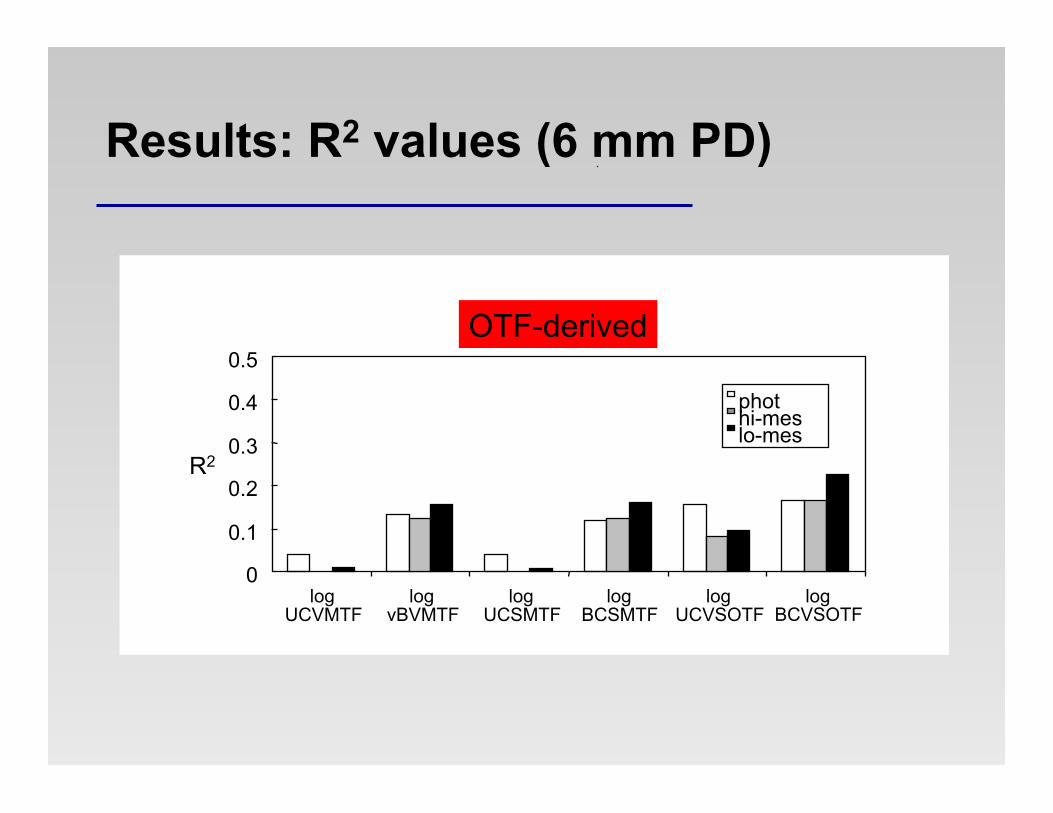
Results: R2 values (6 mm PD)
OTF-derived
0
0.1
0.2
0.3
0.4
0.5
log UCVMTF
log vBVMTF
log UCSMTF
log BCSMTF
log UCVSOTF
log BCVSOTF
phot hi-mes lo-mes
R2
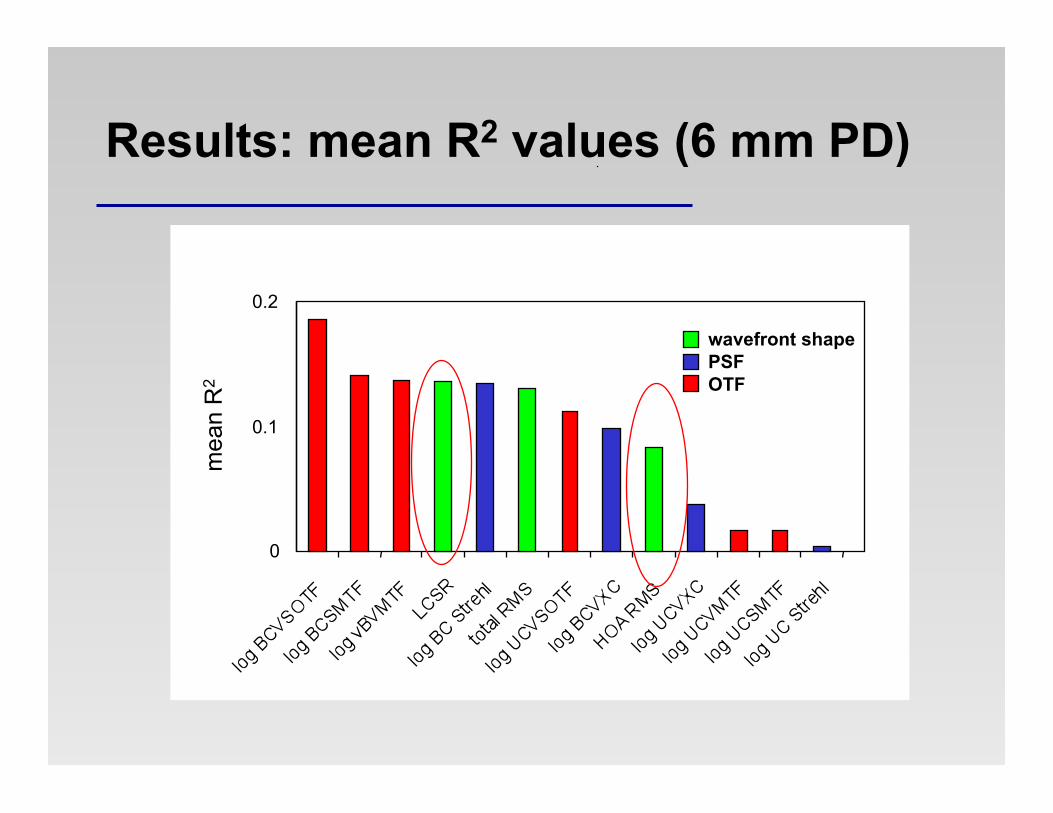
Results: mean R2 values (6 mm PD)
0
0.1
0.2
mea
n R
2
wavefront shape PSF OTF

Results: R2 values 0.4 lux
0
0.1
0.2
mea
n R
2
wavefront shape PSF OTF

Summary / Discussion
• The influence of the postoperative WFE on SQV was limited (max. 23%) • skewed distribution of SQV scores
20 40 60 80 100 0 perfect extremely bad
photopic
high- mesopic
low- mesopic
0
-0.5
-1.0
-1.5
-2.0
-2.5 UCVSOTF BCVSOTF
6 mm 0.4 lux
log
VS
OTF
Summary / Discussion
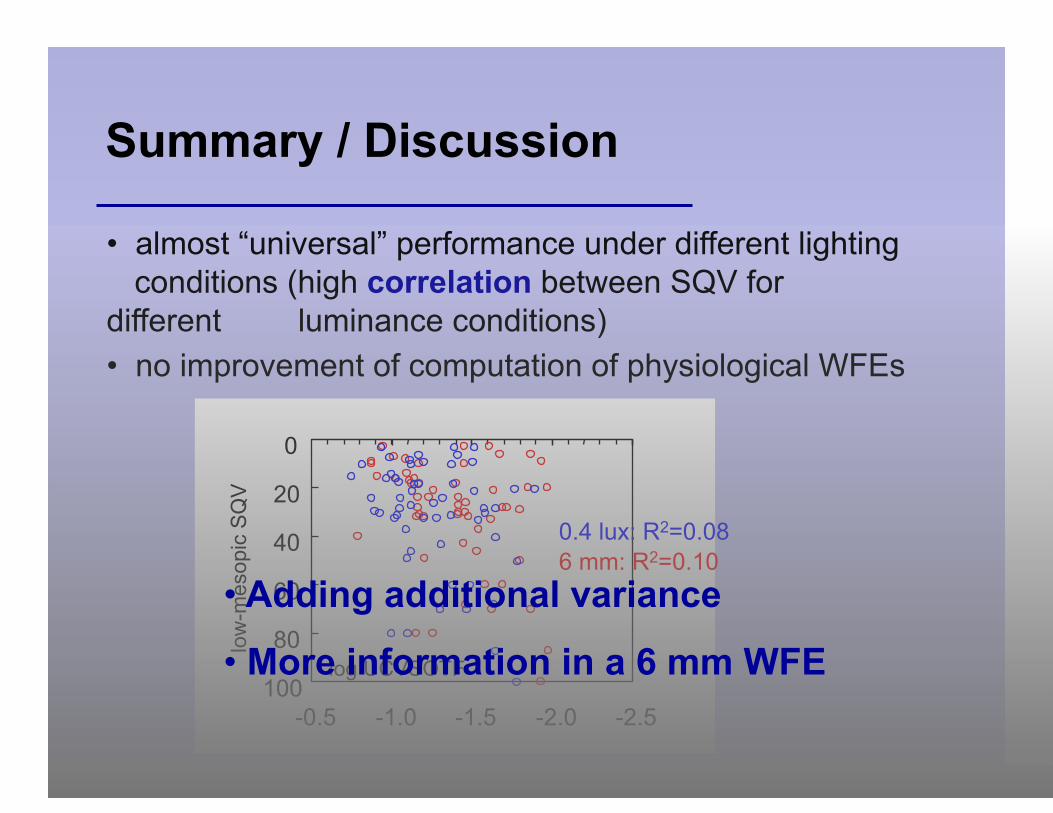
• almost “universal” performance under different lighting conditions (high correlation between SQV for different luminance conditions) • no improvement of computation of physiological WFEs
0
20
40
60
80
100 -2.5 -2.0 -1.5 -1.0 -0.5
low
-mes
opic
SQ
V
log UCVSOTF
0.4 lux: R2=0.08 6 mm: R2=0.10
• Adding additional variance
• More information in a 6 mm WFE

Conclusion – Take home messages
• high theoretical OQ = good subjective OQ • bad subjective OQ = low theoretical OQ • bad theroretical OQ = not necessary bad subjective OQ
-1.5 -1.0 -0.5
0
20
40
60
80
100
log BCVSOTF
low
-mes
opic
SQ
V
adj. R2=0.23

Danke ! Thank you !

Summary / Discussion
• higher predictability for best-corrected values @ 6mm
0
20
40
60
80
100 -2.5 -2.0 -1.5 -1.0 -0.5 0.0
low
-mes
opic
SQ
V
log VSOTF
UC: R2=0.10 BC: R2=0.23
• Higher tolerance to LOA blur ?