comparison of home glucose monitoring with the …...tracted labor, fetopelvic disproportion, and...
TRANSCRIPT
Comparison of Home Glucose Monitoring with the Oral Glucose Tolerance Test to Detect Gestational Glucose IntoleranceKevin A. Peterson, M D, M PH ; Alison M. Peterson, M D; Victor Corbett, M D;Scott Tongen, M D; Martha Guzman, M D; and Roger Mazze, PhDSt Paul and St Louis Park, Minnesota
Background. Recent evidence suggests that infant morbidity is increased among women who have abnormal prenatal glucose screening tests but who do not have gestational diabetes mellitus (G D M ). These women fall into a diagnostic gray zone and historically have not been treated.
Methods. Forty-eight pregnant women with abnormal oral glucose challenge test results performed self-monitored blood glucose (SM BG ) testing seven times per day for 1 week before undergoing a diagnostic 100-g oral glucose tolerance test (O G T T ). At delivery, perinatal complications and birthweights were recorded. Results of SM BG tests for women with normal O G TTs were correlated with infant birthweights.
Results. Thirteen infants (37%) were found to be large for gestational age (LGA). Significant correlation was
found between increasing birthweight and increasing average fasting SM BG values (P < .0 0 1 ) , increasing percentage o f SM BG values above 120 ntg/dL (6.7 mmol/L) (P < .0 1 ) , and increasing average SM BG values (P < .0 1 6 ).
Conclusions. Maternal home glucose values at 28 weeks correlate with the risk o f LGA infant births among women in the diagnostic gray zone. Women with average fasting SM BG values > 9 5 mg/dL (5 .3 mmol/L) are at increased risk for giving birth to LGA infants and may be more likely to exhibit complications usually associated with GDM .
Key words. Screening; diabetes, gestational; gestational age; infant, large for gestational age; fetal macrosomia.( J Fam Pract 1994; 39:558-563)
Gestational diabetes mellitus (G D M ), a term that applies to hyperglycemia first discovered in pregnancy, is present in 3% to 12% o f pregnancies, making its identification and treatment essential to the delivery o f optimal obstetric care.1 GD M is associated with an increased incidence o f fetal macrosomia, neonatal hypoglycemia, hypocalcemia, polycythemia, and hyperbilirubinemia.2 Diagnostic criteria for GD M using the 100-g oral glucose tolerance test (O G T T ) have been defined by the National Diabetes
Submitted, revised, August 15, 1994.
From the Department o f Family Practice and Comunity Health, University o f Minnesota (K.A.P., A.M.P., M.G., R.M.), and United Hospital (V.C., S.T.), St Paul; and the International Diabetes Center (R.M.), St Louis Park, Minnesota. Requests fo r reprints should be addressed to Kevin A. Peterson, MD, Department o f Family Practice and Community Health, University o f Minnesota, Hazel Park Family Practice Clinic, 933 White Bear Ave, St Paul, MN 55106.
© 1994 Appleton & Lange ISSN 0094-3509
Data Group.3 These criteria are based on an interpretation o f work performed by O ’Sullivan and Mahan,4 who evaluated women with hyperglycemia in pregnancy for the purpose o f identifying those at increased risk for subsequent development o f non-insulin-dependent diabetes mellitus (N ID D M ). Subsequently, a positive association was made between an abnormal O G T T and increased perinatal mortality.5 More recendy, the primary purpose o f diagnosis among patients with GD M has been to reduce adverse perinatal outcome6 in conjunction with evaluation o f maternal risk for the subsequent development o f N ID D M . For that reason, it is appropriate to reexamine the current diagnostic criteria.
The large-for-gestational-age (LGA) infant and mac- rosomic infant are among the most common adverse outcomes of G D M .7 LGA infants rank above the 90th per-
558 The Journal o f Family Practice, Vol. 39 , No. 6(D ec), 1994

Detecting Gestational Glucose IntolerancePeterson, Peterson, Corbett, et al
centile in weight, and macrosomic infants weigh more than 4000 g at birth, regardless o f gestational age. Mothers of macrosomic infants are at increased risk of protracted labor, fetopelvic disproportion, and shoulder dystocia.8 They have twice the normal risk of cesarean section, as well as an increased risk of postpartum hemorrhage.9 The infant is at increased risk for brachial plexus palsy, clavicle and humerus fracture, fetal asphyxia, hypoglycemia, hyperbilirubinemia, organomegaly, and low Apgar scores at the time o f birth.10-11 Current literature also suggests that large infants are at increased risk of late diabetes-related sequelae, including obesity and possible developmental delays.12 Previous attempts to find longterm measures o f glucose control that could predict adverse perinatal outcomes have not been successful. Hemoglobin A lc has been demonstrated to be an insensitive measure o f abnormal glucose metabolism in pregnancy, identifying only 40% o f women with an abnormal OGTT.13-14 Fructosamine and glycosylated serum protein have also been reported as insensitive screening tests in pregnancy for gestational diabetes.15-16
In G D M , maternal insulin resistance is exaggerated beyond the levels found in nonpregnant women.17 When maternal pancreatic /3-cells fail to compensate, maternal hyperglycemia results in increased transplacental diffusion of glucose to the fetus. This, in turn, stimulates excessive fetal pancreatic /3-cell production o f insulin.18~20 Fetal hyperinsulinemia fosters abnormal fat deposition. Clinical studies have shown that the risk o f a large infant is five to nine times greater among women with glucose levels >105 mg/dL (5 .8 mmol/L) fasting and 140 mg/dL (7.8 mmol/L) postprandial, as compared with women without diabetes and those with treated GDM whose glucose level is maintained between 60 and 120 mg/dL (3.3 and 6 .7 m m ol/L).21-22 Early intervention and strict glucose control in women with gestational diabetes has been demonstrated in several studies to decrease maternal and fetal complications and reduce the incidence of LGA infants.8-21
Recent work has demonstrated that some women with an abnormal screening glucose challenge test (G C I) but a normal O G T T result remain at increased risk of adverse neonatal outcome.6-23-24 Langer and associates25 have demonstrated that women with only one abnormal result on O G T T have a 35% risk of neonatal complications. Because these women frequently fall into a diagnostic gray zone where recommendations for treatment are unclear, some investigators have considered lowering both the screening and the diagnostic criteria.24-26
With the advent o f newer technologies for determination o f blood glucose levels, other methods for identifying glucose intolerance in pregnancy can be evaluated. In gestational diabetes, frequent self-monitoring of blood
glucose allows for close assessment o f metabolic control. The availability of the portable glucose reflectance meter with an internal memory chip has facilitated the collection of verifiable self-monitored blood glucose data.27 This study prospectively examined the correlation between self-monitored blood glucose values and infant morbidity, measured in terms of occurrence o f LGA infants in women with an abnormal 1-hour GCT and a normal 3-hour OGTT.
MethodsWomen were recruited from family medicine and obstetric practices associated with a large metropolitan hospital center. A consecutive sample o f pregnant women was identified: those who were between the 24th and 29th gestational week and had plasma glucose results > 140 mg/dL (7.8 mmol/L) and < 2 0 0 mg/dL (11.1 mmol/ L), as determined 1 hour following ingestion o f 50 g o f a standard liquid glucose solution, regardless o f prandial state.1 Following informed consent, subjects were interviewed, and the following data were obtained: pregravid weight, maternal height, family history of diabetes, obstetrical history, medications, tobacco and drug use, and gestational age. Women were excluded from the study it they had a previous history o f GDM or a hemoglobin of < 10 .0 g/dL (100 g/L) since reflectometer readings below this value were considered unreliable.
Subjects were instructed in blood glucose monitoring techniques by a nurse specialist in diabetes. A memory-based reflectance meter capable of storing 440 blood glucose values with the corresponding time and date of the test (Glucometer M, Miles Laboratories Inc, Ames Division, Elkhart, Ind) was provided. Subjects were asked to immediately begin measuring their capillary blood glucose seven times per day (fasting, preprandial, 2 hours after the beginning o f each meal, and at bedtime) for 7 days. They remained on an unrestricted diet. At the end of 7 days, capillary blood glucose measurements were downloaded directly from the reflectance meter to a computer, and patients underwent a 3-hour oral glucose tolerance test (O G TT) using a standardized 100-g oral glucose load. Women were instructed to fast for at least 8 hours before the O G TT. Gestational diabetes was diagnosed in accordance with the criteria of the National Diabetes Data Group, which requires that at least two of the following blood glucose values are met: > 1 0 5 mg/dL (5.8 mmol/ L), > 1 9 0 mg/dL (10.5 mmol/L), > 1 6 5 mg/dL (9.2 mmol/L), and > 1 4 5 mg/dL (8.0 mmol/L) at 0, 1, 2, and 3 hours, respectively.3
Following the O G TT, no further glucose testing was performed for patients who did not meet National Dia
The Journal o f Family Practice, Vol. 39, No. 6(D ec), 1994559

Detecting Gestational Glucose Intolerance Peterson, Peterson, Corbett, et al
betes Data Group criteria for gestational diabetes. Patients diagnosed with GDM were treated with diet or insulin therapy, according to established protocols to obtain glycemic control.28 After delivery, the following outcome data were obtained: infant birthweight, gestational age, method o f delivery, maternal weight gain, and presence o f maternal or infant complications during labor or delivery.
Glucose metabolism, measured by SM BG testing, was characterized using Glucofacts (Miles Laboratories Inc, Diagnostics Division, Elkhart, Ind, 1989). This computer program downloads glucose meters and summarizes individual glucose data including ranges and averages. Statistical analysis was performed using SAS (SAS Institute Inc, Cary, NC). Women with an abnormal GG T but a normal O G T T were referred to as the “ gray zone” group. A product-moment correlation coefficient was calculated for the gray zone group between infant birthweight and 18 study variables. The gray zone group was segmented into four subgroups based on the individual’s average fasting SM BG level: group A, s 8 5 mg/dL (4 .7 m m ol/L); group B, 86 to 9 4 mg/dL (4 .8 to 5.2 mm ol/L); group C, 95 to 104 mg/dL (5 .3 to 5.8 m m ol/L); and group D, > 1 0 5 mg/dl (5 .8 mmol/L). Relative risks o f giving birth to an LGA infant for groups A through D were calculated using logit estimators, with group A as the reference to which others were compared.
Iwo-by-two tables were corrected for empty cells using .5 added to every cell.29 Fisher’s exact test was employed to detect significance o f birthweight difference for each group as compared with group A. Trend analysis was performed using a Mantel-Haenszel statistic for trend. Univariate and bivariate regression were performed to evaluate possible confounding effects from the following factors known to influence birthweight: gestational age, multiparity, and maternal pregravid weight. Birthweight was the dependent variable and average fasting glucose the independent variable in the univariate (reduced) model. 1 he full model included the confounding variable o f interest. The change in the beta coefficient for average fasting glucose was examined to reflect degree o f confounding. Any change in the beta coefficient o f less than 10% was considered insignificant.
Birthweight percentiles o f infants were obtained by using a standard o f fetal growth in the United States (Brenner curve)30 to correct for differences in gestational age. LGA infants were identified as those ranking at or above the 90th percentile. Twins and infants born before the 37th gestational week were excluded from these analyses because o f inaccuracy in determining LGA.
ResultsO f the 101 women with a G C T > 1 4 0 mg/dL (7.8 mmol/L) who were contacted for participation in the study, 53 agreed to participate. The most common reasons given for refusal were lack o f time and hesitation to undergo blood glucose testing seven times per day. There was no difference in insurance status or ethnicity between the groups. No significant difference was found in the average plasma glucose at the 1-hour G C T between women who agreed to be in the study (1 5 8 ± 1 4 mg/dL [8 .8 ± 0 .8 m m ol/L]) and those who declined (157±14 mg/dL [8 .7 ± 0 .8 m m ol/L]). Forty-eight women (91%) completed the study. O f the five women who dropped out, four did not complete daily capillary blood glucose measurements, and one refused the 3-hour O G TT. There were no statistical differences for the G C T between those who remained in the study and those who dropped out.
Following the week o f intensive self-monitoring, five subjects were diagnosed with gestational diabetes by O G T T , according to National Diabetes Data Group criteria. Although no significant difference was found between this group and the gray zone group with respect to pregravid weight, gravida, or weight gain during pregnancy, the women with gestational diabetes had a significantly greater BM I (body mass index) (P = .0 3 2 ), higher average screening values (P C .0 0 3 ), higher average fasting values (P < .0 0 1 ) , and higher average overall SM BG values (P < .0 0 1 ) than the gray zone group. O f the women with G D M , two pregnancies resulted in LGA infants, one of whom experienced an episode o f neonatal hypoglycemia.
Six women from the gray zone group had premature deliveries (less than 37 weeks’ gestation), one o f whom had twins. Two additional sets o f twins were born. These were excluded from analysis because o f inaccuracy in determining LGA. Thirteen infants from the remaining 35 (37%) born to the eligible participants were LGA. This is significantly greater than the 10% that would be expected from the distribution o f birthweights from the Brenner curve (P < .0 0 5 ). Additional complications identified at the time o f delivery in the gray zone group included one late intrauterine fetal death, one neonatal hypoglycemia, one mild shoulder dystocia, one cephalopelvic disproportion, and two fourth-degree lacerations.
The relationship between birthweight and 18 study variables was examined for the gray zone group patients. Table 1 contains the correlation coefficient and significance for each study variable in estimating birthweight. Examination o f the O G T T resulted in no single value or combination o f values achieving a correlation with birthweight percentile at the 95% confidence interval (C l) in the gray zone group. On the other hand, several SMBG values significantly correlated with birthweight.
560 The Journal of Family Practice, Vol. 39 , No. 6(D ec), 1994
Detecting Gestational Glucose IntolerancePeterson, Peterson, Corbett, et al
Table 1. Pearson Correlation Coefficients for Gray Zone Group Variables on Birthweight (excluding gestational age<37 weeks)
Variable r ValueP Value
(2-tailed)
Pregravid weight .406 .017
Gravida .356 .039
Weight gain .116 .541
Family history .019 .918
Gestational age .385 .024
Oral glucose tolerance testFasting .316 .0741 hour .314 .0742 hour .318 .0713 hour .048 .792
Self-monitored blood glucose testAverage glucose .409 .016% above 120 .435 .010Highest glucose .161 .364Lowest glucose .262 .134Average fasting .552 .001
Note: Gray zone group is defined as women with an abnormal glucose challenge testbut a norm al oral glucose tolerance test.
The strongest correlate, fasting SMBG, was used to determine whether the SM BG association with infant birthweight was being confounded by other factors known to affect birthweight (pregravid weight, multiparity, or gestational age at delivery). A statistical model was used to determine the change in correlation that occurred when the data were adjusted for these factors (Table 2). Increased gravida and gestational age did not affect the relationship between birthweight and fasting SMBG values. Pregravid weight mildly confounded the relationship: the beta coefficient o f the full model was 15% less than that o f the reduced model.
When the gray zone group was segmented according to average SM BG , the average infant birthweight percen-
Table 2. Contribution of Potential Confounding Factors to Average Fasting Self-monitored Blood Glucose (SMBG) Correlation with Birthweight
Variables Beta Coefficient Standard Deviation
Average fasting SMBG 22.697 6.067
Average fasting SMBG + gravida
20.66692.919
5.97651.795
Average fasting SMBG + gestational age
20.502124.327
5.87660.138
Average fasting SMBG + pregravid weight
19.2263.464
6.3072.160
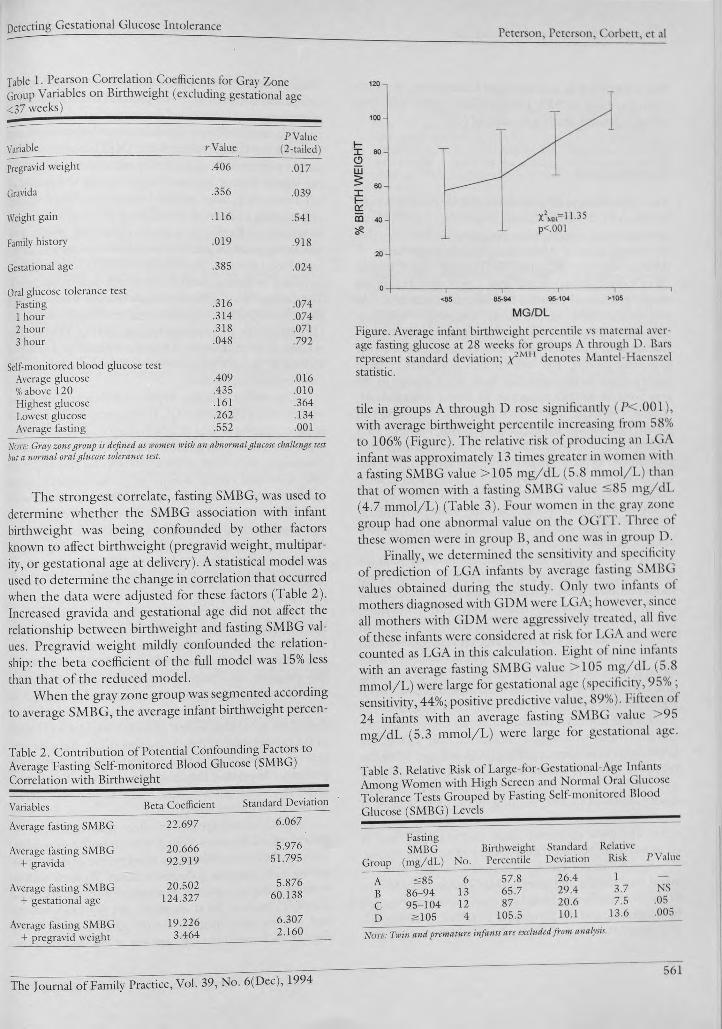
MG/DL
Figure. Average infant birthweight percentile vs maternal average fasting glucose at 28 weeks for groups A through D. Bars represent standard deviation; ; / MH denotes Mantel Haenszel statistic.
tile in groups A through D rose significantly (PC.OOl), with average birthweight percentile increasing from 58% to 106% (Figure). The relative risk of producing an LGA infant was approximately 13 times greater in women with a fasting SMBG value > 1 0 5 mg/dL (5.8 mmol/L) than that of women with a fasting SMBG value ^ 85 mg/dL (4.7 mmol/L) (Table 3). Four women in the gray zone group had one abnormal value on the OG 1 1 . 1 hree of these women were in group B, and one was in group D.
Finally, we determined the sensitivity and specificity of prediction of LGA infants by average fasting SMBG values obtained during the study. Only two infants of mothers diagnosed with GDM were LGA; however, since all mothers with GDM were aggressively treated, all five of these infants were considered at risk for LGA and were counted as LGA in this calculation. Eight of nine infants with an average fasting SMBG value > 1 0 5 mg/dL (5.8 mmol/L) were large for gestational age (specificity, 95% ; sensitivity, 44%; positive predictive value, 89%). Fifteen of 24 infants with an average fasting SMBG value > 95 mg/dL (5.3 mmol/L) were large for gestational age.
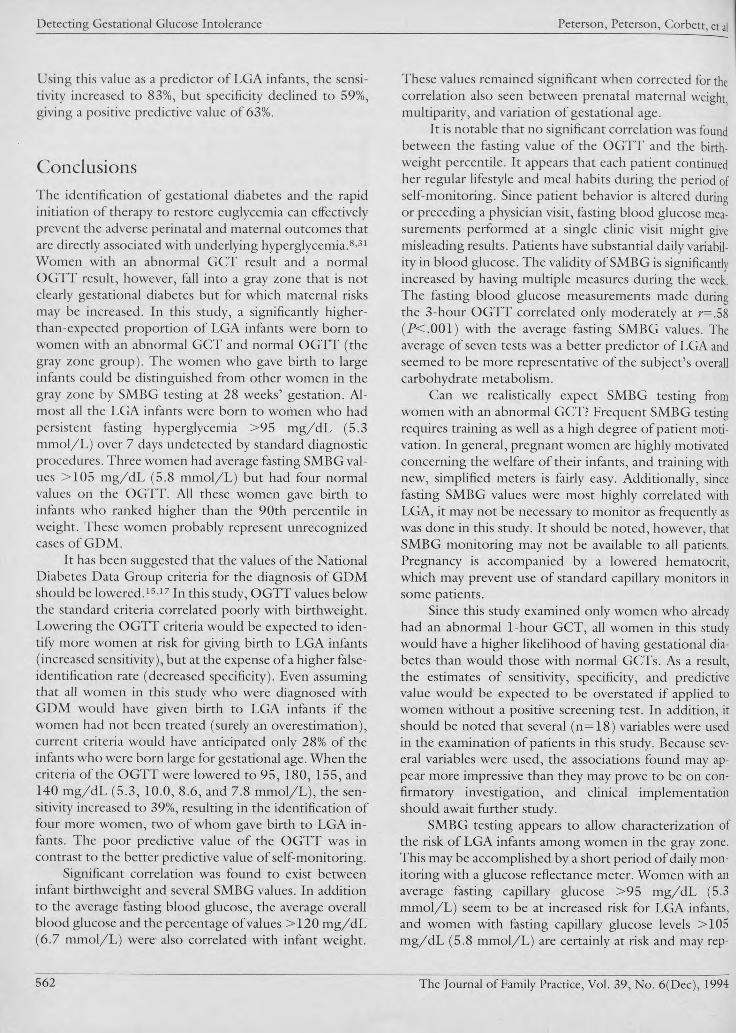
Table 3. Relative Risk of Large-for-Gestational-Age Infants Among Women with High Screen and Normal Oral Glucose Tolerance Tests Grouped by Fasting Self-monitored Blood Glucose (SMBG) Levels_____ _________
Group
FastingSMBG
(mg/dL) No.BirthweightPercentile
StandardDeviation
RelativeRisk P Value
A
LT300VI 6 57.8 26.4 1 —
B 86-94 13 65.7 29.4 3.7 NS
c 95-104 12 87 20.6 7.5 .05
D >105 4 105.5 10.1 13.6 .005
Note: Twin and premature infants are excluded from analysis.
The Journal of Family Practice, Vol. 39, No. 6(Dec), 1994
Detecting Gestational Glucose Intolerance Peterson, Peterson, Corbett, et al
Using this value as a predictor o f LGA infants, the sensitivity increased to 83%, but specificity declined to 59%, giving a positive predictive value o f 63%.
ConclusionsThe identification o f gestational diabetes and the rapid initiation o f therapy to restore euglycemia can effectively prevent the adverse perinatal and maternal outcomes that are directly associated with underlying hyperglycemia.8’31 Women with an abnormal G C T result and a normal O G T T result, however, fall into a gray zone that is not clearly gestational diabetes but for which maternal risks may be increased. In this study, a significantly higher- than-expected proportion o f LGA infants were born to women with an abnormal G C T and normal O G T T (the gray zone group). The women who gave birth to large infants could be distinguished from other women in the gray zone by SM BG testing at 28 weeks’ gestation. Almost all the LGA infants were born to women who had persistent fasting hyperglycemia > 9 5 mg/dL (5.3 mmol/L) over 7 days undetected by standard diagnostic procedures. Three women had average fasting SM BG values > 1 0 5 mg/dL (5 .8 mmol/L) but had four normal values on the O G TT. All these women gave birth to infants who ranked higher than the 90th percentile in weight. These women probably represent unrecognized cases o f GDM .
It has been suggested that the values o f the National Diabetes Data Group criteria for the diagnosis o f GDM should be lowered.15-17 In this study, O G T T values below the standard criteria correlated poorly with birthweight. Lowering the O G T T criteria would be expected to identify more women at risk for giving birth to LGA infants (increased sensitivity), but at the expense o f a higher false- identification rate (decreased specificity). Even assuming that all women in this study who were diagnosed with GDM would have given birth to LGA infants if the women had not been treated (surely an overestimation), current criteria would have anticipated only 28% o f the infants who were born large for gestational age. When the criteria o f the O G T T were lowered to 9 5 , 180, 155 , and 140 mg/dL (5 .3 , 10.0, 8 .6 , and 7 .8 m m ol/L), the sensitivity increased to 39%, resulting in the identification o f four more women, two o f whom gave birth to LGA infants. The poor predictive value o f the O G T T was in contrast to the better predictive value o f self-monitoring.
Significant correlation was found to exist between infant birthweight and several SM BG values. In addition to the average fasting blood glucose, the average overall blood glucose and the percentage o f values > 1 2 0 mg/dL (6 .7 mmol/L) were also correlated with infant weight.
These values remained significant when corrected for the correlation also seen between prenatal maternal weight, multiparity, and variation o f gestadonal age.
It is notable that no significant correlation was found between the fasting value o f the O G T T and the birthweight percentile. It appears that each patient continued her regular lifestyle and meal habits during the period of self-monitoring. Since patient behavior is altered during or preceding a physician visit, fasting blood glucose measurements performed at a single clinic visit might give misleading results. Patients have substantial daily variability in blood glucose. The validity o f SM BG is significantly increased by having multiple measures during the week. The fasting blood glucose measurements made during the 3-hour O G T T correlated only moderately at r=.58 (P < .00 1 ) with the average fasting SM BG values. The average o f seven tests was a better predictor o f LGA and seemed to be more representative o f the subject’s overall carbohydrate metabolism.
Can we realistically expect SM BG testing from women with an abnormal GCT? Frequent SM BG testing requires training as well as a high degree o f patient motivation. In general, pregnant women are highly motivated concerning the welfare o f their infants, and training with new, simplified meters is fairly easy. Additionally, since fasting SM BG values were most highly correlated with LGA, it may not be necessary to monitor as frequently as was done in this study. It should be noted, however, that SM BG monitoring may not be available to all patients. Pregnancy is accompanied by a lowered hematocrit, which may prevent use o f standard capillary monitors in some patients.
Since this study examined only women who already had an abnormal 1-hour G C T, all women in this study would have a higher likelihood o f having gestational diabetes than would those with normal GCTs. As a result, the estimates o f sensitivity, specificity, and predictive value would be expected to be overstated if applied to women without a positive screening test. In addition, it should be noted that several (n= 18) variables were used in the examination o f patients in this study. Because several variables were used, the associations found may appear more impressive than they may prove to be on confirmatory investigation, and clinical implementation should await further study.
SM BG testing appears to allow characterization of the risk o f LGA infants among women in the gray zone. This may be accomplished by a short period o f daily monitoring with a glucose reflectance meter. Women with an average fasting capillary glucose > 9 5 mg/dL (5.3 mmol/L) seem to be at increased risk for LGA infants, and women with fasting capillary glucose levels > 105 mg/dL (5 .8 mmol/L) are certainly at risk and may rep-
562 The Journal o f Family Practice, Vol. 39 , No. 6(D ec), 1994
Detecting Gestational Glucose IntolerancePeterson, Peterson, Corbett, et al
resent cases o f GD M missed by the OGTT. Further studies are needed to determine the cost o f such follow-up, to determine the extent to which adverse outcomes other than LGA infants are identified by SMBG values, and to compare the SM BG level with modified criteria for the OGTT in determining risk o f adverse neonatal outcome.
References
1. ACOG Technical Bulletin No. 92. Management of diabetes melli- tus in pregnancy. Washington, DC: American College of Obstetricians and Gynecologists, May 1986.
2. ADA position statement: gestational diabetes mellitus. Diabetes Care 1 9 8 6 ;9 :4 3 0 -1 .
3. National Diabetes Data Group. Classification and diagnosis of diabetes mellitus and other categories of glucose intolerance. Diabetes 1 9 7 9 ;2 8 :1 0 3 9 -5 7 .
4. O’Sullivan JB , Mahan CM. Criteria for the oral glucose tolerance test in pregnancy. Diabetes 1964; 13 :278-85 .
5. O’Sullivan JB , Charles D, Mahan C, Dandrow R. Gestational diabetes and perinatal mortality rate. Am J Obstet Gynecol 1973; 116: 9 0 1 -4 .
6. heiken E, Jenkins J, Pomerantz G, Klein L. Abnormal glucose screening tests in pregnancy: a risk factor for fetal macrosomia. Obstet Gynecol 1987; 69 :5 7 0 -3 .
7. Canadian Task Force on the Periodic Health Examination. Periodic health examination, 1992 update. Screening for gestational diabetes mellitus. Can Med Assoc J 1992; 147:437-43.
8. Neiger R. Fetal macrosomia in the diabetic patient. Clin Obstet Gynecol 1992; 3 5 :1 3 8 -5 0 .
9. ACOG Technical Bulletin No. 159. Fetal macrosomia. Washington, DC: American College of Obstetricians and Gynecologists, September 1991.
10. Pettitt D J, Bennett PH, Knowler WC, Baird R, Aleck K. Gestational diabetes mellitus and impaired glucose tolerance in the offspring. Diabetes 1985; 34(suppl 2 ):1 19-22.
11. hanger O. Abnormal fetal growth: rationale for achieving cuglyce- mia. Presented at Contemporary Issues in Maternal Fetal Medicine: High Risk Screening and Diabetes, San Antonio, Texas, April 23, 1990.
12. Rizzo T , Freinkel N, Metzger B, Hatcher R, Burns W, Barglow P. Fuel mediated behavioral teratogenesis: correlations between maternal metabolism in diabetic pregnancies and Brazelton tests in the newborn. Diabetes 1988; 37(suppl):86A.
13. Bolli G, Compagnucci P, Cartechini M, Santeusanio F, Cirotto C, Scionti L, Brunctti P. H bAlc in subjects with abnormal glucose tolerance by normal fasting plasma glucose. Diabetes 1979, 29. 272 -7 .
14. Dunn RJ, Cole RA, Soeldner JS, Gleason RE. Reproducibility of
HbAlc and sensitivity of various degrees o f glucose intolerance. Ann Intern Med 1979; 9 1 :3 9 0 -6 .
15. Roberts AB, Baker JR, Metcalf P, Mullard C. Fructosamine compared with a glucose load as a screening test for gestational diabetes. Obstet Gynecol 1990; 76:773-5.
16. Bourgeois FJ, Harbert GM, Paulsoen HP, Thiagarajah S 11. Glycosylated serum protein level as a screening and diagnostic test for gestational diabetes mellitus. Am J Obstet Gvnecol 1986; 155: 493-6 .
17. Buchanan TA. Glucose metabolism during pregnancy: normal physiology and implications for diabetes mellitus. Isr I Med Sci 1991 ;27 :432-41 .
18. Freinkel N. Banting lecture 1980. O f pregnancy and progeny. Diabetes 1980;29:1023-35.
19. Coustan DR, Imarah J. Prophylactic insulin treatment of gestational diabetes reduces the incidences of macrosomia, operative delivery and birth trauma. Am J Obstet Gynecol 1984; 150:836-42.
20. Green J, Pawson I, Schumacher L, Perry J, Kretchmer N. Glucose tolerance in pregnancy: ethnic variation and influence of body habitus. Am J Obstet Gynecol 1990; 163:86-92.
21. hanger O, Mazze R. The relationship between large-for-gcstation al-age infants and glycemic control in women with gestational diabetes. Am J Obstet Gynecol 1988; 159:1478-83 .
22. Karlsson K, Kjellmer I. The outcome of diabetic pregnancies in relation to the mother’s blood sugar level. Am ) Obstet Gynecol 1972; 112:213-20.
23. Tallargio h, Giampietro O, Penno G, Miccoli R, Gregori G, Nave lesi R. Relation of glucose tolerance to complication of pregnancy in nondiabetic women. N Engl J Med 1986; 315 :989-92.
24. Magee M, Walden C, Beiedetti T , Knapp R. Influences of diagnostic criteria on the incidence of gestational diabetes and prenatal morbidity. JAMA 1993; 269 :609-15.
25. hanger 6 , Brustman h, Anyaegbunam A, Mazze R. The significance of one abnormal glucose tolerance test value on adverse outcome in pregnancy. Am J Obstet Gynecol 1987; 157 :758-63 .
26. Carpenter MW, Coustan DR. Criteria for screening tests for gestational diabetes. Am J Obstet Gynecol 1982; 144:768-73.
27. Mazze R, hucido D, hanger O, Hartmann 1C, Rodbard D. Ambulatory glucose profile: representation of verified self-monitered blood glucose data. Diabetes Care 1987; 10:111-7.
28. Summary and recommendations of the Third International Workshop-Conference on Gestational Diabetes Mellitus. Diabetes 1991; 40(suppl 2):197—201.
29. Cochran W. Some methods for strengthening the common y2 test. Biometrics 1954; 10:417-51.
30. Brenner W, F.delman D, Hendricks C. A standard of fetal growth for the United States of America. Am J Obstet Gynecol 1976; 126:555-64.
31. hanger O, Anyaegbunam A, Brustman h, Divon M. Management of women with one abnormal oral glucose tolerance test value reduces adverse outcome in pregnancy. Am J Obstet Gynecol 1989; 161:593-9.
The Journal of Family Practice, Vol. 39, No. 6(D ec), 1994563
J F P J o u r n a l Club
PREDICTING LARGE-FOR-GESTATIONAL- AGEINFANTS
T it l e : Comparison o f home glucose monitoring with the oral glucose tolerance test to detect gestational glucose intoleranceA u t h o r s : Peterson KA, Peterson AM , Corbett V, Tongen S, Guzman M, Mazze R.J o u r n a l : 7 he Journ al o f Family Practice D a t e : December 1994; Volume 39 :558-63 .
Background. Gestational diabetes mellitus (G D M ), which is glucose intolerance first recognized during pregnancy, occurs in 2% to 3% o f pregnancies.1 GDM has been associated with an increased risk o f perinatal complications. Concern exists regarding similar risks for pregnant women with an abnormal 1-hour screening glucose challenge test (G C T) but a normal 3-hour oral glucose tolerance test (O G T T ).
Clinical question. Can self-monitored blood glucose levels predict infant morbidity, as measured by the occurrence o f large-for-gcstational-age (LGA) infants, among women with an abnormal G C T but a normal OGTT?
Population studied. Pregnant women were recruited from family medicine and obstetric practices associated with a large metropolitan hospital center. Potential study subjects were identified after an abnormal G C T was obtained between the 24th and 29th gestational week. Exclusion criteria included a history o f GDM or a hemoglobin less than 10.0 g/dL (100 g/L). No information was given regarding age, race, or ethnicity.
Study design and validity. Consenting women with an abnormal G C T measured capillary blood glucose with a home glucometer seven times daily for 1 week while remaining on an unrestricted diet. They then underwent a standard 3-hour O G TT. Women diagnosed with GDM were treated with either diet or insulin therapy, according to standard protocols. Following the O G T T , no further glucose testing was performed for padents who did not meet the standard diagnostic criteria for GDM .
Outcomes measured. Statistical correlations were made between self-monitored blood glucose levels and infant
Drs Slawson and Squillace are from the Department o f Family Medicine, University o f Virginia Health Sciences Center, Charlottesville, Virginia. DrShaughnessyisfrom the Harrisburg Hospital Family Practice Residency Program, Harrisburg, Pennsylvania. Requests fo r reprints should be addressed to David Slawson, MD, Department o f Family Medicine, University o f Virginia Health Sciences Center, Box 414, Charlottesville, VA 22908.
© 1994 Appleton & Lange ISSN 0094-3509
birthweights. Large for gestational age was defined as above the 90th percentile birthweight. Regression analysis was performed to control for the following confounding variables: gestational age, multiparity, and maternal pregravid weight. Similar analysis was not reported for other potential confounders, including maternal age, weight gain, history o f giving birth to an LGA infant, family history o f diabetes, or previous stillbirth or congenital malformations.
Results. O f the 48 consenting women with an abnormal G C T who completed the study, five met the diagnostic criteria for having GDM . Infants born to two o f these women were LGA. One o f these infants experienced neonatal hypoglycemia. No information was provided regarding the severity o f this event. Thirteen o f the 43 women not meeting the diagnostic criteria for GDM gave birth to LGA infants. Complications o f these deliveries included one intrauterine fetal demise, one neonatal hypoglycemia, one mild shoulder dystocia, one cephalopel- vic disproportion, and two 4th-degree lacerations. The strongest predictor for increased birthweight among the women not diagnosed with GD M was the average fasting self-monitored blood glucose level. This relationship was confounded by pregravid weight but not by parity or gestational age. The risk for a woman giving birth to an LGA infant increased proportionally with an increase in her average fasting self-monitored blood glucose.
Recommendations fo r clinical practice. In this trial of pregnant women with an abnormal G C T, intensive home blood glucose monitoring was more effective than the standard O G T T in predicting which women will deliver LGA infants. The authors have taken advantage o f sophisticated technology to record and analyze 49 blood glucose determinations for each patient.
The difficulties inherent in the intensive glucose monitoring may, however, have affected the results o f the study. Only one half o f the women who were eligible agreed to participate in this study. These women may have been more willing to undergo the frequent blood glucose determinations because they were at an increased risk o f either glucose intolerance or giving birth to an LGA infant, or both, thus potentially increasing the statistical correlation between these two outcomes. Unlike the current study, previous reports show that any association between blood glucose levels and birthweight is lost when adjusted for maternal weight and age.1
A second difficulty with applying the results o f this study to clinical practice is that the expense and discomfort associated with the diagnostic procedure— almost 50
592 The Journal o f Family Practice, Vol. 39 , No. 6(D ec), 1994
JFP Journal ClubSlawson, Shaughnessy, and Squillace
capillary blood glucose determinations— may not be acceptable to many pregnant patients. In addition, the computer support to evaluate the results may not be available to most clinicians. It is unknown whether less extensive monitoring is as useful.
A third, broader concern is that no consensus exists regarding the need for universal screening of pregnant women for glucose intolerance.1- 4 This study suggests that 1 week o f intense self-monitored blood glucose levels will identify more pregnant women who will deliver LGA infants. It does not help us determine whether this identification benefits either the mother or the infant. Pregnant women falsely identified with glucose intolerance may be considered at “ high risk” and subject to extensive and expensive testing and interventions. Women at risk for delivering LGA infants with no evidence of glucose intolerance may be falsely reassured and not treated. Evidence from randomized controlled trials showing an overall benefit from screening for glucose intolerance in pregnancy is clearly needed.
David C. Slawson, MD Allen F. Shaughnessy, PharmD
References
1. Stephenson, MJ. Screening for gestational diabetes mellitus: a critical review. J Fam Pract 1993; 37 :277-83.
2. Enkin M, Keirse M J, Chalmers I. A guide to effective care in pregnancy and childbirth. 1st ed. Oxford, UK: Oxford University Press, 1989: 4 1 -3 .
3. Jarrett RJ. Gestational diabetes: a non-entity? BMJ 1993; 306: 3 7 -8 .
4. Hunter DJS. Is gestational diabetes a clinical entity? Can Fam Physician 1984; 3 0 :1 3 1 9 -2 1 .
GUIDELINES FOR MANAGING ANKLE INJURIES: The Ottawa Ankle Rules_________
T it l e : Implementation o f the Ottawa Ankle Rules Au t h o r s : Stiell IG , McKnight RD, Greenberg GH, McDowell I, Nair RC, Wells GA, Johns C, Worthington JR J o u r n a l : JAM AD a t e : March 16, 1994; Volume 271 :827-32 .
Background. Although acute ankle injuries are one of the most common chief complaints of patients presenting for care in emergency departments (EDs), there are no well- validated guidelines to assist physicians in deciding when radiographic evaluation o f the injured extremity is necessary. As a result, patients are usually referred for a radiograph to rule out treatable fracture. Previous studies by
this group developed a set o f decision rules that were refined and validated through prospective evaluation.1-2
Clinical question. Does the instruction of physicians in the implementation of the Ottawa ankle rules have the potential to change clinical behavior and result in a decrease in the number of patients referred for ankle and foot radio- graphic series?
Population studied. All adult patients presenting to either of two emergency departments with acute ankle pain resulting from blunt trauma, including twisting, falls, and direct blows, were enrolled in the study. A community hospital facility' with no house staff, which served as the control facility', enrolled patients during two 5-month blocks (February through June) in 1991 and 1992. The intervention hospital was a teaching institution and enrolled patients during the same 5-month block in 1990 (before-intervention) and 1992 (after-intervention). Exclusion criteria included age less than 18 years, pregnancy, presence of isolated injuries of the skin, referrals from outside hospitals with radiographs, more than a 10-day interval since injury', and reassessment o f an earlier injury.
Study design and validity. The study was a nonrandom- ized controlled trial comparing rates of ankle and foot radiographic series before and after intervention. Attending physicians and house staff at the intervention institution were instructed in the use o f the ankle rules through lectures, handouts, pocket cards, and two posters mounted in the ED. Data forms were attached to patient charts reminding physicians to evaluate for specific areas of tenderness and the ability' o f the injured ankle to bear weight. The decision to refer for radiography was left to the treating physicians. All radiographs were evaluated by a radiologist and final reports were reviewed for all cases.
All patients in the after-intervention group were followed up by telephone to assess progress of healing, impact of the injury on lifestyle, and patient satisfaction with their emergency care. Patients who were not studied radiographically were contacted by phone a second time 10 days after their ED visit and asked to return for reevaluation if they remained symptomatic.
Inclusion of the data form with the patient’s chart during the intervention period may have falsely elevated compliance with the rules. Use o f radiography was monitored for an additional 12 months after the intervention period when data collection sheets were no longer used. The use o f radiographic studies remained unchanged during this period.
The inclusion of house officers as physicians in the intervention hospital may have made this study particularly susceptible to the Hawthorne effect. House officers’ behavior may have been significantly more likely to
The Journal o f Family Practice, Vol. 39, No. 6(Dec), 1994593
JFP Journal Club Slawson, Shaughnessy, and Squillace
change because they were being observed, and this behavioral change might not have continued after the period o f observation. The lack o f change in rates o f radiography during the 12-month follow-up period suggests that o b servation alone did not account for the decline in radiography use.
Outcomes measured. The primary outcome measured for all patients was the proportion referred for ankle or foot radiographic series. Additional outcomes measured were the direct cost o f medical care, time spent in the ED , persistence o f symptoms, ability to walk and return to work, and subsequent physician visits and radiographs.
Results. A total o f 2342 patients were seen during the before- and after-intervention periods. A relative reduction o f 28% o f patients referred for ankle radiographs was seen at the intervention hospital between the two study periods (P < .0 0 1 ). During the same interval, there was a 2% relative increase in the use o f the same studies at the control hospital (P = N S). Twenty-four percent o f patients at the intervention hospital had no radiographic study during the postintervention period, compared with 4% o f patients during the preintervention period.
Patients discharged from the ED without radiographs spent significantly less time in the ED (80 minutes vs 116 minutes, P < .0 ()1 ). Ninety-five percent o f the nonradiograph group reported being satisfied with their care, compared with 96% o f patients who were x-rayed. The nonradiograph group had fewer follow-up visits (7% vs 20%, P < .0 0 1 ) and a significantly lower total cost o f care ($62 vs $173 , P < .0 0 1 ). None o f the patients discharged from the ED without radiographs were subsequently found to have fractures.
Recommendations fo r clinical practice. This study’s investigators have identified a group o f easily applied decision rules that have demonstrated a 30% reduction in the number o f radiographs ordered with no reduction in the ability to properly and promptly diagnose clinically significant fractures o f the ankle or midfoot.
The authors offer several caveats regarding appropriate application o f the rules. Because patients less than 18 years old were excluded from the study, the rules cannot be generalized to the pediatric population. Physicians
should use caution when applying the rules to patients who may be difficult to reliably evaluate, such as those who are intoxicated, have a head injury, have multiple painful injuries, or have diminished sensation related to neurological deficits. Patients discharged with radio- graphic evaluation should be instructed to return for further evaluation if pain and ability to bear weight have not improved in 5 to 7 days.
The investigators suggest a stepwise evaluation of the injured ankle, which begins with asking the patient about the circumstance o f the injury and the patient’s ability to bear weight within the first hour after injury. The examiner then proceeds with palpation o f the ankle, concentrating on the posterior edge o f both malleoli (from proximal to tip including the entire distal 6 cm o f the fibula), the base o f the fifth metatarsal, and the navicular. Concentrating the examination on the posterior edge o f the malleoli avoids producing pain secondary only to ligamentous tenderness from the anterior edge. Patients with localized tenderness o f the posterior malleoli or fibula are referred for ankle radiography. Patients with tenderness of the fifth metatarsal or navicular are referred for a foot radiographic series. Patients with no localized tenderness are then asked to walk two steps on each lower extremity without assistance. I f they can accomplish this task, they are considered “ able to bear weight,” regardless o f how much they limp. Patients who are unable to bear weight both immediately and in the ED but who have no localized tenderness are referred for both ankle and foot radio- graphic series. Patients with no localized tenderness and who retain their ability to bear weight are discharged without radiography.
Susan P. Squillace, MD David C. Slawson, MD
References1. Stiell IG, Greenberg GH, McKnight RD, Nair RC, McDowell I,
Worthington JR. A study to develop clinical decision rules for the use o f radiography in acute ankle injuries. Ann Emerg Med 1992; 2 1 :3 8 4 -9 0 .
2. Stiell IG, Greenberg GH, McKnight RD, Nair RC, McDowell I, Reardon M, et al. Decision rules for the use o f radiography in acute ankle injuries. Refinement and prospective validation. JAMA 1993; 2 6 9 :1127-32 .
594 The Journal of Family Practice, Vol. 39 , No. 6(D ec), 1994